Download (680Kb) - LSE Research Online
42
CEE DP 106 An Analysis of the Benefit of NVQ2 Qualifications Acquired at Age 26-34 Augustin De Coulon Anna Vignoles October 2008
Transcript of Download (680Kb) - LSE Research Online

CEE DP 106
An Analysis of the Benefit of NVQ2 Qualifications
Acquired at Age 26-34
Augustin De Coulon
Anna Vignoles
October 2008
Published by
Centre for the Economics of Education
London School of Economics
Houghton Street
London WC2A 2AE
© Augustin De Coulon and Anna Vignoles, submitted September 2008
October 2008
The Centre for the Economics of Education is an independent research centre funded by the
Department for Innovation, Universities & Skills and the Department for Children, Schools
and Families. The views expressed in this work are those of the author and do not reflect the
views of DIUS or the DCSF. All errors and omissions remain the authors.

An Analysis of the Benefit of NVQ2 Qualifications
Acquired at Age 26-34
Augustin De Coulon
Anna Vignoles
1. Introduction 1
2. Previous Evidence 2
3. Data and Methods 4
4. Who Acquires NVQ2 Qualifications 6
5. Wage Effects from Acquiring NVQ2 11
6. Learning Benefits from NVQ2 29
7. Conclusions 32
References 36

Acknowledgments
Augustin De Coulon is a Senior Research Officer at the NRDC, Institute of Education, a
Research Associate at the Centre for Economic Performance, London School of Economics
and a CEE Associate. Anna Vignoles is Professor of Education at the Bedford Group for
Lifecourse and Statistical Studies, Institute of Education, a Research Associate at the Centre for
Economic Performance, London School of Economics and Deputy Director of the Centre for the
Economics of Education.

1
1 Introduction
The purpose of this report is to determine the extent to which NVQ2 qualifications, when
acquired in a person‟s late twenties and early thirties, encourage progression on to other
learning and/or lead to other beneficial changes in a person‟s economic circumstances. The
project will provide evidence to help inform the Department about whether NVQ2
qualifications are likely to contribute to individuals‟ productivity and to assist in attempts to
improve qualification design and delivery. The report will also provide evidence on the likely
effects of the historical policy emphasis on reaching level 2. One issue of pressing policy
importance is to explain why the wage returns to NVQ2 qualifications appear to be minimal
(Dearden et al. 2000; McIntosh 2002 and Dearden et al. 2004). Although this question has
been addressed in a number of different academic studies, we will provide up to date
information on the extent to which NVQ2 specifically, when acquired in mid career, can
provide wage (and employment) benefits. For the analysis, we use quantitative analysis
methods applied to the rich data from the British Cohort Study (1970) data (BCS).
The specific research questions we will be able to address are:
1) What are the characteristics of individuals who acquire NVQ2 qualifications in their
twenties and thirties? In particular can we describe these individuals in terms of their
prior ability, gender, ethnicity, other education and parental background?3
2) Do those who acquire NVQ2 qualifications in their twenties and thirties experience
wage gains or employment changes subsequently? Is there any lag in the effect of
NVQ2 on wages or employment?
3) How does the acquisition of NVQ2 qualifications specifically compare, in terms of
learning, wage and employment outcomes, as compared to the acquisition of other
level 2 qualifications?
4) Are individuals who acquire NVQ2 qualifications before the age of 30 more likely to
go on to subsequent spells of learning (either accredited or non-accredited learning), as
compared to a) individuals who have undertaken other forms of level 2 learning; and
b) those who have undertaken no adult learning?
3 We did examine the possibility of looking at this issue by mode of delivery of the qualification and region but
sample sizes were too small.

2
The report is structured as follows. We start in section 2 by very briefly summarizing previous
research evidence on this issue. We then describe the data and methods used in section 3. In
section 4 we investigate the characteristics of individuals who acquire a NVQ2 between the
ages of 26 and 34. We will also explore the extent to which there has been any trend change
in the acquisition of NVQ2 over the period 1996-2004 for this particular cohort (BCS
participants have been interviewed in 1996, 2000 and 2004). Normally we would expect a
lower incidence of lifelong learning as individuals get older. However, as various policies
have been introduced over the period, this may have increased the likelihood of lifelong
learning and we can (descriptively) determine whether there has been any change in the
incidence of this form of lifelong learning for this cohort. In section 5 we will then examine
the relationship between acquiring an NVQ2 and subsequent changes in both wages and
employment. In section 6 we will explore the extent to which acquiring an NVQ2 leads
individuals to engage in more learning/ qualification acquisition in subsequent periods.
Section 7 concludes.
2 Previous Evidence
The wage returns from many UK qualifications, particularly higher level ones, are substantial
(e.g. Dearden et al., 2002; Dickerson 2005). However it does matter what type of qualification
you acquire. The wage returns to academic qualifications, for example, are significantly
higher than the returns to vocational qualifications, although when the time taken to acquire
qualifications is taken into account, the value of vocational qualifications moves much closer
to the value of academic qualifications (Dearden et al. 2002; Dickerson 2005).
There are extremely low or even nil wage returns to some lower level and newer vocational
qualifications (Dearden et al., 2004b; Dickerson, 2005, McIntosh, 2004). Jenkins, Greenwood
and Vignoles (2007) found, in line with much previous research (Dearden et al. 2004b),
negative average wage returns to NVQ2 qualifications specifically, although they did find that
women who hold NVQ2 as their highest qualification earn a positive significant return to
NVQ2 when compared to the earnings of low qualified (3%) and unqualified women (5.13%).
By and large however, the wage benefit of NVQ2 appears to be low or negative. This may be
because workers, regardless of their actual ability, may be considered by employers to be less
able or motivated if they take NVQ2 qualifications. Another possibility is that the low wage
return to these qualifications reflects the content of the curriculum and its evident lack of

3
value to employers. Whatever the reason, the evidence to date is generally pessimistic about
the impact of a number of low-level vocational qualifications on individuals‟ earnings, and by
implication their productivity. For instance, Jenkins et al. (2007) found that some other level 2
vocational qualifications also yield zero returns, such as City and Guilds craft/part 24. That
said, there are level 2 vocational qualifications that do generate a substantial wage premium,
particularly BTEC, and clearly the returns to level 2 vocational qualifications vary
substantially by type. If policy encourages individuals to take NVQ qualifications
specifically, we might be concerned that this would not result in any significant benefit for
individuals, in terms of wages.
However, some caution is required. Even the new lower level vocational qualifications, such
as NVQ2, do help individuals to find and remain in employment (McIntosh, 2004; Jenkins,
2005; Jenkins et al. 2007), although much of this evidence is cross sectional and therefore
causality is not necessarily established. Generally the evidence base also indicates that there is
some variability by sector and/ or occupation in the wage return to qualifications (McIntosh,
2004b, Dearden et al. 2004, Dickenson and Vignoles, forthcoming; Jenkins et al. 2007). This
is true of NVQ2 qualifications. Jenkins et al. (2007) indicates that individuals working in
skilled occupations, for instance, earn a positive significant average return to NVQ2. For
females, there are positive significant marginal returns to NVQ2 in personal service (6%) and
sales occupations (3%) and for males in skilled (7.5%), process/machine operative (3.5%) and
elementary occupations (4%). For females with NVQ2 as their highest vocational
qualification, there is a positive (marginal5) wage return in the following sectors: distribution
(2%), public admin/education/health (4%) and other services (8%). For males positive
marginal wage returns were found in the construction sector (10.5%). We also know that
returns to qualifications can vary by mode of delivery. NVQ2 qualifications for example, are
better rewarded when delivered via the employer (Dearden et al, 2004; Jenkins et al. 2007).
Lastly, there is tentative evidence that the return to NVQ2 may be somewhat higher if these
qualifications are acquired below the age of 25 (Jenkins et al. 2007). It would appear therefore
that there is some merit to exploring in more detail the returns to NVQ2 qualifications
acquired in different contexts.
4 Table 2, Jenkins et al. (2007).
5 Marginal returns refer to the return to qualifications for individuals who hold that qualification as their highest
qualification. Average returns refer to the return to qualifications across all individuals who hold the
qualification, including those who have higher and lower level qualifications.

4
3 Data and Methods
For this analysis, we use a survey of the British Cohort Study (1970 cohort), which was
carried out in 2004, combined with previous surveys of this cohort. In addition to being asked
about their home life and economic activity in 2004, respondents were asked about
qualifications and learning undertaken since the last survey. The 2004 survey was
commissioned under the Skills for Life Initiative and part funded by the National Research
and Development Centre for Adult Literacy and Numeracy (NRDC). Details of the data are
given in Bynner and Parsons (2005).
The advantage of using the British Cohort Study is that it contains information on individuals‟
family background and schooling from birth, in addition to data on previous episodes of post
school learning. For this paper, we focus on the surveys of the BCS conducted in 1996, 2000
and 2004, to evaluate the incidence of lifelong learning leading to a NVQ2 during this period
in their lives. During this period government policy has encouraged greater amounts of
accredited adult learning. Indeed in our data one can therefore compare the incidence of
acquisition of NVQ2 that took place between 1996 and 2000 and then again between 2000
and 2004, to undertake a before and after descriptive assessment of the change over the
period.
The project will use a variety of standard econometric techniques to examine the impact of
NVQ2 acquisition on learning outcomes, employment outcomes and wages. The main
methodological challenge is to overcome potential ability bias caused by the fact that those
who take NVQ2 later in life may be more or less able than average. In other words, if
individuals who take NVQ2 are less able, we may observe very low or nil returns to NVQ2
because of this, rather than because the qualifications are not valuable per se. The richness of
the BCS data enables us to do this in three ways. Firstly, we will control for prior ability,
using early test score measures of the individual‟s ability. Secondly, we will take due care
when choosing an appropriate comparator group for those who acquire NVQ2 later in life.
Thus we will start by assessing the wage effect of NVQ2 by undertaking simple Ordinary
Least Squares regression, comparing wages of those who acquire NVQ2 over the period
1996-2000 with those individuals who do not, controlling for prior ability and personal
characteristics6. We will also explore the delayed (lagged) effect of NVQ2 qualifications on
6 We were restricted by small sample sizes in some instances. For example, we were unable to analyse full time
and part time workers separately. Instead full time and part time workers are pooled and we use hourly wages to

5
wages by considering the impact of NVQ2 qualifications acquired between 1996-2000 on
wages in both 2000 and 2004.
The third approach we take to reducing ability bias in our analysis of the impact of NVQ2 on
wages, is to undertake a first difference model, which will relate the change in wages between
26 & 30 and 30 & 34 to whether an individual has acquired an NVQ2 in the previous period.
A first difference focuses on changes in wages and relates them to changes in qualifications.
The advantage of using this methodology is that it allows for fixed unobserved characteristics,
such as ability, that may determine both the likelihood of acquiring a NVQ2 qualification and
earnings. Such models are therefore more likely to identify the causal impact of acquiring a
NVQ2 qualification on individuals‟ earnings. For example, imagine that individuals who are
more career oriented are more likely to acquire a qualification later in life, and are also
simultaneously more likely to have higher wages. The first difference model takes account of
this unobserved characteristic by focusing on whether individuals who acquire the
qualification end up with higher earnings, taking full account of the fact that they may have
higher earnings in the first place due to their greater career orientation.
To evaluate the determinants of employment, we will use the longitudinal nature of the data to
determine who is moving into and out of employment, estimating probit models with rich
controls. The fact that we observe individuals at various time periods ensures that we do not
have to rely only on recalled data about employment and can instead look at observed
transitions. We will consider moves into and out of employment i.e from unemployment and
inactivity into employment. This is because very few individuals in the sample are
unemployed and for females inactivity is in any case more important. In addition previous
work using the Labour Force Survey has suggested that vocational qualifications may
potentially play a more important role in influencing the move into economic activity rather
than simply assisting unemployed individuals back into work.
To evaluate the relationship between acquiring a NVQ2 and subsequent learning, we will
estimate a probit model with rich controls. The dependent variable with be firstly whether the
individual engaged in lifelong learning broadly defined, i.e. including non-accredited learning
such as leisure courses and work related training. In a separate model, we will then consider a
dependent variable measuring accredited learning, i.e. whether the individual subsequently
acquired another qualification. We can then determine the association between acquiring a
allow for differences in hours worked.

6
NVQ2 in the first time period (age 26-30) on the likelihood of undertaking subsequent
learning (accredited or otherwise) in the second time period (age 30-34).
4 Who Acquires NVQ2 Qualifications?
Research question: What are the characteristics of individuals who acquire NVQ2
qualifications in their twenties and thirties? In particular can we describe these individuals in
terms of their prior ability, gender, ethnicity, other education and parental background?
Table 1 shows lifelong learning leading to progression in the National Framework, for the
period 1996 and 2000, for the sample of 6,457 individuals interviewed in all three sweeps
(1996, 2000 and 2004). This table therefore captures lifelong learning that increases the
qualification level of the individual.
Table 1: Qualification progression from 1996 and 2000
Levels in 2000
0 1 2 3 4 5 Total
Levels in 1996
0 190 7 8 3 2 1 211
(90.05) (3.32) (3.79) (1.42) (0.95) (0.47) 100.00
1 2,101 100 54 55 2 2,312
(90.87) (4.33) (2.34) (2.38) (0.09) 100.00
2 948 31 69 2 1,050
(90.29) (2.95) (6.57) (0.19) 100.00
3 743 77 6 826
(89.95) (9.32) (0.73) 100.00
4 1,563 78 1,641
(95.25) (4.75) 100.00
5 417 417
(100.00) 100.00
Total 190 2,107 1,056 829 1,769 506 6,457
2.94 32.63 16.35 12.84 27.40 7.84 100.00
Row percentages given in brackets.

7
The table indicates that individuals who progressed up the qualification framework in the
early period tended to move up mostly by 1 or 2 levels only, as one might expect in such a
short period of time. We also observed that the proportions of individuals reporting to have
the various levels of qualifications are very similar to published statistics on qualification
rates published by the ONS for the same age groups (see ONS, 2005).
It is possible to reproduce a similar table for the period between 2000 and 2004 (Table 2).
Here we follow the same individuals from age 30 to 34. Again, we find that individuals
mostly progress by only one or two levels of qualification achievement. Interestingly, in the
later period (i.e. 2000-2004), a higher proportion of those with very low initial levels of
qualifications did manage to make some progression, as compared to the earlier 1996-2000
period.
Table 2: Qualification progression from 2000 and 2004
Levels in 2000
0 1 2 3 4 5 Total
Levels in 1996
0 165 17 6 1 1 0 190
(86.84) (8.95) (3.16) (0.53) (0.53) (0.00) 100.00
1 1,827 127 88 61 5 2,107
(86.71) (6.03) (4.17) (.90) (.24) 100.00
2 940 52 60 4 1,056
(89.02) (4.92) (5.68) (0.38) 100.00
3 755 69 7 829
(90.85) (8.30) (0.84) 100.00
4 1,705 61 1,769
(96.55) (3.45) 100.00
5 506 506
(100.00) 100.00
Total 165 1,844 1,073 893 1,899 583 6,457
(2.56) (28.56) (16.62) (13.83) (29.41) (9.03) 100.00
Row percentages given in brackets.
As we are following the same individuals over time, we are not comparing individuals at the
same stage in their life course over the two periods. However, it is worth noting that a human
capital explanation would predict that individuals invest less as they grow older because of

8
the reduced period over which returns can be earned, whereas we observe the reverse. Of
course during this period there were also changes to the qualification and training system and
we do not know the extent to which many qualifications awarded in the later period would not
necessarily have been granted an award in the earlier period. We now consider more
specifically the acquisition of NVQ2 qualifications in these data.
Table 3 shows the highest level of qualification acquired over the 1996-2000 period (i.e. age
26-30) in the first column, over the 2000-2004 period (i.e. age 30-34) in the second column
and then, in the third column, over the entire period. Note that this table records individuals‟
highest qualification acquired in the relevant period, regardless of whether the qualification
actually improved their overall level of qualification in the National Framework. This table
should therefore capture more lifelong learning than the previous two tables, by including
some individuals who undertake accredited learning that does not move them up the National
Framework. Table 3 indicates the general level of qualification acquired, rather than the
specific type of qualification obtained, except in the case of level 2, where NVQ2 is listed
separately. Thus the total number of level 2 qualifications acquired is the sum of the rows
labelled level 2 (excluding NVQ2) and NVQ2.
Table 3 indicates that much accredited lifelong learning is at degree level in the 1996-2000
period, with nearly 7% of the sample acquiring a level 4 qualification over the period. Level 4
includes a range of professional qualifications as well as degrees. Only just under 4% of the
sample, by contrast, took a level 2 qualification, of which about half took an NVQ2. Looking
at the second period it is noticeable that the incidence of lifelong learning leading to a lower
level qualification increased marginally, consistent with tables 1 and 2. Thus in the second
period around 5% of the sample took a level 2 qualification, and again around half of this
group specifically took an NVQ2. For the purposes of subsequent analysis, it is evident that
sufficient numbers of individuals took NVQ2 to consider this particular qualification
separately, although we found that the sample sizes for other level 2 qualifications were too
small to undertake any further disaggregation.
Table 4 examines the characteristics of individuals who took an NVQ2 over the entire period,
as compared to individuals who did not take an NVQ2. Women were more likely to take an
NVQ2 than men and, as expected low educated individuals (particularly those with level 1
qualifications) were much more likely to get an NVQ2, whilst higher educated individuals
(particularly those with level 4 or above) were much less likely to acquire an NVQ2 over the
period. One hypothesis to explain the low returns to NVQ2 has been that individuals who take

9
these particular qualifications are of low ability and skill. We therefore look at two measures
of a person‟s ability and skill, namely measures of the person‟s literacy and numeracy skill
level at age 34 and cognitive ability test scores from age 10. In both instances individuals who
take NVQ2 are less skilled and able than those who do not. But, as this is only a slight and
statistically insignificant difference, it is sensible to conclude that individuals acquiring
NVQ2 qualifications are broadly as able (as measured at age 10) as those who do not.
Table 3. Level 2 acquisition in the BCS between the age 26 and 34
Age 26 to 30 Age 30 to 34 Whole period
Highest qualification
acquired during the
period
Highest qualification
acquired during the
period
Highest qualification
acquired during the period
None acquired 5,048 78.18 4,933 76.4 4,025 62.34
Level 1 317 4.91 418 6.47 555 8.6
Level 2 (excl NVQ2) 130 2.01 158 2.45 236 3.65
NVQ2 110 1.7 152 2.35 202 3.13
Level 3 183 2.83 261 4.04 364 5.64
Level 4 512 7.93 427 6.61 823 12.75
Level 5 157 2.43 108 1.67 252 3.9
N (total number of
individuals interviewed)
6457 100 6457 100 6457 100
Note: As individuals may acquire an NVQ2 in both periods, i.e. from age 26 to 30 and from age 30 to 34, the
rows cannot be summed. The final column indicates the total number of individuals who acquired at least one
NVQ2 over the entire period.
The table then includes measures of parental background, including the financial
circumstances of the individual in childhood (e.g. whether they were a free school meal child
or suffered financial hardship in the home), the social class and education level of the parents;
and parental interest in the individual‟s education in childhood. The slight differences in these
family background measures between individuals who take NVQ2 in their late twenties and
early thirties, and those who do not, are not statistically significant.

10
Table 4. Mean characteristics of individuals who acquired a NVQ2 over the whole
period 1996-2004, and compared with those who never got a NVQ2
Individuals who took an NVQ2
course over 1996-2004
Individuals who did not take an
NVQ2 course over 1996-2004
N Means St.-err. N Means St.-err.
Female 202 0.63 0.48 6255 0.56 0.50
Highest qualification level at age 26
No qualification 202 0.05 0.02 6255 0.03 0.00
Level 1 202 0.60 0.03 6255 0.35 0.01
Level 2 202 0.16 0.03 6255 0.16 0.00
Level 3 202 0.13 0.02 6255 0.13 0.00
Level 4 202 0.05 0.02 6255 0.26 0.01
Level 5 202 0.01 0.01 6255 0.07 0.01
Literacy test at 34 200 21.03 4.57 6185 22.78 3.48
Numeracy test at 34 198 16.53 4.29 6168 18.18 3.89
Math test at 10 155 41.19 10.96 4651 46.91 10.94
Reading test at 10 155 34.07 13.06 4716 40.29 13.21
Ability test at 10 157 72.12 15.34 4742 77.88 16.03
Non white 202 0.01 0.10 6255 0.03 0.16
Free school meal at 10 202 0.14 0.35 6255 0.10 0.29
Financial hardship at 16 202 0.13 0.34 6255 0.08 0.27
Parents social class at age 5
I 202 0.02 0.14 6255 0.07 0.25
II 202 0.12 0.32 6255 0.19 0.39
IIIm 159 0.43 0.49 5104 0.46 0.49
IIInm 202 0.09 0.29 6255 0.09 0.28
IV 202 0.17 0.38 6255 0.09 0.29
V 202 0.05 0.23 6255 0.03 0.16
Father has a degree 202 0.04 0.20 6255 0.13 0.34
Father has A-levels 202 0.05 0.22 6255 0.07 0.25
Mother has a degree 202 0.00 0.07 6255 0.02 0.15
Mother has A-levels 202 0.01 0.10 6255 0.03 0.18
Parental interest in their child‟s education
Father very interested 202 0.24 0.43 6255 0.32 0.47
Father moderately interested 202 0.19 0.39 6255 0.15 0.36
Father very little interested 202 0.04 0.21 6255 0.02 0.15
Father interest missing 202 0.49 0.50 6255 0.49 0.50
Mother very interested 202 0.34 0.48 6255 0.44 0.50
Mother moderately interested 202 0.31 0.46 6255 0.23 0.42
Mother very little interested 202 0.03 0.18 6255 0.03 0.17
Mother interest missing 202 0.28 0.45 6255 0.29 0.45
Table 4 showed descriptively the characteristics of individuals who acquired NVQ2 and of
those who did not. However, to identify the marginal effect of these different characteristics

11
on the likelihood we need to use a modelling approach which allows for all these factors
simultaneously. Table 5 therefore models the probability of acquiring a NVQ2 over the period
1996-2004, estimated using a probit model. The variables included in the model are the same
as in Table 4 and the base case includes individuals who undertook no lifelong learning at all
between the ages if 26 and 34. Most of the variables are statistically insignificant, partly
reflecting the small numbers acquiring NVQ2. Generally the model indicates that after one
controls for initial education, which is highly significant in the model, other measures of
family background and ability do not appear to play a role in determining whether someone
acquires a NVQ2 or not. The exception is parental social class, which suggests that
individuals from a non-manual social class background are more likely to acquire a NVQ2,
given their initial level of education and ability. Certainly table 5 does not lend much
credence to the hypothesis that individuals who acquire a NVQ2 are less able, given their
initial education level, than those who do not.7.
In conclusion:
individuals who acquired an NVQ2 were not more or indeed less able than those who
did not acquire an NVQ2, as measured at age 10
individuals who acquired an NVQ2 were initially less educated than those who did not
acquire an NVQ2
individuals who acquired an NVQ2 were slightly more likely to come from a non
manual social class background.
5 Wage Effects From Acquiring NVQ2
Research Questions:
Do those who acquire NVQ2 qualifications in their twenties and thirties experience wage
gains or employment changes subsequently? Is there any lag in the effect of NVQ2 on
wages or employment?
How does the acquisition of NVQ2 qualifications specifically compare, in terms of
learning, wage and employment outcomes, as compared to the acquisition of other level 2
qualifications?
7 Where significant relationships are found in this model we have no reason to doubt the veracity of the findings,
as significant relationships are harder to find with small sample sizes. However, an insignificant relationship may
be due to small sample sizes rather than there being genuinely no relationship between the variables.

12
Table 5. Main determinants of NVQ2 courses taken after the age of 26
(probit estimates)
Marginal
effects
Standard-
Errors
Marginal
effects
Standard-
Errors
Marginal
effects
Standard-
errors
Female 0.006 (0.007) 0.005 (0.007) 0.005 (0.007)
Highest qual at 26 -0.014*** (0.003) -0.012*** (0.003) -0.012*** (0.003)
Math test at 10 -0.001* (0.000) -0.001* (0.000) -0.001 (0.000)
Reading test at 10 -0.000 (0.000) -0.000 (0.000) -0.000 (0.000)
Ability test at 10 0.000 (0.000) 0.000 (0.000) 0.000 (0.000)
Non white -0.001 (0.010) -0.001 (0.010)
Free school meal
at 10
0.000 (0.012) -0.000 (0.012)
Financial hardship
at 16
0.001 (0.025) 0.001 (0.024)
Social class (i) -0.001 (0.011) -0.002 (0.011)
Social class (ii) 0.013 (0.015) 0.013 (0.015)
Social class (iii
non manual)
0.034*** (0.015) 0.035*** (0.015)
Social class (iv) 0.035* (0.026) 0.033* (0.025)
Social class (v) -0.017 (0.013) -0.016 (0.013)
Father has degree -0.003 (0.015) -0.002 (0.015)
Father has A-
Level
0.008 (0.040) 0.008 (0.040)
Mother has a
degree
-0.028 (0.014) -0.027 (0.014)
Mother has A-
Level
0.007 (0.036)
Father moderately
interested
0.004 (0.036)
Father very little
interested
0.032 (0.058)
Father interest
missing
0.001 (0.034)
Mother very
interested
-0.041 (0.040)
Mother
moderately
interested
-0.028 (0.027)
Mother very little
int.
-0.038** (0.007)
Mother interest
missing
-0.026 (0.021)
N 3138 3080 3080
Note: base case is all individuals who did not undertake any lifelong learning in the period 1996-2004. ***
indicates significant at 1% level, ** at 5% level and * at 10% level.
We now look at the effect of acquiring an NVQ2 on wages. We start with an OLS analysis,
where the dependent variable in column 1 of Table 7a is the individual‟s hourly wage in 2000,
and we measure the impact of an NVQ2 acquired over the period 1996-2000 on wages in
2000. Note that the model includes the individual‟s highest qualification acquired over the
1996-2000 period and the comparison group are individuals with no qualifications gained
over the period. For almost all individuals who acquired a NVQ2, this was their highest
qualification acquired over the period. The sample for the estimation includes both men and

13
women. The model controls for the person‟s initial level of education at age 26, as well as
some of the other family background measures described in Table 38. Although we do not
discuss these results in detail, as they are not the focus of our analysis, we note that initial
level of education is positively and significantly correlated with hourly wage, as one would
expect, so too is mathematics ability at age 10. Many of the family background variables are
jointly significant and estimates indicate that parental education still plays a role in
determining wages even when a person is in their twenties or thirties.
The results from Table 7a suggest that there is a positive impact on wages for those acquiring
a level 2 qualification in the first period, but no positive impact from acquiring a level 2
qualification in the 2000-2004 period.
Table 7b and 7c then show similar specifications for females and males separately. The results
are similar to table 7a, in that generally lifelong learning leading to an accredited qualification
does not result in higher earnings, except for level 2 qualifications acquired in the 1996-2000
period which have a positive wage effect for men and women. Furthermore, acquisition of an
NVQ2 specifically is associated with lower wages in the 2000-2004 period for females. For
men the impact of NVQ2 is nil.
One possible reason that accredited lifelong learning does not generally appear to result in
significant wage gains at any level is that it may take time for the effects of a qualification to
become apparent. Firstly, individuals may need to change jobs to reap the full wage benefit of
their increased productivity as a result of lifelong learning. Secondly, if an individual needed
to take time out of work or just work less in order to acquire the qualification it may take them
some time to improve their wages. Thirdly, if an employer paid for the qualification, the
individual‟s wages may be held lower for some period to allow for this9. Equally it may be
the case that individuals acquire NVQ2 qualifications as a consequence of changing jobs, and
we may therefore confound the effects of a job change or promotion with the effects of
gaining an NVQ2. Table 8 therefore models the effect of lifelong learning, allowing for a
potential delay in the effect of lifelong learning on wages. The model is estimated for males
and females combined in column 1, males only in column 2 and females only in column 3.
The dependent variable is the log of hourly wages in 2004. The model includes separately
qualifications acquired in the 1996-2000 period and qualifications acquired in the later period.
8 Thus although some individuals may already have a level 2 qualification before they then take an NVQ2, we
allow for this in the modelling. In fact, Tables 1 and 2 suggest that the majority of those taking NVQ2 over the
period do not already have a level 2 qualification. 9 Human capital theory predictions on this issue depend on the nature of the training, the nature of the labour
market and the portability of skills.

14
Table 7a. Dependent variable: logarithm of hourly wage, males and females combined
Hourly wage in 2000 Hourly wage in 2004 Hourly wage in 2004
Highest qualifications
acquired over 1996-2000
Highest qualifications
acquired over 2000-2004
Highest qualifications
acquired over 1996-2004
Coeff St.-err. Coeff St.-err. Coeff St.-err.
Courses take at Level 1 -0.066 (0.060) -0.069** (0.033) -0.041 (0.029)
Level 2 0.158*** (0.044) -0.042 (0.040) -0.025 (0.041)
NVQ2 -0.142 (0.107) -0.111*** (0.043) -0.074* (0.040)
Level 3 -0.003 (0.079) -0.021 (0.040) 0.018 (0.030)
Level 4 0.114*** (0.044) -0.039 (0.028) 0.005 (0.023)
Level 5 -0.207** (0.097) 0.027 (0.066) 0.026 (0.045)
Female -0.137*** (0.027) -0.138*** (0.016) -0.138*** (0.016)
Highest qualification at
26: Level 1
0.072
(0.095)
0.065
(0.044)
0.062
(0.044)
Level 2 0.098 (0.100) 0.116** (0.048) 0.113** (0.048)
Level 3 0.122 (0.102) 0.143*** (0.049) 0.139*** (0.049)
Level 4 0.229** (0.101) 0.286*** (0.048) 0.281*** (0.048)
Level 5 0.322*** (0.109) 0.376*** (0.058) 0.369*** (0.059)
Math test at 10 0.006*** (0.002) 0.004*** (0.001) 0.004*** (0.001)
Reading test at 10 0.001 (0.002) 0.001 (0.001) 0.001 (0.001)
Ability test at 10 -0.001 (0.001) 0.000 (0.001) 0.000 (0.001)
Non white 0.160 (0.106) 0.072 (0.067) 0.072 (0.067)
Free school meal at 10 -0.003 (0.044) -0.051** (0.026) -0.049* (0.026)
Financial hardship at 16 0.009 (0.046) -0.046* (0.027) -0.045* (0.027)
Social class (i) 0.118* (0.064) -0.037 (0.040) -0.036 (0.040)
Social class (ii) 0.097*** (0.036) -0.026 (0.022) -0.024 (0.022)
Social class (iii non
manual)
0.128*** (0.047) 0.081*** (0.029) 0.082*** (0.029)
Social class (iv) 0.011 (0.044) -0.028 (0.024) -0.028 (0.024)
Social class (v) -0.073 (0.097) -0.045 (0.047) -0.047 (0.047)
Father has degree 0.028 (0.051) 0.073** (0.031) 0.071** (0.031)
Father has A-Level 0.050 (0.052) 0.054* (0.030) 0.052* (0.030)
Mother has a degree -0.030 (0.084) 0.051 (0.061) 0.048 (0.061)
Mother has A-Level -0.002 (0.076) 0.054 (0.039) 0.055 (0.039)
Father very interested 0.052 (0.110) 0.163** (0.076) 0.164** (0.075)
Father moderately
interested
0.037 (0.110) 0.149** (0.074) 0.149** (0.073)
Father very little
interested
-0.087 (0.121) 0.063 (0.080) 0.062 (0.079)
Father interest missing 0.080 (0.105) 0.120 (0.073) 0.119* (0.072)
Mother very interested -0.021 (0.111) -0.011 (0.086) -0.012 (0.085)
Mother moderately
interested
-0.042 (0.111) -0.028 (0.084) -0.029 (0.083)
Mother very little int. 0.131 (0.107) 0.013 (0.083) 0.013 (0.082)
Mother interest missing -0.010 (0.112) -0.021 (0.086) -0.023 (0.085)
Constant 1.191*** (0.141) 1.520*** (0.078) 1.518*** (0.078)
P-value test scores at 10 0.000 0.000 0.000
P-value free school meal
and financial hardship
0.970 0.024 0.031
P-value social class 0.019 0.011 0.011
P-value parent education
and interest in education
0.617 0.012 0.011
N 3623 3510 3510
Adjusted R2 0.047 0.164 0.162
Notes: Figures in parenthesis are standard-errors. *** indicates significant at 1% level, ** at 5% level and * at
10% level.

15
Table 7b. Dependent variable: logarithm of hourly wage, males and females separately
Females Males
Hourly
wage in
2000
Hourly
wage in
2004
Hourly
wage in
2004
Hourly
wage in
2000
Hourly
wage in
2004
Hourly
wage in
2004
Qual
acquired
over 1996-
2000
Qual
acquired
over 2000-
2004
Qual
acquired
over 1996-
2004
Qual
acquired
over 1996-
2000
Qual
acquired
over 2000-
2004
Qual
acquired
over 1996-
2004
Level 1 -0.072 -0.079* -0.033 -0.034 -0.051 -0.047
(0.079) (0.041) (0.035) (0.091) (0.053) (0.049)
Level 2 0.164** 0.009 0.026 0.132*** -0.115* -0.093
(0.071) (0.053) (0.056) (0.051) (0.061) (0.060)
NVQ2 -0.150 -0.082** -0.055 -0.150 -0.138 -0.092
(0.146) (0.041) (0.037) (0.159) (0.084) (0.076)
Level 3 0.099 -0.037 0.034 -0.140 -0.005 -0.003
(0.094) (0.050) (0.039) (0.132) (0.063) (0.045)
Level 4 0.137** -0.002 0.037 0.090 -0.087* -0.033
(0.059) (0.034) (0.028) (0.067) (0.048) (0.039)
Level 5 -0.218 0.059 0.082 -0.199* -0.008 -0.042
(0.160) (0.083) (0.063) (0.118) (0.105) (0.062)
Highest qual at age 26
Level 1 0.276 0.128** 0.124** -0.091 -0.012 -0.018
(0.202) (0.056) (0.058) (0.067) (0.066) (0.065)
Level 2 0.255 0.206*** 0.200*** -0.021 -0.003 -0.008
(0.205) (0.061) (0.062) (0.084) (0.073) (0.073)
Level 3 0.256 0.193*** 0.186*** 0.025 0.074 0.071
(0.210) (0.063) (0.064) (0.077) (0.072) (0.072)
Level 4 0.366* 0.380*** 0.370*** 0.138* 0.176** 0.173**
(0.206) (0.061) (0.063) (0.082) (0.073) (0.073)
Level 5 0.466** 0.437*** 0.425*** 0.214** 0.289*** 0.292***
(0.213) (0.081) (0.083) (0.102) (0.082) (0.081)
Math test at 10 0.007** 0.005*** 0.005*** 0.006** 0.004** 0.004**
(0.003) (0.002) (0.002) (0.003) (0.002) (0.002)
Reading test at 10 0.001 -0.000 -0.000 -0.000 0.003* 0.003*
(0.002) (0.001) (0.001) (0.002) (0.001) (0.001)
Ability test at 10 -0.001 0.001 0.001 -0.001 -0.000 0.000
(0.002) (0.001) (0.001) (0.001) (0.001) (0.001)
Non white 0.048 0.010 0.008 0.332*** 0.169* 0.168*
(0.163) (0.092) (0.092) (0.075) (0.090) (0.090)
Free school meal at
10
-0.116 -0.027 -0.022 0.122*** -0.089* -0.087*
(0.072) (0.029) (0.029) (0.046) (0.047) (0.047)
Financial hardship
at 16
0.083 -0.028 -0.029 -0.080 -0.062 -0.059
(0.059) (0.032) (0.032) (0.072) (0.045) (0.045)
Social class (i) 0.085 0.021 0.026 0.166* -0.094 -0.093
(0.094) (0.052) (0.053) (0.087) (0.060) (0.060)
Social class (ii) 0.069 -0.017 -0.016 0.139*** -0.047 -0.044
(0.051) (0.029) (0.029) (0.052) (0.035) (0.035)
Social class (iii non
manual)
0.107 0.106*** 0.106*** 0.153** 0.057 0.060
(0.06) (0.040) (0.040) (0.066) (0.042) (0.042)
Social class (iv) 0.032 -0.014 -0.016 -0.038 -0.055 -0.052
(0.059) (0.028) (0.028) (0.068) (0.041) (0.041)
Social class (v) -0.100 -0.166*** -0.166*** -0.021 0.103 0.097
(0.145) (0.064) (0.064) (0.116) (0.063) (0.063)
Father has degree 0.048 0.050 0.047 -0.004 0.095** 0.094**
(0.071) (0.041) (0.040) (0.073) (0.047) (0.047)
Father has A-Level 0.102 0.046 0.042 -0.015 0.069 0.069
(0.064) (0.040) (0.040) (0.084) (0.047) (0.047)
Mother has degree 0.005 0.124 0.116 -0.051 -0.012 -0.014
(0.123) (0.091) (0.091) (0.116) (0.085) (0.084)

16
Mother has A-
Level
-0.062 0.032 0.032 0.067 0.086 0.094*
(0.113) (0.059) (0.060) (0.098) (0.052) (0.053)
Father very
interested
0.037 0.268*** 0.274*** 0.034 0.026 0.020
(0.204) (0.098) (0.098) (0.116) (0.113) (0.109)
Father moderately
interested
0.089 0.281*** 0.286*** -0.048 -0.021 -0.026
(0.204) (0.096) (0.095) (0.116) (0.111) (0.108)
Father very little
interested
-0.042 0.124 0.125 -0.156 -0.005 -0.013
(0.219) (0.114) (0.113) (0.135) (0.112) (0.109)
Father interest
missing
0.060 0.229** 0.233** 0.062 -0.027 -0.033
(0.198) (0.095) (0.094) (0.107) (0.108) (0.104)
Mother very
interested
-0.122 -0.096 -0.100 0.076 0.078 0.080
(0.201) (0.146) (0.145) (0.122) (0.106) (0.103)
Mother moderately
interested
-0.204 -0.148 -0.149 0.115 0.103 0.104
(0.199) (0.144) (0.143) (0.121) (0.103) (0.101)
Mother very little
int.
-0.010 -0.084 -0.086 0.267** 0.110 0.111
(0.184) (0.152) (0.152) (0.123) (0.096) (0.094)
Mother interest
missing
-0.107 -0.105 -0.108 0.100 0.074 0.074
(0.200) (0.146) (0.146) (0.123) (0.107) (0.104)
Constant 0.990*** 1.284*** 1.275*** 1.262*** 1.664*** 1.671***
(0.231) (0.127) (0.127) (0.167) (0.104) (0.102)
P-value, F-test for
test scores at 10
0.007 0.000 0.000 0.071 0.000 0.000
P-value, F-test for
free school meal
and financial
hardship
0.141 0.459 0.501 0.027 0.035 0.043
P-value, F-test for
parent social class
0.491 0.006 0.005 0.039 0.031 0.037
P-value, F-test for
parents education
and interests in
education
0789 0.021 0.020 0.211 0.267 0.225
N 1924 1874 1874 1699 1636 1636
Adjusted R2 0.032 0.171 0.171 0.046 0.118 0.116
Notes: Figures in parenthesis are standard-errors. *** indicates significant at 1% level, ** at 5% level and * at
10% level.
We can therefore look to see whether individuals who undertook accredited lifelong learning
in the first period (age 26-30) have higher wages some 4 years later in 2004, conditional on
both their initial level of education and any lifelong learning they undertook in the second
period.
The results suggest there may be a lag in the effect of lifelong learning, at least for females,
but only for higher-level lifelong learning at level 3 or above. Thus women who acquired
level 3 or level 4 qualifications in the 1996-2000 period go on to have significantly higher
wages in 2004. For males the effect is insignificant. For both males and females, lifelong

17
learning at level 2 or below, including acquisition of NVQ2, has an insignificant effect on
wages even allowing for a time lag.
The principle challenge in this work is to deal with the potential problem that more able
workers are both more likely to undertake lifelong learning and to get higher wages (the so
called endogeneity issue). Simple OLS estimates of the effect of achieving accredited lifelong
learning on wages (such as Tables 7a-c) may be biased. Our estimation above goes some way
to deal with this problem by including measures of individuals‟ ability at an early age.
However, there may be other unobserved characteristics that determine both the likelihood of
undertaking life long learning and earnings, such as motivation. We cannot include a measure
of motivation in our models above and therefore need to explore other statistical models to
deal with this potential problem. The OLS results above should therefore be viewed as
indicative only. For example, in the table above we find a negative association between
lifelong learning in the later period and wages. This may either reflect the fact that
individuals‟ have lower wages as a result of taking time to study or equally that individuals
with lower wages may be more likely to undertake lifelong learning. Causality is not easily
established using cross section OLS analysis.
By using models that examine changes over time (panel data models), we can attempt to
allow for factors that we do not observe but that remain fixed over time, such as motivation.
Such factors may influence both the individual‟s likelihood of undertaking certified lifelong
learning and their wages. We therefore apply a statistical model that looks at the relationship
between changes in wages over time and changes in education level i.e. whether or not the
individual did any accredited lifelong learning. This approach is called first difference
estimation. As our data offer three time points where wages are measured (in 1996, 2000 and
2004), we can therefore investigate how individuals‟ wage changes (between 1996 to 2000
and between 2000 to 2004) are related to individuals‟ changes in their level of qualification
over the same periods10
. In other words, this model assesses whether individuals who
undertake lifelong learning and therefore change their qualification level over time also
experience larger increases in wages than those who do not. This is shown in the model
10
Our first difference model takes into account time-constant individual heterogeneity (the first differencing
eliminates the unobserved effect).

18
Table 8. Delayed effect of NVQ2 on hourly wages in 2004
Dependent variable: Log of hourly wage in 2004
Combined sample:
males and females
Males only
Females only
Highest courses over 1996-2000 taken at level:
Level 1 -0.004 (0.032) -0.019 (0.057) 0.020 (0.038)
Level 2 -0.023 (0.058) 0.013 (0.089) -0.041 (0.074)
NVQ2 -0.006 (0.050) 0.008 (0.092) -0.031 (0.045)
Level 3 0.075** (0.035) -0.001 (0.057) 0.133*** (0.043)
Level 4 0.064** (0.030) 0.056 (0.052) 0.081** (0.036)
Level 5 0.012 (0.054) -0.060 (0.068) 0.058 (0.083)
Highest courses over 2000-2004 taken at level:
Level 1 -0.066* (0.034) -0.050 (0.054) -0.076* (0.043)
Level 2 -0.032 (0.041) -0.113* (0.062) 0.011 (0.055)
NVQ2 -0.113** (0.044) -0.140 (0.089) -0.073* (0.043)
Level 3 -0.022 (0.042) -0.003 (0.066) -0.041 (0.051)
Level 4 -0.052* (0.028) -0.092* (0.048) -0.020 (0.033)
Level 5 0.004 (0.067) -0.019 (0.107) 0.043 (0.083)
Highest qualification at 26
Level 1 0.055 (0.047) -0.012 (0.066) 0.129** (0.057)
Level 2 0.091* (0.051) -0.005 (0.073) 0.201*** (0.061)
Level 3 0.128** (0.052) 0.071 (0.072) 0.182*** (0.063)
Level 4 0.263*** (0.051) 0.171** (0.074) 0.368*** (0.062)
Level 5 0.356*** (0.062) 0.299*** (0.083) 0.423*** (0.083)
Math test at 10 0.006*** (0.001) 0.004** (0.002) 0.005*** (0.002)
Reading test at 10 0.000 (0.001) 0.003* (0.001) -0.000 (0.001)
Ability test at 10 0.000 (0.001) 0.000 (0.001) 0.001 (0.001)
Non white 0.063 (0.068) 0.171* (0.090) 0.009 (0.092)
Free school meal 10 -0.056** (0.026) -0.090* (0.048) -0.026 (0.030)
Financial hardship16 -0.051* (0.027) -0.064 (0.045) -0.025 (0.032)
Social class (i) -0.043 (0.040) -0.095 (0.060) 0.024 (0.052)
Social class (ii) -0.030 (0.022) -0.049 (0.035) -0.011 (0.029)
Social class (iii non-
manual)
0.085*** (0.029) 0.060 (0.042) 0.112*** (0.040)
Social class (iv) -0.032 (0.024) -0.054 (0.042) -0.016 (0.028)
Social class (v) -0.044 (0.050) 0.104 (0.063) -0.163** (0.065)
Father has degree 0.073** (0.032) 0.096** (0.047) 0.048 (0.041)
Father has A-Level 0.052* (0.030) 0.068 (0.047) 0.043 (0.040)
Mother has a degree 0.059 (0.061) -0.017 (0.086) 0.116 (0.091)
Mother has A-Level 0.061 (0.040) 0.083 (0.052) 0.036 (0.059)
Father v interested 0.198** (0.080) 0.020 (0.114) 0.266*** (0.099)
Father moderately
interested
0.178** (0.078) -0.028 (0.113) 0.280*** (0.096)
Father very little
interested
0.083 (0.085) -0.009 (0.112) 0.123 (0.114)
Father interest
missing
0.143* (0.077) -0.033 (0.109) 0.226** (0.095)
Mother v interested -0.049 (0.088) 0.080 (0.107) -0.098 (0.147)
Mother moderately
interested
-0.060 (0.086) 0.107 (0.104) -0.152 (0.144)
Mother very little
int.
-0.001 (0.086) 0.112 (0.096) -0.089 (0.153)
Mother interest
missing
-0.048 (0.088) 0.076 (0.107) -0.107 (0.147)
Constant 1.434*** (0.081) 1.665*** (0.105) 1.285*** (0.128)
N 3510 1636 1874
Adjusted R2 0.145 0.116 0.173
Notes: Figures in parenthesis are standard-errors. *** indicates significant at 1% level, ** at 5% level and * at
10% level.

19
below, where wages are denoted y and characteristics, including lifelong learning, are denoted
x and the error term is v11
.
The first difference model has the advantage that it enables us to take account of all the
factors and characteristics of the individual that remain fixed over time. However, we may
believe that some unobserved characteristics of individuals do in fact vary over time, such as
attitudes to learning or levels of motivation. If individuals who suddenly become more
inclined to learning or experience increased motivation are both more likely to undertake
lifelong learning and have higher wages anyway, our approach cannot be said to have
overcome the potential methodological problems inherent in trying to estimate the wage
impact from lifelong learning.
Table 9 shows the results of a first difference model where the dependent variable is the
change in individuals‟ wages between 1996-2000 and 2000-2004. The first set of results uses
a combined sample of men and women, then estimates are presented for women and men
separately. The lifelong learning variable used for this model is a simple dummy variable
which takes a value of one if the person undertook any lifelong learning (excluding
acquisition of an NVQ2) in the period. Separately there is also a dummy variable indicating
whether the individual specifically acquired an NVQ2 in the intervening period. Only
variables that measure things that change over time are included. Factors that vary and
influence wage growth include time out of the labour market. We therefore include the
number of months of unemployment the individual experienced between each time point of
observation. In addition family formation factors may influence labour market attachment and
earnings growth, particularly for women. We included an indicator for this, namely the
number of additional children in the household between each time point of observation. When
we add these time varying controls they are generally insignificant and the coefficient on the
lifelong learning variable is unaffected.
11
Note that for the first difference estimator to be unbiased the explanatory variables must be uncorrelated with
the error term v in all periods, conditional on the unobserved effect (a strict exogeneity assumption). But in
contrast to a random effects model, we do not need to assume that individual effects are uncorrelated with the
other regressors (i.e. xit). We performed Hausman tests comparing the results from a random effect model and a
first difference model which cast doubts on the consistency on the random effects model (H5= 3.35, for a test of
a first difference versus random effects model).
2,3it it ity x t

20
The results from Table 9a indicate that there is a positive effect on wage growth for this
cohort from undertaking lifelong learning between the ages of 26 and 34. By and large,
individuals who undertake lifelong learning over this period experience 20% higher wage
growth than individuals who do not. This contrasts with previous evidence that has suggested
that lifelong learning does not generally enhance wages (Jenkins et al. 2003). This difference
may be due to better data and methods; however, it is also likely to reflect a genuine
difference between the labour market in the early 1990s (analysed by Jenkins et al. 2003) and
the 2004 labour market, which we are focusing on in this report. It is therefore an important
finding that we show a positive wage effect from lifelong learning for a younger sample of
workers and in the current labour market. We are however, specifically interested in the wage
effects of NVQ2. Acquiring a NVQ2 has a statistically significant positive impact on wages
(of around 20%). When that is broken down by sex, the impact is positive for both men and
women, but only statistically significant for women. However, this doesn‟t necessarily mean
that men gaining a NVQ2 don‟t experience higher wages as a result. If we had a larger sample
size we could be more sure that there is a genuine effect from NVQ2 for men too. Without
larger sample sizes however, we can only be sure that there is a positive effect on wages from
NVQ2 for women
Table 9a: Effects of accredited lifelong learning (age 26-34) on ln(wages), first difference
estimates
1 2 3 4 5 6
Male + females Females Males
No controls With
controls
No
controls
With
controls
No
controls
With
controls
Undertook
lifelong learning
excluding
NVQ2
0.206*** 0.209*** 0.177*** 0.178*** 0.237**
*
0.242***
(0.024) (0.024) (0.033) (0.033) (0.034) (0.035)
Obtained NVQ2 0.161** 0.195*** 0.170 0.225** 0.151 0.157
(0.076) (0.072) (0.112) (0.100) (0.101) (0.103)
Months of
unemployment
-0.011 -0.010 -0.013
(0.011) (0.016) (0.014)
No of children 0.003 -0.017 0.020
(0.014) (0.022) (0.019)
N 6890 6758 3388 3328 3502 3430
Adjusted R2 0.010 0.011 0.008 0.009 0.012 0.012
Notes: Figures in parenthesis are standard-errors. *** indicates significant at 1% level, ** at 5% level and * at
10% level.

21
Table 9b then considers the effects of lifelong learning by level of qualification acquired. The
model is identical to that described for table 9a except that the lifelong learning undertaken
over the period is indicated in levels (with the effect of NVQ2 once again estimated
separately, as this is our primary interest). Thus the coefficient on Level 1 measures the
effect of undertaking accredited lifelong learning in the intervening period that resulted in a
Level 1 qualification. Level 2 qualifications have a positive effect on wages, although the
effect is larger for men. For women, Level 3 qualifications also have a positive impact.
However, for men accredited lifelong learning at Level 4 and Level 5 has a much bigger
impact on wages. Again, we are mostly focused on the impact of NVQ2 and the results here
tell the same story as table 9a.
Thus far therefore, we have found evidence that acquisition of NVQ2 for a cohort in their
twenties and thirties can be beneficial in terms of wages, for women at least. For example,
women who acquire a NVQ2 experience wages that around 20% higher than women who do
not acquire a NVQ2.
With the problem of small sample sizes in mind, we also explored the extent to which
acquiring qualifications in mid career was particularly beneficial for lower ability individuals.
We define lower ability individuals as those who scored in the bottom 50% from a cognitive
mathematical ability test12
administered to the cohort at age 10. Of course focusing on the
bottom half of the ability distribution is not ideal. We might be more interested in very low
achievers, say those in the bottom decile of the distribution.
However, with the small sample sizes involved we cannot do more than ask the question: do
individuals in the bottom half of the ability distribution gain more from acquiring a
qualification in mid career than higher ability individuals? Table 9c therefore shows the effect
of any lifelong learning and specifically the impact of NVQ2 on earnings, for individuals who
achieved in the bottom 50% of the ability distribution at age 10.
12
The pattern of results is similar if one uses alternative ability measures, such as reading ability.

22
Table 9b: Effects of accredited lifelong learning (age 26-34) on ln(wages), first difference
estimates
1 2 3 4 5 6
Male + females Females Males
No
controls
With
controls
No
controls
With
controls
No
controls
With
controls
Level 1 0.073 0.075 -0.092 -0.097 0.171 0.176
(0.122) (0.122) (0.223) (0.221) (0.123) (0.120)
Level 2 (excl
NVQ2)
0.311*** 0.310*** 0.233*** 0.233**
*
0.347*** 0.343***
(0.094) (0.094) (0.078) (0.077) (0.133) (0.133)
NVQ2 0.161** 0.195*** 0.170 0.225** 0.151 0.156
(0.077) (0.072) (0.112) (0.100) (0.101) (0.103)
Level 3 0.175** 0.174** 0.228** 0.227** 0.124 0.118
(0.087) (0.088) (0.114) (0.114) (0.130) (0.134)
Level 4 0.180*** 0.181*** 0.128 0.125 0.248*** 0.248***
(0.065) (0.066) (0.090) (0.091) (0.093) (0.094)
Level 5 0.124 0.143 -0.000 0.001 0.259*** 0.298***
(0.098) (0.096) (0.166) (0.164) (0.089) (0.081)
Months
unemployment
-0.010 -0.009 -0.010
(0.011) (0.015) (0.014)
No of children 0.007 -0.015 0.025
(0.014) (0.022) (0.019)
N 6890 6758 3388 3328 3502 3430
Adjusted R2 0.002 0.002 0.001 0.001 0.003 0.003
Notes: Figures in parenthesis are standard-errors. *** indicates significant at 1% level, ** at 5% level and * at
10% level.
For women, the wage gain from any lifelong learning is larger than for the whole sample13
. In
other words, lower ability individuals benefit somewhat more than higher ability individuals
from acquiring qualifications in their mid thirties. The general pattern of results is similar
across the different samples however: namely that in the lower ability sample, we can only be
sure that gaining NVQ2 has a positive effect on the wages of women. In parallel to the full
sample, the coefficient for men in the bottom half of the ability distribution is positive, but
statistically insignificant. Again, larger sample sizes would be needed in order to be more
certain about the effect of gaining a NVQ2 on the earnings of lower ability men.
13 Although the difference between the coefficient for the full sample and the lower ability sample is not
significant in every case due to small sample sizes.

23
Table 9c: Effects of accredited lifelong learning (age 26-34) on ln(wages), first difference
estimates, low ability only
1 2 3 4 5 6
Male + females Females Males
No controls With
controls
No
controls
With
controls
No
controls
With
controls
Undertook
lifelong learning
excluding
NVQ2
0.240*** 0.241*** 0.205*** 0.206*** 0.285*** 0.285***
(0.044) (0.045) (0.056) (0.057) (0.070) (0.072)
Obtained NVQ2 0.251* 0.325*** 0.212 0.316** 0.315 0.335
(0.136) (0.124) (0.181) (0.153) (0.203) (0.212)
Months of
unemployment
-0.022 0.016 -0.041*
(0.024) (0.027) (0.024)
No of children -0.034 -0.068* -0.003
(0.024) (0.039) (0.030)
N 2002 1966 1064 1040 938 926
Adjusted R2 0.014 0.016 0.011 0.014 0.017 0.016
Notes: Figures in parenthesis are standard-errors. *** indicates significant at 1% level, ** at 5% level and * at
10% level. This table includes only Individuals who were in the bottom 50% of the test score in maths at age 10.
Figures for those who obtained a NVQ2 are: 61, 58, 38, 36, 23 and 22 for col 1 to 6 respectively.
Table 9d focuses on the specific effect of different levels of qualification for lower ability
individuals (the specification is exactly the sample as for Table 9b but restricting the sample
to lower ability individuals). Once again the effect of NVQ2 is considered separately. The
results confirm the previous table, namely that the wage effect from various qualification
levels appears somewhat greater for lower ability individuals. For NVQ2 specifically, the
coefficient for the full sample is 0.225 (from Table 9b) where as the coefficient for the low
ability sample is 0.316 (from Table 9d). Therefore NVQ2 provides a bigger boost to the
earnings of lower ability individuals. However, as discussed above, we can only be sure about
the earnings boost that NVQ2 provides for women.
We now move on to consider employment effects. As has been mentioned earlier, there is
some evidence (Jenkins, 2005) that NVQ2 qualifications may have a positive impact on
employment for females. However, this evidence was based on cross section data and
therefore could not easily distinguish between qualifications acquired prior to becoming
employed and qualifications acquired immediately after starting a new job. We investigate
this issue using longitudinal data and therefore allowing for the timing of lifelong learning
and subsequent moves into or out of employment. Table 10 is a model where the dependent

24
variable takes a value of one if the person is in employment for more months in the previous
year than in any other state and zero otherwise, i.e. mostly employed. We do not focus on
unemployment per se as very few individuals in the sample are unemployed and there is not
sufficient variation in unemployment outcomes. In addition, for women inactivity is more
common. Instead we focus on determining the factors associated with being mostly in
employment, as opposed to mostly inactive or unemployed in the previous year.
Table 9d: Effects of accredited lifelong learning (age 26-34) on ln(wages), first difference
estimates
1 2 3 4 5 6
Male + females Females Males
No
controls
With
controls
No
controls
With
controls
No
controls
With
controls
Level 1 0.152 0.147 -0.263 -0.263 0.567*** 0.564***
(0.299) (0.299) (0.491) (0.492) (0.176) (0.177)
Level 2 (excl
NVQ2)
0.194*** 0.202*** 0.079 0.096 0.255*** 0.257***
(0.062) (0.064) (0.078) (0.077) (0.081) (0.082)
NVQ2 0.251* 0.324*** 0.212 0.316** 0.315 0.335
(0.136) (0.124) (0.181) (0.153) (0.203) (0.212)
Level 3 0.219* 0.215* 0.071 0.071 0.418*** 0.416***
(0.116) (0.114) (0.174) (0.171) (0.118) (0.116)
Level 4 0.263*** 0.264*** 0.192 0.177 0.340*** 0.348***
(0.095) (0.096) (0.171) (0.173) (0.067) (0.067)
Level 5 0.309 0.309 0.286 0.286 0.377*** 0.377***
(0.319) (0.318) (0.424) (0.422) (0.118) (0.118)
Months
unemployment
-0.020 0.018 -0.041*
(0.024) (0.027) (0.024)
No of children -0.036 -0.065* -0.009
(0.025) (0.039) (0.031)
N 2001 1965 1064 1040 937 925
Adjusted R2 0.003 0.005 -0.001 0.002 0.005 0.005
Notes: Figures in parenthesis are standard-errors. *** indicates significant at 1% level, ** at 5% level and * at
10% level. Figures of those who obtained an NVQ2 are the same as in Table 9c.
In column 1 the dependent variable measures employment in 1999/2000 and the explanatory
lifelong learning variables indicate accredited lifelong learning that occurred in the 1996-2000
period. In column 2 the dependent variable measures employment in 2003/4 and the lifelong
learning variable measure accredited learning over the 2000-2004 period. In the third column
the dependent variable measures employment in 2003/4 but the lifelong learning variables
span the entire 1996-2004 period. Lastly, in the final column we investigate the determinants

25
of employment in 2003/4 but focusing on the potential delayed effect of lifelong learning i.e.
looking separately at the impact of lifelong learning in the 1996-2000 and 2000-2004 periods.
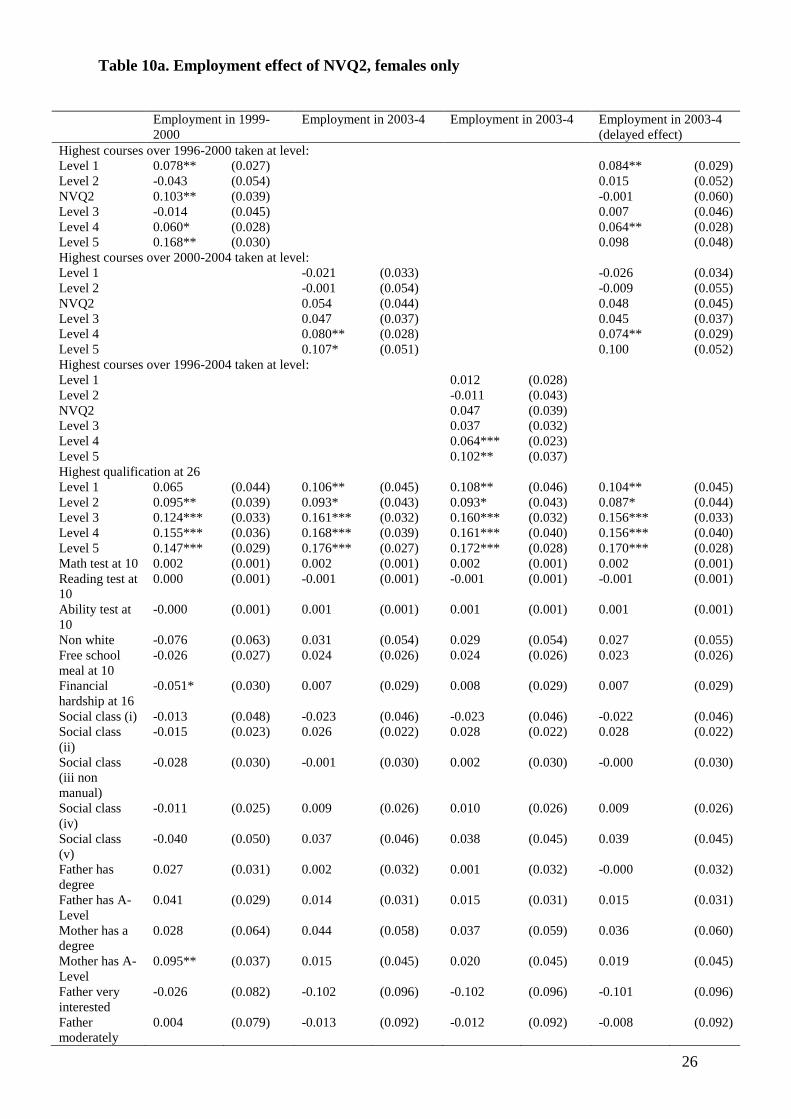
The results from table 10a are for females and one quarter of the female sample is mostly
unemployed or inactive in the previous year. The model controls for similar family
background variables as described in Table 4. Here we focus the discussion on the effects of
lifelong learning and just note that the likelihood of being mostly in employment in a given
year is, as one might expect, significantly determined by a person‟s initial level of education.
Ability and family background appear to matter less.
Column 1 from table 10a suggests that over the 1996-2000 period, lifelong learning leading to
qualifications at levels 1, 4 and 5 resulted in a higher probability of being mostly in
employment. The effect of NVQ2 specifically is also positive and significant in this first
period. Columns 2 and 3 however, indicate that in the second period and indeed over the
entire 1996-2004 period, only courses at level 4 and 5 resulted in a significantly greater
likelihood of being mostly in employment. NVQ2 generally had an insignificant effect on
employment.
The final column shows the delayed effects of lifelong learning on employment, thereby
ensuring that we measure the impact of qualifications acquired some time earlier on current
employment. As in the previous columns, there is a positive effect from level 4 and 5
qualifications on employment, and the coefficients are of a similar order of magnitude to
those in models that do not allow for this delayed effect. However, once we allow for the
delayed effect from acquiring a qualification, we find that a level 1 qualification does appear
to have a positive and significant effect on employment. Even allowing for a potentially
delayed effect however, NVQ2 continues to have no significant effect on employment.
Table 10b below gives results for males. It is worth noting that only 5% of the male sample is
mostly inactive or unemployed. The estimates of the effects of lifelong learning are quite
different for males. Generally higher-level lifelong learning at levels 4 and 5 is negatively
associated with employment in the first period. Other types of lifelong learning are
insignificant in the model. Over the entire period, level 3, 4 and 5 lifelong learning appears to
result in a lower probability of being mostly in employment. This may reflect time taken out
of the labour market to undertake such qualifications. It may also indicate that those
individuals who are out of the labour market may be more likely to take these qualifications.
In the final column we allow for the delayed impact of qualifications on employment. The
results suggest that for men acquiring qualifications over this period is generally not
26
Table 10a. Employment effect of NVQ2, females only
Employment in 1999-
2000
Employment in 2003-4 Employment in 2003-4 Employment in 2003-4
(delayed effect)
Highest courses over 1996-2000 taken at level:
Level 1 0.078** (0.027) 0.084** (0.029)
Level 2 -0.043 (0.054) 0.015 (0.052)
NVQ2 0.103** (0.039) -0.001 (0.060)
Level 3 -0.014 (0.045) 0.007 (0.046)
Level 4 0.060* (0.028) 0.064** (0.028)
Level 5 0.168** (0.030) 0.098 (0.048)
Highest courses over 2000-2004 taken at level:
Level 1 -0.021 (0.033) -0.026 (0.034)
Level 2 -0.001 (0.054) -0.009 (0.055)
NVQ2 0.054 (0.044) 0.048 (0.045)
Level 3 0.047 (0.037) 0.045 (0.037)
Level 4 0.080** (0.028) 0.074** (0.029)
Level 5 0.107* (0.051) 0.100 (0.052)
Highest courses over 1996-2004 taken at level:
Level 1 0.012 (0.028)
Level 2 -0.011 (0.043)
NVQ2 0.047 (0.039)
Level 3 0.037 (0.032)
Level 4 0.064*** (0.023)
Level 5 0.102** (0.037)
Highest qualification at 26
Level 1 0.065 (0.044) 0.106** (0.045) 0.108** (0.046) 0.104** (0.045)
Level 2 0.095** (0.039) 0.093* (0.043) 0.093* (0.043) 0.087* (0.044)
Level 3 0.124*** (0.033) 0.161*** (0.032) 0.160*** (0.032) 0.156*** (0.033)
Level 4 0.155*** (0.036) 0.168*** (0.039) 0.161*** (0.040) 0.156*** (0.040)
Level 5 0.147*** (0.029) 0.176*** (0.027) 0.172*** (0.028) 0.170*** (0.028)
Math test at 10 0.002 (0.001) 0.002 (0.001) 0.002 (0.001) 0.002 (0.001)
Reading test at
10
0.000 (0.001) -0.001 (0.001) -0.001 (0.001) -0.001 (0.001)
Ability test at
10
-0.000 (0.001) 0.001 (0.001) 0.001 (0.001) 0.001 (0.001)
Non white -0.076 (0.063) 0.031 (0.054) 0.029 (0.054) 0.027 (0.055)
Free school
meal at 10
-0.026 (0.027) 0.024 (0.026) 0.024 (0.026) 0.023 (0.026)
Financial
hardship at 16
-0.051* (0.030) 0.007 (0.029) 0.008 (0.029) 0.007 (0.029)
Social class (i) -0.013 (0.048) -0.023 (0.046) -0.023 (0.046) -0.022 (0.046)
Social class
(ii)
-0.015 (0.023) 0.026 (0.022) 0.028 (0.022) 0.028 (0.022)
Social class
(iii non
manual)
-0.028 (0.030) -0.001 (0.030) 0.002 (0.030) -0.000 (0.030)
Social class
(iv)
-0.011 (0.025) 0.009 (0.026) 0.010 (0.026) 0.009 (0.026)
Social class
(v)
-0.040 (0.050) 0.037 (0.046) 0.038 (0.045) 0.039 (0.045)
Father has
degree
0.027 (0.031) 0.002 (0.032) 0.001 (0.032) -0.000 (0.032)
Father has A-
Level
0.041 (0.029) 0.014 (0.031) 0.015 (0.031) 0.015 (0.031)
Mother has a
degree
0.028 (0.064) 0.044 (0.058) 0.037 (0.059) 0.036 (0.060)
Mother has A-
Level
0.095** (0.037) 0.015 (0.045) 0.020 (0.045) 0.019 (0.045)
Father very
interested
-0.026 (0.082) -0.102 (0.096) -0.102 (0.096) -0.101 (0.096)
Father
moderately
0.004 (0.079) -0.013 (0.092) -0.012 (0.092) -0.008 (0.092)

27
interested
Father very
little interested
-0.014 (0.092) -0.089 (0.119) -0.088 (0.119) -0.080 (0.118)
Father interest
missing
-0.030 (0.080) -0.066 (0.092) -0.064 (0.092) -0.063 (0.092)
Mother very
interested
0.198** (0.099) 0.099 (0.106) 0.097 (0.106) 0.096 (0.106)
Mother
moderately
interested
0.144* (0.073) 0.063 (0.094) 0.061 (0.095) 0.058 (0.095)
Mother very
little int.
0.098 (0.063) 0.075 (0.084) 0.072 (0.086) 0.069 (0.086)
Mother
interest
missing
0.137* (0.059) 0.070 (0.088) 0.067 (0.089) 0.068 (0.088)
N 2724 2724 2724 2724
Notes: The dependent variable takes the value of 1 where more months in employment than any other activity
have been spent in the 12 months before interview. Figures in parenthesis are standard-errors. *** indicates
significant at 1% level, ** at 5% level and * at 10% level.
Table 10b. Employment effect of NVQ2, males only
Employment in 1999-
2000
Employment in 2003-4 Employment in 2003-4 Employment in 2003-4
(delayed effect)
Highest courses over 1996-2000 taken at level:
Level 1 -0.026 (0.027) -0.016 (0.025)
Level 2 0.018 (0.023)
NVQ2 -0.019 (0.034) -0.004 (0.027)
Level 3 -0.018 (0.034) -0.093*** (0.048)
Level 4 -0.064*** (0.028) -0.026 (0.022)
Level 5 -0.096** (0.067) -0.033 (0.062)
Highest courses over 2000-2004 taken at level:
Level 1 0.026* (0.008) 0.025* (0.008)
Level 2 -0.036 (0.033) -0.044 (0.038)
NVQ2 -0.003 (0.027) 0.003 (0.024)
Level 3 -0.004 (0.022) 0.006 (0.019)
Level 4 -0.013 (0.018) -0.008 (0.017)
Level 5 -0.062 (0.067) -0.034 (0.056)
Highest courses over 1996-2004 taken at level:
Level 1 0.009 (0.013)
Level 2 -0.008 (0.023)
NVQ2 0.005 (0.021)
Level 3 -0.040** (0.026)
Level 4 -0.031** (0.018)
Level 5 -0.072* (0.057)
Highest qualification at 26
Level 1 0.058*** (0.014) 0.052*** (0.015) 0.052*** (0.015) 0.054*** (0.015)
Level 2 0.043*** (0.008) 0.039*** (0.008) 0.039*** (0.008) 0.039*** (0.008)
Level 3 0.045*** (0.008) 0.041*** (0.008) 0.042*** (0.008) 0.042*** (0.008)
Level 4 0.056*** (0.012) 0.054*** (0.011) 0.057*** (0.011) 0.055*** (0.011)
Level 5 0.037** (0.008)
Math test at 10 0.002*** (0.001) 0.001** (0.001) 0.001** (0.001) 0.001** (0.001)
Reading test at
10
-0.000 (0.000) -0.001** (0.000) -0.001** (0.000) -0.001** (0.000)
Ability test at
10
-0.000 (0.000) -0.000 (0.000) -0.000 (0.000) -0.000 (0.000)
Non white -0.040 (0.039) -0.016 (0.029) -0.013 (0.027) -0.013 (0.027)

28
Free school
meal at 10
-0.039** (0.019) -0.056*** (0.022) -0.054*** (0.021) -0.057*** (0.022)
Financial
hardship at 16
-0.032* (0.020) -0.030* (0.020) -0.031* (0.020) -0.033** (0.021)
Social class (i) 0.002 (0.023) -0.071** (0.044) -0.066** (0.043) -0.066** (0.043)
Social class
(ii)
-0.002 (0.013) -0.029** (0.016) -0.031** (0.016) -0.029** (0.016)
Social class
(iii non
manual)
0.016 (0.013) 0.002 (0.015) 0.001 (0.016) 0.000 (0.016)
Social class
(iv)
0.007 (0.012) 0.015 (0.010) 0.014 (0.010) 0.015 (0.010)
Social class
(v)
-0.027 (0.029) -0.017 (0.026) -0.018 (0.026) -0.014 (0.025)
Father has
degree
0.009 (0.014) 0.009 (0.012) 0.009 (0.012) 0.010 (0.012)
Father has A-
Level
0.027 (0.011) 0.017 (0.012) 0.018 (0.011) 0.018 (0.010)
Mother has a
degree
-0.004 (0.028) -0.003 (0.028) -0.007 (0.030)
Mother has A-
Level
0.010 (0.023)
Father very
interested
0.046* (0.025) 0.011 (0.034) 0.012 (0.031) 0.015 (0.031)
Father
moderately
interested
0.048** (0.014) 0.023 (0.025) 0.023 (0.023) 0.024 (0.023)
Father very
little interested
0.006 (0.027) -0.035 (0.064) -0.036 (0.060) -0.031 (0.058)
Father interest
missing
0.045* (0.022) 0.010 (0.034) 0.010 (0.030) 0.013 (0.030)
Mother very
interested
-0.008 (0.033) 0.021 (0.040) 0.017 (0.036) 0.016 (0.035)
Mother
moderately
interested
-0.013 (0.037) 0.013 (0.034) 0.011 (0.032) 0.010 (0.031)
Mother very
little int.
0.001 (0.034) 0.017 (0.023) 0.015 (0.022) 0.014 (0.022)
Mother
interest
missing
-0.015 (0.042) 0.004 (0.036) 0.001 (0.035) 0.002 (0.034)
N 2003 1857 1857 1821
Notes: The dependent variable takes the value of 1 where more months in employment than any other activity
have been spent in the 12 months before interview. Figures in parenthesis are standard-errors. *** indicates
significant at 1% level, ** at 5% level and * at 10% level.
associated with better employment prospects. This does not of course mean that education is
not an aid to employment. Men with higher initial levels of education were more likely to be
employed over the period. We cannot say however, that actually acquiring an NVQ2
qualification later in life actually improves employment prospects. This is partly because 80-
90% of individuals who acquire an NVQ2 later in life are already in employment.
We do find some instances where qualifications appear to be negatively related to
employment, i.e. individuals who acquire qualifications are less likely to be in employment.

29
We do not believe that qualifications have a negative causal effect on employment (except
perhaps mechanistically where individuals are out of the labour market in order to study).
What is more likely is that in our employment models we are not able to control for
unobserved characteristics of individuals which make them more or less likely to be
employed. We would therefore emphasise our wage results from the first difference models in
tables 9a and 9b, as these take account of such fixed unobserved characteristics.
In conclusion:
NVQ2 qualifications acquired in mid career provide a sizeable wage gain, of just over
20%. The effect is large and significant for women, but we cannot be sure of the effect
for men.
Other Level 2 qualifications acquired mid career yield substantial wage gains for both
men and women.
Low ability women (defined according to their test scores at age 10) benefit even more
from acquiring an NVQ2 later in life (just over 30% wage gain), when compared to
the results for the full sample. As in for the full sample, we cannot be sure of the
earnings effect of NVQ2 for low ability men.
NVQ2 qualifications acquired in mid career are not associated with better employment
prospects for this cohort.
6 Learning Benefits from NVQ2
Research Question:
Are individuals who acquire NVQ2 qualifications before the age of 30 more likely to go
on to subsequent spells of learning (either accredited or non-accredited learning), as
compared to a) individuals who have undertaken other forms of level 2 learning; and b)
those who have undertaken no adult learning?
Table 11 shows a cross tabulation of the association between acquiring a NVQ2 in one period
and the likelihood of undertaking further learning in the subsequent period. The columns
show the proportions undertaking different types of learning in the subsequent period, split
out by whether the individual acquired an NVQ2 in the previous period (Yes) or not (No). So,
of the 110 individuals who acquired an NVQ2 over the 1996-2000 period, some 73.6% went
on to do some kind of subsequent learning in the second period, whether accredited or

30
otherwise. This contrasts to just 45.5% of individuals who did not take an NVQ2 in the
previous period who went on to do further learning. The second set of columns indicates that
similar proportions of those who took a NVQ2 in the earlier period and those who did not,
went on to do non accredited learning specifically. Thus there is no association between
taking an NVQ2 and subsequent non-accredited learning. Note that non-accredited learning
includes courses taken for leisure, as well as unaccredited work related training. The final set
of columns indicates that those who took an NVQ2 in the previous period were considerably
more likely to go on to do some kind of accredited learning, i.e. gain a qualification, in the
second period. One must of course be aware of the small sample sizes involved when
drawing conclusions.
Table 11. NVQ2 acquisition and subsequent learning
Individuals who have (N=110) and who have not (N=6347) taken an NVQ2
qualifications over 1996-2000, percentages
yes no yes no yes no
Courses taken
subsequently over
2000-2004
All lifelong learning
(accreditated and non
accreditated)
73.6 45.5
Non accreditated
lifelong learning
29.1 30.4
Accreditated lifelong
learning
60.1
22.9
Notes: Yes indicates individuals who took an NVQ2 over the period 1996-2000 and No indicates those who did
not take an NVQ2 over the period 1996-2000.
Simple tabulations do not necessarily indicate whether there remains a significant association
between taking an NVQ2 and the likelihood of a person undertaking subsequent learning,
once other factors such as initial education level have been accounted for. In table 12, we
adopt a modelling approach and analyse the probability of undertaking firstly any type of
learning, then just accredited learning and finally only non-accredited learning during the
2000-2004 period. The key explanatory variable of interest is whether the individual acquired
an NVQ2 in the previous period (1996-2000). The model includes the full controls described
previously in table 3. Most of these control variables are not significantly associated with
whether or not the person subsequently undertakes lifelong learning (as was the case in table
5), although higher ability women who have fathers educated at degree level appear

31
marginally more likely to undertake non-accredited learning, such as leisure courses. As was
expected, initial education levels are important predictors of the likelihood of undertaking
subsequent accredited lifelong learning, although lower level qualifications are less important
in determining non-accredited learning. We do not discuss the coefficients on these control
variables in detail however, as the focus is on the role of accredited lifelong learning in
promoting further subsequent learning.
The results from table 12 are striking. Generally individuals who undertake accredited
learning in the earlier 1996-2000 period are more likely to undertake subsequent learning in
the later (2000-2004) period. This holds for all prior accredited learning up to level 4.
Unsurprisingly, taking the highest level, level 5 qualifications, in the early period was not
significantly associated with undertaking subsequent learning. The impact of accredited
learning on subsequent learning varies across the two types of learning, i.e. accredited and
non-accredited. Results from table 12 indicate that there is a positive significant relationship
between prior accredited and subsequent accredited learning. Thus gaining a qualification (up
to level 4) over the 1996-2000 period is positively associated with the likelihood of gaining a
qualification in the subsequent (2000-2004) period. Gaining a qualification in the early period
at levels 2 (excluding NVQ2) and 3 only was also associated with a higher probability of
undertaking non-accredited learning in the second period.
We are particularly interested in the relationship between acquiring a NVQ2 and subsequent
learning. Table 12 indicates that individuals who acquired a NVQ2 qualification in the early
period were 40 percentage points more likely to gain a subsequent qualification in the second
period. By contrast, other level 2 qualifications were associated with just a 17 percentage
points higher probability of gaining a subsequent qualification. Individuals gaining a NVQ2
in the previous period were not significantly more likely to undertake non-accredited lifelong
learning in the second period. We cannot conclude that we have established a causal
relationship here however. Firstly, there may be unobserved characteristics that determine
both the likelihood of taking an NVQ2 in the first place and also the person‟s likelihood of
gaining a subsequent qualification. Our modelling approach cannot allow for this.
Furthermore, sample sizes are relatively small and it is necessary to test these findings in a
data set with larger sample sizes.
In conclusion:
Undertaking accredited lifelong learning is associated with a higher probability of
going on to do more accredited learning,

32
Achieving an NVQ2 is associated with a higher probability of gaining another
qualification in a later period.
7 Conclusions
This report set out to address a number of research questions.
Firstly, what are the characteristics of individuals who acquire NVQ2 qualifications in their
twenties and thirties? The analysis suggests that family background and ability do not play a
large role in determining whether an individual acquires a NVQ2 in mid career. The exception
is parental social class: individuals from a non-manual social class background are more
likely to acquire an NVQ2, given their initial level of education and ability. Individuals who
take NVQ2 qualifications are not significantly less able than other workers, and this is
therefore not an explanation for the low or even negative wage returns to NVQ2 that have
been found by some researchers.
The second set of research questions pertains to the labour market value of NVQ2,
specifically whether a person acquiring an NVQ2 qualification in their twenties and thirties
would experience higher wages or better employment prospects. Simple Ordinary Least
Squares modeling confirmed the findings of the existing literature that the wage gains from an
NVQ2 (in this case acquired age 26-34) are minimal. However, when we used modeling
techniques that accounted for the fact that some types of individuals may be more inclined to
take a NVQ2 and may also have better prospects in the labour market, we found a significant,
positive wage effect from NVQ2 for women. Indeed, for women these wage gains were of a
similar magnitude to the wage gains associated with other types of level 2 qualifications.
Furthermore, the wage gain from NVQ2 was somewhat higher for lower ability women. For
men, the coefficient in the first difference model indicated that there could be a positive wage
effect from acquiring a NVQ2. But, this was statistically insignificant, so we cannot say with
certainty what the effect on earnings might be. One implication of this result and in particular
the difference between the OLS results and the first difference model, is that women who
acquire a NVQ2 may have other fixed characteristics that make them less likely to earn a high
wage in the labour market and when you account for this, you find that gaining a NVQ2 did
indeed benefit these women. By and large we were unable to find positive, significant effects

33
Table 12. Relationship between taking an NVQ2 qualification in first period (1996-2000)
on the probability of undertaking subsequent learning (during 2000-2004 period)
Accredited and non-
accredited lifelong
learning over 2000-2004
Accredited lifelong
learning only over 2000-
2004
Non-accredited lifelong
learning only over 2000-
2004
Coefficient Std-error Coefficient Std-error Coefficient Std-error
Highest courses over 1996-2000 taken at level:
NVQ2 0.313*** (0.047) 0.418*** (0.054) 0.029 (0.054)
Level 1 0.177*** (0.032) 0.216*** (0.033) 0.045 (0.032)
Level 2 0.135*** (0.049) 0.173*** (0.050) 0.094** (0.049)
Level 3 0.231*** (0.040) 0.292*** (0.043) 0.104** (0.043)
Level 4 0.052* (0.028) 0.097*** (0.027) 0.001 (0.025)
Level 5 0.036 (0.050) 0.025 (0.046) 0.039 (0.046)
Highest qualification at 26:
Level 1 0.158*** (0.051) 0.148*** (0.050) 0.056 (0.049)
Level 2 0.198*** (0.052) 0.191*** (0.058) 0.097* (0.055)
Level 3 0.199*** (0.052) 0.190*** (0.060) 0.088 (0.056)
Level 4 0.232*** (0.052) 0.145*** (0.055) 0.164*** (0.055)
Level 5 0.198*** (0.057) 0.107* (0.065) 0.145** (0.063)
Math test at 10 -0.002 (0.001) -0.002* (0.001) -0.001 (0.001)
Reading test at 10 -0.000 (0.001) -0.000 (0.001) 0.001 (0.001)
Ability test at 10 0.002*** (0.001) 0.001 (0.001) 0.001** (0.001)
Female 0.061*** (0.015) -0.009 (0.013) 0.089*** (0.014)
Non white 0.028 (0.052) -0.019 (0.042) 0.039 (0.049)
Free school meal at
10
-0.023 (0.026) -0.029 (0.021) 0.008 (0.024)
Financial hardship at
16
-0.010 (0.028) 0.037 (0.025) -0.035 (0.025)
Social class (i) -0.031 (0.038) -0.040 (0.030) -0.001 (0.034)
Social class (ii) 0.014 (0.021) -0.004 (0.018) 0.020 (0.019)
Social class (iii non
manual)
0.024 (0.027) -0.013 (0.022) 0.031 (0.025)
Social class (iv) -0.005 (0.025) 0.012 (0.021) -0.018 (0.023)
Social class (v) 0.003 (0.047) 0.032 (0.041) 0.020 (0.044)
Father has degree 0.052* (0.028) 0.005 (0.024) 0.063** (0.027)
Father has A-Level 0.017 (0.030) 0.016 (0.026) 0.011 (0.027)
Mother has a degree -0.051 (0.049) 0.017 (0.045) -0.044 (0.042)
Mother has A-Level -0.000 (0.041) -0.010 (0.035) 0.004 (0.037)
Father very
interested
-0.063 (0.077) -0.023 (0.064) -0.058 (0.072)
Father moderately
interested
-0.033 (0.076) 0.007 (0.065) -0.054 (0.069)
Father very little
interested
0.021 (0.084) 0.001 (0.071) -0.004 (0.080)
Father interest
missing
-0.048 (0.075) 0.007 (0.064) -0.053 (0.070)
Mother very
interested
-0.043 (0.089) -0.003 (0.076) 0.026 (0.085)
Mother moderately
interested
-0.075 (0.087) -0.015 (0.074) -0.015 (0.083)
Mother very little
int.
-0.143 (0.084) -0.023 (0.074) -0.100 (0.072)
Mother interest
missing
-0.046 (0.089) 0.032 (0.081) -0.019 (0.084)
N 4788 4788 4788
Notes: Figures in parenthesis are standard-errors. *** indicates significant at 1% level, ** at 5% level and * at
10% level. The dependent variables is whether a qualifications was taken during the 2000-04 period.

34
from acquiring an NVQ2 on employment prospects, for men or women, although as we noted
above this is partly because most individuals who take an NVQ2 already are in employment.
The final set of research questions related to whether individuals who acquire NVQ2
qualifications before the age of 30 are more likely to go on to subsequent spells of learning
(either accredited or non-accredited learning). We found strong associations between prior
lifelong learning and subsequent learning, particularly subsequent accredited learning. More
specifically, individuals who acquired an NVQ2 in the early period were much more likely to
go on to do more accredited learning in the second period. There was no significant
relationship between acquiring an NVQ2 and subsequent non-accredited learning.
The results suggest that an NVQ2 qualification can play a role in enhancing wage prospects of
womenwhen the qualification is acquired in a person‟s twenties and thirties However, we are
less sure of the effect on male wages of acquiring a NVQ2 and we were unable to find a
significant effect of NVQ2 on the employment prospects of men or women. Also, the role of
NVQ2 can be important, from a policy perspective, as we found a strong association between
acquiring an NVQ2 and undertaking further accredited learning. Thus NVQ2 may well be
used by individuals as a stepping stone to further learning that in turn yields good wage and
employment returns.
The evidence presented in this report therefore has a number of important policy implications.
Firstly, this report has been unable to confirm the size of any earnings benefit from gaining an
NVQ2 for men. This particular finding could be due to small sample sizes, but given that
other studies have found minimal earnings benefits to NVQ2 for men at best, further research
is needed to explore just how this qualification is used in the labour market. Perhaps some
NVQ2 qualifications provide workers with skills that are not valued in the labour market or
accredit existing skills, rather than impart new ones. To answer these important questions, it is
imperative that the government, employers and providers work together to better understand
why, on average, NVQ2 qualifications are not particularly highly valued in the labour market.
If such qualifications merely certificate existing skills and knowledge, this may still be
desirable, but more qualitative research is needed to understand the real role that NVQ2
qualifications are playing in the labour market. This issue is particularly pressing, given the
historic policy emphasis on achieving this level of qualification.
More optimistically, the evidence presented indicates that an NVQ2 has some labour market
value for women, particularly those with poorer cognitive ability. Again, we need to better

35
understand why NVQ2 qualifications can seemingly help women secure better wage
progression in the labour market but not men. Other evidence on the return to NVQ2
qualifications has suggested that the value of an NVQ2 varies by sector (Jenkins, Greenwood
and Vignoles 2007), so it may be that women are more likely to be employed in sectors that
reward NVQ2 holders. Equally, it may be that certification of skills is generally more
important for women, as indicated by the higher labour market return women earn on their
education and training, as compared to men. Again, better understanding of the way NVQ2
qualifications are being used by men and women in each sector is needed. This qualitative
analysis might perhaps be conducted in consultation with the Sector Skills Councils, who are
charged with having an “on the ground” understanding of skill needs in their particular sector.

36
References:
Ananiadou, K., Jenkins, A. and Wolf, A. (2004) “Basic skills and workplace learning: what
do we actually know about their benefits?”, Studies in Continuing Education, 26, 2,
289-308.
Battistin, E. and Sianesi, B., (2006), Misreported Schooling and Returns to Education:
Evidence from the UK, IFS (UCL), Cemmap working paper CWP07/06
Bynner, J. and Parsons, S. (1997a.) It Doesn’t Get Any Better: The Impact of Poor Basic
Skills on the Lives of 37 year-olds. London: Basic Skills Agency.
Bynner, J. and Parsons, S. (1997b). Does Numeracy Matter? London: Basic Skills Agency.
Bynner, J and Steedman, J. (1995). Difficulties with basic skills, London: Basic Skills
Agency.
Bynner, J. and Parsons, S. (2005) New Light on Literacy and Numeracy: Results of the
Literacy and Numeracy Assessment in the Age 34 Follow-up of the 1970 Cohort
Study (BCS70), NRDC main report.
Bynner, J., Dearden, H., McIntosh, S., Reed, J., Van Reenen, J., and Vignoles, A. (2001)
Improving Adult Basic Skills: Benefits to the Individual and to Society, DfEE Research
Brief No. 251.
Carey, S., Low, S. and Hansbro, J. (1997). Adult Literacy in Britain. London: The Stationary
Office.
Dearden L, McIntosh S, Myck M and Vignoles A (2002), “The Returns to Academic and
Vocational Qualifications in Britain”, Bulletin of Economic Research, 54, pp.249-274.
Dearden, L; McGranahan, L; Sianesi, B. (2004a). “Returns to Education for the „Marginal
Learner‟: Evidence from the BCS70”, Centre for Economics of Education Discussion
Paper No. 45.
Dearden, L; McGranahan, L; Sianesi, B. (2004b). “An In-depth Analysis of the Returns to
National Vocational Qualifications Obtained at Level 2”, Centre for Economics of
Education Discussion Paper No. 46.
Dearden, L., Reed, H and Van Reenen, J. (2006) “The impact of training on productivity and
wages: evidence from British panel data”, Oxford Bulletin of Economics and
Statistics, 68, 4, 397-422.
Department for Education and Employment (DfEE) (1999). Improving literacy and
numeracy: a fresh start. Great Britain Working Group on Post-School Basic Skills
chaired by Sir Claus Moser, London: Department for Education and Employment.
Dickerson A P (2005), A study on rates of return to investment in level 3 and higher

37
qualifications, DTI, December 2005.
Egerton, M. (2000) “Pay differentials between early and mature graduate men: the role of
state employment, Journal of Education and Work, 13, 3, 289-306.
Gorard, S., Febre, R. and Rees, G. (1999) “The Apparent decline of informal learning”,
Oxford Review of Education, 25, 4, 437-454.
Gorard, S., Rees, G. and Selwyn, N. (2002) “The „conveyor belt effect‟: a re-assessment of
the impact of National Targets for lifelong learning, Oxford Review of Education, 28,
1, 75-89.
Grinyer, J. (2005) Literacy, Numeracy and the labour market: Further analysis of the Skills
for Life survey, Department for Education and Skills report.
House of Commons Committee of Public Accounts (2006), Skills for Life: Improving Adult
Literacy and Numeracy, 21st report of session 2005-06, HC792.
Jenkins, A., Vignoles, A., Wolf, A., and Galindo-Rueda, F. (2003) „The determinants and
labour market effects of lifelong learning‟, Applied Economics, Vol.35, No.16,
pp.1711-1721.
Jenkins, A. (2005). „Women, Lifelong Learning and Transitions into Employment‟, Work,
Employment and Society, 20/2, 309-328, 2006.
Leitch Review of Skills (2006) Skills in the UK: the long term challenge – Final Report,
December 2006.
Machin, S. and Vignoles, A. (2005) What’s the Good of Education?: The Economics of
Education in the UK, Princeton University Press: Princeton and Oxford.
McIntosh S (2002), Further Analysis of the Returns to Academic and Vocational
Qualifications, DfES Research Report No. 370.
McIntosh, S. (2004). “The Impact of Post-school Vocational Qualifications on the Labour
Outcomes of Low-achieving School Leavers in the UK”, Centre for Economics
Performance, London School of Economics, mimeo.
McIntosh, S. and Vignoles, A. (2001) „Measuring and assessing the impact of basic skills on
labour market outcomes‟, Oxford Economic Papers, Vol.53, No.3, pp.453-481.
Meadows, P. and Metcalf, H. (2005) Evaluation of the impact of ‘Skills for Life’ learning:
Report on sweep 1. London: Department for Education and Skills.
Office for National Statistics (2005) Labour Force Survey. London: Office for National
Statistics.

38
Office for National Statistics (ONS), (2005), The Level of Highest Qualification Held by
Young People and Adults, England 2004, Department for Education and Skills,
London, UK
Parsons, S. and Bynner, J. (2005) Does Numeracy Matter More?, National Research and
Development Centre for Adult Literacy and Numeracy, Institute of Education, report.
Tyler, John H. (2004). "Basic Skills and the Earnings of Dropouts." Economics of Education
Review 23(3), 221-35.
Vignoles, A., Galindo-Rueda, F. and Feinstein, L. (2004) “The Labour Market Impact of
Adult Education and Training: A Cohort Analysis”, Scottish Journal of Political
Economy, 51, 2, 266- 280.
Vignoles, A., De Coulon, A. and Marcenaro-Gutierrez, O. (2006) The Value of Basic Skills in
the British Labour Market, mimeo.
Wolf, A. (2002) Does Education Matter? myths about education and economic growth.
Penguin Books.
Wolf, A. Jenkins, A. and Vignoles, A. (2006) „Certifying the workforce: economic imperative
or failed social policy?‟, Journal of Education Policy, Vol. 21, No.5, pp.535-565.