
Download 1.21 MB
74
Technical Assistance Consultant’s Report This consultant’s report does not necessarily reflect the views of ADB or the Government concerned, and ADB and the Government cannot be held liable for its contents. (For project preparatory technical assistance: All the views expressed herein may not be incorporated into the proposed project’s design. Project Number: 44447 August 2014 India: Preparing the Bond Guarantee Fund for India (Financed by the Japan Fund for Poverty Reduction) Prepared by CRISIL Risk and Infrastructure Solutions Limited Mumbai, India For Department of Financial Services, Ministry of Finance
Transcript of Download 1.21 MB
Technical Assistance Consultant’s Report
This consultant’s report does not necessarily reflect the views of ADB or the Government concerned, and ADB and the Government cannot be held liable for its contents. (For project preparatory technical assistance: All the views expressed herein may not be incorporated into the proposed project’s design.
Project Number: 44447 August 2014
India: Preparing the Bond Guarantee Fund for India (Financed by the Japan Fund for Poverty Reduction)
Prepared by CRISIL Risk and Infrastructure Solutions Limited
Mumbai, India
For Department of Financial Services, Ministry of Finance
Asian Development Bank
TA-8279 IND: Preparing the Bond Guarantee Fund for India
– 1 Consulting Firm (44447-012)
Market Assessment Report
August 2014
CRISIL Risk and Infrastructure Solutions Limited

Asian Development Bank
[iii] TA-8279 IND: Preparing the Bond Guarantee Fund for India Market Assessment Report
Abbreviations
ADB Asian Development Bank
AUM Assets Under Management
BGFI Bond Guarantee Fund for India
CAGR Compounded Annual Growth Rate
CDR Corporate Debt Restructuring
COD Commercial Operations Date
CRIS CRISIL Risk and Infrastructure Solutions
CRISIL Credit Rating and Information Services India Ltd.
CRR Cash Reserve Ratio
CSO Central Statistics Office
ECB External Commercial Borrowings
EPF Employee Provident Fund
EPFO Employees’ Provident Fund Organisation
GCF Gross Capital Formation
GDP Gross Domestic Product
GFCF Gross Fixed Capital Formation
GIC General Insurance Corporation of India
GNPA Gross Non-Performing Asset
HDFC Housing Development and Finance Corporation
HNI High Net-Worth Individual
HPCL Hindustan Petroleum Corporation Limited
IDBI Industrial Development Bank of India
IDF Infrastructure Debt Fund
IDFC Infrastructure Development & Finance Corporation
IFC International Finance Corporation
IFCI Industrial Finance Corporation of India
IIFCL India Infrastructure Finance Company Ltd.
IL&FS Infrastructure Leasing & Financial Services Ltd.
IRDA Insurance Regulatory and Development Authority
LIC Life Insurance Corporation of India
MOSPI Ministry of Statistics & Programme Implementation
MSME Micro, Small & Medium Enterprises
NBFC Non-Banking Finance Company
NCD Non-Convertible Debenture
NHAI National Highways Authority of India
NHB National Housing Bank
Asian Development Bank
[iv] TA-8279 IND: Preparing the Bond Guarantee Fund for India Market Assessment Report
NHDP National Highways Development Project
NPS National Pension System
NTPC National Thermal Power Corporation
ONGC Oil and Natural Gas Corporation
PCG Partial Credit Guarantee
PFC Power Finance Corporation
PFRDA Pension Fund Regulatory and Development Authority
PMI Purchasing Managers’ Index
PMS Portfolio Management Services
PPP Public-Private Partnership
PSU Public Sector Undertaking/Utility
RBI Reserve Bank of India
REC Rural Electrification Corporation
SARFAESI The Securitisation and Reconstruction of Financial Assets and Enforcement of Security Interest Act, 2002
SBI State Bank of India
SEB State Electricity Board
SEBI Securities and Exchange Board of India
SIDBI Small Industries Development Bank of India
SLR Statutory Liquidity Ratio
SPV Special Purpose Vehicle
USA United States of America
USAID United States Agency for International Development
USD United States Dollar
UTI Unit Trust of India
WPI Wholesale Price Index
Asian Development Bank
[v] TA-8279 IND: Preparing the Bond Guarantee Fund for India Market Assessment Report
Executive Summary
The Bond Guarantee Fund for India (BGFI seeks to catalyze the nascent bond market…
BGFI is proposed to be a credit enhancement mechanism, giving guarantees to long-term bond
issuances (by entities (private and public) in the infrastructure and non-infrastructure sectors) of
issuers with credit rating less than AA (category); through this credit enhancement these bond issues
would achieve a structured rating of AA or above and would therefore be able to attract bond market
investors.
CRISIL Infrastructure Advisory (CRIS) has been appointed by ADB to design such a fund – ascertain
the business case through market assessment, analyze the financial viability, develop the structure
and frameworks and conduct road shows and seminars. A kick-off meeting with the Steering
Committee was conducted on June 2, 2014 and subsequently the inception report was submitted on
June 23, 2014. This report details out the first stage of the engagement i.e market assessment.
Based on the analysis conducted – investments required over a period of 10 years, supply of
traditional sources of funds and their constraints – it can be concluded that bond markets need to play
a significant part to fund these investments. There is a huge pool of lower rated entities, rated lower
than AA (and especially in the A and BBB categories) which are practically serviced only by banks
today and which would benefit from the bond market and therefore a mechanism such as BGFI.
Moreover all market participants, interacted with during the course of this stage, were positively
disposed towards the overall concept of BGFI.
A comprehensive market assessment exercise was undertaken to ascertain the business case
for BGFI over a period of 10 years…
The exercise undertaken was two-fold:
First, an analytical projection of investments and debt requirement (long term and for entities
rated less than AA) for both infrastructure and non-infrastructure sectors for 10 years was
done – against which supply of debt from the existing sources of finance such as banks,
NBFCs, ECBs, and bond investors was measured. The objective of this exercise was to arrive
at the potential gap in debt financing.
Second, extensive interactions were held with a cross-section of stakeholders
(government/ministry departments, regulators, investors, bond issuers, investment banks and
lenders) to gain perspectives on the overall concept and attractiveness of the same to them.
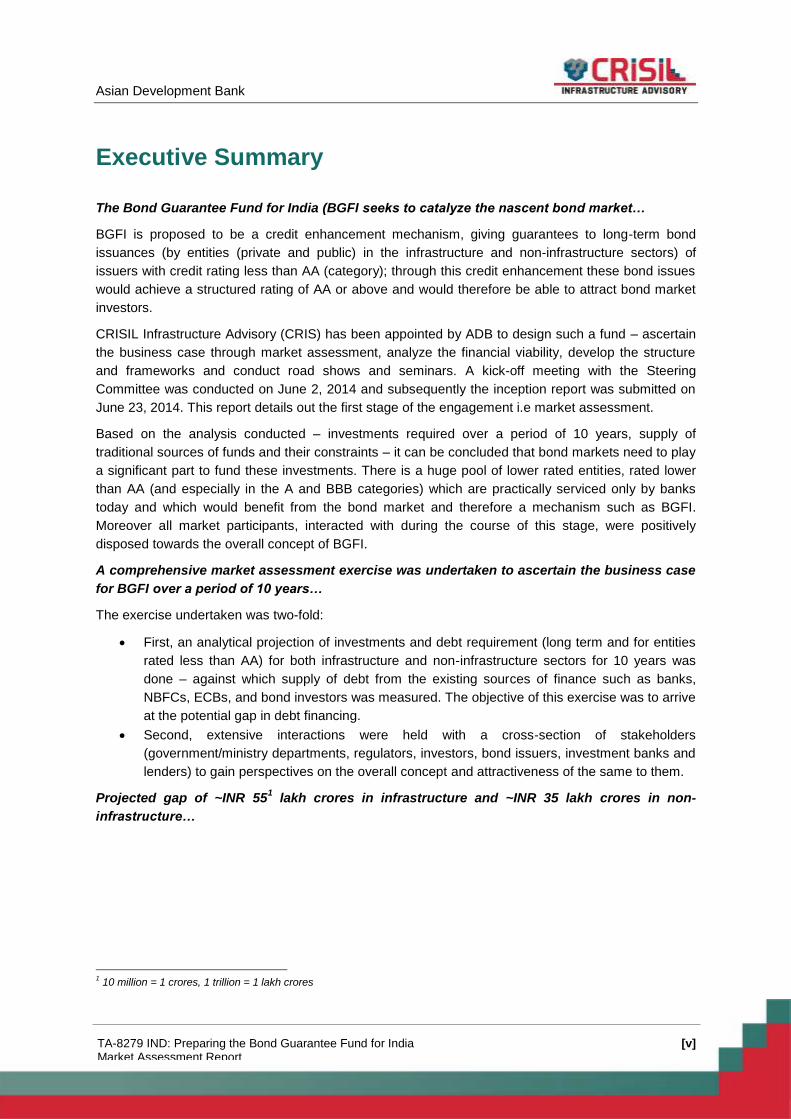
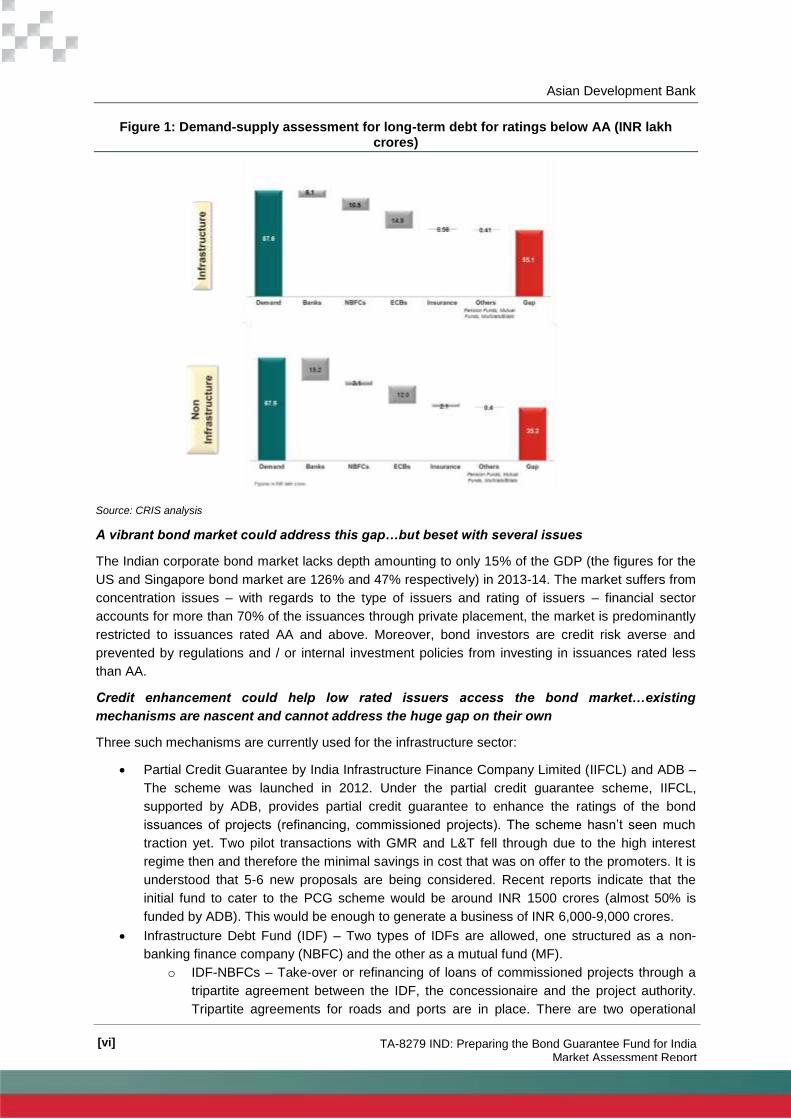
Projected gap of ~INR 551 lakh crores in infrastructure and ~INR 35 lakh crores in non-
infrastructure…
1 10 million = 1 crores, 1 trillion = 1 lakh crores
Asian Development Bank
[vi] TA-8279 IND: Preparing the Bond Guarantee Fund for India Market Assessment Report
Figure 1: Demand-supply assessment for long-term debt for ratings below AA (INR lakh crores)
Source: CRIS analysis
A vibrant bond market could address this gap…but beset with several issues
The Indian corporate bond market lacks depth amounting to only 15% of the GDP (the figures for the
US and Singapore bond market are 126% and 47% respectively) in 2013-14. The market suffers from
concentration issues – with regards to the type of issuers and rating of issuers – financial sector
accounts for more than 70% of the issuances through private placement, the market is predominantly
restricted to issuances rated AA and above. Moreover, bond investors are credit risk averse and
prevented by regulations and / or internal investment policies from investing in issuances rated less
than AA.
Credit enhancement could help low rated issuers access the bond market…existing
mechanisms are nascent and cannot address the huge gap on their own
Three such mechanisms are currently used for the infrastructure sector:
Partial Credit Guarantee by India Infrastructure Finance Company Limited (IIFCL) and ADB –
The scheme was launched in 2012. Under the partial credit guarantee scheme, IIFCL,
supported by ADB, provides partial credit guarantee to enhance the ratings of the bond
issuances of projects (refinancing, commissioned projects). The scheme hasn’t seen much
traction yet. Two pilot transactions with GMR and L&T fell through due to the high interest
regime then and therefore the minimal savings in cost that was on offer to the promoters. It is
understood that 5-6 new proposals are being considered. Recent reports indicate that the
initial fund to cater to the PCG scheme would be around INR 1500 crores (almost 50% is
funded by ADB). This would be enough to generate a business of INR 6,000-9,000 crores.
Infrastructure Debt Fund (IDF) – Two types of IDFs are allowed, one structured as a non-
banking finance company (NBFC) and the other as a mutual fund (MF).
o IDF-NBFCs – Take-over or refinancing of loans of commissioned projects through a
tripartite agreement between the IDF, the concessionaire and the project authority.
Tripartite agreements for roads and ports are in place. There are two operational
Asian Development Bank
[vii] TA-8279 IND: Preparing the Bond Guarantee Fund for India Market Assessment Report
IDFs, one promoted by ICICI and other by L&T. Interactions reveal that these funds
are finding it tough to find adequate assets in the market; primary reason is that
banks are not willing to sell off their assets after project commissioning as they
believe that risks come down substantially after commissioning of projects.
Discussions are also underway to do away with the tripartite agreement which could
result in lower credit rating for the respective IDFs, impacting their ability to attract
long term funds, as well as impacting their investments.
o IDF-MFs – Three IDFs set up by IL&FS, IIFCL and SREI. Investment guidelines
mandate them to invest at least 90% of AUM in infrastructure companies or
infrastructure projects/SPVs or bank loans in terms of completed and revenue
generating projects or public finance institutions or infrastructure finance companies.
Today while they are technically allowed to invest upto BBB, there are hardly any
investments in less than AA credits. The appetite of these funds for investment
directly in projects in the infrastructure sector is therefore questionable.
Credit enhancement by banks – The recent draft circular by RBI, which is open to public
comments allows restricted credit enhancement (by 20%/2 notches whichever is lower)
through provision of subordinate debt or a line of credit. Considering the fact that
infrastructure sector projects in general are rated not above BBB/BB, would need a higher
level of credit enhancement to take them to AA. Moreover, the current capital requirements as
mandated by the circular are prohibitive. Therefore, in the present form this mechanism is not
expected to be successful.
Clearly the viability of most of these mechanisms is in question. Moreover, the large market gap
cannot be addressed without new mechanisms being introduced. The RBI has recently issued a
circular, following the announcement in the Union Budget 2014-15, allowing banks to issue long-term
infrastructure bonds which are exempted from Cash Reserve Ratio (CRR), Statutory Liquidity Ratio
(SLR) and Priority Sector Lending limits. This initiative would help the banks two-fold, i) manage their
assets/liabilities better and ii) help the higher rated banks access cheaper sources of funds (due to
the exemptions) and thereby become aggressive in pricing of loans (interactions reveal that AAA
rated banks would probably enjoy pricing advantages to the tune of 50-120 bps). However the
initiative would do little to catalyze the bond market in terms of helping low rated entities access it.
Tremendous opportunity for BGFI…overall unanimous approval for such a mechanism, from
all stakeholders
A diverse set of stakeholders – government/ministry departments, regulators, investors, issuers,
lenders, and investment bankers – were consulted with during this stage. All of them were well
disposed towards such a concept and believed that such a mechanism could help kick-start the bond
market in the country.
Key issues were discussed and inputs were garnered from a wide cross-section of stakeholders on
the following issues:
Who will own this entity? – Strong ownership is required to attain AAA rating. Majority
government holding might create a moral hazard, while majority private sector holding might
not promote acceptability in the market. A widely held structure, professionally run, with
representation from both government and private sector could be explored along the lines of
IDFC – IDFC when set up had 35% government holding, 5% by IDBI, 40% by foreign
investors and 20% by domestic institutions. Government holding ensured easy access to
various stakeholders and forums within the government which helped in development of
IDFC.

Asian Development Bank
[viii] TA-8279 IND: Preparing the Bond Guarantee Fund for India Market Assessment Report
How will the entity be capitalized? – In addition to ownership, the entity should be sufficiently
capitalized to attain AAA rating. The capital could be upfront through direct infusion or by
means of callable capital. The government could also participate through a long-term
subordinate debt – case in point; the government has provided a 50-year subordinate debt
to IDFC.
What will be the legal structure of this entity? – The entity is meant to be a pure guarantee
company. Thus the operations of the entity do not strictly fall under the ambit of any of the
current regulated structures in India. A potential option is as a bond insurance company
(akin to a monoline insurer) under IRDA. Structuring the entity as a NBFC under RBI may
also be explored but it may lead to issues pertaining to exposure limits which NBFCs are
subjected to unless specific exemptions are obtained for the same.
What will be the business model of this entity?
o Products – Partial credit guarantee as an instrument is still nascent in India. It might
be prudent to employ a mix of full guarantees and partial guarantees to begin with to
establish credibility and acceptability.
o Rating enhancement – To begin with BGFI could target entities rated A and BBB
category, and enhance them to AA+/AAA. This would promote acceptability in the
market.
o Pricing – Pricing might be critical to wean away borrowers from the bank loan
market. Prominent bigger firms enjoy a long relationship with banks and therefore
favourable interest rates. The prospective cost savings in the bond market might not
be attractive enough to pull these firms away from their relationships. It would
therefore be advisable to target smaller promoters, with good credit quality, but who
do not enjoy favourable interest rates with the banks currently.
This report establishes the need for a facility such as BGFI. The next stage of the engagement,
which will be part of the interim report, will be to ascertain the financial viability of this facility
as a standalone business.
[ix]
Contents
1. Introduction ..................................................................................................................................... 1
1.1 Market estimation .................................................................................................................... 1
1.1.1 Classification of infrastructure and non-infrastructure sectors .................................. 2
1.2 Structure of the report ............................................................................................................. 3
2. Overview of the Indian Economy .................................................................................................... 4
2.1 Macroeconomic overview ........................................................................................................ 4
2.1.1 Sectoral trends ........................................................................................................... 4
2.2 Key indicators and outlook ...................................................................................................... 5
2.2.1 Infrastructure sector indicators .................................................................................. 5
2.2.2 Macroeconomic outlook ............................................................................................. 6
3. Investments in India and Debt Requirement ................................................................................... 8
3.1 Methodology to forecast investments and estimate debt requirement ................................... 8
3.2 Recent trends in investments .................................................................................................. 8
3.2.1 Investment in infrastructure sector............................................................................. 9
3.2.2 Investment in non-infrastructure sector ................................................................... 13
4. Financial Sector in India and Debt Supply .................................................................................... 16
4.1 Overview of the Indian financial sector ................................................................................. 16
4.2 Sources of debt financing and estimation of debt supply ..................................................... 17
4.2.1 Banks ....................................................................................................................... 17
4.2.2 Non-banking finance companies (NBFCs) .............................................................. 24
4.2.3 External commercial borrowings (ECBs) ................................................................. 27
4.2.4 Insurance sector ...................................................................................................... 30
4.2.5 Other suppliers of debt ............................................................................................ 33
4.3 Gap assessment ................................................................................................................... 37
4.3.1 Infrastructure sector ................................................................................................. 37
4.3.2 Non-infrastructure sector ......................................................................................... 38
4.4 Sensitivity analysis ................................................................................................................ 38
4.4.1 Adjustment for credit ratings bracket ....................................................................... 38
4.4.2 Adjustment to investment by insurance sector in less than AA ............................... 39
4.4.3 Adjustment to investment by EPFO, pension funds in less than AA ....................... 39
4.4.4 Adjustment to long-term tenure of credit provided by banks ................................... 40
5. Requirement of Bond Market in India ........................................................................................... 42
[x]
5.1 Key Issues with the bond market in India ............................................................................. 43
5.1.1 Lack of depth in corporate bond market in India ..................................................... 44
5.1.2 Low credit rating for infrastructure projects ............................................................. 44
5.1.3 Absence of bond Market for low rated paper ........................................................... 45
5.1.4 Low risk appetite of investors and regulatory restrictions ........................................ 45
5.1.5 Limited secondary market activity............................................................................ 46
5.1.6 Lack of awareness and information ......................................................................... 46
5.2 Credit enhancement can help bridge the gap ....................................................................... 46
5.3 Sectors that can potentially tap the bond market through credit enhancement .................... 47
5.3.1 Infrastructure ............................................................................................................ 47
5.3.2 Non-infrastructure .................................................................................................... 47
5.4 Existing credit enhancement mechanisms in India ............................................................... 47
5.4.1 Partial Credit Guarantee Scheme (PCG) ................................................................ 47
5.4.2 Infrastructure Debt Fund (IDF) ................................................................................. 48
5.4.3 Credit enhancement by banks ................................................................................. 49
6. Initial Thoughts on Bond Guarantee Fund for India and Next Steps ............................................ 51
6.1 Stakeholder’s initial inputs on BGFI ...................................................................................... 51
6.2 Next steps ............................................................................................................................. 54
7. Annexure 1 – Stakeholder meetings ............................................................................................. 55
[xi]
List of Tables
Table 1: Classification of infrastructure and non-infrastructure sectors .................................................. 3
Table 2: Growth in GDP of India at constant prices (2004-05 prices (percent)) ..................................... 4
Table 3: Sectoral share in GDP (%) ........................................................................................................ 5
Table 4: Global Competitiveness Report - Ranking for Infrastructure .................................................... 6
Table 5: Contribution of investment to GDP in percentage terms (at current market prices) ................. 8
Table 6: Comparison of infrastructure investments across Five Year Plans – Planning Commission
(INR crores) ............................................................................................................................................. 9
Table 7: Planning Commission estimates for private corporate sector debt requirement in the
infrastructure sector during 12th Five Year Plan (INR crores) ............................................................... 11
Table 8: Forecast for investment and debt requirement in infrastructure sector (INR crores) ............. 13
Table 9: Investments in non-infrastructure sectors ............................................................................... 13
Table 10: Estimated Private Debt Requirement in non-infrastructure sector ....................................... 15
Table 11: Outstanding credit by scheduled commercial banks in India (INR crores) ........................... 18
Table 12: Incremental flow of bank credit to infrastructure (INR crores) .............................................. 18
Table 13: Outstanding bank credit to non-infrastructure sector (INR crores) ....................................... 19
Table 14: Overall and incremental credit by scheduled commercial banks .......................................... 21
Table 15: Forecast of debt supply from banks to infrastructure sector (INR crores) ............................ 23
Table 16: Forecast of debt supply from banks to non-infrastructure sector (INR crores) ..................... 24
Table 17: Loans and advances by NBFCs (INR crores) ....................................................................... 24
Table 18: Loans and advances by NBFC-IFCs (INR crores) ................................................................ 25
Table 19: Forecast of debt supply from NBFC-IFCs to infrastructure sector (INR crores) ................... 26
Table 20: Total ECB Inflow (INR crores) ............................................................................................... 28
Table 21: Flow of ECBs to infrastructure sector (INR crores) ............................................................... 28
Table 22: Data for ECBs to non-infrastructure sector for the period January-April 2014 ..................... 28
Table 23: Forecast of debt supply through ECBs to infrastructure sector (INR crores) ....................... 29
Table 24: Forecast of debt supply through ECBs to non-infrastructure sector (INR crores) ................ 30
Table 25: Incremental flow of credit from insurance companies into infrastructure sector (INR crores)
.............................................................................................................................................................. 31
Table 26: Investments in infrastructure sector by life insurance companies (INR crores) ................... 31
Table 27: Forecast of debt supply from insurance companies to infrastructure sector (INR crores) ... 32
Table 28: Forecast of debt supply from insurance companies to non-infrastructure sector (INR crores)
.............................................................................................................................................................. 32
[xii]
Table 29: EPFO corpus (INR crores) .................................................................................................... 33
Table 30: EPFO portfolio managers ..................................................................................................... 33
Table 31: Corporate Bonds Investment Pattern – EPFO (INR crores as of September 2013) ............ 34
Table 32: Corpus size and investment pattern – NPS (INR crores) ..................................................... 34
Table 33: Estimated debt supply – NPS (INR crores) .......................................................................... 35
Table 34: Estimated Debt Supply - Mutual Funds ................................................................................ 36
Table 35: Historical debt supply from multilateral/bilateral Institutions ................................................. 36
Table 36: Estimated Debt Supply from Multilateral/Bilateral Institutions .............................................. 37
Table 37: Gap assessment for infrastructure sector (INR crores) ........................................................ 37
Table 38: Gap assessment for non-infrastructure sector (INR crores) ................................................. 38
Table 39: Adjustment to credit ratings bracket...................................................................................... 38
Table 40: Sensitivity - insurance sector Supply Increase ..................................................................... 39
Table 41: Sensitivity - Pension funds sector supply increase ............................................................... 39
Table 42: Sensitivity - Long term debt to Infrastructure from Banks ..................................................... 40
Table 43: Sensitivity - Long term debt to Non-Infrastructure from Banks ............................................. 40
Table 44: Past PCG transactions in India ............................................................................................. 48
Table 45: List of stakeholders met ........................................................................................................ 55
[xiii]
List of Figures
Figure 1: Demand-supply assessment for long-term debt for ratings below AA (INR lakh crores) ....... vi
Figure 2: Approach and methodology for market assessment ............................................................... 2
Figure 3: Sector-wise growth rate of GDP .............................................................................................. 5
Figure 4: Methodology to estimate debt requirement ............................................................................. 8
Figure 5: Investment in Infrastructure (% of GDP) for other emerging economies ............................... 12
Figure 6: Mode of financing of infrastructure investments .................................................................... 16
Figure 7: Corporate bonds outstanding as a percentage of GDP, 2013 – Replaced China with
Thailand................................................................................................................................................. 17
Figure 8: Methodology adopted for estimating debt supply from banks ............................................... 17
Figure 9: Banking sector GNPA and RA (%) ........................................................................................ 20
Figure 10: Exposure of the banking system to some of the large business groups (INR ‘000 crores) . 22
Figure 11: Methodology adopted for estimating debt supply from NBFCs ........................................... 24
Figure 12: Methodology adopted for estimating debt supply from ECBs ............................................. 27
Figure 13: Methodology adopted for estimating debt supply from insurance companies .................... 30
Figure 14: Issuances by issuer type (INR crores) ................................................................................. 43
Figure 15: Sectoral share in primary market issues ............................................................................. 43
Figure 16: Amount raised through private debt placement (INR crores) .............................................. 44
Figure 17: Issuances by issuer type (INR crores) ................................................................................. 44
Figure 18: Long-term instruments rated below AA in infrastructure sectors (INR crores) .................... 44
Figure 19: Bond issuances by rating (% of issuance values) ............................................................... 45
Figure 20: 10-year spreads data for AA, A and BBB category bonds in India ...................................... 54

Asian Development Bank
[1] TA-8279 IND: Preparing the Bond Guarantee Fund for India Market Assessment Report
1. Introduction
The Ministry of Finance (MOF) has requested the Asian Development Bank (ADB) to examine the
modalities, scope and potential for the establishment of the Bond Guarantee Fund for India (BGFI)
that supports the development of the local currency bond market to meet India’s infrastructure and
non-infrastructure financing requirements.
CRISIL Infrastructure Advisory (CRIS) has been appointed for designing such a fund. The assignment
is being undertaken under a technical assistance grant from ADB and under the aegis of the MOF.
The MOF has constituted a Steering Committee – to oversee the progress of this assignment –
comprising representatives from Department of Financial Services (DFS) – Chairperson, Department
of Economic Affairs (DEA) – Observer, Insurance Regulatory and Development Authority (IRDA),
Pension Fund Regulatory and Development Authority (PFRDA), Reserve Bank of India (RBI), and
Securities and Exchange Board of India (SEBI).
The first meeting with the Steering Committee was held on June 2, 2014 wherein CRIS presented the
objectives of the study and detailed work programme – approach and methodology, work plan and
deliverables’ schedule. Thereafter, a detailed Inception Report was submitted by CRIS on June 23,
2014 presenting the afore-mentioned details.
This document – market assessment report – forms the second deliverable of this study. It is advised
that this report is read post reading of the inception report.
1.1 Market estimation
BGFI is proposed to be a credit enhancement mechanism, giving guarantees to long-term bond
issuances (by entities (private and public) in the infrastructure and non-infrastructure sectors) with
credit rating less than AA (category); through this credit enhancement these bond issues would
achieve a structured rating of AA or above and would therefore be able to attract bond market
investors. With this background, this report strives to estimate a market/ a business case for BGFI.
The estimation is structured in the following broad manner for both the infrastructure and non-
infrastructure sectors.
Asian Development Bank
[2] TA-8279 IND: Preparing the Bond Guarantee Fund for India Market Assessment Report
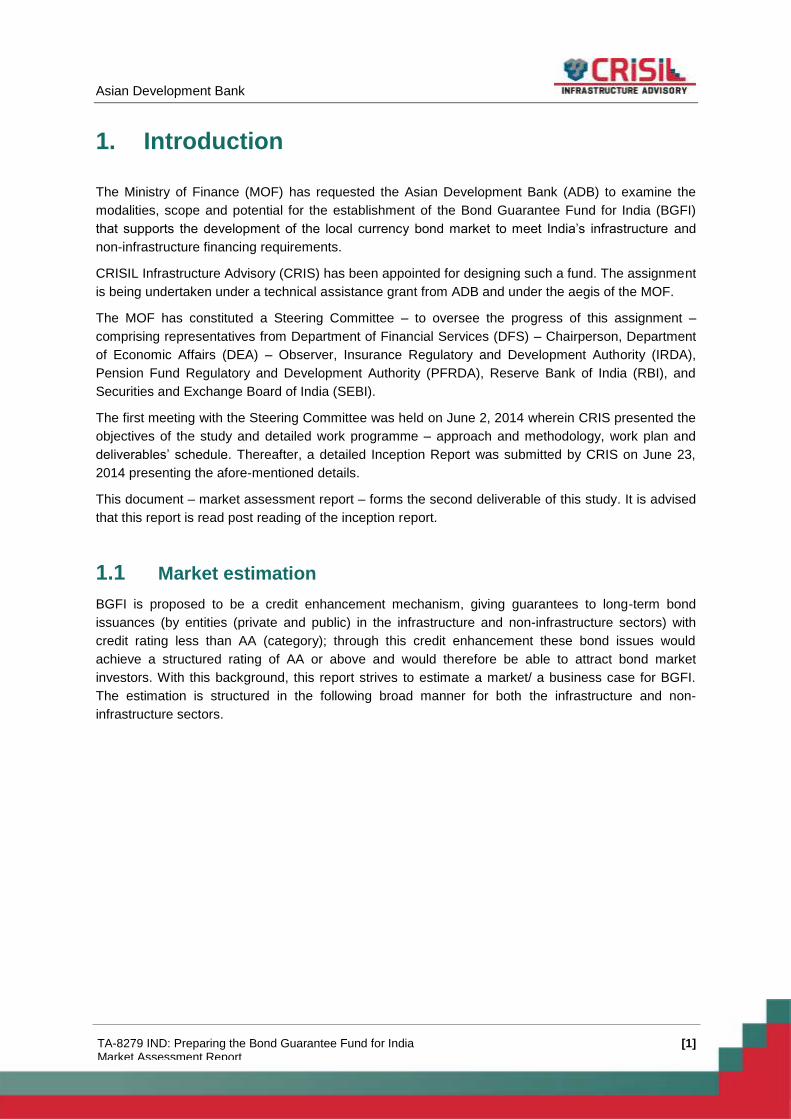
Figure 2: Approach and methodology for market assessment
Forecast investments/fixed capital formation (for 10 years from 2015-16 to 2024-25) by
entities (public and private) and estimate the demand for debt
Forecast supply of debt (for the same time period) from the existing traditional sources of
finance – banks (also accounting for the recent initiative to allow them to issue long-term
infrastructure bonds), non-banking finance companies (NBFCs), external commercial
borrowings (ECBs) amongst others
Estimate if there is a gap between demand and supply
Conduct a broad analysis of the possible addressable gap by some of the recently announced
mechanisms such as partial credit guarantee (PCG), Infrastructure Debt Fund (IDF) and other
credit enhancement mechanisms
Estimate a possible market for BGFI. The existing bank loan ratings will also be analysed to
assess the quantum of long-term bank loans required for entities rated less than AA.
The detailed methodology is given in pertinent sections from Chapter 3. The analysis is based on
primary and secondary research including interactions with seasoned internal as well as external
stakeholders.
1.1.1 Classification of infrastructure and non-infrastructure sectors
For the estimation of investment requirements and supply, all economic sectors have been divided
into two main sectors, namely, infrastructure and non-infrastructure. This division is based on the
Asian Development Bank
[3] TA-8279 IND: Preparing the Bond Guarantee Fund for India Market Assessment Report
definition of infrastructure sectors as specified by RBI2 as well as the sectors considered under capital
formation in the National Account Statistics prepared by the Ministry of Statistics and Programme
Implementation (MOSPI)3.
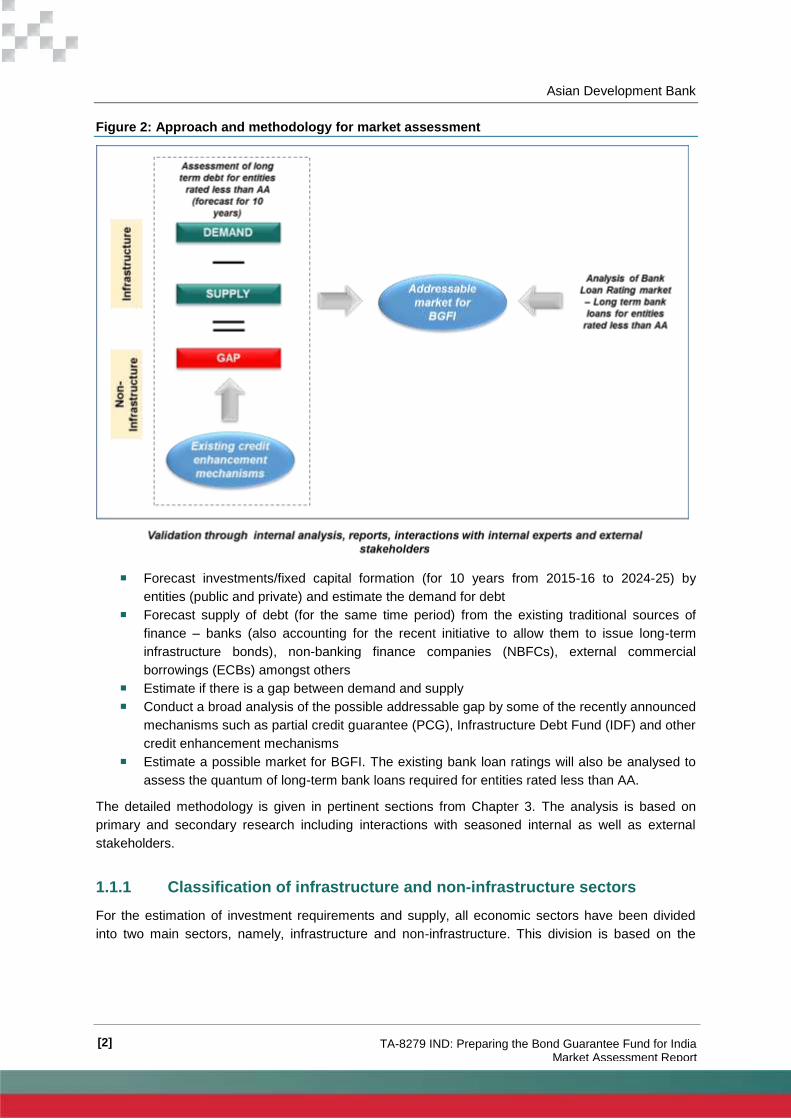
The following table presents the sub-sectors considered as part of infrastructure and non-infrastructure sectors.
Table 1: Classification of infrastructure and non-infrastructure sectors
Sector Sub-sectors
Infrastructure
Mining & Quarrying
Electricity, gas & water supply,
Construction
Transport, Storage & Communication
Non-Infrastructure
Agriculture, forestry & fishing,
Manufacturing (Both registered & unregistered)
Trade, hotels and restaurants
Financial, insurance, real estate & business services,
Community, social & personal services
Source: RBI, MOSPI
1.2 Structure of the report
The purpose of this report is to assess the business potential/estimate the market size for BGFI. The
report is structured as follows:
Chapter 1 (this chapter) provides an introduction to this report and puts forth the structure of
the report.
Chapter 2 provides a brief overview on the Indian economy and outlook.
Chapter 3 looks at historical trends and estimates of future investments in the infrastructure
and non-infrastructure sectors in India; following which an estimate of debt to fund these
investments is arrived at.
Chapter 4 gives an overview of the current sources of financing in India, the key constraints
and issues in present financing sources. This chapter also estimates the likely debt supply
from these sources in the future and the resulting gap between debt demand and supply.
Chapter 5 establishes the importance of the bond market and the key issues facing the bond
market in India today. The chapter also touches upon why credit enhancement would be
important to catalyze the bond market and also looks at the existing credit enhancement
mechanisms in the country.
Chapter 6 establishes the need for Bond Guarantee Fund in India and presents the initial
thoughts on some of the key issues (highlighted in the inception report) and summarizes
discussions with stakeholders on these issues. This chapter also presents the next steps on
this engagement.
2 Circular RBI/2013-14/378 dated November 25, 2013
3 http://mospi.nic.in/Mospi_New/upload/NAS2014/NAS14.htm
Asian Development Bank
[4] TA-8279 IND: Preparing the Bond Guarantee Fund for India Market Assessment Report
2. Overview of the Indian Economy
2.1 Macroeconomic overview
The Indian economy grew at a fast clip of over 9% for three successive years before it slowed down
due to the global financial crisis in 2008-09. It however recovered strongly and posted almost
equivalent pre-crisis growth figures in the two subsequent years. In recent times, the economy has
suffered a slowdown, witnessing its lowest growth rate in 2012-13.
A combination of domestic factors, borne out of weak policy decisions, such as high inflation, weak
currency, and drop in foreign investment coupled with global stress factors such as the sovereign debt
crisis in the Euro-zone that unfolded in 2010-11 (and the subsequent recession in the Euro-area)
were primary reasons for the slow growth.
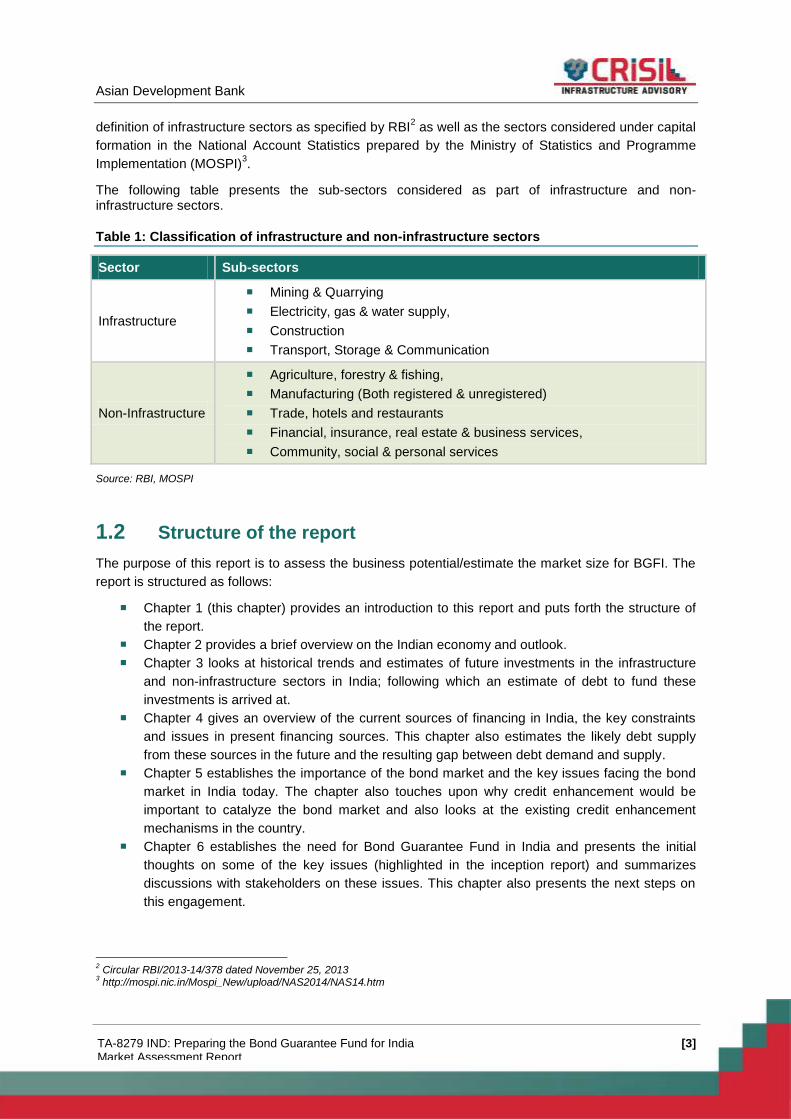
Table 2: Growth in GDP of India at constant prices (2004-05 prices (percent))
2006-07 2007-08 2008-09 2009-10 2010-11 2011-12 2012-13 2013-14
9.57 9.32 6.72 8.59 8.91 6.69 4.47 4.74
Source: CSO Release May 30, 2014, RBI, EAC to PM, Ministry of Finance; May 31, 2014
The economy began to show signs of recovery in 2013-14, with the second quarter of 2013-14
recording a growth of 4.8%. This follows a growth rate of 4.4% in the first quarter which was the
lowest growth recorded in 16 quarters. The external sector witnessed a turnaround after the first
quarter of 2013-14, the year ending with a current account deficit of 1.7% of GDP as against 4.7 per
cent in 2012-13. Improvement has also been observed on the fiscal front, with the fiscal deficit
declining from 5.7% of GDP in 2011-12 to 4.9% in 2012-13 and 4.5% in 2013-14. Other indications of
recovery are the moderation on year-on-year WPI inflation to 6.0% in 2013-14 vis-à-vis 8.9% in 2011-
12 and 7.4% in 2012-13, accelerated growth in agriculture and a mild recovery in manufacturing.
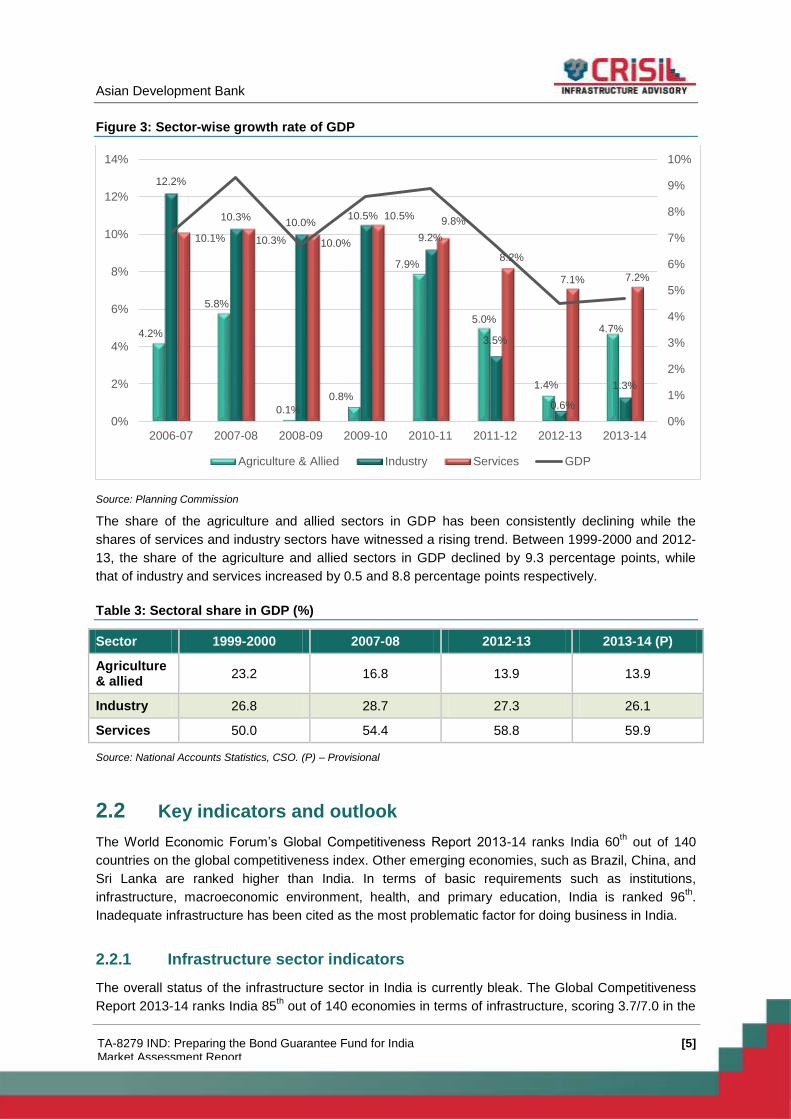
2.1.1 Sectoral trends
In the last decade, the biggest contributors to the economy growth were the services and industry
sectors. As seen in the subsequent graph, between 2006-07 and 2007-08 when the annual growth
rate of GDP was over 9 per cent, the performance of these two sectors was particularly strong.
The slowdown witnessed in the following years, however, was broad-based across all sectors. The
agriculture sector witnessed a steady decline in growth rate from 7.9 per cent in 2010-11 to 3.6% in
2011-12 and further to 1.9 per cent in 2012-13. Within the industry sector, mining and manufacturing
sectors have decelerated significantly over the period 2010-11 and 2012-13. Growth in services which
had averaged 10 per cent for six years, reduced to 8.2 per cent and 7.1% in 2011-12 and 2012-13
respectively. Within the services sector, transport (particularly railways) and communications, as well
as banking and insurance, slowed in 2012-13 vis-à-vis 2011-12.
In 2013-14, the agriculture and allied sectors achieved a growth of 4.7% due to favourable monsoons,
while business services also witnessed recovery due to moderate revival in the global economy.
Asian Development Bank
[5] TA-8279 IND: Preparing the Bond Guarantee Fund for India Market Assessment Report
Figure 3: Sector-wise growth rate of GDP
Source: Planning Commission
The share of the agriculture and allied sectors in GDP has been consistently declining while the
shares of services and industry sectors have witnessed a rising trend. Between 1999-2000 and 2012-
13, the share of the agriculture and allied sectors in GDP declined by 9.3 percentage points, while
that of industry and services increased by 0.5 and 8.8 percentage points respectively.
Table 3: Sectoral share in GDP (%)
Sector 1999-2000 2007-08 2012-13 2013-14 (P)
Agriculture & allied
23.2 16.8 13.9 13.9
Industry 26.8 28.7 27.3 26.1
Services 50.0 54.4 58.8 59.9
Source: National Accounts Statistics, CSO. (P) – Provisional
2.2 Key indicators and outlook
The World Economic Forum’s Global Competitiveness Report 2013-14 ranks India 60th out of 140
countries on the global competitiveness index. Other emerging economies, such as Brazil, China, and
Sri Lanka are ranked higher than India. In terms of basic requirements such as institutions,
infrastructure, macroeconomic environment, health, and primary education, India is ranked 96th.
Inadequate infrastructure has been cited as the most problematic factor for doing business in India.
2.2.1 Infrastructure sector indicators
The overall status of the infrastructure sector in India is currently bleak. The Global Competitiveness
Report 2013-14 ranks India 85th out of 140 economies in terms of infrastructure, scoring 3.7/7.0 in the
4.2%
5.8%
0.1%
0.8%
7.9%
5.0%
1.4%
4.7%
12.2%
10.3% 10.0%
10.5%
9.2%
3.5%
0.6%
1.3%
10.1% 10.3% 10.0%
10.5% 9.8%
8.2%
7.1% 7.2%
0%
1%
2%
3%
4%
5%
6%
7%
8%
9%
10%
0%
2%
4%
6%
8%
10%
12%
14%
2006-07 2007-08 2008-09 2009-10 2010-11 2011-12 2012-13 2013-14
Agriculture & Allied Industry Services GDP
Asian Development Bank
[6] TA-8279 IND: Preparing the Bond Guarantee Fund for India Market Assessment Report
global competitiveness index. Other emerging economies, such as China, Brazil, and Sri Lanka are
ranked higher and boast of better basic infrastructure, as shown in the table below.
Table 4: Global Competitiveness Report - Ranking for Infrastructure
Country Rank Global Competitiveness Index Score
(Out of 7)
Hong Kong 1 6.7
Singapore 2 5.9
USA 15 5.8
China 48 4.5
Brazil 56 4.3
Sri Lanka 73 4.0
India 85 3.7
Pakistan 121 2.7
Source: Global Competitiveness Report 2013-14, World Economic Forum
Further, India is ranked 84th in terms of road infrastructure, 19
th in terms of railroad, 70
th in terms of
port infrastructure, 61st in terms of quality of air transport infrastructure and 111
th in terms of electricity
supply.
Time overruns in the implementation of projects continue to be one of the main reasons for
underachievement in many infrastructure sectors. According to the Ministry of Statistics and
Programme Implementation (MOSPI) Flash Report for February 2014, of the 239 central-sector
infrastructure projects costing INR 1000 crores and above, 99 are delayed with respect to the latest
schedule and 11 have reported additional delays with respect to the date of completion reported in the
previous month. Delays in land acquisition, municipal permission, supply of materials, award of work,
operational issues, etc. continue to drag down the implementation of these projects and hinder
efficient capital expenditure.
Further, infrastructure projects are also subject to financing constraints since they are typically
complex, are highly capital-intensive, and have long gestation periods. Infrastructure projects are
characterized by non-recourse or limited recourse financing. Initial financing requirements form a
large proportion of the total cost of the project, owing to the high capital requirements. In India, the
sector is over-dependent on banks for its financing due to the absence of other alternative sources of
long-term finance. Banks have been increasingly facing stress due to overexposure to the sector and
increasing asset-liability mismatches.
Resolving bottlenecks in infrastructure investments and associated financing issues is the need of the
hour.
2.2.2 Macroeconomic outlook
With the appointment of a new government which is widely touted to be progressive, the economy is
expected to regain lost ground and move upwards. This growth is based on the expectations of
modest revival in the global economy, improved balance of payments situations and better
performance of the manufacturing sector, which registered a growth of only 2% per annum in the last
two years.

Asian Development Bank
[7] TA-8279 IND: Preparing the Bond Guarantee Fund for India Market Assessment Report
Global economic activity is expected to strengthen in the current year on the back of some recovery in
advanced economies. The World Bank has predicted a growth rate of above 1% for the Euro area as
against the contraction witnessed in 2012 and 2013. The growth outlook for emerging Asian
economies is generally benign with some grappling with inflation, structural bottlenecks, and external
imbalances.
The Union Budget 2014-15 has announced steps to raise private consumption growth as well as push
growth in the manufacturing and construction/infrastructure sectors. While these steps would help in
industrial recovery, weaker monsoons are likely to adversely impact growth in the short term.
The Economic Survey of India 2013-14 (July, 2014) has predicted a growth rate of GDP at constant
prices in the range of 5.4 – 5.9% in 2014-15 for the economy. This assumes the revival of growth in
the industrial sector witnessed in April 2014 to continue for the rest of the year, the generally benign
outlook on oil prices and the absence of pronounced destabilizing shocks. However, as per our
estimates, it is expected that GDP will grow at a lower growth rate of 5.5% in the short term, given the
likely deficit in monsoons in 2014-15 that could affect agriculture production.
Asian Development Bank
[8] TA-8279 IND: Preparing the Bond Guarantee Fund for India Market Assessment Report
3. Investments in India and Debt Requirement
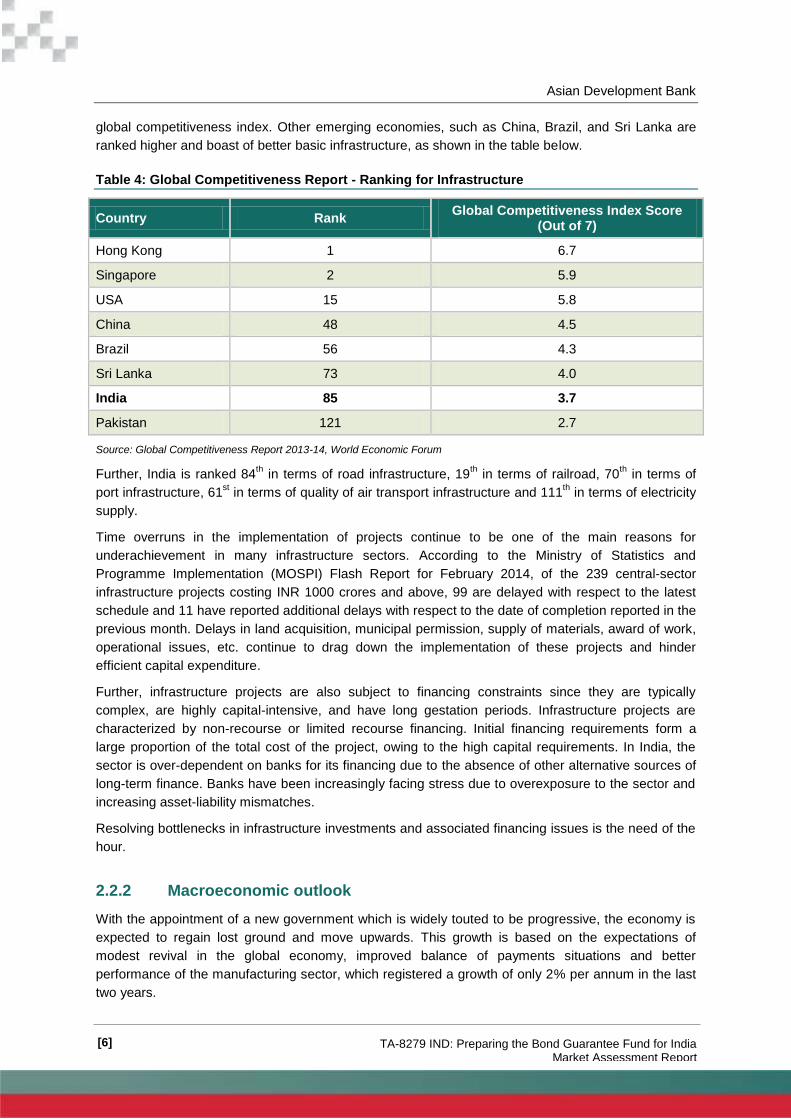
3.1 Methodology to forecast investments and estimate debt
requirement
Debt requirement has been estimated separately for both infrastructure and non-infrastructure sectors
in the future, based on the likely economic growth and fixed capital formation. The flowchart in the
following figure gives a snapshot of the methodology utilized for estimating this requirement.
Figure 4: Methodology to estimate debt requirement
Source: CRIS analysis
Detailed analysis and assumptions are present in the Excel document accompanying this report.
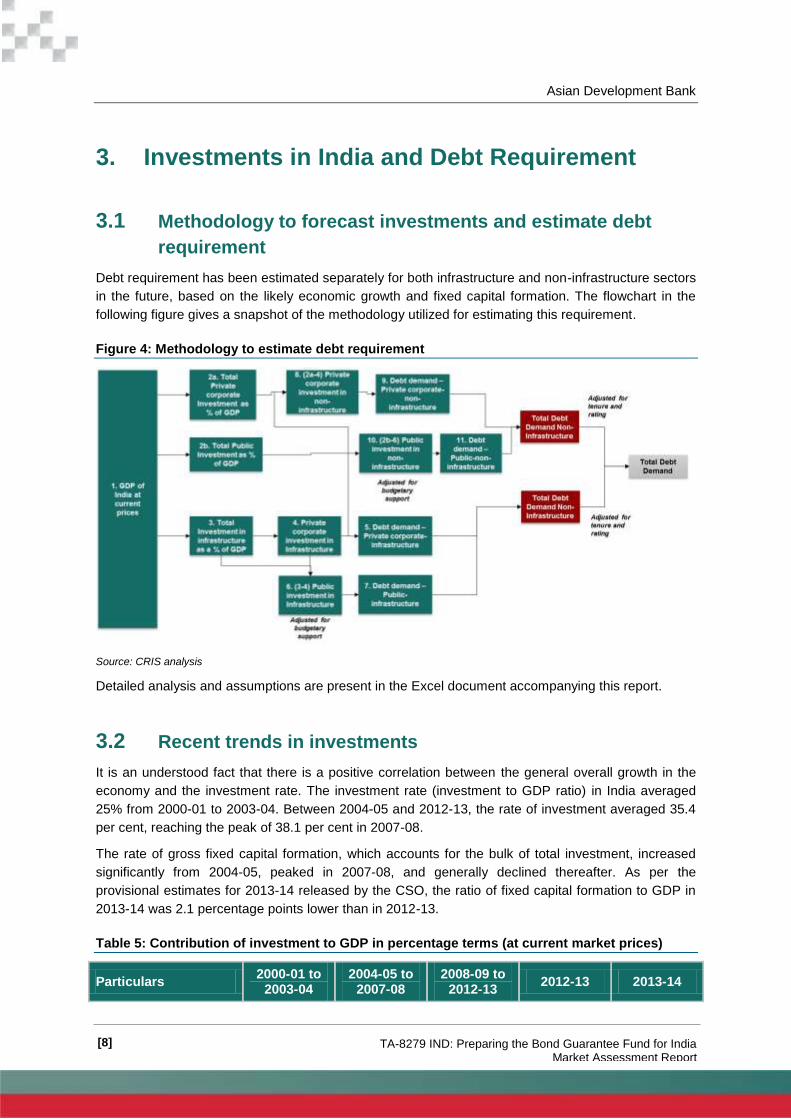
3.2 Recent trends in investments
It is an understood fact that there is a positive correlation between the general overall growth in the
economy and the investment rate. The investment rate (investment to GDP ratio) in India averaged
25% from 2000-01 to 2003-04. Between 2004-05 and 2012-13, the rate of investment averaged 35.4
per cent, reaching the peak of 38.1 per cent in 2007-08.
The rate of gross fixed capital formation, which accounts for the bulk of total investment, increased
significantly from 2004-05, peaked in 2007-08, and generally declined thereafter. As per the
provisional estimates for 2013-14 released by the CSO, the ratio of fixed capital formation to GDP in
2013-14 was 2.1 percentage points lower than in 2012-13.
Table 5: Contribution of investment to GDP in percentage terms (at current market prices)
Particulars 2000-01 to
2003-04 2004-05 to
2007-08 2008-09 to
2012-13 2012-13 2013-14
Asian Development Bank
[9] TA-8279 IND: Preparing the Bond Guarantee Fund for India Market Assessment Report
Particulars 2000-01 to
2003-04 2004-05 to
2007-08 2008-09 to
2012-13 2012-13 2013-14
Total Investment 25.0 35.3 35.5 34.8 35
Gross Fixed Capital Formation
24.0 30.8 31.4 30.4 28.3
Public Sector 6.7 7.6 7.9 7.8 NA
Private Corporate Sector 5.5 11.9 9.8 8.5
NA
Household Sector 11.8 11.3 13.7 14.1 NA
Source: CSO Release May 30, 2014, RBI, EAC to PM, Ministry of Finance; May 31, 2014, NA-Not Available
As can be seen from the previous table, the private sector (comprising private corporate sector and
household sector) is the major source of investment in the country. Increase in investment by the
private corporate sector explained the bulk of the increase in overall investment during the upswing
phase between 2004-05 and 2007-08.
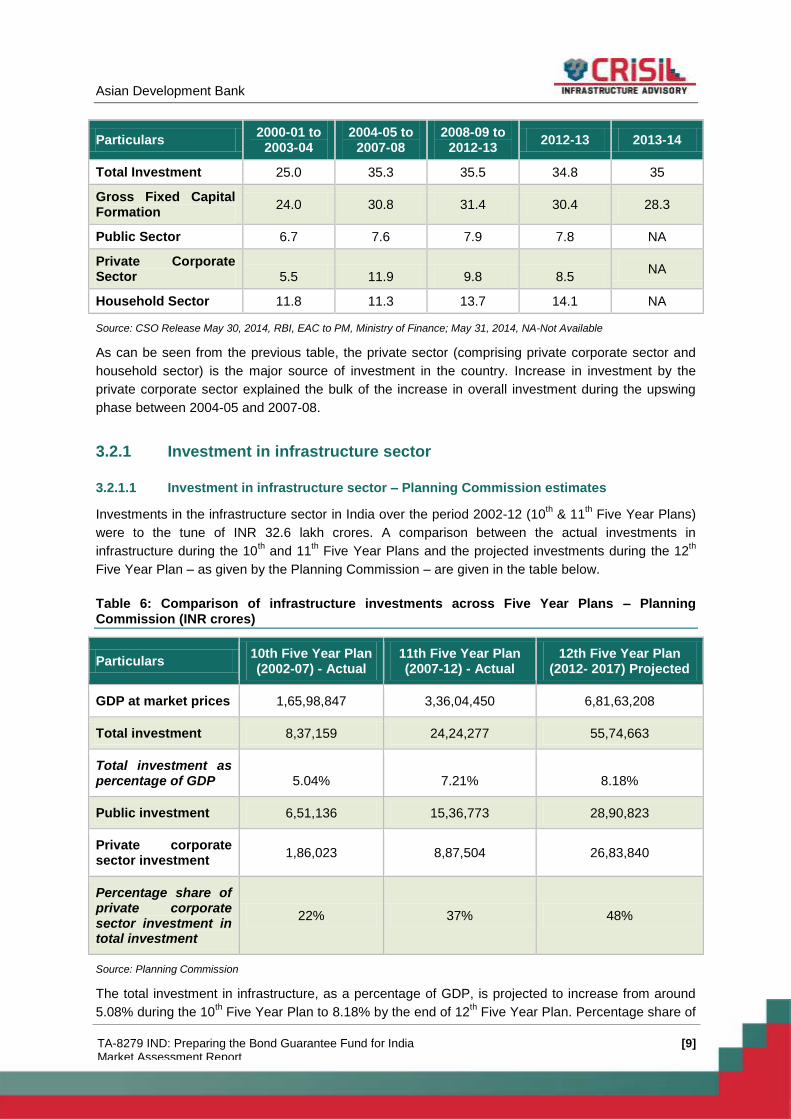
3.2.1 Investment in infrastructure sector
3.2.1.1 Investment in infrastructure sector – Planning Commission estimates
Investments in the infrastructure sector in India over the period 2002-12 (10th & 11
th Five Year Plans)
were to the tune of INR 32.6 lakh crores. A comparison between the actual investments in
infrastructure during the 10th and 11
th Five Year Plans and the projected investments during the 12
th
Five Year Plan – as given by the Planning Commission – are given in the table below.
Table 6: Comparison of infrastructure investments across Five Year Plans – Planning Commission (INR crores)
Particulars 10th Five Year Plan (2002-07) - Actual
11th Five Year Plan (2007-12) - Actual
12th Five Year Plan (2012- 2017) Projected
GDP at market prices 1,65,98,847 3,36,04,450 6,81,63,208
Total investment 8,37,159 24,24,277 55,74,663
Total investment as percentage of GDP 5.04% 7.21% 8.18%
Public investment 6,51,136 15,36,773 28,90,823
Private corporate sector investment
1,86,023 8,87,504 26,83,840
Percentage share of private corporate sector investment in total investment
22% 37% 48%
Source: Planning Commission
The total investment in infrastructure, as a percentage of GDP, is projected to increase from around
5.08% during the 10th Five Year Plan to 8.18% by the end of 12
th Five Year Plan. Percentage share of
Asian Development Bank
[10] TA-8279 IND: Preparing the Bond Guarantee Fund for India Market Assessment Report
private investment in the total investment is projected to increase from 25% during the 10th Plan to
48% by the end of the 12th Plan.
The Union Budget 2014-15 has announced a slew of measures to boost infrastructure investments –
mainstreaming Public-Private Partnerships (PPPs) through the creation of 3P India, focusing on
increasing investments in infrastructure through various projects and increasing funding to the sector
amongst others; these measures are expected to boost the pace of growth in the infrastructure sector.
Overall spending on infrastructure is budgeted to rise 24% over last fiscal to INR 2.1 lakh crores.
While the budget provisions are positive, addressing on-the-ground issues like land acquisition,
environmental clearances, inflation, and uncertainties in regulations etc. is key to reinvigorate the
sector.
Keeping these teething issues in mind it is believed that the total investment in infrastructure as a
percentage of GDP might just fall short of the Planning Commission estimates for the 12th Plan period,
falling to an average of 7.3% of GDP for the same period. Contribution by private corporate sector in
the overall investment has been growing year on year. While a slowdown in investment was seen in
recent years, with the focus of the new government on increasing private sector participation it is
expected that their contribution to investments would increase further.
3.2.1.2 Outlook on investments in key infrastructure segments
In the following sub-section, details on investments in some of the key infrastructure segments are
provided.
3.2.1.2.1 Power/Electricity
The capacity-addition target for the 12th Plan period is estimated at 88,537 MW, comprising 26,182
MW in the central sector, 15,530 MW in the state sector, and 46,825 MW in the private sector. In
2012-13, a record capacity addition of 20,622.8 MW (20,121.8 MW in thermal and 501 MW in hydro)
was achieved, as against the set target of 17,956.3 MW. The capacity addition target for the year
2013-14 was 18,432.3 MW.
The government has also recently undertaken initiatives for augmenting power generation in India –
changes in the mega power policy for provisional mega power certified projects (February 2014),
allocation of new coal blocks to NTPC, Independent Coal Regulatory Bill, automatic approval for
foreign direct investment etc.
It is expected that another 37,000 MW of capacity will be added by 2017-18, out of which around 82%
will be based on coal. Private sector is expected account for around 54% of the capacity additions.
3.2.1.2.2 Roads
It is expected that roads and highways would see an investment of about INR 6.3 lakh crores between
2013-14 and 2017-18. Of this amount, the share of national highways would be 43%, followed by
state roads and rural roads at 30% and 27%, respectively.
Going forward, it is expected that the highway projects under the National Highways Development
Programme (NHDP) would pick up, with the main focus on Phase III, Phase IV and Phase V projects.
A total length of 21,787 km has been completed till March 2014 under various phases of the NHDP.
The Union Budget 2014-15 has announced the provision of INR 14,400 crores towards Pradhan
Mantri Gram Sadak Yojana Scheme and INR 37.900 crores for national highways and state roads.
Further, it has set aside INR 500 crores to initiate work on expressways.
Asian Development Bank
[11] TA-8279 IND: Preparing the Bond Guarantee Fund for India Market Assessment Report
3.2.1.2.3 Railways
The Indian Railways is currently working at close to 100% capacity utilization, highlighting the need to
augment its freight-carrying capacity in the near future. Keeping these constraints in mind, policies
have been developed to focus on the creation of additional capacity, modernization of the existing
network, improvement in asset utilization and productivity, and modernization of rolling stock and
maintenance practices to bring about overall improvement in the quality of railway services, while
augmenting profitability and internal resource generation. The 12th Five Year Plan envisages an
investment of over INR 5 lakh crores in Railways. It also envisages a larger role for PPP in projects
like high-speed rail corridors and direct freight corridors for effective project execution.
The Union Budget 2014-15 plans to introduce a bullet train on the Mumbai-Ahmedabad route and
create a diamond quadrilateral for high-speed trains. It further provides for permitting foreign direct
investment in railway projects.
3.2.1.2.4 Ports
Over INR 55,000 crores has been invested in the ports sector, in the last five years. More than 80% of
these investments are estimated to have been made by the private sector, majority towards non-major
ports, whereas public sector contribution in the investments has remained limited to maintenance of
draft and building of allied infrastructure like roads at major ports.
Going forward, it is expected that close to INR 60,000 crores will be invested in the ports sector in the
coming years. Based on the present status of ongoing/announced projects, it is likely that a higher
proportion of these investments would flow towards projects at major ports.
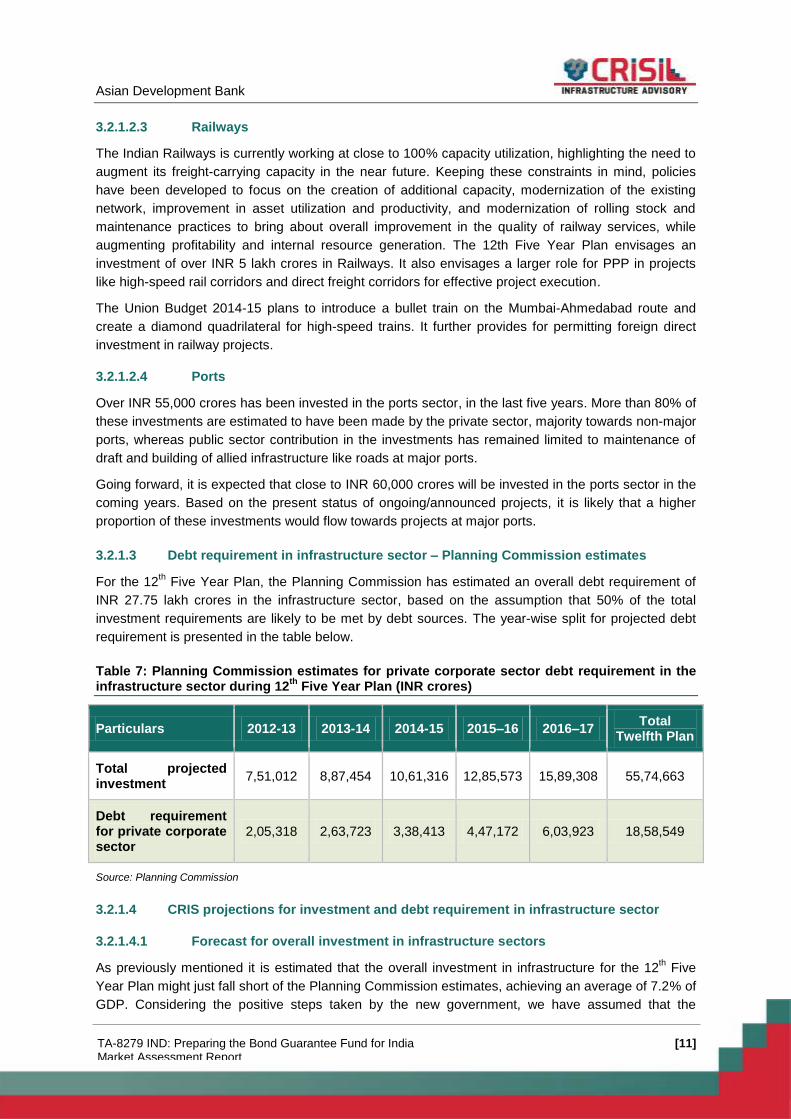
3.2.1.3 Debt requirement in infrastructure sector – Planning Commission estimates
For the 12th Five Year Plan, the Planning Commission has estimated an overall debt requirement of
INR 27.75 lakh crores in the infrastructure sector, based on the assumption that 50% of the total
investment requirements are likely to be met by debt sources. The year-wise split for projected debt
requirement is presented in the table below.
Table 7: Planning Commission estimates for private corporate sector debt requirement in the infrastructure sector during 12
th Five Year Plan (INR crores)
Particulars 2012-13 2013-14 2014-15 2015–16 2016–17 Total
Twelfth Plan
Total projected investment
7,51,012 8,87,454 10,61,316 12,85,573 15,89,308 55,74,663
Debt requirement for private corporate sector
2,05,318 2,63,723 3,38,413 4,47,172 6,03,923 18,58,549
Source: Planning Commission
3.2.1.4 CRIS projections for investment and debt requirement in infrastructure sector
3.2.1.4.1 Forecast for overall investment in infrastructure sectors
As previously mentioned it is estimated that the overall investment in infrastructure for the 12th Five
Year Plan might just fall short of the Planning Commission estimates, achieving an average of 7.2% of
GDP. Considering the positive steps taken by the new government, we have assumed that the
Asian Development Bank
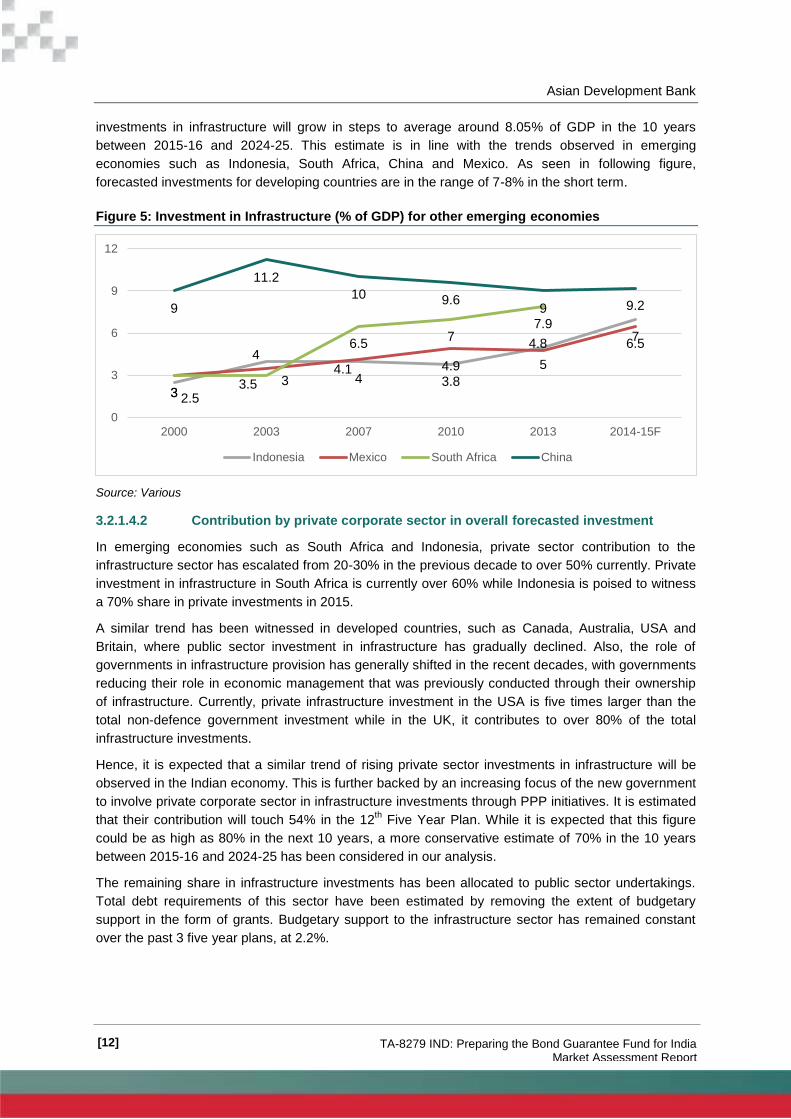
[12] TA-8279 IND: Preparing the Bond Guarantee Fund for India Market Assessment Report
investments in infrastructure will grow in steps to average around 8.05% of GDP in the 10 years
between 2015-16 and 2024-25. This estimate is in line with the trends observed in emerging
economies such as Indonesia, South Africa, China and Mexico. As seen in following figure,
forecasted investments for developing countries are in the range of 7-8% in the short term.
Figure 5: Investment in Infrastructure (% of GDP) for other emerging economies
Source: Various
3.2.1.4.2 Contribution by private corporate sector in overall forecasted investment
In emerging economies such as South Africa and Indonesia, private sector contribution to the
infrastructure sector has escalated from 20-30% in the previous decade to over 50% currently. Private
investment in infrastructure in South Africa is currently over 60% while Indonesia is poised to witness
a 70% share in private investments in 2015.
A similar trend has been witnessed in developed countries, such as Canada, Australia, USA and
Britain, where public sector investment in infrastructure has gradually declined. Also, the role of
governments in infrastructure provision has generally shifted in the recent decades, with governments
reducing their role in economic management that was previously conducted through their ownership
of infrastructure. Currently, private infrastructure investment in the USA is five times larger than the
total non-defence government investment while in the UK, it contributes to over 80% of the total
infrastructure investments.
Hence, it is expected that a similar trend of rising private sector investments in infrastructure will be
observed in the Indian economy. This is further backed by an increasing focus of the new government
to involve private corporate sector in infrastructure investments through PPP initiatives. It is estimated
that their contribution will touch 54% in the 12th Five Year Plan. While it is expected that this figure
could be as high as 80% in the next 10 years, a more conservative estimate of 70% in the 10 years
between 2015-16 and 2024-25 has been considered in our analysis.
The remaining share in infrastructure investments has been allocated to public sector undertakings.
Total debt requirements of this sector have been estimated by removing the extent of budgetary
support in the form of grants. Budgetary support to the infrastructure sector has remained constant
over the past 3 five year plans, at 2.2%.
2.5
4
4 3.8
5
7
3 3.5
4.1 4.9
4.8 6.5
3 3
6.5 7
7.9 9
11.2
10 9.6 9 9.2
0
3
6
9
12
2000 2003 2007 2010 2013 2014-15F
Indonesia Mexico South Africa China
Asian Development Bank
[13] TA-8279 IND: Preparing the Bond Guarantee Fund for India Market Assessment Report
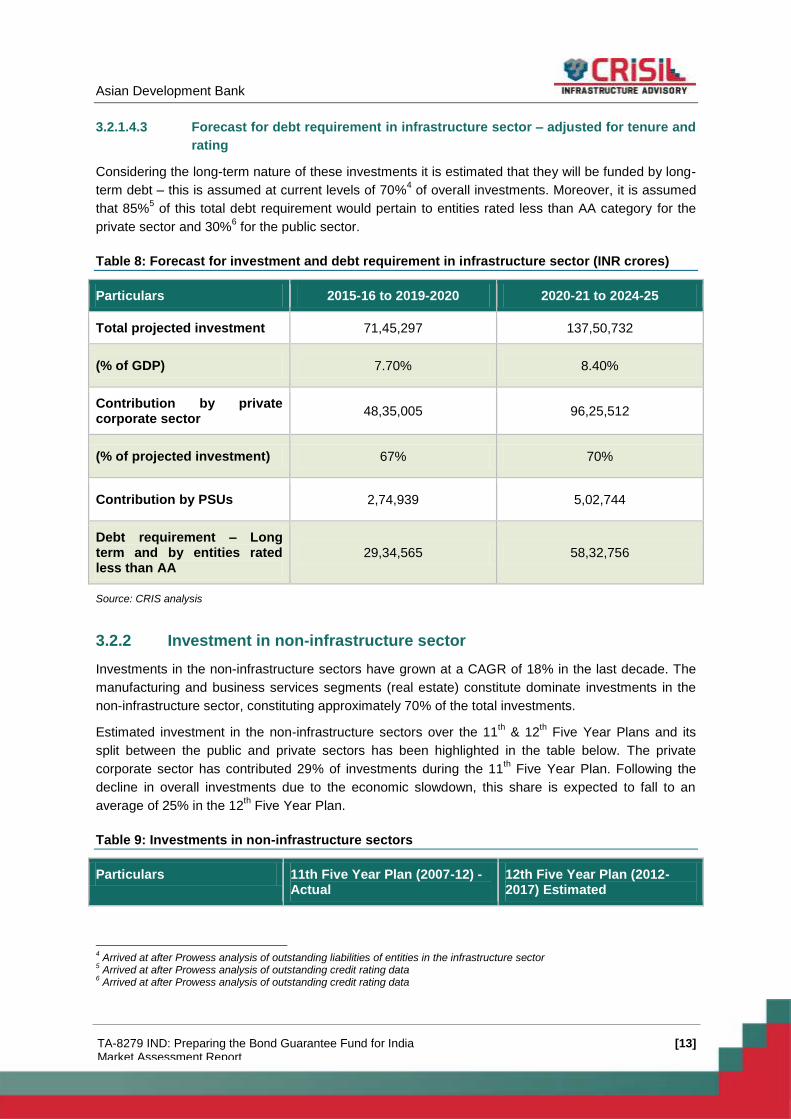
3.2.1.4.3 Forecast for debt requirement in infrastructure sector – adjusted for tenure and
rating
Considering the long-term nature of these investments it is estimated that they will be funded by long-
term debt – this is assumed at current levels of 70%4 of overall investments. Moreover, it is assumed
that 85%5 of this total debt requirement would pertain to entities rated less than AA category for the
private sector and 30%6 for the public sector.
Table 8: Forecast for investment and debt requirement in infrastructure sector (INR crores)
Particulars 2015-16 to 2019-2020 2020-21 to 2024-25
Total projected investment 71,45,297 137,50,732
(% of GDP) 7.70% 8.40%
Contribution by private corporate sector
48,35,005 96,25,512
(% of projected investment) 67% 70%
Contribution by PSUs 2,74,939 5,02,744
Debt requirement – Long term and by entities rated less than AA
29,34,565 58,32,756
Source: CRIS analysis
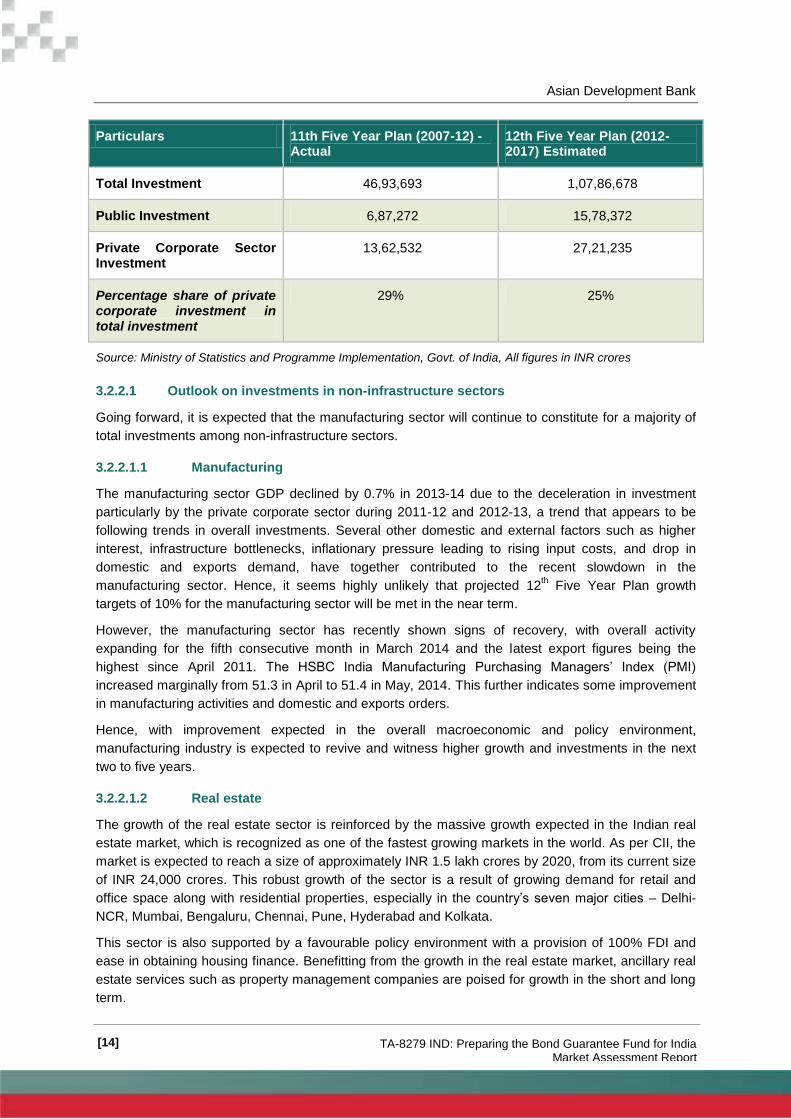
3.2.2 Investment in non-infrastructure sector
Investments in the non-infrastructure sectors have grown at a CAGR of 18% in the last decade. The
manufacturing and business services segments (real estate) constitute dominate investments in the
non-infrastructure sector, constituting approximately 70% of the total investments.
Estimated investment in the non-infrastructure sectors over the 11th & 12
th Five Year Plans and its
split between the public and private sectors has been highlighted in the table below. The private
corporate sector has contributed 29% of investments during the 11th Five Year Plan. Following the
decline in overall investments due to the economic slowdown, this share is expected to fall to an
average of 25% in the 12th Five Year Plan.
Table 9: Investments in non-infrastructure sectors
Particulars 11th Five Year Plan (2007-12) - Actual
12th Five Year Plan (2012- 2017) Estimated
4 Arrived at after Prowess analysis of outstanding liabilities of entities in the infrastructure sector
5 Arrived at after Prowess analysis of outstanding credit rating data
6 Arrived at after Prowess analysis of outstanding credit rating data
Asian Development Bank
[14] TA-8279 IND: Preparing the Bond Guarantee Fund for India Market Assessment Report
Particulars 11th Five Year Plan (2007-12) - Actual
12th Five Year Plan (2012- 2017) Estimated
Total Investment 46,93,693 1,07,86,678
Public Investment 6,87,272 15,78,372
Private Corporate Sector Investment
13,62,532 27,21,235
Percentage share of private corporate investment in total investment
29% 25%
Source: Ministry of Statistics and Programme Implementation, Govt. of India, All figures in INR crores
3.2.2.1 Outlook on investments in non-infrastructure sectors
Going forward, it is expected that the manufacturing sector will continue to constitute for a majority of
total investments among non-infrastructure sectors.
3.2.2.1.1 Manufacturing
The manufacturing sector GDP declined by 0.7% in 2013-14 due to the deceleration in investment
particularly by the private corporate sector during 2011-12 and 2012-13, a trend that appears to be
following trends in overall investments. Several other domestic and external factors such as higher
interest, infrastructure bottlenecks, inflationary pressure leading to rising input costs, and drop in
domestic and exports demand, have together contributed to the recent slowdown in the
manufacturing sector. Hence, it seems highly unlikely that projected 12th Five Year Plan growth
targets of 10% for the manufacturing sector will be met in the near term.
However, the manufacturing sector has recently shown signs of recovery, with overall activity
expanding for the fifth consecutive month in March 2014 and the latest export figures being the
highest since April 2011. The HSBC India Manufacturing Purchasing Managers’ Index (PMI)
increased marginally from 51.3 in April to 51.4 in May, 2014. This further indicates some improvement
in manufacturing activities and domestic and exports orders.
Hence, with improvement expected in the overall macroeconomic and policy environment,
manufacturing industry is expected to revive and witness higher growth and investments in the next
two to five years.
3.2.2.1.2 Real estate
The growth of the real estate sector is reinforced by the massive growth expected in the Indian real
estate market, which is recognized as one of the fastest growing markets in the world. As per CII, the
market is expected to reach a size of approximately INR 1.5 lakh crores by 2020, from its current size
of INR 24,000 crores. This robust growth of the sector is a result of growing demand for retail and
office space along with residential properties, especially in the country’s seven major cities – Delhi-
NCR, Mumbai, Bengaluru, Chennai, Pune, Hyderabad and Kolkata.
This sector is also supported by a favourable policy environment with a provision of 100% FDI and
ease in obtaining housing finance. Benefitting from the growth in the real estate market, ancillary real
estate services such as property management companies are poised for growth in the short and long
term.
Asian Development Bank
[15] TA-8279 IND: Preparing the Bond Guarantee Fund for India Market Assessment Report
3.2.2.2 CRIS projections for investment and debt requirement in non-infrastructure sectors
3.2.2.2.1 Forecast for total private corporate investment
As per our estimates, private corporate investment in both infrastructure and non-infrastructure
sectors has historically grown from 5.3% in 2002-03 to 10% currently. Following these trends, private
corporate investment is expected to increase in the future, given the limited investment ability of the
public sector due to the fiscal deficit target and an overall impetus to privatization in the economy.
Hence, private corporate gross fixed capital formation as a percentage of GDP is expected to rise by
another five percentage points over the next year, rising to 15% in 2025.
3.2.2.2.2 Forecast for total private corporate investment in the non-infrastructure sector
The estimates for private corporate investment in the non-infrastructure sector have been arrived at
by calculating the balancing figure for overall private corporate investment. It has been assumed that
the balance of private corporate investments to infrastructure sector will be invested in the non-
infrastructure sector.
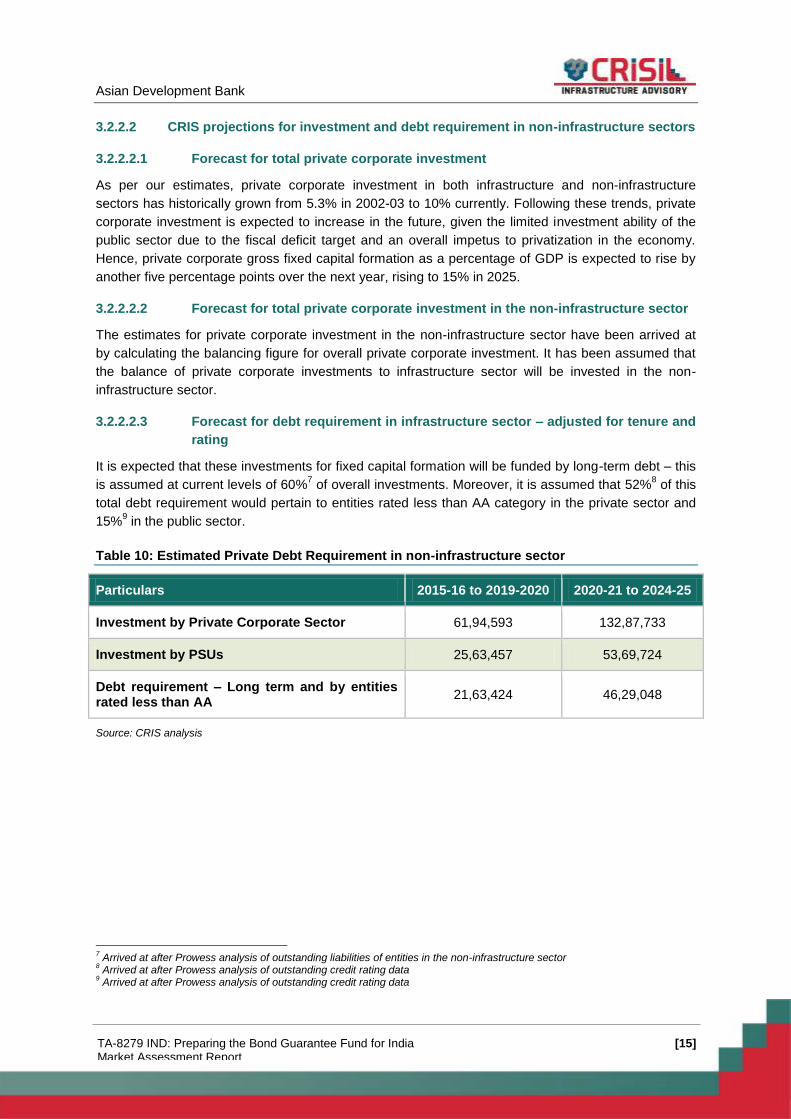
3.2.2.2.3 Forecast for debt requirement in infrastructure sector – adjusted for tenure and
rating
It is expected that these investments for fixed capital formation will be funded by long-term debt – this
is assumed at current levels of 60%7 of overall investments. Moreover, it is assumed that 52%
8 of this
total debt requirement would pertain to entities rated less than AA category in the private sector and
15%9 in the public sector.
Table 10: Estimated Private Debt Requirement in non-infrastructure sector
Particulars 2015-16 to 2019-2020 2020-21 to 2024-25
Investment by Private Corporate Sector 61,94,593 132,87,733
Investment by PSUs 25,63,457 53,69,724
Debt requirement – Long term and by entities rated less than AA
21,63,424 46,29,048
Source: CRIS analysis
7 Arrived at after Prowess analysis of outstanding liabilities of entities in the non-infrastructure sector
8 Arrived at after Prowess analysis of outstanding credit rating data
9 Arrived at after Prowess analysis of outstanding credit rating data
Asian Development Bank
[16] TA-8279 IND: Preparing the Bond Guarantee Fund for India Market Assessment Report
4. Financial Sector in India and Debt Supply
4.1 Overview of the Indian financial sector
India has one of the better financial market systems in the world. The World Economic Forum’s Global
Competitiveness Report 2013-14 ranks India 45th out of 128 countries in availability of financial
services and 38th in both ease of access to loans and affordability of financial services, outperforming
most of its peers in the BRICS quintet such as Brazil, China, and Russia.
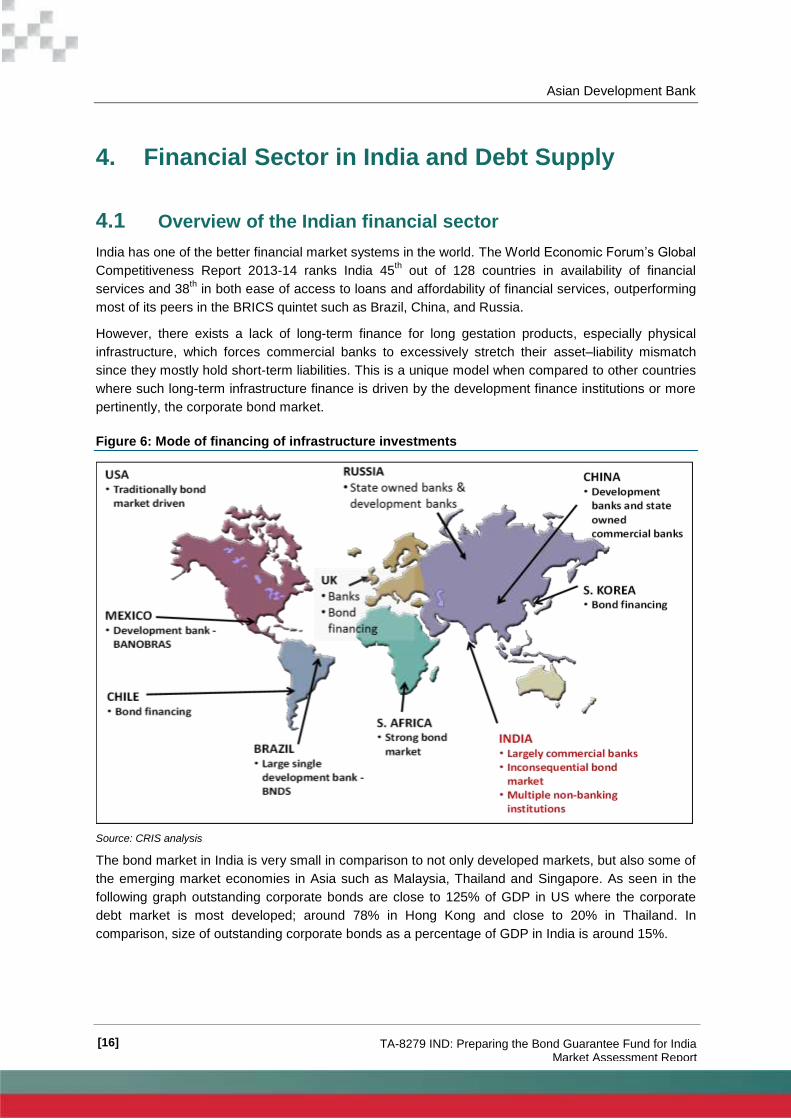
However, there exists a lack of long-term finance for long gestation products, especially physical
infrastructure, which forces commercial banks to excessively stretch their asset–liability mismatch
since they mostly hold short-term liabilities. This is a unique model when compared to other countries
where such long-term infrastructure finance is driven by the development finance institutions or more
pertinently, the corporate bond market.
Figure 6: Mode of financing of infrastructure investments
Source: CRIS analysis
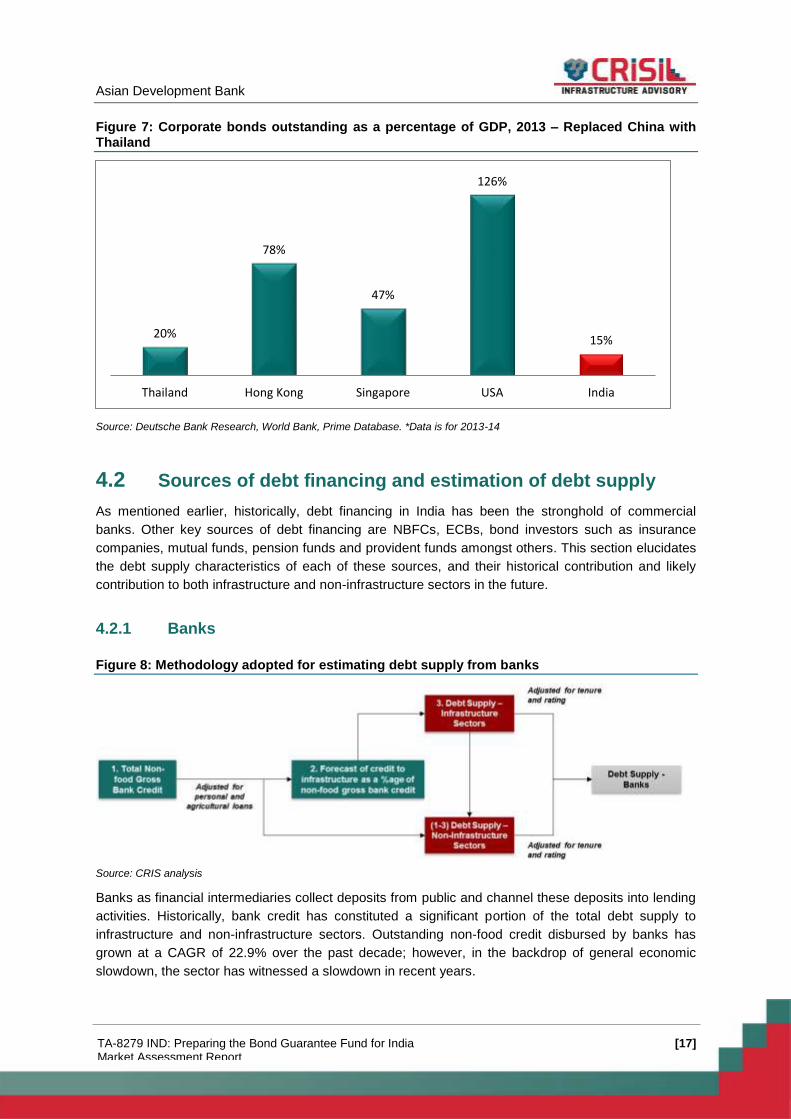
The bond market in India is very small in comparison to not only developed markets, but also some of
the emerging market economies in Asia such as Malaysia, Thailand and Singapore. As seen in the
following graph outstanding corporate bonds are close to 125% of GDP in US where the corporate
debt market is most developed; around 78% in Hong Kong and close to 20% in Thailand. In
comparison, size of outstanding corporate bonds as a percentage of GDP in India is around 15%.
Asian Development Bank
[17] TA-8279 IND: Preparing the Bond Guarantee Fund for India Market Assessment Report
Figure 7: Corporate bonds outstanding as a percentage of GDP, 2013 – Replaced China with Thailand
Source: Deutsche Bank Research, World Bank, Prime Database. *Data is for 2013-14
4.2 Sources of debt financing and estimation of debt supply
As mentioned earlier, historically, debt financing in India has been the stronghold of commercial
banks. Other key sources of debt financing are NBFCs, ECBs, bond investors such as insurance
companies, mutual funds, pension funds and provident funds amongst others. This section elucidates
the debt supply characteristics of each of these sources, and their historical contribution and likely
contribution to both infrastructure and non-infrastructure sectors in the future.
4.2.1 Banks
Figure 8: Methodology adopted for estimating debt supply from banks
Source: CRIS analysis
Banks as financial intermediaries collect deposits from public and channel these deposits into lending
activities. Historically, bank credit has constituted a significant portion of the total debt supply to
infrastructure and non-infrastructure sectors. Outstanding non-food credit disbursed by banks has
grown at a CAGR of 22.9% over the past decade; however, in the backdrop of general economic
slowdown, the sector has witnessed a slowdown in recent years.
20%
78%
47%
126%
15%
Thailand Hong Kong Singapore USA India
Asian Development Bank
[18] TA-8279 IND: Preparing the Bond Guarantee Fund for India Market Assessment Report
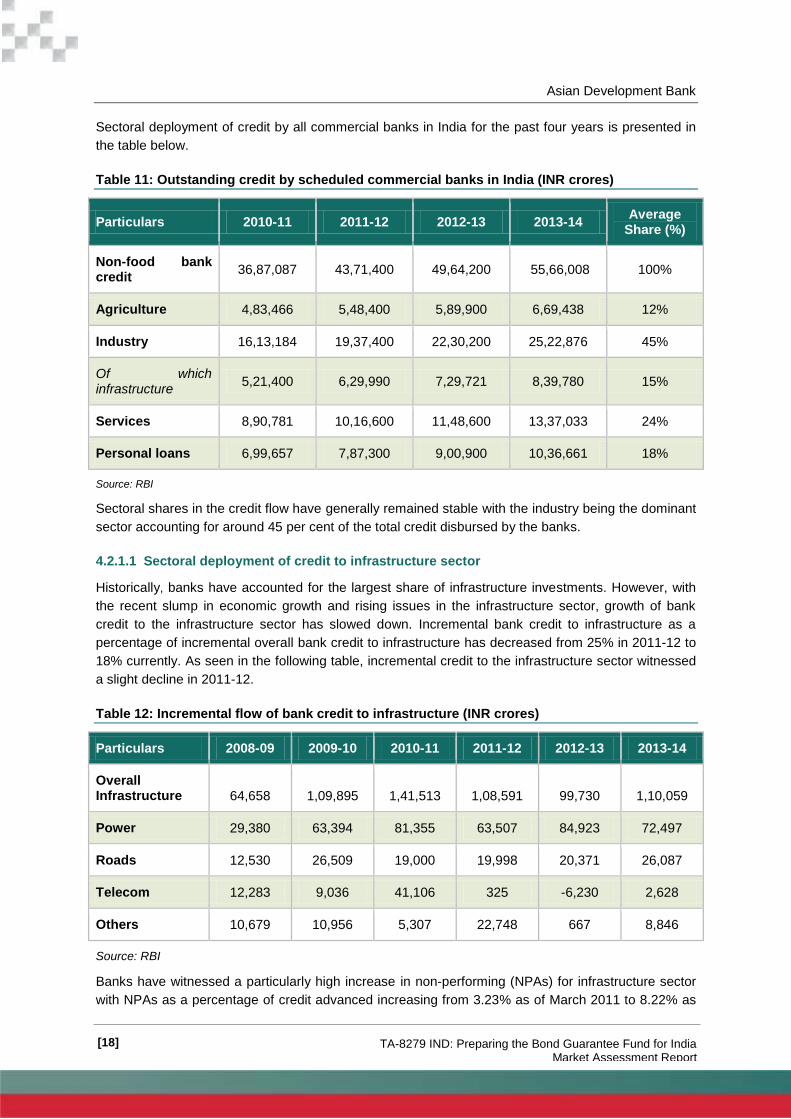
Sectoral deployment of credit by all commercial banks in India for the past four years is presented in
the table below.
Table 11: Outstanding credit by scheduled commercial banks in India (INR crores)
Particulars 2010-11 2011-12 2012-13 2013-14 Average
Share (%)
Non-food bank credit
36,87,087 43,71,400 49,64,200 55,66,008 100%
Agriculture 4,83,466 5,48,400 5,89,900 6,69,438 12%
Industry 16,13,184 19,37,400 22,30,200 25,22,876 45%
Of which infrastructure
5,21,400 6,29,990 7,29,721 8,39,780 15%
Services 8,90,781 10,16,600 11,48,600 13,37,033 24%
Personal loans 6,99,657 7,87,300 9,00,900 10,36,661 18%
Source: RBI
Sectoral shares in the credit flow have generally remained stable with the industry being the dominant
sector accounting for around 45 per cent of the total credit disbursed by the banks.
4.2.1.1 Sectoral deployment of credit to infrastructure sector
Historically, banks have accounted for the largest share of infrastructure investments. However, with
the recent slump in economic growth and rising issues in the infrastructure sector, growth of bank
credit to the infrastructure sector has slowed down. Incremental bank credit to infrastructure as a
percentage of incremental overall bank credit to infrastructure has decreased from 25% in 2011-12 to
18% currently. As seen in the following table, incremental credit to the infrastructure sector witnessed
a slight decline in 2011-12.
Table 12: Incremental flow of bank credit to infrastructure (INR crores)
Particulars 2008-09 2009-10 2010-11 2011-12 2012-13 2013-14
Overall Infrastructure 64,658 1,09,895 1,41,513 1,08,591 99,730 1,10,059
Power 29,380 63,394 81,355 63,507 84,923 72,497
Roads 12,530 26,509 19,000 19,998 20,371 26,087
Telecom 12,283 9,036 41,106 325 -6,230 2,628
Others 10,679 10,956 5,307 22,748 667 8,846
Source: RBI
Banks have witnessed a particularly high increase in non-performing (NPAs) for infrastructure sector
with NPAs as a percentage of credit advanced increasing from 3.23% as of March 2011 to 8.22% as
Asian Development Bank
[19] TA-8279 IND: Preparing the Bond Guarantee Fund for India Market Assessment Report
of March 2014. As of March 31, 2014, banks had restructured INR 50,239 crores of infrastructure
loans – 21% of the total loans recast in the last fiscal year under the corporate debt restructuring
(CDR) mechanism.
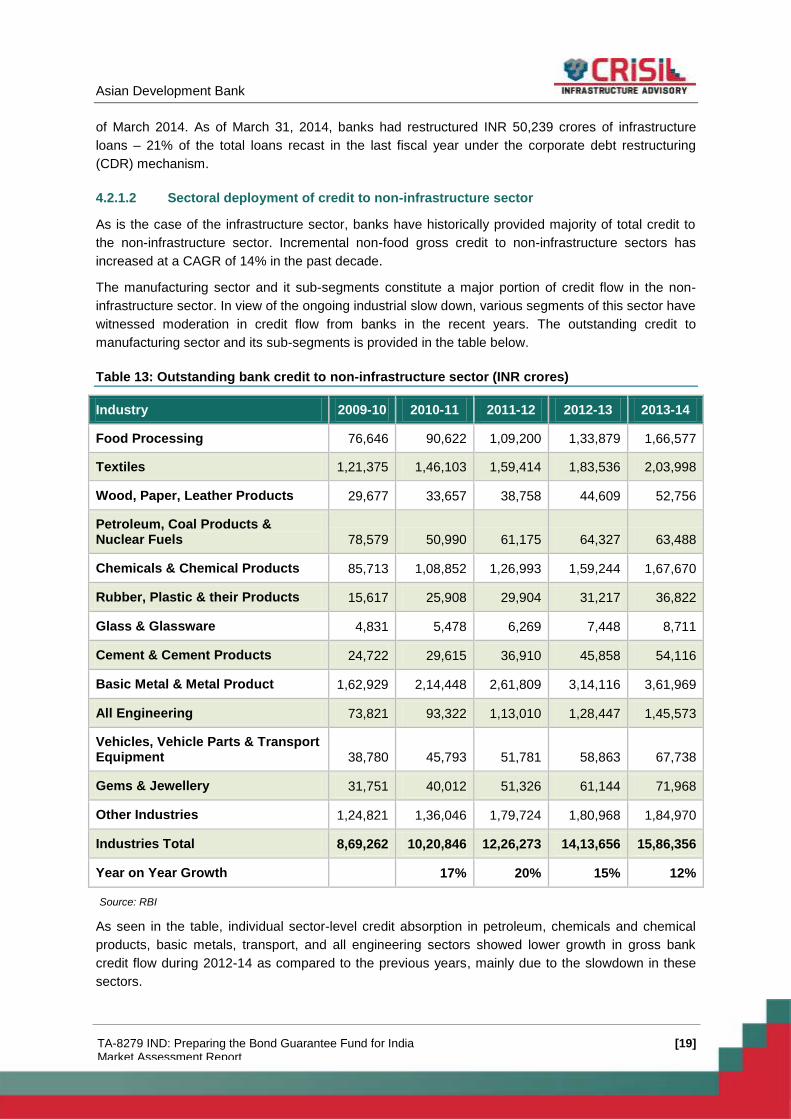
4.2.1.2 Sectoral deployment of credit to non-infrastructure sector
As is the case of the infrastructure sector, banks have historically provided majority of total credit to
the non-infrastructure sector. Incremental non-food gross credit to non-infrastructure sectors has
increased at a CAGR of 14% in the past decade.
The manufacturing sector and it sub-segments constitute a major portion of credit flow in the non-
infrastructure sector. In view of the ongoing industrial slow down, various segments of this sector have
witnessed moderation in credit flow from banks in the recent years. The outstanding credit to
manufacturing sector and its sub-segments is provided in the table below.
Table 13: Outstanding bank credit to non-infrastructure sector (INR crores)
Industry 2009-10 2010-11 2011-12 2012-13 2013-14
Food Processing 76,646 90,622 1,09,200 1,33,879 1,66,577
Textiles 1,21,375 1,46,103 1,59,414 1,83,536 2,03,998
Wood, Paper, Leather Products 29,677 33,657 38,758 44,609 52,756
Petroleum, Coal Products & Nuclear Fuels 78,579 50,990 61,175 64,327 63,488
Chemicals & Chemical Products 85,713 1,08,852 1,26,993 1,59,244 1,67,670
Rubber, Plastic & their Products 15,617 25,908 29,904 31,217 36,822
Glass & Glassware 4,831 5,478 6,269 7,448 8,711
Cement & Cement Products 24,722 29,615 36,910 45,858 54,116
Basic Metal & Metal Product 1,62,929 2,14,448 2,61,809 3,14,116 3,61,969
All Engineering 73,821 93,322 1,13,010 1,28,447 1,45,573
Vehicles, Vehicle Parts & Transport Equipment 38,780 45,793 51,781 58,863 67,738
Gems & Jewellery 31,751 40,012 51,326 61,144 71,968
Other Industries 1,24,821 1,36,046 1,79,724 1,80,968 1,84,970
Industries Total 8,69,262 10,20,846 12,26,273 14,13,656 15,86,356
Year on Year Growth 17% 20% 15% 12%
Source: RBI
As seen in the table, individual sector-level credit absorption in petroleum, chemicals and chemical
products, basic metals, transport, and all engineering sectors showed lower growth in gross bank
credit flow during 2012-14 as compared to the previous years, mainly due to the slowdown in these
sectors.
Asian Development Bank
[20] TA-8279 IND: Preparing the Bond Guarantee Fund for India Market Assessment Report
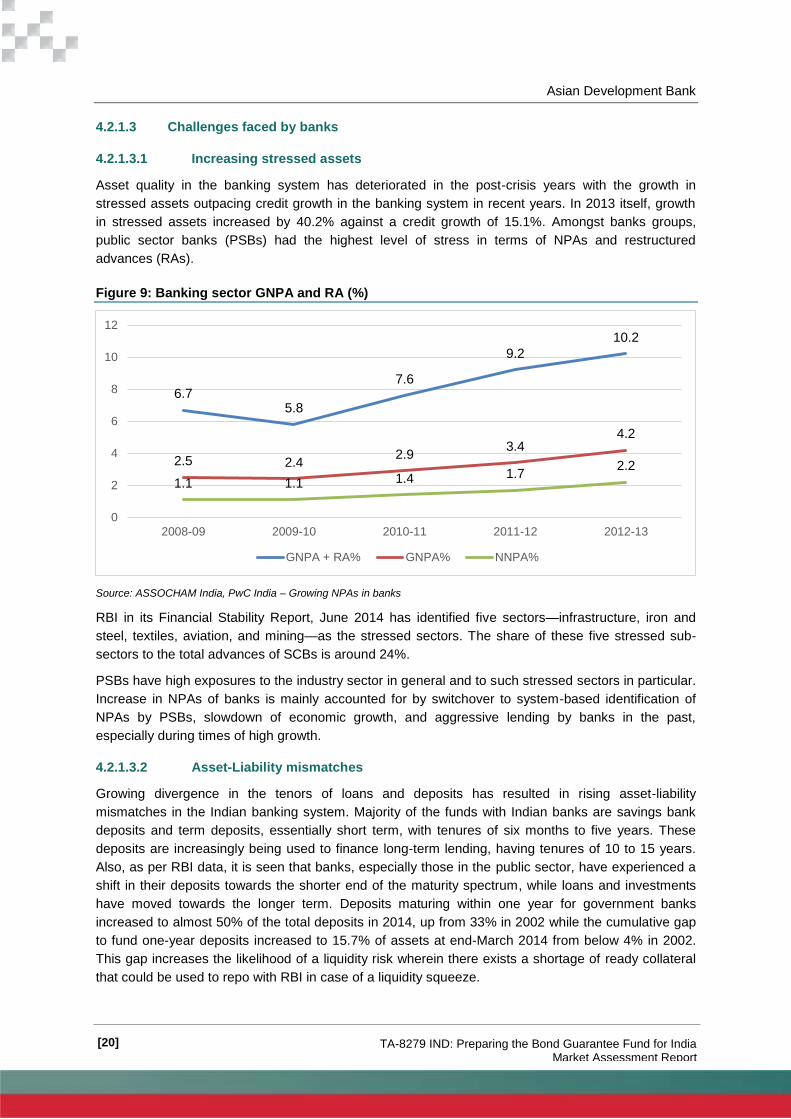
4.2.1.3 Challenges faced by banks
4.2.1.3.1 Increasing stressed assets
Asset quality in the banking system has deteriorated in the post-crisis years with the growth in
stressed assets outpacing credit growth in the banking system in recent years. In 2013 itself, growth
in stressed assets increased by 40.2% against a credit growth of 15.1%. Amongst banks groups,
public sector banks (PSBs) had the highest level of stress in terms of NPAs and restructured
advances (RAs).
Figure 9: Banking sector GNPA and RA (%)
Source: ASSOCHAM India, PwC India – Growing NPAs in banks
RBI in its Financial Stability Report, June 2014 has identified five sectors—infrastructure, iron and
steel, textiles, aviation, and mining—as the stressed sectors. The share of these five stressed sub-
sectors to the total advances of SCBs is around 24%.
PSBs have high exposures to the industry sector in general and to such stressed sectors in particular.
Increase in NPAs of banks is mainly accounted for by switchover to system-based identification of
NPAs by PSBs, slowdown of economic growth, and aggressive lending by banks in the past,
especially during times of high growth.
4.2.1.3.2 Asset-Liability mismatches
Growing divergence in the tenors of loans and deposits has resulted in rising asset-liability
mismatches in the Indian banking system. Majority of the funds with Indian banks are savings bank
deposits and term deposits, essentially short term, with tenures of six months to five years. These
deposits are increasingly being used to finance long-term lending, having tenures of 10 to 15 years.
Also, as per RBI data, it is seen that banks, especially those in the public sector, have experienced a
shift in their deposits towards the shorter end of the maturity spectrum, while loans and investments
have moved towards the longer term. Deposits maturing within one year for government banks
increased to almost 50% of the total deposits in 2014, up from 33% in 2002 while the cumulative gap
to fund one-year deposits increased to 15.7% of assets at end-March 2014 from below 4% in 2002.
This gap increases the likelihood of a liquidity risk wherein there exists a shortage of ready collateral
that could be used to repo with RBI in case of a liquidity squeeze.
6.7 5.8
7.6
9.2
10.2
2.5 2.4 2.9
3.4 4.2
1.1 1.1 1.4 1.7 2.2
0
2
4
6
8
10
12
2008-09 2009-10 2010-11 2011-12 2012-13
GNPA + RA% GNPA% NNPA%
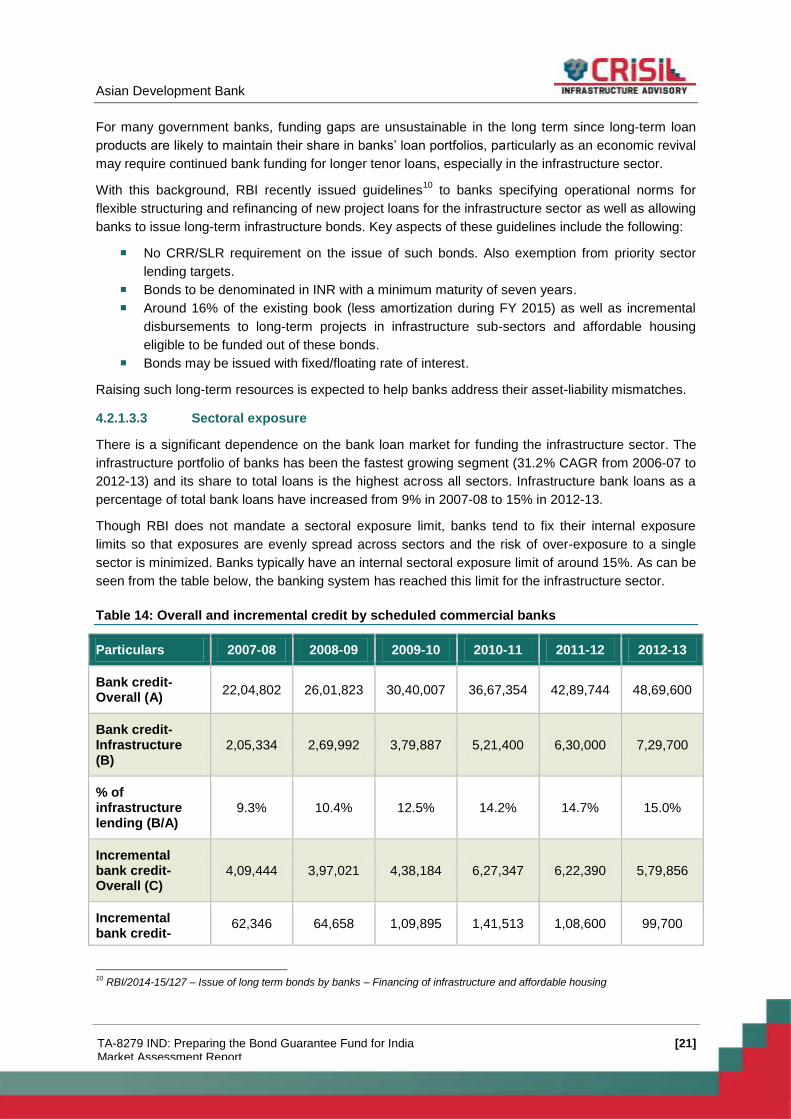
Asian Development Bank
[21] TA-8279 IND: Preparing the Bond Guarantee Fund for India Market Assessment Report
For many government banks, funding gaps are unsustainable in the long term since long-term loan
products are likely to maintain their share in banks’ loan portfolios, particularly as an economic revival
may require continued bank funding for longer tenor loans, especially in the infrastructure sector.
With this background, RBI recently issued guidelines10
to banks specifying operational norms for
flexible structuring and refinancing of new project loans for the infrastructure sector as well as allowing
banks to issue long-term infrastructure bonds. Key aspects of these guidelines include the following:
No CRR/SLR requirement on the issue of such bonds. Also exemption from priority sector
lending targets.
Bonds to be denominated in INR with a minimum maturity of seven years.
Around 16% of the existing book (less amortization during FY 2015) as well as incremental
disbursements to long-term projects in infrastructure sub-sectors and affordable housing
eligible to be funded out of these bonds.
Bonds may be issued with fixed/floating rate of interest.
Raising such long-term resources is expected to help banks address their asset-liability mismatches.
4.2.1.3.3 Sectoral exposure
There is a significant dependence on the bank loan market for funding the infrastructure sector. The
infrastructure portfolio of banks has been the fastest growing segment (31.2% CAGR from 2006-07 to
2012-13) and its share to total loans is the highest across all sectors. Infrastructure bank loans as a
percentage of total bank loans have increased from 9% in 2007-08 to 15% in 2012-13.
Though RBI does not mandate a sectoral exposure limit, banks tend to fix their internal exposure
limits so that exposures are evenly spread across sectors and the risk of over-exposure to a single
sector is minimized. Banks typically have an internal sectoral exposure limit of around 15%. As can be
seen from the table below, the banking system has reached this limit for the infrastructure sector.
Table 14: Overall and incremental credit by scheduled commercial banks
Particulars 2007-08 2008-09 2009-10 2010-11 2011-12 2012-13
Bank credit-Overall (A)
22,04,802 26,01,823 30,40,007 36,67,354 42,89,744 48,69,600
Bank credit-Infrastructure (B)
2,05,334 2,69,992 3,79,887 5,21,400 6,30,000 7,29,700
% of infrastructure lending (B/A)
9.3% 10.4% 12.5% 14.2% 14.7% 15.0%
Incremental bank credit-Overall (C)
4,09,444 3,97,021 4,38,184 6,27,347 6,22,390 5,79,856
Incremental bank credit-
62,346 64,658 1,09,895 1,41,513 1,08,600 99,700
10
RBI/2014-15/127 – Issue of long term bonds by banks – Financing of infrastructure and affordable housing
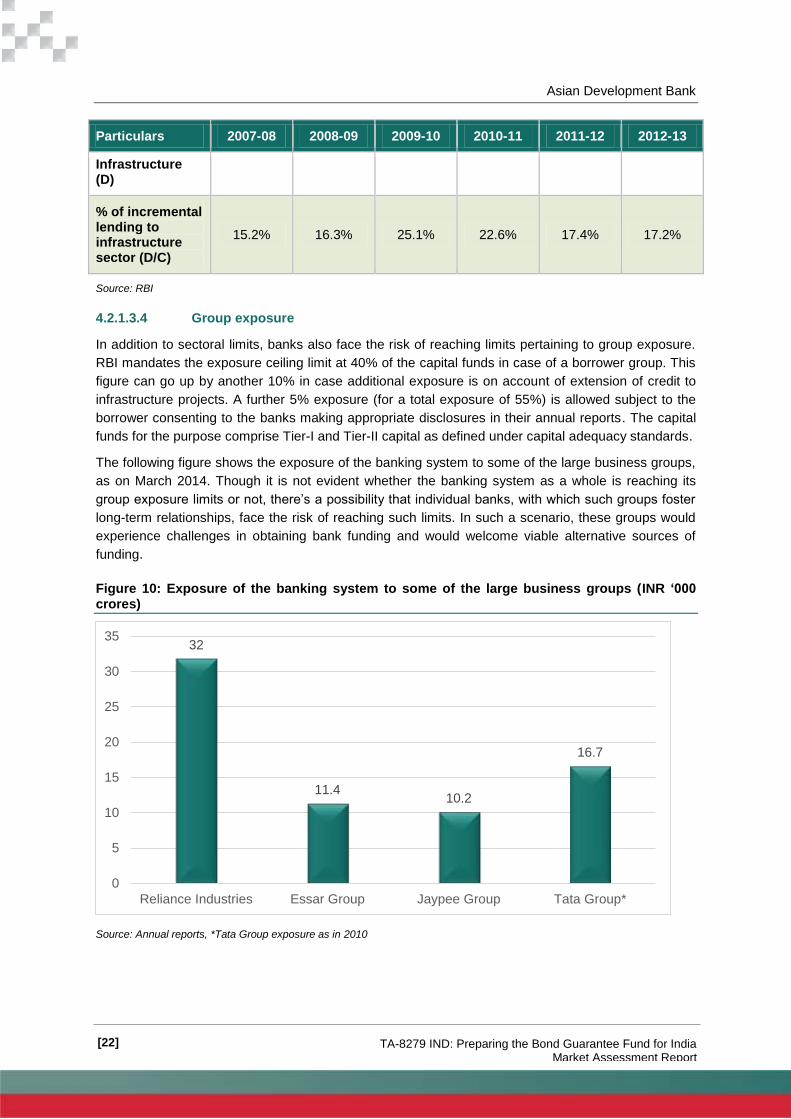
Asian Development Bank
[22] TA-8279 IND: Preparing the Bond Guarantee Fund for India Market Assessment Report
Particulars 2007-08 2008-09 2009-10 2010-11 2011-12 2012-13
Infrastructure (D)
% of incremental lending to infrastructure sector (D/C)
15.2% 16.3% 25.1% 22.6% 17.4% 17.2%
Source: RBI
4.2.1.3.4 Group exposure
In addition to sectoral limits, banks also face the risk of reaching limits pertaining to group exposure.
RBI mandates the exposure ceiling limit at 40% of the capital funds in case of a borrower group. This
figure can go up by another 10% in case additional exposure is on account of extension of credit to
infrastructure projects. A further 5% exposure (for a total exposure of 55%) is allowed subject to the
borrower consenting to the banks making appropriate disclosures in their annual reports. The capital
funds for the purpose comprise Tier-I and Tier-II capital as defined under capital adequacy standards.
The following figure shows the exposure of the banking system to some of the large business groups,
as on March 2014. Though it is not evident whether the banking system as a whole is reaching its
group exposure limits or not, there’s a possibility that individual banks, with which such groups foster
long-term relationships, face the risk of reaching such limits. In such a scenario, these groups would
experience challenges in obtaining bank funding and would welcome viable alternative sources of
funding.
Figure 10: Exposure of the banking system to some of the large business groups (INR ‘000 crores)
Source: Annual reports, *Tata Group exposure as in 2010
32
11.4 10.2
16.7
0
5
10
15
20
25
30
35
Reliance Industries Essar Group Jaypee Group Tata Group*
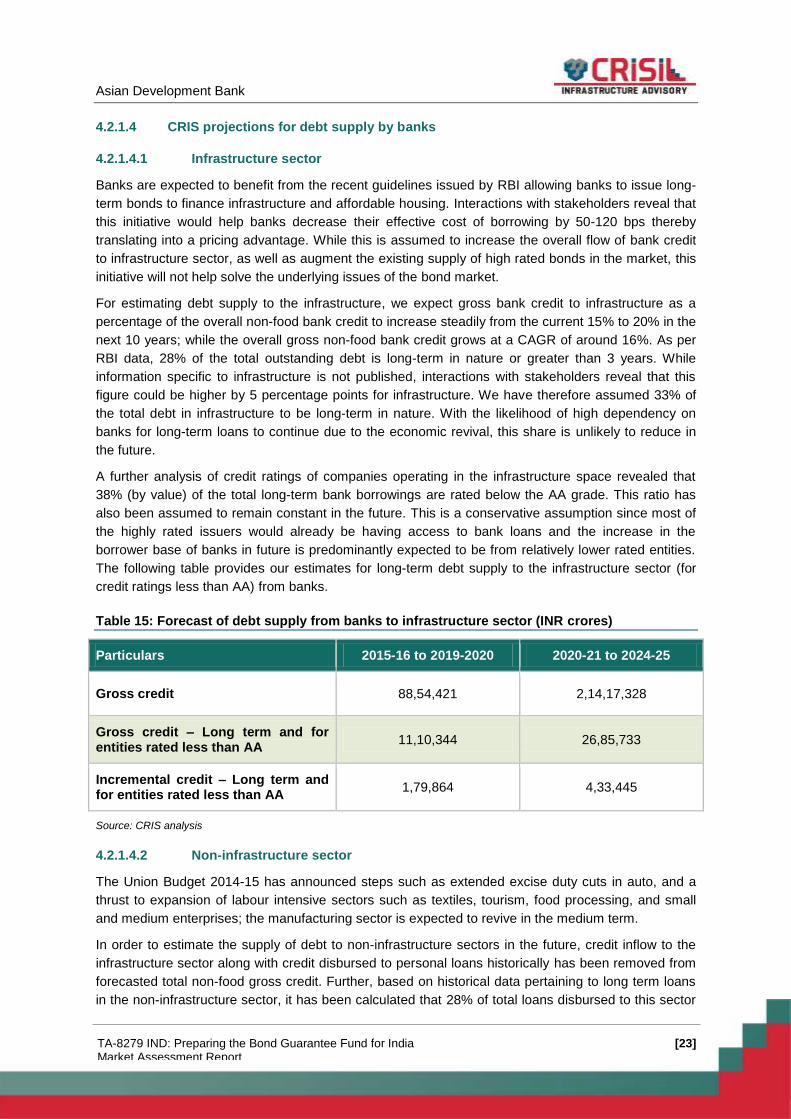
Asian Development Bank
[23] TA-8279 IND: Preparing the Bond Guarantee Fund for India Market Assessment Report
4.2.1.4 CRIS projections for debt supply by banks
4.2.1.4.1 Infrastructure sector
Banks are expected to benefit from the recent guidelines issued by RBI allowing banks to issue long-
term bonds to finance infrastructure and affordable housing. Interactions with stakeholders reveal that
this initiative would help banks decrease their effective cost of borrowing by 50-120 bps thereby
translating into a pricing advantage. While this is assumed to increase the overall flow of bank credit
to infrastructure sector, as well as augment the existing supply of high rated bonds in the market, this
initiative will not help solve the underlying issues of the bond market.
For estimating debt supply to the infrastructure, we expect gross bank credit to infrastructure as a
percentage of the overall non-food bank credit to increase steadily from the current 15% to 20% in the
next 10 years; while the overall gross non-food bank credit grows at a CAGR of around 16%. As per
RBI data, 28% of the total outstanding debt is long-term in nature or greater than 3 years. While
information specific to infrastructure is not published, interactions with stakeholders reveal that this
figure could be higher by 5 percentage points for infrastructure. We have therefore assumed 33% of
the total debt in infrastructure to be long-term in nature. With the likelihood of high dependency on
banks for long-term loans to continue due to the economic revival, this share is unlikely to reduce in
the future.
A further analysis of credit ratings of companies operating in the infrastructure space revealed that
38% (by value) of the total long-term bank borrowings are rated below the AA grade. This ratio has
also been assumed to remain constant in the future. This is a conservative assumption since most of
the highly rated issuers would already be having access to bank loans and the increase in the
borrower base of banks in future is predominantly expected to be from relatively lower rated entities.
The following table provides our estimates for long-term debt supply to the infrastructure sector (for
credit ratings less than AA) from banks.
Table 15: Forecast of debt supply from banks to infrastructure sector (INR crores)
Particulars 2015-16 to 2019-2020 2020-21 to 2024-25
Gross credit 88,54,421 2,14,17,328
Gross credit – Long term and for entities rated less than AA
11,10,344 26,85,733
Incremental credit – Long term and for entities rated less than AA
1,79,864 4,33,445
Source: CRIS analysis
4.2.1.4.2 Non-infrastructure sector
The Union Budget 2014-15 has announced steps such as extended excise duty cuts in auto, and a
thrust to expansion of labour intensive sectors such as textiles, tourism, food processing, and small
and medium enterprises; the manufacturing sector is expected to revive in the medium term.
In order to estimate the supply of debt to non-infrastructure sectors in the future, credit inflow to the
infrastructure sector along with credit disbursed to personal loans historically has been removed from
forecasted total non-food gross credit. Further, based on historical data pertaining to long term loans
in the non-infrastructure sector, it has been calculated that 28% of total loans disbursed to this sector
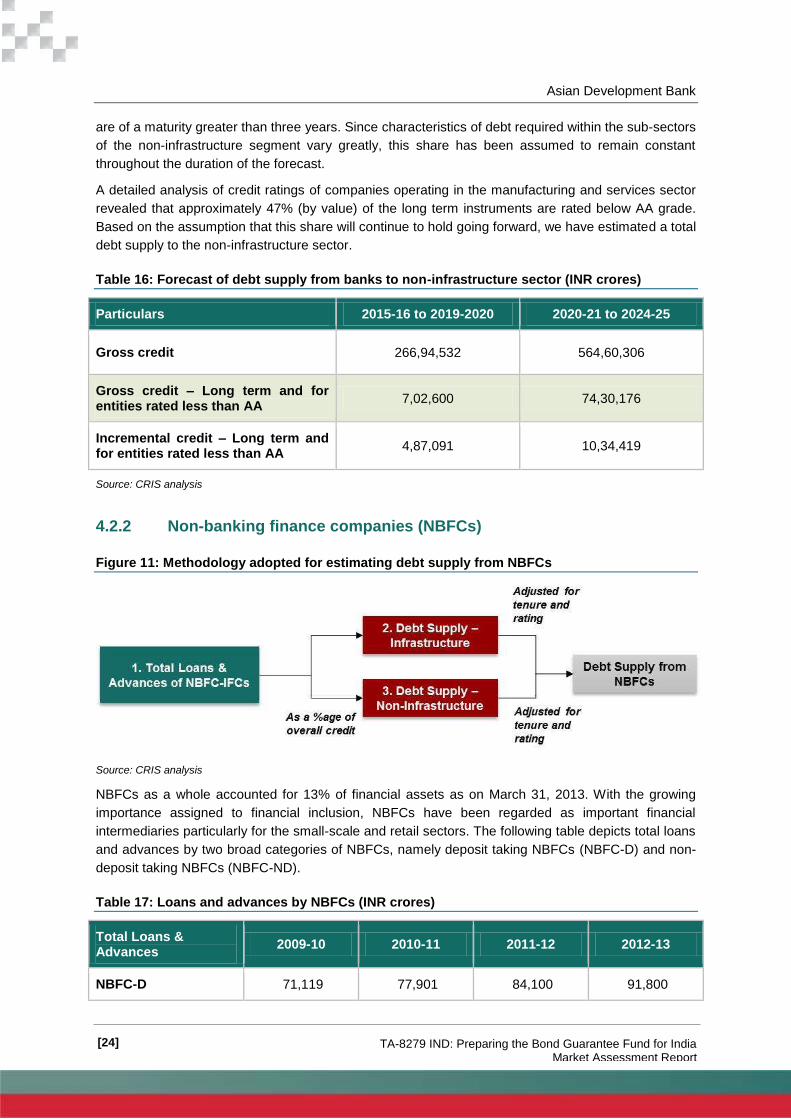
Asian Development Bank
[24] TA-8279 IND: Preparing the Bond Guarantee Fund for India Market Assessment Report
are of a maturity greater than three years. Since characteristics of debt required within the sub-sectors
of the non-infrastructure segment vary greatly, this share has been assumed to remain constant
throughout the duration of the forecast.
A detailed analysis of credit ratings of companies operating in the manufacturing and services sector
revealed that approximately 47% (by value) of the long term instruments are rated below AA grade.
Based on the assumption that this share will continue to hold going forward, we have estimated a total
debt supply to the non-infrastructure sector.
Table 16: Forecast of debt supply from banks to non-infrastructure sector (INR crores)
Particulars 2015-16 to 2019-2020 2020-21 to 2024-25
Gross credit 266,94,532 564,60,306
Gross credit – Long term and for entities rated less than AA
7,02,600 74,30,176
Incremental credit – Long term and for entities rated less than AA
4,87,091 10,34,419
Source: CRIS analysis
4.2.2 Non-banking finance companies (NBFCs)
Figure 11: Methodology adopted for estimating debt supply from NBFCs
Source: CRIS analysis
NBFCs as a whole accounted for 13% of financial assets as on March 31, 2013. With the growing
importance assigned to financial inclusion, NBFCs have been regarded as important financial
intermediaries particularly for the small-scale and retail sectors. The following table depicts total loans
and advances by two broad categories of NBFCs, namely deposit taking NBFCs (NBFC-D) and non-
deposit taking NBFCs (NBFC-ND).
Table 17: Loans and advances by NBFCs (INR crores)
Total Loans & Advances
2009-10 2010-11 2011-12 2012-13
NBFC-D 71,119 77,901 84,100 91,800
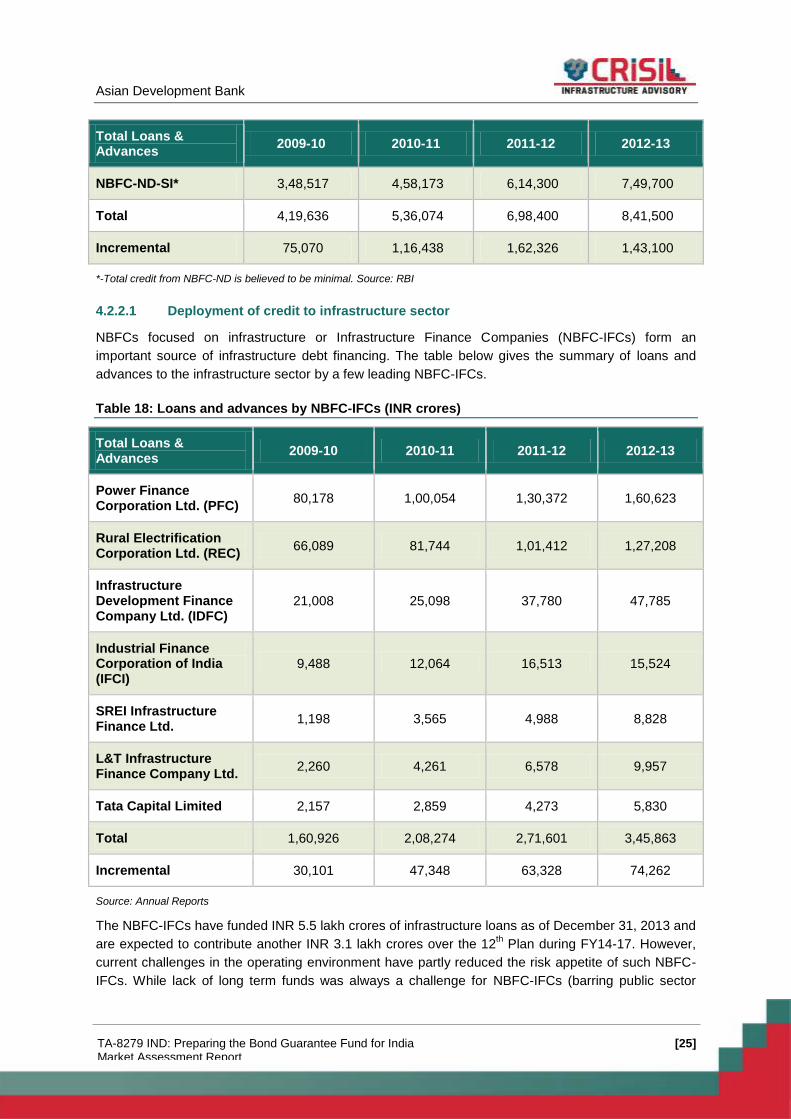
Asian Development Bank
[25] TA-8279 IND: Preparing the Bond Guarantee Fund for India Market Assessment Report
Total Loans & Advances
2009-10 2010-11 2011-12 2012-13
NBFC-ND-SI* 3,48,517 4,58,173 6,14,300 7,49,700
Total 4,19,636 5,36,074 6,98,400 8,41,500
Incremental 75,070 1,16,438 1,62,326 1,43,100
*-Total credit from NBFC-ND is believed to be minimal. Source: RBI
4.2.2.1 Deployment of credit to infrastructure sector
NBFCs focused on infrastructure or Infrastructure Finance Companies (NBFC-IFCs) form an
important source of infrastructure debt financing. The table below gives the summary of loans and
advances to the infrastructure sector by a few leading NBFC-IFCs.
Table 18: Loans and advances by NBFC-IFCs (INR crores)
Total Loans & Advances
2009-10 2010-11 2011-12 2012-13
Power Finance Corporation Ltd. (PFC)
80,178 1,00,054 1,30,372 1,60,623
Rural Electrification Corporation Ltd. (REC)
66,089 81,744 1,01,412 1,27,208
Infrastructure Development Finance Company Ltd. (IDFC)
21,008 25,098 37,780 47,785
Industrial Finance Corporation of India (IFCI)
9,488 12,064 16,513 15,524
SREI Infrastructure Finance Ltd.
1,198 3,565 4,988 8,828
L&T Infrastructure Finance Company Ltd.
2,260 4,261 6,578 9,957
Tata Capital Limited 2,157 2,859 4,273 5,830
Total 1,60,926 2,08,274 2,71,601 3,45,863
Incremental 30,101 47,348 63,328 74,262
Source: Annual Reports
The NBFC-IFCs have funded INR 5.5 lakh crores of infrastructure loans as of December 31, 2013 and
are expected to contribute another INR 3.1 lakh crores over the 12th Plan during FY14-17. However,
current challenges in the operating environment have partly reduced the risk appetite of such NBFC-
IFCs. While lack of long term funds was always a challenge for NBFC-IFCs (barring public sector
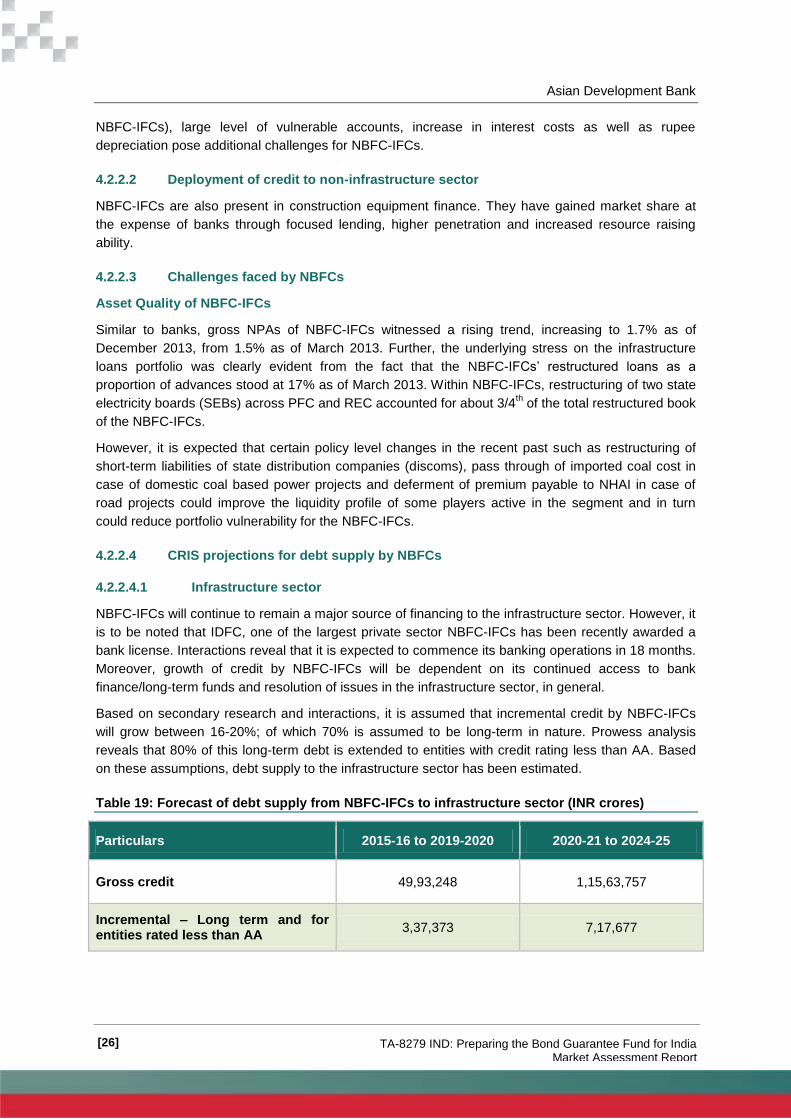
Asian Development Bank
[26] TA-8279 IND: Preparing the Bond Guarantee Fund for India Market Assessment Report
NBFC-IFCs), large level of vulnerable accounts, increase in interest costs as well as rupee
depreciation pose additional challenges for NBFC-IFCs.
4.2.2.2 Deployment of credit to non-infrastructure sector
NBFC-IFCs are also present in construction equipment finance. They have gained market share at
the expense of banks through focused lending, higher penetration and increased resource raising
ability.
4.2.2.3 Challenges faced by NBFCs
Asset Quality of NBFC-IFCs
Similar to banks, gross NPAs of NBFC-IFCs witnessed a rising trend, increasing to 1.7% as of
December 2013, from 1.5% as of March 2013. Further, the underlying stress on the infrastructure
loans portfolio was clearly evident from the fact that the NBFC-IFCs’ restructured loans as a
proportion of advances stood at 17% as of March 2013. Within NBFC-IFCs, restructuring of two state
electricity boards (SEBs) across PFC and REC accounted for about 3/4th of the total restructured book
of the NBFC-IFCs.
However, it is expected that certain policy level changes in the recent past such as restructuring of
short-term liabilities of state distribution companies (discoms), pass through of imported coal cost in
case of domestic coal based power projects and deferment of premium payable to NHAI in case of
road projects could improve the liquidity profile of some players active in the segment and in turn
could reduce portfolio vulnerability for the NBFC-IFCs.
4.2.2.4 CRIS projections for debt supply by NBFCs
4.2.2.4.1 Infrastructure sector
NBFC-IFCs will continue to remain a major source of financing to the infrastructure sector. However, it
is to be noted that IDFC, one of the largest private sector NBFC-IFCs has been recently awarded a
bank license. Interactions reveal that it is expected to commence its banking operations in 18 months.
Moreover, growth of credit by NBFC-IFCs will be dependent on its continued access to bank
finance/long-term funds and resolution of issues in the infrastructure sector, in general.
Based on secondary research and interactions, it is assumed that incremental credit by NBFC-IFCs
will grow between 16-20%; of which 70% is assumed to be long-term in nature. Prowess analysis
reveals that 80% of this long-term debt is extended to entities with credit rating less than AA. Based
on these assumptions, debt supply to the infrastructure sector has been estimated.
Table 19: Forecast of debt supply from NBFC-IFCs to infrastructure sector (INR crores)
Particulars 2015-16 to 2019-2020 2020-21 to 2024-25
Gross credit 49,93,248 1,15,63,757
Incremental – Long term and for entities rated less than AA
3,37,373 7,17,677
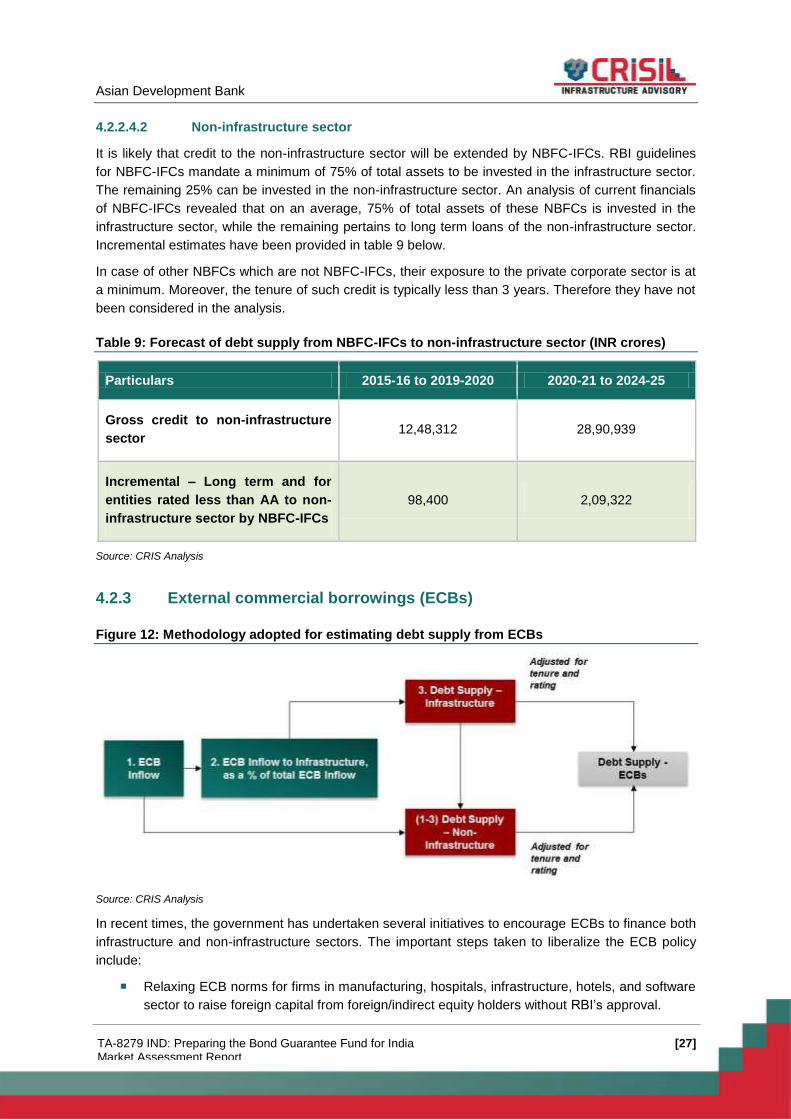
Asian Development Bank
[27] TA-8279 IND: Preparing the Bond Guarantee Fund for India Market Assessment Report
4.2.2.4.2 Non-infrastructure sector
It is likely that credit to the non-infrastructure sector will be extended by NBFC-IFCs. RBI guidelines
for NBFC-IFCs mandate a minimum of 75% of total assets to be invested in the infrastructure sector.
The remaining 25% can be invested in the non-infrastructure sector. An analysis of current financials
of NBFC-IFCs revealed that on an average, 75% of total assets of these NBFCs is invested in the
infrastructure sector, while the remaining pertains to long term loans of the non-infrastructure sector.
Incremental estimates have been provided in table 9 below.
In case of other NBFCs which are not NBFC-IFCs, their exposure to the private corporate sector is at
a minimum. Moreover, the tenure of such credit is typically less than 3 years. Therefore they have not
been considered in the analysis.
Table 9: Forecast of debt supply from NBFC-IFCs to non-infrastructure sector (INR crores)
Particulars 2015-16 to 2019-2020 2020-21 to 2024-25
Gross credit to non-infrastructure
sector 12,48,312 28,90,939
Incremental – Long term and for
entities rated less than AA to non-
infrastructure sector by NBFC-IFCs
98,400 2,09,322
Source: CRIS Analysis
4.2.3 External commercial borrowings (ECBs)
Figure 12: Methodology adopted for estimating debt supply from ECBs
Source: CRIS Analysis
In recent times, the government has undertaken several initiatives to encourage ECBs to finance both
infrastructure and non-infrastructure sectors. The important steps taken to liberalize the ECB policy
include:
Relaxing ECB norms for firms in manufacturing, hospitals, infrastructure, hotels, and software
sector to raise foreign capital from foreign/indirect equity holders without RBI’s approval.
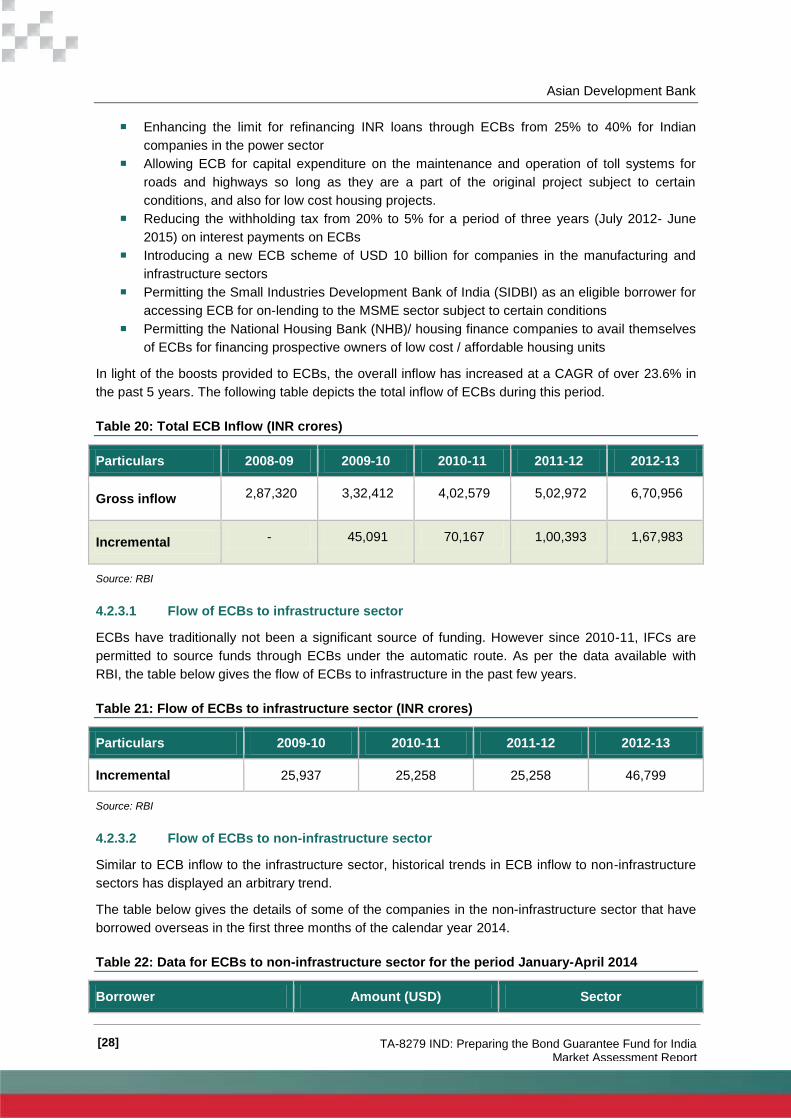
Asian Development Bank
[28] TA-8279 IND: Preparing the Bond Guarantee Fund for India Market Assessment Report
Enhancing the limit for refinancing INR loans through ECBs from 25% to 40% for Indian
companies in the power sector
Allowing ECB for capital expenditure on the maintenance and operation of toll systems for
roads and highways so long as they are a part of the original project subject to certain
conditions, and also for low cost housing projects.
Reducing the withholding tax from 20% to 5% for a period of three years (July 2012- June
2015) on interest payments on ECBs
Introducing a new ECB scheme of USD 10 billion for companies in the manufacturing and
infrastructure sectors
Permitting the Small Industries Development Bank of India (SIDBI) as an eligible borrower for
accessing ECB for on-lending to the MSME sector subject to certain conditions
Permitting the National Housing Bank (NHB)/ housing finance companies to avail themselves
of ECBs for financing prospective owners of low cost / affordable housing units
In light of the boosts provided to ECBs, the overall inflow has increased at a CAGR of over 23.6% in
the past 5 years. The following table depicts the total inflow of ECBs during this period.
Table 20: Total ECB Inflow (INR crores)
Particulars 2008-09 2009-10 2010-11 2011-12 2012-13
Gross inflow 2,87,320 3,32,412 4,02,579 5,02,972 6,70,956
Incremental - 45,091 70,167 1,00,393 1,67,983
Source: RBI
4.2.3.1 Flow of ECBs to infrastructure sector
ECBs have traditionally not been a significant source of funding. However since 2010-11, IFCs are
permitted to source funds through ECBs under the automatic route. As per the data available with
RBI, the table below gives the flow of ECBs to infrastructure in the past few years.
Table 21: Flow of ECBs to infrastructure sector (INR crores)
Particulars 2009-10 2010-11 2011-12 2012-13
Incremental 25,937 25,258 25,258 46,799
Source: RBI
4.2.3.2 Flow of ECBs to non-infrastructure sector
Similar to ECB inflow to the infrastructure sector, historical trends in ECB inflow to non-infrastructure
sectors has displayed an arbitrary trend.
The table below gives the details of some of the companies in the non-infrastructure sector that have
borrowed overseas in the first three months of the calendar year 2014.
Table 22: Data for ECBs to non-infrastructure sector for the period January-April 2014
Borrower Amount (USD) Sector
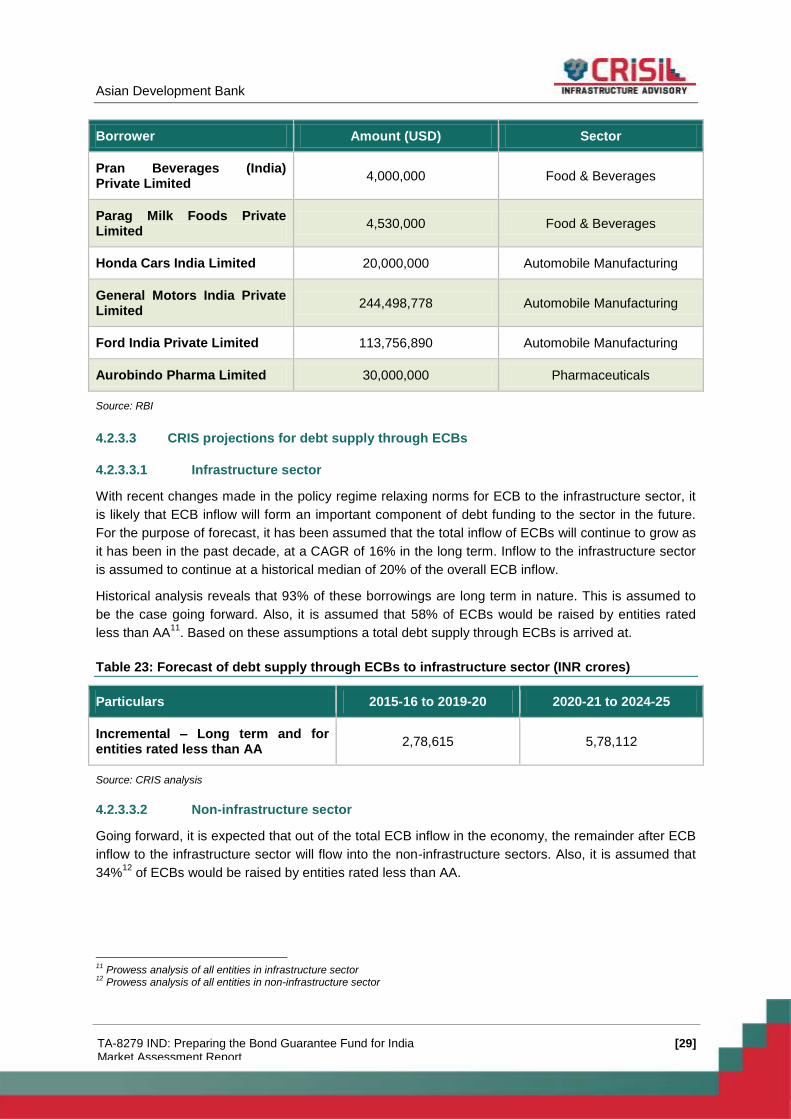
Asian Development Bank
[29] TA-8279 IND: Preparing the Bond Guarantee Fund for India Market Assessment Report
Borrower Amount (USD) Sector
Pran Beverages (India) Private Limited
4,000,000 Food & Beverages
Parag Milk Foods Private Limited
4,530,000 Food & Beverages
Honda Cars India Limited 20,000,000 Automobile Manufacturing
General Motors India Private Limited
244,498,778 Automobile Manufacturing
Ford India Private Limited 113,756,890 Automobile Manufacturing
Aurobindo Pharma Limited 30,000,000 Pharmaceuticals
Source: RBI
4.2.3.3 CRIS projections for debt supply through ECBs
4.2.3.3.1 Infrastructure sector
With recent changes made in the policy regime relaxing norms for ECB to the infrastructure sector, it
is likely that ECB inflow will form an important component of debt funding to the sector in the future.
For the purpose of forecast, it has been assumed that the total inflow of ECBs will continue to grow as
it has been in the past decade, at a CAGR of 16% in the long term. Inflow to the infrastructure sector
is assumed to continue at a historical median of 20% of the overall ECB inflow.
Historical analysis reveals that 93% of these borrowings are long term in nature. This is assumed to
be the case going forward. Also, it is assumed that 58% of ECBs would be raised by entities rated
less than AA11
. Based on these assumptions a total debt supply through ECBs is arrived at.
Table 23: Forecast of debt supply through ECBs to infrastructure sector (INR crores)
Particulars 2015-16 to 2019-20 2020-21 to 2024-25
Incremental – Long term and for entities rated less than AA
2,78,615 5,78,112
Source: CRIS analysis
4.2.3.3.2 Non-infrastructure sector
Going forward, it is expected that out of the total ECB inflow in the economy, the remainder after ECB
inflow to the infrastructure sector will flow into the non-infrastructure sectors. Also, it is assumed that
34%12
of ECBs would be raised by entities rated less than AA.
11
Prowess analysis of all entities in infrastructure sector 12
Prowess analysis of all entities in non-infrastructure sector
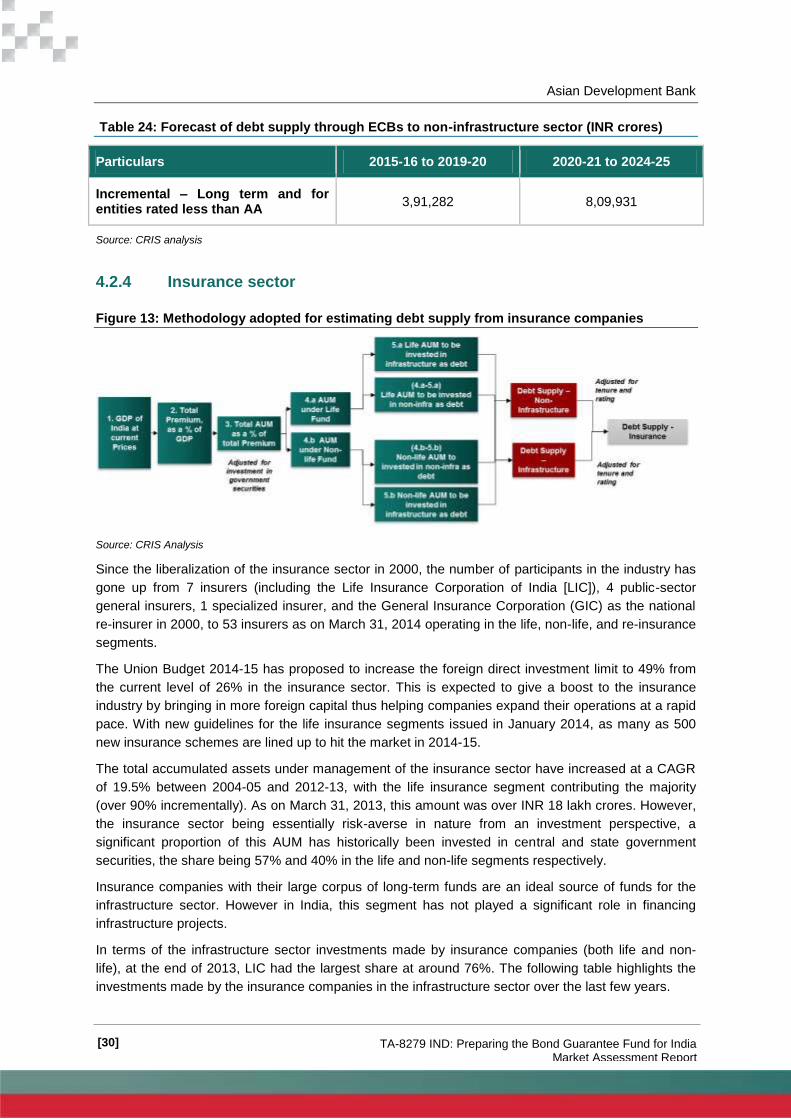
Asian Development Bank
[30] TA-8279 IND: Preparing the Bond Guarantee Fund for India Market Assessment Report
Table 24: Forecast of debt supply through ECBs to non-infrastructure sector (INR crores)
Particulars 2015-16 to 2019-20 2020-21 to 2024-25
Incremental – Long term and for entities rated less than AA
3,91,282 8,09,931
Source: CRIS analysis
4.2.4 Insurance sector
Figure 13: Methodology adopted for estimating debt supply from insurance companies
Source: CRIS Analysis
Since the liberalization of the insurance sector in 2000, the number of participants in the industry has
gone up from 7 insurers (including the Life Insurance Corporation of India [LIC]), 4 public-sector
general insurers, 1 specialized insurer, and the General Insurance Corporation (GIC) as the national
re-insurer in 2000, to 53 insurers as on March 31, 2014 operating in the life, non-life, and re-insurance
segments.
The Union Budget 2014-15 has proposed to increase the foreign direct investment limit to 49% from
the current level of 26% in the insurance sector. This is expected to give a boost to the insurance
industry by bringing in more foreign capital thus helping companies expand their operations at a rapid
pace. With new guidelines for the life insurance segments issued in January 2014, as many as 500
new insurance schemes are lined up to hit the market in 2014-15.
The total accumulated assets under management of the insurance sector have increased at a CAGR
of 19.5% between 2004-05 and 2012-13, with the life insurance segment contributing the majority
(over 90% incrementally). As on March 31, 2013, this amount was over INR 18 lakh crores. However,
the insurance sector being essentially risk-averse in nature from an investment perspective, a
significant proportion of this AUM has historically been invested in central and state government
securities, the share being 57% and 40% in the life and non-life segments respectively.
Insurance companies with their large corpus of long-term funds are an ideal source of funds for the
infrastructure sector. However in India, this segment has not played a significant role in financing
infrastructure projects.
In terms of the infrastructure sector investments made by insurance companies (both life and non-
life), at the end of 2013, LIC had the largest share at around 76%. The following table highlights the
investments made by the insurance companies in the infrastructure sector over the last few years.
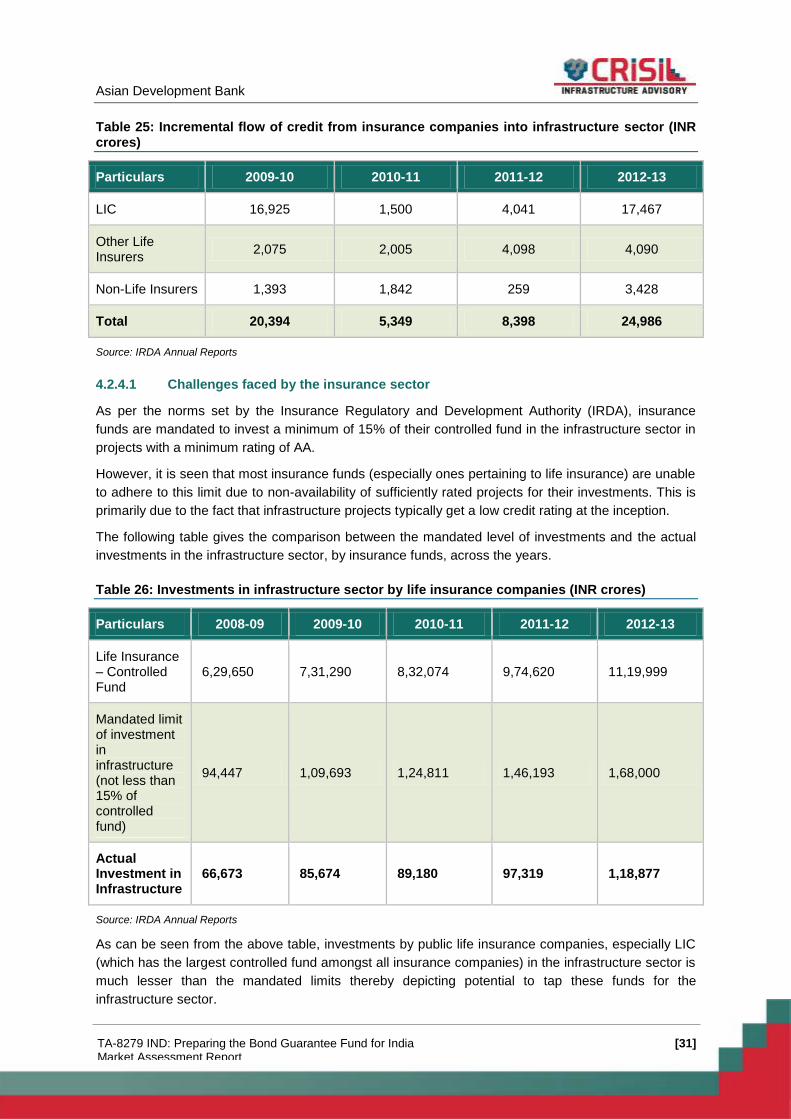
Asian Development Bank
[31] TA-8279 IND: Preparing the Bond Guarantee Fund for India Market Assessment Report
Table 25: Incremental flow of credit from insurance companies into infrastructure sector (INR crores)
Particulars 2009-10 2010-11 2011-12 2012-13
LIC 16,925 1,500 4,041 17,467
Other Life Insurers
2,075 2,005 4,098 4,090
Non-Life Insurers 1,393 1,842 259 3,428
Total 20,394 5,349 8,398 24,986
Source: IRDA Annual Reports
4.2.4.1 Challenges faced by the insurance sector
As per the norms set by the Insurance Regulatory and Development Authority (IRDA), insurance
funds are mandated to invest a minimum of 15% of their controlled fund in the infrastructure sector in
projects with a minimum rating of AA.
However, it is seen that most insurance funds (especially ones pertaining to life insurance) are unable
to adhere to this limit due to non-availability of sufficiently rated projects for their investments. This is
primarily due to the fact that infrastructure projects typically get a low credit rating at the inception.
The following table gives the comparison between the mandated level of investments and the actual
investments in the infrastructure sector, by insurance funds, across the years.
Table 26: Investments in infrastructure sector by life insurance companies (INR crores)
Particulars 2008-09 2009-10 2010-11 2011-12 2012-13
Life Insurance – Controlled Fund
6,29,650 7,31,290 8,32,074 9,74,620 11,19,999
Mandated limit of investment in infrastructure (not less than 15% of controlled fund)
94,447 1,09,693 1,24,811 1,46,193 1,68,000
Actual Investment in Infrastructure
66,673 85,674 89,180 97,319 1,18,877
Source: IRDA Annual Reports
As can be seen from the above table, investments by public life insurance companies, especially LIC
(which has the largest controlled fund amongst all insurance companies) in the infrastructure sector is
much lesser than the mandated limits thereby depicting potential to tap these funds for the
infrastructure sector.
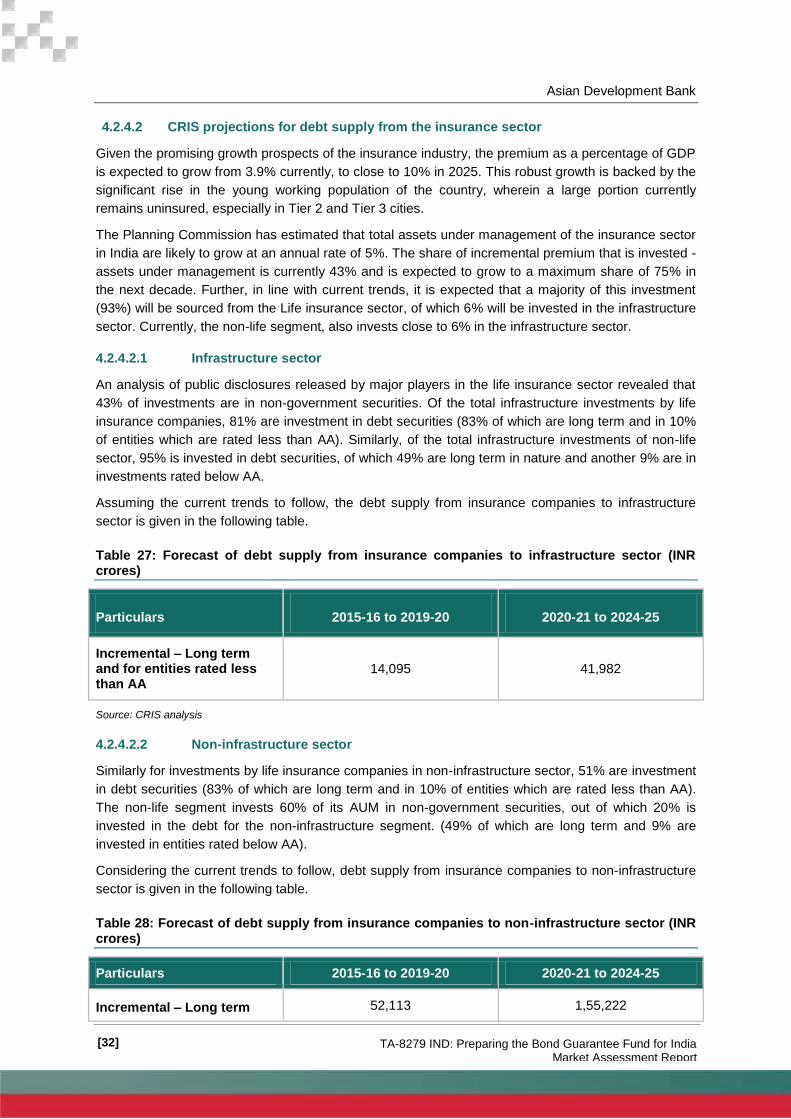
Asian Development Bank
[32] TA-8279 IND: Preparing the Bond Guarantee Fund for India Market Assessment Report
4.2.4.2 CRIS projections for debt supply from the insurance sector
Given the promising growth prospects of the insurance industry, the premium as a percentage of GDP
is expected to grow from 3.9% currently, to close to 10% in 2025. This robust growth is backed by the
significant rise in the young working population of the country, wherein a large portion currently
remains uninsured, especially in Tier 2 and Tier 3 cities.
The Planning Commission has estimated that total assets under management of the insurance sector
in India are likely to grow at an annual rate of 5%. The share of incremental premium that is invested -
assets under management is currently 43% and is expected to grow to a maximum share of 75% in
the next decade. Further, in line with current trends, it is expected that a majority of this investment
(93%) will be sourced from the Life insurance sector, of which 6% will be invested in the infrastructure
sector. Currently, the non-life segment, also invests close to 6% in the infrastructure sector.
4.2.4.2.1 Infrastructure sector
An analysis of public disclosures released by major players in the life insurance sector revealed that
43% of investments are in non-government securities. Of the total infrastructure investments by life
insurance companies, 81% are investment in debt securities (83% of which are long term and in 10%
of entities which are rated less than AA). Similarly, of the total infrastructure investments of non-life
sector, 95% is invested in debt securities, of which 49% are long term in nature and another 9% are in
investments rated below AA.
Assuming the current trends to follow, the debt supply from insurance companies to infrastructure
sector is given in the following table.
Table 27: Forecast of debt supply from insurance companies to infrastructure sector (INR crores)
Particulars 2015-16 to 2019-20 2020-21 to 2024-25
Incremental – Long term and for entities rated less than AA
14,095 41,982
Source: CRIS analysis
4.2.4.2.2 Non-infrastructure sector
Similarly for investments by life insurance companies in non-infrastructure sector, 51% are investment
in debt securities (83% of which are long term and in 10% of entities which are rated less than AA).
The non-life segment invests 60% of its AUM in non-government securities, out of which 20% is
invested in the debt for the non-infrastructure segment. (49% of which are long term and 9% are
invested in entities rated below AA).
Considering the current trends to follow, debt supply from insurance companies to non-infrastructure
sector is given in the following table.
Table 28: Forecast of debt supply from insurance companies to non-infrastructure sector (INR crores)
Particulars 2015-16 to 2019-20 2020-21 to 2024-25
Incremental – Long term 52,113 1,55,222
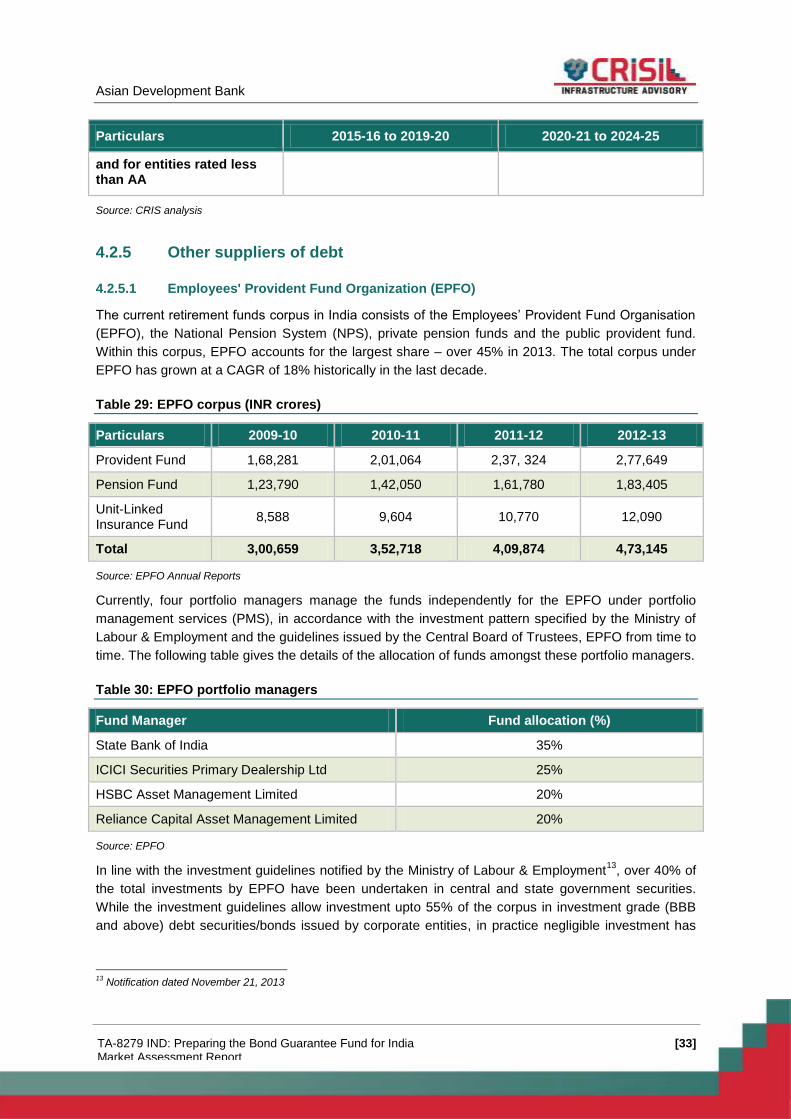
Asian Development Bank
[33] TA-8279 IND: Preparing the Bond Guarantee Fund for India Market Assessment Report
Particulars 2015-16 to 2019-20 2020-21 to 2024-25
and for entities rated less than AA
Source: CRIS analysis
4.2.5 Other suppliers of debt
4.2.5.1 Employees' Provident Fund Organization (EPFO)
The current retirement funds corpus in India consists of the Employees’ Provident Fund Organisation
(EPFO), the National Pension System (NPS), private pension funds and the public provident fund.
Within this corpus, EPFO accounts for the largest share – over 45% in 2013. The total corpus under
EPFO has grown at a CAGR of 18% historically in the last decade.
Table 29: EPFO corpus (INR crores)
Particulars 2009-10 2010-11 2011-12 2012-13
Provident Fund 1,68,281 2,01,064 2,37, 324 2,77,649
Pension Fund 1,23,790 1,42,050 1,61,780 1,83,405
Unit-Linked Insurance Fund
8,588 9,604 10,770 12,090
Total 3,00,659 3,52,718 4,09,874 4,73,145
Source: EPFO Annual Reports
Currently, four portfolio managers manage the funds independently for the EPFO under portfolio
management services (PMS), in accordance with the investment pattern specified by the Ministry of
Labour & Employment and the guidelines issued by the Central Board of Trustees, EPFO from time to
time. The following table gives the details of the allocation of funds amongst these portfolio managers.
Table 30: EPFO portfolio managers
Fund Manager Fund allocation (%)
State Bank of India 35%
ICICI Securities Primary Dealership Ltd 25%
HSBC Asset Management Limited 20%
Reliance Capital Asset Management Limited 20%
Source: EPFO
In line with the investment guidelines notified by the Ministry of Labour & Employment13
, over 40% of
the total investments by EPFO have been undertaken in central and state government securities.
While the investment guidelines allow investment upto 55% of the corpus in investment grade (BBB
and above) debt securities/bonds issued by corporate entities, in practice negligible investment has
13
Notification dated November 21, 2013

Asian Development Bank
[34] TA-8279 IND: Preparing the Bond Guarantee Fund for India Market Assessment Report
been undertaken in long-term corporate bonds with less than AA grade, as seen in table 31. This is
because of the following reasons/internal guidelines
Limited exposure allowance to lower rated issuances
Exposure to private sector maintained at less than 10%
Exposure linked to net worth of issuing entity
Hence, even though it is expected that the EPFO corpus will continue to grow, it is highly unlikely that
there will be any significant investment in long-term corporate bonds (rated less than AA).
Table 31: Corporate Bonds Investment Pattern – EPFO (INR crores as of September 2013)
Credit Rating EPFO – Provident
Fund EPFO – Pension Fund EPFO – Insurance
AA ( AA & AA+) 15,494 4,391 226
AAA (AAA & AAA(SO) ) 74,893 41,703 2,050
FD & Others 16,509 6,067 336
Total – Corporate Bonds 1,06,896 52,161 2,611
Source: EPFO
Similar to the investment pattern of EPFO, other pension funds refrain from investments in less than
AA rated bonds. The NPS and its investment pattern have been discussed below.
4.2.5.2 National Pension System (NPS)
The NPS is a defined-contribution-based pension system launched by the Government of
India/PFRDA with effect from January 1, 2004. Since April 1, 2008, the pension contributions of
Central Government employees covered by the NPS are being invested by eight professional pension
fund managers in line with the investment guidelines of the government applicable to non-government
provident funds set by PFRDA. The total corpus size under NPS is estimated to be around INR
50,000 crores currently.
Analysis of funds held by each of the eight fund managers and their associated investments reveal
that less than 4% of investments are undertaken in instruments holding a less than AA grade.
Table 32: Corpus size and investment pattern – NPS (INR crores)
Fund Manager Corpus Size Investment in AA or above
rated instruments
UTI -November 13 4,759.36 4,628.66
SBI - May 14 7,018.86 6,828.87
LIC Pension Fund - May 14 4,689.74 4,444.66
Reliance Pension Fund - June 14 12.01 12.01
Kotak Pension Fund - June 14 12.51 12.51
ICICI Pension Fund - June 14 61.29 61.29
HDFC Pension Fund June - 14 2.62 2.62
DsP Black Rock Pension Fund - 0.37 0.37
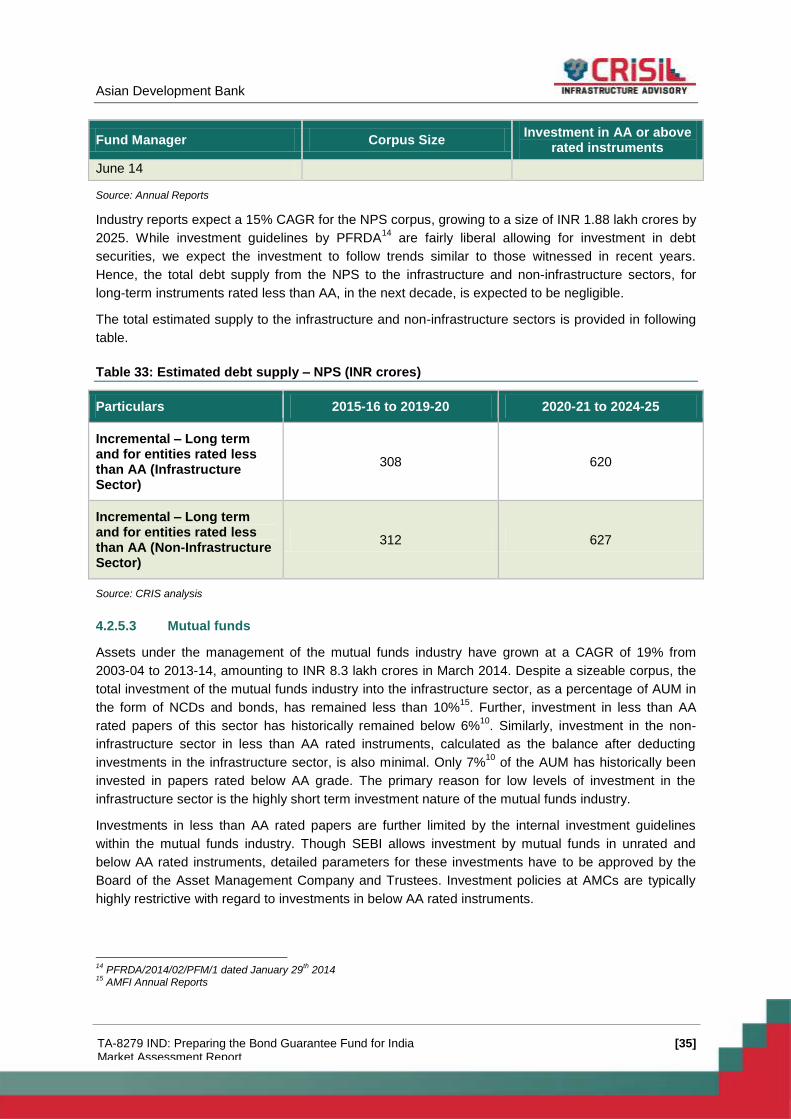
Asian Development Bank
[35] TA-8279 IND: Preparing the Bond Guarantee Fund for India Market Assessment Report
Fund Manager Corpus Size Investment in AA or above
rated instruments
June 14
Source: Annual Reports
Industry reports expect a 15% CAGR for the NPS corpus, growing to a size of INR 1.88 lakh crores by
2025. While investment guidelines by PFRDA14
are fairly liberal allowing for investment in debt
securities, we expect the investment to follow trends similar to those witnessed in recent years.
Hence, the total debt supply from the NPS to the infrastructure and non-infrastructure sectors, for
long-term instruments rated less than AA, in the next decade, is expected to be negligible.
The total estimated supply to the infrastructure and non-infrastructure sectors is provided in following
table.
Table 33: Estimated debt supply – NPS (INR crores)
Particulars 2015-16 to 2019-20 2020-21 to 2024-25
Incremental – Long term and for entities rated less than AA (Infrastructure Sector)
308 620
Incremental – Long term and for entities rated less than AA (Non-Infrastructure Sector)
312 627
Source: CRIS analysis
4.2.5.3 Mutual funds
Assets under the management of the mutual funds industry have grown at a CAGR of 19% from
2003-04 to 2013-14, amounting to INR 8.3 lakh crores in March 2014. Despite a sizeable corpus, the
total investment of the mutual funds industry into the infrastructure sector, as a percentage of AUM in
the form of NCDs and bonds, has remained less than 10%15
. Further, investment in less than AA
rated papers of this sector has historically remained below 6%10
. Similarly, investment in the non-
infrastructure sector in less than AA rated instruments, calculated as the balance after deducting
investments in the infrastructure sector, is also minimal. Only 7%10
of the AUM has historically been
invested in papers rated below AA grade. The primary reason for low levels of investment in the
infrastructure sector is the highly short term investment nature of the mutual funds industry.
Investments in less than AA rated papers are further limited by the internal investment guidelines
within the mutual funds industry. Though SEBI allows investment by mutual funds in unrated and
below AA rated instruments, detailed parameters for these investments have to be approved by the
Board of the Asset Management Company and Trustees. Investment policies at AMCs are typically
highly restrictive with regard to investments in below AA rated instruments.
14
PFRDA/2014/02/PFM/1 dated January 29th 2014
15 AMFI Annual Reports
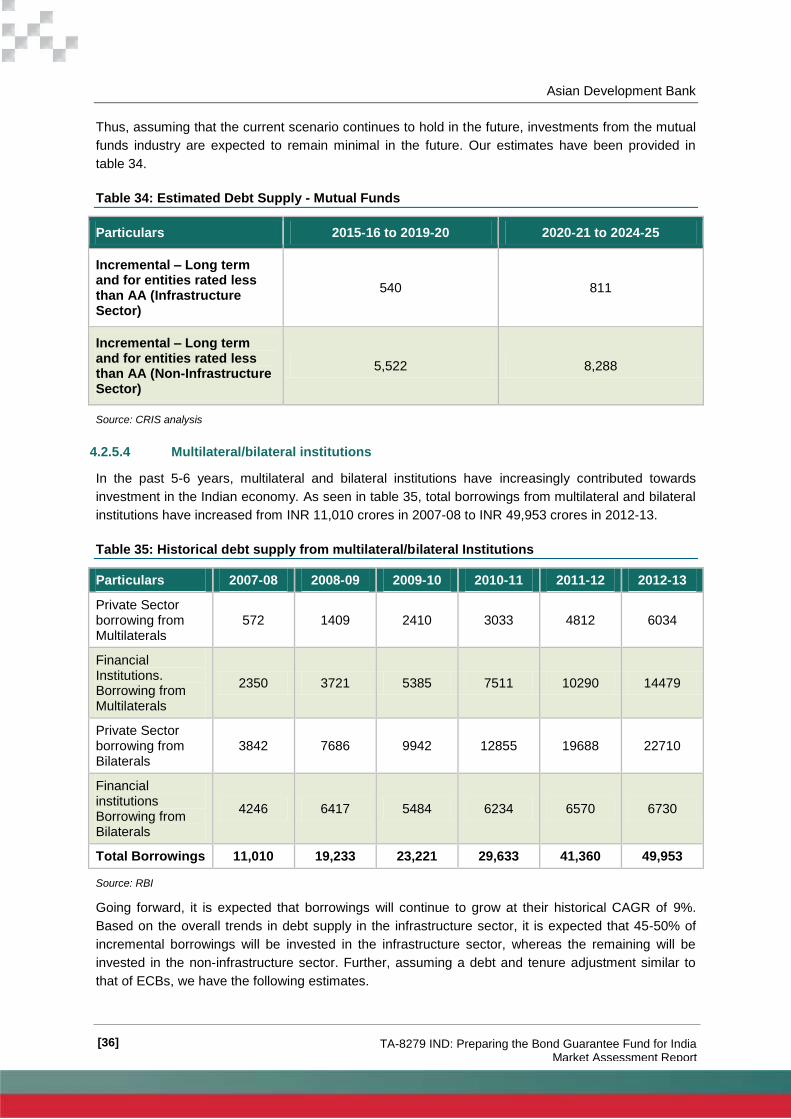
Asian Development Bank
[36] TA-8279 IND: Preparing the Bond Guarantee Fund for India Market Assessment Report
Thus, assuming that the current scenario continues to hold in the future, investments from the mutual
funds industry are expected to remain minimal in the future. Our estimates have been provided in
table 34.
Table 34: Estimated Debt Supply - Mutual Funds
Particulars 2015-16 to 2019-20 2020-21 to 2024-25
Incremental – Long term and for entities rated less than AA (Infrastructure Sector)
540 811
Incremental – Long term and for entities rated less than AA (Non-Infrastructure Sector)
5,522 8,288
Source: CRIS analysis
4.2.5.4 Multilateral/bilateral institutions
In the past 5-6 years, multilateral and bilateral institutions have increasingly contributed towards
investment in the Indian economy. As seen in table 35, total borrowings from multilateral and bilateral
institutions have increased from INR 11,010 crores in 2007-08 to INR 49,953 crores in 2012-13.
Table 35: Historical debt supply from multilateral/bilateral Institutions
Particulars 2007-08 2008-09 2009-10 2010-11 2011-12 2012-13
Private Sector borrowing from Multilaterals
572 1409 2410 3033 4812 6034
Financial Institutions. Borrowing from Multilaterals
2350 3721 5385 7511 10290 14479
Private Sector borrowing from Bilaterals
3842 7686 9942 12855 19688 22710
Financial institutions Borrowing from Bilaterals
4246 6417 5484 6234 6570 6730
Total Borrowings 11,010 19,233 23,221 29,633 41,360 49,953
Source: RBI
Going forward, it is expected that borrowings will continue to grow at their historical CAGR of 9%.
Based on the overall trends in debt supply in the infrastructure sector, it is expected that 45-50% of
incremental borrowings will be invested in the infrastructure sector, whereas the remaining will be
invested in the non-infrastructure sector. Further, assuming a debt and tenure adjustment similar to
that of ECBs, we have the following estimates.
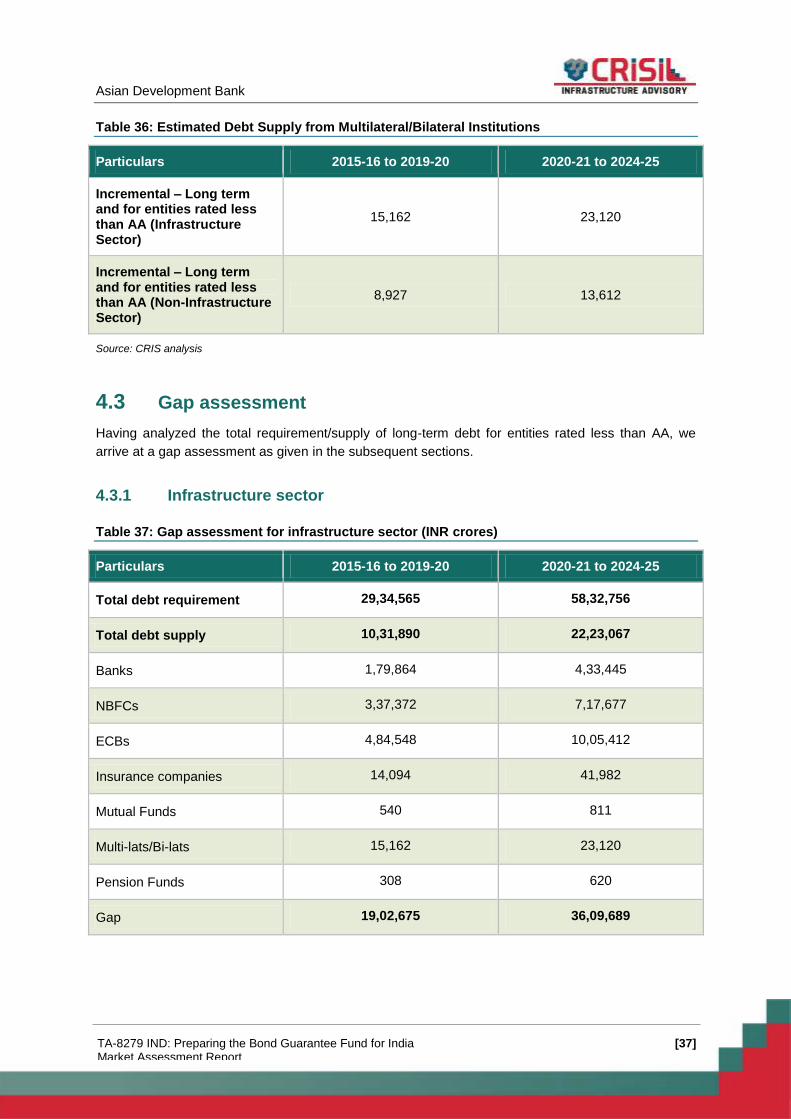
Asian Development Bank
[37] TA-8279 IND: Preparing the Bond Guarantee Fund for India Market Assessment Report
Table 36: Estimated Debt Supply from Multilateral/Bilateral Institutions
Particulars 2015-16 to 2019-20 2020-21 to 2024-25
Incremental – Long term and for entities rated less than AA (Infrastructure Sector)
15,162 23,120
Incremental – Long term and for entities rated less than AA (Non-Infrastructure Sector)
8,927 13,612
Source: CRIS analysis
4.3 Gap assessment
Having analyzed the total requirement/supply of long-term debt for entities rated less than AA, we
arrive at a gap assessment as given in the subsequent sections.
4.3.1 Infrastructure sector
Table 37: Gap assessment for infrastructure sector (INR crores)
Particulars 2015-16 to 2019-20 2020-21 to 2024-25
Total debt requirement 29,34,565 58,32,756
Total debt supply 10,31,890 22,23,067
Banks 1,79,864 4,33,445
NBFCs 3,37,372 7,17,677
ECBs 4,84,548 10,05,412
Insurance companies 14,094 41,982
Mutual Funds 540 811
Multi-lats/Bi-lats 15,162 23,120
Pension Funds 308 620
Gap 19,02,675 36,09,689
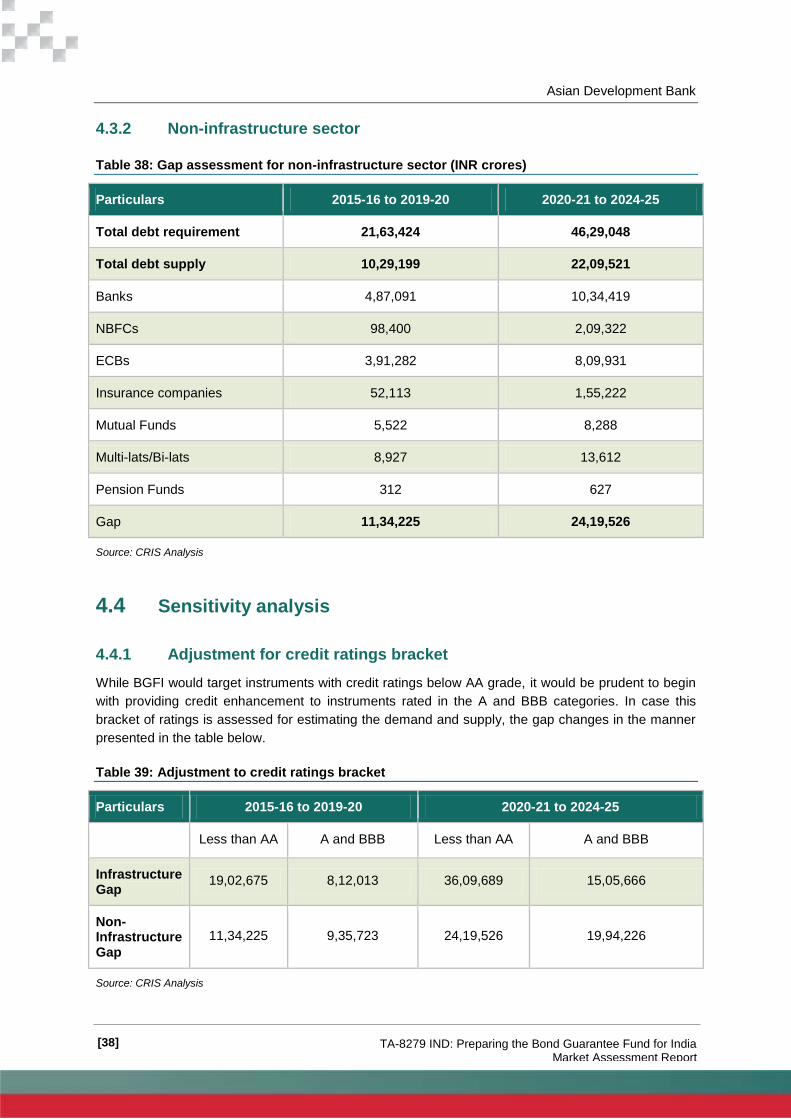
Asian Development Bank
[38] TA-8279 IND: Preparing the Bond Guarantee Fund for India Market Assessment Report
4.3.2 Non-infrastructure sector
Table 38: Gap assessment for non-infrastructure sector (INR crores)
Particulars 2015-16 to 2019-20 2020-21 to 2024-25
Total debt requirement 21,63,424 46,29,048
Total debt supply 10,29,199 22,09,521
Banks 4,87,091 10,34,419
NBFCs 98,400 2,09,322
ECBs 3,91,282 8,09,931
Insurance companies 52,113 1,55,222
Mutual Funds 5,522 8,288
Multi-lats/Bi-lats 8,927 13,612
Pension Funds 312 627
Gap 11,34,225 24,19,526
Source: CRIS Analysis
4.4 Sensitivity analysis
4.4.1 Adjustment for credit ratings bracket
While BGFI would target instruments with credit ratings below AA grade, it would be prudent to begin
with providing credit enhancement to instruments rated in the A and BBB categories. In case this
bracket of ratings is assessed for estimating the demand and supply, the gap changes in the manner
presented in the table below.
Table 39: Adjustment to credit ratings bracket
Particulars 2015-16 to 2019-20 2020-21 to 2024-25
Less than AA A and BBB Less than AA A and BBB
Infrastructure Gap
19,02,675 8,12,013 36,09,689 15,05,666
Non-Infrastructure Gap
11,34,225 9,35,723 24,19,526 19,94,226
Source: CRIS Analysis
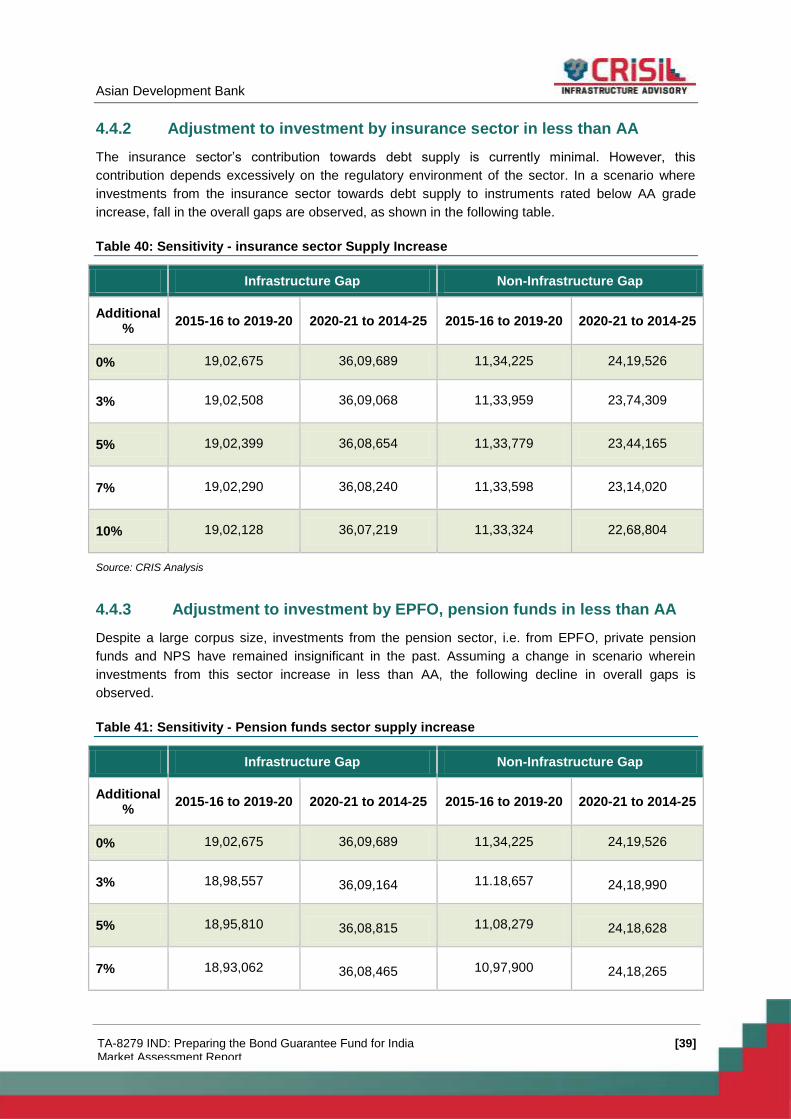
Asian Development Bank
[39] TA-8279 IND: Preparing the Bond Guarantee Fund for India Market Assessment Report
4.4.2 Adjustment to investment by insurance sector in less than AA
The insurance sector’s contribution towards debt supply is currently minimal. However, this
contribution depends excessively on the regulatory environment of the sector. In a scenario where
investments from the insurance sector towards debt supply to instruments rated below AA grade
increase, fall in the overall gaps are observed, as shown in the following table.
Table 40: Sensitivity - insurance sector Supply Increase
Infrastructure Gap Non-Infrastructure Gap
Additional %
2015-16 to 2019-20 2020-21 to 2014-25 2015-16 to 2019-20 2020-21 to 2014-25
0% 19,02,675 36,09,689 11,34,225 24,19,526
3% 19,02,508 36,09,068 11,33,959 23,74,309
5% 19,02,399 36,08,654 11,33,779 23,44,165
7% 19,02,290 36,08,240 11,33,598 23,14,020
10% 19,02,128 36,07,219 11,33,324 22,68,804
Source: CRIS Analysis
4.4.3 Adjustment to investment by EPFO, pension funds in less than AA
Despite a large corpus size, investments from the pension sector, i.e. from EPFO, private pension
funds and NPS have remained insignificant in the past. Assuming a change in scenario wherein
investments from this sector increase in less than AA, the following decline in overall gaps is
observed.
Table 41: Sensitivity - Pension funds sector supply increase
Infrastructure Gap Non-Infrastructure Gap
Additional %
2015-16 to 2019-20 2020-21 to 2014-25 2015-16 to 2019-20 2020-21 to 2014-25
0% 19,02,675 36,09,689 11,34,225 24,19,526
3% 18,98,557 36,09,164 11.18,657 24,18,990
5% 18,95,810 36,08,815 11,08,279 24,18,628
7% 18,93,062 36,08,465 10,97,900 24,18,265
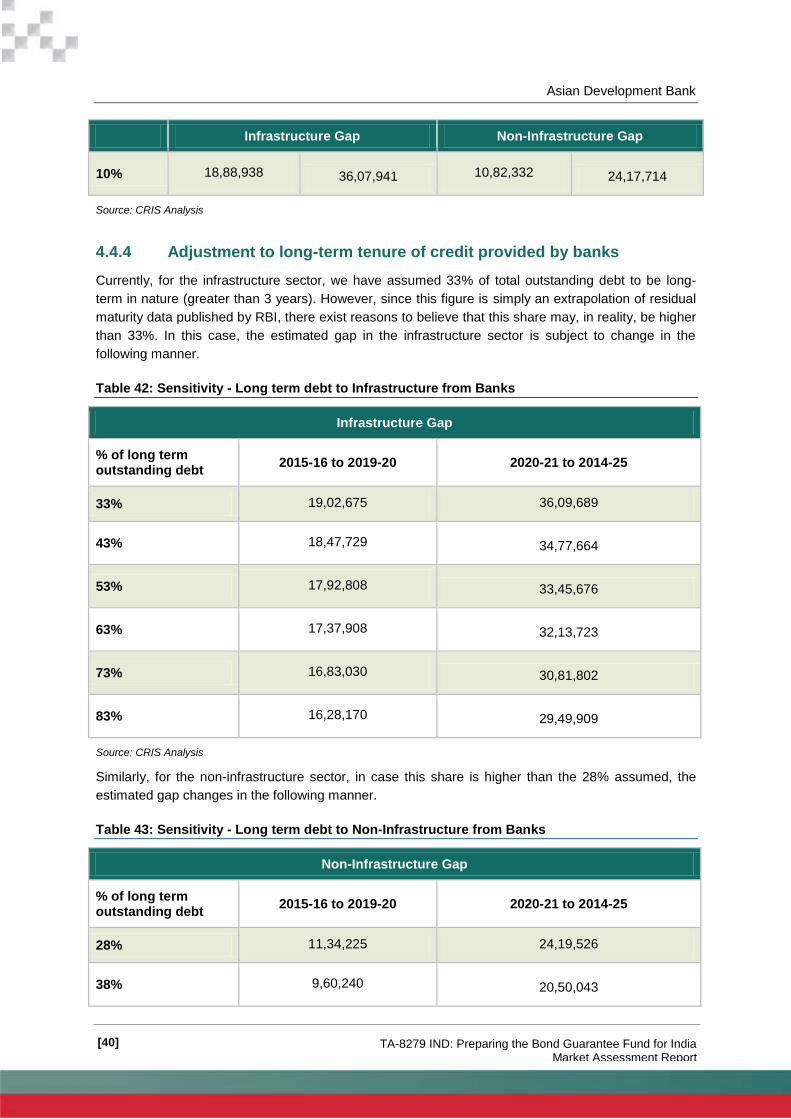
Asian Development Bank
[40] TA-8279 IND: Preparing the Bond Guarantee Fund for India Market Assessment Report
Infrastructure Gap Non-Infrastructure Gap
10% 18,88,938 36,07,941 10,82,332 24,17,714
Source: CRIS Analysis
4.4.4 Adjustment to long-term tenure of credit provided by banks
Currently, for the infrastructure sector, we have assumed 33% of total outstanding debt to be long-
term in nature (greater than 3 years). However, since this figure is simply an extrapolation of residual
maturity data published by RBI, there exist reasons to believe that this share may, in reality, be higher
than 33%. In this case, the estimated gap in the infrastructure sector is subject to change in the
following manner.
Table 42: Sensitivity - Long term debt to Infrastructure from Banks
Infrastructure Gap
% of long term outstanding debt
2015-16 to 2019-20 2020-21 to 2014-25
33% 19,02,675 36,09,689
43% 18,47,729 34,77,664
53% 17,92,808 33,45,676
63% 17,37,908 32,13,723
73% 16,83,030 30,81,802
83% 16,28,170 29,49,909
Source: CRIS Analysis
Similarly, for the non-infrastructure sector, in case this share is higher than the 28% assumed, the
estimated gap changes in the following manner.
Table 43: Sensitivity - Long term debt to Non-Infrastructure from Banks
Non-Infrastructure Gap
% of long term outstanding debt
2015-16 to 2019-20 2020-21 to 2014-25
28% 11,34,225 24,19,526
38% 9,60,240 20,50,043
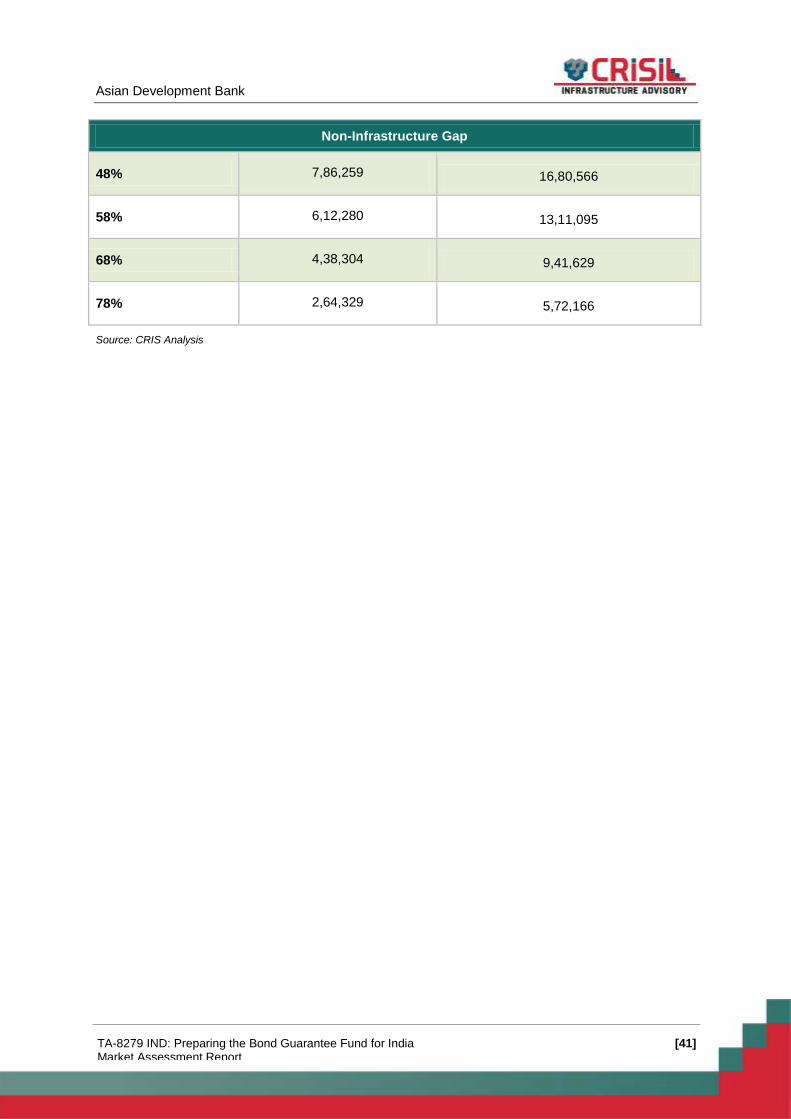
Asian Development Bank
[41] TA-8279 IND: Preparing the Bond Guarantee Fund for India Market Assessment Report
Non-Infrastructure Gap
48% 7,86,259 16,80,566
58% 6,12,280 13,11,095
68% 4,38,304 9,41,629
78% 2,64,329 5,72,166
Source: CRIS Analysis
Asian Development Bank
[42] TA-8279 IND: Preparing the Bond Guarantee Fund for India Market Assessment Report
5. Requirement of Bond Market in India
As analysed in the earlier sections, the traditional sources of finance will not be sufficient to meet
investments and therefrom arise debt requirements for the future. The banking sector which has
been the mainstay for debt financing is increasingly facing stress. Therefore, it is imperative that
alternative financing channels be developed in a systematic manner to supplement traditional bank
credit. A well-functioning corporate debt market could play a critical role by supplementing the
banking system to meet the requirements of the corporate sector for long-term capital investment and
asset creation.
Bond finance differs from conventional bank finance in certain aspects. These are discussed below
Fixed v/s. Floating rate
Bond finance typically comprises a fixed coupon rate while banks loans usually have a
floating interest rate, linked to the interest rate cycle. By taking on a fixed interest rate, the
borrower would be able to better forecast fixed cash flows. The choice of entering into a
floating rate or fixed rate debt arrangement essentially depends on market timing and risk
appetite of borrower/investor. For instance, if the interest rates are expected to increase over
a certain time period, it might be more beneficial for the project to enter into a debt
arrangement/refinanced existing debt arrangement through a fixed coupon bond.
Longer maturity period
The investment appetite for investors on the asset site depends on the profile of their liability
side. The liability tenure of bond investors such as insurance funds and pension funds is
much longer than that of banks. Therefore, these bond investors would have the appetite to
invest in long-term projects. In general, bonds have a maturity period longer than bank loans.
Exit Option
Banks typically have prepayment penalty clauses written into the loan agreements, while in
bond finance theoretically there is no such penalty. For instance, if the borrower wishes to
close out an existing loan by prepaying it a penalty (to the extent prepaid) will be levied.
Borrowers can provide an option of exiting bonds to investors by listing them in the
exchanges. Bonds may also have a put option, where the investor is allowed to sell the bonds
based on certain conditions back to the borrower. Similarly call options in bonds enable
borrowers to buy back the bonds from investors.
Negative Cost of Carry
Bond funds have to be drawn in one go while bank funds can be drawn in tranches. Drawing
in tranches reduces the negative carry.
High Transaction Cost
The transaction costs associated with issue of bonds (rating of bond, listing on exchange etc.)
would be higher than those for bank financing (as a percentage) for a higher quantum. But the
amount would be minimal and therefore would not be a significant factor affecting the choice
of one financing arrangement over the other.
Pricing Mechanism
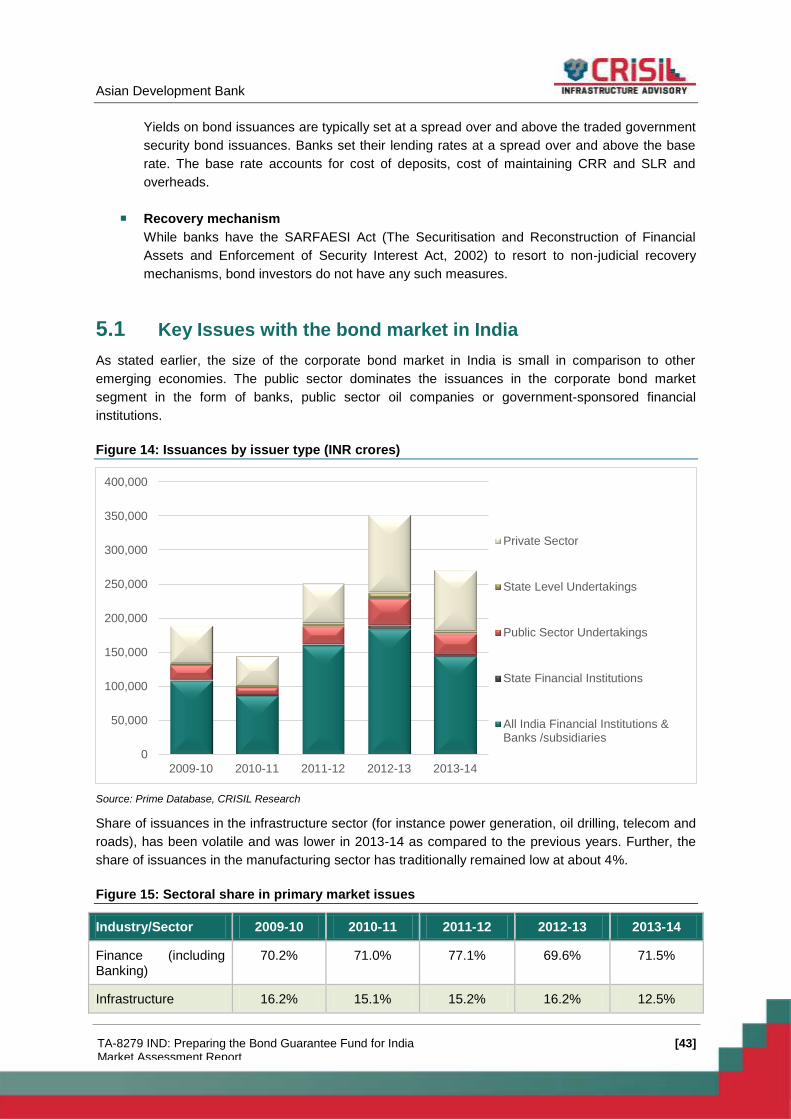
Asian Development Bank
[43] TA-8279 IND: Preparing the Bond Guarantee Fund for India Market Assessment Report
Yields on bond issuances are typically set at a spread over and above the traded government
security bond issuances. Banks set their lending rates at a spread over and above the base
rate. The base rate accounts for cost of deposits, cost of maintaining CRR and SLR and
overheads.
Recovery mechanism
While banks have the SARFAESI Act (The Securitisation and Reconstruction of Financial
Assets and Enforcement of Security Interest Act, 2002) to resort to non-judicial recovery
mechanisms, bond investors do not have any such measures.
5.1 Key Issues with the bond market in India
As stated earlier, the size of the corporate bond market in India is small in comparison to other
emerging economies. The public sector dominates the issuances in the corporate bond market
segment in the form of banks, public sector oil companies or government-sponsored financial
institutions.
Figure 14: Issuances by issuer type (INR crores)
Source: Prime Database, CRISIL Research
Share of issuances in the infrastructure sector (for instance power generation, oil drilling, telecom and
roads), has been volatile and was lower in 2013-14 as compared to the previous years. Further, the
share of issuances in the manufacturing sector has traditionally remained low at about 4%.
Figure 15: Sectoral share in primary market issues
Industry/Sector 2009-10 2010-11 2011-12 2012-13 2013-14
Finance (including Banking)
70.2% 71.0% 77.1% 69.6% 71.5%
Infrastructure 16.2% 15.1% 15.2% 16.2% 12.5%
0
50,000
100,000
150,000
200,000
250,000
300,000
350,000
400,000
2009-10 2010-11 2011-12 2012-13 2013-14
Private Sector
State Level Undertakings
Public Sector Undertakings
State Financial Institutions
All India Financial Institutions &Banks /subsidiaries
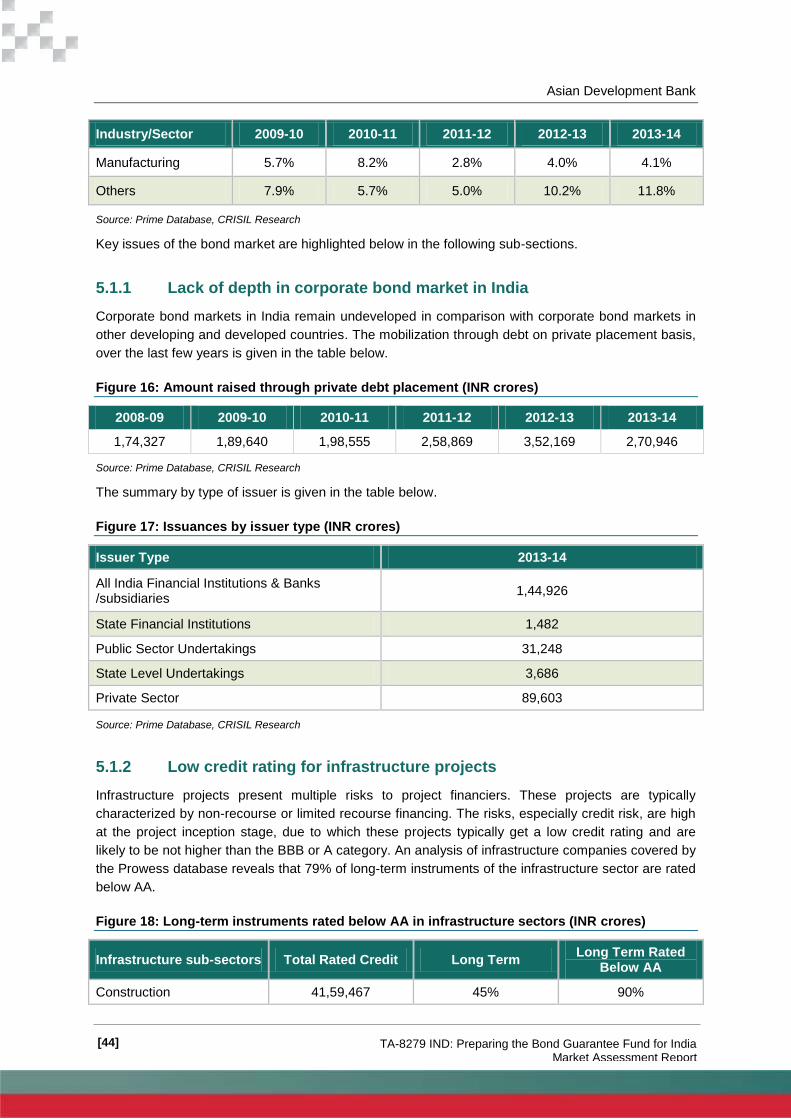
Asian Development Bank
[44] TA-8279 IND: Preparing the Bond Guarantee Fund for India Market Assessment Report
Industry/Sector 2009-10 2010-11 2011-12 2012-13 2013-14
Manufacturing 5.7% 8.2% 2.8% 4.0% 4.1%
Others 7.9% 5.7% 5.0% 10.2% 11.8%
Source: Prime Database, CRISIL Research
Key issues of the bond market are highlighted below in the following sub-sections.
5.1.1 Lack of depth in corporate bond market in India
Corporate bond markets in India remain undeveloped in comparison with corporate bond markets in
other developing and developed countries. The mobilization through debt on private placement basis,
over the last few years is given in the table below.
Figure 16: Amount raised through private debt placement (INR crores)
2008-09 2009-10 2010-11 2011-12 2012-13 2013-14
1,74,327 1,89,640 1,98,555 2,58,869 3,52,169 2,70,946
Source: Prime Database, CRISIL Research
The summary by type of issuer is given in the table below.
Figure 17: Issuances by issuer type (INR crores)
Issuer Type 2013-14
All India Financial Institutions & Banks /subsidiaries
1,44,926
State Financial Institutions 1,482
Public Sector Undertakings 31,248
State Level Undertakings 3,686
Private Sector 89,603
Source: Prime Database, CRISIL Research
5.1.2 Low credit rating for infrastructure projects
Infrastructure projects present multiple risks to project financiers. These projects are typically
characterized by non-recourse or limited recourse financing. The risks, especially credit risk, are high
at the project inception stage, due to which these projects typically get a low credit rating and are
likely to be not higher than the BBB or A category. An analysis of infrastructure companies covered by
the Prowess database reveals that 79% of long-term instruments of the infrastructure sector are rated
below AA.
Figure 18: Long-term instruments rated below AA in infrastructure sectors (INR crores)
Infrastructure sub-sectors Total Rated Credit Long Term Long Term Rated
Below AA
Construction 41,59,467 45% 90%
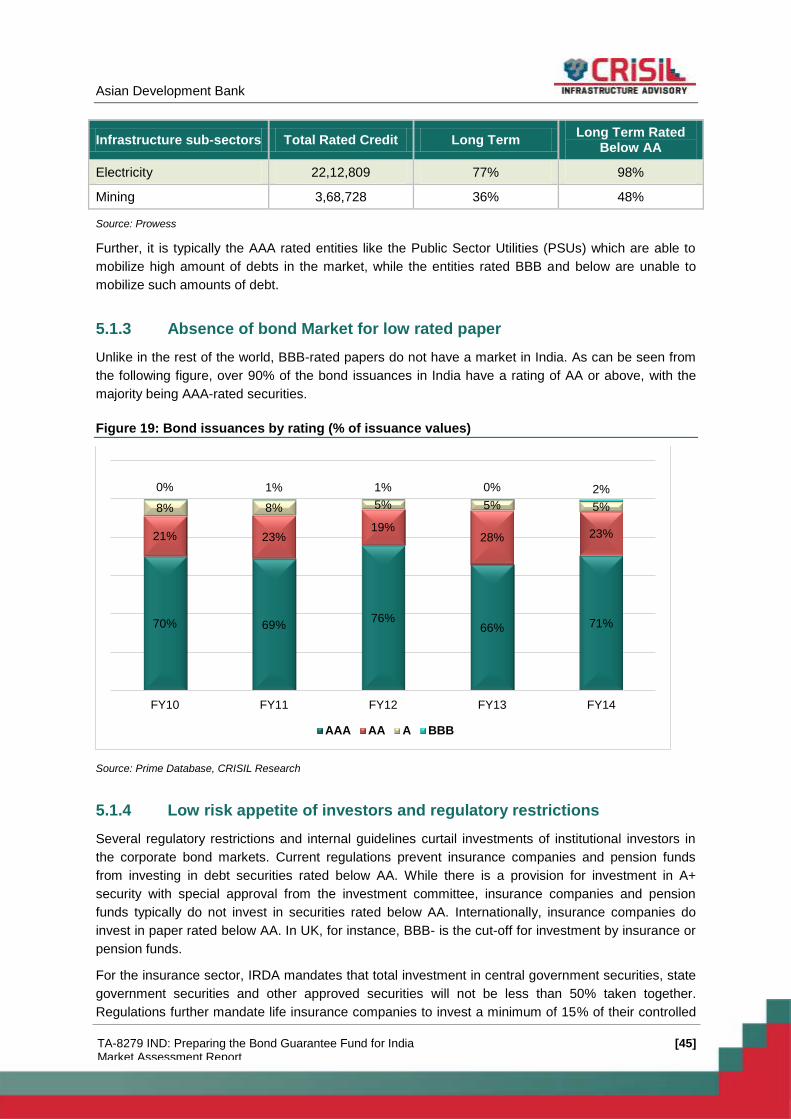
Asian Development Bank
[45] TA-8279 IND: Preparing the Bond Guarantee Fund for India Market Assessment Report
Infrastructure sub-sectors Total Rated Credit Long Term Long Term Rated
Below AA
Electricity 22,12,809 77% 98%
Mining 3,68,728 36% 48%
Source: Prowess
Further, it is typically the AAA rated entities like the Public Sector Utilities (PSUs) which are able to
mobilize high amount of debts in the market, while the entities rated BBB and below are unable to
mobilize such amounts of debt.
5.1.3 Absence of bond Market for low rated paper
Unlike in the rest of the world, BBB-rated papers do not have a market in India. As can be seen from
the following figure, over 90% of the bond issuances in India have a rating of AA or above, with the
majority being AAA-rated securities.
Figure 19: Bond issuances by rating (% of issuance values)
Source: Prime Database, CRISIL Research
5.1.4 Low risk appetite of investors and regulatory restrictions
Several regulatory restrictions and internal guidelines curtail investments of institutional investors in
the corporate bond markets. Current regulations prevent insurance companies and pension funds
from investing in debt securities rated below AA. While there is a provision for investment in A+
security with special approval from the investment committee, insurance companies and pension
funds typically do not invest in securities rated below AA. Internationally, insurance companies do
invest in paper rated below AA. In UK, for instance, BBB- is the cut-off for investment by insurance or
pension funds.
For the insurance sector, IRDA mandates that total investment in central government securities, state
government securities and other approved securities will not be less than 50% taken together.
Regulations further mandate life insurance companies to invest a minimum of 15% of their controlled
70% 69% 76%
66% 71%
21% 23% 19%
28% 23%
8% 8% 5% 5% 5%
0% 1% 1% 0% 2%
FY10 FY11 FY12 FY13 FY14
AAA AA A BBB
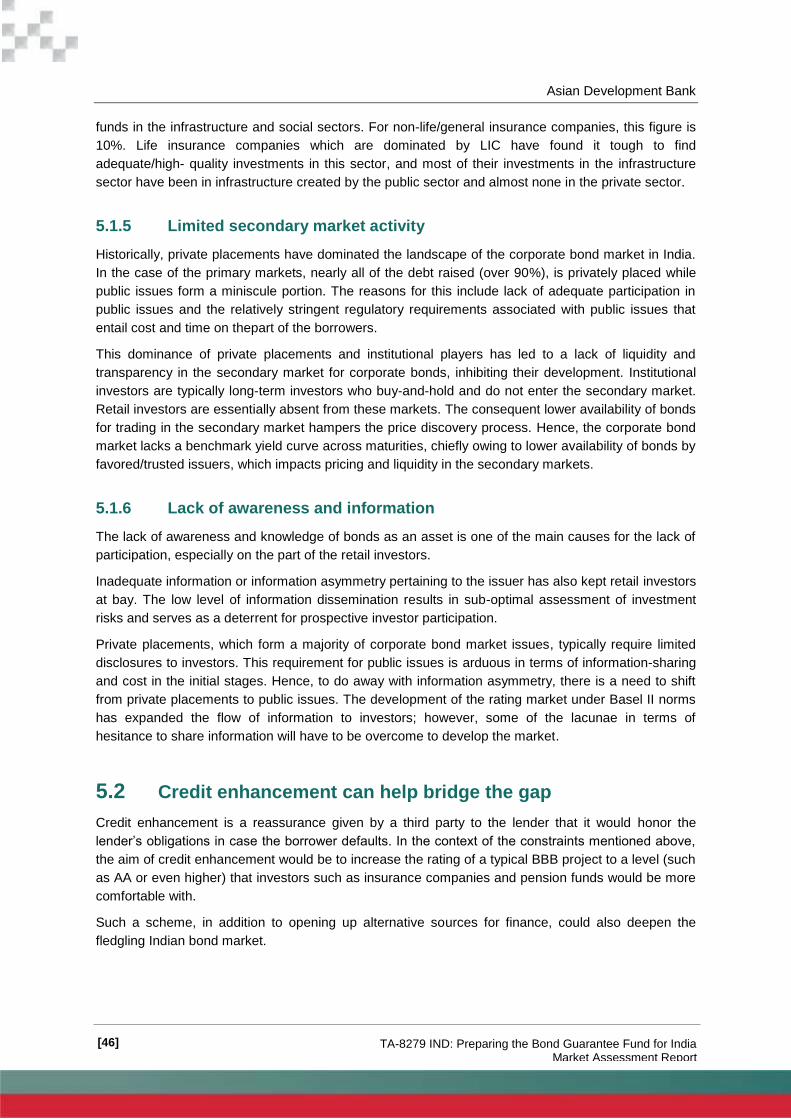
Asian Development Bank
[46] TA-8279 IND: Preparing the Bond Guarantee Fund for India Market Assessment Report
funds in the infrastructure and social sectors. For non-life/general insurance companies, this figure is
10%. Life insurance companies which are dominated by LIC have found it tough to find
adequate/high- quality investments in this sector, and most of their investments in the infrastructure
sector have been in infrastructure created by the public sector and almost none in the private sector.
5.1.5 Limited secondary market activity
Historically, private placements have dominated the landscape of the corporate bond market in India.
In the case of the primary markets, nearly all of the debt raised (over 90%), is privately placed while
public issues form a miniscule portion. The reasons for this include lack of adequate participation in
public issues and the relatively stringent regulatory requirements associated with public issues that
entail cost and time on thepart of the borrowers.
This dominance of private placements and institutional players has led to a lack of liquidity and
transparency in the secondary market for corporate bonds, inhibiting their development. Institutional
investors are typically long-term investors who buy-and-hold and do not enter the secondary market.
Retail investors are essentially absent from these markets. The consequent lower availability of bonds
for trading in the secondary market hampers the price discovery process. Hence, the corporate bond
market lacks a benchmark yield curve across maturities, chiefly owing to lower availability of bonds by
favored/trusted issuers, which impacts pricing and liquidity in the secondary markets.
5.1.6 Lack of awareness and information
The lack of awareness and knowledge of bonds as an asset is one of the main causes for the lack of
participation, especially on the part of the retail investors.
Inadequate information or information asymmetry pertaining to the issuer has also kept retail investors
at bay. The low level of information dissemination results in sub-optimal assessment of investment
risks and serves as a deterrent for prospective investor participation.
Private placements, which form a majority of corporate bond market issues, typically require limited
disclosures to investors. This requirement for public issues is arduous in terms of information-sharing
and cost in the initial stages. Hence, to do away with information asymmetry, there is a need to shift
from private placements to public issues. The development of the rating market under Basel II norms
has expanded the flow of information to investors; however, some of the lacunae in terms of
hesitance to share information will have to be overcome to develop the market.
5.2 Credit enhancement can help bridge the gap
Credit enhancement is a reassurance given by a third party to the lender that it would honor the
lender’s obligations in case the borrower defaults. In the context of the constraints mentioned above,
the aim of credit enhancement would be to increase the rating of a typical BBB project to a level (such
as AA or even higher) that investors such as insurance companies and pension funds would be more
comfortable with.
Such a scheme, in addition to opening up alternative sources for finance, could also deepen the
fledgling Indian bond market.
Asian Development Bank
[47] TA-8279 IND: Preparing the Bond Guarantee Fund for India Market Assessment Report
5.3 Sectors that can potentially tap the bond market through
credit enhancement
5.3.1 Infrastructure
As seen in the previous chapter, the total gap in financing (long-term for entities rates less than AA)
for the infrastructure sectors over ten years would be to the tune of around INR 55 lakh crores (by
2024-25); this is a major gap which cannot be addressed by the traditional sources of finance and the
development of the bond market is essential to at least partially fund the gap.
The earlier sections took bottom-up approach to establish the need for a bond market to cater to the
large projected gap in long-term debt financing for low rated entities.
In this section, a top-down approach is used to establish the same need. This approach involves
analysis of bank loan ratings. Bank loan ratings commenced in 2007, post RBI’s guidelines on capital
adequacy for banks. As per these guidelines all bank loans greater than INR 10 crores must be rated
by a recognized credit rating agency. Analysis of a cross-section of ratings by CRISIL (which
represents 50% of the market today) reveals that around INR 3 lakh crores of bank loans in the
infrastructure sector are rated less than AA today. Adopting our earlier assumption that overall bank
credit will grow at 16%, the figure of INR 3 lakh crores would become almost INR 13 lakh crores by
2024-25.
5.3.2 Non-infrastructure
Similarly among the non-infrastructure sectors, certain sectors such as real estate development,
engineering and capital goods manufacturing, require long-term loans and subsequent funding. As of
March 2014, close to 75% of the outstanding long term bank credit to the real estate sector was rated
below AA. Similarly, close to 45% of the outstanding long-term credit to the steel manufacturing sector
was rated below AA.
Overall, around INR 6 lakh crores is rated less than AA today in the non-infrastructure sectors.
Growing this at 16% gives a figure of around INR 26 lakh crores by 2024-25.
A mechanism for credit enhancement could allow these sectors to access the bond market.
5.4 Existing credit enhancement mechanisms in India
Several credit enhancement initiatives have been announced in the recent past to encourage the flow
of funds to the infrastructure sector. No such mechanisms are available for the non-infrastructure
sector currently. An overview of these instruments and their addressable market is provided in the
following sub sections.
5.4.1 Partial Credit Guarantee Scheme (PCG)
Under the partial credit guarantee scheme, India Infrastructure Finance Company Limited (IIFCL),
supported by ADB, provides partial credit guarantee to enhance the ratings of project bond issuances
in order to enable channelization of long-term funds from the bond market towards the infrastructure
sector. By virtue of the AAA credit rating that IIFCL enjoys, the rating of the bonds can be enhanced
to a maximum of AA+ (as it is a partial credit guarantee). This mechanism is considered as a
refinancing mechanism. Only commissioned projects operating for at least six months post the
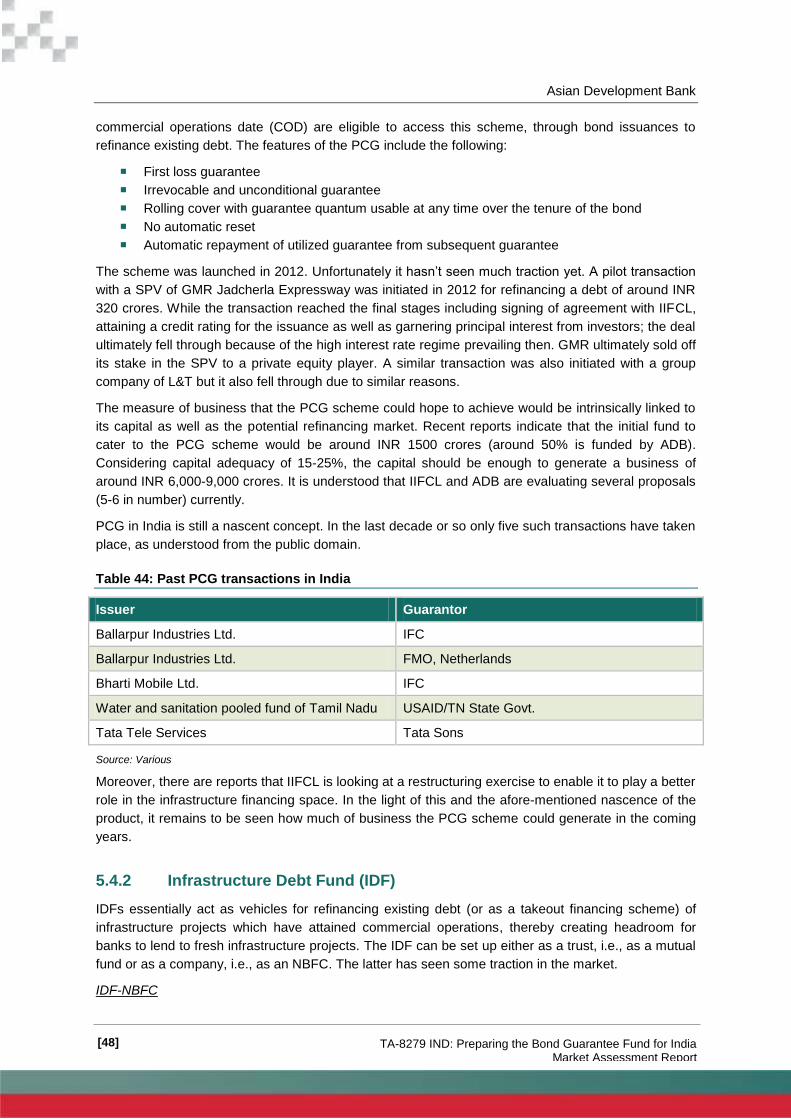
Asian Development Bank
[48] TA-8279 IND: Preparing the Bond Guarantee Fund for India Market Assessment Report
commercial operations date (COD) are eligible to access this scheme, through bond issuances to
refinance existing debt. The features of the PCG include the following:
First loss guarantee
Irrevocable and unconditional guarantee
Rolling cover with guarantee quantum usable at any time over the tenure of the bond
No automatic reset
Automatic repayment of utilized guarantee from subsequent guarantee
The scheme was launched in 2012. Unfortunately it hasn’t seen much traction yet. A pilot transaction
with a SPV of GMR Jadcherla Expressway was initiated in 2012 for refinancing a debt of around INR
320 crores. While the transaction reached the final stages including signing of agreement with IIFCL,
attaining a credit rating for the issuance as well as garnering principal interest from investors; the deal
ultimately fell through because of the high interest rate regime prevailing then. GMR ultimately sold off
its stake in the SPV to a private equity player. A similar transaction was also initiated with a group
company of L&T but it also fell through due to similar reasons.
The measure of business that the PCG scheme could hope to achieve would be intrinsically linked to
its capital as well as the potential refinancing market. Recent reports indicate that the initial fund to
cater to the PCG scheme would be around INR 1500 crores (around 50% is funded by ADB).
Considering capital adequacy of 15-25%, the capital should be enough to generate a business of
around INR 6,000-9,000 crores. It is understood that IIFCL and ADB are evaluating several proposals
(5-6 in number) currently.
PCG in India is still a nascent concept. In the last decade or so only five such transactions have taken
place, as understood from the public domain.
Table 44: Past PCG transactions in India
Issuer Guarantor
Ballarpur Industries Ltd. IFC
Ballarpur Industries Ltd. FMO, Netherlands
Bharti Mobile Ltd. IFC
Water and sanitation pooled fund of Tamil Nadu USAID/TN State Govt.
Tata Tele Services Tata Sons
Source: Various
Moreover, there are reports that IIFCL is looking at a restructuring exercise to enable it to play a better
role in the infrastructure financing space. In the light of this and the afore-mentioned nascence of the
product, it remains to be seen how much of business the PCG scheme could generate in the coming
years.
5.4.2 Infrastructure Debt Fund (IDF)
IDFs essentially act as vehicles for refinancing existing debt (or as a takeout financing scheme) of
infrastructure projects which have attained commercial operations, thereby creating headroom for
banks to lend to fresh infrastructure projects. The IDF can be set up either as a trust, i.e., as a mutual
fund or as a company, i.e., as an NBFC. The latter has seen some traction in the market.
IDF-NBFC
Asian Development Bank
[49] TA-8279 IND: Preparing the Bond Guarantee Fund for India Market Assessment Report
These IDFs commenced operations about a year back, and target to take over loans for projects
created through the PPP route. The project or the concessionaire will issue bonds to raise funds from
the IDF. The take-over or refinancing would be governed by the tripartite agreement between the IDF,
the concessionaire and the project authority, to ensure a compulsory buyout with termination payment
in the event of a default in repayment by the concessionaire. The tripartite agreement binds all the
parties collectively and aids credit enhancement. Model tripartite agreements for the road sector as
well as the port sector have been finalized and approved by the Government of India.
Two IDF-NBFCs are operational:
India Infradebt Ltd. formed by ICICI Bank, Bank of Baroda, Citicorp Finance (India) Ltd. and
LIC. The entity has undertaken its first sanction to Himalayan Expressway Limited.
L&T Infra Debt Fund formed by L&T Infra Finance and other companies in the L&T group
While India Infradebt has raised INR 300 crores in the market the latter L&T Infra debt has raised INR
250 crores. India Infradebt has signed its first transaction (less than INR 50 crores as per information
received through interactions). Interactions reveal that these funds are finding it tough to find
adequate assets in the market; the primary reason being that banks today are not willing to sell off
their existing assets which have been commissioned as their perception is that risks in these projects
reduce considerably post commissioning. Discussions are also underway to possibly do away with the
tripartite agreement which currently adds much complexity to the concept – however, it remains to be
seen how the credit enhancement would then be achieved without the tripartite agreement.
IDF-MF
Three IDFs have been set up through the mutual fund route by IL&FS (~INR 720 crores AUM), IIFCL
(~INR 300 crores AUM) and SREI. The investment guidelines of these IDFs mention that at least 90%
of the AUM should be invested in infrastructure companies or infrastructure projects/SPVs or banks
loans in terms of completed and revenue generating projects or public finance institutions or
infrastructure finance companies. Today, while mutual funds are technically allowed to invest till
investment grade (BBB), there are hardly any investments below AA (as seen in the earlier chapter).
Therefore, the appetite of these funds for investment in infrastructure sector is questionable.
Moreover, their ability to raise resources/funds remains to be seen.
5.4.3 Credit enhancement by banks
On May 20, 2014, RBI had issued a draft circular allowing banks to provide partial credit
enhancements to bonds issued for funding infrastructure projects by companies/SPVs. This draft
circular is open for public comments. Brief particulars of the scheme are as follow:
Mechanism of providing credit enhancement to the bonds issued by infrastructure
project/SPV is to separate the debt of the project company into senior and subordinate
tranches
Banks will provide subordinate debt either in the form of a loan or contingent facility
Partial credit enhancement shall be limited to the extent of improving the credit rating of
bonds by maximum of 2 notches or 20% of the entire bond issue whichever is lower
RBI has invited comments from market stakeholders. Our internal understanding, as well as
supplemented by external interactions, is that the scheme in the current form will find it difficult to get
much traction due to the following reasons.
Most infrastructure projects are rated below A. The credit enhancement restrictions imposed
in this scheme currently, would not be enough to credit enhance the bond issuance to AA

Asian Development Bank
[50] TA-8279 IND: Preparing the Bond Guarantee Fund for India Market Assessment Report
In light of the recent initiatives to make long term financing more attractive – both on liabilities
side (through issuance of long term bonds) and assets side (flexibility in structuring), it
remains to be seen if banks would cater to credit enhancement which has not been a
traditional focus
A prohibitory capital requirement and risk weight has been imposed
There is undoubtedly intent by the Government and the regulators to develop the bond market,
especially for the infrastructure sector. However the viability of the afore-mentioned schemes is yet to
be established. Even if for a moment, we assume that the schemes are viable the gap presented in
Section 4.3 is just too large for these three schemes to address. A concept such as BGFI is therefore
worth exploring.
Asian Development Bank
[51] TA-8279 IND: Preparing the Bond Guarantee Fund for India Market Assessment Report
6. Initial Thoughts on Bond Guarantee Fund for
India and Next Steps
6.1 Stakeholder’s initial inputs on BGFI
As seen in Chapter 4, the total gap in long-term debt financing that entities (rated less than AA) in
infrastructure sector and non-infrastructure sector are projected to witness is around INR 60 lakh
crores and INR 35 lakh crores respectively. Also as seen in Chapter 5, the existing credit
enhancement mechanisms which are present only in the infrastructure sector today will be able to
address only a minimal portion of the afore-mentioned gap. Therefore, a portion of virtually the entire
gap could be addressed by BGFI – thereby establishing a potential market and a business case.
CRIS has also undertaken interactions with a cross-section of stakeholders (41 individuals across 27
entities) – government/ministry entities, regulators, investors, borrowers and banks amongst others to
get their perspectives on this concept and their inputs on some of the key issues (given below) that
were highlighted in the inception report. These would serve as inputs in the next stage pertaining to
assessment of financial viability and actual structuring of the entity.
Who will own the entity?
What will be the legal structure of the entity/Who will regulate the entity?
What will be its business model, product offerings and associated structuring/pricing
mechanisms?
What are the institutional and process frameworks that need to be in place?
How does one promote the marketability and acceptability of the product?
The details of the people met are given in Annexure 1, while the summary of the discussions held is
given below.
1. Overall concept – Unanimous approval was received for the concept. It was agreed that a
credit enhancement mechanism was required to kick start the bond market in India, especially
in the light of the lack of low rated bonds and the investment restrictions on bond investors.
2. Ownership – Again the unanimous single opinion was that the entity should be owned and
capitalized such that it is AAA rated. Such a rating would be crucial to achieve the desired
amount of credit enhancement either through partial guarantee or full guarantee. However,
when it came to the question of who should own the entity, there was diversity in opinions –
majority government holding (as great as 100%) at one end to majority private sector holding
(as great as 100%) on the other. The pros and cons of both the extremes were discussed
a. Majority government holding – While participation by the government would lend
credibility to the concept amongst investors and other stakeholders, a majority stake
by the government could result in slow decision-making process, decreased
efficiency, inability to attract the right set of private sector management, and on a
generic level – perhaps a moral hazard (due to involvement by the government,
stakeholders would expect a bailout by the government in case of any issue).
b. Majority private sector holding – While participation by the private sector would bring
in requisite skill sets in terms of credit appraisal skills and robust
Asian Development Bank
[52] TA-8279 IND: Preparing the Bond Guarantee Fund for India Market Assessment Report
processes/frameworks, acceptability of such an ownership might be an issue at least
in the initial stages, with regards to creditworthiness, especially with investors.
The consensus seemed to be that the entity should have a judicious amount of government
ownership but have majority private sector ownership – to promote acceptability as well as to
ensure that the entity is run by professionally appointed management
a. It should be noted that, in the absence of a government majority ownership it might
not be possible to have a single majority shareholder. A widely held structure could
be explored possibly on the lines of IDFC
Stakeholders such as banks, insurance companies are willing to explore taking
up a share in the capital to help set up the entity
b. IDFC when it was set up had the following structure – 35% held by the government,
5% by the Industrial Development Bank of India (IDBI), 40% by foreign investors
including multilateral institutions and 20% by domestic institutions and banks.
Representatives from each bucket of investors were present on the Board of the
company. Representation from the government ensured easy access to various
stakeholders and forums within the government which was crucial at the development
stage of IDFC. This kind of a commitment from government would be required at
least during the initial stage of BGFI too.
3. Capital – The entity should be sufficiently capitalized such that it attains a credit rating of AAA.
The capital could take several forms like
a. Direct infusion by various investors
b. Callable capital
The government could also participate in the form of a long-term subordinate debt. IDFC has
a 50-year subordinate debt from the government amounting to almost INR 650 crores.
4. Legal structure – The entity is meant to be a pure guarantee company. While the operations
of such an entity do not fall strictly under the ambit of current regulated structures, the
feasibility of structuring the entity along the following lines should be explored
a. As a NBFC under RBI – The nine types of NBFCs regulated by RBI are - i) Asset
finance companies, ii) Investment companies, iii) Loan finance companies, iv)
Infrastructure finance companies, v) Core investment company, vi) Infrastructure debt
fund NBFC, vii) NBFC – Factors, viii) NBFC – Microfinance Institution and ix) Non-
operative financial holding company. Technically a guarantee company does not
strictly belong to any of the afore-mentioned types. A new form of NBFC might then
need to be considered. A point to keep in mind is that RBI has stringent guidelines
when it comes to capital adequacy and exposure limits. These might need to be
relaxed for such an entity.
Another structure that could be studied is the recent Mortgage Guarantee
Corporation, guidelines of which were released by RBI recently. Indian Mortgage
Guarantee Corporation, the first of its kind, started operations last year.
b. As a bond insurance company under IRDA – The entity could be structured akin to a
mono line insurer or a bond insurance company or a bond guarantee company. IRDA
today does not have explicit regulations governing such an operating model currently.
Therefore a fresh set of regulations would need to be explored.
Asian Development Bank
[53] TA-8279 IND: Preparing the Bond Guarantee Fund for India Market Assessment Report
c. As an entity under a special act or statute under the Government – This would not be
preferable as it would mean that the entity would be Government owned.
d. As a public financial institution – Section 4A in the Companies Act established the
definition of Public Finance Institutions (PFIs). This applies to only those entities
which are established under a Special Act or a Central Act, operational for at least 3
years and have 51% ownership by the Government. Therefore, it may not be feasible
for BGFI to be set up as a PFI
e. Other legal considerations – The key regulations governing issuance and listing of
bonds in India are covered by SEBI. Moreover the Companies Act and the Indian
Contract Act will cover issuances through public issues, private placement as well as
issuances of guarantees.
5. Business model – The entity should be self-sustaining, i.e able to sustain on its own
revenues. Moreover the entity should be only in the business of providing guarantees (and
not undertake any other activities) so that its objective is not diluted
a. Products – BGFI can essentially provide credit enhancement either through a full
guarantee or a partial guarantee. Assuming BGFI’s credit rating is AAA, in the former,
the target rating achieved for the issue would be AAA while for the latter the target
rating achieved would be maximum AA+. As seen earlier the partial guarantee as a
concept is nascent in India with just a handful of such transactions having been made
in the last decade. It might therefore be prudent to employ a mix of full and partial
guarantees at the start, to establish credibility and acceptability for the products.
However, it should be noted that the demand for a full guarantee/partial guarantee
would be linked to a cost-benefit analysis at the issuer’s end.
b. Source Rating – As mentioned earlier, BGFI would target entities rated less than AA
category. It might be prudent to target the higher rated (amongst these) such as A
and BBB to begin with and as pilot transactions; as analysed in Chapter 4, a
significant portion of debt requirement below AA pertains to entities rated in the A and
BBB categories.
c. Target Rating – Related to point a) above, it might be advisable to credit enhance the
pilot transactions to AA+/AAA to promote acceptability in the market.
d. Pricing – Pricing of such an instrument would be critical; the prospective savings in a
long tenure bond instrument could potentially attract the traditionally bank-funded
firms. 10-year bond spreads for BBB, A and AA bonds are shown in the figure below.
As can be seen, borrowers issuing A and BBB bonds can expect a gross saving of
100 to 250 basis points. The net savings would be lower, adjusted for guarantee fees,
liquidity premium, processing charges etc.
Today the 10-year government bond rate is traded at a yield of around 8.50-8.75%.
AA spreads are around 110 basis points, so a standalone AA bond would be priced at
around 9.60-9.90%. Investors in a credit-enhanced issue would demand a liquidity
premium of 50-75 basis points, pushing the cost of the AA (so) bond beyond 10%.
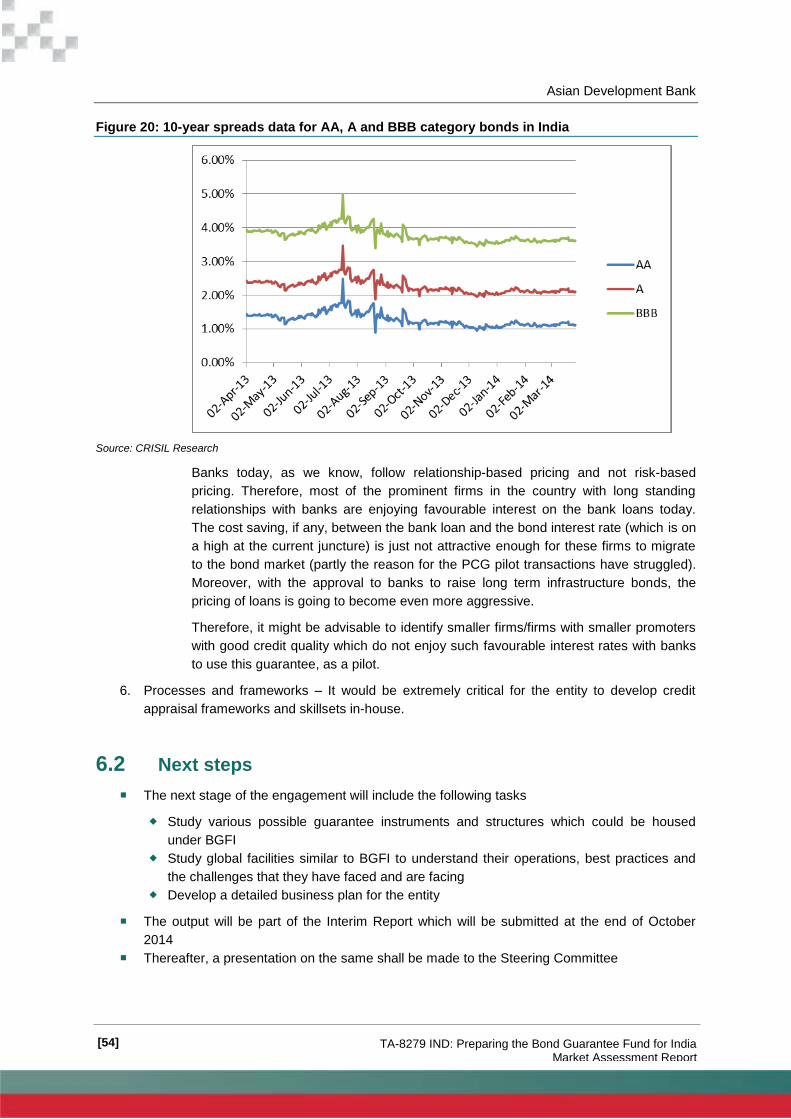
Asian Development Bank
[54] TA-8279 IND: Preparing the Bond Guarantee Fund for India Market Assessment Report
Figure 20: 10-year spreads data for AA, A and BBB category bonds in India
Source: CRISIL Research
Banks today, as we know, follow relationship-based pricing and not risk-based
pricing. Therefore, most of the prominent firms in the country with long standing
relationships with banks are enjoying favourable interest on the bank loans today.
The cost saving, if any, between the bank loan and the bond interest rate (which is on
a high at the current juncture) is just not attractive enough for these firms to migrate
to the bond market (partly the reason for the PCG pilot transactions have struggled).
Moreover, with the approval to banks to raise long term infrastructure bonds, the
pricing of loans is going to become even more aggressive.
Therefore, it might be advisable to identify smaller firms/firms with smaller promoters
with good credit quality which do not enjoy such favourable interest rates with banks
to use this guarantee, as a pilot.
6. Processes and frameworks – It would be extremely critical for the entity to develop credit
appraisal frameworks and skillsets in-house.
6.2 Next steps
The next stage of the engagement will include the following tasks
Study various possible guarantee instruments and structures which could be housed
under BGFI
Study global facilities similar to BGFI to understand their operations, best practices and
the challenges that they have faced and are facing
Develop a detailed business plan for the entity
The output will be part of the Interim Report which will be submitted at the end of October
2014
Thereafter, a presentation on the same shall be made to the Steering Committee
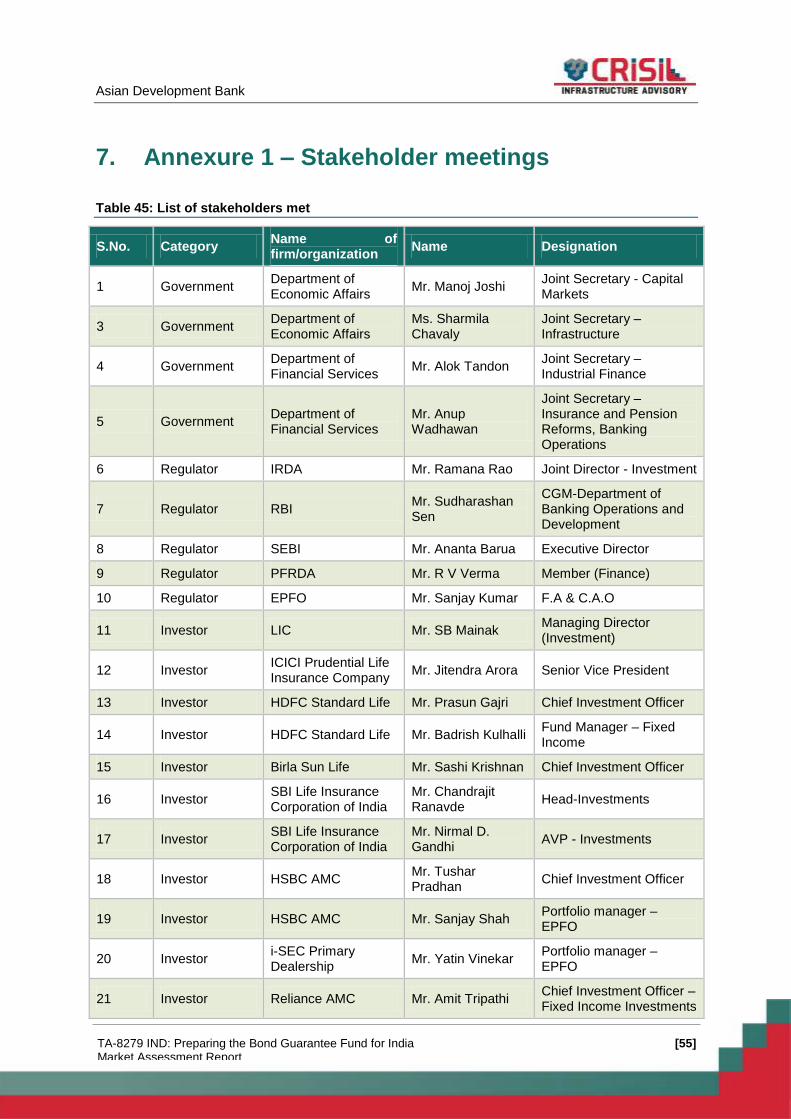
Asian Development Bank
[55] TA-8279 IND: Preparing the Bond Guarantee Fund for India Market Assessment Report
7. Annexure 1 – Stakeholder meetings
Table 45: List of stakeholders met
S.No. Category Name of firm/organization
Name Designation
1 Government Department of Economic Affairs
Mr. Manoj Joshi Joint Secretary - Capital Markets
3 Government Department of Economic Affairs
Ms. Sharmila Chavaly
Joint Secretary – Infrastructure
4 Government Department of Financial Services
Mr. Alok Tandon Joint Secretary – Industrial Finance
5 Government Department of Financial Services
Mr. Anup Wadhawan
Joint Secretary – Insurance and Pension Reforms, Banking Operations
6 Regulator IRDA Mr. Ramana Rao Joint Director - Investment
7 Regulator RBI Mr. Sudharashan Sen
CGM-Department of Banking Operations and Development
8 Regulator SEBI Mr. Ananta Barua Executive Director
9 Regulator PFRDA Mr. R V Verma Member (Finance)
10 Regulator EPFO Mr. Sanjay Kumar F.A & C.A.O
11 Investor LIC Mr. SB Mainak Managing Director (Investment)
12 Investor ICICI Prudential Life Insurance Company
Mr. Jitendra Arora Senior Vice President
13 Investor HDFC Standard Life Mr. Prasun Gajri Chief Investment Officer
14 Investor HDFC Standard Life Mr. Badrish Kulhalli Fund Manager – Fixed Income
15 Investor Birla Sun Life Mr. Sashi Krishnan Chief Investment Officer
16 Investor SBI Life Insurance Corporation of India
Mr. Chandrajit Ranavde
Head-Investments
17 Investor SBI Life Insurance Corporation of India
Mr. Nirmal D. Gandhi
AVP - Investments
18 Investor HSBC AMC Mr. Tushar Pradhan
Chief Investment Officer
19 Investor HSBC AMC Mr. Sanjay Shah Portfolio manager – EPFO
20 Investor i-SEC Primary Dealership
Mr. Yatin Vinekar Portfolio manager – EPFO
21 Investor Reliance AMC Mr. Amit Tripathi Chief Investment Officer – Fixed Income Investments
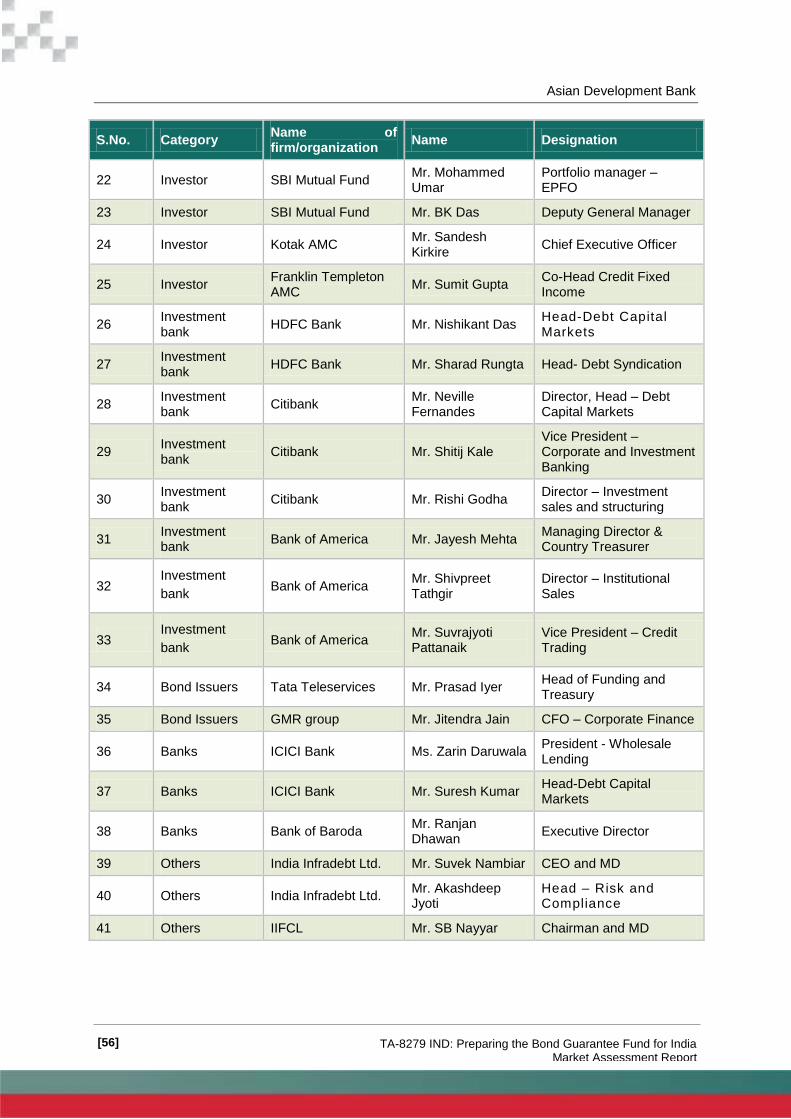
Asian Development Bank
[56] TA-8279 IND: Preparing the Bond Guarantee Fund for India Market Assessment Report
S.No. Category Name of firm/organization
Name Designation
22 Investor SBI Mutual Fund Mr. Mohammed Umar
Portfolio manager – EPFO
23 Investor SBI Mutual Fund Mr. BK Das Deputy General Manager
24 Investor Kotak AMC Mr. Sandesh Kirkire
Chief Executive Officer
25 Investor Franklin Templeton AMC
Mr. Sumit Gupta Co-Head Credit Fixed Income
26 Investment bank
HDFC Bank Mr. Nishikant Das Head-Debt Capital Markets
27 Investment bank
HDFC Bank Mr. Sharad Rungta Head- Debt Syndication
28 Investment bank
Citibank Mr. Neville Fernandes
Director, Head – Debt Capital Markets
29 Investment bank
Citibank Mr. Shitij Kale Vice President – Corporate and Investment Banking
30 Investment bank
Citibank Mr. Rishi Godha Director – Investment sales and structuring
31 Investment bank
Bank of America Mr. Jayesh Mehta Managing Director & Country Treasurer
32 Investment
bank Bank of America
Mr. Shivpreet Tathgir
Director – Institutional Sales
33 Investment
bank Bank of America
Mr. Suvrajyoti Pattanaik
Vice President – Credit Trading
34 Bond Issuers Tata Teleservices Mr. Prasad Iyer Head of Funding and Treasury
35 Bond Issuers GMR group Mr. Jitendra Jain CFO – Corporate Finance
36 Banks ICICI Bank Ms. Zarin Daruwala President - Wholesale Lending
37 Banks ICICI Bank Mr. Suresh Kumar Head-Debt Capital Markets
38 Banks Bank of Baroda Mr. Ranjan Dhawan
Executive Director
39 Others India Infradebt Ltd. Mr. Suvek Nambiar CEO and MD
40 Others India Infradebt Ltd. Mr. Akashdeep Jyoti
Head – Risk and Compliance
41 Others IIFCL Mr. SB Nayyar Chairman and MD


Asian Development Bank
[b]
Disclaimer
CRISIL Risk and Infrastructure Solutions Limited (CRIS) has taken due care and caution in preparation of this Report for Asian
Development Bank. This Report is based on the information / documents provided by the Company and/or information
available publicly and/or obtained by CRIS from sources, which it considers reliable. CRIS does not guarantee the accuracy,
adequacy or completeness of the information / documents / Report and is not responsible for any errors or omissions, or for the
results obtained from the use of the same. The Report and results stated therein are subject to change. CRIS especially states
that it has no financial liability whatsoever to the Company / users of this Report. This Report is strictly confidential and should
not be reproduced or redistributed or communicated directly or indirectly in any form or published or copied in whole or in part,
especially outside India, for any purpose.

Our Offices / Contact us:
Registered Office – Mumbai
CRISIL House, Central Avenue,
Hiranandani Business Park,
Powai, Mumbai- 400 076
Phone : 91-22-3342 3000
Fax : 91-22-3342 1830
New Delhi
Plot No. 46 (Opposite Provident
Fund Office),
Sector 44, Gurgaon 122 003,
Haryana, India
Phone : 91-124-672 2000
Fax : 91-124-672 2495
Hyderabad
3rd Floor, Uma Chambers
Plot No. 9&10, Nagarjuna Hills,
Near Punjagutta Cross Road
Hyderabad - 500 082
Phone : 91-40-40328200
Fax : 91-40-2335 7507
Bengaluru
W-101, Sunrise Chambers,
22, Ulsoor Road,
Bengaluru - 560 042
Phone : 91-80-2558 0899
Fax : 91-80-2559 4801
Ahmedabad
706, Venus Atlantis,
Near Reliance Petrol Pump
Prahladnagar, Ahmedabad - 380 015
Phone : 91-79-4024 4500
Fax : 91-79-2755 9863
Visit us at:
www.crisil.com
About CRISIL Infrastructure Advisory
CRISIL Infrastructure Advisory is a division of CRISIL Risk and Infrastructure Solutions Limited, a 100% subsidiary of CRISIL Limited – India’s leading
Ratings, Research, Risk and Policy Advisory Company.
CRISIL Infrastructure Advisory is India’s premier advisor focusing on policy issues, as well as commercial and contractual issues in the areas of
transport, energy and urban infrastructure. We also provide support to international firms planning investments in India. Over a period of time, CRISIL
Infrastructure Advisory has built a unique position for itself in these domains and is considered the preferred consultant by governments, multilateral
agencies and private-sector clients. We have extended our operations beyond India and are present in other emerging markets in Africa, Middle East
and South Asia.
CRISIL Limited CRISIL House, Central Avenue, Hiranandani Business Park, Powai, Mumbai – 400076. India Phone: + 91 22 3342 3000 Fax: + 91 22 3342 1830 www.crisil.com
LinkedIn YouTube Facebook Stay Connected | | | | Twitter
CRISIL Ltd is a Standard & Poor's company

![Download [2.96 MB]](https://static.fdocuments.net/doc/165x107/5873c7231a28ab29048c054c/download-296-mb.jpg)


![Download [12.78 MB]](https://static.fdocuments.net/doc/165x107/58904f861a28abd74c8b6127/download-1278-mb.jpg)


![Download [1.24 MB]](https://static.fdocuments.net/doc/165x107/588869d21a28abc6518b5b6f/download-124-mb.jpg)