Down, but not out - The Tungsten Market in Europe · PDF filefrom the Euro zone financial...
13
Tungsten Market Europe www.hcstarck.com www.hcstarck.com Slide 1 Insert title here Technology Metals I Advanced Ceramics Down, but not out - The Tungsten Market in Europe ITIA – 26 th Annual General Meeting, Sydney Kurt Wandaller, Gunnar Kunz 24. Sep. 2013
Transcript of Down, but not out - The Tungsten Market in Europe · PDF filefrom the Euro zone financial...
Tungsten Market Europe
www.hcstarck.com www.hcstarck.com Slide 1
Insert title here
Technology Metals I Advanced Ceramics
Down, but not out - The Tungsten Market in Europe ITIA – 26th Annual General Meeting, Sydney Kurt Wandaller, Gunnar Kunz 24. Sep. 2013

Tungsten Market Europe
www.hcstarck.com www.hcstarck.com
Europe Economy Outlook
Slide 2
• The Euro zone remains in recession with GDP is forecast to shrink by -0.4% in 2013 (after -0.6% in 2012).
• Although leading indicators signal improvement, it will take time to feed through to the real economy.
• There is a severe disparity between northern & southern EU countries in terms of economic performance & unemployment rates
• In 2013 external demand is the main driver for economic stabilization. Domestic demand is held back by the impact of deleveraging in the private & public sector
• By 2014 domestic demand will be taking over as main demand driver.
• EU economic recovery may still take >5 years on back of an improving global economy.
EU economy bottoming out…
Source: European Union 2013 / The Economist / RBS market insight
Quarterly GDP Growth, EU and Euro Area ~ q-o-q% ~
Employment Growth and Unemployment Rate, EU ~ % of labour force ~
Euro Area EU
Unemployment rate Employment

Tungsten Market Europe
www.hcstarck.com www.hcstarck.com
Tungsten Consumption in Europe
Slide 3
~ 85% of European Tungsten Consumption
A fistful of countries consume about 85% of Europe‘s Tungsten consumption.
Euro area
Currency pegged to Euro
Floating currency
Sweden
UK
Austria
France
Germany
Luxembourg
Italy
Tungsten Market Europe
www.hcstarck.com www.hcstarck.com
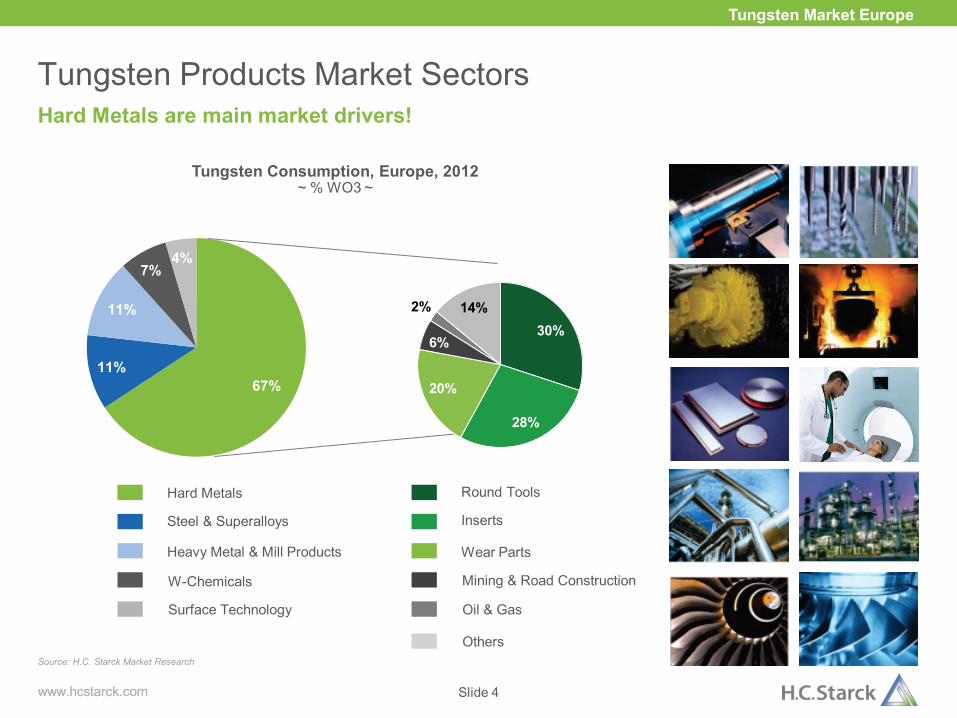
Tungsten Products Market Sectors
Slide 4
Tungsten Consumption, Europe, 2012 ~ % WO3 ~
Hard Metals
Steel & Superalloys
W-Chemicals
Heavy Metal & Mill Products
Hard Metals are main market drivers!
Source: H.C. Starck Market Research
Surface Technology
67%11%
11%
4%7%
30%
28%
20%
6%
2% 14%
Round Tools
Inserts
Mining & Road Construction
Wear Parts
Oil & Gas
Others

Tungsten Market Europe
www.hcstarck.com www.hcstarck.com Slide 5
Automotive Industry
Energy Industry
Industrial Engineering
Special Steel Industry
Mining & Road Construction
Tungsten End Market Drivers
0
20
40
60
80
10 0
12 0
14 0
0
20
40
60
80
10 0
12 0
14 0
20 06 20 07 20 08 20 09 20 10 20 11 20 12 20 13 20 14 20 15 20 16 20 17 20 18
31,400
17,300
26,900
31,300
29,000 29,300 29,800
30,800 31,800
32,900 34,000
21,700
10,900
19,300
21,700
19,200 19,200 19,400 20,100 20,800 21,500 22,300
3,800
2,100
2,500
3,200
3,300 3,300 3,400 3,500
3,600 3,700
3,700
2,600
2,000
2,500
3,100
3,200 3,300 3,500 3,600
3,700 3,800
3,900
2,000
1,400
1,600
2,000
2,100 2,100 2,200
2,300 2,400
2,400 2,500
1,200
900
1,000
1,200
1,200 1,300 1,300
1,400 1,400
1,500 1,500
0
5,0 00
10 ,000
15 ,000
20 ,000
25 ,000
30 ,000
35 ,000
40 ,000
0
5,0 00
10 ,000
15 ,000
20 ,000
25 ,000
30 ,000
35 ,000
40 ,000
20 08 20 09 20 10 20 11 20 12 20 13 20 14 20 15 20 16 20 17 20 18
19,950
17,348
15,784
16,614
18,096
19,722
22,679
24,430
16,861 16,625
19,842
0
22,725
20 01 20 02 20 03 20 04 20 05 20 06 20 07 20 08 20 09 20 10 20 11 20 12 20 13
196185
210204
163 164 167 174185
52 52 49 50 50 50 5135 40
17 16 15 13 14 1410 10
52 53 58 63 72 79 89100
110
23 23 23 2427
2829
2025
13 13 1314
1314
10
12
7 8 88
1013
15
10
13
16
14
2002 2003 2004 2005 2006 2007 2008 2009 2010
Presenter
Presentation Notes
Tungsten end market index, developed based on development and split of major underlying end markets.

Tungsten Market Europe
www.hcstarck.com www.hcstarck.com
End Markets – Automotive Global
Slide 6
Source: PwC Autofacts (2006-2013)
Global Light Vehicle Assembly, 2006 - 2018 ~ million units ~
European Union East Europe, incl. Russia China Japan, Korea, Taiwan
India ASEAN Middle East Africa NAFTA
Capacity Utilization Rate
South America Excess Capacity
0
20
40
60
80
100
120
140
0
20
40
60
80
100
120
140
2006 2007 2008 2009 2010 2011 2012 2013 2014 2015 2016 2017 2018
71.5 74.7 79.2 80.9 86.7
93.2 98 101 105.1
65.2 69.0 66.0 57.6
81% 83%
76%
67%
79% 78% 77% 75% 76%
78% 80%
82% 82%
50%
55%
60%
65%
70%
75%
80%
85%
90%
• For 2013 global car assembly is forecasted as 81mio units, +2% YoY. Main growth markets are China & NAFTA, while EU & Japan are shrinking.
• In 2018 global car assembly is fore-casted as 105mio units, however, with downside risks of up to -15%
• The majority of growth contribution comes from emerging markets (China, India) with increasing urbanization & growing middle-class.
• China’s forecast was downgraded early 2013, but in recent months the GDP y-o-y again rose above 7%.
• The European union is stuck in a financial crisis.
• North America sees continuous growth on back of economic recovery.
• For Japan the long-term trend of assembly-localization to current end markets continues.
Tungsten Market Europe
www.hcstarck.com www.hcstarck.com
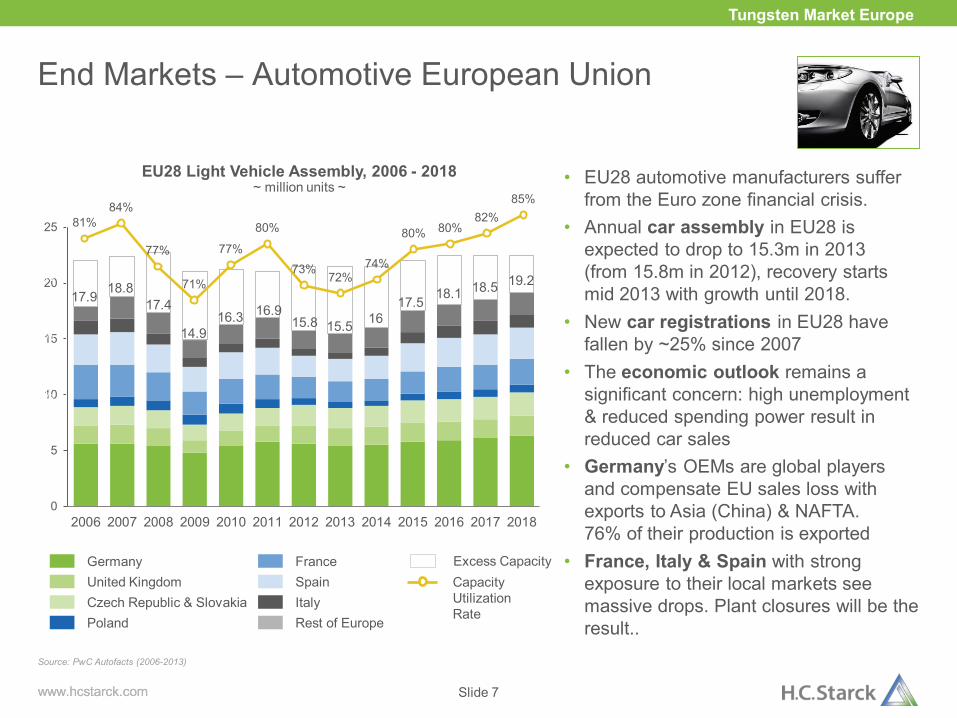
End Markets – Automotive European Union
Slide 7
• EU28 automotive manufacturers suffer from the Euro zone financial crisis.
• Annual car assembly in EU28 is expected to drop to 15.3m in 2013 (from 15.8m in 2012), recovery starts mid 2013 with growth until 2018.
• New car registrations in EU28 have fallen by ~25% since 2007
• The economic outlook remains a significant concern: high unemployment & reduced spending power result in reduced car sales
• Germany’s OEMs are global players and compensate EU sales loss with exports to Asia (China) & NAFTA. 76% of their production is exported
• France, Italy & Spain with strong exposure to their local markets see massive drops. Plant closures will be the result..
Source: PwC Autofacts (2006-2013)
Germany United Kingdom Czech Republic & Slovakia Poland
France Spain Italy Rest of Europe
Capacity Utilization Rate
EU28 Light Vehicle Assembly, 2006 - 2018 ~ million units ~
Excess Capacity
0
5
10
15
20
25
0
5
10
15
20
25
2006 2007 2008 2009 2010 2011 2012 2013 2014 2015 2016 2017 2018
81% 84%
77%
71%
77%
80%
73% 72%
74%
80% 80% 82%
85%
50%
55%
60%
65%
70%
75%
80%
85%
90%
18.8 17.4
14.9
17.9 16
17.5 18.1 18.5 19.2
16.3 15.5
16.9 15.8

Tungsten Market Europe
www.hcstarck.com www.hcstarck.com
Demand for Construction and Mining Equipment by Region ~ units ~
End Markets – Mining & Road Construction
Slide 8
• Europe’s Mining Activity had already it’s peak in the 19th century.
• There’s a ongoing shift of mining locations & road construction works from developed to under-developed countries.
• However, there’s high global demand for mining equipment industry manufactured in Europe.
• Main demand growth happens in China, South East Asian (Indonesia), Latin America and Australia against the backdrop of booming resources development.
• In 2011 there was a strong rise in demand mainly to replace aging equipment.
• Growth prospects of 7-8% in the coming years.
Sources: ICMM (10/2012) / Komatsu Annual Report 2012
Location of World Mining Regions, 1850 to Present ~ % of world mining ~
Europe
North America
Japan
China
Others
Europe USA China USSR / CIS AU & CA
CL, BR, PR, SA, DRC

Tungsten Market Europe
www.hcstarck.com www.hcstarck.com
End Markets – Europe Machine Tools Industry
Slide 9
• European Machine Tools are highly competitive at the world market • The industry sees slowing growth: in 2012 EU demand contracted by 2%, while exports to non-EU grew by 9% • There is an increasing dependence on exports: > 60% of production is exported to Asia(China), USA & Russia • In H1 2013 exports to Asia (China) slowed by 10%, indicating that China’s industrial growth peak might be over • Restoring growth in the Europe domestic market will be vital for securing the future of the MT industry.
Global Machine Tools Production Share, 2012
Source: CECIMO European Machine Tools Industry
19,950
17,348 15,784 16,614
18,096 19,722
22,679 24,430
16,861 16,625
19,842
22,725
2001 2002 2003 2004 2005 2006 2007 2008 2009 2010 2011 2012 2013
Europe Machine Tools Production, 2001 – 2013 ~ million Euro ~
Germany Italy Switzerland
Spain Austria France
UK Czech Republic Turkey
TOTAL
EU 28, 31%
China, 30%
Japan, 20%
South Korea,
6%
Taiwan, 5%
USA, 4% Brazil, 1% Others, 2%
48%
19%
11%
22%
others
22.594

Tungsten Market Europe
www.hcstarck.com www.hcstarck.com
End Markets – Energy
Slide 10
• The EU produces just 48% of it’s energy needs, the rest is imported.
• The import dependency on fossil fuel is for oil 84%, gas 62% & coal 58%.
• The EU energy production declined by 13% over the last 20 years – less coal mined in Germany and North Sea oil&gas is depleting.
• The production of renewable energies rose by 110% in the same period.
• 2/3 of energy production comes from 5 EU states: - UK: Oil & Gas - France: Nuclear - Germany & Poland: Coal - Netherlands: Gas
• There is an expected shale gas boom in UK & Poland that will change the energy landscape and open new potentials for hard metal manufacturers. Source: Eurostat (08/2013) / European Commission Market Observation for Energy (2011)
213 211 209 208 200 195 191 185 177 165 163 166
173 161 166 156 145 133 121 120 112 105 97 85
208 208 204 200 203 189 179 167 168 153 156 140
244 253 256 257 260 258 255 241 242
231 237 234
96 100 97 104 112 116 123 134 142 149 167 162
2000 2001 2002 2003 2004 2005 2006 2007 2008 2009 2010 2011
Energy Production in the EU28 ~ million tons of oil equivalent ~
Coal Oil Gas
Nuclear Renewables
Presenter
Presentation Notes
The Oil & Gas industry also suffered from declining economic and industrial growth. In 2009 major oil companies delayed or canceled planned investments in increasing or sustaining production.

Tungsten Market Europe
www.hcstarck.com www.hcstarck.com
End Markets – Special Steel Industry
• Europe remains an important location for special steel production.
• Germany + Sweden account for 94% of Europe’s demand and 40% of world production.
• Between 2002 - 2010 China showed the highest growth rates.
• Tungsten is added to steel in form of FeW. Different types of tool steel contain 1 – 20% W.
• China & Vietnam are the main suppliers of FeW to the European Tool Steel Industry.
Slide 11
Source: Roskill (2011)
Special Steel Industry – a profitable business in Europe!
High Speed Steel Production by Region ~ thousand tons ~
196185
210204
163 164 167 174185
52 52 49 50 50 50 5135 40
17 16 15 13 14 1410 10
52 53 58 63 72 79 89100
110
23 23 23 2427
2829
2025
13 13 1314
1314
10
12
7 8 88
1013
15
10
13
16
14
2002 2003 2004 2005 2006 2007 2008 2009 2010
China USA Europe
Others CIS Other Asia
Presenter
Presentation Notes
In 2009 global steel production dropped by 8%, making the decline by far the biggest in the industry since the end of the second world war.
Tungsten Market Europe
www.hcstarck.com www.hcstarck.com
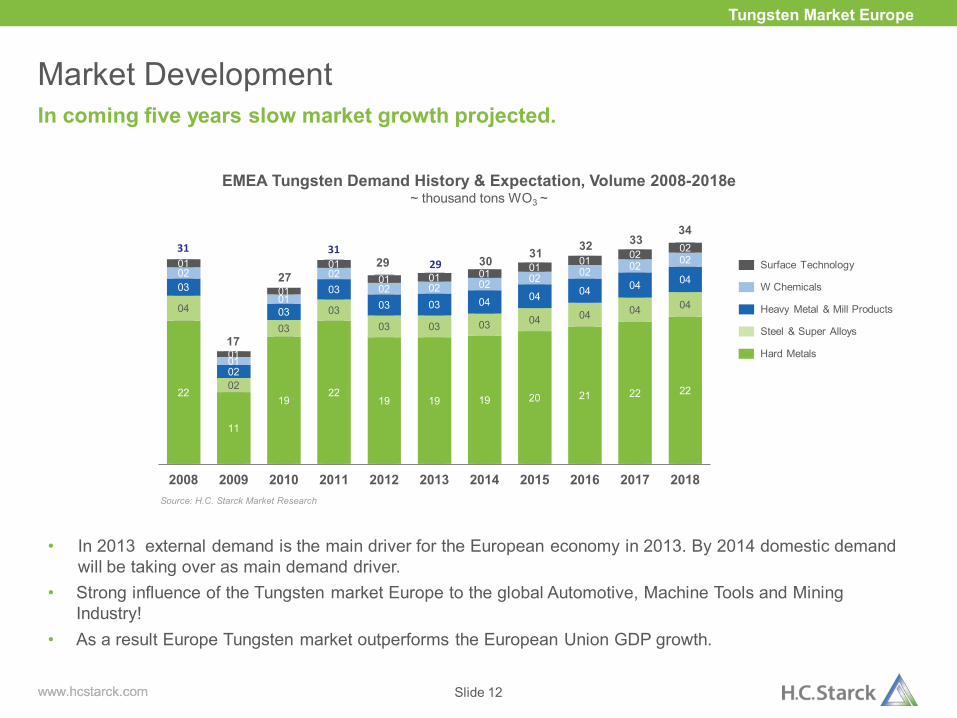
Market Development
Slide 12
In coming five years slow market growth projected.
• In 2013 external demand is the main driver for the European economy in 2013. By 2014 domestic demand will be taking over as main demand driver.
• Strong influence of the Tungsten market Europe to the global Automotive, Machine Tools and Mining Industry!
• As a result Europe Tungsten market outperforms the European Union GDP growth.
Source: H.C. Starck Market Research
EMEA Tungsten Demand History & Expectation, Volume 2008-2018e ~ thousand tons WO3 ~
Hard Metals
Surface Technology
W Chemicals
Steel & Super Alloys
Heavy Metal & Mill Products
31
17
27
31 29 29 30 31 32 33
34
22
11
19 22
19 19 19 20 21 22 22
04
02
03
03 03 03 03 04 04 04 04
03
02
03
03 03 03 04 04 04 04 04 02
01
01
02 02 02 02 02 02 02 02 01
01
01
01 01 01 01 01 01 02 02
0
5
10
15
20
25
30
35
40
2008 2009 2010 2011 2012 2013 2014 2015 2016 2017 2018

Tungsten Market Europe
www.hcstarck.com www.hcstarck.com Slide 13
Thank you for your attention!
Kurt Wandaller Senior Vice President
Business Line Tungsten Landberger Str. 94-98, 80339 Munich Germany / European Community T +49 89 5009 42 0 F +49 89 5009 42 499