DOTC*MMDA*DPWH*NEDA*PNP-NCR*HUDCC*UP-NCTS*EMB …open_jicareport.jica.go.jp/pdf/11580560.pdf ·...
84
Republic of the Philippines DOTC*MMDA*DPWH*NEDA*PNP-NCR*HUDCC*UP-NCTS*EMB Japan International Cooperation Agency (JICA) METRO MANILA URBAN TRANSPORTATION INTEGRATION STUDY TECHNICAL REPORT NO. 10 T TRAFFIC E ENVIRONMENTAL S STUDY , , A AIR AND N NOISE P POLLUTION IN M METRO M MANILA March 1999 MMUTIS STUDY TEAM m m m m u u t t i i s s No. SSF JR 99-036 (13/16) .
Transcript of DOTC*MMDA*DPWH*NEDA*PNP-NCR*HUDCC*UP-NCTS*EMB …open_jicareport.jica.go.jp/pdf/11580560.pdf ·...
Republic of the Philippines DOTC*MMDA*DPWH*NEDA*PNP-NCR*HUDCC*UP-NCTS*EMB Japan International Cooperation Agency (JICA)
MMEETTRROO MMAANNIILLAA
UURRBBAANN TTRRAANNSSPPOORRTTAATTIIOONN
IINNTTEEGGRRAATTIIOONN SSTTUUDDYY TTEECCHHNNIICCAALL RREEPPOORRTT NNOO.. 1100
TTRRAAFFFFIICC EENNVVIIRROONNMMEENNTTAALL
SSTTUUDDYY,, AAIIRR AANNDD NNOOIISSEE
PPOOLLLLUUTTIIOONN IINN
MMEETTRROO MMAANNIILLAA MMaarrcchh 11999999
MMMMUUTTIISS SSTTUUDDYY TTEEAAMM mmmm
uu ttii ss
No.
SSF
JR
99-036 (13/16)
.

METRO MANILA URBAN TRANSPORTATION INTEGRATION STUDY
TECHNICAL REPORT NO. 10: TRAFFIC ENVIRONMENTAL STUDY, AIR AND NOISE POLLUTION IN METRO MANILA
TABLE OF CONTENTS
Page No.
1. INTRODUCTION.........................................................................................................1-1
1.1 Objectives.............................................................................................................1-11.2 General Description of Metro Manila ..................................................................1-21.3 Data Sources.........................................................................................................1-4
1.3.1 Previous Studies .......................................................................................1-41.3.2 MMUTIS Primary Data Collection..........................................................1-4
1.4 Motor Vehicles in Metro Manila ..........................................................................1-5
2. TYPE, SOURCES AND EFFECTS OF AIR AND NOISE POLLUTION..................2-1
2.1 Types of Air Pollutants.........................................................................................2-1
2.1.1 Suspended Particulate Matter (SPM) .......................................................2-22.1.2 Particulate Matter 10 (PM10)...................................................................2-22.1.3 Carbon Monoxide (CO) ...........................................................................2-22.1.4 Sulfur Dioxide (SOx) ...............................................................................2-22.1.5 Nitrogen Oxides (NOx)............................................................................2-32.1.6 Lead (Pb) ..................................................................................................2-3
2.2 Noise Pollution.....................................................................................................2-32.3 Methodology ........................................................................................................2-4
2.3.1 Air Pollution.............................................................................................2-42.3.2 Meteorological Monitoring ......................................................................2-52.3.3 Traffic Volume Count...............................................................................2-6
3. PRESENT SITUATION OF AIR QUALITY IN METRO MANILA..........................3-1
3.1 General .................................................................................................................3-13.2 Monitoring of Pollutants ......................................................................................3-2
3.2.1 TSP...........................................................................................................3-23.2.2 PM10 ........................................................................................................3-83.2.3 Lead (Pb) ..................................................................................................3-83.2.4 Sulfur Dioxide (SO2) .............................................................................3-103.2.5 Carbon Monoxide (CO) ......................................................................... 3-113.2.6 NO2 ........................................................................................................3-14
3.3 Meteorological Monitoring ................................................................................3-163.4 Traffic Volume Count.........................................................................................3-173.5 Conclusion and Recommendations ....................................................................3-19
METRO MANILA URBAN TRANSPORTATION INTEGRATION STUDY
TECHNICAL REPORT NO. 10: TRAFFIC ENVIRONMENTAL STUDY, AIR AND NOISE POLLUTION IN METRO MANILA
3.5.1 Use of Cleaner Fuels ..............................................................................3-193.5.2 Use of Cleaner Vehicles .........................................................................3-203.5.3 Improve Traffic Flow .............................................................................3-203.5.4 Reduce Travel Demand ..........................................................................3-20
4. INITIAL ENVIRONMENTAL EXAMINATION........................................................4-1
4.1 Objectives.............................................................................................................4-14.2 Methodology ........................................................................................................4-14.3 Screening of Subprojects in MMUTIS.................................................................4-14.4 Conclusion............................................................................................................4-14.5 Scoping of Subprojects in MMUTIS ...................................................................4-24.6 Possible Most Important Environmental Impacts in MMUTIS ...........................4-3
5. ESTIMATION OF AIR POLLUTANT EMISSION IN METRO MANILA................5-1
5.1 Relationship Between Transport and the Environment........................................5-15.2 Policy Responses..................................................................................................5-15.3 Estimation of Air Pollutant Emission in Metro Manila .......................................5-5
5.3.1 Methodology ............................................................................................5-55.3.2 Two-Fluid Model......................................................................................5-65.3.3 Aggregation of Travel Distance and Average Speed ...............................5-95.3.4 Emission Estimation.................................................................................5-95.3.5 Sensitivity Analysis................................................................................5-12
5.4 Recommendations for Sustainable Environment Development.........................5-13
METRO MANILA URBAN TRANSPORTATION INTEGRATION STUDY
TECHNICAL REPORT NO. 10: TRAFFIC ENVIRONMENTAL STUDY, AIR AND NOISE POLLUTION IN METRO MANILA
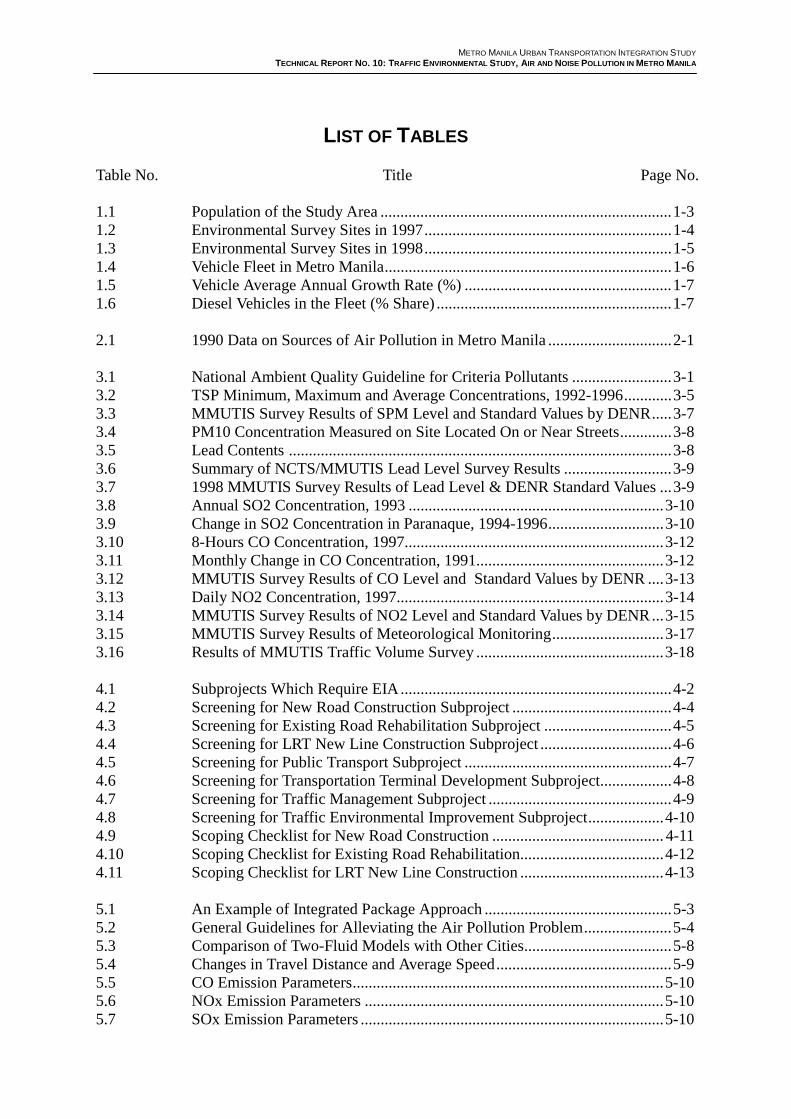
LIST OF TABLES
Table No. Title Page No.
1.1 Population of the Study Area .........................................................................1-31.2 Environmental Survey Sites in 1997..............................................................1-41.3 Environmental Survey Sites in 1998..............................................................1-51.4 Vehicle Fleet in Metro Manila........................................................................1-61.5 Vehicle Average Annual Growth Rate (%) ....................................................1-71.6 Diesel Vehicles in the Fleet (% Share) ...........................................................1-7
2.1 1990 Data on Sources of Air Pollution in Metro Manila ...............................2-1
3.1 National Ambient Quality Guideline for Criteria Pollutants .........................3-13.2 TSP Minimum, Maximum and Average Concentrations, 1992-1996............3-53.3 MMUTIS Survey Results of SPM Level and Standard Values by DENR.....3-73.4 PM10 Concentration Measured on Site Located On or Near Streets.............3-83.5 Lead Contents ................................................................................................3-83.6 Summary of NCTS/MMUTIS Lead Level Survey Results ...........................3-93.7 1998 MMUTIS Survey Results of Lead Level & DENR Standard Values ...3-93.8 Annual SO2 Concentration, 1993 ................................................................3-103.9 Change in SO2 Concentration in Paranaque, 1994-1996.............................3-103.10 8-Hours CO Concentration, 1997.................................................................3-123.11 Monthly Change in CO Concentration, 1991...............................................3-123.12 MMUTIS Survey Results of CO Level and Standard Values by DENR ....3-133.13 Daily NO2 Concentration, 1997...................................................................3-143.14 MMUTIS Survey Results of NO2 Level and Standard Values by DENR...3-153.15 MMUTIS Survey Results of Meteorological Monitoring............................3-173.16 Results of MMUTIS Traffic Volume Survey ...............................................3-18
4.1 Subprojects Which Require EIA....................................................................4-24.2 Screening for New Road Construction Subproject ........................................4-44.3 Screening for Existing Road Rehabilitation Subproject ................................4-54.4 Screening for LRT New Line Construction Subproject .................................4-64.5 Screening for Public Transport Subproject ....................................................4-74.6 Screening for Transportation Terminal Development Subproject..................4-84.7 Screening for Traffic Management Subproject ..............................................4-94.8 Screening for Traffic Environmental Improvement Subproject...................4-104.9 Scoping Checklist for New Road Construction ........................................... 4-114.10 Scoping Checklist for Existing Road Rehabilitation....................................4-124.11 Scoping Checklist for LRT New Line Construction ....................................4-13
5.1 An Example of Integrated Package Approach ...............................................5-35.2 General Guidelines for Alleviating the Air Pollution Problem......................5-45.3 Comparison of Two-Fluid Models with Other Cities.....................................5-85.4 Changes in Travel Distance and Average Speed............................................5-95.5 CO Emission Parameters..............................................................................5-105.6 NOx Emission Parameters ...........................................................................5-105.7 SOx Emission Parameters ............................................................................5-10

METRO MANILA URBAN TRANSPORTATION INTEGRATION STUDY
TECHNICAL REPORT NO. 10: TRAFFIC ENVIRONMENTAL STUDY, AIR AND NOISE POLLUTION IN METRO MANILA
5.8 SPM Emission Parameters ........................................................................... 5-115.9 Share of the Present Travel Distance by Jeepney and Bus........................... 5-115.10 Share of Gasoline and Diesel by Mode Type............................................... 5-115.11 Emission Estimation Results........................................................................5-125.12 Changes in the Share of Gasoline and Diesel ..............................................5-125.13 Changes in the Share of Bus and Jeepney....................................................5-125.14 Sensitivity Analysis Results .........................................................................5-13

METRO MANILA URBAN TRANSPORTATION INTEGRATION STUDY
TECHNICAL REPORT NO. 10: TRAFFIC ENVIRONMENTAL STUDY, AIR AND NOISE POLLUTION IN METRO MANILA
LIST OF FIGURES
Figure No. Title Page No.
1.1 Trend of Population in MMUTIS Study Area................................................1-31.2 Number of Vehicles in Metro Manila.............................................................1-6
3.1 TSP and SO2 Monitoring Station Map of DENR/NCR in Metro Manila .....3-33.2 Air Quality Measurement Points in NCTS/MMUTIS Survey.......................3-43.3 TSP Minimum, Maximum and Average Concentrations, 1992-1996............3-63.4 Survey and Standard Values of SPM, Maximum Hourly Average ................3-73.5 MMUTIS Survey and Standard Value of Lead (1-Year Average) .................3-93.6 Annual SO2 Concentration, 1993 ................................................................ 3-113.7 Change in SO2 Concentration, 1994-1996 .................................................. 3-113.8 8-Hours CO Concentration...........................................................................3-123.9 Monthly Change in CO Concentration.........................................................3-133.10 MMUTIS Survey and Standard Values of CO Maximum Hourly Ave........3-143.11 Daily NO2 Concentration, 1997...................................................................3-153.12 MMUTIS Survey and Standard Values of NO2 Daily Average...................3-163.13 Results of MMUTIS Wind Speed Survey....................................................3-173.14 Results of MMUTIS Traffic Volume Survey ...............................................3-183.15 Correlation of Hourly CO Value and Traffic Volume ..................................3-213.16 Correlation of Hourly SPM Value and Traffic Volume................................3-213.17 Correlation of Hourly CO Value and Traffic Volume With Wind Speed
of Lower Than 1.0m/s ..................................................................................3-223.18 Correlation of Hourly SPM Value and Traffic Volume With Wind Speed
of Lower Than 1.0m/s ..................................................................................3-22
5.1 Interaction Between Transport and Environment inSustainable Development...............................................................................5-2
5.2 Methodology for Environment Analysis........................................................5-65.3 Travel Time Versus Stop Time Relation ........................................................5-75.4 Two-Fluid Model for Metro Manila...............................................................5-85.5 CO Emissions...............................................................................................5-145.6 NOx Emissions.............................................................................................5-155.7 SOx Emissions .............................................................................................5-165.8 PM Emissions...............................................................................................5-17
METRO MANILA URBAN TRANSPORTATION INTEGRATION STUDY
TECHNICAL REPORT NO. 10: TRAFFIC ENVIRONMENTAL STUDY, AIR AND NOISE POLLUTION IN METRO MANILA
APPENDICES
A. Summary of Travel Speed Survey By Route, 1996 .....................................................A-1
B. Veh-km and Average Speed By Zone (1996)............................................................... B-1Veh-km and Average Speed By Zone (Do-Nothing, 2015).......................................... B-2Veh-km and Average Speed By Zone (Master Plan, 2015).......................................... B-3Veh-km and Average Speed By Zone (Do-Max, 2015) ............................................... B-4
C. CO Emission ................................................................................................................ C-1NOx Emission .............................................................................................................. C-2SOx Emission............................................................................................................... C-3PM Emission ................................................................................................................ C-4

METRO MANILA URBAN TRANSPORTATION INTEGRATION STUDY
TECHNICAL REPORT NO. 10: TRAFFIC ENVIRONMENTAL STUDY, AIR AND NOISE POLLUTION IN METRO MANILA
LIST OF ACRONYMS/ABBREVIATIONS
ADB Asian Development BankAQG National Air Quality GuidelineCMDC Construction Manpower Development CenterCO Carbon MonoxideCOx Carbon OxidesDENR Department of Environment and Natural ResourcesDOTC Department of Transportation and CommunicationsDPWH Department of Public Works and HighwaysEMB Environmental Management BureauEDSA Epifanio de los Santos AvenueEIA Environmental Impact AssessmentIEE Initial Environmental ExaminationJICA Japan International Cooperation AgencyLRT Light Rail TransitLTO Land Transportation Officemg Milligramu g Microgramu g/m3 Particulate Concentration per Microgram per Cubic MeterMC/TC Motorcycle/TricycleMMDA Metro Manila Development AuthorityMMUTIS Metro Manila Urban Transportation Integration StudyMMUTSTRAP Metro Manila Urban Transportation Strategic Planning ProjectMRT Mass Rail TransitNCR National Capital RegionNCTS National Center for Transportation StudiesNOx Nitrogen OxidesPb LeadPD Presidential DecreePM10 Particulate Matter Less Than 10 Micronsppm Parts Per MillionSEATAC Southeast Asian Agency for Regional Transport and Communications
DevelopmentSOx Sulfur OxidesSPM Suspended Particulate MatterTOG Total Organic GasesTDM Transport Demand ManagementTSM Transport System ManagementTSP Total Suspended ParticulateURBAIR Urban Air Quality Management Strategy in AsiaUV Utility VehicleWB World BankWHO World Health Organization

METRO MANILA URBAN TRANSPORTATION INTEGRATION STUDY
TECHNICAL REPORT NO. 10: TRAFFIC ENVIRONMENTAL STUDY, AIR AND NOISE POLLUTION IN METRO MANILA
1-1
1. INTRODUCTION
1.1 Objectives
The Metro Manila Urban Transportation Integration Study (MMUTIS) had a three-fold task of formulating medium- to long-term sustainable transportation developmentstrategies at the metropolitan level (structure plan) and a five-year implementationplan; conducting feasibility studies for identified priority projects; and recommendingpolicies and strategies for strengthening the metropolitan transportation planningadministration, education and research activities. The development challenge was toformulate a comprehensive strategic transportation plan that will ensure thesatisfaction of the community’s demand for mobility at a level that is sustainable fromthe economic, social, financial and environmental perspectives. Thus, it wasnecessary to include an environmental impact study as an integral component of theplanning process.
The environmental study was divided into the following three phases:
Phase 1 Collection and review of existing institutions, regulatory frameworkand guidelines on the environment;
Phase 2 Conduct of an air pollution survey and a noise survey for six selectedroads;
Phase 3 Evaluation of the existing environmental issues in the study area, suchas relocation of residents affected by transportation project activitiesand split of communications; and
Phase 4 Study of noise/air pollution forecast models.
The second phase of this study particularly aimed to do the following:
1) Formulate an Initial Environmental Examination (IEE) for the programs whichare proposed by the MMUTIS members; and
2) Present this technical report on environment study in support of the finalreport on MMUTIS investigations.
The recommendations in this technical report are a result of the findings from theenvironmental study and the discussions of the study team with the various agenciesconcerned with transportation in Metro Manila.
This report summarizes the review of air and noise pollution issues caused by trafficoperation in Metro Manila. It outlines existing legislation and administrative andtechnical procedures for the control of air and noise pollution, and describes currentlyavailable data on concentration of air pollution. A comparison of the current situationof air pollution with other mega-cities in Southeast Asia (e.g., Bangkok, Thailand andJakarta) is likewise presented
METRO MANILA URBAN TRANSPORTATION INTEGRATION STUDY
TECHNICAL REPORT NO. 10: TRAFFIC ENVIRONMENTAL STUDY, AIR AND NOISE POLLUTION IN METRO MANILA
1-2
The issue of air pollution is discussed in greater detail. It is clearly a major issue andhas serious health implications. Noise pollution is a more subjective problem and isgenerally more difficult to control. Some examples of successful enforcement, andproposals for further action are also outlined in the report.
1.2 General Description of Metro Manila
Metro Manila, also called the National Capital Region (NCR), is situated on the plainlocated on the southwestern coast of Luzon Island, around the mouth of the PasigRiver in Manila Bay. It is bounded by Manila Bay in the west, the agricultural plainsof Central Luzon in the north, the Sierra Madre mountains in the east, and LagunaBay in the south. Metro Manila covers a total land area of 636 square kilometers,covering ten cities and seven municipalities.
Meteorological characteristics, especially wind direction and wind velocity, are one ofthe important factors of air pollution. The study area’s climate is characterized by adominant rainy season from May to October and a dominant dry season during therest of the year. The annual rainfall is 2,000 mm to 3,000 mm in the study area andaround 2,000 mm in the Metro Manila area. The temperature varies from 25°C inJanuary to about 30°C in May. The average annual temperature is 27°C. No severetemperature change can be observed throughout the year in the study area. Theprevailing wind direction in the Metro Manila area is southwestward during the rainymonths, changing its direction to eastward during the dry months. The wind velocityis observed to be stable throughout the year, with an average velocity of about threemeters per second, except during tropical cyclone season.
Metro Manila is expected to become one of the world’s megacities by the turn of thecentury. Its total population has been rapidly increasing, from 1.6 million in 1948 to2.5 million in 1960, 5.6 million in 1980, 7.9 million in 1990, and 9.5 million as of1995 (refer to Table 1.1 and Figure 1.1). In addition, continuous urban migration hasexpanded the metropolitan area beyond the municipal boundaries and has causedrapid population growth in adjoining areas such as Cavite, Laguna, Rizal andBulacan. The MMUTIS study area now has a total population of 14.4 million and hasbeen growing at a rate of 4.2% per year. The Metro Manila area shares more than20% of the country’s population.
The expansion of urban areas is starting to severely strain the existing urbaninfrastructure and ecology. In particular, the supply and operation of varioustransport infrastructure can no longer cope with the increasing demand for efficientmovement of goods and people. The problem is further compounded by theincreasing levels of pollution brought about by man and machine. The number ofmotor vehicles, the primary source of pollutants in Metro Manila, has been rapidlyincreasing by an annual average rate of 8.66%, outpacing the 2.3% increase in roadsthrough construction and improvement. This has resulted in a continuous increase inroad traffic and, consequently, in the degradation of the air quality by exhaust gases.

METRO MANILA URBAN TRANSPORTATION INTEGRATION STUDY
TECHNICAL REPORT NO. 10: TRAFFIC ENVIRONMENTAL STUDY, AIR AND NOISE POLLUTION IN METRO MANILA
1-3
TABLE 1.1POPULATION OF THE STUDY AREA
Population: ‘000 (% Share) Growth Rate: % / yr.Area
1980 1990 1995 1980-90 1990-95 1980-95Metro Manila
Adjoining Areas
5,962(70. 9)2,434(29.1)
7,929(67. 7)3,774(32.3)
9,454(65. 8)4,912(34.2)
2.9
4.5
3. 6
5.4
3.1
4.8
Study Area 8,360(100.0)
11,702(100.0)
14,368(100.0)
3.4 4.2 3.7
Philippines 48,098 60,703 68,614 2.4 2.5 2.4% of Study Area
to RP17.4 19.3 20.9 - - -
Source: MMUTIS Report
0
2000
4000
6000
8000
10000
12000
14000
16000
Po
pu
latio
n(0
00)
1980 1995
Metro Manila Adjoining Area MMUTIS Study Area
FIGURE 1.1TREND OF POPULATION IN MMUTIS STUDY AREA
METRO MANILA URBAN TRANSPORTATION INTEGRATION STUDY
TECHNICAL REPORT NO. 10: TRAFFIC ENVIRONMENTAL STUDY, AIR AND NOISE POLLUTION IN METRO MANILA
1-4
1.3 Data Sources
1.3.1 Previous Studies
Several institutions and agencies have already researched and reported on the airpollution status in Metro Manila. The most important among these reports are thefollowing: ! “Urban Air Quality Management Strategy in Asia” by World Bank, 1997;! “Urban Environmental Pollution Study” by Japan International Cooperation
Agency, 1996;! “Vehicular Emission Control Planning in Metro Manila” by ADB/EMB, 1992;! “Survey on the Environmental Impacts of Urban Expressways in SEATEC
Countries” by Southern Asian Agency for Regional Transport andCommunication Development, 1989;
! “Metro Manila Urban Transportation Strategy Planning Project” by Ministry ofTransportation and Communications, 1984; and
! “Philippine Environmental Sector Study Toward Improved EnvironmentalPolicies and Management” by World Bank, 1993.
1.3.2 MMUTIS Primary Data Collection
The Environmental Impact Analysis Study conducted by the National Center forTransportation Studies of the University of the Philippines (NCTS)/MMUTIS in 1997analyzed primary data which had been measured at six measurement points on the sixmain roads in Metro Manila (refer to Table 1.2). A follow-up survey was conductedby MMUTIS in 1998, covering eight survey sites at the north and south areas ofMetro Manila and adjoining areas, in order to examine the air pollution level of theentire MMUTIS study area (see Table 1.3).
TABLE 1.2ENVIRONMENTAL SURVEY SITES IN 1997
Survey Area Category Survey Site Location
1) Taft Avenue Manila City
2) Epifanio de los Santos Avenue Quezon City
3) Roxas Boulevard Pasay City
4) Quezon Ave. Quezon City
5) Quirino Highway Quezon City
Center of M.M. Roadside
6) South Superhighway Paranaque

METRO MANILA URBAN TRANSPORTATION INTEGRATION STUDY
TECHNICAL REPORT NO. 10: TRAFFIC ENVIRONMENTAL STUDY, AIR AND NOISE POLLUTION IN METRO MANILA
1-5
TABLE 1.3ENVIRONMENTAL SURVEY SITES IN 1998
Survey Area Category Survey Site Location
1) Regalado Avenue Quezon City
2) Commonwealth Avenue Quezon City
Roadside
3) MacArthur Highway Valenzuela
North Sideof M.M.
Background 4) Far Eastern University Quezon City
Center of M.M Background 5) EDSA Quezon City
6) Aguinaldo Highway Las Pinas CityRoadside
7) National Highway Muntinlupa City
South Sideof M.M.
Background 8) C.M.D.C. Cavite
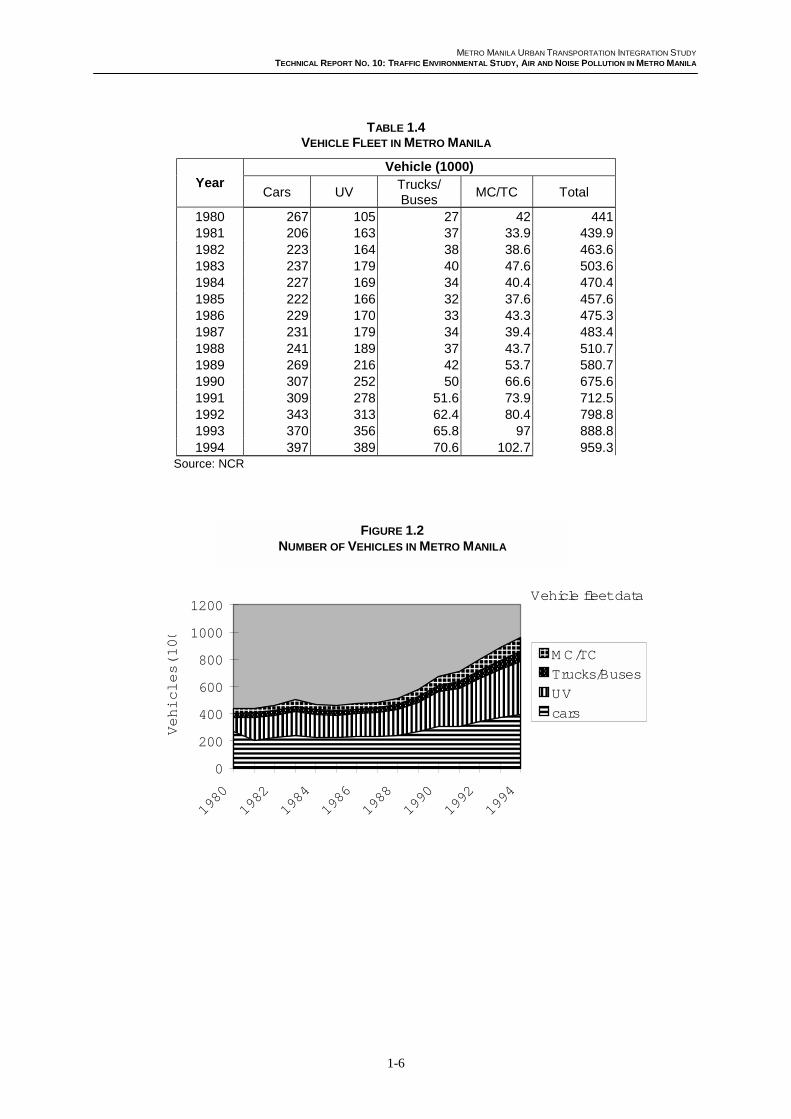
.1.4 Motor Vehicles in Metro Manila
The vehicle fleet in Metro Manila is divided into four categories, as follows:
a) Cars : passenger, taxi, light duty vehicles;b) Utility Vehicles (UV): light duty truck, jeepney (a mid-size passenger vehicle);c) Trucks and Buses; andd) MC/TC: Motorcycle and tricycle.
In 1994, the total vehicle fleet was reported at 9,590,000 vehicles, broken down asfollows (refer to Table 1.4 and Figure 1.2):
Cars and Taxis: 3,970,000 (41.4%)Utility Vehicles: 3,890,000 (40.1%)Trucks and Buses: 706,000 (7.4%)Two- and Three-Wheelers: 1,027,000 (10.7%)
The number of vehicles grew between 1986 and 1994, especially after 1992 when a10.1% increase in the total fleet—primarily composed of utility vehicles, motorcyclesand tricycles—was recorded (refer to Table 1.5).
In terms of vehicle density, the following figures are reported for Metro Manila:
Cars: 37 per 1,000 inhabitantsUV: 36 per 1,000 inhabitantsTruck/Buses: 7.6 per 1,000 inhabitantsMC/TC: 9.8 per 1,000 inhabitants
METRO MANILA URBAN TRANSPORTATION INTEGRATION STUDY
TECHNICAL REPORT NO. 10: TRAFFIC ENVIRONMENTAL STUDY, AIR AND NOISE POLLUTION IN METRO MANILA
1-6
TABLE 1.4VEHICLE FLEET IN METRO MANILA
Vehicle (1000)Year
Cars UVTrucks/Buses
MC/TC Total
1980 267 105 27 42 4411981 206 163 37 33.9 439.91982 223 164 38 38.6 463.61983 237 179 40 47.6 503.61984 227 169 34 40.4 470.41985 222 166 32 37.6 457.61986 229 170 33 43.3 475.31987 231 179 34 39.4 483.41988 241 189 37 43.7 510.71989 269 216 42 53.7 580.71990 307 252 50 66.6 675.61991 309 278 51.6 73.9 712.51992 343 313 62.4 80.4 798.81993 370 356 65.8 97 888.81994 397 389 70.6 102.7 959.3
Source: NCR
����������������������������������������������������������������������������������������������������������������������������������������������������������������������������������������������������������������������������������������������������������������������������������������������������������������������������������������������������������������������������������������������������������������������������������������������������������������������������������������������������������������������������������������������������������������������������������������������������
������������������������������������������������������������������������������������������������������������������������������������������������������������������������������������������������������������������������������������������������������������������������������������������������������������������������������������������������������������������������������������������������������������������������������������������������������������������������������������������������������������������������������������������������������������������������������������������������������������������������������������������������������������������������������������������������������������������������
Vehicle fleet data
0
200
400
600
800
1000
1200
1980
1982
1984
1986
1988
1990
1992
1994
Vehicles(100 �������
M C/TC��������������Trucks/Buses��������������
UV�������cars
FIGURE 1.2NUMBER OF VEHICLES IN METRO MANILA
METRO MANILA URBAN TRANSPORTATION INTEGRATION STUDY
TECHNICAL REPORT NO. 10: TRAFFIC ENVIRONMENTAL STUDY, AIR AND NOISE POLLUTION IN METRO MANILA
1-7
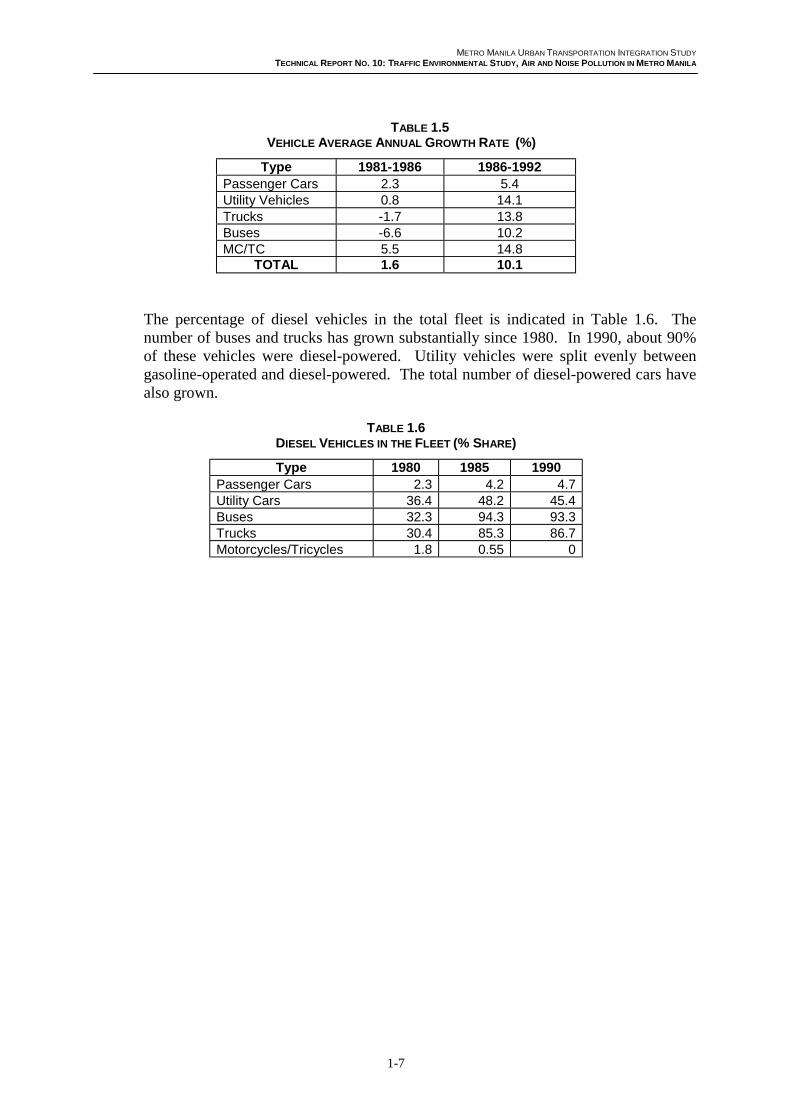
TABLE 1.5VEHICLE AVERAGE ANNUAL GROWTH RATE (%)
Type 1981-1986 1986-1992Passenger Cars 2.3 5.4Utility Vehicles 0.8 14.1Trucks -1.7 13.8Buses -6.6 10.2MC/TC 5.5 14.8
TOTAL 1.6 10.1
The percentage of diesel vehicles in the total fleet is indicated in Table 1.6. Thenumber of buses and trucks has grown substantially since 1980. In 1990, about 90%of these vehicles were diesel-powered. Utility vehicles were split evenly betweengasoline-operated and diesel-powered. The total number of diesel-powered cars havealso grown.
TABLE 1.6DIESEL VEHICLES IN THE FLEET (% SHARE)
Type 1980 1985 1990Passenger Cars 2.3 4.2 4.7Utility Cars 36.4 48.2 45.4Buses 32.3 94.3 93.3Trucks 30.4 85.3 86.7Motorcycles/Tricycles 1.8 0.55 0
METRO MANILA URBAN TRANSPORTATION INTEGRATION STUDY
TECHNICAL REPORT NO. 10: TRAFFIC ENVIRONMENTAL STUDY, AIR AND NOISE POLLUTION IN METRO MANILA
2-1
2. TYPE, SOURCE AND EFFECTS OF AIR AND NOISE POLLUTION
Despite the unquestionable benefits that appropriate transport provision can bring,there are inevitable opportunity costs and social costs involved. In particular,environmental concerns in transport are not restricted to local factors such as noise,severance and visual intrusion, but they also have regional, national and globalimplications such as global warming, acid rain and a range of pollution-induceddiseases. Environmental degradation from the transport sector is mainly caused byroad-based transport.
In Metro Manila, traffic congestion and environmental degradation in transport havebeen one of the most important social issues. The 1990 Emission Inventory conductedby the Environmental Management Bureau (EMB) showed that motor vehiclescontribute to about 78% of the total air pollution load in the metropolis. CarbonMonoxide (CO) in particular, the most toxic among the air pollutants, is almost 100%attributed to mobile sources.
2.1 Types of Air Pollutants
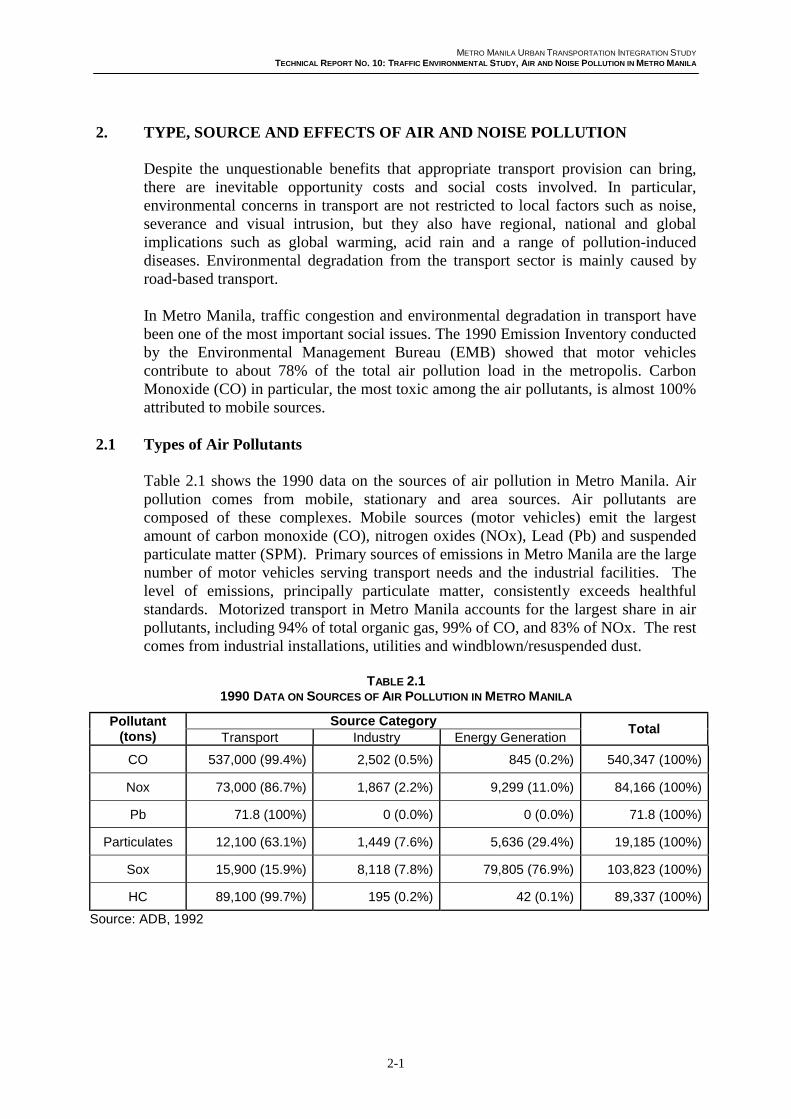
Table 2.1 shows the 1990 data on the sources of air pollution in Metro Manila. Airpollution comes from mobile, stationary and area sources. Air pollutants arecomposed of these complexes. Mobile sources (motor vehicles) emit the largestamount of carbon monoxide (CO), nitrogen oxides (NOx), Lead (Pb) and suspendedparticulate matter (SPM). Primary sources of emissions in Metro Manila are the largenumber of motor vehicles serving transport needs and the industrial facilities. Thelevel of emissions, principally particulate matter, consistently exceeds healthfulstandards. Motorized transport in Metro Manila accounts for the largest share in airpollutants, including 94% of total organic gas, 99% of CO, and 83% of NOx. The restcomes from industrial installations, utilities and windblown/resuspended dust.
TABLE 2.11990 DATA ON SOURCES OF AIR POLLUTION IN METRO MANILA
Source CategoryPollutant(tons) Transport Industry Energy Generation
Total
CO 537,000 (99.4%) 2,502 (0.5%) 845 (0.2%) 540,347 (100%)
Nox 73,000 (86.7%) 1,867 (2.2%) 9,299 (11.0%) 84,166 (100%)
Pb 71.8 (100%) 0 (0.0%) 0 (0.0%) 71.8 (100%)
Particulates 12,100 (63.1%) 1,449 (7.6%) 5,636 (29.4%) 19,185 (100%)
Sox 15,900 (15.9%) 8,118 (7.8%) 79,805 (76.9%) 103,823 (100%)
HC 89,100 (99.7%) 195 (0.2%) 42 (0.1%) 89,337 (100%)
Source: ADB, 1992
METRO MANILA URBAN TRANSPORTATION INTEGRATION STUDY
TECHNICAL REPORT NO. 10: TRAFFIC ENVIRONMENTAL STUDY, AIR AND NOISE POLLUTION IN METRO MANILA
2-2
2.1.1 Suspended Particulate Matter (SPM)
SPM, or Total Suspended Particulate (TSP), are highly visible products of poorlycontrolled combustion and are mainly dust and carbon. The larger particles settle outof the air; finer materials stay suspended and may form the basis of smog or fog. Bythemselves, they are not toxic, but they may act to convey toxic pollutants to thelungs. SPM is a major air pollution problem in Metro Manila. It is especiallyconcentrated near streets and industrial areas particularly during the dry season. Thesources of particulate in urban areas include motor vehicle exhaust emissions,combustion of fuels, fires and construction activities.
2.1.2 Particulate Matter 10 (PM10)
PM10, which is defined as particles with diameters of less than 10 micrometer, is abetter indicator of the possible health effects of airborne particles than SPM. BecausePM10 particles are smaller, they are most likely to penetrate the lungs and causerespiratory illness. They include fine solids or liquid particles found in the air or inemission such as dust, smoke or smog. Sources include the fine asbestos and otherparticles stemming from wear and tear of tires and brakes as well as matter resultingfrom engine, especially diesel engine, combustion. Particulate matter may be toxic initself or carry toxic trace substances absorbed into its surfaces.
2.1.3 Carbon Monoxide (CO)
CO is an odorless and almost colorless gas. It is primarily a product of thecombustion of fuel in a motor vehicle when it is idling or operating below normalcruise speeds. It can have detrimental effects on health because it interferes with theabsorption of oxygen by red blood cells. This may lead to increased morbidity andadversely affected fertility, and there is evidence that it affects worker productivity.CO is especially a problem in urban areas where synergistic effects with otherpollutants mean it contributes to photochemical smog and surface ozone (O3).Concentrations of O3 at lower levels have implications for the respiratory system. Inlow concentrations, CO can produce sluggishness, nausea, headaches and dizziness.In large doses, it can kill by reacting with blood hemoglobin. High concentrations ofthis gas are found in areas of high traffic density. It usually resides in the atmospherefor one to two months.
2.1.4 Sulfur Dioxide (SOx)
Sulfur dioxide results from the combustion of fossil fuels and the decomposition andcombustion of organic matter, and many remain in the atmosphere for periods rangingfrom hours to several weeks. “Acid rain” is associated with the combination of sulfurdioxide with water to form sulfurous and sulfuric acid. Exposure to high levels ofsulfur dioxide results in chest irritation and persistent bronchitis. These health effectsare aggravated if particulate matter is also present. Transport is directly responsiblefor about 5% of total SO2 emissions with diesel fuel containing more SO2 per literthan gasoline.
METRO MANILA URBAN TRANSPORTATION INTEGRATION STUDY
TECHNICAL REPORT NO. 10: TRAFFIC ENVIRONMENTAL STUDY, AIR AND NOISE POLLUTION IN METRO MANILA
2-3
2.1.5 Nitrogen Oxides (NOx)
Nitric acids and nitrogen dioxide are produced by combustion processes, the formerfound in vehicle exhaust and the latter formed by subsequent oxidation of the nitricacids. These oxides, with nitrous oxide, may reside in the atmosphere for severaldays. The oxides can be oxidized to nitric acid and particulate matter. With strongsunlight, the oxides react with hydrocarbons and oxygen to form photochemicalsmog. This causes very severe breathing problems at high concentrations. It posesparticular difficulties when combined with other air pollutants or in areas whereresidents already suffer from ill-health. In the latter case, they can lead to respiratorydifficulties and extended exposure can result in oedema or emphysema. At thetransboundary level, NOx emissions converted to nitric acid and combined with SO2,form a significant component of acid rain which has serious detrimental effects onecosystems.
2.1.6 Lead (Pb)
Lead compounds are found in exhaust gas produced from anti-knock agents in fuel. Itaffects the central nervous system, lowers an individual’s IQ, causes behavioraldisturbance, decreases ability to concentrate, increases the incidence of high bloodpressure, and has been found to be carcinogenic to animals and potentially to humans.When emitted after combustion, lead is in an inorganic form. Airborne lead particlescan exist in many chemical forms which may influence their environmental propertiesand toxicity. The major sources of lead are evaporation losses incurred duringtransport and handling of leaded petrol and emission in motor vehicle exhaust.
Results of air quality measurement undertaken by the EMB-NCR in differentmonitoring stations from 1986 showed levels occasionally exceeding environmentalstandards. In the 1997 NCTS-MMUTIS environmental impact study covering 6arterial roads in Metro Manila, CO, NO2, Pb and SPM were measured as mainpollutants from mobile sources. Simultaneously with the air pollution levelmonitoring, wind speed and wind direction and 24-hour traffic volume counts wereundertaken.
2.2 Noise Pollution
Noise due to motor vehicles is related to the number of vehicles using a road,particularly the number of heavy vehicles. The reaction of people to vehicle noisevaries considerably depending upon individual irritation from noise, the backgroundlevel of noise, and the characteristics of the noise (e.g., frequency, tone, intensityhertz, as well as absolute level). Cars are widespread contributors of unwanted noise,though larger trucks, buses and jeepneys are generally noisier than cars.
Sound is measured in terms of its intensity as this is associated with the humanperception of loudness and is measured in units of power per unit area. Sound israrely constant over time, and time is found to affect noise impacts in several ways, asfollows:
! The length or duration of the sound;! The number of times the sound is repeated; and! The time of day at which the noise occurs.
METRO MANILA URBAN TRANSPORTATION INTEGRATION STUDY
TECHNICAL REPORT NO. 10: TRAFFIC ENVIRONMENTAL STUDY, AIR AND NOISE POLLUTION IN METRO MANILA
2-4
A number of noise descriptions have been developed to characterize the nature ofhighway traffic noise. Ideally, any descriptor should be capable of reflectingfrequency, sound pressure level, and the fluctuation of these two variables over time.Those that are currently used include:
! Percentile exceeded noise levels (Lx), which defines the sound level that isexceeded X percent of the time;
! Equivalent continuous (A-weighted) sound levels (Leq), which is the averagesound level over a prescribed period of time. Common periods are 1 hour, 24hours, daytime or night time; and
! Maximum sound pressure level (Lmax).
2.3 Methodology
2.3.1 Air Pollution
a) Equipment
For CO and SPM, the Air Pollution Monitoring System by Horiba Ltd., equipped withgas sampling mechanism and automatic recorder-analyzers, was used in the study. Airpollution analyzers and automatic data management hardware were fixed in aMitsubishi Rosa. Data management hardware included a data logger which storedand integrated field data in a computer file format, and recorders which plotted realtime site measurements.
For NO2, the simple NO2 detectors and Eco Analyzer produced by Tsukuba ScienceLaboratory Ltd. was used in the study.
For lead, the high volume air sampler by Shibata Ltd. was used to collect theatmospheric TSP in the study. It has an ability to inhale 500 liters of sample air perminute as standard capacity.
b) Methods of Measurement
Non-Dispersive Infrared Radiation Method (NDIR) for CO
The measurement of CO in ambient air is based on the absorption of infrared radiationby non-dispersive spectrometry. The infrared radiation emitted from an infraredsource is split into parallel beams and directed through two cells. One beam passes areference cell which contains a non-absorbing background gas; the other sample cellcontains a continuous flowing sample of ambient air. Any CO introduced into thesample cell will absorb radiation. The detector converts the difference in energybetween sample and reference cell to capacitance change. This capacitance change,equivalent to the CO concentration, is detected electronically and amplified toproduce output signal. Ambient CO concentrations can be determined by reference tothe analyzer response versus the CO concentration calibration curve (EMB, 1994).The duration of measurements for CO was 48 hours with one sample point for everyhour.
METRO MANILA URBAN TRANSPORTATION INTEGRATION STUDY
TECHNICAL REPORT NO. 10: TRAFFIC ENVIRONMENTAL STUDY, AIR AND NOISE POLLUTION IN METRO MANILA
2-5
Saltzman and Absorption Spectrophotometry Method for NO2
In the survey, NO2 in ambient was measured by the simple detector and analyzer.The specific filter of the NO2 detector has the ability to absorb NO2 in the air. Afterthe detector was exposed for 24 hours in the survey site, the filter was taken out andput into the Saltzman Liquid. This liquid changes to a darker color the higher the NO2level. The concentration of atmospheric NO2 was measured by the translucency valueof the colored liquid by using the absorbance analyzer. The duration of measurementsfor NO2 was two days with one sample point.
Beta-Ray Absorption Method for SPM
In this method, a beta radiation source was located on one side of a high-grade filtertape and a detector on the other. The low-energy beta ray was absorbed in proportionto the particle volume. Beta rays were directed on the filter tape that gathered particlesand the density was derived from the intensity of ray transmission (EMB, 1994). Theduration of measurements for SPM was 48 hours with one sample point for everyhour.
Atomic Absorption Spectro-Photometer Method for Lead (Pb)
The pre-weighted filters used in the collection of TSP were submitted to thelaboratory for lead (Pb) analysis. Before doing so, the TSP concentration wascalculated from the resulting weight of the filters after sampling the volume of air thatpassed through the high volume sampler. Filter papers used in the high volumesampler were digested using 10ml ashing acid (4:1 mitric-perchloric acid) intodryness. The digested filter was left to stand for 30 minutes at room temperature.Then, 2ml of ashing acid was again added and the solution heated in a hot plate at120oC until 0.5ml remained. The same procedure was repeated until the solutionbecame clear. The sample was rinsed by 10ml distilled water in a watch glass andthen heated to a temperature of 150oC until it was dry. The remaining residue wasdissolved in 2-3ml of dilution acid (4% nitric; 1% perchloric acid) for analysis of lead(Pb) using atomic absorption spectro-photometer (AAS). A lead standard curve wasprepared to determine the level of lead in the sample. Concentration was computedusing the resulting weight of lead in the filter over the volume of air that passedthrough the high volume sampler. The duration of measurements for lead (Pb) was 24hours with one sample point.
2.3.2 Meteorological Monitoring
a) Equipment
The equipment used for wind speed and wind direction were the ananemometer andanemoscope mounted on top of the mobiles, the Air Pollution Monitoring System byHoriba Ltd.
b) Method of Measurement
The ananemometer and anemoscope were elevated to 9.0 meters to clear anywindward obstacle. Hourly measurements of wind speed were expressed in m/s withwind speed of 0.40 m/s or less considered as calm. Most prevalent hourly wind
METRO MANILA URBAN TRANSPORTATION INTEGRATION STUDY
TECHNICAL REPORT NO. 10: TRAFFIC ENVIRONMENTAL STUDY, AIR AND NOISE POLLUTION IN METRO MANILA
2-6
directions were established using the 16 compass points. These data were recordedautomatically by the data management hardware, including a data logger, with otherair pollution data. For each location, the monitoring was done with air pollution levelmeasurement for a period of 48 hours.
2.3.3 Traffic Volume Count
a) Equipment
Traffic manual counters connecting five individual counters were used to measure thetraffic volume classified into five classes. The traffic volume surveyor recorded every15 minutes the traffic volume into the recording sheets prepared previously.
b) Method of Measurement
The main variable in roadside environment is traffic volume. Defined as the numberof vehicles passing a given point during a specified period of time, traffic volumegives an accurate information on the total traffic from each direction contributing tothe pollution level in the areas (TTC, 1983). Since air pollution level is source-dependent, the number of vehicles is expected to be directly proportional to pollutionconcentration.
Five general classes of vehicles were used in the survey, namely: cars (including fiera,taxi, Hi-Ace, L300, FX, pick-up), passenger jeepney, bus, trucks (including rigid andarticulated types), and others (including motorcycles and tricycles). For each location,the counting was done simultaneously with air pollution level measurements for aperiod of 24 hours.
METRO MANILA URBAN TRANSPORTATION INTEGRATION STUDY
TECHNICAL REPORT NO. 10: TRAFFIC ENVIRONMENTAL STUDY, AIR AND NOISE POLLUTION IN METRO MANILA
3-1
3. PRESENT SITUATION OF AIR QUALITY IN METRO MANILA
3.1 General
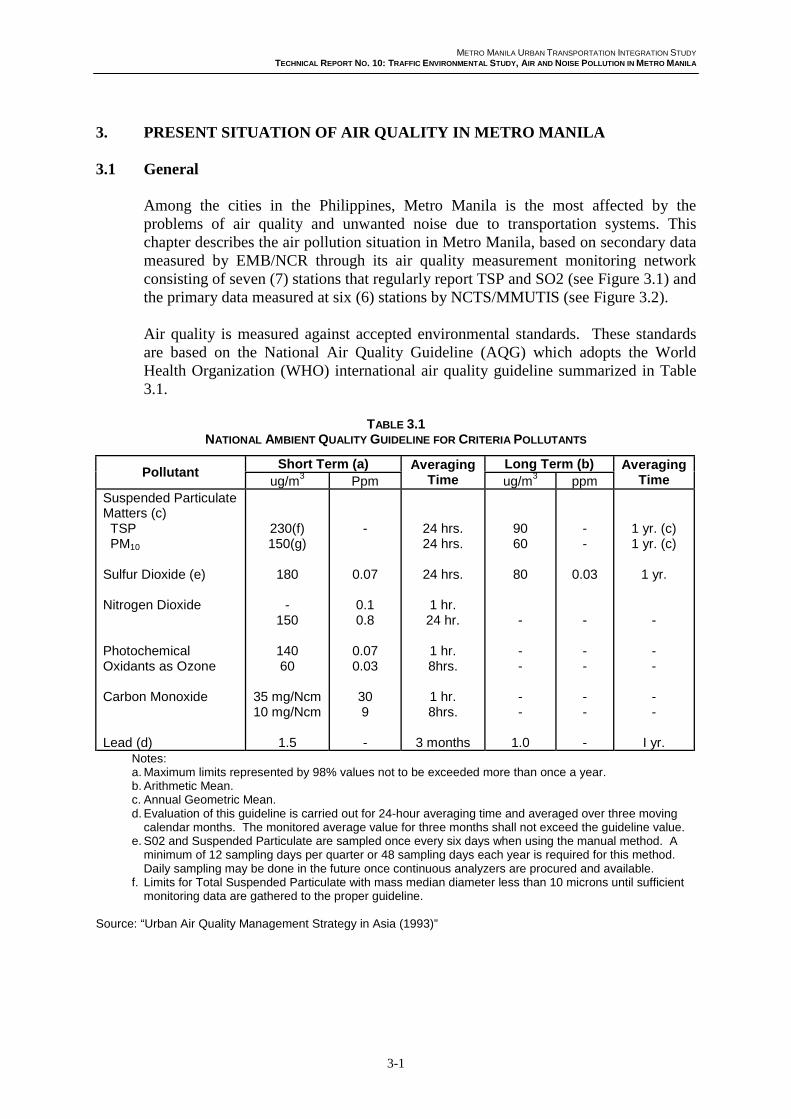
Among the cities in the Philippines, Metro Manila is the most affected by theproblems of air quality and unwanted noise due to transportation systems. Thischapter describes the air pollution situation in Metro Manila, based on secondary datameasured by EMB/NCR through its air quality measurement monitoring networkconsisting of seven (7) stations that regularly report TSP and SO2 (see Figure 3.1) andthe primary data measured at six (6) stations by NCTS/MMUTIS (see Figure 3.2).
Air quality is measured against accepted environmental standards. These standardsare based on the National Air Quality Guideline (AQG) which adopts the WorldHealth Organization (WHO) international air quality guideline summarized in Table3.1.
TABLE 3.1NATIONAL AMBIENT QUALITY GUIDELINE FOR CRITERIA POLLUTANTS
Short Term (a) Long Term (b)Pollutant
ug/m3 PpmAveraging
Time ug/m3 ppmAveraging
TimeSuspended ParticulateMatters (c) TSP PM10
Sulfur Dioxide (e)
Nitrogen Dioxide
PhotochemicalOxidants as Ozone
Carbon Monoxide
Lead (d)
230(f)150(g)
180
-150
14060
35 mg/Ncm10 mg/Ncm
1.5
-
0.07
0.10.8
0.070.03
309
-
24 hrs.24 hrs.
24 hrs.
1 hr.24 hr.
1 hr.8hrs.
1 hr.8hrs.
3 months
9060
80
-
--
--
1.0
--
0.03
-
--
--
-
1 yr. (c)1 yr. (c)
1 yr.
-
--
--
I yr.Notes:a. Maximum limits represented by 98% values not to be exceeded more than once a year.b. Arithmetic Mean.c. Annual Geometric Mean.d. Evaluation of this guideline is carried out for 24-hour averaging time and averaged over three moving
calendar months. The monitored average value for three months shall not exceed the guideline value.e. S02 and Suspended Particulate are sampled once every six days when using the manual method. A
minimum of 12 sampling days per quarter or 48 sampling days each year is required for this method.Daily sampling may be done in the future once continuous analyzers are procured and available.
f. Limits for Total Suspended Particulate with mass median diameter less than 10 microns until sufficientmonitoring data are gathered to the proper guideline.
Source: “Urban Air Quality Management Strategy in Asia (1993)”
METRO MANILA URBAN TRANSPORTATION INTEGRATION STUDY
TECHNICAL REPORT NO. 10: TRAFFIC ENVIRONMENTAL STUDY, AIR AND NOISE POLLUTION IN METRO MANILA
3-2
3.2 Monitoring of Pollutants
3.2.1 TSP
The Philippines has accepted the upper permit value of the environmental standards ofthe WHO Air Quality Guideline. The WHO guideline for PM10 and total suspendedparticulate (TSP) is 60-90 µ g/m3 for long-term (annual) average, and 150-230 µ g/m3
for short-term (24 hours) average.
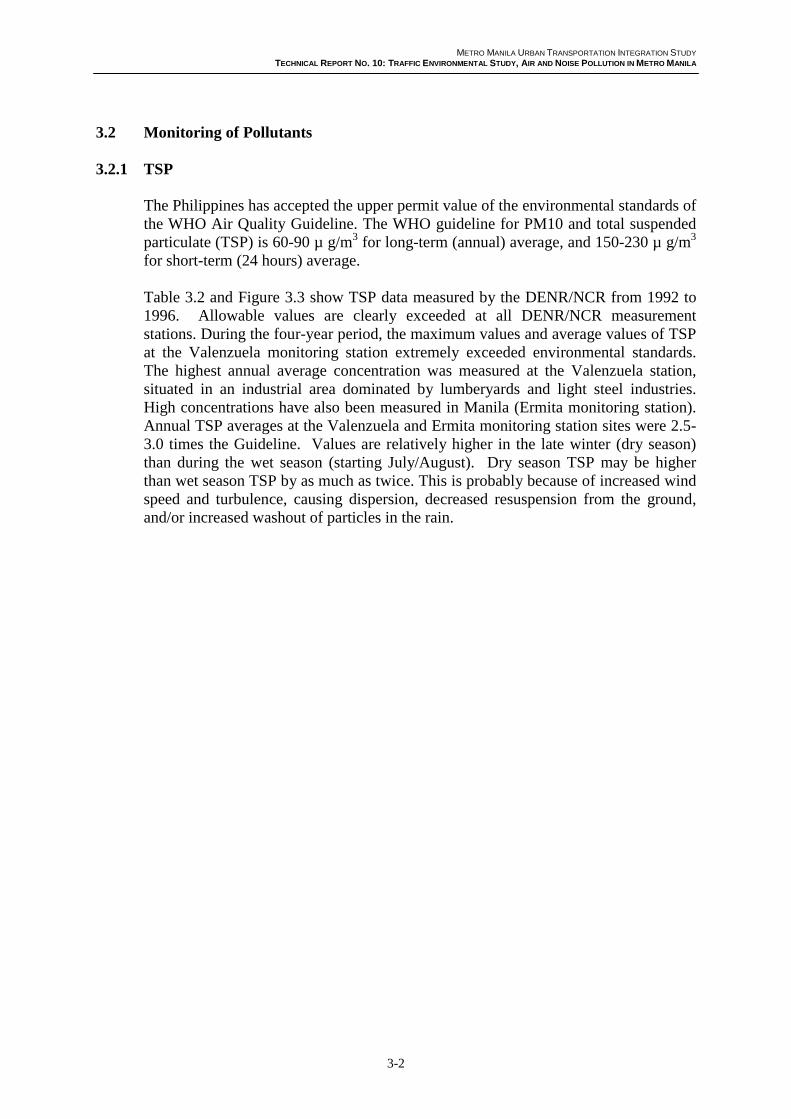
Table 3.2 and Figure 3.3 show TSP data measured by the DENR/NCR from 1992 to1996. Allowable values are clearly exceeded at all DENR/NCR measurementstations. During the four-year period, the maximum values and average values of TSPat the Valenzuela monitoring station extremely exceeded environmental standards.The highest annual average concentration was measured at the Valenzuela station,situated in an industrial area dominated by lumberyards and light steel industries.High concentrations have also been measured in Manila (Ermita monitoring station).Annual TSP averages at the Valenzuela and Ermita monitoring station sites were 2.5-3.0 times the Guideline. Values are relatively higher in the late winter (dry season)than during the wet season (starting July/August). Dry season TSP may be higherthan wet season TSP by as much as twice. This is probably because of increased windspeed and turbulence, causing dispersion, decreased resuspension from the ground,and/or increased washout of particles in the rain.
METRO MANILA URBAN TRANSPORTATION INTEGRATION STUDY
TECHNICAL REPORT NO. 10: TRAFFIC ENVIRONMENTAL STUDY, AIR AND NOISE POLLUTION IN METRO MANILA
3-3
FIGURE 3.1TSP AND SO2 MONITORING STATION MAP OF DENR / NCR IN METRO MANILA
Monitoring Stations:
1: Ermita (street)2: Laspinas (street)3: Paranaque (street)4: Pasig (industrial)5: Quezon City (area)6: Caloocan City7: Valenzuela (industrial)8: Makati (area)
METRO MANILA URBAN TRANSPORTATION INTEGRATION STUDY
TECHNICAL REPORT NO. 10: TRAFFIC ENVIRONMENTAL STUDY, AIR AND NOISE POLLUTION IN METRO MANILA
3-4
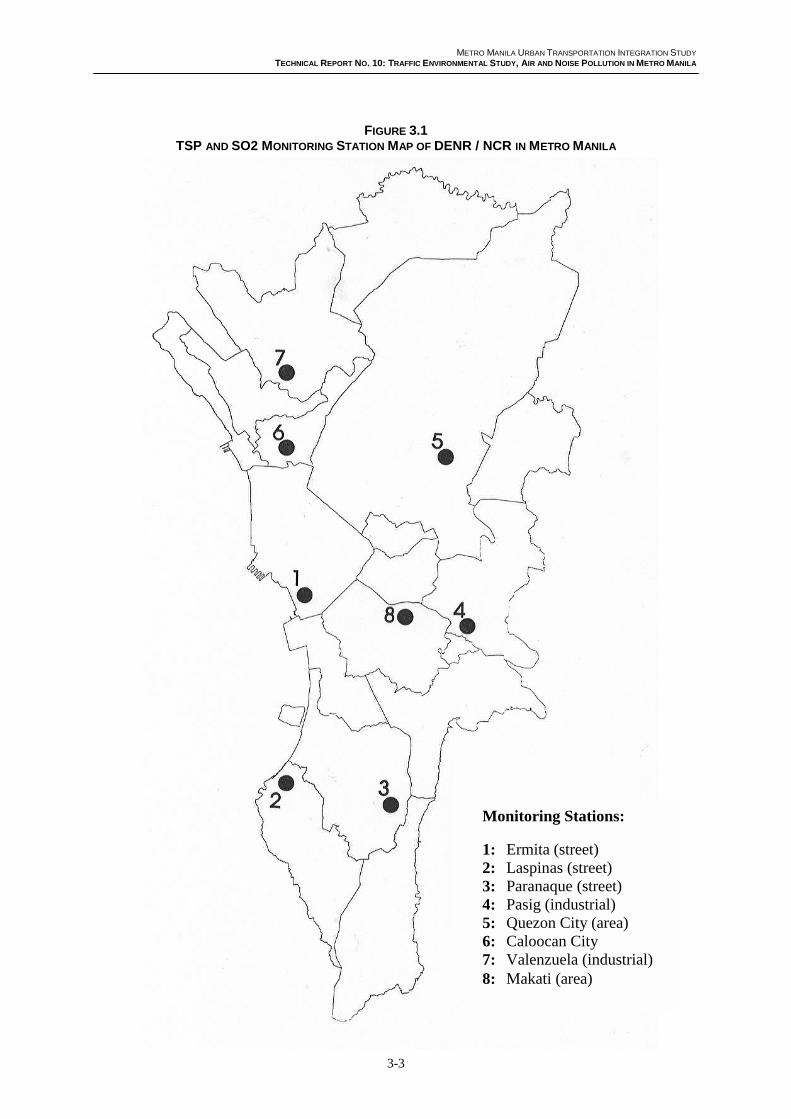
FIGURE 3.2AIR QUALITY MEASUREMENT POINTS ON NCTS/MMUTIS SURVEY
1: Quirino Highway2: Quezon Avenue3: Taft Avenue4: EDSA5: Roxas Boulevard6: South Superhighway

METRO MANILA URBAN TRANSPORTATION INTEGRATION STUDY
TECHNICAL REPORT NO. 10: TRAFFIC ENVIRONMENTAL STUDY, AIR AND NOISE POLLUTION IN METRO MANILA
3-5
TABLE 3.2TSP MINIMUM, MAXIMUM AND AVERAGE CONCENTRATIONS, 1992-1996
(UNIT: u g/m3)
Year Monitoring Station Minimum Maximum Average1992 Valenzuela 75 459 356
Navotas 74 224 150Quezon 40 345 178Ermita 70 387 219Pasig 69 294 187Makati 36 291 146Paranaque 47 391 166Las Pinas 36 247 115
1993 Valenzuela 50 295 173Navotas - - -Quezon 47 254 121Ermita 59 300 164Pasig 27 314 154Makati 63 261 179Paranaque 47 261 169Las Pinas 30 141 72
1994 Valenzuela 77 559 322Navotas - - -Quezon 27 218 113Ermita 45 312 164Pasig - - -Makati 47 324 188Paranaque 35 192 112Las Pinas - - -
1995 Valenzuela 131 454 296EDSA – QC 64 401 193Pagasa – QC 43 310 133Ermita 77 302 174Makati 77 485 210Las Pinas 74 198 118
1996 Valenzuela 157 463 276East Ave. – QC 111 369 201Pagasa – QC 57 355 123Quezon Ave. – QC 205 384 269Ermita 45 217 146Makati 132 351 246Las Pinas 73 295 136Pasig 139 219 188
Source: DENR/NCR

METRO MANILA URBAN TRANSPORTATION INTEGRATION STUDY
TECHNICAL REPORT NO. 10: TRAFFIC ENVIRONMENTAL STUDY, AIR AND NOISE POLLUTION IN METRO MANILA
3-6
FIGURE 3.3TSP MINIMUM, MAXIMUM AND AVERAGE CONCENTRATIONS, 1992-1996
1992 1993
1994 1995
1996
Source: DENR/NCR
0
100
200
300
400
500
Valenzu
ela
Navot
as
Quezon
Ermita
Pasig
Mak
ati
Paran
aqu
Las P
inas
ug/m
3
0
100
200
300
400
500
Valenzu
ela
Navot
as
Quezon
Ermita
Pasig
Mak
ati
Paran
aque
Las P
inas
ug/m
3
0
100
200
300
400
500
Valenzu
ela
Navot
as
Quezon
Ermita
Pasig
Mak
ati
Paran
aque
Las P
inas
ug/m
3
0
100
200
300
400
500
Valenzu
ela
EDSA
Pagas
a
Ermita
Mak
ati
Las P
inas
ug/m
3
0
100
200
300
400
500
Valenzu
ela
East A
ve
Pagas
a
Quezon
Ave
Ermita
Mak
ati
Las P
inas
Pasig
ug/m
3
METRO MANILA URBAN TRANSPORTATION INTEGRATION STUDY
TECHNICAL REPORT NO. 10: TRAFFIC ENVIRONMENTAL STUDY, AIR AND NOISE POLLUTION IN METRO MANILA
3-7
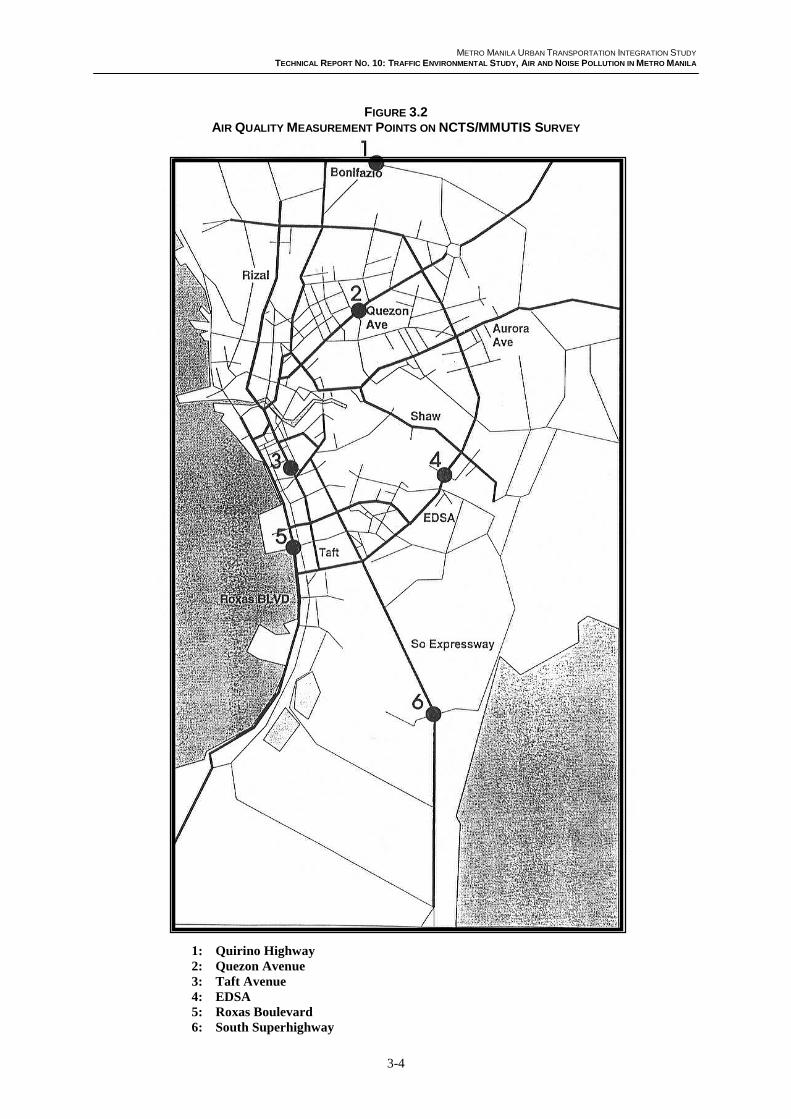
The results of the suspended particulate matter (SPM) monitoring during theMMUTIS survey tend to confirm the high concentration of this air pollutant in thestudy area. Table 3.3 and Figure 3.4 show the survey results and the standard valuesadopted by the DENR for SPM.
TABLE 3.3MMUTIS SURVEY RESULTS OF SPM LEVEL AND STANDARD VALUES BY DENR
Collected Data
(ug/m3)
National. Air Pollution
Quality Std. (ug/m3)Survey Station
Daily Ave. Max Min Daily Ave. Hourly Ave.
1) Regalado Ave. 69 125 21 180 250
2) Commonwealth Ave. 167 616 68 180 250
3) MacArthur Highway 245 476 60 180 250
4) Far Eastern University 52 115 21 180 250
5) Camp Crame 83 192 33 180 250
6) Aguinaldo Highway 106 415 31 180 250
7) National Highway 85 201 30 180 250
8) C.M.D.C. 27 43 15 180 250
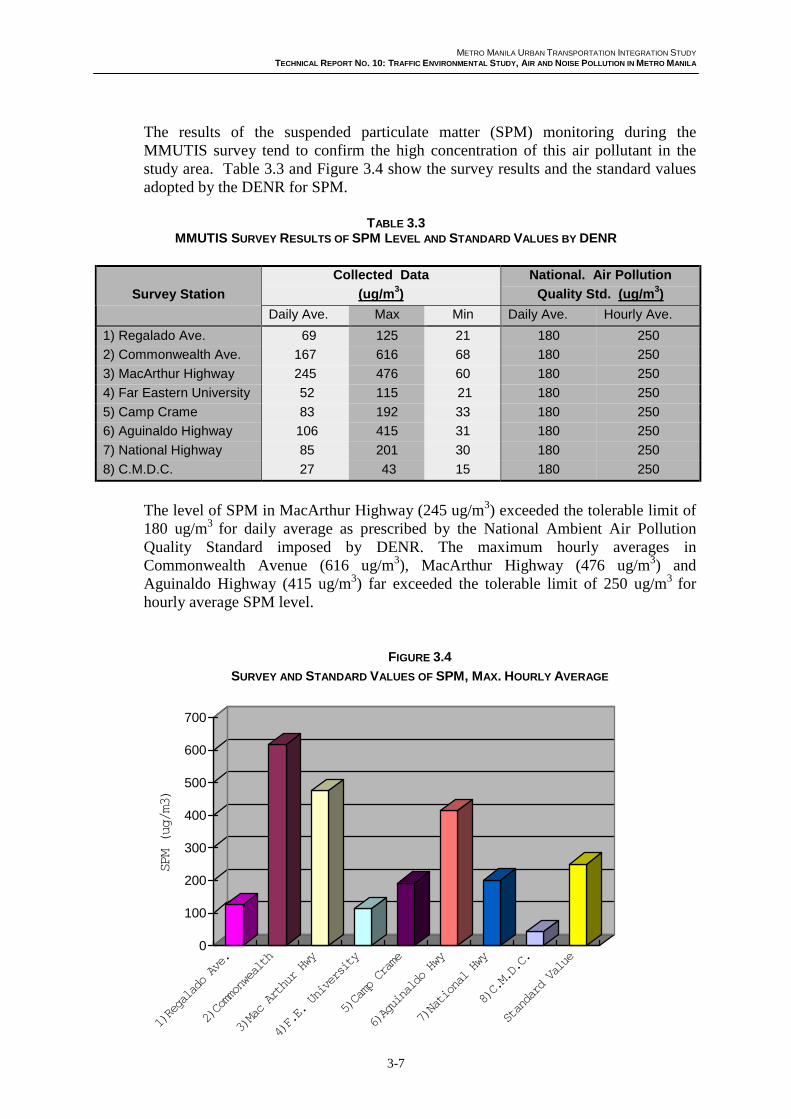
The level of SPM in MacArthur Highway (245 ug/m3) exceeded the tolerable limit of180 ug/m3 for daily average as prescribed by the National Ambient Air PollutionQuality Standard imposed by DENR. The maximum hourly averages inCommonwealth Avenue (616 ug/m3), MacArthur Highway (476 ug/m3) andAguinaldo Highway (415 ug/m3) far exceeded the tolerable limit of 250 ug/m3 forhourly average SPM level.
FIGURE 3.4
SURVEY AND STANDARD VALUES OF SPM, MAX. HOURLY AVERAGE
0
100
200
300
400
500
600
700
SPM (ug/m3)
1)Regalado Ave.
2)Commonwealth
3)Mac Arthur Hwy
4)F.E. University
5)Camp Crame
6)Aguinaldo Hwy
7)National Hwy
8)C.M.D.C.
Standard Value
METRO MANILA URBAN TRANSPORTATION INTEGRATION STUDY
TECHNICAL REPORT NO. 10: TRAFFIC ENVIRONMENTAL STUDY, AIR AND NOISE POLLUTION IN METRO MANILA
3-8
3.2.2 PM10
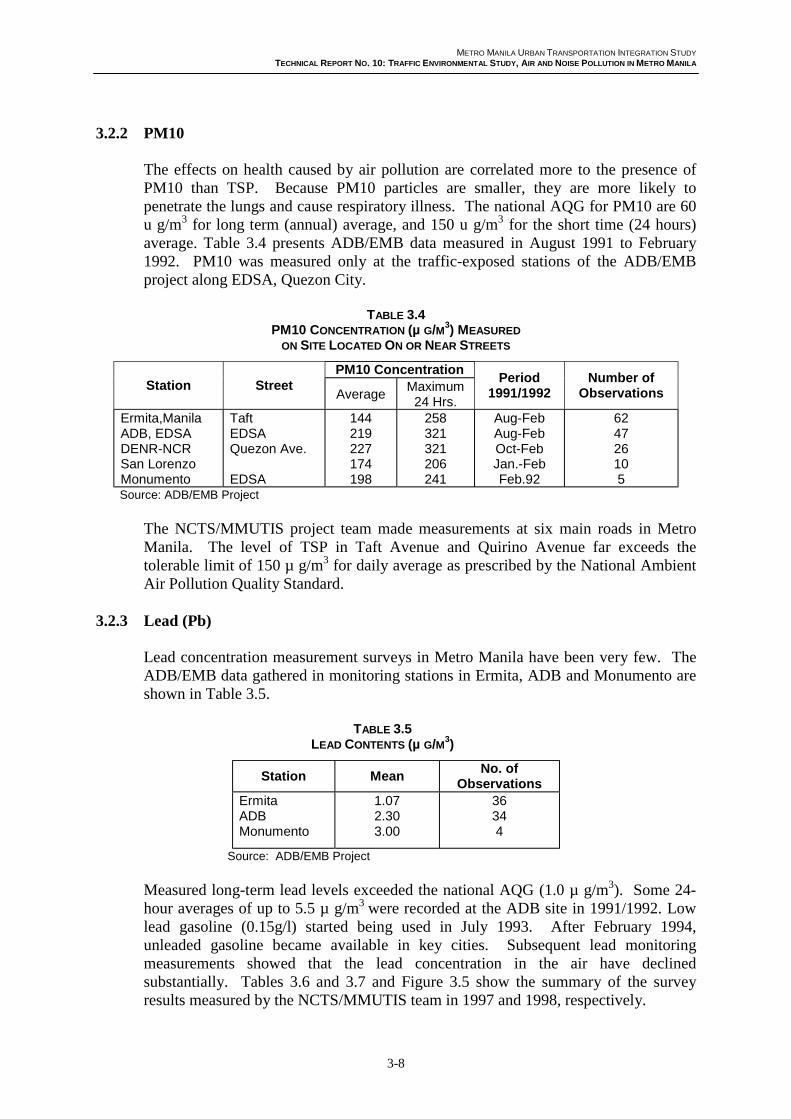
The effects on health caused by air pollution are correlated more to the presence ofPM10 than TSP. Because PM10 particles are smaller, they are more likely topenetrate the lungs and cause respiratory illness. The national AQG for PM10 are 60u g/m3 for long term (annual) average, and 150 u g/m3 for the short time (24 hours)average. Table 3.4 presents ADB/EMB data measured in August 1991 to February1992. PM10 was measured only at the traffic-exposed stations of the ADB/EMBproject along EDSA, Quezon City.
TABLE 3.4PM10 CONCENTRATION (µ G/M3) MEASURED
ON SITE LOCATED ON OR NEAR STREETS
PM10 ConcentrationStation Street
AverageMaximum
24 Hrs.
Period1991/1992
Number ofObservations
Ermita,ManilaADB, EDSADENR-NCRSan LorenzoMonumento
TaftEDSAQuezon Ave.
EDSA
144219227174198
258321321206241
Aug-FebAug-FebOct-FebJan.-FebFeb.92
624726105
Source: ADB/EMB Project
The NCTS/MMUTIS project team made measurements at six main roads in MetroManila. The level of TSP in Taft Avenue and Quirino Avenue far exceeds thetolerable limit of 150 µ g/m3 for daily average as prescribed by the National AmbientAir Pollution Quality Standard.
3.2.3 Lead (Pb)
Lead concentration measurement surveys in Metro Manila have been very few. TheADB/EMB data gathered in monitoring stations in Ermita, ADB and Monumento areshown in Table 3.5.
TABLE 3.5LEAD CONTENTS (µ G/M3)
Station MeanNo. of
ObservationsErmitaADBMonumento
1.072.303.00
36344
Source: ADB/EMB Project
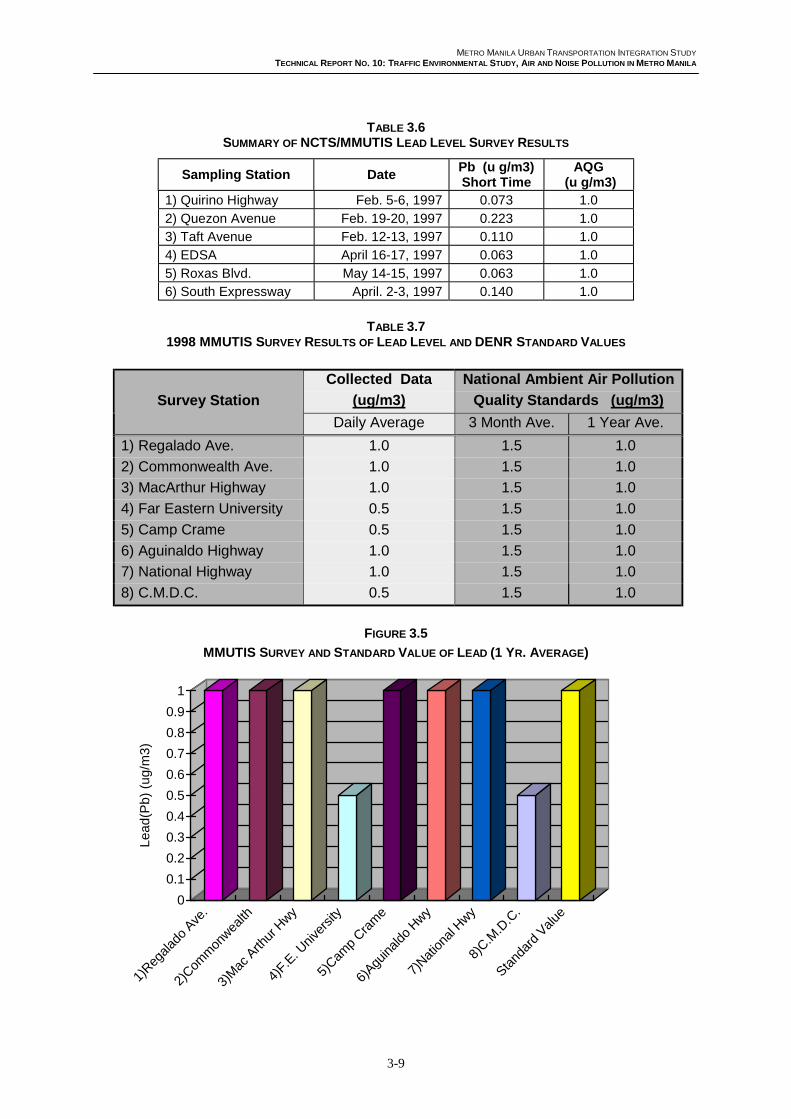
Measured long-term lead levels exceeded the national AQG (1.0 µ g/m3). Some 24-hour averages of up to 5.5 µ g/m3 were recorded at the ADB site in 1991/1992. Lowlead gasoline (0.15g/l) started being used in July 1993. After February 1994,unleaded gasoline became available in key cities. Subsequent lead monitoringmeasurements showed that the lead concentration in the air have declinedsubstantially. Tables 3.6 and 3.7 and Figure 3.5 show the summary of the surveyresults measured by the NCTS/MMUTIS team in 1997 and 1998, respectively.
METRO MANILA URBAN TRANSPORTATION INTEGRATION STUDY
TECHNICAL REPORT NO. 10: TRAFFIC ENVIRONMENTAL STUDY, AIR AND NOISE POLLUTION IN METRO MANILA
3-9
TABLE 3.6SUMMARY OF NCTS/MMUTIS LEAD LEVEL SURVEY RESULTS
Sampling Station DatePb (u g/m3)Short Time
AQG (u g/m3)
1) Quirino Highway Feb. 5-6, 1997 0.073 1.0
2) Quezon Avenue Feb. 19-20, 1997 0.223 1.03) Taft Avenue Feb. 12-13, 1997 0.110 1.0
4) EDSA April 16-17, 1997 0.063 1.0
5) Roxas Blvd. May 14-15, 1997 0.063 1.06) South Expressway April. 2-3, 1997 0.140 1.0
TABLE 3.71998 MMUTIS SURVEY RESULTS OF LEAD LEVEL AND DENR STANDARD VALUES
Collected Data
(ug/m3)
National Ambient Air Pollution
Quality Standards (ug/m3)Survey Station
Daily Average 3 Month Ave. 1 Year Ave.
1) Regalado Ave. 1.0 1.5 1.0
2) Commonwealth Ave. 1.0 1.5 1.0
3) MacArthur Highway 1.0 1.5 1.0
4) Far Eastern University 0.5 1.5 1.0
5) Camp Crame 0.5 1.5 1.0
6) Aguinaldo Highway 1.0 1.5 1.0
7) National Highway 1.0 1.5 1.0
8) C.M.D.C. 0.5 1.5 1.0
FIGURE 3.5
MMUTIS SURVEY AND STANDARD VALUE OF LEAD (1 YR. AVERAGE)
0
0.1
0.2
0.3
0.4
0.5
0.6
0.7
0.8
0.9
1
Le
ad
(Pb
) (u
g/m
3)
1)Reg
alado
Ave
.
2)Com
mon
wealth
3)M
ac A
rthur
Hwy
4)F.E
. Univ
ersit
y
5)Cam
p Cra
me
6)Agu
inaldo
Hwy
7)Nat
ional
Hwy
8)C.M
.D.C
.
Stand
ard
Value
METRO MANILA URBAN TRANSPORTATION INTEGRATION STUDY
TECHNICAL REPORT NO. 10: TRAFFIC ENVIRONMENTAL STUDY, AIR AND NOISE POLLUTION IN METRO MANILA
3-10
3.2.4 Sulfur Dioxide (SO2)
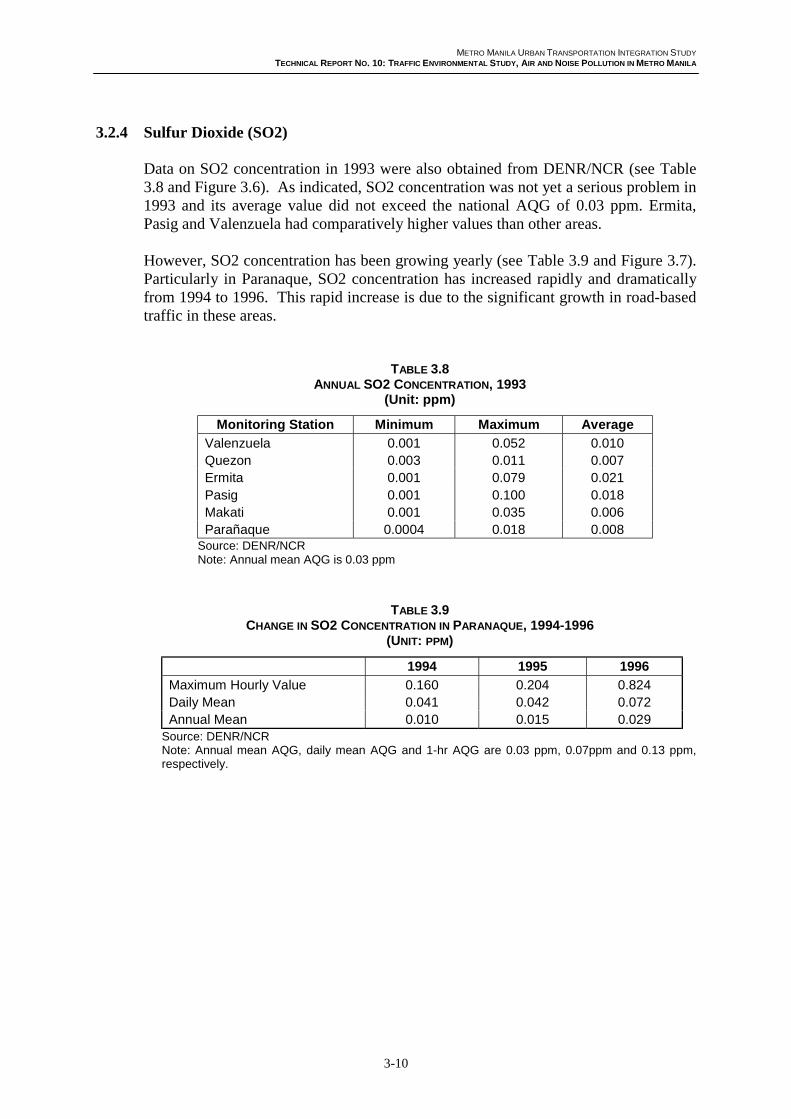
Data on SO2 concentration in 1993 were also obtained from DENR/NCR (see Table3.8 and Figure 3.6). As indicated, SO2 concentration was not yet a serious problem in1993 and its average value did not exceed the national AQG of 0.03 ppm. Ermita,Pasig and Valenzuela had comparatively higher values than other areas.
However, SO2 concentration has been growing yearly (see Table 3.9 and Figure 3.7).Particularly in Paranaque, SO2 concentration has increased rapidly and dramaticallyfrom 1994 to 1996. This rapid increase is due to the significant growth in road-basedtraffic in these areas.
TABLE 3.8ANNUAL SO2 CONCENTRATION, 1993
(Unit: ppm)
Monitoring Station Minimum Maximum Average
Valenzuela 0.001 0.052 0.010Quezon 0.003 0.011 0.007Ermita 0.001 0.079 0.021Pasig 0.001 0.100 0.018Makati 0.001 0.035 0.006Parañaque 0.0004 0.018 0.008
Source: DENR/NCRNote: Annual mean AQG is 0.03 ppm
TABLE 3.9CHANGE IN SO2 CONCENTRATION IN PARANAQUE, 1994-1996
(UNIT: PPM)
1994 1995 1996
Maximum Hourly Value 0.160 0.204 0.824Daily Mean 0.041 0.042 0.072Annual Mean 0.010 0.015 0.029
Source: DENR/NCRNote: Annual mean AQG, daily mean AQG and 1-hr AQG are 0.03 ppm, 0.07ppm and 0.13 ppm,respectively.
METRO MANILA URBAN TRANSPORTATION INTEGRATION STUDY
TECHNICAL REPORT NO. 10: TRAFFIC ENVIRONMENTAL STUDY, AIR AND NOISE POLLUTION IN METRO MANILA
3-11
FIGURE 3.6ANNUAL SO2 CONCENTRATION, 1993
FIGURE 3.7CHANGE IN SO2 CONCENTRATION, 1994-1996
3.2.5 Carbon Monoxide (CO)
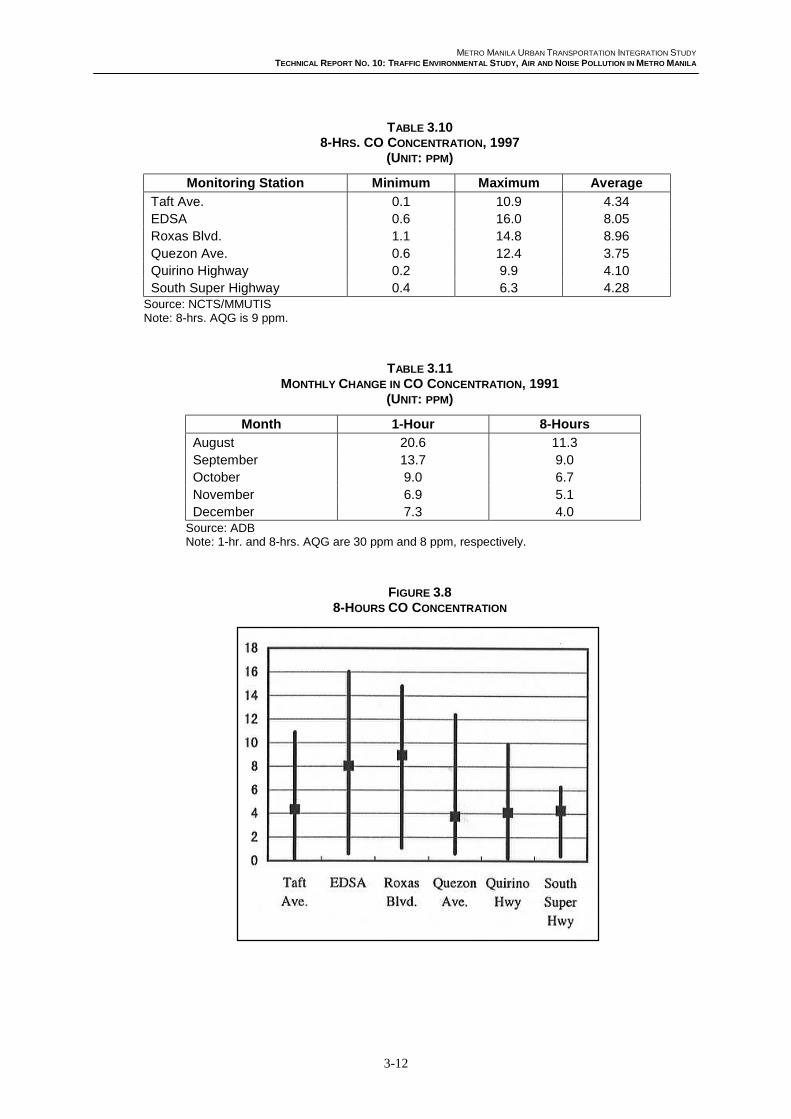
CO concentration was measured by NCTS/MMUTIS and the results are shown inTable 3.10 and Figure 3.8. Nowhere in the sample sites did the CO level exceed thenational AQG average CO concentration of 9 ppm, but it existing levels areapproximating the national guideline value. Compared with other roads, EDSA andRoxas Blvd. had slightly higher values. Table 3.11 and Figure 3.9 show the monthlychange in CO concentration, with the highest registered in August.
METRO MANILA URBAN TRANSPORTATION INTEGRATION STUDY
TECHNICAL REPORT NO. 10: TRAFFIC ENVIRONMENTAL STUDY, AIR AND NOISE POLLUTION IN METRO MANILA
3-12
TABLE 3.108-HRS. CO CONCENTRATION, 1997
(UNIT: PPM)
Monitoring Station Minimum Maximum Average
Taft Ave. 0.1 10.9 4.34EDSA 0.6 16.0 8.05Roxas Blvd. 1.1 14.8 8.96Quezon Ave. 0.6 12.4 3.75Quirino Highway 0.2 9.9 4.10South Super Highway 0.4 6.3 4.28
Source: NCTS/MMUTISNote: 8-hrs. AQG is 9 ppm.
TABLE 3.11MONTHLY CHANGE IN CO CONCENTRATION, 1991
(UNIT: PPM)
Month 1-Hour 8-Hours
August 20.6 11.3September 13.7 9.0October 9.0 6.7November 6.9 5.1December 7.3 4.0
Source: ADBNote: 1-hr. and 8-hrs. AQG are 30 ppm and 8 ppm, respectively.
FIGURE 3.88-HOURS CO CONCENTRATION

METRO MANILA URBAN TRANSPORTATION INTEGRATION STUDY
TECHNICAL REPORT NO. 10: TRAFFIC ENVIRONMENTAL STUDY, AIR AND NOISE POLLUTION IN METRO MANILA
3-13
FIGURE 3.9MONTHLY CHANGE IN CO CONCENTRATION
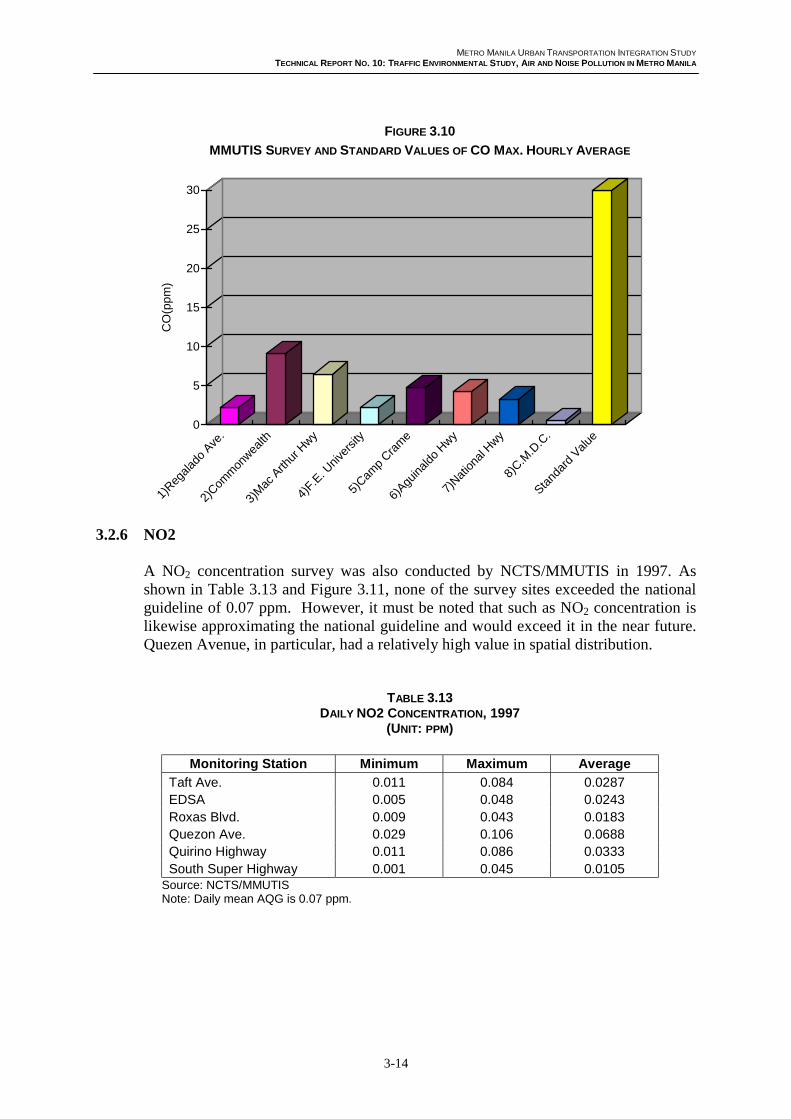
Table 3.12 and Figure 3.10 present the results of the 1998 MMUTIS supplementarysurvey in regard to CO monitoring and the standard values adopted by the DENR.
CO concentration levels were still below the DENR AQG. The maximum hourlyaverage observed in Commonwealth Avenue was 9.1 ppm. The minimum hourlyreading was 0.2 ppm, recorded in Far Eastern University. The highest 8-houraverage of 4.9 ppm was registered in MacArthur Highway while the lowest 8-houraverage of 0.4 ppm was noted in the Construction Manpower Development Center(CMDC) site.
TABLE 3.12MMUTIS SURVEY RESULTS OF CO LEVEL AND STANDARD VALUES BY DENR
Collected Data
(ppm)
National Ambient Air
Pollution Quality Std.(ppm)Survey Station
8-hr Ave Max Min 8-hour Ave. Hourly Ave.
1) Regalado Ave. 1.6 2.2 0.3 9 30
2) Commonwealth Ave. 4.5 9.1 1.2 9 30
3) MacArthur Highway 4.9 6.5 0.4 9 30
4) Far Eastern University 1.5 2.2 0.2 9 30
5) Camp Crame 2.6 4.8 1.1 9 30
6) Aguinaldo Highway 3.0 4.3 0.5 9 30
7) National Highway 2.4 3.3 0.9 9 30
8) C.M.D.C. 0.4 0.5 0.3 9 30
METRO MANILA URBAN TRANSPORTATION INTEGRATION STUDY
TECHNICAL REPORT NO. 10: TRAFFIC ENVIRONMENTAL STUDY, AIR AND NOISE POLLUTION IN METRO MANILA
3-14
FIGURE 3.10
MMUTIS SURVEY AND STANDARD VALUES OF CO MAX. HOURLY AVERAGE
3.2.6 NO2
A NO2 concentration survey was also conducted by NCTS/MMUTIS in 1997. Asshown in Table 3.13 and Figure 3.11, none of the survey sites exceeded the nationalguideline of 0.07 ppm. However, it must be noted that such as NO2 concentration islikewise approximating the national guideline and would exceed it in the near future.Quezen Avenue, in particular, had a relatively high value in spatial distribution.
TABLE 3.13DAILY NO2 CONCENTRATION, 1997
(UNIT: PPM)
Monitoring Station Minimum Maximum Average
Taft Ave. 0.011 0.084 0.0287EDSA 0.005 0.048 0.0243Roxas Blvd. 0.009 0.043 0.0183Quezon Ave. 0.029 0.106 0.0688Quirino Highway 0.011 0.086 0.0333South Super Highway 0.001 0.045 0.0105
Source: NCTS/MMUTISNote: Daily mean AQG is 0.07 ppm.
0
5
10
15
20
25
30
CO
(pp
m)
1)Reg
alado
Ave
.
2)Com
mon
wealth
3)M
ac A
rthur
Hwy
4)F.E
. Univ
ersit
y
5)Cam
p Cra
me
6)Agu
inaldo
Hwy
7)Nat
ional
Hwy
8)C.M
.D.C
.
Stand
ard
Value

METRO MANILA URBAN TRANSPORTATION INTEGRATION STUDY
TECHNICAL REPORT NO. 10: TRAFFIC ENVIRONMENTAL STUDY, AIR AND NOISE POLLUTION IN METRO MANILA
3-15
FIGURE 3.11DAILY NO2 CONCENTRATION, 1997
The results of NO2 monitoring under the 1998 MMUTIS survey and the standardvalues adopted by the DENR are shown in Table 3.14 and Figure 3.12.
TABLE 3.14MMUTIS SURVEY RESULTS OF NO2 LEVEL AND STANDARD VALUES BY DENR
Collected Data
(ppm)
National Ambient Air
Pollution Quality Std. (ppm)Survey Station
Daily Ave. Daily Ave. Hourly Ave.
1) Regalado Ave. 0.022 0.08 0.10
2) Commonwealth Ave. 0.046 0.08 0.10
3) MacArthur Highway 0.050 0.08 0.10
4) Far Eastern University 0.020 0.08 0.10
5) Camp Crame 0.022 0.08 0.10
6) Aguinaldo Highway 0.019 0.08 0.10
7) National Highway 0.016 0.08 0.10
8) C.M.D.C. 0.007 0.08 0.10

METRO MANILA URBAN TRANSPORTATION INTEGRATION STUDY
TECHNICAL REPORT NO. 10: TRAFFIC ENVIRONMENTAL STUDY, AIR AND NOISE POLLUTION IN METRO MANILA
3-16
FIGURE 3.12
MMUTIS SURVEY AND STANDARD VALUES OF NO2 DAILY AVERAGE
Survey results showed that NO2 concentrations at the survey sites were low comparedto the DENR standards. The maximum daily average NO2 was 0.050 ppm and theminimum daily average, 0.007 ppm. The maximum NO2 concentration was observedin MacArthur Highway. The next highest, at 0.046 ppm, was registered inCommonwealth Avenue. The minimum value of 0.007 ppm was observed inC.M.D.C.
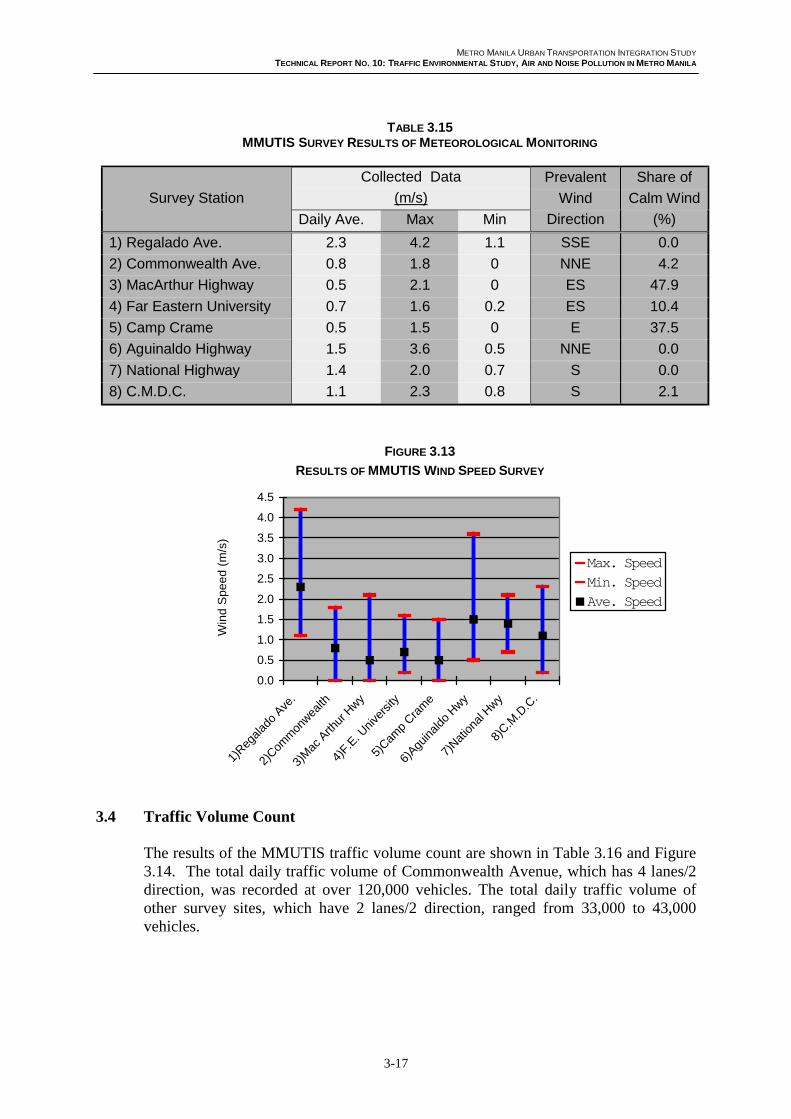
3.3 Meteorological Monitoring
Table 3.15 presents the results of the 1998 MMUTIS meteorological monitoring.Using a 16-point directional system, the most prevalent wind direction was found tobe southeast (SE) for the survey sites located along MacArthur Highway. This sectoris influenced by the northeast monsoon which is prevalent in September and October.
Wind speed was highest in Regalado Avenue, with a magnitude of 4.2 m/s, followedby Aguinaldo Highway, at 3.6 m/s. The share of calm wind (<0.4m/s) was very highin MacArthur Highway and Camp Crame.
0
0.01
0.02
0.03
0.04
0.05
0.06
0.07
0.08
NO
2(p
pm
)
1)Reg
alado
Ave
.
2)Com
mon
wealth
3)M
ac A
rthur
Hwy
4)F.E
. Univ
ersit
y
5)Cam
p Cra
me
6)Agu
inaldo
Hwy
7)Nat
ional
Hwy
8)C.M
.D.C
.
Stand
ard
Value
METRO MANILA URBAN TRANSPORTATION INTEGRATION STUDY
TECHNICAL REPORT NO. 10: TRAFFIC ENVIRONMENTAL STUDY, AIR AND NOISE POLLUTION IN METRO MANILA
3-17
TABLE 3.15MMUTIS SURVEY RESULTS OF METEOROLOGICAL MONITORING
Collected Data
(m/s)Survey Station
Daily Ave. Max Min
Prevalent
Wind
Direction
Share of
Calm Wind
(%)
1) Regalado Ave. 2.3 4.2 1.1 SSE 0.0
2) Commonwealth Ave. 0.8 1.8 0 NNE 4.2
3) MacArthur Highway 0.5 2.1 0 ES 47.9
4) Far Eastern University 0.7 1.6 0.2 ES 10.4
5) Camp Crame 0.5 1.5 0 E 37.5
6) Aguinaldo Highway 1.5 3.6 0.5 NNE 0.0
7) National Highway 1.4 2.0 0.7 S 0.0
8) C.M.D.C. 1.1 2.3 0.8 S 2.1
FIGURE 3.13
RESULTS OF MMUTIS WIND SPEED SURVEY
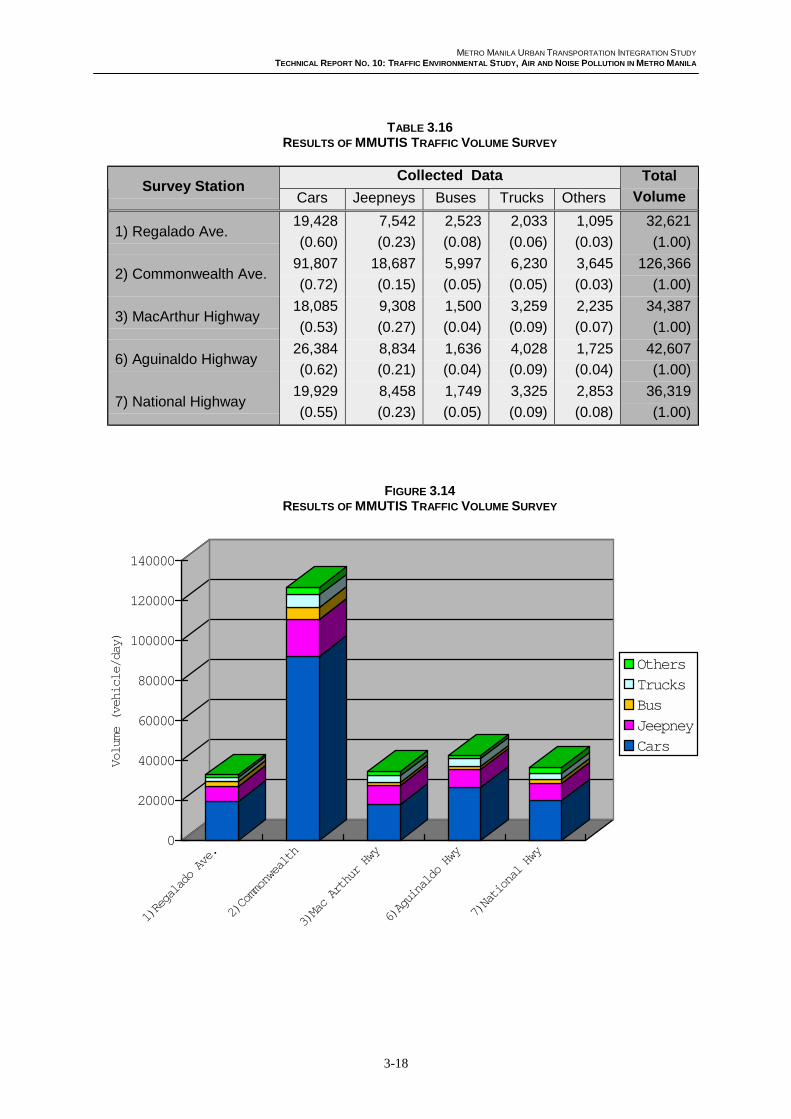
3.4 Traffic Volume Count
The results of the MMUTIS traffic volume count are shown in Table 3.16 and Figure3.14. The total daily traffic volume of Commonwealth Avenue, which has 4 lanes/2direction, was recorded at over 120,000 vehicles. The total daily traffic volume ofother survey sites, which have 2 lanes/2 direction, ranged from 33,000 to 43,000vehicles.
0.0
0.5
1.0
1.5
2.0
2.5
3.0
3.5
4.0
4.5
1)Reg
alado
Ave
.
2)Com
mon
wealth
3)M
ac A
rthur
Hwy
4)F.E
. Univ
ersit
y
5)Cam
p Cra
me
6)Agu
inaldo
Hwy
7)Nat
ional
Hwy
8)C.M
.D.C
.
Win
d S
pe
ed
(m
/s)
Max. Speed
Min. Speed
Ave. Speed
METRO MANILA URBAN TRANSPORTATION INTEGRATION STUDY
TECHNICAL REPORT NO. 10: TRAFFIC ENVIRONMENTAL STUDY, AIR AND NOISE POLLUTION IN METRO MANILA
3-18
TABLE 3.16RESULTS OF MMUTIS TRAFFIC VOLUME SURVEY
Collected DataSurvey Station
Cars Jeepneys Buses Trucks Others
Total
Volume
1) Regalado Ave.19,428
(0.60)
7,542
(0.23)
2,523
(0.08)
2,033
(0.06)
1,095
(0.03)
32,621
(1.00)
2) Commonwealth Ave.91,807
(0.72)
18,687
(0.15)
5,997
(0.05)
6,230
(0.05)
3,645
(0.03)
126,366
(1.00)
3) MacArthur Highway18,085
(0.53)
9,308
(0.27)
1,500
(0.04)
3,259
(0.09)
2,235
(0.07)
34,387
(1.00)
6) Aguinaldo Highway26,384
(0.62)
8,834
(0.21)
1,636
(0.04)
4,028
(0.09)
1,725
(0.04)
42,607
(1.00)
7) National Highway19,929
(0.55)
8,458
(0.23)
1,749
(0.05)
3,325
(0.09)
2,853
(0.08)
36,319
(1.00)
FIGURE 3.14RESULTS OF MMUTIS TRAFFIC VOLUME SURVEY
0
20000
40000
60000
80000
100000
120000
140000
Volume (vehicle/day)
1)Regalado Ave.
2)Commonwealth
3)Mac Arthur Hwy
6)Aguinaldo Hwy
7)National Hwy
Others
Trucks
Bus
Jeepney
Cars
METRO MANILA URBAN TRANSPORTATION INTEGRATION STUDY
TECHNICAL REPORT NO. 10: TRAFFIC ENVIRONMENTAL STUDY, AIR AND NOISE POLLUTION IN METRO MANILA
3-19
3.5 Conclusion and Recommendations
The results of the air pollution survey should cause and move us to take the necessarysteps in order to meet air pollution problems. While the amount of CO, NO2 andLead in the surveyed areas has not exceeded allowable levels, it is precariouslystraddling the line between a healthy and a polluted environment. The SPM level issignificantly above the national standards.
The air pollution level is related with traffic volume. Correlation of hourly CO andSPM values and traffic volume was done in Commonwealth Avenue, MacArthurHighway and Aguinaldo Highway (see Figures 3.15 and 3.16). These survey siteswere selected in order to analyze why these survey sites had high portion of calmwind. The concentration of both CO and SPM tends to become higher when trafficvolume is larger.
Figures 3.17 and 3.18 show the correlation of hourly CO and SPM values and trafficvolume, with wind speed of lower than 1.0m/s. CO does not exceed 30 ppm as thehourly standard value in this survey. It is expected, however, that SPM will exceed250ug/m3 as the hourly standard value at roadside when the hourly traffic volume ismore than 2,500 vehicles for 2 lanes/2 direction road or 6,000 vehicles for 4 lanes/2direction road.
Based on the results of the surveys, it is concluded that Metro Manila is fast becominghighly polluted due to the rapid increase in motorized transit and population growth.
Given this scenario, pollution-abatement strategies must be considered imperative andseveral strategies are recommended. Recommended measures aimed at controllingmotor vehicle emissions may be classified into four categories, namely: (a) use ofcleaner fuels; (b) use of cleaner vehicles; (c) improvement of traffic flow; and (d)reduction of travel demand.
3.5.1 Use of Cleaner Fuels
In most developing countries, lead content in gasoline and sulfur content in diesel fuelare much higher compared with those in developed countries. Hence, dramaticreductions in particulate, lead, and sulfur emissions can be gained within the existingvehicle technology using conventional fuels (World Bank, 1996). The use ofunleaded gasoline and low-sulfur diesel can be promoted through:
a) Differential taxation for leaded and unleaded gasoline in favor of the latter;b) Fuel price surcharges based on lead content of gasoline and sulfur content of
diesel fuel;c) Lower taxes on cleaner fuels;d) Tax deductions to retrofit vehicles with emission control devices;e) Provision of infrastructure to distribute cleaner fuels; andf) Imposition of stricter vehicle emission standards coupled with effective
implementation of on-road inspection and maintainance (I/M) programs (Faiz,et al., 1990).
METRO MANILA URBAN TRANSPORTATION INTEGRATION STUDY
TECHNICAL REPORT NO. 10: TRAFFIC ENVIRONMENTAL STUDY, AIR AND NOISE POLLUTION IN METRO MANILA
3-20
3.5.2 Use of Cleaner Vehicles
This strategy covers a range of measures, including:
a) Use of exhaust treatment devices such as catalysts and traps;b) Retrofitting of on-the-road vehicles with emission control devices;c) Promoting the use of less polluting conventional transport such as electric-
powered rail systems and non-motorized travel modes;d) Phasing out of aging and deteriorated vehicles which emit higher level of
pollutants; ande) Development and use of electric cars and buses.
In the context of developing countries, the most significant issues typically involvethe continued operation of old and dilapidated vehicles, and the local production andimportation of second-hand trucks and buses which are particularly polluting.Furthermore, there is an increasing trend towards using motorcycles powered by two-stroke engines which are up to ten times more polluting than modern four-strokeengines (World Bank, 1996). Therefore, measures aimed at modernizing the agingvehicle fleet, discouraging the importation and local production of substandardvehicles, and arresting the growth in motorcycle usage would significantly reducemotor vehicle emissions.
3.5.3 Improve Traffic Flow
Measures to improve traffic flow in terms of increased travel speed, less vehicleidling, and decreased accelerations and decelerations would serve to reduce carbonmonoxide and hydrocarbon emissions. These measures include:
a) Widening of roadways and intersections;b) On-street parking prohibitions;c) Synchronization of traffic signal operations;d) Implementation of one-way street systems;e) Installation of reversible lanes;f) Turning movement prohibitions;g) Designation of exclusive lanes for buses and other high occupancy vehicle;
and,h) Designation of truck routes.
These measures are generally traffic engineering techniques geared towardsmaximizing the utilization of existing transport supply and typically known asTransportation System Management (TSM) measures.
3.5.4 Reduce Travel Demand
It is now widely believed that the worsening traffic congestion problem in citiescannot be solved by simply continuing to provide additional transport capacity. Thedemand for travel has to be reduced using Transportation Demand Management(TDM) measures. Examples of these include car pooling, staggered work hours,telecommuting, improvement of public transport service, high parking fees, anddesignation of high occupancy lanes.
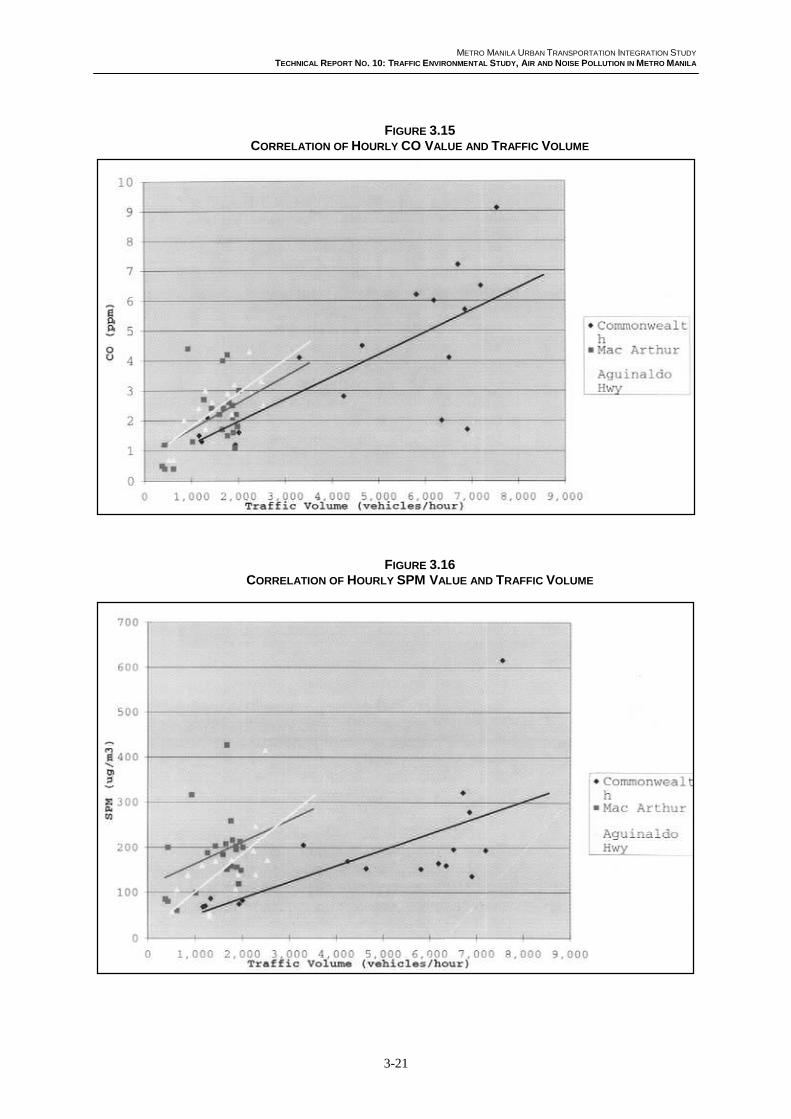
METRO MANILA URBAN TRANSPORTATION INTEGRATION STUDY
TECHNICAL REPORT NO. 10: TRAFFIC ENVIRONMENTAL STUDY, AIR AND NOISE POLLUTION IN METRO MANILA
3-21
FIGURE 3.15CORRELATION OF HOURLY CO VALUE AND TRAFFIC VOLUME
FIGURE 3.16CORRELATION OF HOURLY SPM VALUE AND TRAFFIC VOLUME
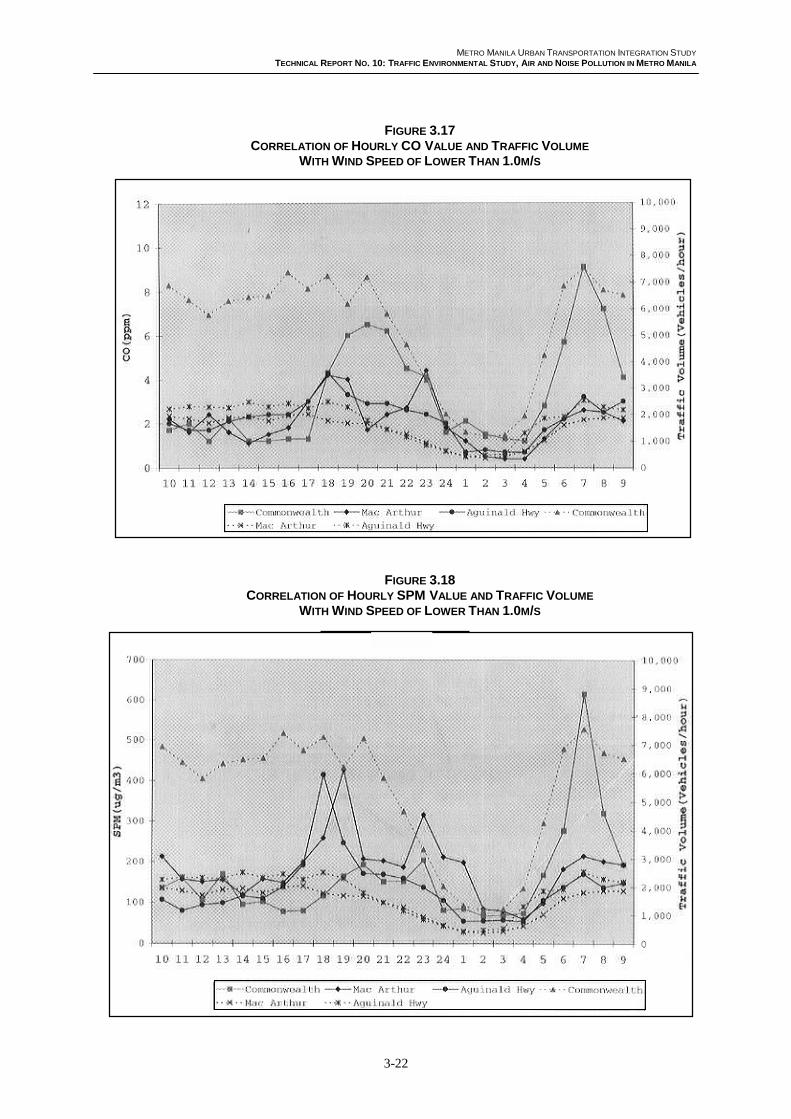
METRO MANILA URBAN TRANSPORTATION INTEGRATION STUDY
TECHNICAL REPORT NO. 10: TRAFFIC ENVIRONMENTAL STUDY, AIR AND NOISE POLLUTION IN METRO MANILA
3-22
FIGURE 3.17CORRELATION OF HOURLY CO VALUE AND TRAFFIC VOLUME
WITH WIND SPEED OF LOWER THAN 1.0M/S
FIGURE 3.18CORRELATION OF HOURLY SPM VALUE AND TRAFFIC VOLUME
WITH WIND SPEED OF LOWER THAN 1.0M/S
METRO MANILA URBAN TRANSPORTATION INTEGRATION STUDY
TECHNICAL REPORT NO. 10: TRAFFIC ENVIRONMENTAL STUDY, AIR AND NOISE POLLUTION IN METRO MANILA
4-1
4. INITIAL ENVIRONMENTAL EXAMINATION
4.1 Objectives
Under the MMUTIS Project, subprojects proposed by the JICA study team memberswere identified for each project area. An Initial Environmental Examination (IEE)was undertaken for each subproject. The objective of the IEE in this phase was todetermine the items for environmental analysis in preparation for a full-scaleEnvironmental Impact Assessment (EIA) in the latter phase.
4.2 Methodology
The JICA study team has summarized and reviewed the 7 MMUTIS subprojects,namely: new road construction, existing road rehabilitation, LRT new lineconstruction, public transport, transportation terminal development, trafficmanagement, and traffic environmental improvement project. The current situation ofthe subproject areas has been determined by field research and relevant informationhas been collected (e.g., environmental standards, natural conservation areas, EIAprocedure guidelines).
By using JICA’s screening and scoping method, environmental guidelines for someenvironmental components such as socioeconomic, natural environment andpollution, were developed. Projected environmental impacts that may occur due to theproject activities were evaluated (Yes/No/Unknown). The results of the overallevaluation and environmental analysis will be described in this chapter.
4.3 Screening of Subprojects in MMUTIS
Screening guidelines were based on the following definition: “a process of judgementon whether a development project requires an environmental impact study or not.”However, evaluation of whether or not the IEE/EIA is required for a project should bebased on appropriate ideas and views for environment by taking into consideration theproject features and its environment.
The following concepts were established in the preliminary environmental survey:
! The development project should be planned in such a way as to provide societywith sufficient benefits while securing the areas with sustainable development andgrowth without being detrimental to the lives and existence of the residents; and
! The development project should be planned in such a way as to maintain harmonywith the natural environment, while avoiding significant damage to the existingenvironment, and preserving valuable natural environmental assets.
4.4 Conclusion
The analysis aimed to answer the question: which of the subprojects required full-scale EIA? As shown in Table 4.1, the new road construction, existing roadrehabilitation, and LRT new line construction subprojects required full-scale EIA.The other subprojects did not but required the submission of project descriptions.
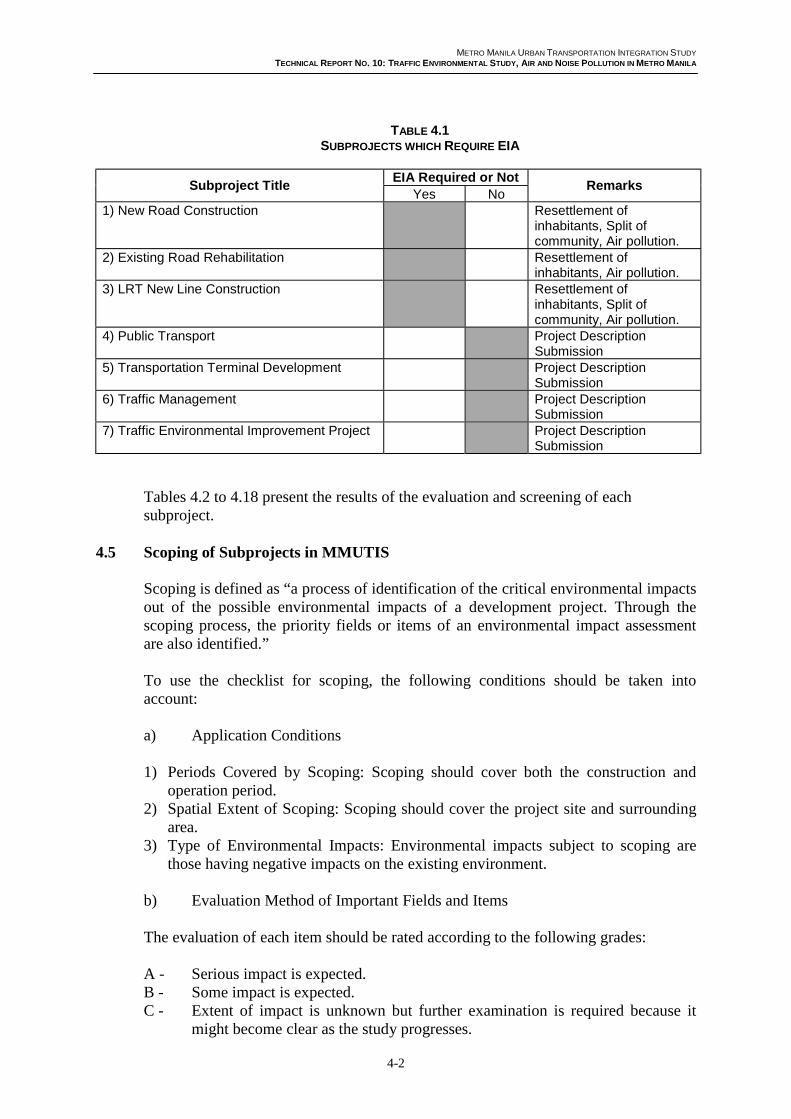
METRO MANILA URBAN TRANSPORTATION INTEGRATION STUDY
TECHNICAL REPORT NO. 10: TRAFFIC ENVIRONMENTAL STUDY, AIR AND NOISE POLLUTION IN METRO MANILA
4-2
TABLE 4.1SUBPROJECTS WHICH REQUIRE EIA
EIA Required or NotSubproject Title
Yes NoRemarks
1) New Road Construction Resettlement ofinhabitants, Split ofcommunity, Air pollution.
2) Existing Road Rehabilitation Resettlement ofinhabitants, Air pollution.
3) LRT New Line Construction Resettlement ofinhabitants, Split ofcommunity, Air pollution.
4) Public Transport Project DescriptionSubmission
5) Transportation Terminal Development Project DescriptionSubmission
6) Traffic Management Project DescriptionSubmission
7) Traffic Environmental Improvement Project Project DescriptionSubmission
Tables 4.2 to 4.18 present the results of the evaluation and screening of eachsubproject.
4.5 Scoping of Subprojects in MMUTIS
Scoping is defined as “a process of identification of the critical environmental impactsout of the possible environmental impacts of a development project. Through thescoping process, the priority fields or items of an environmental impact assessmentare also identified.”
To use the checklist for scoping, the following conditions should be taken intoaccount:
a) Application Conditions
1) Periods Covered by Scoping: Scoping should cover both the construction andoperation period.
2) Spatial Extent of Scoping: Scoping should cover the project site and surroundingarea.
3) Type of Environmental Impacts: Environmental impacts subject to scoping arethose having negative impacts on the existing environment.
b) Evaluation Method of Important Fields and Items
The evaluation of each item should be rated according to the following grades:
A - Serious impact is expected.B - Some impact is expected.C - Extent of impact is unknown but further examination is required because it
might become clear as the study progresses.
METRO MANILA URBAN TRANSPORTATION INTEGRATION STUDY
TECHNICAL REPORT NO. 10: TRAFFIC ENVIRONMENTAL STUDY, AIR AND NOISE POLLUTION IN METRO MANILA
4-3
D - No impact is foreseeable and EIA is not required.Scoping checklists (see Tables 4.9 to 4.11) are applied to the following subprojectswhich, when examined during the IEE, were found to be the subprojects requiringEIA in the latter phase:
1) New Road Construction;2) Existing Road Rehabilitation; and3) LRT New Line Construction.
4.6 Possible Most Important Environmental Impacts in MMUTIS
a) Resettlement of Inhabitants
Resettlement of inhabitants due to land acquisition for construction of newroads/railway is the most important problem in the urban transportation developmentin Metro Manila, for the following reasons:
! Loss of living foundation of the residents to be relocated;! Friction between permanent residents and relocated people (newcomers) due to
social and economic burdens on the permanent residents;! Deterioration of living standard after resettlement due to the poor compensation
system.
b) Split of Communities
Community split due to interruption of area traffic results in the following:
! Inconvenience in the daily lives of the residents and negative effects on economicactivities; and
! Split of communities would create territories or isolated areas.
c) Air Pollution
Pollution caused by exhaust gas or dust from vehicles may result in:
! An increase in traffic convenience that would cause a traffic flow increase whichwould then lead to traffic congestion and air pollution.;
! Air pollution caused by exhaust gas and dust that would affect the health ofresidents, and plants and animals;
! Sulfur oxides in the gas that may cause acid rain and carbon dioxide, which maythen contribute to global warming if a large amount of exhaust gas is produced.
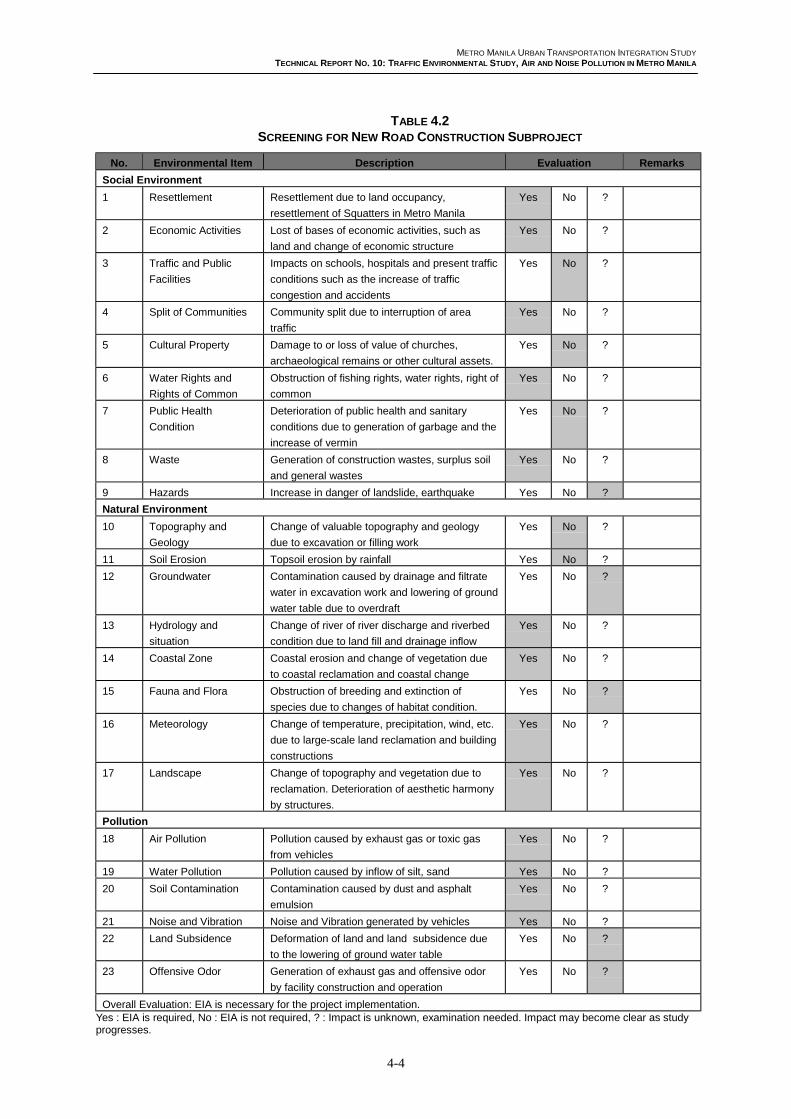
METRO MANILA URBAN TRANSPORTATION INTEGRATION STUDY
TECHNICAL REPORT NO. 10: TRAFFIC ENVIRONMENTAL STUDY, AIR AND NOISE POLLUTION IN METRO MANILA
4-4
TABLE 4.2SCREENING FOR NEW ROAD CONSTRUCTION SUBPROJECT
No. Environmental Item Description Evaluation Remarks
Social Environment
1 Resettlement Resettlement due to land occupancy,
resettlement of Squatters in Metro Manila
Yes No ?
2 Economic Activities Lost of bases of economic activities, such as
land and change of economic structure
Yes No ?
3 Traffic and Public
Facilities
Impacts on schools, hospitals and present traffic
conditions such as the increase of traffic
congestion and accidents
Yes No ?
4 Split of Communities Community split due to interruption of area
traffic
Yes No ?
5 Cultural Property Damage to or loss of value of churches,
archaeological remains or other cultural assets.
Yes No ?
6 Water Rights and
Rights of Common
Obstruction of fishing rights, water rights, right of
common
Yes No ?
7 Public Health
Condition
Deterioration of public health and sanitary
conditions due to generation of garbage and the
increase of vermin
Yes No ?
8 Waste Generation of construction wastes, surplus soil
and general wastes
Yes No ?
9 Hazards Increase in danger of landslide, earthquake Yes No ?
Natural Environment
10 Topography and
Geology
Change of valuable topography and geology
due to excavation or filling work
Yes No ?
11 Soil Erosion Topsoil erosion by rainfall Yes No ?
12 Groundwater Contamination caused by drainage and filtrate
water in excavation work and lowering of ground
water table due to overdraft
Yes No ?
13 Hydrology and
situation
Change of river of river discharge and riverbed
condition due to land fill and drainage inflow
Yes No ?
14 Coastal Zone Coastal erosion and change of vegetation due
to coastal reclamation and coastal change
Yes No ?
15 Fauna and Flora Obstruction of breeding and extinction of
species due to changes of habitat condition.
Yes No ?
16 Meteorology Change of temperature, precipitation, wind, etc.
due to large-scale land reclamation and building
constructions
Yes No ?
17 Landscape Change of topography and vegetation due to
reclamation. Deterioration of aesthetic harmony
by structures.
Yes No ?
Pollution
18 Air Pollution Pollution caused by exhaust gas or toxic gas
from vehicles
Yes No ?
19 Water Pollution Pollution caused by inflow of silt, sand Yes No ?
20 Soil Contamination Contamination caused by dust and asphalt
emulsion
Yes No ?
21 Noise and Vibration Noise and Vibration generated by vehicles Yes No ?
22 Land Subsidence Deformation of land and land subsidence due
to the lowering of ground water table
Yes No ?
23 Offensive Odor Generation of exhaust gas and offensive odor
by facility construction and operation
Yes No ?
Overall Evaluation: EIA is necessary for the project implementation.Yes : EIA is required, No : EIA is not required, ? : Impact is unknown, examination needed. Impact may become clear as studyprogresses.
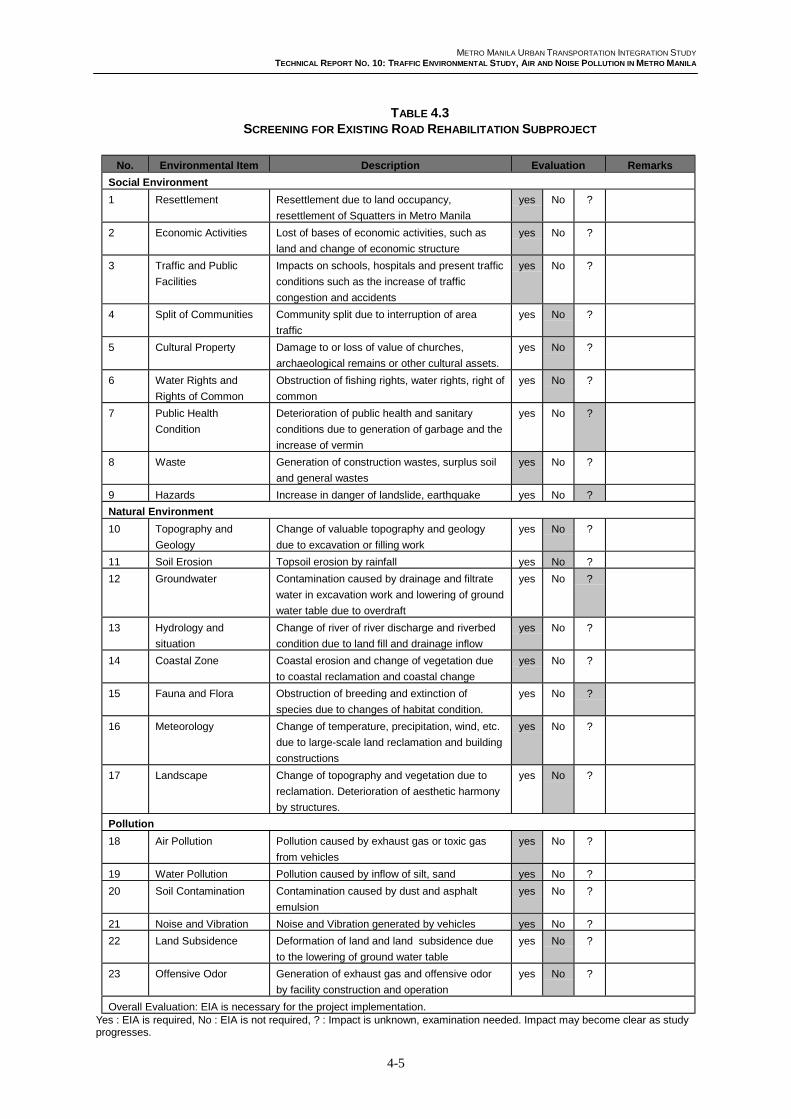
METRO MANILA URBAN TRANSPORTATION INTEGRATION STUDY
TECHNICAL REPORT NO. 10: TRAFFIC ENVIRONMENTAL STUDY, AIR AND NOISE POLLUTION IN METRO MANILA
4-5
TABLE 4.3SCREENING FOR EXISTING ROAD REHABILITATION SUBPROJECT
No. Environmental Item Description Evaluation Remarks
Social Environment
1 Resettlement Resettlement due to land occupancy,
resettlement of Squatters in Metro Manila
yes No ?
2 Economic Activities Lost of bases of economic activities, such as
land and change of economic structure
yes No ?
3 Traffic and Public
Facilities
Impacts on schools, hospitals and present traffic
conditions such as the increase of traffic
congestion and accidents
yes No ?
4 Split of Communities Community split due to interruption of area
traffic
yes No ?
5 Cultural Property Damage to or loss of value of churches,
archaeological remains or other cultural assets.
yes No ?
6 Water Rights and
Rights of Common
Obstruction of fishing rights, water rights, right of
common
yes No ?
7 Public Health
Condition
Deterioration of public health and sanitary
conditions due to generation of garbage and the
increase of vermin
yes No ?
8 Waste Generation of construction wastes, surplus soil
and general wastes
yes No ?
9 Hazards Increase in danger of landslide, earthquake yes No ?
Natural Environment
10 Topography and
Geology
Change of valuable topography and geology
due to excavation or filling work
yes No ?
11 Soil Erosion Topsoil erosion by rainfall yes No ?
12 Groundwater Contamination caused by drainage and filtrate
water in excavation work and lowering of ground
water table due to overdraft
yes No ?
13 Hydrology and
situation
Change of river of river discharge and riverbed
condition due to land fill and drainage inflow
yes No ?
14 Coastal Zone Coastal erosion and change of vegetation due
to coastal reclamation and coastal change
yes No ?
15 Fauna and Flora Obstruction of breeding and extinction of
species due to changes of habitat condition.
yes No ?
16 Meteorology Change of temperature, precipitation, wind, etc.
due to large-scale land reclamation and building
constructions
yes No ?
17 Landscape Change of topography and vegetation due to
reclamation. Deterioration of aesthetic harmony
by structures.
yes No ?
Pollution
18 Air Pollution Pollution caused by exhaust gas or toxic gas
from vehicles
yes No ?
19 Water Pollution Pollution caused by inflow of silt, sand yes No ?
20 Soil Contamination Contamination caused by dust and asphalt
emulsion
yes No ?
21 Noise and Vibration Noise and Vibration generated by vehicles yes No ?
22 Land Subsidence Deformation of land and land subsidence due
to the lowering of ground water table
yes No ?
23 Offensive Odor Generation of exhaust gas and offensive odor
by facility construction and operation
yes No ?
Overall Evaluation: EIA is necessary for the project implementation.Yes : EIA is required, No : EIA is not required, ? : Impact is unknown, examination needed. Impact may become clear as studyprogresses.

METRO MANILA URBAN TRANSPORTATION INTEGRATION STUDY
TECHNICAL REPORT NO. 10: TRAFFIC ENVIRONMENTAL STUDY, AIR AND NOISE POLLUTION IN METRO MANILA
4-6
TABLE 4.4SCREENING FOR LRT NEW LINE CONSTRUCTION SUBPROJECT
No. Environmental Item Description Evaluation Remarks
Social Environment
1 Resettlement Resettlement due to land occupancy,
resettlement of Squatters in Metro Manila
yes No ?
2 Economic Activities Lost of bases of economic activities, such as
land and change of economic structure
yes No ?
3 Traffic and Public
Facilities
Impacts on schools, hospitals and present traffic
conditions such as the increase of traffic
congestion and accidents
yes No ?
4 Split of Communities Community split due to interruption of area
traffic
yes No ?
5 Cultural Property Damage to or loss of value of churches,
archaeological remains or other cultural assets.
yes No ?
6 Water Rights and
Rights of Common
Obstruction of fishing rights, water rights, right of
common
yes No ?
7 Public Health
Condition
Deterioration of public health and sanitary
conditions due to generation of garbage and the
increase of vermin
yes No ?
8 Waste Generation of construction wastes, surplus soil
and general wastes
yes No ?
9 Hazards Increase in danger of landslide, earthquake yes No ?
Natural Environment
10 Topography and
Geology
Change of valuable topography and geology
due to excavation or filling work
yes No ?
11 Soil Erosion Topsoil erosion by rainfall yes No ?
12 Groundwater Contamination caused by drainage and filtrate
water in excavation work and lowering of ground
water table due to overdraft
yes No ?
13 Hydrology and
situation
Change of river of river discharge and riverbed
condition due to land fill and drainage inflow
yes No ?
14 Coastal Zone Coastal erosion and change of vegetation due
to coastal reclamation and coastal change
yes No ?
15 Fauna and Flora Obstruction of breeding and extinction of
species due to changes of habitat condition.
yes No ?
16 Meteorology Change of temperature, precipitation, wind, etc.
due to large-scale land reclamation and building
constructions
yes No ?
17 Landscape Change of topography and vegetation due to
reclamation. Deterioration of aesthetic harmony
by structures.
yes No ?
Pollution
18 Air Pollution Pollution caused by exhaust gas or toxic gas
from vehicles
yes No ?
19 Water Pollution Pollution caused by inflow of silt, sand yes No ?
20 Soil Contamination Contamination caused by dust and asphalt
emulsion
yes No ?
21 Noise and Vibration Noise and Vibration generated by vehicles yes No ?
22 Land Subsidence Deformation of land and land subsidence due
to the lowering of ground water table
yes No ?
23 Offensive Odor Generation of exhaust gas and offensive odor
by facility construction and operation
yes No ?
Overall Evaluation: EIA is necessary for the project implementation.Yes : EIA is required, No : EIA is not required, ? : Impact is unknown, examination needed. Impact may become clear as studyprogresses.
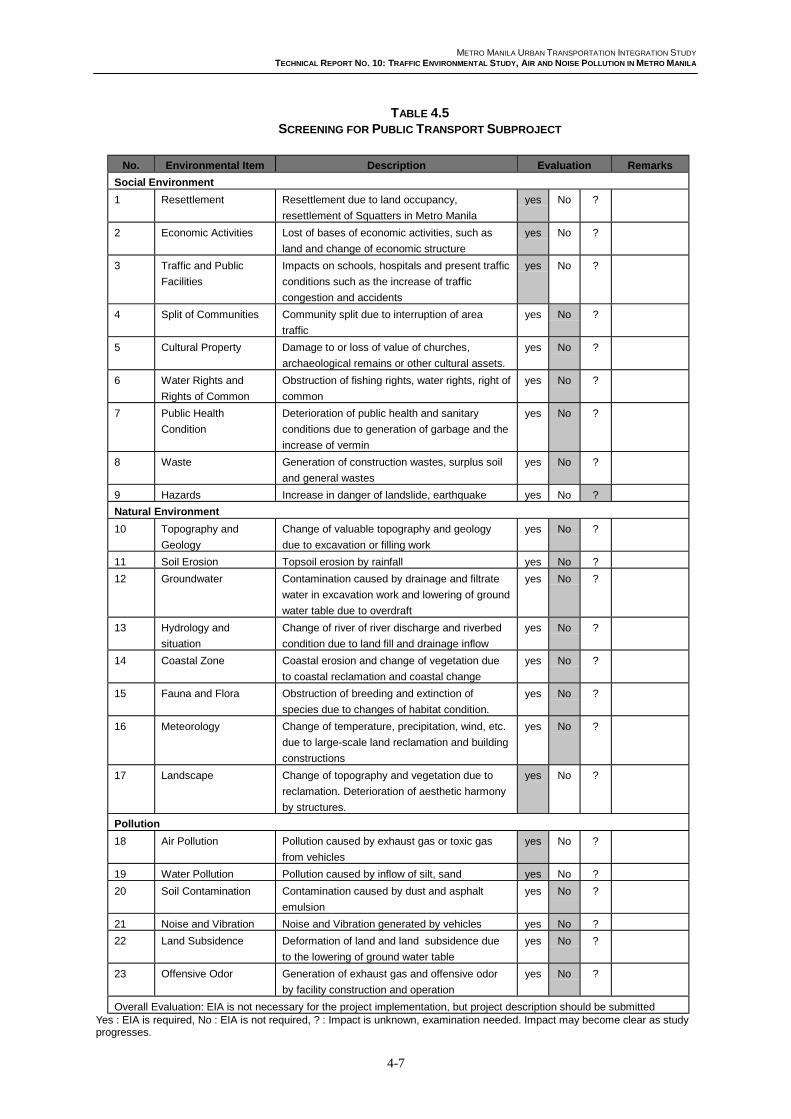
METRO MANILA URBAN TRANSPORTATION INTEGRATION STUDY
TECHNICAL REPORT NO. 10: TRAFFIC ENVIRONMENTAL STUDY, AIR AND NOISE POLLUTION IN METRO MANILA
4-7
TABLE 4.5SCREENING FOR PUBLIC TRANSPORT SUBPROJECT
No. Environmental Item Description Evaluation Remarks
Social Environment
1 Resettlement Resettlement due to land occupancy,
resettlement of Squatters in Metro Manila
yes No ?
2 Economic Activities Lost of bases of economic activities, such as
land and change of economic structure
yes No ?
3 Traffic and Public
Facilities
Impacts on schools, hospitals and present traffic
conditions such as the increase of traffic
congestion and accidents
yes No ?
4 Split of Communities Community split due to interruption of area
traffic
yes No ?
5 Cultural Property Damage to or loss of value of churches,
archaeological remains or other cultural assets.
yes No ?
6 Water Rights and
Rights of Common
Obstruction of fishing rights, water rights, right of
common
yes No ?
7 Public Health
Condition
Deterioration of public health and sanitary
conditions due to generation of garbage and the
increase of vermin
yes No ?
8 Waste Generation of construction wastes, surplus soil
and general wastes
yes No ?
9 Hazards Increase in danger of landslide, earthquake yes No ?
Natural Environment
10 Topography and
Geology
Change of valuable topography and geology
due to excavation or filling work
yes No ?
11 Soil Erosion Topsoil erosion by rainfall yes No ?
12 Groundwater Contamination caused by drainage and filtrate
water in excavation work and lowering of ground
water table due to overdraft
yes No ?
13 Hydrology and
situation
Change of river of river discharge and riverbed
condition due to land fill and drainage inflow
yes No ?
14 Coastal Zone Coastal erosion and change of vegetation due
to coastal reclamation and coastal change
yes No ?
15 Fauna and Flora Obstruction of breeding and extinction of
species due to changes of habitat condition.
yes No ?
16 Meteorology Change of temperature, precipitation, wind, etc.
due to large-scale land reclamation and building
constructions
yes No ?
17 Landscape Change of topography and vegetation due to
reclamation. Deterioration of aesthetic harmony
by structures.
yes No ?
Pollution
18 Air Pollution Pollution caused by exhaust gas or toxic gas
from vehicles
yes No ?
19 Water Pollution Pollution caused by inflow of silt, sand yes No ?
20 Soil Contamination Contamination caused by dust and asphalt
emulsion
yes No ?
21 Noise and Vibration Noise and Vibration generated by vehicles yes No ?
22 Land Subsidence Deformation of land and land subsidence due
to the lowering of ground water table
yes No ?
23 Offensive Odor Generation of exhaust gas and offensive odor
by facility construction and operation
yes No ?
Overall Evaluation: EIA is not necessary for the project implementation, but project description should be submittedYes : EIA is required, No : EIA is not required, ? : Impact is unknown, examination needed. Impact may become clear as studyprogresses.
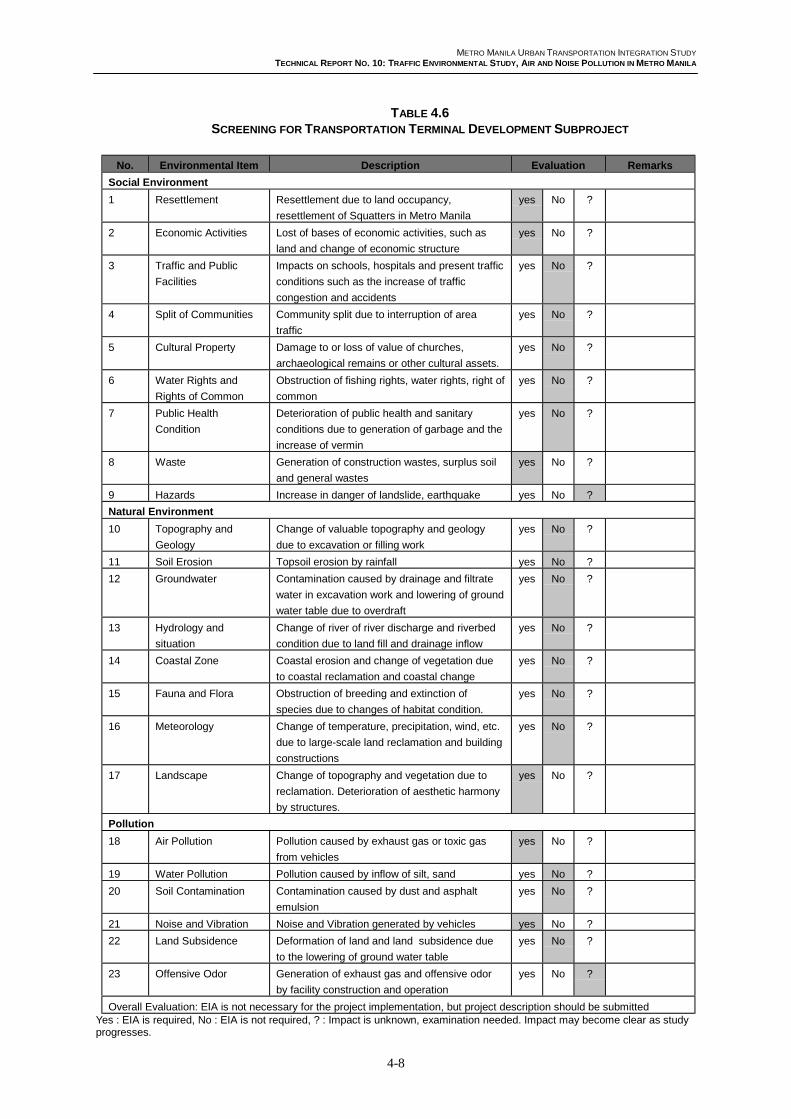
METRO MANILA URBAN TRANSPORTATION INTEGRATION STUDY
TECHNICAL REPORT NO. 10: TRAFFIC ENVIRONMENTAL STUDY, AIR AND NOISE POLLUTION IN METRO MANILA
4-8
TABLE 4.6SCREENING FOR TRANSPORTATION TERMINAL DEVELOPMENT SUBPROJECT
No. Environmental Item Description Evaluation Remarks
Social Environment
1 Resettlement Resettlement due to land occupancy,
resettlement of Squatters in Metro Manila
yes No ?
2 Economic Activities Lost of bases of economic activities, such as
land and change of economic structure
yes No ?
3 Traffic and Public
Facilities
Impacts on schools, hospitals and present traffic
conditions such as the increase of traffic
congestion and accidents
yes No ?
4 Split of Communities Community split due to interruption of area
traffic
yes No ?
5 Cultural Property Damage to or loss of value of churches,
archaeological remains or other cultural assets.
yes No ?
6 Water Rights and
Rights of Common
Obstruction of fishing rights, water rights, right of
common
yes No ?
7 Public Health
Condition
Deterioration of public health and sanitary
conditions due to generation of garbage and the
increase of vermin
yes No ?
8 Waste Generation of construction wastes, surplus soil
and general wastes
yes No ?
9 Hazards Increase in danger of landslide, earthquake yes No ?
Natural Environment
10 Topography and
Geology
Change of valuable topography and geology
due to excavation or filling work
yes No ?
11 Soil Erosion Topsoil erosion by rainfall yes No ?
12 Groundwater Contamination caused by drainage and filtrate
water in excavation work and lowering of ground
water table due to overdraft
yes No ?
13 Hydrology and
situation
Change of river of river discharge and riverbed
condition due to land fill and drainage inflow
yes No ?
14 Coastal Zone Coastal erosion and change of vegetation due
to coastal reclamation and coastal change
yes No ?
15 Fauna and Flora Obstruction of breeding and extinction of
species due to changes of habitat condition.
yes No ?
16 Meteorology Change of temperature, precipitation, wind, etc.
due to large-scale land reclamation and building
constructions
yes No ?
17 Landscape Change of topography and vegetation due to
reclamation. Deterioration of aesthetic harmony
by structures.
yes No ?
Pollution
18 Air Pollution Pollution caused by exhaust gas or toxic gas
from vehicles
yes No ?
19 Water Pollution Pollution caused by inflow of silt, sand yes No ?
20 Soil Contamination Contamination caused by dust and asphalt
emulsion
yes No ?
21 Noise and Vibration Noise and Vibration generated by vehicles yes No ?
22 Land Subsidence Deformation of land and land subsidence due
to the lowering of ground water table
yes No ?
23 Offensive Odor Generation of exhaust gas and offensive odor
by facility construction and operation
yes No ?
Overall Evaluation: EIA is not necessary for the project implementation, but project description should be submittedYes : EIA is required, No : EIA is not required, ? : Impact is unknown, examination needed. Impact may become clear as studyprogresses.
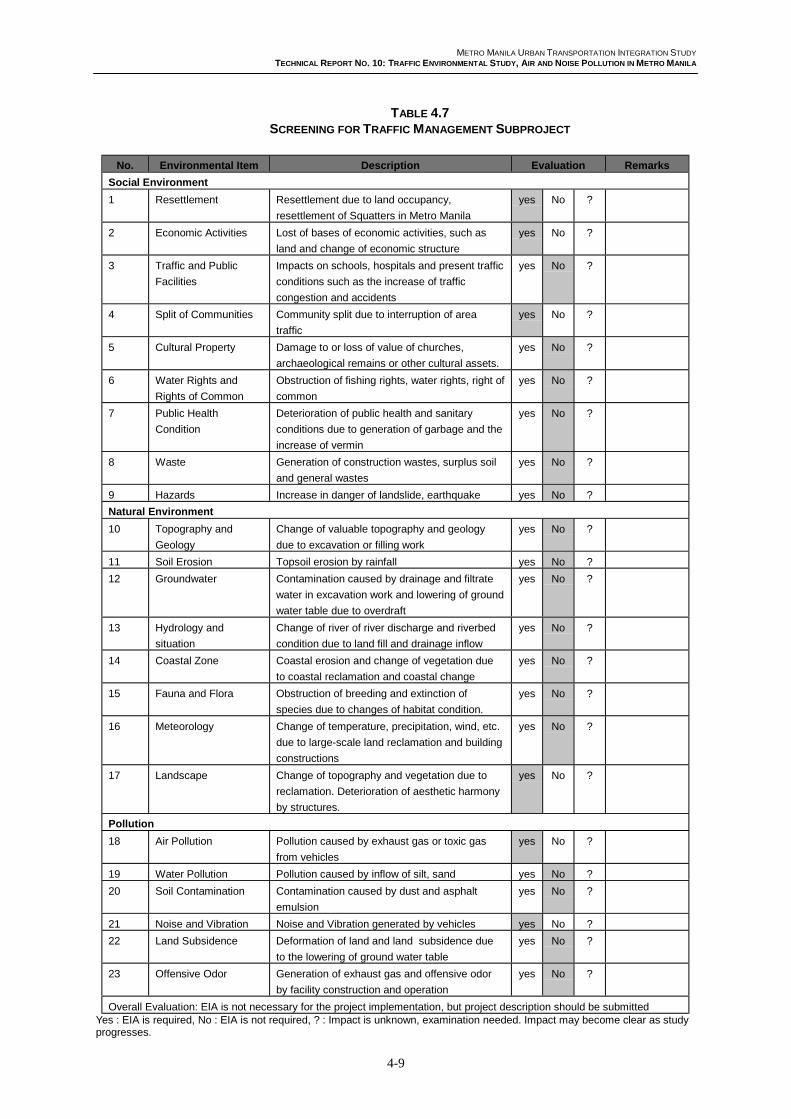
METRO MANILA URBAN TRANSPORTATION INTEGRATION STUDY
TECHNICAL REPORT NO. 10: TRAFFIC ENVIRONMENTAL STUDY, AIR AND NOISE POLLUTION IN METRO MANILA
4-9
TABLE 4.7SCREENING FOR TRAFFIC MANAGEMENT SUBPROJECT
No. Environmental Item Description Evaluation Remarks
Social Environment
1 Resettlement Resettlement due to land occupancy,
resettlement of Squatters in Metro Manila
yes No ?
2 Economic Activities Lost of bases of economic activities, such as
land and change of economic structure
yes No ?
3 Traffic and Public
Facilities
Impacts on schools, hospitals and present traffic
conditions such as the increase of traffic
congestion and accidents
yes No ?
4 Split of Communities Community split due to interruption of area
traffic
yes No ?
5 Cultural Property Damage to or loss of value of churches,
archaeological remains or other cultural assets.
yes No ?
6 Water Rights and
Rights of Common
Obstruction of fishing rights, water rights, right of
common
yes No ?
7 Public Health
Condition
Deterioration of public health and sanitary
conditions due to generation of garbage and the
increase of vermin
yes No ?
8 Waste Generation of construction wastes, surplus soil
and general wastes
yes No ?
9 Hazards Increase in danger of landslide, earthquake yes No ?
Natural Environment
10 Topography and
Geology
Change of valuable topography and geology
due to excavation or filling work
yes No ?
11 Soil Erosion Topsoil erosion by rainfall yes No ?
12 Groundwater Contamination caused by drainage and filtrate
water in excavation work and lowering of ground
water table due to overdraft
yes No ?
13 Hydrology and
situation
Change of river of river discharge and riverbed
condition due to land fill and drainage inflow
yes No ?
14 Coastal Zone Coastal erosion and change of vegetation due
to coastal reclamation and coastal change
yes No ?
15 Fauna and Flora Obstruction of breeding and extinction of
species due to changes of habitat condition.
yes No ?
16 Meteorology Change of temperature, precipitation, wind, etc.
due to large-scale land reclamation and building
constructions
yes No ?
17 Landscape Change of topography and vegetation due to
reclamation. Deterioration of aesthetic harmony
by structures.
yes No ?
Pollution
18 Air Pollution Pollution caused by exhaust gas or toxic gas
from vehicles
yes No ?
19 Water Pollution Pollution caused by inflow of silt, sand yes No ?
20 Soil Contamination Contamination caused by dust and asphalt
emulsion
yes No ?
21 Noise and Vibration Noise and Vibration generated by vehicles yes No ?
22 Land Subsidence Deformation of land and land subsidence due
to the lowering of ground water table
yes No ?
23 Offensive Odor Generation of exhaust gas and offensive odor
by facility construction and operation
yes No ?
Overall Evaluation: EIA is not necessary for the project implementation, but project description should be submittedYes : EIA is required, No : EIA is not required, ? : Impact is unknown, examination needed. Impact may become clear as studyprogresses.

METRO MANILA URBAN TRANSPORTATION INTEGRATION STUDY
TECHNICAL REPORT NO. 10: TRAFFIC ENVIRONMENTAL STUDY, AIR AND NOISE POLLUTION IN METRO MANILA
4-10
TABLE 4.8SCREENING FOR TRAFFIC ENVIRONMENTAL IMPROVEMENT SUBPROJECT
No. Environmental Item Description Evaluation Remarks
Social Environment
1 Resettlement Resettlement due to land occupancy,
resettlement of Squatters in Metro Manila
yes No ?
2 Economic Activities Lost of bases of economic activities, such as
land and change of economic structure
yes No ?
3 Traffic and Public
Facilities
Impacts on schools, hospitals and present traffic
conditions such as the increase of traffic
congestion and accidents
yes No ?
4 Split of Communities Community split due to interruption of area
traffic
yes No ?
5 Cultural Property Damage to or loss of value of churches,
archaeological remains or other cultural assets.
yes No ?
6 Water Rights and
Rights of Common
Obstruction of fishing rights, water rights, right of
common
yes No ?
7 Public Health
Condition
Deterioration of public health and sanitary
conditions due to generation of garbage and the
increase of vermin
yes No ?
8 Waste Generation of construction wastes, surplus soil
and general wastes
yes No ?
9 Hazards Increase in danger of landslide, earthquake yes No ?
Natural Environment
10 Topography and
Geology
Change of valuable topography and geology
due to excavation or filling work
yes No ?
11 Soil Erosion Topsoil erosion by rainfall yes No ?
12 Groundwater Contamination caused by drainage and filtrate
water in excavation work and lowering of ground
water table due to overdraft
yes No ?
13 Hydrology and
situation
Change of river of river discharge and riverbed
condition due to land fill and drainage inflow
yes No ?
14 Coastal Zone Coastal erosion and change of vegetation due
to coastal reclamation and coastal change
yes No ?
15 Fauna and Flora Obstruction of breeding and extinction of
species due to changes of habitat condition.
yes No ?
16 Meteorology Change of temperature, precipitation, wind, etc.
due to large-scale land reclamation and building
constructions
yes No ?
17 Landscape Change of topography and vegetation due to
reclamation. Deterioration of aesthetic harmony
by structures.
yes No ?
Pollution
18 Air Pollution Pollution caused by exhaust gas or toxic gas
from vehicles
yes No ?
19 Water Pollution Pollution caused by inflow of silt, sand yes No ?
20 Soil Contamination Contamination caused by dust and asphalt
emulsion
yes No ?
21 Noise and Vibration Noise and Vibration generated by vehicles yes No ?
22 Land Subsidence Deformation of land and land subsidence due
to the lowering of ground water table
yes No ?
23 Offensive Odor Generation of exhaust gas and offensive odor
by facility construction and operation
yes No ?
Overall Evaluation: EIA is not necessary for the project implementation, but project description should be submittedYes : EIA is required, No : EIA is not required, ? : Impact is unknown, examination needed. Impact may become clear as studyprogresses.

METRO MANILA URBAN TRANSPORTATION INTEGRATION STUDY
TECHNICAL REPORT NO. 10: TRAFFIC ENVIRONMENTAL STUDY, AIR AND NOISE POLLUTION IN METRO MANILA
4-11
TABLE 4.9SCOPING CHECKLIST FOR NEW ROAD CONSTRUCTION
No. Environmental items Evaluation Basis
Socio Environment
1. Resettlement A Land acquisition for the construction of new road construction
2. Economic Activities B Inflow and outflow of population and goods resulting from
operation of traffic
3. Traffic/Public Facilities B Change of transport means by the operation of new roads,
traffic control.
4. Split of Community A Interruption of existing regional transportation, pedestrian
traffic, and distribution of goods due to construction of new
roads.
5. Cultural property C Vibration and air pollution caused by vehicles and heavy
equipment.
6. Water right/ Right of
Common.
B Obstruction of fishing right, and water right, right of common.
7. Public health A Generation of construction wastes, surplus soil and general
waste.
8. Waste B Generation of debris and construction waste following the
construction of new roads.
9. Hazards(Risk) C Damage to roads and buildings due to construction work of
transportation facilities.
Natural Environment
10. Topography/Geology D Change of valuable topography and geology due to
excavation or filling work.
11. Soil erosion C Topsoil erosion by rainfall
12. Groundwater C Contamination caused by drainage and filtrate water in
excavation work and lowering of ground water table due to
overdraft.
13. Hydrology C Hydrology regime would be altered by structures, such as
piers, when the route passes over lakes and rivers
14. Coastal zone B Coastal erosion and change of vegetation due to coastal
reclamation.
15. Fauna / Flora B Removal of vegetation and extinction. Generation of exhaust
gas from operating vehicles.
16. Meteorology D Change of temperature, precipitation, wind etc. due to large
scale elevated roads and
17. Landscape C Change of topography by construction and appearance of
transportation facilities
Pollution
18 Air pollution B Exhaust gas and dust generated by heavy equipment and
vehicles.
19 Water pollution B Pollution caused by inflow of silt, sand
20 Soil contamination B Dispersion of paving materials, such as asphalt emulsion,
during construction
21 Noise and vibration B Operation of construction equipment and vehicles
22 Land subsidence C Deformation of land and land subsidence due to the lowering
of ground water
23 Offensive odor B Generation of exhaust gas and offensive odor by facility
construction and operation
Note : Evaluation grade
A : Serious impact is expected
B : Some impact is expected
C : Extent of impact is unknown (Examination is needed. Impacts may become clear as study progresses).
D : No impact is expected

METRO MANILA URBAN TRANSPORTATION INTEGRATION STUDY
TECHNICAL REPORT NO. 10: TRAFFIC ENVIRONMENTAL STUDY, AIR AND NOISE POLLUTION IN METRO MANILA
4-12
TABLE 4.10SCOPING CHECKLIST FOR EXISTING ROAD REHABILITATION
No. Environmental items Evaluation Basis
Socio Environment
1. Resettlement B Land acquisition for the construction of new road construction
2. Economic Activities C Inflow and outflow of population and goods resulting from
operation of traffic
3. Traffic/Public Facilities C Change of transport means by the operation of new roads,
traffic control.
4. Split of Community D Interruption of existing regional transportation, pedestrian
traffic, and distribution of goods due to construction of new
roads.
5. Cultural property D Vibration and air pollution caused by vehicles and heavy
equipment.
6. Water right/ Right of
Common.
D Obstruction of fishing right, and water right, right of common.
7. Public health B Generation of construction wastes, surplus soil and general
waste.
8. Waste B Generation of debris and construction waste following the
construction of new roads.
9. Hazards(Risk) C Damage to roads and buildings due to construction work of
transportation facilities.
Natural Environment
10. Topography/Geology D Change of valuable topography and geology due to
excavation or filling work.
11. Soil erosion D Topsoil erosion by rainfall
12. Groundwater Contamination caused by drainage and filtrate water in
excavation work and lowering of ground water table due to
overdraft.
13. Hydrology C Hydrology regime would be altered by structures, such as
piers, when the route passes over lakes and rivers
14. Coastal zone C Coastal erosion and change of vegetation due to coastal
reclamation.
15. Fauna / Flora D Removal of vegetation and extinction. Generation of exhaust
gas from operating vehicles.
16. Meteorology D Change of temperature, precipitation, wind etc. due to large
scale elevated roads and
17. Landscape D Change of topography by construction and appearance of
transportation facilities
Pollution
18 Air pollution B Exhaust gas and dust generated by heavy equipment and
vehicles.
19 Water pollution B Pollution caused by inflow of silt, sand
20 Soil contamination B Dispersion of paving materials, such as asphalt emulsion,
during construction
21 Noise and vibration C Operation of construction equipment and vehicles
22 Land subsidence C Deformation of land and land subsidence due to the lowering
of ground water
23 Offensive odor C Generation of exhaust gas and offensive odor by facility
construction and operation
Note : Evaluation grade
A : Serious impact is expected
B : Some impact is expected
C : Extent of impact is unknown (Examination is needed. Impacts may be become clear as study progresses).
D : No impact is expected
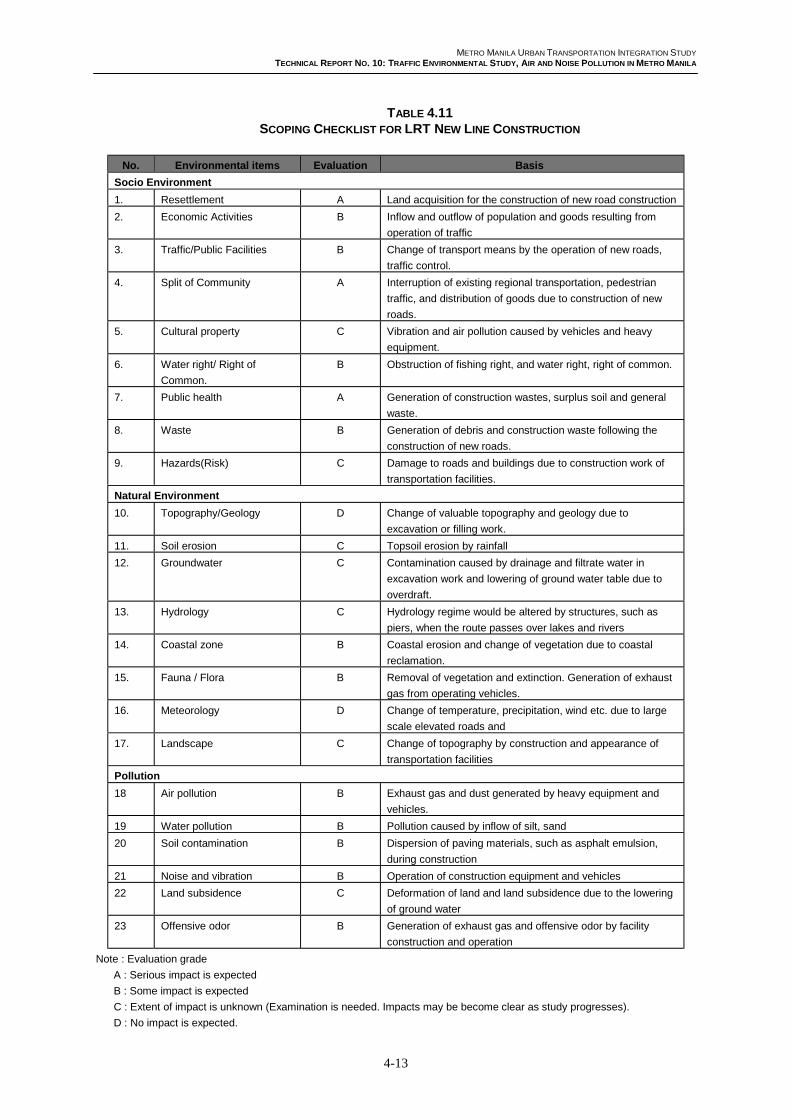
METRO MANILA URBAN TRANSPORTATION INTEGRATION STUDY
TECHNICAL REPORT NO. 10: TRAFFIC ENVIRONMENTAL STUDY, AIR AND NOISE POLLUTION IN METRO MANILA
4-13
TABLE 4.11SCOPING CHECKLIST FOR LRT NEW LINE CONSTRUCTION
No. Environmental items Evaluation Basis
Socio Environment
1. Resettlement A Land acquisition for the construction of new road construction
2. Economic Activities B Inflow and outflow of population and goods resulting from
operation of traffic
3. Traffic/Public Facilities B Change of transport means by the operation of new roads,
traffic control.
4. Split of Community A Interruption of existing regional transportation, pedestrian
traffic, and distribution of goods due to construction of new
roads.
5. Cultural property C Vibration and air pollution caused by vehicles and heavy
equipment.
6. Water right/ Right of
Common.
B Obstruction of fishing right, and water right, right of common.
7. Public health A Generation of construction wastes, surplus soil and general
waste.
8. Waste B Generation of debris and construction waste following the
construction of new roads.
9. Hazards(Risk) C Damage to roads and buildings due to construction work of
transportation facilities.
Natural Environment
10. Topography/Geology D Change of valuable topography and geology due to
excavation or filling work.
11. Soil erosion C Topsoil erosion by rainfall
12. Groundwater C Contamination caused by drainage and filtrate water in
excavation work and lowering of ground water table due to
overdraft.
13. Hydrology C Hydrology regime would be altered by structures, such as
piers, when the route passes over lakes and rivers
14. Coastal zone B Coastal erosion and change of vegetation due to coastal
reclamation.
15. Fauna / Flora B Removal of vegetation and extinction. Generation of exhaust
gas from operating vehicles.
16. Meteorology D Change of temperature, precipitation, wind etc. due to large
scale elevated roads and
17. Landscape C Change of topography by construction and appearance of
transportation facilities
Pollution
18 Air pollution B Exhaust gas and dust generated by heavy equipment and
vehicles.
19 Water pollution B Pollution caused by inflow of silt, sand
20 Soil contamination B Dispersion of paving materials, such as asphalt emulsion,
during construction
21 Noise and vibration B Operation of construction equipment and vehicles
22 Land subsidence C Deformation of land and land subsidence due to the lowering
of ground water
23 Offensive odor B Generation of exhaust gas and offensive odor by facility
construction and operation
Note : Evaluation grade
A : Serious impact is expected
B : Some impact is expected
C : Extent of impact is unknown (Examination is needed. Impacts may be become clear as study progresses).
D : No impact is expected.
METRO MANILA URBAN TRANSPORTATION INTEGRATION STUDY
TECHNICAL REPORT NO. 10: TRAFFIC ENVIRONMENTAL STUDY, AIR AND NOISE POLLUTION IN METRO MANILA
5-1
5. ESTIMATION OF AIR POLLUTANT EMISSION IN METRO MANILA
Even while it brings unquestionable benefits, the transport sector may induceindispensable side effects, such as environmental degradation. This chapter examinesthe interaction between transport and the environment, contributing to unsustainabilityin urban travel.
Many transport policies in other countries have already taken into consideration thesector’s effects on the environment. After a recent prototypical example of transportpolicy in other countries is introduced, proposed measures for air qualityimprovement in Metro Manila were reviewed. Based on this, an environmentalanalysis was carried out in Metro Manila, the findings of which are discussed in thefollowing sections. Finally, appropriate transport policies for sustainableenvironmental development are tentatively recommended.
5.1 Relationship Between Transport and the Environment
It is very important to understand the interaction between transport and environmentbecause transport policy starts from it. As shown in Figure 5.1, a lot of factors areconsiderably interrelated. In general, the transport sector’s environmental impact isdetermined largely by the vehicles themselves and the way they are used. A criticalissue is how to cope with rapidly increasing travel demand (i.e., more journeys, longerjourneys and greater car use).
Travel demand has been increasing at a rapid rate annually. A comparison of the 1980and 1996 person trip surveys in Metro Manila indicates that over that 16-year period,the number of trips increased by 63.6%. A rough estimation indicates that totalvehicle travel by the year 2015, in vehicle-km, will increase by around 170% in the“Do-Nothing” case. This scenario is encouraged by a number of factors, including thetrend to lower density development; the construction of larger, more remote, schools,shopping centers and hospitals; provision of transport at less than the marginal cost;and discouragement of shorter journeys. As a result, conditions for walking andcycling are worsened and the level of public service is reduced. More journeys,longer journeys and greater car use have worsened environmental quality and radicalsteps on how to deal with these factors are already being taken in many othercountries. [Source: “Transport, the Environment and Sustainable Development”(1993)]
5.2 Policy Responses
As the environmental quality worsens day by day, a new approach or concept hasbeen proposed. In the past, demand forecasts have been made for traffic and networkshave been defined to meet that demand. It has now been recognized that it may not besocially efficient, or desirable or possible to meet unrestricted demand. Thus, TDM(Transport Demand Management) and institutionalized measures as well as supply-side measures have become the key concerns of transport planners. In particular, anintegrated package approach, that includes not only supply-side measures but alsodemand-side or institutionalized measures, has been thought to be a more effectiveapproach to reduce travel demand, improve the environmental quality and, as a result,attain policy goals.
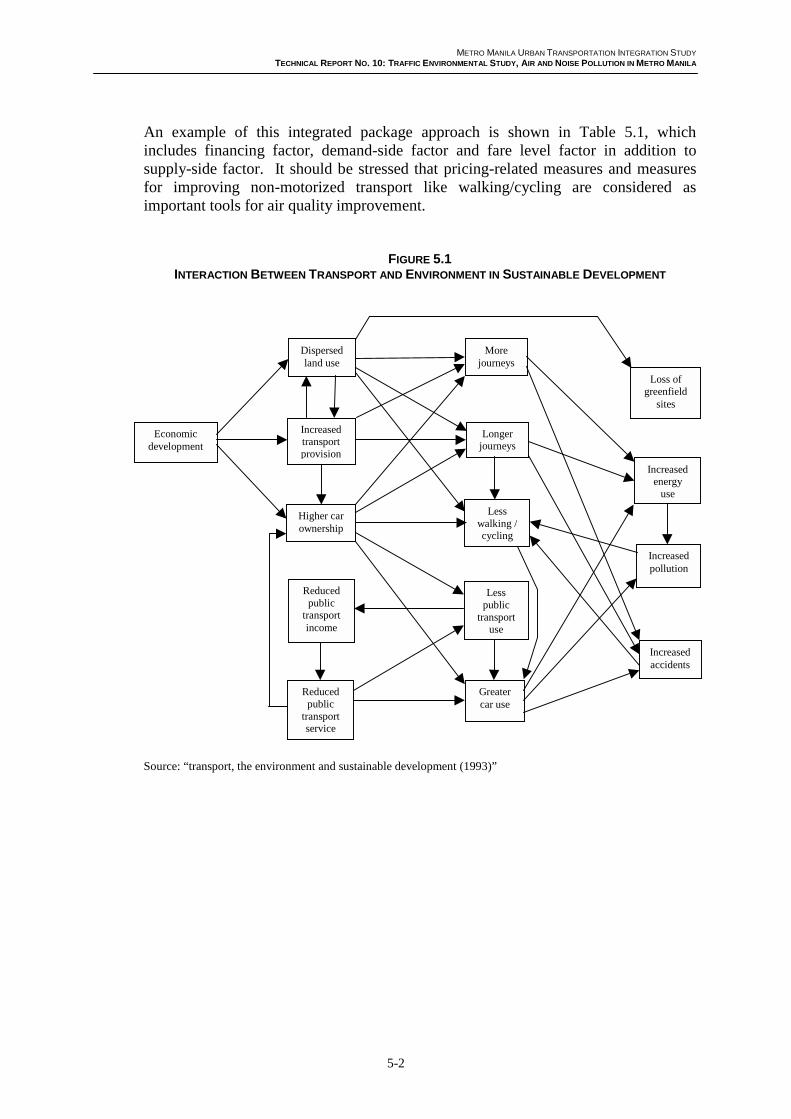
METRO MANILA URBAN TRANSPORTATION INTEGRATION STUDY
TECHNICAL REPORT NO. 10: TRAFFIC ENVIRONMENTAL STUDY, AIR AND NOISE POLLUTION IN METRO MANILA
5-2
An example of this integrated package approach is shown in Table 5.1, whichincludes financing factor, demand-side factor and fare level factor in addition tosupply-side factor. It should be stressed that pricing-related measures and measuresfor improving non-motorized transport like walking/cycling are considered asimportant tools for air quality improvement.
FIGURE 5.1INTERACTION BETWEEN TRANSPORT AND ENVIRONMENT IN SUSTAINABLE DEVELOPMENT
Source: “transport, the environment and sustainable development (1993)”
Increasedtransportprovision
Higher carownership
Reducedpublic
transportincome
Reducedpublic
transportservice
Morejourneys
Longerjourneys
Lesswalking /cycling
Lesspublic
transportuse
Greatercar use
Loss ofgreenfield
sites
Increasedenergy
use
Increasedpollution
Increasedaccidents
Economicdevelopment
Dispersedland use

METRO MANILA URBAN TRANSPORTATION INTEGRATION STUDY
TECHNICAL REPORT NO. 10: TRAFFIC ENVIRONMENTAL STUDY, AIR AND NOISE POLLUTION IN METRO MANILA
5-3
TABLE 5.1AN EXAMPLE OF INTEGRATED PACKAGE APPROACH
StrategyDo
MinimumC1 C2 C3 C4 C5 C6
Access by car – – – – – ÷ ÷ ÷ – ÷ ÷ – – – – – –
Access by bus / rail – – – – ÷ ÷ ÷ ÷ ÷ ÷ ÷ ÷ ÷ – – – – –
Environmental quality – – – – – – – – ÷ – – – – – – –
Local economic activity – – – – – – – – – ÷ ÷ ÷ ÷ – – – – – – – –
Fuel consumption – 16% – 2% – 7% 0 – 10% – 1% – 16%
Casualties – 7% – 8% – 1% – 7% – 2% – 7% – 2%
Benefits (£m NPV) N/A – 410 – 300 – 330 – 180 – 310 – 110
Finance (£m PVF) N/A – 260 – 270 – 100 – 160 – 10 0
Capital costs (£ 1990) N/A 530 520 530 340 530 340
Key: < Worse Better >– – – – – – – – – – – – – – – ( ) – – – – – – – – – – – – – – –
NVP: Net Present Value (a measure of economic efficiency) relative to Do Minimum
The Six Combined Strategies
Strategy C1 C2 C3 C4 C5 C6
Finance1 High High Medium Medium Low Low
Infrastruture2 NSEWWR
NSEWWR
NSEWWR
NS
WR
NSEWWR
NS
WRCapacity reduction (%)3 10% 10% 25% 10% 25% 10%
Fares level (%)4 – 50% 0 – 25% 0 – 10% – 25%
Road Pricing5 Yes No Yes No Yes No
Notes:1. High: £200m - £300m PVF:
Medium: £-100m - £200m PVF:Low: Zero Financial Outlay
2. NS: North-South Light Rapid Transit:EW: East-West Light Rapid Transit:WR: Western Radial
3. Percentage reduction in city center road capacity.4. Percentage change from level anticipated in 2010.5. Inclusion or otherwise of a charge of £ to enter or leave the city center throughout the day.6. CI to C6 relates to different strategies being evaluated in Edinburgh.

METRO MANILA URBAN TRANSPORTATION INTEGRATION STUDY
TECHNICAL REPORT NO. 10: TRAFFIC ENVIRONMENTAL STUDY, AIR AND NOISE POLLUTION IN METRO MANILA
5-4
As a general guideline for improving air quality, measures such as those enumeratedin Table 5.2 can be taken considered. In Metro Manila, policy measures that seems tobe appropriate for reducing air pollution were proposed by a foreign research group.These measures are categorized as traffic, power plant, fuel combustion other than inpower plants, non-combustion sources, construction, and refuse burning. Amongthem, specific measures pertaining to traffic are summarized as follows:
1) Enhancing effectiveness of the anti-smoke belching program;2) Improving diesel fuel quality;3) Implementation of a scheme for inspection and maintenance;4) Fuel switches (diesel to gasoline) in the transportation sector induced by price-
shifts;5) Adoption of clean vehicle emission standards; and6) Other measures. (Source: URBAIR, 1995)
TABLE 5.2GENERAL GUIDELINES FOR ALLEVIATING THE AIR POLLUTION PROBLEM
1. Technical Fixes 1: Pollution Reduction and Energy EfficiencyPollution reduction technology - oxidation catalysts
Three-way catalystsCatalysts trap oxidizers
Improving energy efficiencies - engine changes (e.g. lean burn)Weight reductionAerodynamicsOther technological modifications (e.g. transmissionchanges, rolling resistance)
2. Technical Fixes 2: Alternative Fuels and Power SourcesDieselElectricityHydrogenAlternative power sources (e.g. nuclear power, gas from power stations, renewable sources)Gas (e.g. liquefied natural gas, liquefied petroleum gas)Methanol and ethanol
3. The Role of the DriverLower average engine size: the vehicle purchase decisionThe vehicle replacement decisionIncreasing car occupanciesBetter driving practicesBetter maintenance
4. Transport Planning PoliciesInter modal shiftRoad traffic management - Improving traffic flow
Reducing excessive speedsDiscouraging car traffic
Land-use planningOther policies - public information campaigns encouraging
Telecommuting
5. Transport Pricing PoliciesRoad pricingFuel pricing and taxation policiesVehicle pricing and taxation
Source: “Transport, the Environment and Sustainable Development,” (1993)

METRO MANILA URBAN TRANSPORTATION INTEGRATION STUDY
TECHNICAL REPORT NO. 10: TRAFFIC ENVIRONMENTAL STUDY, AIR AND NOISE POLLUTION IN METRO MANILA
5-5
These measures were evaluated from the viewpoint of benefit/cost analysis andevaluation results showed that such measures could, indeed, bring great benefits.However, the above mentioned measures are mainly related to technical factors andno transport demand-related measures were evaluated. From the transportperspective, therefore, their impact on air pollution is herein analyzed and discussed.
5.3 Estimation of Air Pollutant Emission in Metro Manila
An environmental analysis model was developed in order to examine the impact oftransport on air pollution. In addition, some scenarios were evaluated based on thismodel.
5.3.1 Methodology
Air pollution is affected by many factors and consists of a very complex function. Itsgeneral form can be expressed as follows:
Air pollutant emissions = f (travel distance, travel speed, idling, emission factors,wind speed, wind direction)
However, it must be noted that it is very difficult to put so many factors into an airpollution model, especially a macroanalysis model. In general, the traditional trafficassignment model uses travel distance, travel speed and emission factor as exogenousfactors to conduct emission estimation. Aside from these, the methodology presentedin this report will include vehicle idling factor and estimated air pollutant emission.
The methodology for environment analysis is shown in Fig 5.2. Firstly, traveldistances (veh-km) and average speed (km/h) are aggregated by each zone based ontraffic assignment results for the “Do-Nothing,” the “Master Plan” and the “Do-Max”cases. Air pollutant emissions, as mentioned earlier, are estimated based on traveldistances and average speed. However, we have to remember that air pollutantemissions are affected by traveling patterns not only while the vehicle is moving butalso while it is stopped. Therefore, a reasonable emission estimation should considerair pollutant emissions in both moving and immobile vehicles.
The problem is that the traffic assignment result estimated from STRADA does notgive any information on vehicle stop time. This is why we are incorporating the two-fluid model in order to divide travel time into running time and stop time. Only byusing the two-fluid model can we estimate emission units while the vehicle is stopped(i.e., idling) as well as when it is moving. Afterwards, each air pollutant emission(CO, NOx, SOx and SPM) is estimated by zone. Finally, sensitivity analysis wascarried out by varying the share of gasoline and diesel and the share of bus andjeepney.
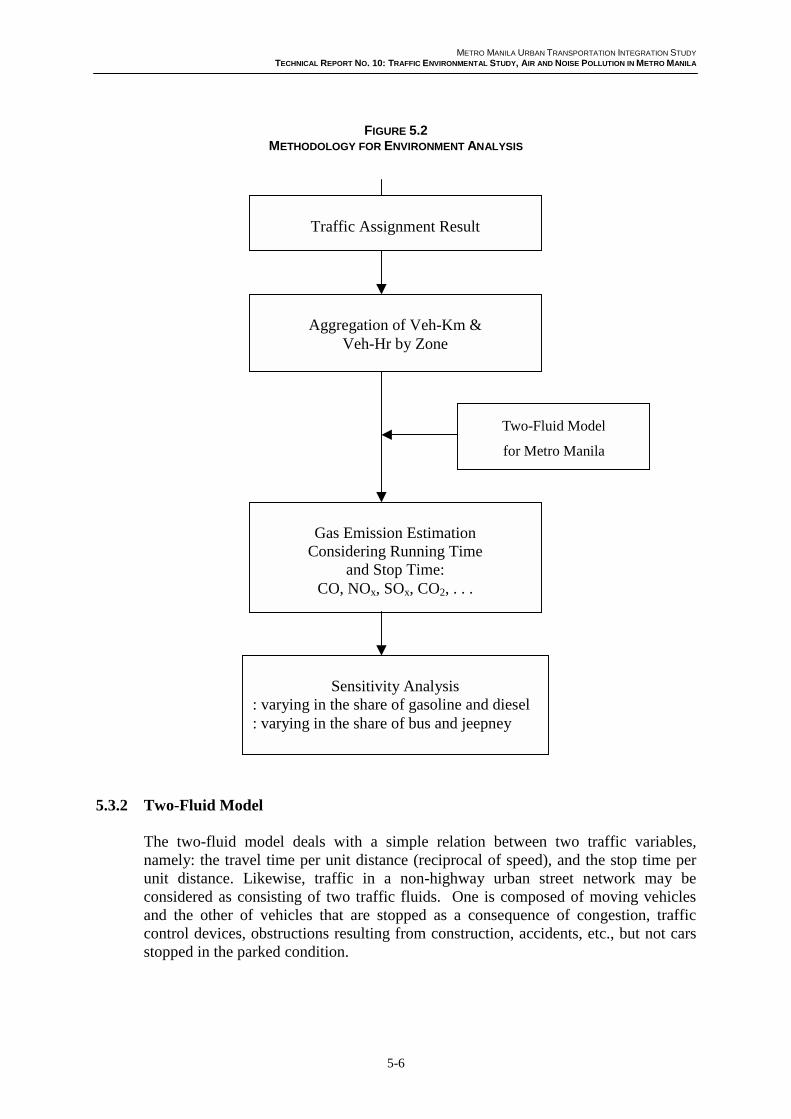
METRO MANILA URBAN TRANSPORTATION INTEGRATION STUDY
TECHNICAL REPORT NO. 10: TRAFFIC ENVIRONMENTAL STUDY, AIR AND NOISE POLLUTION IN METRO MANILA
5-6
FIGURE 5.2METHODOLOGY FOR ENVIRONMENT ANALYSIS
5.3.2 Two-Fluid Model
The two-fluid model deals with a simple relation between two traffic variables,namely: the travel time per unit distance (reciprocal of speed), and the stop time perunit distance. Likewise, traffic in a non-highway urban street network may beconsidered as consisting of two traffic fluids. One is composed of moving vehiclesand the other of vehicles that are stopped as a consequence of congestion, trafficcontrol devices, obstructions resulting from construction, accidents, etc., but not carsstopped in the parked condition.
Traffic Assignment Result
Aggregation of Veh-Km &Veh-Hr by Zone
Gas Emission EstimationConsidering Running Time
and Stop Time:CO, NOx, SOx, CO2, . . .
Two-Fluid Model
for Metro Manila
Sensitivity Analysis: varying in the share of gasoline and diesel: varying in the share of bus and jeepney

METRO MANILA URBAN TRANSPORTATION INTEGRATION STUDY
TECHNICAL REPORT NO. 10: TRAFFIC ENVIRONMENTAL STUDY, AIR AND NOISE POLLUTION IN METRO MANILA
5-7
0
2
4
6
8
10
12
0 1 2 3 4 5 6
Stop Time, Ts(min/Km)
Travel Time,T(min/Km)
n=1,Tm=1.5 n=2,Tm=1.5 n=3,Tm=1.5
n=1,Tm=3 n=2,Tm=3 n=3,Tm=3
In the two-fluid model, the ideas are followed by assuming that the average speed ofthe moving cars, vr, depends on the fraction of the cars that are moving, fr, in thefollowing form:
n
rm
n
rmrr )f(vfvvfv −=== − 11
where vm is the average maximum running speed in the network, v is the averagespeed of the traffic, and n is a parameter. Note that:
1=+ sr ff
mm T/v 1=
rr T/v 1=T/v 1=
where fs and fr are the fraction of thevehicles stopped and moving,respectively; Tm is a parameterrepresenting the average minimumtrip time per unit distance; Tr is therunning time per unit distance; and Tis the trip time per unit distance. If, inaddition, the stop time per unitdistance is denoted by Ts, it followsthat:
rs TTT +=
In the two-fluid model, it is also assumed that the fraction of time stopped for the ithvehicle circulating in a network, (Ts/T)i, is equal to the average fraction of thepopulation of vehicles stopped in the system, <fs>p, over the same time period,namely:
isps )T/T(f =><
These assumptions lead to the two-fluid model relation between the trip time, T, andthe running time, Tr, namely:
11
1
++= n
n
nmr TTT
yielding the final result:
11
1
++−= n
n
nms TTTT
The two-fluid model represented by the equation yields a curvilinear relation betweenT and Ts (as shown in Figure 5.3) for Tm values of 1.5 and 3.0 minutes per km and forn values of 1, 2, and 3.
FIGURE 5.3TRAVEL TIME VERSUS STOP TIME RELATION
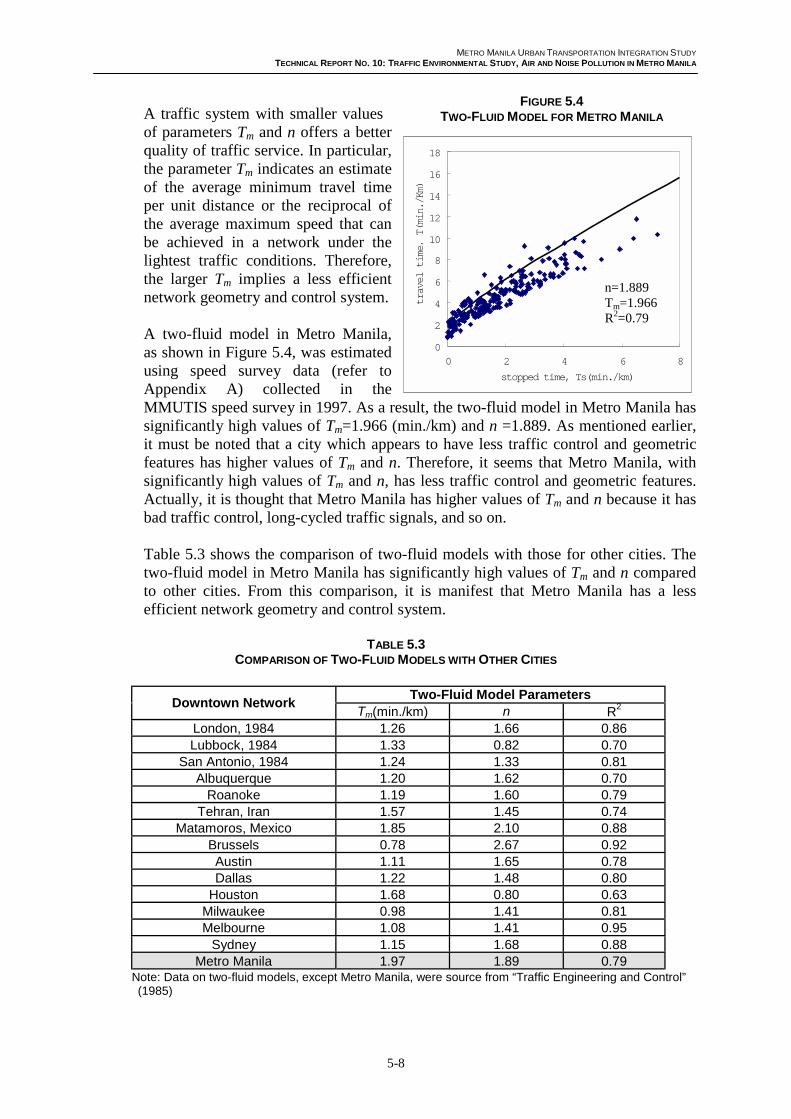
METRO MANILA URBAN TRANSPORTATION INTEGRATION STUDY
TECHNICAL REPORT NO. 10: TRAFFIC ENVIRONMENTAL STUDY, AIR AND NOISE POLLUTION IN METRO MANILA
5-8
A traffic system with smaller valuesof parameters Tm and n offers a betterquality of traffic service. In particular,the parameter Tm indicates an estimateof the average minimum travel timeper unit distance or the reciprocal ofthe average maximum speed that canbe achieved in a network under thelightest traffic conditions. Therefore,the larger Tm implies a less efficientnetwork geometry and control system.
A two-fluid model in Metro Manila,as shown in Figure 5.4, was estimatedusing speed survey data (refer toAppendix A) collected in theMMUTIS speed survey in 1997. As a result, the two-fluid model in Metro Manila hassignificantly high values of Tm=1.966 (min./km) and n =1.889. As mentioned earlier,it must be noted that a city which appears to have less traffic control and geometricfeatures has higher values of Tm and n. Therefore, it seems that Metro Manila, withsignificantly high values of Tm and n, has less traffic control and geometric features.Actually, it is thought that Metro Manila has higher values of Tm and n because it hasbad traffic control, long-cycled traffic signals, and so on.
Table 5.3 shows the comparison of two-fluid models with those for other cities. Thetwo-fluid model in Metro Manila has significantly high values of Tm and n comparedto other cities. From this comparison, it is manifest that Metro Manila has a lessefficient network geometry and control system.
TABLE 5.3COMPARISON OF TWO-FLUID MODELS WITH OTHER CITIES
Two-Fluid Model ParametersDowntown Network
Tm(min./km) n R2
London, 1984 1.26 1.66 0.86Lubbock, 1984 1.33 0.82 0.70
San Antonio, 1984 1.24 1.33 0.81Albuquerque 1.20 1.62 0.70
Roanoke 1.19 1.60 0.79Tehran, Iran 1.57 1.45 0.74
Matamoros, Mexico 1.85 2.10 0.88Brussels 0.78 2.67 0.92Austin 1.11 1.65 0.78Dallas 1.22 1.48 0.80
Houston 1.68 0.80 0.63Milwaukee 0.98 1.41 0.81Melbourne 1.08 1.41 0.95
Sydney 1.15 1.68 0.88Metro Manila 1.97 1.89 0.79
Note: Data on two-fluid models, except Metro Manila, were source from “Traffic Engineering and Control”(1985)
FIGURE 5.4TWO-FLUID MODEL FOR METRO MANILA
0
2
4
6
8
10
12
14
16
18
0 2 4 6 8
stopped time, Ts(min./km)
travel time, T(min./Km)
n=1.889Tm=1.966R2=0.79

METRO MANILA URBAN TRANSPORTATION INTEGRATION STUDY
TECHNICAL REPORT NO. 10: TRAFFIC ENVIRONMENTAL STUDY, AIR AND NOISE POLLUTION IN METRO MANILA
5-9
5.3.3 Aggregation of Travel Distance and Average Speed
Travel distance (veh-km) and average speed (km/h) were aggregated by zone (refer toAppendix B). Table 5.4 shows the summary of changes in travel distance and averagespeed. It must be noted that, in the case of “Do-Nothing” without any projects, traveldistance greatly increased, especially among private vehicles, and average speedgreatly decreased. On the other hand, travel distance for public vehicles for both“Master Plan” and “Do-Max” cases decreased up to 40%. This may be due to theMRT system being incorporated into the “Master Plan” and “Do-Max” scenariosresulting in users of public transport converting to the MRT. This, as already knownwell, means that railways systems such as MRT, subway, etc. contribute to shortertravel journey and to environmental improvement. However, the increase of traveldistance for private vehicles is still high even for both the “Master Plan” and “Do-Max.”
TABLE 5.4CHANGES IN TRAVEL DISTANCE AND AVERAGE SPEED
Present (1996)Do-Nothing
(2015)Master Plan
(2015)Do-Max (2015)
Public Private Public Private Public Private Public Private15,017 76,319 6,480 43,290 4,925 39,764Veh-km
(‘000) 9,827 24,434(+52.3) (+212.3) (-34.1) (+77.2) (-49.9) (+62.7)
13.5 13.1 19.4 19.2 19.2 20.1Ave.Speed 28.9 30.6
(-53.3) (-57.2) (-32.9) (-37.3) (-33.6) (-34.3)Note: Figures in parentheses refer to % changes with regard to the present situation.
One problem in the traffic assignment results estimated from STRADA is that averagespeeds in CBD areas, such as Manila and Makati City, were estimated highly (refer toAppendix B), even though actual speeds are significantly low. It seems that trafficassignment results estimated from STRADA did not consider factors such as delaytime at signal intersections, and so on.
Based on travel distance and average speed, the next step is to estimate air pollutantemissions.
5.3.4 Emission Estimation
In emission estimation, a basic requirement is the air pollutant emission parametervarying travel by speed and mode type. As the emission parameter could not beobtained, it was developed from the MMUTIS environmental survey. The airpollutant emission parameters are presented in Tables 5.5 to 5.8. All the air pollutantsdiscussed in this report are related to local or regional factors. It is noted that globalfactors such as CO2 were not discussed because of data constraints.
The emission parameters vary by mode types, i.e. car, jeepney and bus. A problemwas encountered in how to reflect the emission parameters of jeepney and bus in theemission estimation for public transport because jeepney and bus were not separatedin the traffic assignment results. So, the share of the present travel distance forjeepney and bus (obtained from the MMUTIS person trip survey) was used to dividethe travel distance by public transport into travel distances by jeepney and bus (seeTable 5.9).
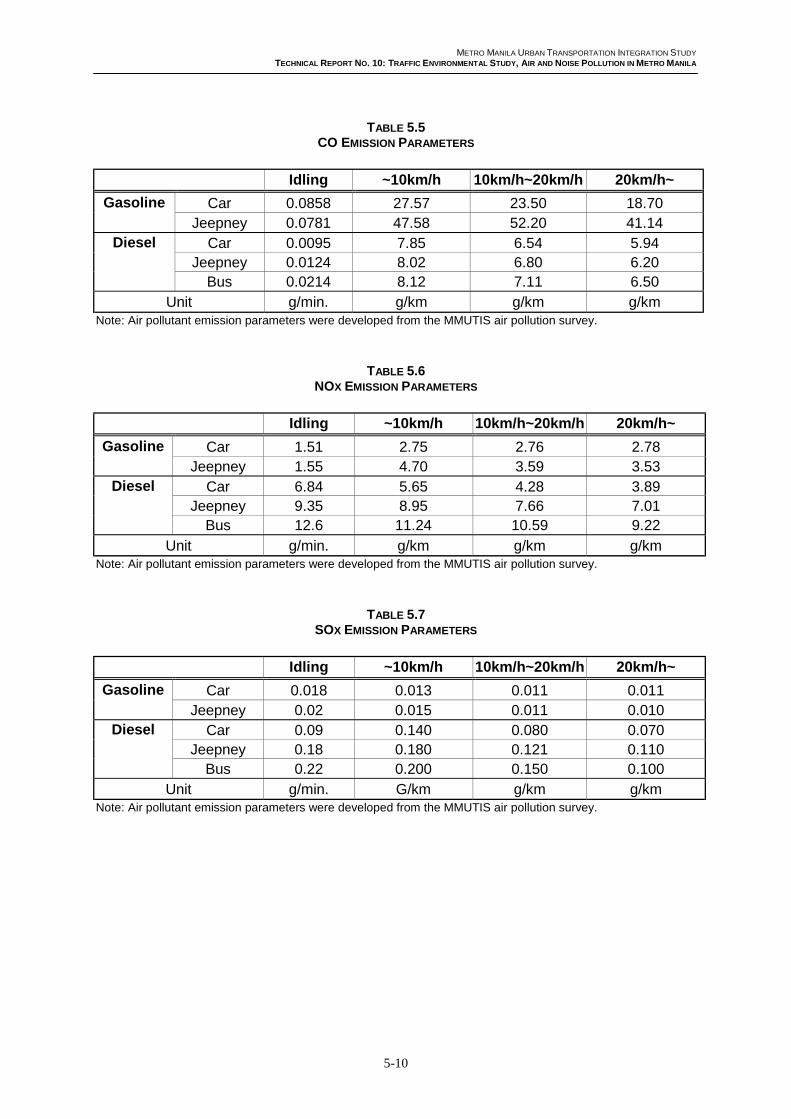
METRO MANILA URBAN TRANSPORTATION INTEGRATION STUDY
TECHNICAL REPORT NO. 10: TRAFFIC ENVIRONMENTAL STUDY, AIR AND NOISE POLLUTION IN METRO MANILA
5-10
TABLE 5.5CO EMISSION PARAMETERS
Idling ~10km/h 10km/h~20km/h 20km/h~
Gasoline Car 0.0858 27.57 23.50 18.70Jeepney 0.0781 47.58 52.20 41.14
Diesel Car 0.0095 7.85 6.54 5.94Jeepney 0.0124 8.02 6.80 6.20
Bus 0.0214 8.12 7.11 6.50Unit g/min. g/km g/km g/km
Note: Air pollutant emission parameters were developed from the MMUTIS air pollution survey.
TABLE 5.6NOX EMISSION PARAMETERS
Idling ~10km/h 10km/h~20km/h 20km/h~
Gasoline Car 1.51 2.75 2.76 2.78Jeepney 1.55 4.70 3.59 3.53
Diesel Car 6.84 5.65 4.28 3.89Jeepney 9.35 8.95 7.66 7.01
Bus 12.6 11.24 10.59 9.22
Unit g/min. g/km g/km g/kmNote: Air pollutant emission parameters were developed from the MMUTIS air pollution survey.
TABLE 5.7SOX EMISSION PARAMETERS
Idling ~10km/h 10km/h~20km/h 20km/h~
Gasoline Car 0.018 0.013 0.011 0.011Jeepney 0.02 0.015 0.011 0.010
Diesel Car 0.09 0.140 0.080 0.070Jeepney 0.18 0.180 0.121 0.110
Bus 0.22 0.200 0.150 0.100Unit g/min. G/km g/km g/km
Note: Air pollutant emission parameters were developed from the MMUTIS air pollution survey.

METRO MANILA URBAN TRANSPORTATION INTEGRATION STUDY
TECHNICAL REPORT NO. 10: TRAFFIC ENVIRONMENTAL STUDY, AIR AND NOISE POLLUTION IN METRO MANILA
5-11
TABLE 5.8SPM EMISSION PARAMETERS
Idling ~10km/h 10km/h~20km/h 20km/h~
Gasoline Car 0.10 0.07 0.05 0.05Jeepney 0.10 0.07 0.06 0.05
Diesel Car 0.90 1.20 0.07 0.07Jeepney 1.50 1.80 0.90 0.81
Bus 1.50 2.30 1.50 0.80Unit g/min. G/km g/km g/km
Note: Air pollutant emission parameters were developed from the MMUTIS air pollution survey.
TABLE 5.9SHARE OF THE PRESENT TRAVEL DISTANCE BY JEEPNEY AND BUS
Vehicle trips(‘000)
Ave. trip length(km)
Veh-km(‘000)
Share of Veh-km(%)
Bus 57 13.0 741 31.5Jeepney 460 3.5 1,610 68.5
Source: MMUTIS Person Trip Survey
In addition, it is necessary to consider the share of gasoline and diesel by mode typebecause emission parameters are different by engine type. Table 5.10 shows the shareof gasoline and diesel by mode type. Emission estimation was conducted by assumingthat their shares would not change even in the future, 2015.
TABLE 5.10SHARE OF GASOLINE AND DIESEL BY MODE TYPE
Car Jeepney BusGasoline 95.3% 54.6% 6.7%
Diesel 4.7% 45.4% 93.3%Source: MMUTIS Survey
Air pollutants can be estimated as follows:
Air pollutants = travel distance (veh-km) * emission factor at running speed (g/veh-km) + total stop time (min.) * emission factor at stop time (g/min.)
The air pollutants were estimated based on this equation (refer to Figures 5.4 to 5.7and Appendix C). Table 5.11 shows the emission estimation results.
Some observations can be taken from the emission estimation results. Firstly, areaswith MRT system have comparatively low increases in air pollutant emission.Secondly, there are significant increases in air pollutant emission even in the “MasterPlan” and “Do-Max” cases and it seems that this is mainly caused by the traveldistance increase of private transport. In order to preserve the present situation orimprove the air pollution quality, the reduction of private transport volume isnecessary. This will be later discussed in detail.
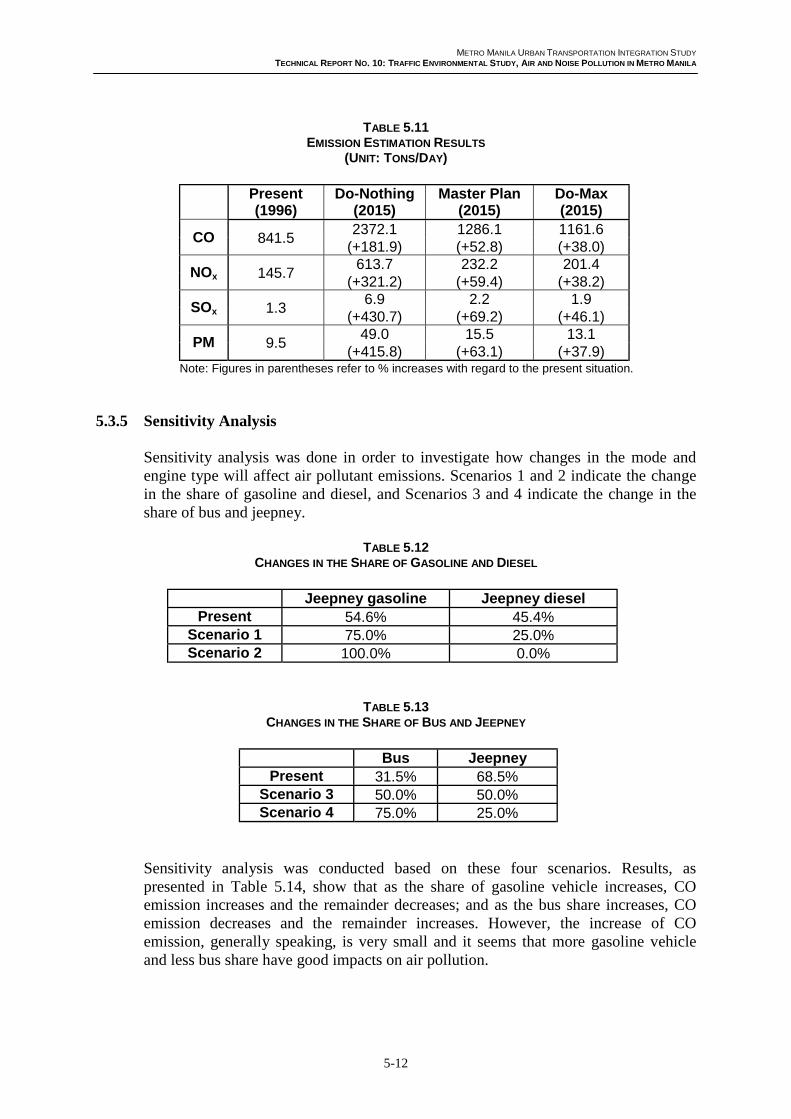
METRO MANILA URBAN TRANSPORTATION INTEGRATION STUDY
TECHNICAL REPORT NO. 10: TRAFFIC ENVIRONMENTAL STUDY, AIR AND NOISE POLLUTION IN METRO MANILA
5-12
TABLE 5.11EMISSION ESTIMATION RESULTS
(UNIT: TONS/DAY)
Present(1996)
Do-Nothing(2015)
Master Plan(2015)
Do-Max(2015)
2372.1 1286.1 1161.6CO 841.5(+181.9) (+52.8) (+38.0)
613.7 232.2 201.4NOx 145.7(+321.2) (+59.4) (+38.2)
6.9 2.2 1.9SOx 1.3(+430.7) (+69.2) (+46.1)
49.0 15.5 13.1PM 9.5(+415.8) (+63.1) (+37.9)
Note: Figures in parentheses refer to % increases with regard to the present situation.
5.3.5 Sensitivity Analysis
Sensitivity analysis was done in order to investigate how changes in the mode andengine type will affect air pollutant emissions. Scenarios 1 and 2 indicate the changein the share of gasoline and diesel, and Scenarios 3 and 4 indicate the change in theshare of bus and jeepney.
TABLE 5.12CHANGES IN THE SHARE OF GASOLINE AND DIESEL
Jeepney gasoline Jeepney dieselPresent 54.6% 45.4%
Scenario 1 75.0% 25.0%Scenario 2 100.0% 0.0%
TABLE 5.13CHANGES IN THE SHARE OF BUS AND JEEPNEY
Bus JeepneyPresent 31.5% 68.5%
Scenario 3 50.0% 50.0%Scenario 4 75.0% 25.0%
Sensitivity analysis was conducted based on these four scenarios. Results, aspresented in Table 5.14, show that as the share of gasoline vehicle increases, COemission increases and the remainder decreases; and as the bus share increases, COemission decreases and the remainder increases. However, the increase of COemission, generally speaking, is very small and it seems that more gasoline vehicleand less bus share have good impacts on air pollution.

METRO MANILA URBAN TRANSPORTATION INTEGRATION STUDY
TECHNICAL REPORT NO. 10: TRAFFIC ENVIRONMENTAL STUDY, AIR AND NOISE POLLUTION IN METRO MANILA
5-13
TABLE 5.14SENSITIVITY ANALYSIS RESULTS
(UNIT: TONS/DAY)
Master Plan Scenario 1 Scenario 2 Scenario 3 Scenario 41,319.4 1,360.3 1,262.4 1,230.4CO 1,286.1(+2.6) (+5.7) (-1.8) (-4.3)225.4 217.0 242.1 255.3NOx 232.2(-2.9) (-6.5) (+4.3) (+9.9)2.06 1.86 2.37 2.54SOx 2.23(-7.6) (-16.6) (+6.3) (+13.9)14.1 12.4 16.6 18.1PM 15.5(-9.0) (-20.0) (+7.1) (+16.8)
Note: Figures in parentheses refer to % changes with regard to the Master Plan.
5.4 Recommendations for Sustainable Environment Development
Analysis results showed that, compared to “Do-Nothing,” the “Master Plan” and “Do-Max” cases brought significant reduction in air pollutant emission. However, it mustbe noted that the increase of air pollutant emission even in “Master Plan” and “Do-Max” is very significant and it will increase by around 30~50 % as compared to thepresent situation. This is easily attributable to the intractable private vehicle increase.This means that supply-side transport measures alone may not solve transportproblems such as traffic congestion and the environmental concerns which MetroManila is facing now. From now on, as explained earlier, an integrated packageapproach for Metro Manila should be considered and evaluated.
In MMUTIS, pricing-related measures such as heavier vehicle tax, heavier fuel tax,road pricing and cordon pricing were also taken and their effects were evaluated.Among these measures, EDSA cordon pricing was taken as an experimental case inorder to investigate its effect on air pollutant reduction. As a result, air pollutants inthe case of “Master Plan” with EDSA cordon pricing were reduced up to about 6%with regard to “Master Plan.” It seems that air pollutant reduction would be verysignificant in the case of heavier vehicle tax.
Undoubtedly, an integrated package approach will contribute to traffic congestionreduction and air quality improvement in Metro Manila.
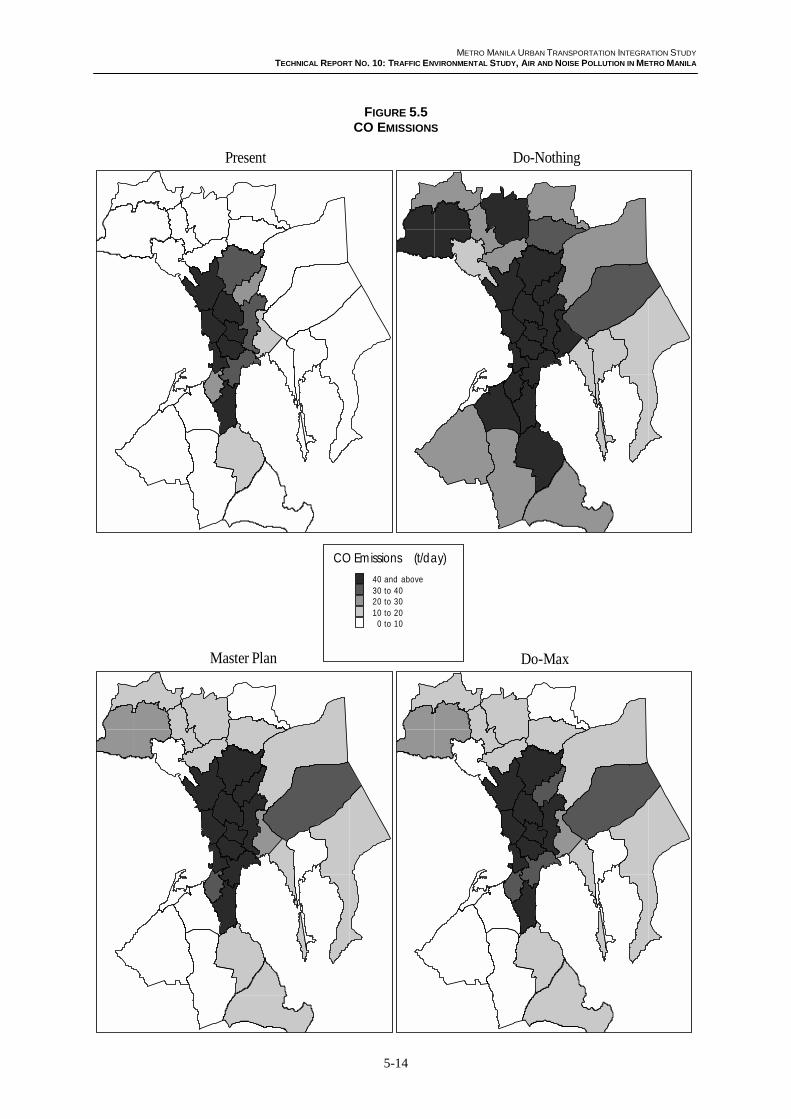
METRO MANILA URBAN TRANSPORTATION INTEGRATION STUDY
TECHNICAL REPORT NO. 10: TRAFFIC ENVIRONMENTAL STUDY, AIR AND NOISE POLLUTION IN METRO MANILA
5-14
FIGURE 5.5CO EMISSIONS
Present Do-Nothing
Master Plan Do-Max
CO Emissions (t/day)
40 and above30 to 4020 to 3010 to 200 to 10

METRO MANILA URBAN TRANSPORTATION INTEGRATION STUDY
TECHNICAL REPORT NO. 10: TRAFFIC ENVIRONMENTAL STUDY, AIR AND NOISE POLLUTION IN METRO MANILA
5-15
FIGURE 5.6NOX EMISSIONS
Present Do-Nothing
Master Plan Do-Max
NOx Emissions (t/day)
over 108 to 106 to 84 to 62 to 40 to 2

METRO MANILA URBAN TRANSPORTATION INTEGRATION STUDY
TECHNICAL REPORT NO. 10: TRAFFIC ENVIRONMENTAL STUDY, AIR AND NOISE POLLUTION IN METRO MANILA
5-16
FIGURE 5.7SOX EMISSIONS
Present Do-Nothing
Master Plan Do-Max
SOx Emissions (t/day)
more than 0.250.20 to 0.250.15 to 0.200.10 to 0.150.05 to 0.100 to 0.05
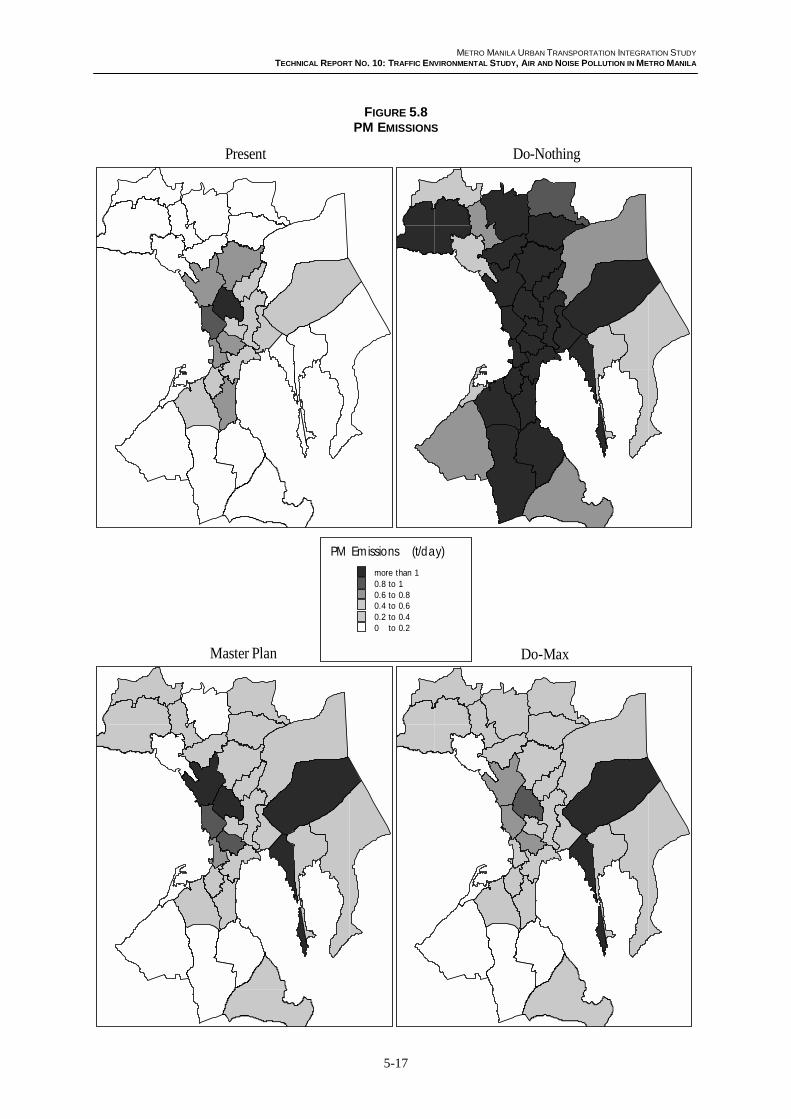
METRO MANILA URBAN TRANSPORTATION INTEGRATION STUDY
TECHNICAL REPORT NO. 10: TRAFFIC ENVIRONMENTAL STUDY, AIR AND NOISE POLLUTION IN METRO MANILA
5-17
FIGURE 5.8PM EMISSIONS
Present Do-Nothing
Master Plan Do-Max
PM Emissions (t/day)
more than 10.8 to 10.6 to 0.80.4 to 0.60.2 to 0.40 to 0.2

METRO MANILA URBAN TRANSPORTATION INTEGRATION STUDY
TECHNICAL REPORT NO. 10: TRAFFIC ENVIRONMENTAL STUDY, AIR AND NOISE POLLUTION IN METRO MANILA
AAPPPPEENNDDIICCEESS
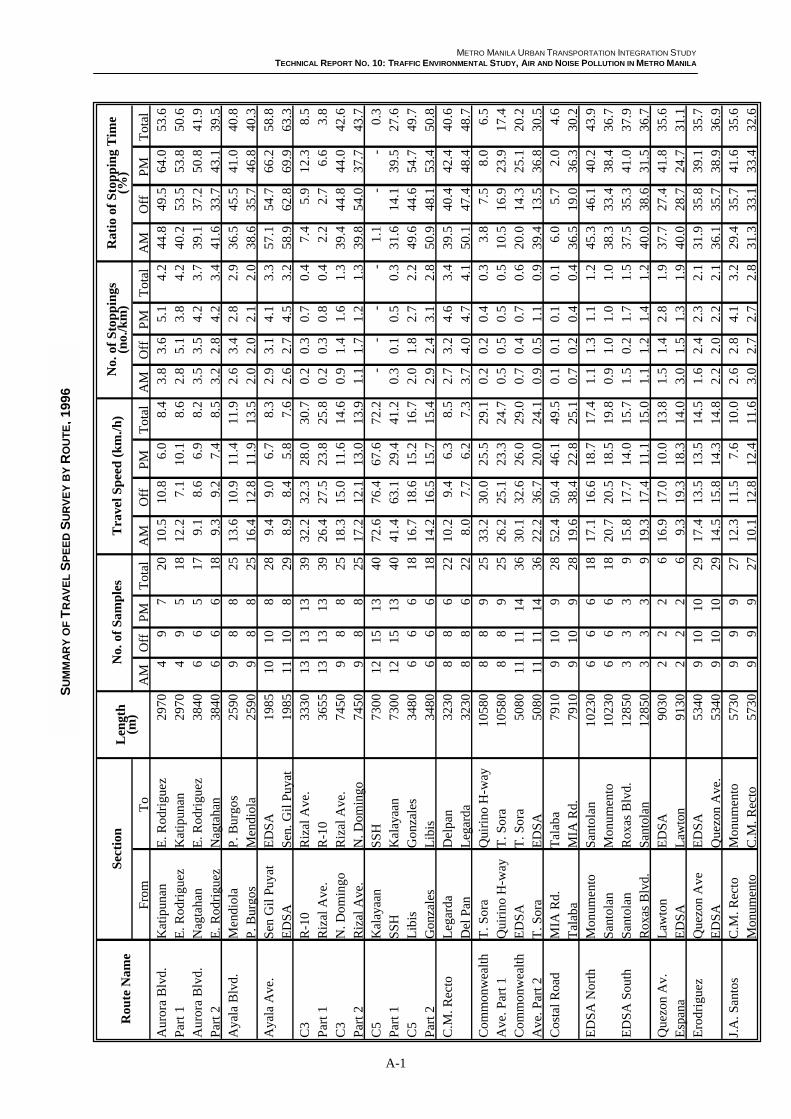
METRO MANILA URBAN TRANSPORTATION INTEGRATION STUDY
TECHNICAL REPORT NO. 10: TRAFFIC ENVIRONMENTAL STUDY, AIR AND NOISE POLLUTION IN METRO MANILA
A-1
SU
MM
AR
Y O
F T
RA
VE
L S
PE
ED
SU
RV
EY
BY
RO
UT
E, 1
996
Tot
al53
.650
.641
.939
.540
.840
.358
.863
.3 8.5
3.8
42.6
43.7 0.3
27.6
49.7
50.8
40.6
48.7 6.5
17.4
20.2
30.5 4.6
30.2
43.9
36.7
37.9
36.7
35.6
31.1
35.7
36.9
35.6
32.6
PM 64
.053
.850
.843
.141
.046
.866
.269
.912
.3 6.6
44.0
37.7 -
39.5
54.7
53.4
42.4
48.4 8.0
23.9
25.1
36.8 2.0
36.3
40.2
38.4
41.0
31.5
41.8
24.7
39.1
38.9
41.6
33.4
Off 49.5
53.5
37.2
33.7
45.5
35.7
54.7
62.8 5.9
2.7
44.8
54.0 -
14.1
44.6
48.1
40.4
47.4 7.5
16.9
14.3
13.5 5.7
19.0
46.1
33.4
35.3
38.6
27.4
28.7
35.8
35.7
35.7
33.1
AM 44
.840
.239
.141
.636
.538
.657
.158
.9 7.4
2.2
39.4
39.8 1.1
31.6
49.6
50.9
39.5
50.1 3.8
10.5
20.0
39.4 6.0
36.5
45.3
38.3
37.5
40.0
37.7
40.0
31.9
36.1
29.4
31.3
Tot
al 4.2
4.2
3.7
3.4
2.9
2.0
3.3
3.2
0.4
0.4
1.3
1.3 -
0.3
2.2
2.8
3.4
4.1
0.3
0.5
0.6
0.9
0.1
0.4
1.2
1.0
1.5
1.2
1.9
1.9
2.1
2.1
3.2
2.8
PM 5.
13.
84.
24.
22.
82.
14.
14.
50.
70.
81.
61.
2 -0.
52.
73.
14.
64.
70.
40.
50.
71.
10.
10.
41.
11.
01.
71.
42.
81.
32.
32.
24.
12.
7
Off 3.6
5.1
3.5
2.8
3.4
2.0
3.1
2.7
0.3
0.3
1.4
1.7 -
0.1
1.8
2.4
3.2
4.0
0.2
0.5
0.4
0.5
0.1
0.2
1.3
1.0
0.2
1.2
1.4
1.5
2.4
2.0
2.8
2.7
AM 3.
82.
83.
53.
22.
62.
02.
92.
60.
20.
20.
91.
1 -0.
32.
02.
92.
73.
70.
20.
50.
70.
90.
10.
71.
10.
91.
51.
11.
53.
01.
62.
22.
63.
0
Tot
al 8.4
8.6
8.2
8.5
11.9
13.5 8.3
7.6
30.7
25.8
14.6
13.9
72.2
41.2
16.7
15.4 8.5
7.3
29.1
24.7
29.0
24.1
49.5
25.1
17.4
19.8
15.7
15.0
13.8
14.0
14.5
14.8
10.0
11.6
PM 6.
010
.1 6.9
7.4
11.4
11.9 6.7
5.8
28.0
23.8
11.6
13.0
67.6
29.4
15.2
15.7 6.3
6.2
25.5
23.3
26.0
20.0
46.1
22.8
18.7
18.5
14.0
11.1
10.0
18.3
13.5
14.3 7.6
12.4
Off 10.8 7.1
8.6
9.2
10.9
12.8 9.0
8.4
32.3
27.5
15.0
12.1
76.4
63.1
18.6
16.5 9.4
7.7
30.0
25.1
32.6
36.7
50.4
38.4
16.6
20.5
17.7
17.4
17.0
19.3
13.5
15.8
11.5
12.8
AM 10
.512
.2 9.1
9.3
13.6
16.4 9.4
8.9
32.2
26.4
18.3
17.2
72.6
41.4
16.7
14.2
10.2 8.0
33.2
26.2
30.1
22.2
52.4
19.6
17.1
20.7
15.8
19.3
16.9 9.3
17.4
14.5
12.3
10.1
Tot
al 20 18 17 18 25 25 28 29 39 39 25 25 40 40 18 18 22 22 25 25 36 36 28 28 18 18 9 9 6 6 29 29 27 27
PM
7 5 5 6 8 8 8 8 13 13 8 8 13 13 6 6 6 6 9 9 14 14 9 9 6 6 3 3 2 2 10 10 9 9
Off 9 9 6 6 8 8 10 10 13 13 8 8 15 15 6 6 8 8 8 8 11 11 10 10 6 6 3 3 2 2 10 10 9 9
AM
4 4 6 6 9 9 10 11 13 13 9 9 12 12 6 6 8 8 8 8 11 11 9 9 6 6 3 3 2 2 9 9 9 9
2970
2970
3840
3840
2590
2590
1985
1985
3330
3655
7450
7450
7300
7300
3480
3480
3230
3230
1058
010
580
5080
5080
7910
7910
1023
010
230
1285
012
850
9030
9130
5340
5340
5730
5730
To
E. R
odri
guez
Kat
ipun
anE
. Rod
rigu
ezN
agta
han
P. B
urgo
sM
endi
ola
ED
SA
Sen
. Gil
Puy
atR
izal
Ave
.R
-10
Riz
al A
ve.
N. D
omin
goS
SH
Kal
ayaa
nG
onza
les
Lib
isD
elpa
nL
egar
daQ
uiri
no H
-way
T. S
ora
T. S
ora
ED
SA
Tal
aba
MIA
Rd.
San
tola
nM
onum
ento
Rox
as B
lvd.
San
tola
nE
DS
AL
awto
nE
DS
AQ
uezo
n A
ve.
Mon
umen
toC
.M. R
ecto
Fro
mK
atip
unan
E. R
odri
guez
Nag
taha
nE
. Rod
rigu
ezM
endi
ola
P. B
urgo
sS
en G
il P
uyat
ED
SA
R-1
0R
izal
Ave
.N
. Dom
ingo
Riz
al A
ve.
Kal
ayaa
nS
SH
Lib
isG
onza
les
Leg
arda
Del
Pan
T. S
ora
Qui
rino
H-w
ayE
DS
AT
. Sor
aM
IA R
d.T
alab
aM
onum
ento
San
tola
nS
anto
lan
Rox
as B
lvd.
Law
ton
ED
SA
Que
zon
Ave
ED
SA
C.M
. Rec
toM
onum
ento
Aur
ora
Blv
d.P
art 1
Aur
ora
Blv
d.P
art 2
Aya
la B
lvd.
Aya
la A
ve.
C3
Par
t 1C
3P
art 2
C5
Par
t 1C
5P
art 2
C.M
. Rec
to
Com
mon
wea
lthA
ve. P
art 1
Com
mon
wea
lthA
ve. P
art 2
Cos
tal R
oad
ED
SA
Nor
th
ED
SA
Sou
th
Que
zon
Av.
Esp
ana
Ero
drig
uez
J.A
. San
tos
No.
of
Sam
ple
sT
rave
l Sp
eed
(k
m./h
)N
o. o
f S
top
pin
gs
(no.
/km
)R
atio
of
Sto
pp
ing
Tim
e (%
)R
oute
Nam
eL
engt
h
(m)
Sec
tion

METRO MANILA URBAN TRANSPORTATION INTEGRATION STUDY
TECHNICAL REPORT NO. 10: TRAFFIC ENVIRONMENTAL STUDY, AIR AND NOISE POLLUTION IN METRO MANILA
A-2
Tot
al
17.1
16.1
48.3
57.9
36.8
25.6
52.9
48.8
15.5
10.9
28.2
36.9
30.8
39.2
31.5
41.9
13.5
12.6
56.8
45.8
57.5
53.9
31.4
34.6
53.7
42.4
17.2
31.8
22.2
30.5
21.9
27.5
47.3
47.0
PM 20
.9
18.1
49.4
56.3
38.3
28.7
51.0
55.2
19.5
11.5
43.7
55.3
38.4
39.0
33.6
45.4
14.6
13.3
53.8
50.6
55.2
52.6
36.4
37.9
53.1
41.4
31.8
38.6
19.5
32.4
25.3
28.4
48.5
50.7
Off 16.6
14.5
43.7
53.1
35.6
28.8
54.8
48.9 5.8
8.1
26.5
35.6
25.9
36.8
26.2
32.2
15.0
15.9
51.8
48.1
57.3
52.1
31.1
29.3
53.3
45.9
15.1
33.9
19.4
36.5
21.7
31.2
47.6
46.8
AM 13
.2
15.7
52.7
65.9
37.0
19.1
52.8
43.8
21.1
13.7
19.8
29.1
28.7
42.2
34.9
48.1
10.9 9.4
66.2
38.4
59.6
56.6
27.0
36.6
54.6
39.9
11.9
26.2
27.7
22.6
17.2
20.4
43.4
40.3
Tot
al 1.7
1.6
2.0
1.9
2.5
2.7
2.7
3.1
0.9
0.9
2.0
2.5
2.1
2.6
0.9
1.2
1.4
1.7
3.3
2.9
2.5
2.1
1.4
1.5
2.1
1.9
0.5
0.9
0.6
0.8
0.6
0.8
4.0
3.0
PM 2.
0
1.5
2.0
1.8
3.3
2.8
3.1
3.4
1.1
0.8
2.7
3.0
2.5
2.5
1.0
1.1
1.6
1.6
4.0
3.5
3.2
2.2
1.7
1.9
1.8
1.9
1.1
1.3
0.6
0.8
0.7
0.9
4.0
3.4
Off 1.6
1.5
2.1
1.8
2.7
2.7
2.7
3.2
0.4
0.6
1.8
2.4
1.9
2.2
0.6
1.1
1.8
2.7
2.9
3.1
2.4
2.0
1.3
1.3
2.0
1.9
0.3
0.8
0.4
1.0
0.6
0.8
4.2
2.8
AM 1.
4
1.7
1.8
2.0
1.4
2.6
2.4
2.9
1.2
1.3
1.8
2.3
1.8
3.1
1.1
1.5
1.0
1.1
3.2
2.1
2.0
2.0
1.1
1.4
2.4
2.0
0.3
0.8
0.7
0.6
0.6
0.7
3.1
2.7
Tot
al
13.5
14.7
13.1
10.3 7.8
7.8
10.8
10.2
16.5
18.0 9.9
7.8
13.3
11.9
18.6
16.7
19.2
18.3 8.5
10.9 8.2
11.2
13.9
11.8 8.8
11.0
36.2
16.0
18.2
17.4
22.8
20.9 7.5
8.5
PM 12
.1
14.1
12.1
10.5 6.6
6.5
10.3 9.3
14.7
18.3 6.0
5.1
11.4
11.7
16.0
18.4
20.0
19.4 7.9
9.1
7.2
11.1
12.0
10.0 7.8
9.3
20.2
17.5
21.6
16.3
21.7
19.3 7.4
7.5
Off 13.8
14.6
15.1
12.4 7.4
8.1
10.3 9.9
19.6
16.6
10.6 8.6
14.7
13.4
22.8
15.2
15.8
14.4
10.0
10.4 8.4
12.0
14.6
14.6 9.0
11.8
41.1
18.2
20.1
17.0
25.4
20.7 7.1
8.8
AM 15
.1
15.6
12.4 8.4
10.1 9.1
11.6
11.4
16.0
16.0
15.2 9.5
14.2
10.8
18.8
16.8
21.2
20.4 7.5
14.4 9.3
10.7
15.5
11.6 9.7
12.4
50.2
13.7
14.6
19.3
21.2
24.1 9.0
10.3
Tot
al 17 17 18 18 31 31 20 20 15 14 17 20 22 22 15 12 9 9 29 29 25 25 56 58 32 33 5 5 9 9 8 8 13 12
PM
6 6 7 7 9 9 6 6 5 5 4 4 7 7 6 4 4 4 8 8 8 8 18 18 10 11 1 1 3 3 3 3 5 4
Off 6 6 6 6 12 12 6 6 5 5 7 8 8 8 5 4 2 2 12 12 8 8 19 19 11 11 2 2 3 3 3 3 6 6
AM
5 5 5 5 10 10 8 8 5 4 6 8 7 7 4 4 3 3 9 9 9 9 19 21 11 11 2 2 3 3 2 2 2 2
4600
4600
5960
5960
2320
2320
4480
4480
8440
8440
3290
3290
5180
5180
9770
9770
4100
4100
1900
1900
3230
3230
1630
1630
5570
5570
1868
5
1868
5
1912
0
1912
0
1888
5
1888
5
6200
6200
To
ED
SA
Ped
ro G
il
Aur
ora
E. R
odri
guez
E. R
odri
guez
Cai
nta
Junc
tion
Nag
taha
n
Rox
as B
lvd
Sar
mie
nto
ED
SA
Reg
alad
o
Sus
ano
Rd.
R-1
0
Nag
taha
n
C.M
. Rec
to
MIA
Rd.
Pab
lo S
t.
ED
SA
SS
H
Rox
as B
lvd.
SS
H
ED
SA
Kal
engt
ong
Aur
ora
Kal
engt
ong
C5/
E. R
odri
guez
Ala
bang
Pre
s. Q
uiri
no
Ala
bang
Pre
s. Q
uiri
no
Ala
bang
Pre
s. Q
uiri
no
ED
SA
Law
ton
Fro
m
Ped
ro G
il
ED
SA
E. R
odri
guez
Aur
ora
Cai
nta
Junc
tion
E. R
odri
guez
Rox
as B
lvd
Nag
taha
n
ED
SA
Sar
mie
nto
Sus
ano
Rd.
Reg
alad
o
Nag
taha
n
R-1
0
MIA
Rd.
C.M
. Rec
to
ED
SA
Pab
lo S
t.
Rox
as B
lvd.
SS
H
ED
SA
SS
H
Aur
ora
Kal
engt
ong
C5/
E. R
odri
guez
Kal
engt
ong
Pre
s. Q
uiri
no
Ala
bang
Pre
s. Q
uiri
no
Ala
bang
Pre
s. Q
uiri
no
Ala
bang
Law
ton
ED
SA
J.P
. Riz
al
Ort
igas
Ave
.
Par
t 1
Ort
igas
Ave
.
Par
t 2
Pre
s. Q
uiri
no
Qui
rino
H-w
ay
Par
t 1
Qui
rino
H-w
ay
Par
t 2
R. M
agsa
ysay
Rox
as B
lvd.
McA
rthu
r
Sen
. Gil
Puy
at
Par
t 1
Sen
. Gil
Puy
at
Par
t 2
Sha
w B
lvd.
Par
t 1
Sha
w B
lvd.
Par
t 2
Sou
th S
uper
Hig
hway
SS
H E
ast S
ervi
ce
SS
H W
est S
ervi
ce
Taf
t Ave
.
Len
gth
(m
)S
ecti
onR
oute
Nam
eR
atio
of
Sto
pp
ing
Tim
e (%
)N
o. o
f S
top
pin
gs
(no.
/km
)T
rave
l Sp
eed
(k
m./h
)N
o. o
f S
amp
les
(CO
NT’D
)
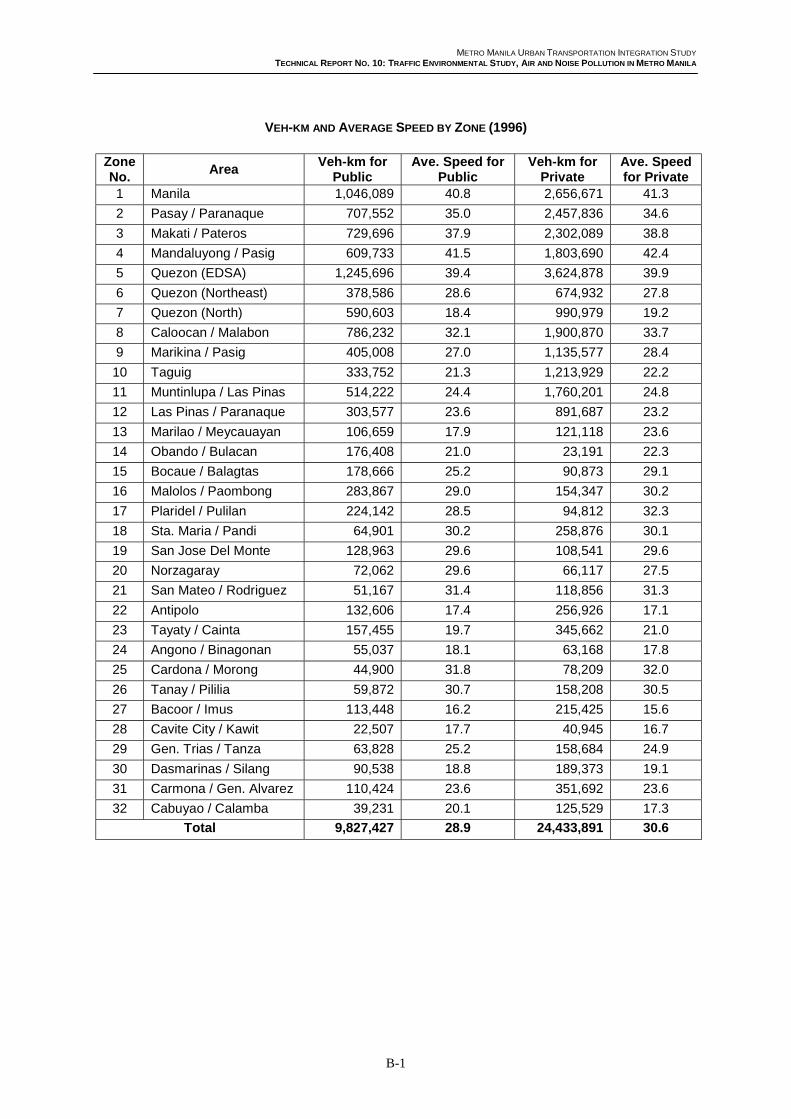
METRO MANILA URBAN TRANSPORTATION INTEGRATION STUDY
TECHNICAL REPORT NO. 10: TRAFFIC ENVIRONMENTAL STUDY, AIR AND NOISE POLLUTION IN METRO MANILA
B-1
VEH-KM AND AVERAGE SPEED BY ZONE (1996)
ZoneNo.
AreaVeh-km for
PublicAve. Speed for
PublicVeh-km for
PrivateAve. Speedfor Private
1 Manila 1,046,089 40.8 2,656,671 41.3
2 Pasay / Paranaque 707,552 35.0 2,457,836 34.6
3 Makati / Pateros 729,696 37.9 2,302,089 38.8
4 Mandaluyong / Pasig 609,733 41.5 1,803,690 42.4
5 Quezon (EDSA) 1,245,696 39.4 3,624,878 39.9
6 Quezon (Northeast) 378,586 28.6 674,932 27.8
7 Quezon (North) 590,603 18.4 990,979 19.2
8 Caloocan / Malabon 786,232 32.1 1,900,870 33.7
9 Marikina / Pasig 405,008 27.0 1,135,577 28.4
10 Taguig 333,752 21.3 1,213,929 22.2
11 Muntinlupa / Las Pinas 514,222 24.4 1,760,201 24.8
12 Las Pinas / Paranaque 303,577 23.6 891,687 23.2
13 Marilao / Meycauayan 106,659 17.9 121,118 23.6
14 Obando / Bulacan 176,408 21.0 23,191 22.3
15 Bocaue / Balagtas 178,666 25.2 90,873 29.1
16 Malolos / Paombong 283,867 29.0 154,347 30.2
17 Plaridel / Pulilan 224,142 28.5 94,812 32.3
18 Sta. Maria / Pandi 64,901 30.2 258,876 30.1
19 San Jose Del Monte 128,963 29.6 108,541 29.6
20 Norzagaray 72,062 29.6 66,117 27.5
21 San Mateo / Rodriguez 51,167 31.4 118,856 31.3
22 Antipolo 132,606 17.4 256,926 17.1
23 Tayaty / Cainta 157,455 19.7 345,662 21.0
24 Angono / Binagonan 55,037 18.1 63,168 17.8
25 Cardona / Morong 44,900 31.8 78,209 32.0
26 Tanay / Pililia 59,872 30.7 158,208 30.5
27 Bacoor / Imus 113,448 16.2 215,425 15.6
28 Cavite City / Kawit 22,507 17.7 40,945 16.7
29 Gen. Trias / Tanza 63,828 25.2 158,684 24.9
30 Dasmarinas / Silang 90,538 18.8 189,373 19.1
31 Carmona / Gen. Alvarez 110,424 23.6 351,692 23.6
32 Cabuyao / Calamba 39,231 20.1 125,529 17.3
Total 9,827,427 28.9 24,433,891 30.6
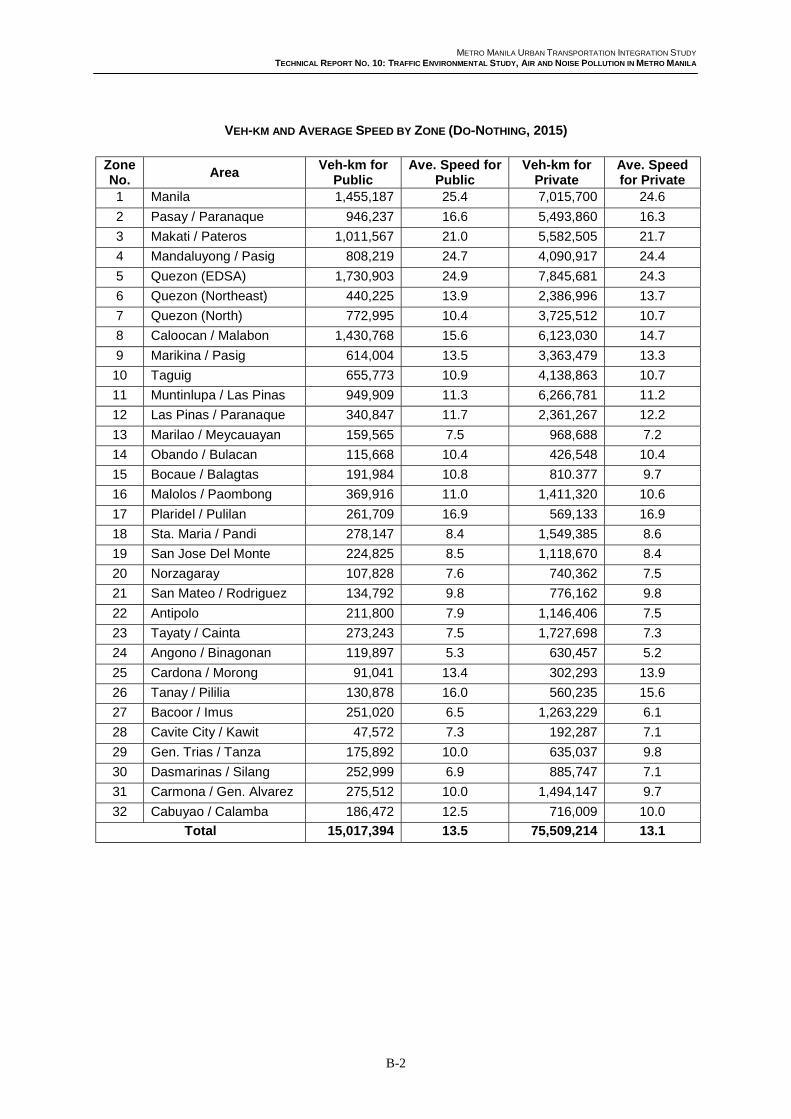
METRO MANILA URBAN TRANSPORTATION INTEGRATION STUDY
TECHNICAL REPORT NO. 10: TRAFFIC ENVIRONMENTAL STUDY, AIR AND NOISE POLLUTION IN METRO MANILA
B-2
VEH-KM AND AVERAGE SPEED BY ZONE (DO-NOTHING, 2015)
ZoneNo.
AreaVeh-km for
PublicAve. Speed for
PublicVeh-km for
PrivateAve. Speedfor Private
1 Manila 1,455,187 25.4 7,015,700 24.6
2 Pasay / Paranaque 946,237 16.6 5,493,860 16.3
3 Makati / Pateros 1,011,567 21.0 5,582,505 21.7
4 Mandaluyong / Pasig 808,219 24.7 4,090,917 24.4
5 Quezon (EDSA) 1,730,903 24.9 7,845,681 24.3
6 Quezon (Northeast) 440,225 13.9 2,386,996 13.7
7 Quezon (North) 772,995 10.4 3,725,512 10.7
8 Caloocan / Malabon 1,430,768 15.6 6,123,030 14.7
9 Marikina / Pasig 614,004 13.5 3,363,479 13.3
10 Taguig 655,773 10.9 4,138,863 10.7
11 Muntinlupa / Las Pinas 949,909 11.3 6,266,781 11.2
12 Las Pinas / Paranaque 340,847 11.7 2,361,267 12.2
13 Marilao / Meycauayan 159,565 7.5 968,688 7.2
14 Obando / Bulacan 115,668 10.4 426,548 10.4
15 Bocaue / Balagtas 191,984 10.8 810.377 9.7
16 Malolos / Paombong 369,916 11.0 1,411,320 10.6
17 Plaridel / Pulilan 261,709 16.9 569,133 16.9
18 Sta. Maria / Pandi 278,147 8.4 1,549,385 8.6
19 San Jose Del Monte 224,825 8.5 1,118,670 8.4
20 Norzagaray 107,828 7.6 740,362 7.5
21 San Mateo / Rodriguez 134,792 9.8 776,162 9.8
22 Antipolo 211,800 7.9 1,146,406 7.5
23 Tayaty / Cainta 273,243 7.5 1,727,698 7.3
24 Angono / Binagonan 119,897 5.3 630,457 5.2
25 Cardona / Morong 91,041 13.4 302,293 13.9
26 Tanay / Pililia 130,878 16.0 560,235 15.6
27 Bacoor / Imus 251,020 6.5 1,263,229 6.1
28 Cavite City / Kawit 47,572 7.3 192,287 7.1
29 Gen. Trias / Tanza 175,892 10.0 635,037 9.8
30 Dasmarinas / Silang 252,999 6.9 885,747 7.1
31 Carmona / Gen. Alvarez 275,512 10.0 1,494,147 9.7
32 Cabuyao / Calamba 186,472 12.5 716,009 10.0
Total 15,017,394 13.5 75,509,214 13.1

METRO MANILA URBAN TRANSPORTATION INTEGRATION STUDY
TECHNICAL REPORT NO. 10: TRAFFIC ENVIRONMENTAL STUDY, AIR AND NOISE POLLUTION IN METRO MANILA
B-3
VEH-KM AND AVERAGE SPEED BY ZONE (MASTER PLAN, 2015)
ZoneNo.
AreaVeh-km for
PublicAve. Speed for
PublicVeh-km for
PrivateAve. Speedfor Private
1 Manila 569,636 29.5 4,765,656 31.0
2 Pasay / Paranaque 598,166 29.6 3,047,244 28.6
3 Makati / Pateros 592,956 27.4 3,747,442 27.1
4 Mandaluyong / Pasig 363,440 33.6 2,522,098 33.6
5 Quezon (EDSA) 785,098 31.2 5,830,554 29.7
6 Quezon (Northeast) 208,045 20.9 1,402,869 21.7
7 Quezon (North) 258,400 18.2 1,683,334 18.7
8 Caloocan / Malabon 606,125 21.6 3,812,380 20.6
9 Marikina / Pasig 234,674 18.7 1,878,614 20.6
10 Taguig 296,361 19.8 1,441,713 18.8
11 Muntinlupa / Las Pinas 213,606 22.7 2,285,734 24.2
12 Las Pinas / Paranaque 147,605 22.6 1,175,215 20.4
13 Marilao / Meycauayan 56,205 7.8 550,826 8.2
14 Obando / Bulacan 29,219 13.2 241,981 15.6
15 Bocaue / Balagtas 70,553 13.3 381,558 14.3
16 Malolos / Paombong 173,212 12.5 704,861 13.4
17 Plaridel / Pulilan 120,611 18.0 531,858 19.2
18 Sta. Maria / Pandi 81,758 19.8 347,546 18.1
19 San Jose Del Monte 74,431 9.6 453,171 11.2
20 Norzagaray 35,488 9.5 257,074 9.7
21 San Mateo / Rodriguez 70,316 11.1 670,045 11.2
22 Antipolo 162,427 7.1 1,263,601 7.3
23 Tayaty / Cainta 50,739 22.5 941,250 9.4
24 Angono / Binagonan 109,200 5.0 635,178 5.0
25 Cardona / Morong 84,723 13.0 294,581 13.3
26 Tanay / Pililia 125,586 14.7 575,566 14.6
27 Bacoor / Imus 62,431 11.7 288,208 11.8
28 Cavite City / Kawit 16,519 20.0 62,280 22.6
29 Gen. Trias / Tanza 55,938 20.2 268,006 12.1
30 Dasmarinas / Silang 15,043 22.0 149,024 22.8
31 Carmona / Gen. Alvarez 80,465 24.2 472,820 23.4
32 Cabuyao / Calamba 131,555 14.4 607,771 12.7
Total 6,480,531 19.4 43,290,058 19.2

METRO MANILA URBAN TRANSPORTATION INTEGRATION STUDY
TECHNICAL REPORT NO. 10: TRAFFIC ENVIRONMENTAL STUDY, AIR AND NOISE POLLUTION IN METRO MANILA
B-4
VEH-KM AND AVERAGE SPEED BY ZONE (DO-MAX, 2015)
ZoneNo.
AreaVeh-km for
PublicAve. Speed for
PublicVeh-km for
PrivateAve. Speedfor Private
1 Manila 439,281 30.5 4,183,291 33.6
2 Pasay / Paranaque 199,870 26.6 3,197,214 31.6
3 Makati / Pateros 308,897 29.6 3,658,983 30.3
4 Mandaluyong / Pasig 292,810 34.9 2,314,769 36.4
5 Quezon (EDSA) 676,411 34.5 5,046,018 31.8
6 Quezon (Northeast) 147,582 23.2 1,179,153 24.1
7 Quezon (North) 174,700 18.6 1,423,379 20.5
8 Caloocan / Malabon 475,964 25.2 3,161,309 23.9
9 Marikina / Pasig 215,782 21.1 1,780,398 22.3
10 Taguig 258,664 22.2 1,289,227 19.2
11 Muntinlupa / Las Pinas 184,613 23.8 1,974,745 26.5
12 Las Pinas / Paranaque 101,580 22.2 1,097,349 20.2
13 Marilao / Meycauayan 30,931 7.7 566,236 8.7
14 Obando / Bulacan 29,104 13.2 233,391 15.8
15 Bocaue / Balagtas 64,258 14.3 391,482 14.7
16 Malolos / Paombong 163,959 12.1 700,699 13.4
17 Plaridel / Pulilan 117,946 17.9 529,960 19.3
18 Sta. Maria / Pandi 84,050 14.8 432,950 14.6
19 San Jose Del Monte 57,457 10.0 377,264 12.3
20 Norzagaray 37,164 9.6 244,759 9.8
21 San Mateo / Rodriguez 76,132 12.6 534,751 12.1
22 Antipolo 116,817 7.1 1,249,236 7.5
23 Tayaty / Cainta 25,897 26.8 944,938 9.5
24 Angono / Binagonan 107,710 5.0 636,843 5.0
25 Cardona / Morong 83,517 13.1 293,859 13.4
26 Tanay / Pililia 125,050 14.7 575,509 14.6
27 Bacoor / Imus 46,066 9.5 238,281 12.6
28 Cavite City / Kawit 15,406 18.9 67,238 21.5
29 Gen. Trias / Tanza 47,046 21.7 195,110 19.2
30 Dasmarinas / Silang 7,430 20.6 151,583 20.8
31 Carmona / Gen. Alvarez 78,934 24.0 488,075 22.7
32 Cabuyao / Calamba 134,471 14.6 605,938 12.8
Total 4,925,499 19.2 39,763,937 20.1
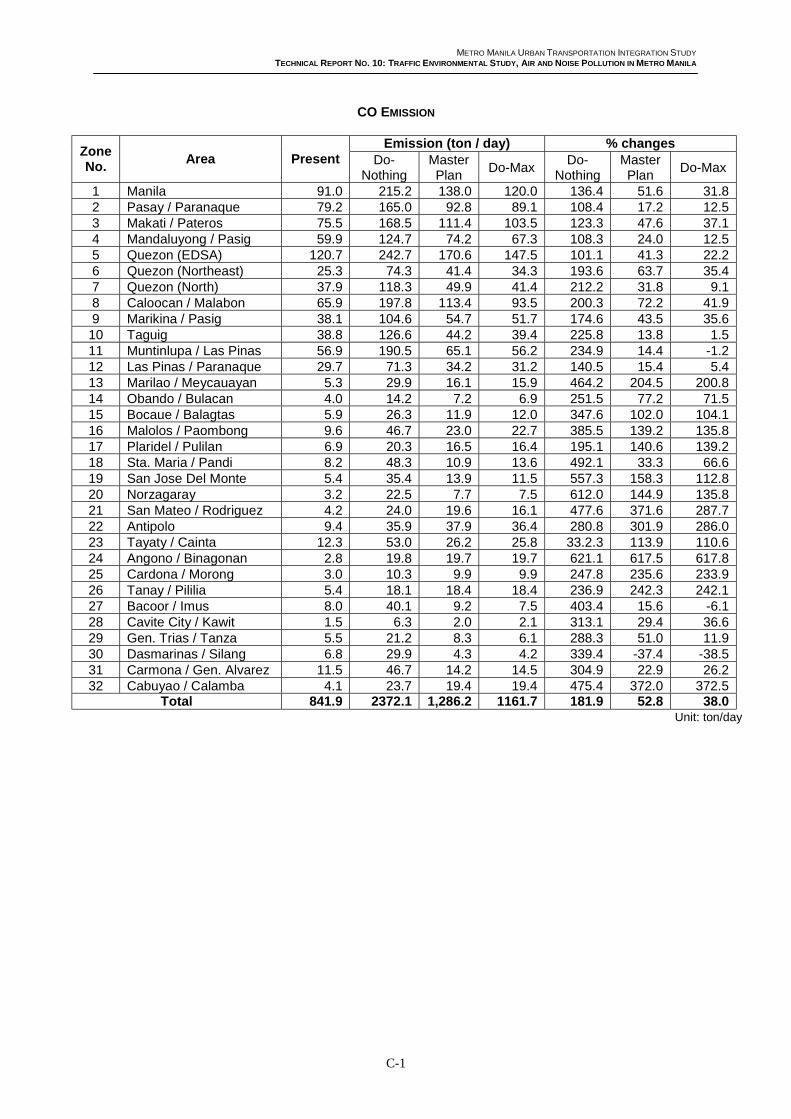
METRO MANILA URBAN TRANSPORTATION INTEGRATION STUDY
TECHNICAL REPORT NO. 10: TRAFFIC ENVIRONMENTAL STUDY, AIR AND NOISE POLLUTION IN METRO MANILA
C-1
CO EMISSION
Emission (ton / day) % changesZoneNo.
Area Present Do-Nothing
MasterPlan
Do-MaxDo-
NothingMasterPlan
Do-Max
1 Manila 91.0 215.2 138.0 120.0 136.4 51.6 31.82 Pasay / Paranaque 79.2 165.0 92.8 89.1 108.4 17.2 12.53 Makati / Pateros 75.5 168.5 111.4 103.5 123.3 47.6 37.14 Mandaluyong / Pasig 59.9 124.7 74.2 67.3 108.3 24.0 12.55 Quezon (EDSA) 120.7 242.7 170.6 147.5 101.1 41.3 22.26 Quezon (Northeast) 25.3 74.3 41.4 34.3 193.6 63.7 35.47 Quezon (North) 37.9 118.3 49.9 41.4 212.2 31.8 9.18 Caloocan / Malabon 65.9 197.8 113.4 93.5 200.3 72.2 41.99 Marikina / Pasig 38.1 104.6 54.7 51.7 174.6 43.5 35.610 Taguig 38.8 126.6 44.2 39.4 225.8 13.8 1.511 Muntinlupa / Las Pinas 56.9 190.5 65.1 56.2 234.9 14.4 -1.212 Las Pinas / Paranaque 29.7 71.3 34.2 31.2 140.5 15.4 5.413 Marilao / Meycauayan 5.3 29.9 16.1 15.9 464.2 204.5 200.814 Obando / Bulacan 4.0 14.2 7.2 6.9 251.5 77.2 71.515 Bocaue / Balagtas 5.9 26.3 11.9 12.0 347.6 102.0 104.116 Malolos / Paombong 9.6 46.7 23.0 22.7 385.5 139.2 135.817 Plaridel / Pulilan 6.9 20.3 16.5 16.4 195.1 140.6 139.218 Sta. Maria / Pandi 8.2 48.3 10.9 13.6 492.1 33.3 66.619 San Jose Del Monte 5.4 35.4 13.9 11.5 557.3 158.3 112.820 Norzagaray 3.2 22.5 7.7 7.5 612.0 144.9 135.821 San Mateo / Rodriguez 4.2 24.0 19.6 16.1 477.6 371.6 287.722 Antipolo 9.4 35.9 37.9 36.4 280.8 301.9 286.023 Tayaty / Cainta 12.3 53.0 26.2 25.8 33.2.3 113.9 110.624 Angono / Binagonan 2.8 19.8 19.7 19.7 621.1 617.5 617.825 Cardona / Morong 3.0 10.3 9.9 9.9 247.8 235.6 233.926 Tanay / Pililia 5.4 18.1 18.4 18.4 236.9 242.3 242.127 Bacoor / Imus 8.0 40.1 9.2 7.5 403.4 15.6 -6.128 Cavite City / Kawit 1.5 6.3 2.0 2.1 313.1 29.4 36.629 Gen. Trias / Tanza 5.5 21.2 8.3 6.1 288.3 51.0 11.930 Dasmarinas / Silang 6.8 29.9 4.3 4.2 339.4 -37.4 -38.531 Carmona / Gen. Alvarez 11.5 46.7 14.2 14.5 304.9 22.9 26.232 Cabuyao / Calamba 4.1 23.7 19.4 19.4 475.4 372.0 372.5
Total 841.9 2372.1 1,286.2 1161.7 181.9 52.8 38.0Unit: ton/day

METRO MANILA URBAN TRANSPORTATION INTEGRATION STUDY
TECHNICAL REPORT NO. 10: TRAFFIC ENVIRONMENTAL STUDY, AIR AND NOISE POLLUTION IN METRO MANILA
C-2
NOX EMISSION
Emission (ton / day) % changesZoneNo.
Area Present Do-Nothing
MasterPlan
Do-MaxDo-
NothingMasterPlan
Do-Max
1 Manila 14.37 33.08 17.46 14.89 130.2 21.5 3.62 Pasay / Paranaque 11.63 33.46 12.87 10.65 187.7 10.7 -8.43 Makati / Pateros 11.32 28.02 15.44 12.57 147.5 36.4 11.04 Mandaluyong / Pasig 9.11 19.18 9.61 8.56 110.5 5.5 -6.05 Quezon (EDSA) 18.44 38.11 21.95 18.90 106.7 19.0 2.56 Quezon (Northeast) 4.54 17.74 6.64 4.98 290.7 46.3 9.77 Quezon (North) 9.68 37.59 8.97 6.78 288.3 -7.3 -30.08 Caloocan / Malabon 10.52 45.78 18.66 13.74 335.2 77.4 30.69 Marikina / Pasig 6.19 25.58 8.97 7.88 313.2 44.9 27.310 Taguig 7.00 36.84 8.18 6.91 426.3 16.9 -1.311 Muntinlupa / Las Pinas 9.51 52.81 9.08 7.49 455.3 -4.5 -21.212 Las Pinas / Paranaque 5.33 18.29 5.37 4.77 243.2 0.8 -10.513 Marilao / Meycauayan 1.51 13.11 5.75 4.96 768.2 280.8 228.514 Obando / Bulacan 1.64 4.92 1.48 1.43 200.0 -9.8 -12.815 Bocaue / Balagtas 1.60 8.92 2.82 2.66 457.5 76.3 66.316 Malolos / Paombong 2.32 15.35 6.24 6.17 561.6 169.0 165.917 Plaridel / Pulilan 1.77 5.22 3.22 3.18 194.9 81.9 79.718 Sta. Maria / Pandi 1.16 18.44 2.10 3.09 1489.7 81.0 166.419 San Jose Del Monte 1.15 14.06 4.21 3.17 1122.6 266.1 175.720 Norzagaray 0.71 9.27 2.45 2.38 1205.6 245.1 235.221 San Mateo / Rodriguez 0.67 7.87 5.09 4.04 1074.6 659.7 503.022 Antipolo 2.46 15.42 15.92 13.98 526.8 547.2 468.323 Tayaty / Cainta 2.70 22.75 6.69 6.38 742.6 147.8 136.324 Angono / Binagonan 0.82 13.23 13.36 13.32 1513.4 1529.3 1524.425 Cardona / Morong 0.51 2.80 2.76 2.72 449.0 441.2 433.326 Tanay / Pililia 0.84 4.03 4.31 4.30 379.8 413.1 411.927 Bacoor / Imus 2.29 21.82 2.65 2.25 852.8 15.7 -1.728 Cavite City / Kawit 0.41 3.14 0.36 0.38 665.9 -12.2 -7.329 Gen. Trias / Tanza 0.98 7.79 1.94 1.12 694.9 98.0 14.330 Dasmarinas / Silang 1.60 16.00 0.62 0.60 900.0 -61.3 -62.531 Carmona / Gen. Alvarez 2.02 15.47 2.17 2.24 665.8 7.4 10.932 Cabuyao / Calamba 0.86 7.56 4.90 4.90 779.1 469.8 469.8
Total 145.66 613.65 232.24 201.39 321.3 59.4 38.3Unit: ton/day
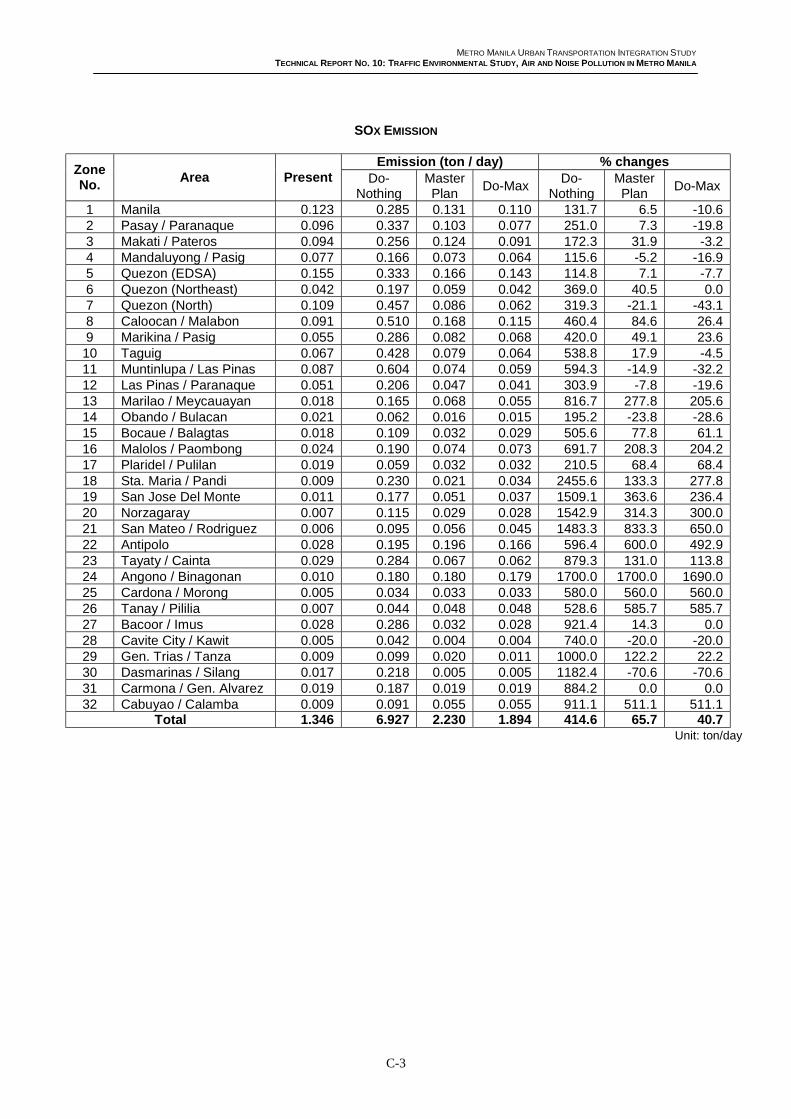
METRO MANILA URBAN TRANSPORTATION INTEGRATION STUDY
TECHNICAL REPORT NO. 10: TRAFFIC ENVIRONMENTAL STUDY, AIR AND NOISE POLLUTION IN METRO MANILA
C-3
SOX EMISSION
Emission (ton / day) % changesZoneNo.
Area Present Do-Nothing
MasterPlan
Do-MaxDo-
NothingMasterPlan
Do-Max
1 Manila 0.123 0.285 0.131 0.110 131.7 6.5 -10.62 Pasay / Paranaque 0.096 0.337 0.103 0.077 251.0 7.3 -19.83 Makati / Pateros 0.094 0.256 0.124 0.091 172.3 31.9 -3.24 Mandaluyong / Pasig 0.077 0.166 0.073 0.064 115.6 -5.2 -16.95 Quezon (EDSA) 0.155 0.333 0.166 0.143 114.8 7.1 -7.76 Quezon (Northeast) 0.042 0.197 0.059 0.042 369.0 40.5 0.07 Quezon (North) 0.109 0.457 0.086 0.062 319.3 -21.1 -43.18 Caloocan / Malabon 0.091 0.510 0.168 0.115 460.4 84.6 26.49 Marikina / Pasig 0.055 0.286 0.082 0.068 420.0 49.1 23.610 Taguig 0.067 0.428 0.079 0.064 538.8 17.9 -4.511 Muntinlupa / Las Pinas 0.087 0.604 0.074 0.059 594.3 -14.9 -32.212 Las Pinas / Paranaque 0.051 0.206 0.047 0.041 303.9 -7.8 -19.613 Marilao / Meycauayan 0.018 0.165 0.068 0.055 816.7 277.8 205.614 Obando / Bulacan 0.021 0.062 0.016 0.015 195.2 -23.8 -28.615 Bocaue / Balagtas 0.018 0.109 0.032 0.029 505.6 77.8 61.116 Malolos / Paombong 0.024 0.190 0.074 0.073 691.7 208.3 204.217 Plaridel / Pulilan 0.019 0.059 0.032 0.032 210.5 68.4 68.418 Sta. Maria / Pandi 0.009 0.230 0.021 0.034 2455.6 133.3 277.819 San Jose Del Monte 0.011 0.177 0.051 0.037 1509.1 363.6 236.420 Norzagaray 0.007 0.115 0.029 0.028 1542.9 314.3 300.021 San Mateo / Rodriguez 0.006 0.095 0.056 0.045 1483.3 833.3 650.022 Antipolo 0.028 0.195 0.196 0.166 596.4 600.0 492.923 Tayaty / Cainta 0.029 0.284 0.067 0.062 879.3 131.0 113.824 Angono / Binagonan 0.010 0.180 0.180 0.179 1700.0 1700.0 1690.025 Cardona / Morong 0.005 0.034 0.033 0.033 580.0 560.0 560.026 Tanay / Pililia 0.007 0.044 0.048 0.048 528.6 585.7 585.727 Bacoor / Imus 0.028 0.286 0.032 0.028 921.4 14.3 0.028 Cavite City / Kawit 0.005 0.042 0.004 0.004 740.0 -20.0 -20.029 Gen. Trias / Tanza 0.009 0.099 0.020 0.011 1000.0 122.2 22.230 Dasmarinas / Silang 0.017 0.218 0.005 0.005 1182.4 -70.6 -70.631 Carmona / Gen. Alvarez 0.019 0.187 0.019 0.019 884.2 0.0 0.032 Cabuyao / Calamba 0.009 0.091 0.055 0.055 911.1 511.1 511.1
Total 1.346 6.927 2.230 1.894 414.6 65.7 40.7Unit: ton/day
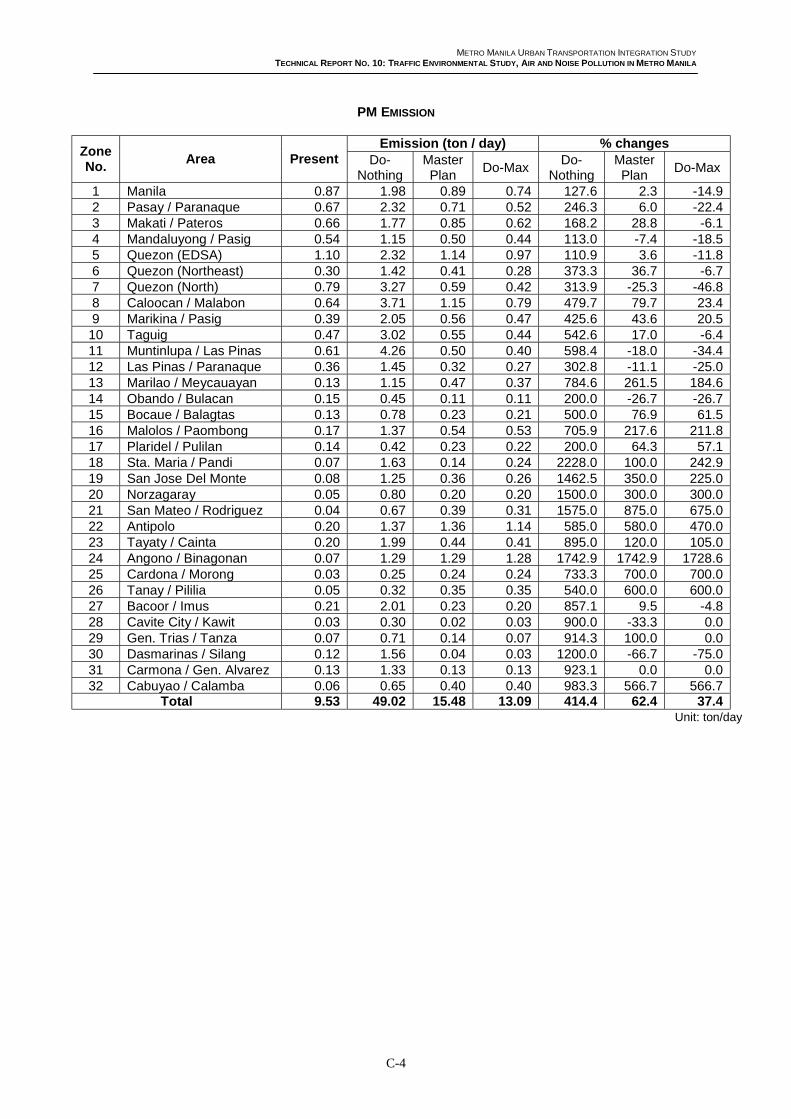
METRO MANILA URBAN TRANSPORTATION INTEGRATION STUDY
TECHNICAL REPORT NO. 10: TRAFFIC ENVIRONMENTAL STUDY, AIR AND NOISE POLLUTION IN METRO MANILA
C-4
PM EMISSION
Emission (ton / day) % changesZoneNo.
Area Present Do-Nothing
MasterPlan
Do-MaxDo-
NothingMasterPlan
Do-Max
1 Manila 0.87 1.98 0.89 0.74 127.6 2.3 -14.92 Pasay / Paranaque 0.67 2.32 0.71 0.52 246.3 6.0 -22.43 Makati / Pateros 0.66 1.77 0.85 0.62 168.2 28.8 -6.14 Mandaluyong / Pasig 0.54 1.15 0.50 0.44 113.0 -7.4 -18.55 Quezon (EDSA) 1.10 2.32 1.14 0.97 110.9 3.6 -11.86 Quezon (Northeast) 0.30 1.42 0.41 0.28 373.3 36.7 -6.77 Quezon (North) 0.79 3.27 0.59 0.42 313.9 -25.3 -46.88 Caloocan / Malabon 0.64 3.71 1.15 0.79 479.7 79.7 23.49 Marikina / Pasig 0.39 2.05 0.56 0.47 425.6 43.6 20.510 Taguig 0.47 3.02 0.55 0.44 542.6 17.0 -6.411 Muntinlupa / Las Pinas 0.61 4.26 0.50 0.40 598.4 -18.0 -34.412 Las Pinas / Paranaque 0.36 1.45 0.32 0.27 302.8 -11.1 -25.013 Marilao / Meycauayan 0.13 1.15 0.47 0.37 784.6 261.5 184.614 Obando / Bulacan 0.15 0.45 0.11 0.11 200.0 -26.7 -26.715 Bocaue / Balagtas 0.13 0.78 0.23 0.21 500.0 76.9 61.516 Malolos / Paombong 0.17 1.37 0.54 0.53 705.9 217.6 211.817 Plaridel / Pulilan 0.14 0.42 0.23 0.22 200.0 64.3 57.118 Sta. Maria / Pandi 0.07 1.63 0.14 0.24 2228.0 100.0 242.919 San Jose Del Monte 0.08 1.25 0.36 0.26 1462.5 350.0 225.020 Norzagaray 0.05 0.80 0.20 0.20 1500.0 300.0 300.021 San Mateo / Rodriguez 0.04 0.67 0.39 0.31 1575.0 875.0 675.022 Antipolo 0.20 1.37 1.36 1.14 585.0 580.0 470.023 Tayaty / Cainta 0.20 1.99 0.44 0.41 895.0 120.0 105.024 Angono / Binagonan 0.07 1.29 1.29 1.28 1742.9 1742.9 1728.625 Cardona / Morong 0.03 0.25 0.24 0.24 733.3 700.0 700.026 Tanay / Pililia 0.05 0.32 0.35 0.35 540.0 600.0 600.027 Bacoor / Imus 0.21 2.01 0.23 0.20 857.1 9.5 -4.828 Cavite City / Kawit 0.03 0.30 0.02 0.03 900.0 -33.3 0.029 Gen. Trias / Tanza 0.07 0.71 0.14 0.07 914.3 100.0 0.030 Dasmarinas / Silang 0.12 1.56 0.04 0.03 1200.0 -66.7 -75.031 Carmona / Gen. Alvarez 0.13 1.33 0.13 0.13 923.1 0.0 0.032 Cabuyao / Calamba 0.06 0.65 0.40 0.40 983.3 566.7 566.7
Total 9.53 49.02 15.48 13.09 414.4 62.4 37.4Unit: ton/day