Dosimeter for the measurement of - USQ ePrints · The development of a dosimeter for the...
27
Dosimeter for the measurement of plant damaging solar UV exposures J. Turner 1* , A.V. Parisi 1 and D. J. Turnbull 1 1 Faculty of Sciences, University of Southern Queensland, TOOWOOMBA. 4350. AUSTRALIA. Fax: 61 74 6312721. Email: [email protected] * To whom correspondence is to be addressed 1
Transcript of Dosimeter for the measurement of - USQ ePrints · The development of a dosimeter for the...
Dosimeter for the measurement of
plant damaging solar UV exposures
J. Turner1*, A.V. Parisi1 and D. J. Turnbull1
1Faculty of Sciences, University of Southern Queensland, TOOWOOMBA. 4350.
AUSTRALIA. Fax: 61 74 6312721. Email: [email protected]
*To whom correspondence is to be addressed
1

Abstract
The development of a dosimeter for the measurement of the biologically effective UV
exposures (UVPGI) for plant growth inhibition in higher plants based on a recently
reported action spectrum is presented. The new dosimeter is based on the two
photoactive materials polysulphone and nalidixic acid, each in thin film form layered
on top of one another to provide a combined response. The quantitative
characteristics of the UVPGI dosimeter were measured, including the spectral
response, dose response, dark reaction and cosine response. The spectral response of
the new dosimeter has been successfully extended into the UVA waveband. The dark
reaction was within a reasonable limit that could be taken into account when
measurements are taken by measuring the post-exposure absorbances at a consistent
time period after the exposure. The cosine response approximated the cosine function
to better than 15% for solar zenith angles up to 50°. The dose response shows that the
new dosimeter can be employed for the measurement of UVPGI exposures and has
reproducibility comparable to other dosimeters calibrated to a biological action
spectrum.
Keywords: dosimeter, UV, plant, action spectrum, solar
2

Introduction
Dosimetry in the ultraviolet waveband (UV) has been employed to measure erythemal
UV exposures using polysulphone dosimeters. The potential of the photochemical
polysulphone (PS) as an erythemal UV dosimeter was reported by Davis et al.,
(1976a) who found that exposure of PS in thin film form to UV radiation resulted in
optical density darkening of the polymer, with the maximum change at 330 nm. PS is
responsive only to wavelengths shorter than 330 nm and when cast as a thin film of
approximately 40 µm thickness possesses a response spectrum that approximates the
erythemal action spectrum (CIE, 1987) for wavelengths shorter than 330 nm (CIE,
1992). In this form, PS has been employed extensively for the measurement of
personal erythemal UV exposures in different environments.
UVB (280 – 320 nm) radiation is known to produce biological damage in higher
plants. Additionally, UVA (320 - 400 nm) radiation has also been found to elicit a
biological response (Flint et al., 2004) and an action spectrum for plant growth
inhibition in higher plants has been recently developed (Flint and Caldwell, 2003) that
extends into the UVA to 366 nm. The UV exposures to plants can be measured on a
horizontal plane and on a number of inclined planes with instrumentation. However,
the measurement of UV exposures to the plant leaves with dosimeters at a series of
locations and orientations will provide a more accurate representation of the UV
exposures incident on a small plant in studies of the effects of enhanced UV levels
(Parisi et al., 1998). This allows simultaneous multi-site measurement taking into
account shading by neighbouring plants and shading by other leaves in the plant.
3
Previous research has investigated the use of dosimeters fabricated from polysulphone
and supported on a light weight frame over the canopy of a plant for the measurement
of the UVB over a plant canopy (Parisi et al., 2003). The recently developed action
spectrum for UV plant growth inhibition to higher plants has a response that extends
into the UVA waveband (Flint and Caldwell, 2003). In order to measure with
dosimeters the biologically effective UV exposures weighted with this action
spectrum for plant growth inhibition in higher plants (UVPGI), a dosimeter that
possesses a spectral response that is high in the UVB and extends into the UVA is
required. This paper reports on the development and testing of the properties of a
dosimeter with this spectral response, that can be employed for the measurement of
the biologically growth inhibiting UV exposures to higher plants.
Methodology
Selection of Photoactive Material
The approach employed in this paper was to employ two photoactive materials
layered one on top of the other in a dosimeter that possesses a response that is high in
the UVB and extends into the UVA. The reason for this approach is that there is no
chemical dosimeter that responds to more than one waveband, such as UVB and UVA
radiation and that also approximates the Flint-Caldwell plant action spectrum (Flint &
Caldwell, 2003).
Polysulphone (PS) is a photoactive material for a UV dosimeter, with a spectral
response that is high in the UVB and can be used to approximate the Flint-Caldwell
plant action spectrum for plant growth inhibition (APGI) for this waveband of the
response. Its limiting factor is the lack of spectral sensitivity within the UVA
4
waveband. Due to polysulphone’s ease of use and ruggedness for UV dosimetry, the
approach employed in this research was to enhance the already useful features of the
polymer and extend the response into the UVA with the use of a second photoactive
material. Interchanging the photoactive material of the dosimeter changes the
response waveband of the dosimeter, allowing alternative wavebands to be
investigated.
A number of photoactive materials were considered: Nalidixic acid (Tate et al., 1979),
8-methoxypsoralen (Diffey and Davis, 1978), phenothiazine (Diffey et al., 1977,
Wong and Parisi, 1996, Parisi and Kimlin 2004), allyl diglycol carbonate or CR-39
(Wong et al., 1992, Wong et al., 1995), polyphenylene oxide or PPO (Davis et al.,
1976b, Berre and Lala, 1989, Lester et al., 2003), diazochromic film (Ali and
Jacobson, 1980, Jackson, 1980, Mosely et al., 1984), benoxaprofen (Diffey et al.,
1982) and triphenyl tetrazolium chloride dye doped in poly vinyl alcohol (PVA) and
poly vinyl butyral (PVB) (Ebraheem et al., 2000). Nalidixic acid was identified as
being the most appropriate candidate to investigate further for use with polysulphone,
due to the appropriate ease of handling and a response spectrum that extends into
UVA wavelengths with a spectral response in the range of 280-350 nm (Tate et al.,
1979) that may result in an approximation of the plant growth inhibition action
spectrum when combined with PS in a combined dosimeter. Nalidixic acid (NDA)
undergoes a change in its optical properties when exposed to UV radiation, and has a
measurable change in absorbance at 330 nm.
Sheets of PS and NDA in thin film form were used to construct the UVPGI dosimeter
that was in a holder with an overall size of 3 cm x 3 cm. In order to investigate
5

whether the location of each material within the dosimeter would affect the response
of the dosimeter, a test of the change in optical absorbance due to UV exposure of
four types of dosimeters consisting of PS, NDA, PS layered on top of NDA
(PS/NDA) and NDA layered on top of PS (NDA/PS), was carried out. For each case
four different exposure times were employed. Each dosimeter was exposed for four
consecutive half hour intervals, and measured at the end of each interval. The
photodegradation of PS dosimeters are quantified by measuring the optical
absorbance pre and post exposure to UV radiation, due to the increase in optical
absorbance at 330 nm due to UV exposure. At the wavelength of 330 nm, NDA has a
decrease in optical absorbance due to UV exposure. In order to employ PS and NDA
in a UVPGI dosimeter, a new wavelength at which both materials undergo a change in
absorption that is in the same direction for both materials is required. In order to
determine this, the changes in the spectral optical absorbance of the two materials due
to UV exposure were measured in a spectrophotometer (UV-1601, Shimadzu & Co,
Kyoto). The error of the spectrophotometer is ± 0.004%. Variations in surface and
thickness of the materials over each dosimeter were accounted for by measuring the
change in absorbance at four sites over the dosimeter. This was achieved by using a
rotating mount holder that takes a measurement on each side of the square dosimeter
as it is rotated, and averaging these values.
Spectral Response
The spectral response of the UVPGI dosimeter was measured by exposing a series of
dosimeters to monochromatic radiation and recording the resultant degradation of the
film. Monochromatic UV radiation was sourced from an irradiation monochromator
consisting of a xenon arc lamp (model LX/450-2, Spectral Energy, New Jersey, USA)
6
and a monochromator (model GM 252, Spectral Energy, New Jersey, USA). The
input and output slit widths were adjusted to provide an output beam with a FWHM of
6 nm. The output beam of UV from the irradiation monochromator had a diameter of
the same order of magnitude as the aperture of a UV dosimeter.
The irradiances of the irradiation monochromator and the other UV radiation sources
employed in this paper were measured using a mobile scanning spectroradiometer.
This instrument consists of a diffuser for the input optics (type D6, Bentham
Instruments, Reading, UK) and a dispersion unit of a monochromator with double
holographic gratings (model DH10, Jobin Yvon, France) at 1200 lines/mm. The
diffuser and input slit of the monochromator are connected by a length of optical
fibre. The UV detection system is a UV radiation photomultiplier tube (model R212,
Hamamatsu Co., Japan) which is kept at 14.5°C ± 0.5°C using a Peltier effect
temperature control unit.
Wavelength calibration was carried out using an electric discharge mercury lamp,
where the spectral emission lines at 365 nm and 405 nm were used. Absolute
calibration was carried out using a quartz-tungsten halogen lamp (with a traceable
calibration against a standard located at the National Measurements Laboratory,
CSIRO, Lindfield) supplied with a current of 9.500 ± 0.005 A (DC) from a current
regulated power supply (model PD36 20AD, Kenwood). The dark current, or the
“noise” of the system was measured prior to each scan and all scans were carried out
at 1 nm steps between 280 nm and 400 nm. It is estimated that the spectroradiometer
measurement of spectral irradiances has an overall error of ± 5% (Wong et al. 1995).
7
Cosine Response
The solar simulator (model 15S solar UV simulator, Solar Light Co., Philadelphia,
USA) is an artificial UV radiation source. The output of the solar simulator varied in
diameter, and was manually adjusted to the same size as the aperture of a UV
dosimeter. The irradiance output was measured using the scanning spectroradiometer.
Using a stand and a rotating dosimeter clamp, the dosimeter was positioned in front of
the solar simulator aperture that emits the UV radiation. One dosimeter was exposed
on a plane normal to the incident radiation (0°) and then used as a comparison for the
measurements at the other angles of incidence. The mount holding the dosimeter was
then rotated 10° from the normal plane and another dosimeter was exposed for the
same period of time as the initial dosimeter at 0°. This was carried out for the
following angles from the plane normal to the incident irradiance: 20°, 30°, 40°, 50°,
60°, and 70°. Using the dose response of the UVPGI dosimeter to the UV radiation
from the source, the change in absorbance of the dosimeter at a given angle was
normalized by a previously given technique (Lester et al. 2003). In this technique, the
dose-response equation in the form of a polynomial expression is calculated for the
solar UV simulator, where change in absorbance is a function of time. The normalized
response is a ratio of the dose response of this equation at a given incident angle to the
dose response of the equation at normal incidence (0º).
Dark Reaction
Eleven dosimeters were exposed to solar UV for three hours on a clear day and the
optical absorbance for each dosimeter was measured at four sites over the dosimeter
surface before and immediately after exposure, with the calculated change in
absorbance averaged. The dosimeters were then stored in a UV radiation free
8
environment for twenty-four hours and then measured again for absorbance. This was
followed by storage in the same UV radiation free environment for a week after
exposure and the absorbance measured again. The differences between absorbance
measured immediately after exposure, twenty-four hours after exposure and a week
after exposure indicated the dark reaction of the UVPGI dosimeter.
Dose Response
A series of the UVPGI dosimeters were exposed to solar UV on different cloudless
days on a horizontal plane for varying periods of time: 5 minutes, 10 minutes, 15
minutes, 30 minutes, 45 minutes, 1 hour, 1 hour and thirty minutes, and then in 30
minute intervals up to a maximum of 5 hours. The dose response is expressed as the
biologically growth inhibiting UV exposure for the APGI action spectrum versus the
corresponding change in absorbance. The UVPGI exposure was determined by
measurement of the UV spectrum with a UV spectroradiometer that is permanently
mounted on the roof of a building in a weather proof container and that automatically
measures the UV spectral irradiance every five minutes from 280 nm to 400 nm in
half nanometer steps (model DTM300, Bentham Instruments, Reading, UK). The
measured UV spectral irradiances were then weighted with the APGI action spectrum
to produce the UVPGI irradiances at each five minute interval from which the UVPGI
exposures that each of the calibration dosimeters were exposed to were calculated.
UV radiation varies according to solar zenith angle, clouds, ozone and aerosol levels,
therefore the dose response is initially measured each day of UV measurements to
account for the variations of conditions.
Although the agreement between the spectral response of the dosimeter and the action
spectrum for the UVPGI spectrum are not exact, it is possible to allow for this,
9

provided the relative spectral distribution of the incident irradiance is quantified and
the reproducibility of the response of the dosimeter to the given spectral distribution is
known (Davis et al, 1976a).
The ability of the dose response to predict UVPGI irradiance values (reproducibility)
was tested using a number of dosimeters exposed for certain time periods, using the
dose response to calculate the corresponding UVPGI irradiance and comparing to the
weighted UVPGI measured by the UV spectroradiometer. The dosimeters were
exposed on a clear day, and also on a different day to when the dose response was
calculated. Thirty-six dosimeters were separated into four groups and exposed for
different time periods. The difference between the calculated UVPGI irradiance and the
measured UVPGI irradiance was determined.
Results
Spectral scans of PS, NDA and PS over NDA were analysed and indicated a suitable
wavelength in the UV spectrum with a maximum observable change in absorbance for
both photoactive materials. The wavelength of 345 nm was selected as both PS and
NDA undergo positive changes in absorbance at this wavelength. PS and NDA have
opposite magnitude change in absorbance measured at 330nm. NDA undergoes a
negative change in absorbance relative to PS, indicating the wavelength of 330 nm
would not be suitable as a guide to the changes in absorbance of each material, when
used in conjunction as a combined dosimeter.
Figure 1 shows the test for comparing how each photoactive material reacts in single
and combined form. For the combined dosimeter, the Figure shows the change in
absorbance for a combined dosimeter consisting of NDA/PS and PS/NDA. In this
10

case, each change in absorbance was measured at 330 nm as this was prior to the
determination of a wavelength where the change in absorbance was positive.
Nevertheless, this side by side dot plot shows that the materials do affect one another.
The results show that the change in absorbance for NDA is similar to that for
NDA/PS, indicating that the NDA filters nearly all UV radiation from reaching the
PS, thus rendering the PS component almost inactive. The PS placed above the NDA
responded to UV radiation, but did not act as a strong filter, allowing NDA to also
respond to UV radiation. Therefore the combination of PS on top of NDA will be
used within this study and all further references to a combined dosimeter will indicate
the placement of PS over NDA within the UV dosimeter to form the UVPGI dosimeter.
The variances of the absorbances of the UVPGI dosimeter at different stages are
provided in Table 1. The absorbance measurements were recorded at 345 nm. The
data for 55 dosimeters (the total number of dosimeters that were used in all tests),
were used to determine the overall accuracy for the UVPGI dosimeter. This accuracy is
attributable to thickness and surface variation of the photochemical materials.
Different batches of the material can contribute to variation in absorbance. For the
pre-exposure change in absorbance, measurements of the 55 dosimeters, using the
average of the four side absorbance measurements, provided a mean absorbance of
0.334 and a standard deviation of 0.014. This gives 4.2% variance within pre-
exposure absorbance measurements. The variance for immediate post-exposure and
24 hours post-exposure changes in absorbance was calculated from 11 of the total 55
dosimeters. These eleven dosimeters were irradiated at the same time for a two hour
time period, and therefore received the same exposures. Variances found for these
11

dosimeters are taken as the variation in the dosimeters. The largest variance is 5.8%
for the change in absorbance determined immediately post exposure.
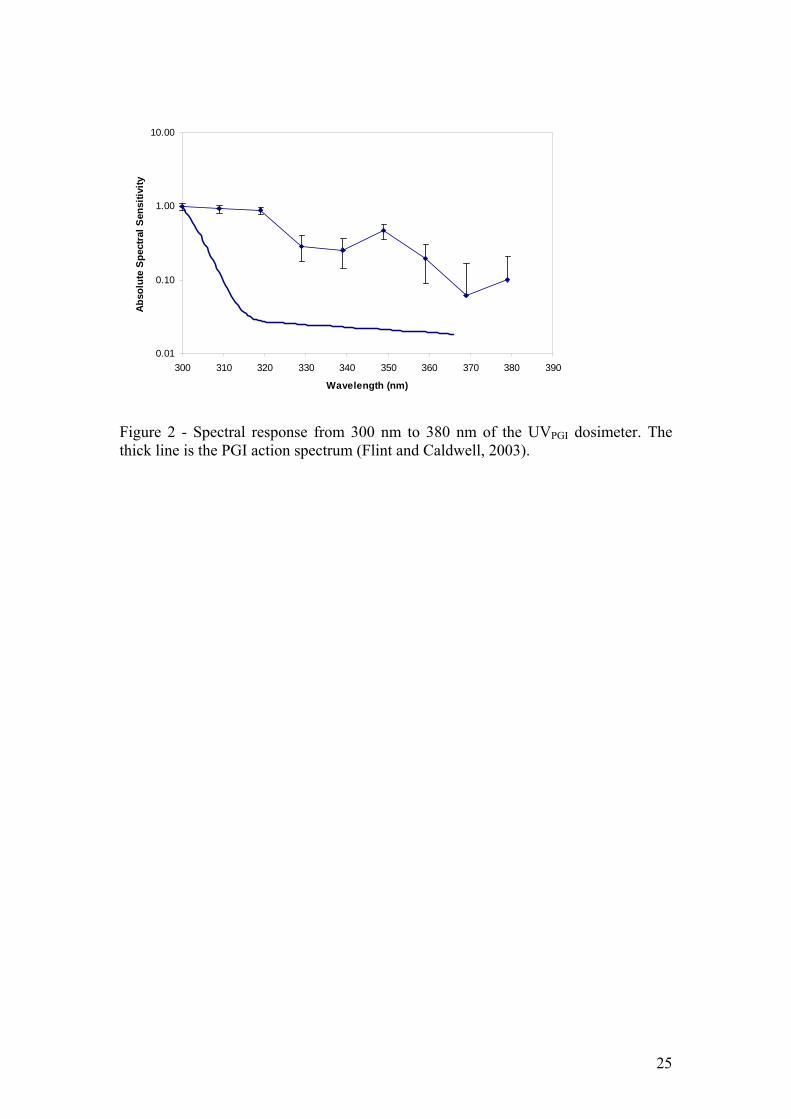
The spectral response of the UVPGI dosimeter between 300 nm and 380 nm, with each
dosimeter at each wavelength exposed to 2000 Jm-2 is shown in Figure 2. This
spectral response is expressed as the absolute of the change in absorbance normalized
to the change in absorbance measured at the wavelength where the largest change in
absorbance occurs. The error bars represent ±10.8% error, consisting of the
accumulated errors due to the variance of the change in dosimeter absorbance (5.8%),
the scanning spectroradiometer (5%) and the spectrophotometer (0.004%). Although
the agreement between the spectral response of the dosimeter and the action spectrum
for the UVPGI spectrum is not exact, it is possible to allow for this, if the relative
spectral distribution of the incident irradiance is quantified (Davis et al, 1976a). The
relative spectral distribution of the incident radiation was quantified with the
spectroradiometer as reported in the methodology. By weighting the spectral
distribution of the measured incident irradiance with the PGI action spectrum, only
the irradiance that contributes to the biological effect of plant growth inhibition is
correlated to the UVPGI dosimeter’s change in absorbance. This is achieved by the
recording of a dose response at the approximate time of the field measurement. To
find the UV exposure experienced by any dosimeter, the change in absorbance of that
dosimeter is calibrated against the weighted UV exposures.
Table 2 indicates the dark reaction of the UVPGI dosimeter measured at 345 nm for
periods of 24 hours and one week after exposure. In comparison, PS has a dark
reaction, when measured at 330 nm, of 4% after 24 hours and 5% after a week (Davis
et al., 1976a), which is comparable to that of the UVPGI dosimeter.
12
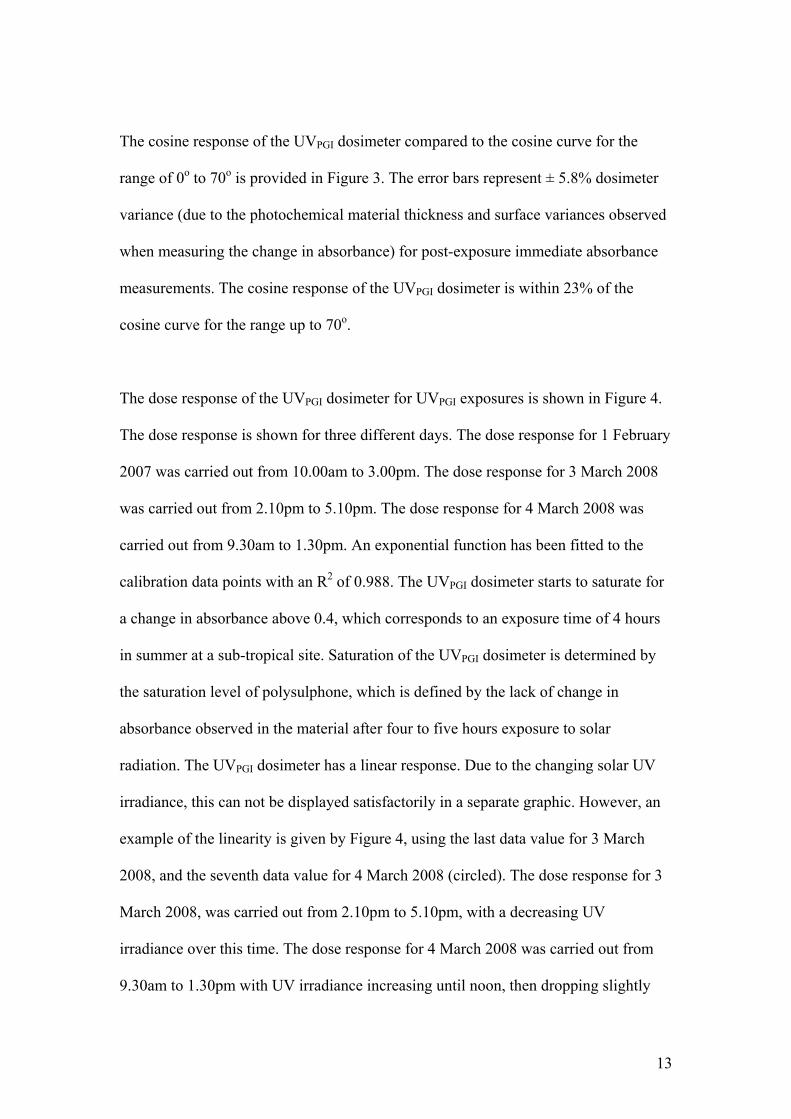
The cosine response of the UVPGI dosimeter compared to the cosine curve for the
range of 0o to 70o is provided in Figure 3. The error bars represent ± 5.8% dosimeter
variance (due to the photochemical material thickness and surface variances observed
when measuring the change in absorbance) for post-exposure immediate absorbance
measurements. The cosine response of the UVPGI dosimeter is within 23% of the
cosine curve for the range up to 70o.
The dose response of the UVPGI dosimeter for UVPGI exposures is shown in Figure 4.
The dose response is shown for three different days. The dose response for 1 February
2007 was carried out from 10.00am to 3.00pm. The dose response for 3 March 2008
was carried out from 2.10pm to 5.10pm. The dose response for 4 March 2008 was
carried out from 9.30am to 1.30pm. An exponential function has been fitted to the
calibration data points with an R2 of 0.988. The UVPGI dosimeter starts to saturate for
a change in absorbance above 0.4, which corresponds to an exposure time of 4 hours
in summer at a sub-tropical site. Saturation of the UVPGI dosimeter is determined by
the saturation level of polysulphone, which is defined by the lack of change in
absorbance observed in the material after four to five hours exposure to solar
radiation. The UVPGI dosimeter has a linear response. Due to the changing solar UV
irradiance, this can not be displayed satisfactorily in a separate graphic. However, an
example of the linearity is given by Figure 4, using the last data value for 3 March
2008, and the seventh data value for 4 March 2008 (circled). The dose response for 3
March 2008, was carried out from 2.10pm to 5.10pm, with a decreasing UV
irradiance over this time. The dose response for 4 March 2008 was carried out from
9.30am to 1.30pm with UV irradiance increasing until noon, then dropping slightly
13

again. The seventh data value for this dose response was recorded at 11.00am, one
and a half hours from the beginning of the dose response. Therefore, the UVPGI
dosimeter responded to 6124mW/m2 in three hours during the late afternoon, and to
6168mW/m2 in one and a half hours in the morning, with a similar change in
absorbance.
During the day the proportion of UVA to UVB radiation changes, with maximum
ratios occurring in early mornings and late afternoons and the minimum ratio
occurring at solar noon. Kimlin et al., (2002) reports this for the ratio of UVA to
erythemal UV, although when considering the range of UVB to erythemal UV, the
ratios obtained are likely to be higher as the waveband for UVB is smaller than the
waveband for erythemal UV. The proportion of UVA to UVB radiation also changes
seasonally (Cole, 2001) with summer always having the lowest proportion and winter
the highest proportion, although total irradiance values are lower in winter than
summer, due to the position of the sun in the sky. At the location of this research, the
proportion of UVA to UVB ranges from mid-morning to noon values of 13.5 to 10 for
February 2007, while March 2008 ranges from 16.4 (mid morning) to 37 (later
afternoon). Since the UVPGI dosimeter has been shown to have a linear response, the
changing proportion of UVA to UVB during the day does not appear to affect the
dose response. PS has been previously found to have a changing dose response for
winter and summer (Kimlin, 2003) and this is believed to be due to the difference in
its spectral response compared to the erythemal action spectrum. With the spectral
response in the UVA waveband of the UVPGI dosimeter, we may see much less
variation in seasonal dose responses. Even from month to month, variation can be
seen in the PS dose response, but surprisingly, even with one month separation (in
different years) between the dose responses measured for the UVPGI dosimeter, there is
14

little variation observed. There should be some variation between winter and summer
dose responses due to the changing total values of UVA to UVB (for example Cole
(2001) shows there is a fifth of total UVB in winter compared to summer and a third
of total UVA in winter compared to summer).
The variance of the dosimeter when used to predict weighted irradiance values from
the dose response was calculated by exposing a series of dosimeters for the same time
period and comparing the calculated weighted irradiance to the measured weighted
irradiance by the spectroradiometer. The four groups of dosimeters, exposed for
different time periods, had the weighted irradiance calculated for each change in
absorbance, and compared to the known weighted irradiance measured. The average
difference between the calculated and measured weighted irradiance was 13.7%. The
error associated with the change in dosimeter absorbance, the scanning
spectroradiometer and the spectrophotometer equates to 10.8% so an additional error
of 2.9% is incurred through using the dose response of only a portion of the UVPGI
dosimeters to calculate the remaining UVPGI dosimeters and their associated weighted
irradiances.
Discussion
The biological responses in higher plants to UV radiation have been previously shown
to extend from the shorter wavelengths to 366 nm. This research has reported on a
new dosimeter that consists of two types of photoactive materials that possesses a
spectral response that extends to 380 nm for the measurement of UVPGI exposures.
The UVPGI dosimeter was found to be most effective when constructed with a thin
film of PS placed on top of a thin film of NDA in the dosimeter holder. The dosimeter
15

of this combination had a maximum change in absorbance at 345 nm and this
wavelength was employed for the quantification of the change in the dosimeter due to
UV radiation.
The characteristics of dose response, spectral response, dark reaction and cosine
response of the UVPGI dosimeter have been quantified. The dark reaction of the UVPGI
dosimeter is similar in magnitude to the dark reaction of polysulphone. After twenty-
four hours, the average of the change in absorbance was 2.7% with an increase to
6.3% after a week. The dark reaction will be taken into account during the field use of
the dosimeter by measuring the post exposure absorbance of the UVPGI dosimeters
after a consistent time period following exposure, in a similar manner to that
employed for personal UV exposure dosimeters (CIE, 1992).
The cosine error of the UVPGI dosimeter is within 15% for angles up to 50°, and less
than 23% for angles up to 70°. The solar irradiances decrease with increasing solar
zenith angles (SZA), so the cosine error of more than 15% for SZA greater than 50° is
not too significant as the exposures measured by the dosimeter during use for SZA
greater than 50°, would be less than those measured for SZA less than 50°. The
normalized cosine value is in most cases, systematically lower than the cosine
function. This suggests that at larger incident angles the cosine value is more likely to
be underestimated rather than overestimated. The normalized cosine value at an
incident angle of 20º is likely to be a measurement error as the dosimeter was used
from the same batch as the other dosimeters for all incident angles.
16
The response spectrum of the UVPGI dosimeter showed a spectral response up to 380
nm, extending the response into the UVA spectrum. This data is the absolute of each
change in absorbance, as the change in absorbance measured at 349 nm and 359 nm
were negative. These two values are possibly due to the influence of the NDA
undergoing a negative change in absorbance due to the response at these wavelengths.
Further investigation of the spectral response at 5 nm increments is required.
However, this research has shown that the response of the UVPGI dosimeter extends
into the UVA as required.
The dose response was collated using the cumulative change in absorbance of the
UVPGI dosimeter compared against periods of weighted UVPGI exposure, on three
different days. The UVPGI dosimeter responds to the weighted UV irradiance that it is
exposed to, and changes in the time required to expose the dosimeter does not affect
the response of the dosimeter. The error of the UVPGI dosimeter at predicting the
weighted UV irradiance from the calculated dose response averaged at 13.7%. Diffey
(1989) reports a minimum error of 10% for the reproducibility of polysulphone, so in
comparison, the error of the UVPGI dosimeter is considered reasonable.
At a minimum, dose responses should be calculated for changes in season and for
each new sheet of PS and NDA, but until seasonal calibrations are established,
calibrations are recommended for each new measurement.
Seasonally the proportion of UVA to UVB changes, which contributes to PS having
different dose responses in different seasons and even month to month. The UVPGI
dosimeter shows no variation between the dose response recorded in the months of
February and March, and may be suggested to be representative of a seasonal
17

grouping. PS will contribute to a different dose response seasonally, but the
combination of PS and NDA in the UVPGI dosimeter responding to UVA should
decrease this seasonal difference observed in PS by itself. This means the UVPGI
dosimeter’s response to longer UVA wavelengths should reduce variation in the dose
response over the year, by accounting for UVA radiation as well as UVB radiation. It
is recommended that dose responses for the UVPGI dosimeter should be carried out for
each new measurement conducted until seasonal calibrations are established. The
dosimeter that has been developed will be important for further research into the
biological effects of UV radiation on higher plants. The dosimeter will allow
simultaneous measurements of the UVPGI exposures at multiple sites over and within a
plant canopy.
ACKNOWLEDGEMENTS: The authors acknowledge the technical staff in Physics
and the Sciences workshop for assistance in this project.
18

References
Ali, JB & Jacobson, RE 1980, 'The use of a diazo film as a film badge dosimeter', J. Photographic Sci., vol. 28, pp. 172-6. Berre, B & Lala, D 1989, 'Investigation on photochemical dosimeters for ultraviolet radiation', Solar Energy, vol. 42, no. 5, pp. 405-16. CIE (International Commission on Illumination) 1992, 'Personal dosimetry of UV radiation', Technical Report, vol. 98, no. 1. CIE (International Commission on Illumination) 1987, A reference action spectrum for ultraviolet induced erythema in human skin, CIE J. vol. 6, pp. 17-22. Cole, C 2001, ‘Sunscreen protection in the ultraviolet A region: how to measure the effectiveness’, Photodermatol. Photoimmunol. Photomed., vol. 17, pp. 2-10. Davis, A, Deane, GHW & Diffey, BL 1976a, 'Possible dosimeter for ultraviolet radiation', Nature, vol. 261, pp. 169-70. Davis, A, Deane, GHW, Gordon, D, Howell, GV & Ledbury, KJ 1976b, 'A world-wide program for the continuous monitoring of solar UV radiation using poly (phenylene oxide) film, and a consideration of results', J. Appl. Poly. Sci., vol. 20, pp. 1165-74. Diffey, BL 1989, ‘Ultraviolet radiation dosimetry with polysulphone film’, in Radiation measurement in Photobiology, Academic Press, New York, pp. 136-159. Diffey, BL & Davis, A 1978, 'A new dosemeter for the measurement of natural ultraviolet radiation in the study of photodermatoses and drug photosensitivity', Phys. Med. Biol., vol. 23, no. 2, pp. 318-23. Diffey, BL, Davis, A, Johnson, M & Harrington, TR 1977, 'A dosimeter for long wave ultraviolet radiation', Br. J. Dermatol., vol. 97, pp. 127-30. Diffey, BL, Oliver, I & Davis, A 1982, 'A personal dosemeter for quantifying the biologically effective sunlight exposure of patients receiving benoxaprofen', Phys. Med. Biol., vol. 27, no. 12, pp. 1507-13. Ebraheem, S, Abdel-Fattah, AA, Said, FI & Ali, ZI 2000, 'Polymer based triphenyl tetrazolium chloride films for ultraviolet radiation monitoring', Rad. Phys. Chem., vol. 57, pp. 195-202. Flint, S.D, and Caldwell, M.M, 2003 A biological spectral weighting function for ozone depletion research with higher plants, Physiol. Plant., vol. 117, pp. 137-144. Flint, S.D, Searles, P.S. and Caldwell, M.M. 2004, ‘Field testing of biological spectral weighting functions for induction of UV-absorbing compounds in higher plants’, Photochem. Photobiol., vol. 79, no. 5, pp. 399-403.
19
Jackson, S.A. 1980, 'A film badge dosimeter for UVA radiation', J. Biomed. Eng., vol. 2, pp. 63-4. Kimlin, MG 2003, ‘Techniques for assessing human UV exposures’, Proceedings of SPIE, vol. 5156, pp. 197-206. Kimlin, MG, Parisi, AV, Sabburg, J & Downs, NJ 2002, ‘Understanding the UVA environment at a sub-tropical site and its consequent impact on human UVA exposure’, Photochem. Photobiol. Sci., vol 1, pp. 478-482. Lester, RA, Parisi, AV, Kimlin, MG & Sabburg, J 2003, 'Optical properties of poly (2,6 dimethyl-1,4-phenylene oxide) film and its potential for a long term solar ultraviolet dosimeter', Phys. Med. Biol., vol. 48, pp. 3685-98. Moseley, H, Robertson, J & O'Donoghue, J 1984, 'The suitability of diazochrome KBL film for UV dosimetry', Phys. Med. Biol., vol. 29, no. 6, pp. 679-86. Parisi, AV & Kimlin, MG 2004, 'Dosimeter for measurement of UVA exposure', in JR Slusser, JR Herman, W Gao & G Bernhard (eds), Ultraviolet Ground and Space based Measurements, Models and Effects IV, SPIE-The International Society for Optical Engineering, Bellingham, vol. 5545, pp. 63-70. Parisi, A.V., Galea, V.J. & Randall, C. 2003, ‘Dosimetric measurements of the visible and UV exposures on field grown soybean plants,’ Agr. For. Meteorol., vol. 120, pp. 153-160. Parisi, A.V, Wong, C.F. & Galea, V. 1998, ‘A study of the total ultraviolet exposure to all the leaves for small plant growth,’ J. Photochem. Photobiol. B: Biol., vol. 45, pp. 36-42. Tate, TJ, Diffey, BL & Davis, A 1979, 'An ultraviolet radiation dosimeter based on the photosensitising drug Nalidixic acid', Photochem. Photobiol., vol. 31, pp. 27-30. Wong, JCF & Parisi, AV 1996, 'Measurement of UVA exposure to solar radiation', Photochem. Photobiol., vol. 63, no. 3, pp. 807-10. Wong, JCF, Fleming, RA, Carter, SJ, Ring, IT & Vishvakarman, D 1992, 'Measurement of human exposure to ultraviolet-B solar radiation using a CR-39 dosimeter', Health Phys., vol. 63, no. 4, pp. 457-61. Wong, JCF, Toomey, S, Fleming, RA & Thomas, BW 1995, 'UV-B radiometry and dosimetry for solar measurements', Health Phys., vol. 68, no. 2, pp. 175-84.
20

Table 1 Variance of the absorbance measurements of the UVPGI dosimeter throughout the absorbance measurement process. Absorbance is measured at 345 nm. Mean Standard deviation % variance
Pre-exposure absorbance
0.334 0.014 4.2
Immediate post-exposure absorbance
0.598 0.016 2.7
Immediate change in absorbance
0.263 0.015 5.8
24 hours post-exposure absorbance
0.614 0.012 2.0
24 hours post-exposure change in absorbance
0.279 0.005 1.9
21

Table 2 Average dark reaction of eleven UVPGI dosimeters.
Period of time Change in absorbance % change
24 hours 0.016 2.71 week 0.021 6.3
22

Figure Captions Figure 1 - Side-by-side dot plot of four types of dosimeter, the change in absorbance
measured on four sites over four time periods of 30 minutes each, group 1= PS, group
2= NDA, group 3= NDA/PS, group 4 = PS/NDA. The change in absorbance was
measured at 330 nm.
Figure 2 – Spectral response from 300 nm to 380 nm of the UVPGI dosimeter. The
thick line is the PGI action spectrum (Flint and Caldwell, 2003).
Figure 3 – Comparison of the cosine response of the UVPGI dosimeter to the cosine
curve.
Figure 4 – Calibration of the UVPGI dosimeter for the measurement of the UVPGI
exposures. The diamond ( ) represents the dose response carried out from 10.00am to
3.00pm on 1 February, 2007, the square ( ) represents the dose response carried out
from 2.10pm to 5.10pm on 3 March, 2008 and the triangle (▲) represents the dose
response carried out from 9.30am to 1.30pm on 4 March, 2008.
23

-0.8
-0.7
-0.6
-0.5
-0.4
-0.3
-0.2
-0.1
0
0.1
0.2
0 1 2 3 4 5
Group
Cha
nge
in a
bsor
banc
e
A
B
C
D
Figure 1 - Side-by-side dot plot of four types of dosimeter, the change in absorbance
measured on four sites over four time periods (A, B, C, D) of 30 minutes each, group
1= PS, group 2= NDA, group 3= NDA/PS, group 4 = PS/NDA. The change in
absorbance was measured at 330 nm.
24
0.01
0.10
1.00
10.00
300 310 320 330 340 350 360 370 380 390
Wavelength (nm)
Abso
lute
Spe
ctra
l Sen
sitiv
ity
Figure 2 - Spectral response from 300 nm to 380 nm of the UVPGI dosimeter. The thick line is the PGI action spectrum (Flint and Caldwell, 2003).
25

0.0
0.2
0.4
0.6
0.8
1.0
1.2
0 10 20 30 40 50 60 70 80
Angle (degrees)
Nor
mal
ised
resp
onse
Normalised response Cosine
Figure 3 – Comparison of the cosine response of the UVPGI dosimeter to the cosine
curve.
26

0
2000
4000
6000
8000
10000
12000
14000
0 0.1 0.2 0.3 0.4 0.5
Change in absorbance
UV P
GI w
eigh
ted
expo
sure
(J/m
2 )
Figure 4 – Calibration of the UVplant dosimeter for the measurement of the UVPGI
exposures. The diamond ( ) represents the dose response carried out from 10.00am to
3.00pm on 1 February, 2007, the square ( ) represents the dose response carried out
from 2.10pm to 5.10pm on 3 March, 2008 and the triangle (▲) represents the dose
response carried out from 9.30am to 1.30pm on 4 March, 2008.
27


![Improvement in sensitivity of radiochromic 3D dosimeter ......AGE dosimeter [32]. They reported that iodoform incorporation in the composition of PRES-AGE enhanced the sensitivity](https://static.fdocuments.net/doc/165x107/60c9079b1e58eb5eef70ae41/improvement-in-sensitivity-of-radiochromic-3d-dosimeter-age-dosimeter-32.jpg)