Dose-response and Non-linear Regression Analysis User Guide
16
InVivoStat User Guides – Dose-response and Non-linear Regression Analysis Version 4.3 November 2021 Page 1 of 16 Dose-response and Non-linear Regression Analysis User Guide
Transcript of Dose-response and Non-linear Regression Analysis User Guide

InVivoStat User Guides – Dose-response and Non-linear Regression Analysis Version 4.3 November 2021
Page 1 of 16
Dose-response and
Non-linear Regression
Analysis
User Guide
InVivoStat User Guides – Dose-response and Non-linear Regression Analysis Version 4.3 November 2021
Page 2 of 16
Contents
1 Introduction ......................................................................................... 3
2 Dataset format ..................................................................................... 4
3 Analysis procedure .............................................................................. 5 3.1 Analysis initialisation ............................................................................................................... 5 3.2 Four parameter logistic dose-response analysis ........................................................................ 6 3.3 User defined equation analysis ................................................................................................. 9
4 Output results .................................................................................... 10 4.1 Four parameter logistic dose-response analysis ...................................................................... 10 4.2 User defined equation ............................................................................................................. 10
5 Controlling the output ...................................................................... 11
6 Test dataset example output (Four parameter dose-response) .... 13 6.1 InVivoStat options .................................................................................................................. 13 6.2 Sample output ......................................................................................................................... 14
InVivoStat User Guides – Dose-response and Non-linear Regression Analysis Version 4.3 November 2021
Page 3 of 16
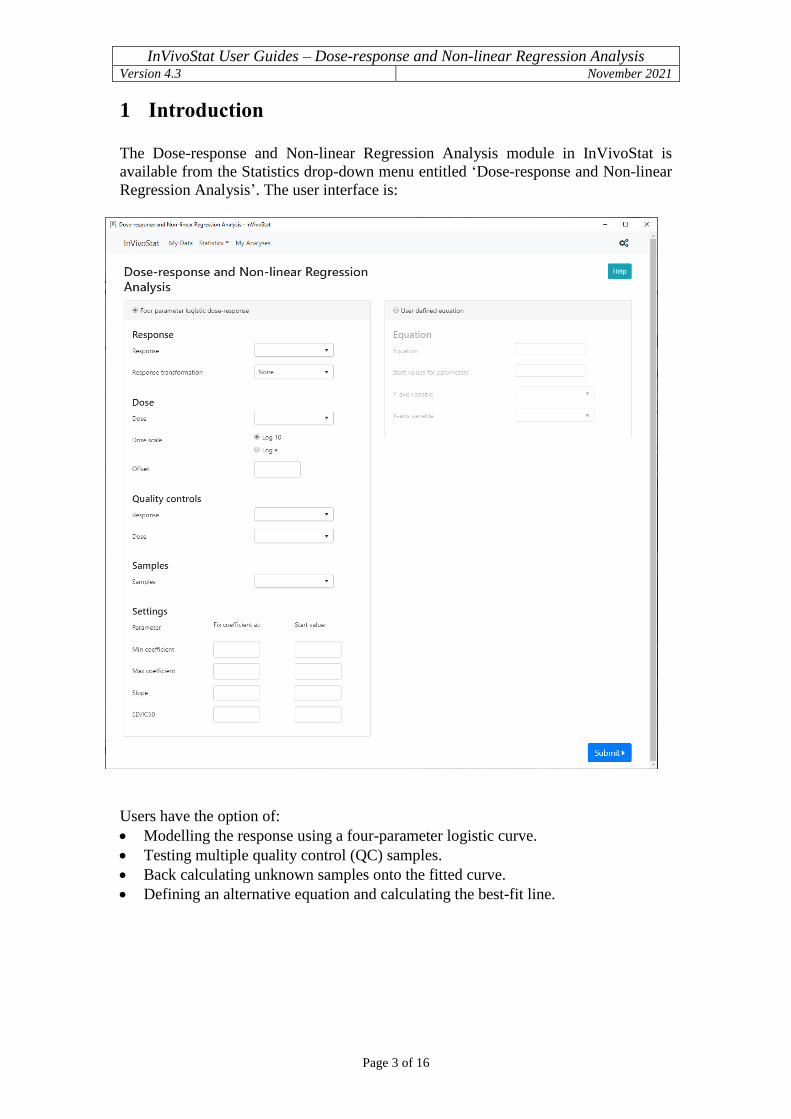
1 Introduction
The Dose-response and Non-linear Regression Analysis module in InVivoStat is
available from the Statistics drop-down menu entitled ‘Dose-response and Non-linear
Regression Analysis’. The user interface is:
Users have the option of:
Modelling the response using a four-parameter logistic curve.
Testing multiple quality control (QC) samples.
Back calculating unknown samples onto the fitted curve.
Defining an alternative equation and calculating the best-fit line.

InVivoStat User Guides – Dose-response and Non-linear Regression Analysis Version 4.3 November 2021
Page 4 of 16
2 Dataset format
The Dose-response and Non-linear Regression Analysis module accepts data in the
single measures format, for example:
Response Standards
Dose Quality Control
Response Quality Control
Dose Unknown Sample
0.02038835 0 0.75 0.079432823 0.2
0.031067961 0 0.72 0.079432823 0.6
0.031067961 0 0.77 0.079432823 0.4
0.033009709 0.001 0.05 0.031622777 0.2
0.031067961 0.001 0.47 0.031622777 0.5435
0.051456311 0.001 0.42 0.031622777 0.675543
0.274757282 0.01 0.38 0.007943282 0.8765
0.246601942 0.01 0.37 0.007943282 0.232
0.302912621 0.01 0.35 0.007943282 0.99
0.778640777 0.1
0.02
0.810679612 0.1
0.01
0.85631068 0.1 0.963106796 1 0.95631068 1 0.97184466 1 0.980582524 10 0.990291262 10 0.995145631 10

InVivoStat User Guides – Dose-response and Non-linear Regression Analysis Version 4.3 November 2021
Page 5 of 16
3 Analysis procedure
The steps required to perform an analysis are described in this section.
3.1 Analysis initialisation
3.1.1 Select the analysis module
The analysis begins by selecting the
Dose-response and Non-linear
Regression Analysis module from the
drop-down list of available modules:
Parametric Analysis →
Dose-response and Non-linear
Regression Analysis
3.1.2 Select the dataset to be
analysed
Once the module is selected, the dataset
is chosen from the drop-down list of
available datasets.
Click ‘Submit’.
3.1.3 Select the analysis approach
To begin with the user should select
either the ‘Four parameter logistic dose-
response’ analysis or the more general
‘User defined equation’ (i.e. a non-
linear regression model).
InVivoStat User Guides – Dose-response and Non-linear Regression Analysis Version 4.3 November 2021
Page 6 of 16
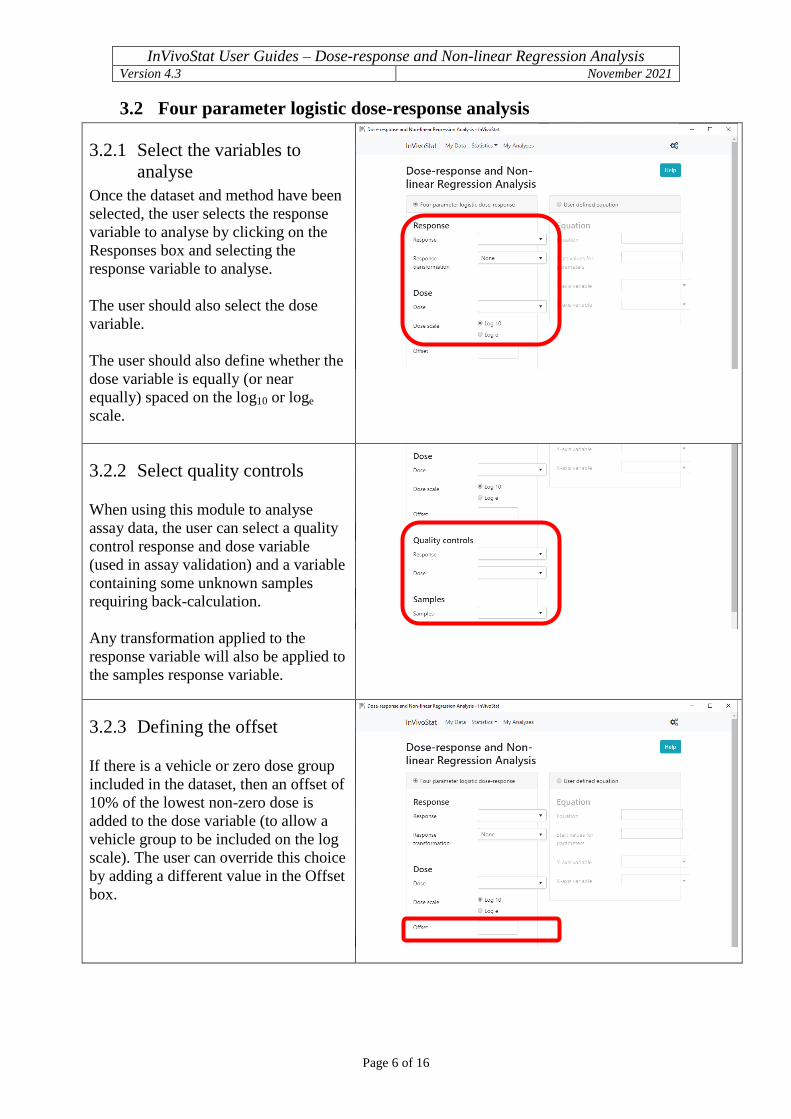
3.2 Four parameter logistic dose-response analysis
3.2.1 Select the variables to
analyse
Once the dataset and method have been
selected, the user selects the response
variable to analyse by clicking on the
Responses box and selecting the
response variable to analyse.
The user should also select the dose
variable.
The user should also define whether the
dose variable is equally (or near
equally) spaced on the log10 or loge
scale.
3.2.2 Select quality controls
When using this module to analyse
assay data, the user can select a quality
control response and dose variable
(used in assay validation) and a variable
containing some unknown samples
requiring back-calculation.
Any transformation applied to the
response variable will also be applied to
the samples response variable.
3.2.3 Defining the offset
If there is a vehicle or zero dose group
included in the dataset, then an offset of
10% of the lowest non-zero dose is
added to the dose variable (to allow a
vehicle group to be included on the log
scale). The user can override this choice
by adding a different value in the Offset
box.
InVivoStat User Guides – Dose-response and Non-linear Regression Analysis Version 4.3 November 2021
Page 7 of 16
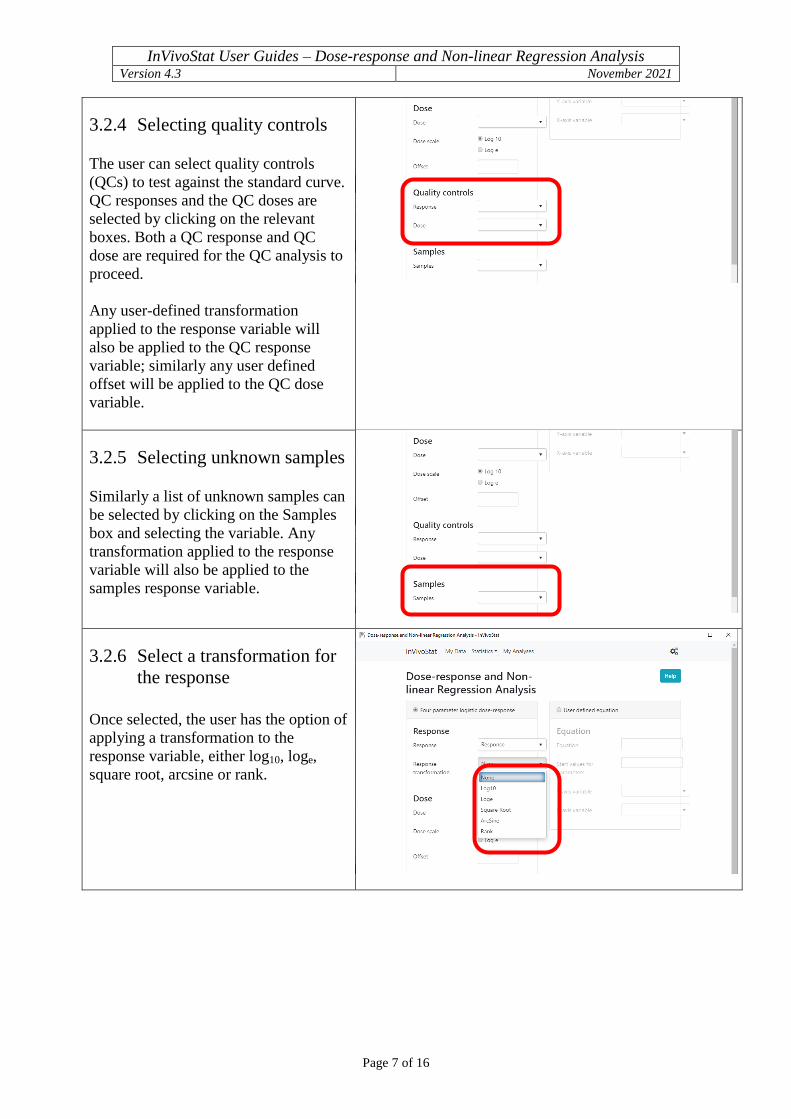
3.2.4 Selecting quality controls
The user can select quality controls
(QCs) to test against the standard curve.
QC responses and the QC doses are
selected by clicking on the relevant
boxes. Both a QC response and QC
dose are required for the QC analysis to
proceed.
Any user-defined transformation
applied to the response variable will
also be applied to the QC response
variable; similarly any user defined
offset will be applied to the QC dose
variable.
3.2.5 Selecting unknown samples
Similarly a list of unknown samples can
be selected by clicking on the Samples
box and selecting the variable. Any
transformation applied to the response
variable will also be applied to the
samples response variable.
3.2.6 Select a transformation for
the response
Once selected, the user has the option of
applying a transformation to the
response variable, either log10, loge,
square root, arcsine or rank.
InVivoStat User Guides – Dose-response and Non-linear Regression Analysis Version 4.3 November 2021
Page 8 of 16
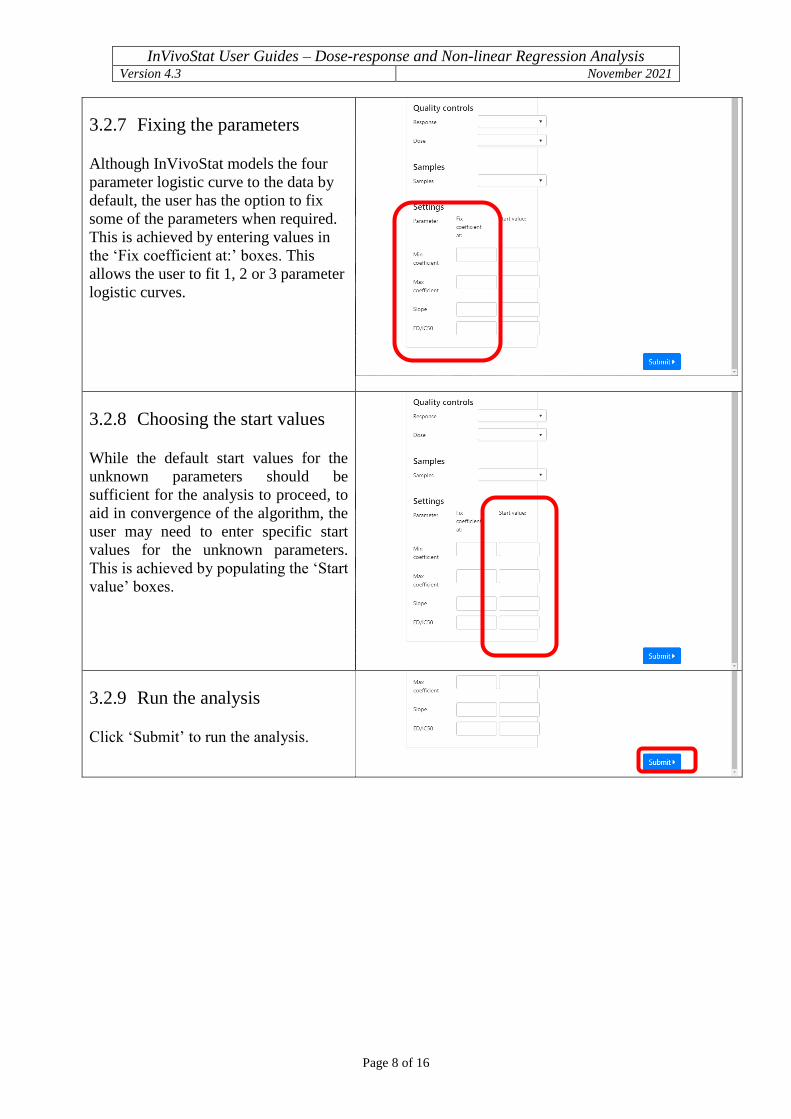
3.2.7 Fixing the parameters
Although InVivoStat models the four
parameter logistic curve to the data by
default, the user has the option to fix
some of the parameters when required.
This is achieved by entering values in
the ‘Fix coefficient at:’ boxes. This
allows the user to fit 1, 2 or 3 parameter
logistic curves.
3.2.8 Choosing the start values
While the default start values for the
unknown parameters should be
sufficient for the analysis to proceed, to
aid in convergence of the algorithm, the
user may need to enter specific start
values for the unknown parameters.
This is achieved by populating the ‘Start
value’ boxes.
3.2.9 Run the analysis
Click ‘Submit’ to run the analysis.
InVivoStat User Guides – Dose-response and Non-linear Regression Analysis Version 4.3 November 2021
Page 9 of 16
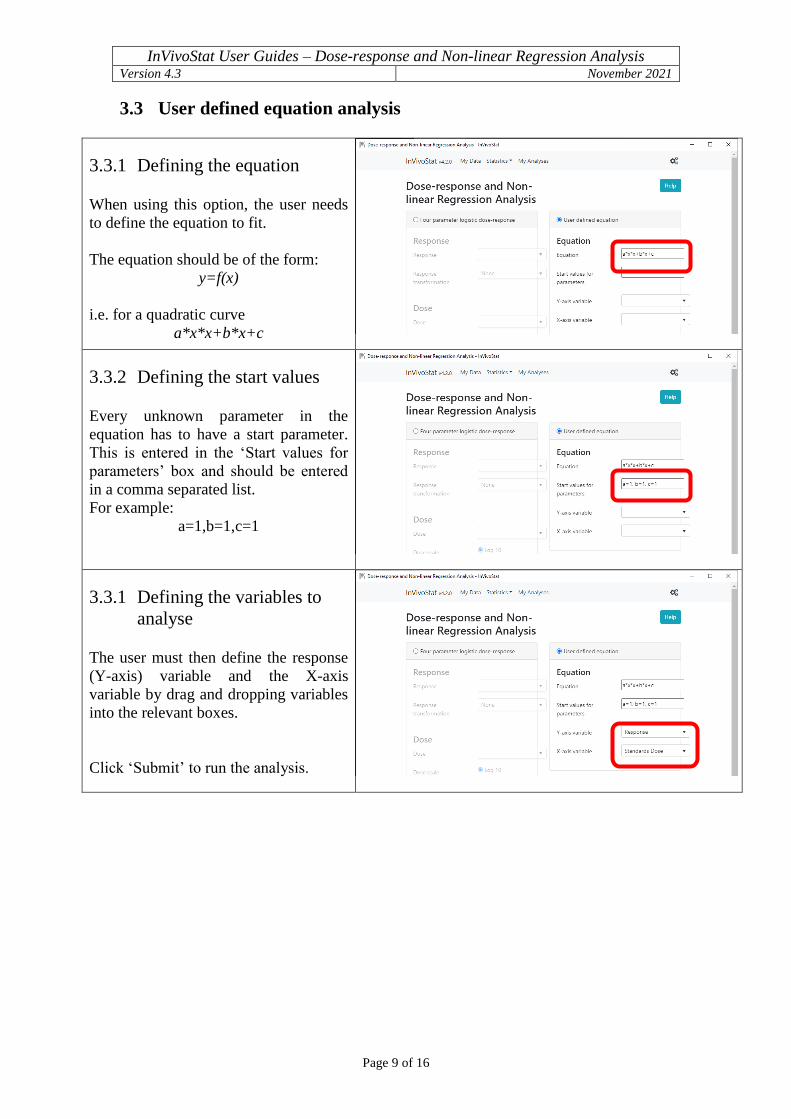
3.3 User defined equation analysis
3.3.1 Defining the equation
When using this option, the user needs
to define the equation to fit.
The equation should be of the form:
y=f(x)
i.e. for a quadratic curve
a*x*x+b*x+c
3.3.2 Defining the start values
Every unknown parameter in the
equation has to have a start parameter.
This is entered in the ‘Start values for
parameters’ box and should be entered
in a comma separated list.
For example:
a=1,b=1,c=1
3.3.1 Defining the variables to
analyse
The user must then define the response
(Y-axis) variable and the X-axis
variable by drag and dropping variables
into the relevant boxes.
Click ‘Submit’ to run the analysis.

InVivoStat User Guides – Dose-response and Non-linear Regression Analysis Version 4.3 November 2021
Page 10 of 16
4 Output results
4.1 Four parameter logistic dose-response analysis
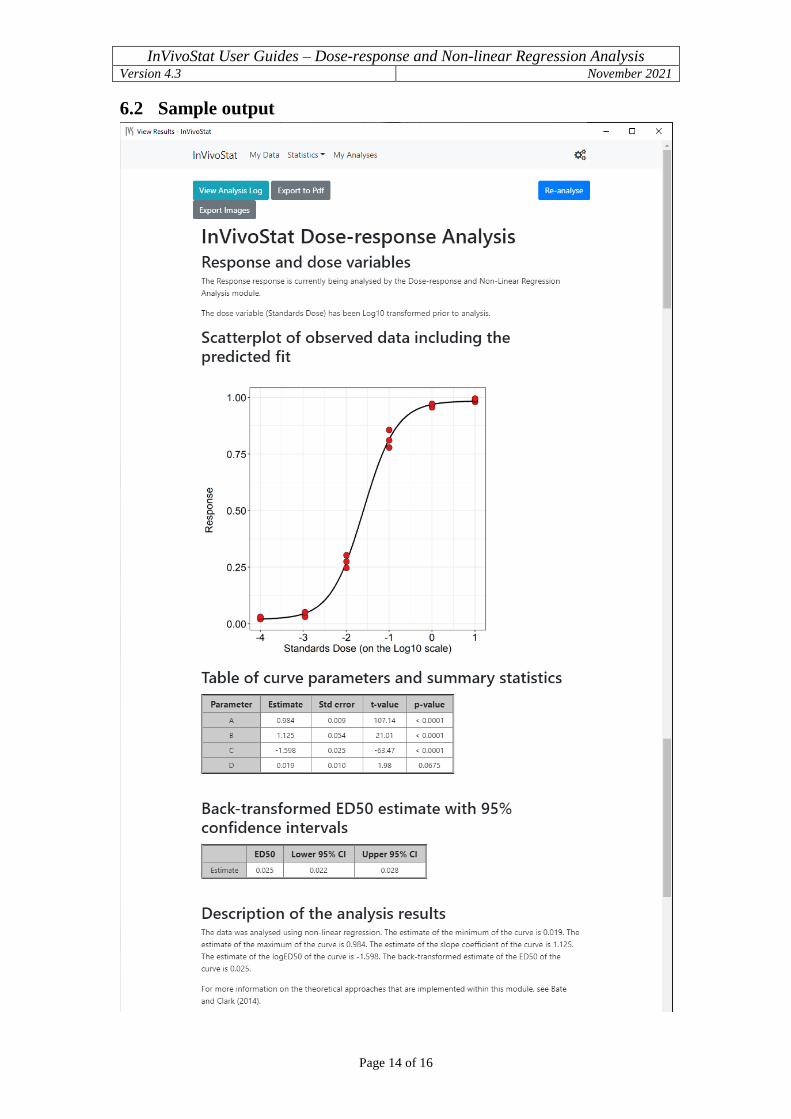
The output from the four parameter dose-response analysis includes:
Analysis description and references
A description of the analysis performed.
Scatterplot with fitted curve
A scatterplot of the response variable vs. the dose variable, including the fitted curve
and any QCs.
Tables of analysis results
A table of curve parameter estimates.
A table of the back transformed IC50 estimate along with 95% confidence intervals.
A table of the back calculated QC samples and acceptance criteria (%CV and %RE).
A table of the predicted back calculated unknown samples.
Analysis description
A description of the analysis performed.
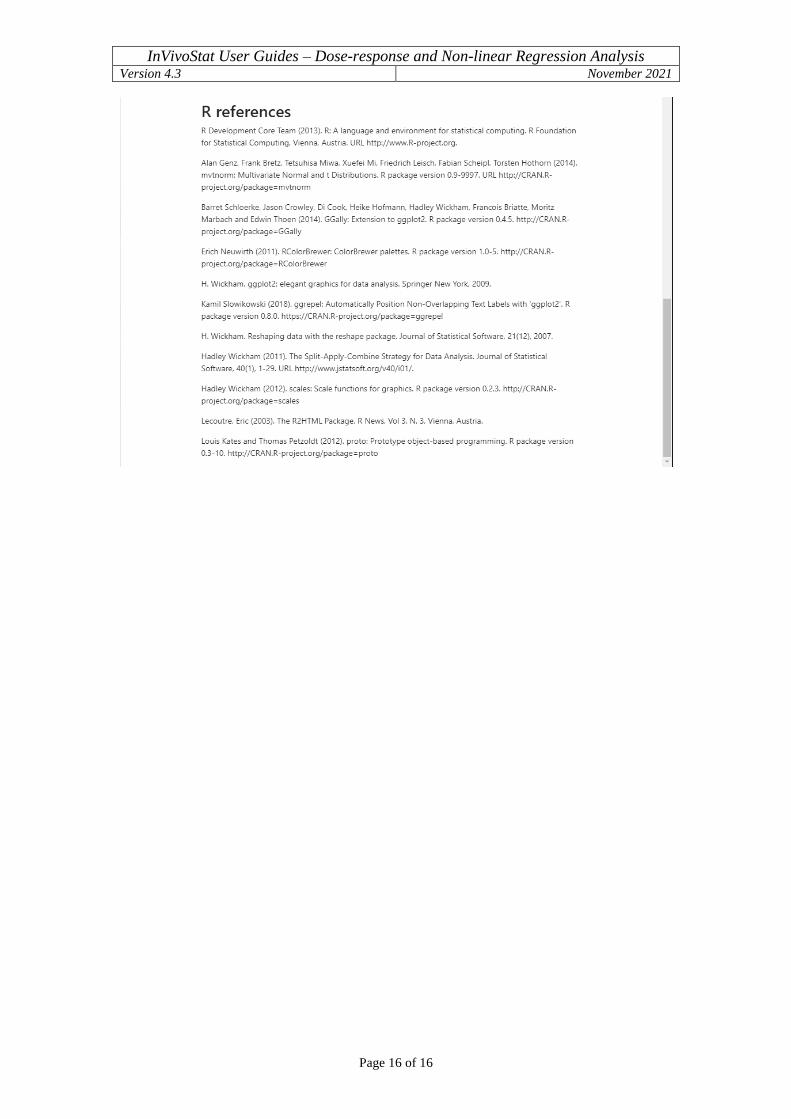
References
A list of references for the methods applied in the analysis.
4.2 User defined equation
The output from the user defined equation analysis includes:
Analysis description and references
A description of the analysis performed.
Scatterplot with fitted curve
A scatterplot of the response variable vs. the dose variable, including the fitted curve.
Tables of analysis results
A table of fitted curve parameter estimates.
References
A list of references for the methods applied in the analysis.

InVivoStat User Guides – Dose-response and Non-linear Regression Analysis Version 4.3 November 2021
Page 11 of 16
5 Controlling the output
The user has the ability to control various aspects of the output. These are available in
the ‘Output Options’ dialogue:
Users can manipulate various plot
characteristics including line size, fonts
and marker size/type.

InVivoStat User Guides – Dose-response and Non-linear Regression Analysis Version 4.3 November 2021
Page 12 of 16
The user has control over all text
included on the plots, for example text
position, size and font.
The user has control over the colour
scheme employed by InVivoStat,
including an option to produce all plots
in black & white.
Further information on these options can be found in the Getting Started User Guide.
InVivoStat User Guides – Dose-response and Non-linear Regression Analysis Version 4.3 November 2021
Page 13 of 16
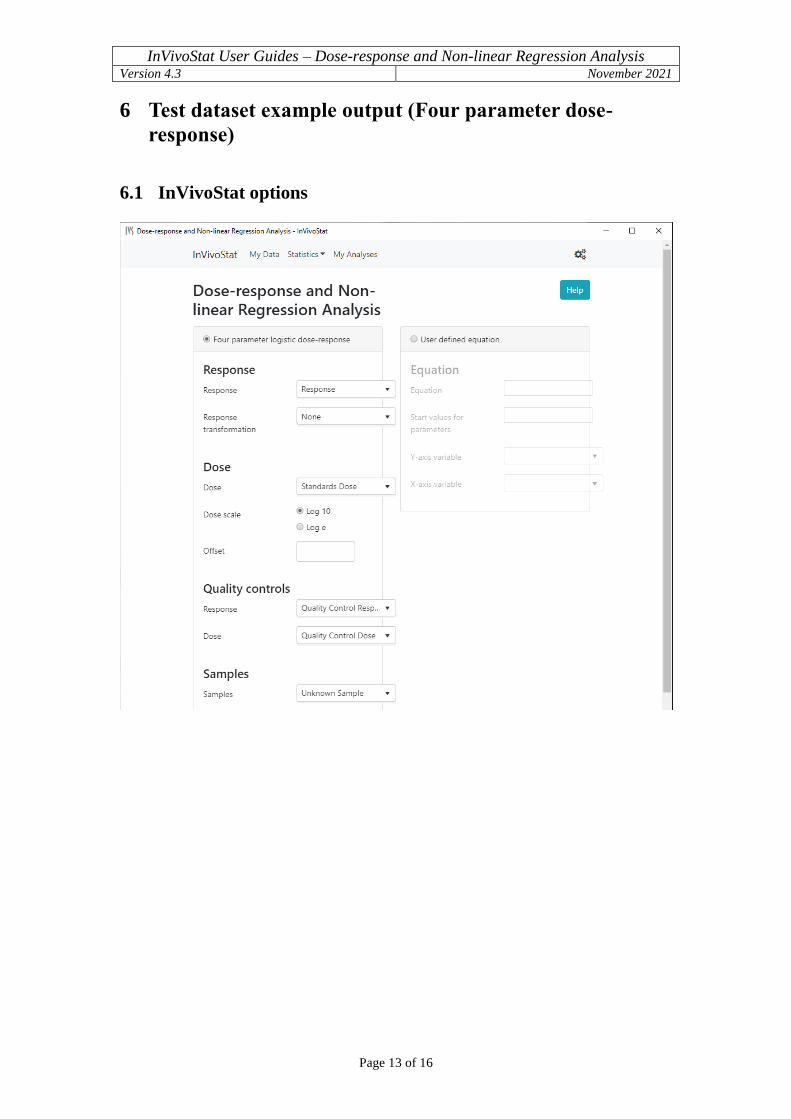
6 Test dataset example output (Four parameter dose-
response)
6.1 InVivoStat options
InVivoStat User Guides – Dose-response and Non-linear Regression Analysis Version 4.3 November 2021
Page 14 of 16
6.2 Sample output

InVivoStat User Guides – Dose-response and Non-linear Regression Analysis Version 4.3 November 2021
Page 15 of 16
InVivoStat User Guides – Dose-response and Non-linear Regression Analysis Version 4.3 November 2021
Page 16 of 16