Doppler radar analysis of a tornadic miniature supercell...
15
1 Doppler radar analysis of a tornadic miniature supercell during the Landfall of Typhoon Mujigae (2015) in South China Kun Zhao* # , Mingjun Wang # ,Ming Xue #,% , Peiling Fu # , Zhonglin Yang # , Xiaomin Chen # and Yi Zhang # # Key Lab of Mesoscale Severe Weather/Ministry of Education of China, and School of Atmospheric Sciences, Nanjing University, Nanjing, China % Center for Analysis and Prediction of Storms and School of Meteorology, University of Oklahoma, Norman Oklahoma 73072, USA Wen-Chau Lee Earth Observing Laboratory, National Center for Atmospheric Research 1 Boulder, Colorado Fuqing Zhang Department of Meteorology and Atmospheric Science, and Center for Advanced Data Assimilation and Predictability Techniques, the Pennsylvania State University, University Park, Pennsylvania Qing Lin and Zhaohui Li Guangdong Meteorological Observatory, and Foshan tornado research Center, Guangdong Meteorological Service, Guangzhou, China 28 June 2016 Submitted to Bulletin of the American Meteorological Society Revised October 31, 2016 *Corresponding author address: Dr. Kun Zhao Key Laboratory of Mesoscale Severe Weather/MOE, School of Atmospheric Sciences, Nanjing University, 163 Xianlin Road, Nanjing 210023, China [email protected] 1 National Center for Atmospheric Research is sponsored by the National Science Foundation.
Transcript of Doppler radar analysis of a tornadic miniature supercell...
1
Doppler radar analysis of a tornadic miniature supercell during
the Landfall of Typhoon Mujigae (2015) in South China
Kun Zhao*#, Mingjun Wang# ,Ming Xue#,%, Peiling Fu#,
Zhonglin Yang# , Xiaomin Chen# and Yi Zhang# #Key Lab of Mesoscale Severe Weather/Ministry of Education of China,
and School of Atmospheric Sciences, Nanjing University, Nanjing, China %Center for Analysis and Prediction of Storms and School of Meteorology, University
of Oklahoma, Norman Oklahoma 73072, USA
Wen-Chau Lee
Earth Observing Laboratory, National Center for Atmospheric Research1
Boulder, Colorado
Fuqing Zhang
Department of Meteorology and Atmospheric Science, and Center for Advanced Data
Assimilation and Predictability Techniques, the Pennsylvania State University,
University Park, Pennsylvania
Qing Lin and Zhaohui Li
Guangdong Meteorological Observatory, and Foshan tornado research Center,
Guangdong Meteorological Service, Guangzhou, China
28 June 2016
Submitted to Bulletin of the American Meteorological Society
Revised October 31, 2016
*Corresponding author address:
Dr. Kun Zhao
Key Laboratory of Mesoscale Severe Weather/MOE,
School of Atmospheric Sciences, Nanjing University,
163 Xianlin Road, Nanjing 210023, China
1 National Center for Atmospheric Research is sponsored by the National
Science Foundation.

2
Abstract
On 4 October 2015, a miniature supercell in the outer rainband of landfalling
Typhoon Mujigae produced a violent tornado in Guangdong Province of South China,
leading to 4 deaths and up to 80 injuries. A detailed damage survey shows that the
tornado is rated at least a category 3 on the enhanced Fujita scale (EF3), which is by far
the strongest typhoon rainband tornado ever documented in China. This study, for the
first time, documents the structure and evolution of the tornadic miniature supercell and
the environmental conditions with observations from coastal Doppler radars and a
nearby sounding.
Radar analysis indicates that this tornadic, miniature supercell exhibited
characteristics similar to those found in landfalling hurricanes in the US, whose
signatures include a hook echo, several low-level inflow notches, an echo top below 10
km, a small and shallow mesocyclone, and a long lifespan (~3 h). The environmental
conditions characterized by the nearby sounding consisted of moderate CAPE (~1284
J kg-1), large veering low-level vertical wind shear, and large cell-relative helicity that
are favorable for producing miniature supercells. The mesocyclone, with its maximum
intensity at ~2 km above ground level (AGL), formed an hour before the tornadogenesis.
A tornado vortex signature (TVS) was first identified between 1 and 3 km AGL, when
its parent mesocyclone reached its peak intensity of 30 m s-1. The TVS was located
between the updraft and forward-flank downdraft, near the center of the mesocyclone.
Dual-Doppler wind analysis reveals that tilting of low-level vorticity into the vertical
direction and subsequent stretching by a strong updraft were the main contributors to
the mesocyclone intensification.
1. Introduction
Tropical cyclone (TC)-spawned tornadoes often occur in the outer rainbands located
in the right-front or the northeast quadrant relative to the TC track within a 200-400 km
annulus (Edwards 2012; Schultz and Cecil 2009). These tornadoes often reside in
miniature supercells in an environment characterized by high low-level moisture
content, moderate convective available potential energy (CAPE), and enhanced low-
level shear due to increased surface friction from water to land as well as boundary
layer convergence (Green et al. 2011). Generally, these miniature supercells exhibit
hook echo/appendage and tornado vortex signature (TVS) in Doppler radar
observations (Mccaul 1987; Mccaul et al. 2004). Rare dual-Doppler observations (e.g,
Lee et al. 2008; Eastin et al. 2009) had provided snapshots of the kinematic and dynamic
structures of miniature supercells in the United States (US) in the past. In Asia, TC-
spawned tornadoes and their parent miniature supercells have been observed by single
Doppler radars in Japan and China (e.g. Saito et al. 1992; Suzuki et al. 2000; Zheng et
al. 2015), revealing similar radar signatures as in their US counterparts. In China,
typhoon-rainband-spawned tornadoes occur about once per year (Zheng et al. 2015).
Nevertheless, the evolution, three-dimensional structures and other dynamic
characteristics of miniature supercells in Asia have yet to be documented through dual-
Doppler wind analysis. For reference, in China, the average number of tornadoes per
year over the past half a century is fewer than 100, and the total number of the EF3

3
(enhanced Fujita scale) intensity or higher tornadoes is 20 (Xue et al. 2016; Fan and Yu
2015).
In the afternoon of October 4, 2015, two tornadoes were produced within the
rainbands of typhoon Mujigae (2015) in Guangdong Province. Typhoon Mujigae was
categorized as a super typhoon [those with peak wind speed of 51 m s-1 or greater Yu
et al. (2013)] by the Chinese Meteorological Administration (CMA) near the time of
landfall in Guangdong Province at 1400 LST on 4 October 2015, with the maximum
sustained surface winds of 52 m s-1 and the minimum mean sea-level pressure (MSLP)
of 935 hPa (Fig. 1). This destructive typhoon resulted in 19 deaths and 24 billion RMB
losses in China, and as a result its name has been retired by the World Meteorological
Organization. After its landfall, Mujigae produced two confirmed tornados and one
waterspout within three separate miniature supercells in two outermost rainbands (Fig.
1). The strongest tornado, spawned in the third rainband from the center, was located
~350 km northeast of the Mujigae’s center and was rated EF3 (enhanced Fujita scale),
causing 4 deaths, 80 injuries, and about 2 million RMB damages in the city of Foshang.
These rainbands were accompanied by active lightning over the ocean but lightning
activities diminished over land. There were eight cloud-to-cloud lightning reports
associated with this tornadic mini-supercell, all to the right of the supercell, but no hail
was reported. Because of the relative rarity of tornadoes in China, tornado forecasting
and warning operations had not been part of the routine operations of CMA. After a
number of recent significant tornadoes, CMA is, however, starting experimental
tornado forecasting and warning operations in several provinces including the
Guangdong Province (Xue et al. 2016).
Doppler radar data were collected from Guangzhou (GZ) and Shenzhen (SZ) over a
90-min period while the target miniature supercell was located in the western dual-
Doppler lobe (Fig. 1). The purpose of this study is to document, for the first time, the
time evolution of the strongest TC-spawned tornado ever observed by modern
instruments in China, as well as the evolution and structure of the parent mesocyclone
and miniature supercell. The paper also compares and contracts the characteristics of
the parent mesocyclone of this TC-spawned tornado with its US counterparts using the
Doppler radar data from the closer GZ radar while coarser-resolution dual-Doppler
wind analyses are used to examine the intensification mechanisms of the mesocyclone
via vorticity budget analysis.
2. Environmental conditions and damage survey
The environmental conditions of the TC miniature supercell are shown by a
rawinsonde profile (Fig. 3), released outside the distant rainband from the Hong Kong
International Airport at 0600 UTC (1400 LST, all times hereafter are LST), an hour
before the miniature supercell became tornadic. The key buoyancy and shear
parameters (Fig. 3) meet the “high threat” category of a TC-spawned tornado in the US
(Mccaul 1991; Schneider and Sharp 2007)
Joint damage surveys were conducted jointly by CMA, Nanjing University and
Peking University. Aerial photography along the damage path from location LD to YB

4
(Fig. 2) was taken by an unmanned aerial vehicle operated by the Foshan
Meteorological Bureau during 8 – 10 October. Ground damage surveys were also
conducted to mark the directions of fallen walls, trees, and power poles. Considering
the differences in building codes between China and the United States, as well as the
soil properties affecting tree mortalities, the wind speed estimations of the matched
degree of damage (DOD) were assigned the expected values (EXP in McDonald and
Mehta 2006) for all of the damage indicators (DIs) (Meng and Yao 2014). Visual
evidences (e.g., photographs and videos) of the tornado were also collected from a
variety of sources (e.g., from news websites and a variety of online social media, etc.),
which provided direct evidence of the tornado and the severity of its damages. The most
severe damages were rated EF-3 as recommended by the Wind Science and Energy
Center (McDonald and Mehta 2006).
The tornado’s damage track was about 30 km long (Fig. 2c, white line). The wind
damage first appeared to the southeast of location LD, but without clear tornado damage
patterns. The tornado’s parent supercell moved north-northwestward with a mean speed
of ~21 m s-1. At location LY, a funnel cloud was captured by a cellphone camera
~153124 (Fig. 2a) by Mr. S. Huang (available on youku.com), suggesting that the
tornado touched down between LD and LY. Ten seconds later at 153134, two funnels
are apparent (Fig. 2e). Several factory buildings were completely demolished by the
tornado between LD and LY, with a damage swath ~150 m (Fig. 2b). The DI of this
metal building with DOD 8 was rated EF3. The tornado then hit location SB ~1534 and
damaged a larger area of metal buildings (rated EF3, not shown). A concrete electrical
transmission line pole was snapped (Fig. 3d) north of location MD (rated EF3). The
tornado kept intensifying and broadening, and reached its widest damage path ~500 m
at location YB with the same DOD as those in LY and SB (figure not shown). Later,
trees up to 20 cm in diameter were uprooted at location FS ~1543 (rated EF1, not
shown).
3. Radar signatures of the miniature supercell, mesocyclone and tornado
3.1 Miniature supercell and mesocyclone
The damage track matched well with the “hook echo” radar reflectivity signature
and the accompanied Doppler velocity dipole where Vmax and Vmin are the outbound and
inbound Doppler velocity maxima (Fig. 4). A mesocyclone usually has a diameter
between 2 to 10 km and a vertical vorticity on the order of 0.01 s−1 or greater (Glickman
2000). Figure 5 illustrates the characteristics of the mesocyclone from the axisymmetric
rotational velocity, Vrot = (Vmax − Vmin)/2, and the mesocyclone diameter, D, defined as
the distance between Vmax and Vmin (Stumpf et al. 1998; Lee and White 1998), and
azimuthal shear (one half of the vorticity), (Vmax − Vmin)/D . The cyclonic vortex
associated with the tornado-producing miniature supercell (Fig. 5) already met the
criteria of a mesocyclone (Andra 1997; Lee and White 1998) with a vorticity exceeding
10-2 s-1 at 1430 and ~3 km AGL. The mesocyclone rapidly intensified below the 3 km
altitude with a Vrot of up to 30 m s-1 at 1530. It can be categorized as strong mesocyclone
according to the mesocyclone strength nomogram (Andra 1997). Associated with the

5
strengthening mesocyclone, it contracted in diameter from ~6 km to less than 3 km at
1530 when the tornado was observed on the ground with vorticity exceeding 3 x 10⁻² s-
1. The diameter of the mesocyclone continued to contract toward ~2 km at 1542 while
Vrot ceased to increase after 1530 with vorticity exceeding 4.5 x 10⁻² s-1. This could be
a sign of the mesocyclone vortex intensifying and collapsing in size into a tornado
vortex as documented in Wakimoto et al. (1998). However, the Guangzhou radar’s
beamwidth (~400 m) was too coarse to resolve the tornado (~200 m wide) at a distance
of ~25 km from the radar. It is noted that the lowest elevation of Guangzhou radar was
0.5º where the lowest level of the mesocyclone can be better sampled as it moved closer
to the Guangzhou radar from 1436 to 1546. EF3 tornado damages coincided with the
time of peak mesocyclone strength. This was consistent with previous studies that ~90%
of EF3–EF5 tornadoes were associated with strong mesocyclones (e.g, Smith 1965).
The mesocyclone intensity weakened and diameter broadened after 1536 (Fig. 5).
3.2 Tornado vortex signature (TVS)
A tornado vortex signature (TVS), defined as a signature with local maximum and
minimum over an azimuthal distance of approximately one beamwidth (< 1 km) and
the gate-to-gate azimuthal radial velocity difference (ΔV) greater than 20 m s−1 (Brown
et al. 1978), was first detected at 1526 at 1.5o elevation (about 1.5 km AGL) near LY
(Fig. 4b). In the next 4 min ~1530, the TVS intensified. It strengthened rapidly and
descended toward the surface. It could be detected at all elevations below 9.9o except
0.5o (Fig. 5). The lack of consistent TVS at 0.5o can be attributed to the strong second
trip echo contaminating the radial velocity data in the TVS region. In fact, the video of
funnel cloud taken nearby shows that the tornado was on the ground during this period.
The extreme radar reflectivity (> 60 dBZ) in the hook echo at 1536 and 1542 also is
suggestive of a tornado debris signature. The first surface damage was identified near
LS ~1528. The TVS at all elevations below 3.3o continued to intensify with ΔV greater
than 45 m s-1. The strongest TVS was detected at the 0.5o PPI with a magnitude of
ΔV~48 m s-1 and was collocated with the severe damage exemplified by the fallen trees
and demolished factories near location LY. In the next 6 min, the low-level TVS
intensity decreased below 30 m s-1. The strongest damage occurred at location MD
~1540 when a cement pole with a diameter of 0.5 m was snapped, supporting an EF3
tornado. After that, the TVS continued to weaken, coincident with the weak damages
between locations JB and QK. From 1600 onwards, the TVS became undetectable in
radar data, consistent with the end of the damage pattern north of location QK.
4. Kinematic structure of the miniature supercell
Doppler radial velocities from Guangzhou and Shenzhen radars were first
interpolated onto a 1 km × 1 km × 1 km Cartesian grid using the National Center for
Atmospheric Research’s REORDER software (Oye et al. 1995) then synthesized into
3-D winds using CEDRIC (Mohr et al. 1986). The miniature supercell motion (~21.7
m s−1 towards an azimuth of 330° relative to true north) was accounted for in the
interpolation procedure. Although the Guangzhou radar is closer to the tornado, the

6
scale of the dual-Doppler syntheses is determined by the coarser sampling resolution
from the Shenzhen radar ~80 km from the tornado. As a result, the dual-Doppler
syntheses can only resolve the parent mesocyclone and the miniature supercell. The
evolution and intensification of the mesocyclone circulation at the southeast end of the
miniature supercell are illustrated using the storm-relative wind vectors at 1.5 km and
3.5 km altitude (Fig. 6).
The storm-relative velocity field at 1.5 km AGL is dominated by a closed cyclonic
circulation (Fig. 6a). The mid-level inflow (Fig. 6b) came from the southwest, and
turned cyclonically towards north after it entered the storm. The vorticity maximum is
located northeast of the low-level vorticity center, indicating tilting of the low-level
horizontal vorticity aligned with the storm motion, consistent with the low-level shear
vector as shown in Fig. 3. At 1500 (Fig. 6c-d), the mesocyclone at low levels intensified
with its vorticity center collocated with the maximum updraft. The wind fields in the
midlevel became more southerly. Thirty minutes later at 1530 (Fig. 6e-f), the magnitude
of the mesocyclone, accompanied by a hook echo, intensified by more than 100% with
the vorticity maximum exceeding 2 × 10⁻² s−1 and its diameter decreased to less than 5
km (based on the 5 × 10⁻³ s−1 vorticity contour). The tornado occurred near the center
of the cyclonic circulation. Note that the vorticity maximum (i.e., the mesocyclone) is
shifted to north of the updraft center. The cyclonic circulation is well defined in the
midlevels (Fig. 6f).
Figure 7 presents two orthogonal vertical cross sections of reflectivity, vertical
velocity, and vertical vorticity through the mesocyclone center. The miniature supercell
and its mesocyclone are seen to extend up to 8 km and 4 km based on the 20 dBZ and
5 × 10⁻³ s−1 contour, respectively, with the maximum vorticity ∼2 × 10⁻² s−1 at 2 km
AGL. These characteristics are consistent with those miniature supercells observed in
TC rainbands in the US (e.g, Spratt et al. 1997; Mccaul et al. 2004; Eastin et al. 2009).
The storm-relative inflow approaches from the northeast, and the primary updraft
extends from the boundary layer up to ∼6 km with a maximum of ∼10 m s−1 at the 3
km altitude. A moderate downdraft with a maximum of ∼6 m s−1 is confined to the
north of the updraft within the inflow region, which can be attributed to the
compensating downdraft of the convective updraft and the drag by heavy precipitation
(> 45 dBZ). The tornado is located at the boundary between the updraft and downdraft.
To examine the intensifying mechanism of the mesocyclone in this miniature
supercell, the vertical vorticity budget from the 3D dual-Doppler winds is calculated
using the method described in Eastin et al. (2009). Ignoring contributions from
frictional and solenoidal terms that are usually much smaller, the time rate of change of
vertical vorticity can be expressed as the sum of horizontal (HADV) and vertical
(VADV) advection of vertical vorticity, the convergence (CONV, or stretching) and
tilting (TILT) terms. Figure 8 shows the horizontal distribution of the vertical vorticity
production terms at 1.5 km in the vicinity of the mesocyclone at 1500 and 1530,
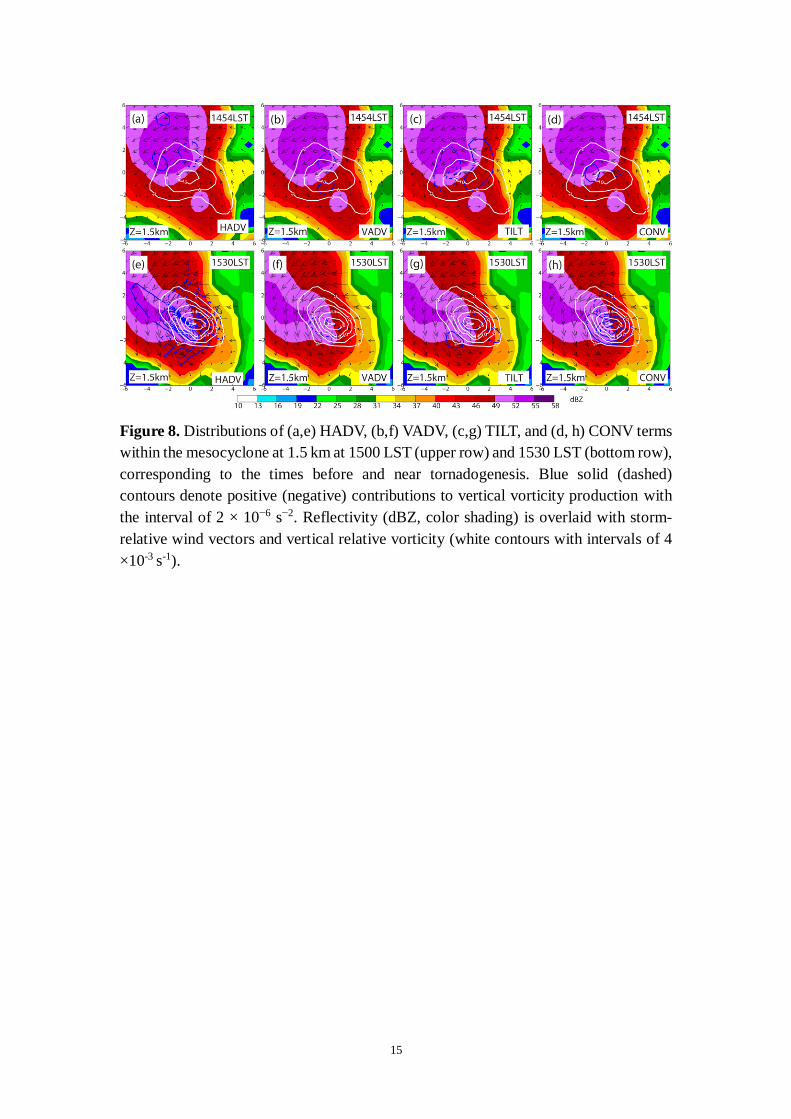
corresponding to the times before and near tornadogenesis, respectively. At 1500 LST
(Fig.8a-d), the CONV term is mostly positive within the mesocyclone. The tilting term
7
is comparable in magnitude to the CONV term, and has positive contributions to the
vorticity of the mesocyclone. Both HADV and VADV terms exhibit a pair of positive
and negative maxima near the center of the mesocyclone, consistent with the effect of
advection by the storm-relative winds and vertical motion. Overall, the low-level
vorticity production before the tornadogenesis mostly resulted from the tilting of
horizontal vorticity and its subsequent stretching.
Near the tornadogenesis time ~1530 (Fig.7e-h), CONV and HADV terms
increased to an order of magnitude larger than VADV and TILT terms. The HADV still
exhibits a positive (negative) maximum at the southwest (northeast) flank of the
mesocyclone center. Maximum CONV exceeds 25 × 10−6 s−2 and is collocated with the
mesocyclone, indicating its dominant role in the production of vertical mesocyclone
vorticity. The vorticity distribution and evolution in this event are consistent with
supercells found in the US Great Plains, where the vertical vorticity couplet is initially
created by tilting from horizontal environmental vorticity, then positive vorticity is
rapidly intensified by the stretching of vertical vorticity within the mesocyclone (e.g,
McCaul and Weisman 1996; Davies-Jones et al. 2001).
Past studies (e.g., Markowski et al. 2002; Dawson et al. 2010) have pointed to the
importance of cold pool, including its strength in tornadic storms. Often cold pools that
are not tool cold or too weak are most favorable for tornado formation. For the miniature
supercell storm studied here, the cold pool was rather weak; the surface temperature
drops were less than 1 K at surface stations near the path of the tornado (not shown),
which is not surprising because of the very humid low-level environment. Because of
the weak cold pool, baroclinic generation of horizontal vorticity as a contributor of the
low-level vorticity source appears low, while strong vertical shear near the surface
associated with surface friction may have played a larger role (Schenkman et al. 2014;
Roberts et al. 2016). The relatively low spatial and temporal resolutions of the Doppler
wind analyses as well as the lack of data very close to the ground, unfortunately, prevent
us from performing detailed trajectory or circulation-based vorticity budget analyses to
address the question of the source of tornadic vorticity near the ground. High-resolution
simulations studies will be needed to help address such questions.
5. Concluding remarks
The first look of the evolution and structure of a miniature supercell in Typhoon
Mujigae (2015), which produced an EF3 tornado, the strongest tornado embedded in a
typhoon rainband ever observed in China, was presented in this paper using single and
dual-Doppler radar data along with rawinsonde and damage surveys. The tornadic
typhoon mini-supercell was embedded in an environment of a moderate CAPE and a
strong low-level shear similar to its US hurricane counterparts. Mesocyclone properties
deduced from single-Doppler radar data suggest that the mesocyclone first intensified
and contracted at ~3 km altitude, then descended to the lower levels. Due to the
limitations of the available data, we are unable to investigate the tornadogenesis and
the subsequent evolution and structure of the tornado.
8
With dual-Doppler wind analyses, the parent mesocyclone can be well identified
initially. Positive vorticity intensified as the hook echo reflectivity signature developed.
The vorticity budget demonstrated that tilting of the low-level horizontal vorticity into
the vertical and subsequently stretching by strong updraft were the main contributors
to the mesocyclone intensification. Future studies will examine the microphysical
processes of the miniature supercell using dual-polarization data from the Hong Kong
radar. In addition, storm dynamics and tornadogenesis will be examined using high-
resolution numerical simulations that include radar data assimilation.
Acknowledgements
This work was primarily supported by the National Fundamental Research 973
Program of China (2013CB430100), the National Natural Science Foundation of China
(grants 41322032, 41275031 and 41230421), and the Social Commonwealth Research
Program (GYHY201006007). We would like to acknowledge the China Meteorological
Administration for organizing damage surveys and collecting the radar data used in this
study. Special thanks also go to all people who took part in the tornado damage survey
and shared their valuable pictures and videos of the tornado damage. We would also
like to acknowledge Mr. Huang Sheng who shared his valuable videos of the tornado.
Reference
Andra, D. L., 1997: The origin and evolution of the WSR-88D mesocyclone recognition
nomogram. Conference on Radar Meteorology, 28 th, Austin, TX, 1997.
Brown, R. A., L. R. Lemon, and D. W. Burgess, 1978: Tornado detection by pulsed
Doppler radar. Monthly Weather Review, 106, 29-38.
Davies-Jones, R., R. J. Trapp, and H. B. Bluestein, 2001: Tornadoes and tornadic storms.
Severe convective storms, Springer, 167-221.
Dawson, D. T., II, M. Xue, J. A. Milbrandt, and M. K. Yau, 2010: Comparison of
evaporation and cold pool development between single-moment and multi-
moment bulk microphysics schemes in idealized simulations of tornadic
thunderstorms. Mon. Wea. Rev., 138, 1152-1171.
Eastin, Matthew D Link, and M. Christopher, 2009: Miniature supercells in an offshore
outer rainband of Hurricane Ivan (2004). Monthly Weather Review, 137, 2081-
2104.
Edwards, R., 2012: Tropical cyclone tornadoes: A review of knowledge in research and
prediction. E-Journal of Severe Storms Meteorology, 7.
Fan, W. and X. Yu, 2015: Characteristics of Spatial-Temporal Distribution of Tornadoes
in China. Meteorological Monthly.
Glickman, T., 2000: Glossary of meteorology, 2nd ed. Amer. Meteor. Soc., 855
pp.[Available online at http://glossary.ametsoc.org.].
Green, B. W., F. Zhang, and P. Markowski, 2011: Multiscale processes leading to
supercells in the landfalling outer rainbands of Hurricane Katrina (2005). Weather
and Forecasting, 26, 828-847.
Lee, R. R. and A. White, 1998: Improvement of the WSR-88D mesocyclone algorithm.
Weather and forecasting, 13, 341-351.

9
Lee, W. C., M. M. Bell, and K. E. Goodman, 2008: Supercells and mesocyclones in
outer rainbands of Hurricane Katrina (2005). Geophysical Research Letters, 35.
Markowski, P. M., J. M. Straka, and E. N. Rasmussen, 2002: Direct surface
thermodynamic observations within the rear-flank downdrafts of nontornadic and
tornadic supercells. Mon. Wea. Rev., 130, 1692-1721.
Mccaul, E. W., 1987: Observations of the Hurricane ``Danny'' Tornado Outbreak of 16
August 1985. Monthly Weather Review, 115, 1206.
Mccaul, E. W., 1991: Buoyancy and Shear Characteristics of Hurricane-Tornado
Environments. Monthly Weather Review, 119, 1954.
McCaul, E. W. and M. L. Weisman, 1996: Simulations of Shallow Supercell Storms in
Landfalling Hurricane Environments. Mon. Wea. Rev., 124, 408-429.
Mccaul, E. W., D. E. Buechler, S. J. Goodman, and M. Cammarata, 2004: Doppler
Radar and Lightning Network Observations of a Severe Outbreak of Tropical
Cyclone Tornadoes. Monthly Weather Review, 132, 1747.
McDonald, J. R. and K. C. Mehta, 2006: A recommendation for an Enhanced Fujita
scale (EF-Scale). Wind Science and Engineering Center, Texas Tech University.
Meng, z. and d. Yao, 2014: Damage Survey, Radar, and Environment Analyses on the
First-Ever Documented Tornado in Beijing during the Heavy Rainfall Event of 21
July 2012. Weather & Forecasting, 29, 702-724.
Mohr, C. G., L. Jay Miller, R. L. Vaughan, and H. W. Frank, 1986: The merger of
mesoscale datasets into a common Cartesian format for efficient and systematic
analyses. Journal of Atmospheric and Oceanic Technology, 3, 143-161.
Oye, R., C. Mueller, and S. Smith, 1995: Software for radar translation, visualization,
editing, and interpolation. Preprints, 27th Conf. on Radar Meteorology, Vail, CO,
Amer. Meteor. Soc, 359-361.
Roberts, B., M. Xue, A. D. Schenkman, and I. Daniel T. Dawson, 2016: The role of
surface friction in tornadogenesis within an idealized supercell simulation. J.
Atmos. Sci., 73, 3371–3395.
Saito, R., M. Fujita, G. Dresselhaus, and M. S. Dresselhaus, 1992: Electronic structure
of chiral graphene tubules. Applied Physics Letters, 60, 2204-2206.
Schenkman, A. D., M. Xue, and M. Hu, 2014: Tornadogenesis in a high-resolution
simulation of the 8 May 2003 Oklahoma City supercell. J. Atmos. Sci., 71, 130-
154.
Schneider, D. and S. Sharp, 2007: Radar signatures of tropical cyclone tornadoes in
central North Carolina. Weather and forecasting, 22, 278-286.
Schultz, L. A. and D. J. Cecil, 2009: Tropical cyclone tornadoes, 1950-2007. Monthly
Weather Review, 137, 3471-3484.
Smith, J. S., 1965: The hurricane-tornado. Mon. Wea. Rev, 93, 53-1.
Spratt, S. M., D. W. Sharp, P. Welsh, A. Sandrik, F. Alsheimer, and C. Paxton, 1997: A
WSR-88D assessment of tropical cyclone outer rainband tornadoes. Weather and
forecasting, 12, 479-501.
Stumpf, G. J., A. Witt, E. D. Mitchell, P. L. Spencer, J. Johnson, M. D. Eilts, K. W.
10
Thomas, and D. W. Burgess, 1998: The National Severe Storms Laboratory
Mesocyclone Detection Algorithm for the WSR-88D*. Weather and Forecasting,
13, 304-326.
Suzuki, H., T. ABE, K. Takaishi, M. Narita, and F. Hamada, 2000: New Polyimides
Derived from Norbornanetetracarboxylic Dianhydride and Aromatic Diamine
Showing Excellent Transparency and Heat-Resistance. International Journal of
the Society of Materials Engineering for Resources, 8, 9-14.
Wakimoto, R. M., C. Liu, and H. Cai, 1998: The Garden City, Kansas, storm during
VORTEX 95. Part I: Overview of the storm's life cycle and mesocyclogenesis.
Monthly weather review, 126, 372-392.
Xue, M., K. Zhao, M. Wang, Z. Li, and Y. Zheng, 2016: Recent significant tornadoes
in China. Advances in Atmospheric Sciences, 33, 1209-1217.
Yu, H., P. Chen, Q. Li, and B. Tang, 2013: Current Capability of Operational Numerical
Models in Predicting Tropical Cyclone Intensity in the Western North Pacific.
Weather & Forecasting, 28, 353-367.
Zheng, Y., B. Zhang, X. Wang, K. Sun, R. Mu, and W. Xia, 2015: Analysis of typhoon-
tornado weather background and radar echo structure. Meterological Monthly, 41,
942-952 (in Chinese with English abstract).
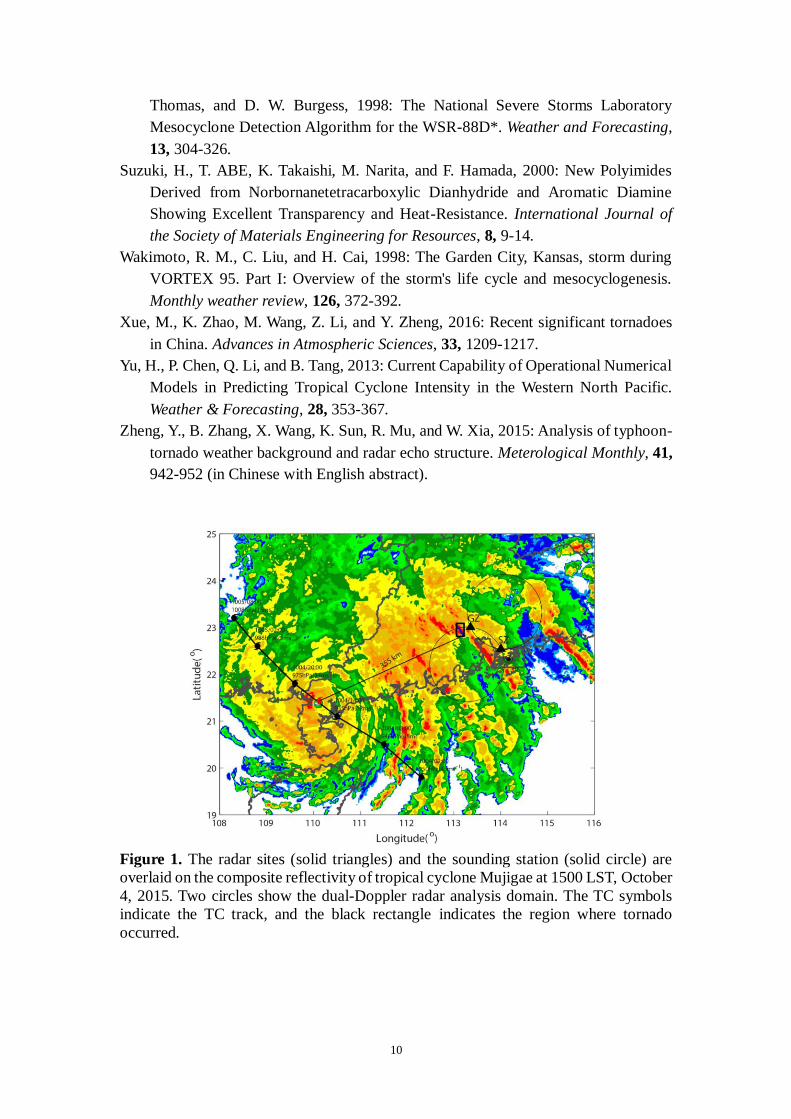
Figure 1. The radar sites (solid triangles) and the sounding station (solid circle) are
overlaid on the composite reflectivity of tropical cyclone Mujigae at 1500 LST, October
4, 2015. Two circles show the dual-Doppler radar analysis domain. The TC symbols
indicate the TC track, and the black rectangle indicates the region where tornado
occurred.
11
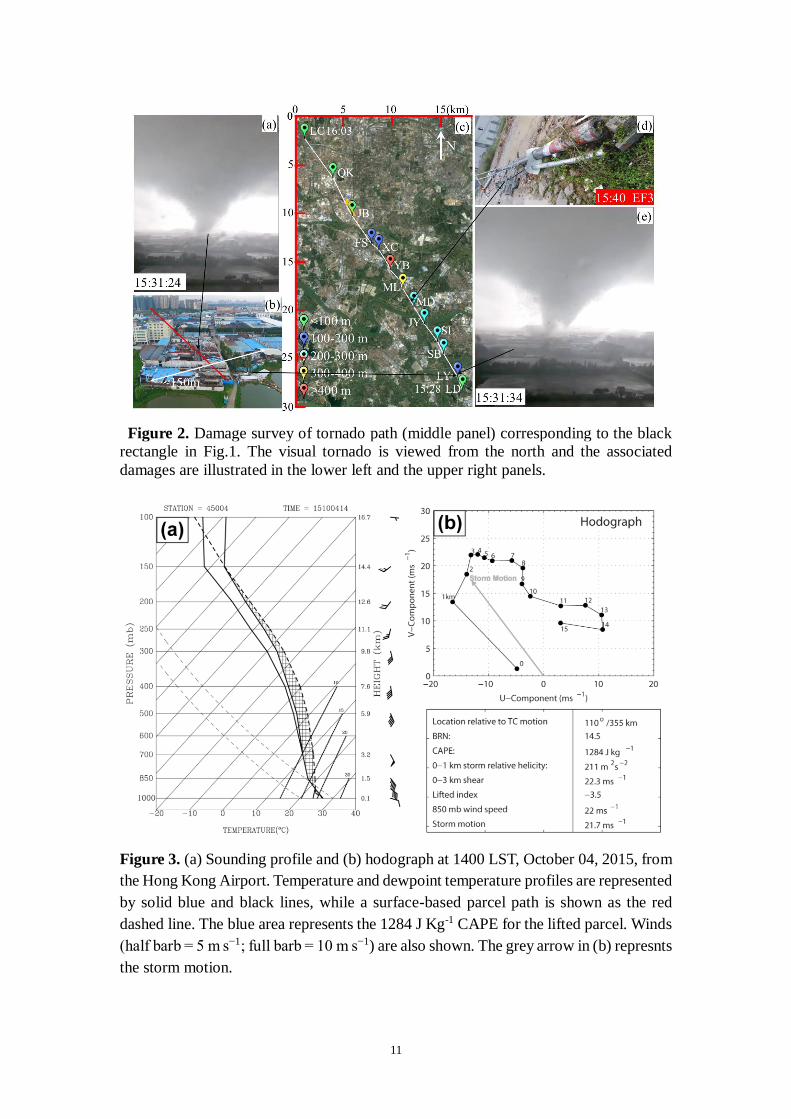
Figure 2. Damage survey of tornado path (middle panel) corresponding to the black
rectangle in Fig.1. The visual tornado is viewed from the north and the associated
damages are illustrated in the lower left and the upper right panels.
Figure 3. (a) Sounding profile and (b) hodograph at 1400 LST, October 04, 2015, from
the Hong Kong Airport. Temperature and dewpoint temperature profiles are represented
by solid blue and black lines, while a surface-based parcel path is shown as the red
dashed line. The blue area represents the 1284 J Kg-1 CAPE for the lifted parcel. Winds
(half barb = 5 m s−1; full barb = 10 m s−1) are also shown. The grey arrow in (b) represnts
the storm motion.

12
Figure 4. Damage survey of tornado path (solid black line) from Fig. 2 and the TVS
(black cross) superimposed on radar reflectivity (dBZ) at 1.5o elevation angle from the
Guangzhou radar and ground-relative radial velocities (m s−1) from 1524 to 1554 LST,
October 4, 2015, at an interval of 6 min.

13
Figure 5. Time-height profiles of (a) rotational velocity (m s-1), (b) couplet diameter
(km), and (c) azimuthal shear (10-3 s-1) for the tornado’s parent mesocyclone. A distance
scale (km) relative to Guangzhou radar along with the local time is indicated in the
horizontal axis. The strength of the TVS, defined by the gate-by-gate radial velocity
difference are indicated by circles in (a). The presence of the tornado, through visual
and damage track records, is indicated by the red line.

14
Figure 6. Dual-Doppler analysis of tornadic mesocyclone from Guangzhou and
Shenzhen radars at 1.5 km height (top row) and 3.5 km height (bottom row) at (a-d)
1430 LST, (b-e) 1454 LST and (c-f) 1530 UTC, October 04, 2015, corresponds to
before and at the time of tornadogenesis. Reflectivity (color, dBZ) is overlaid with
storm-relative wind vectors. The positive (white solid line) and negative (white dashed
line) vertical vorticity is contoured at ±1, 5, 10, 15, and 20 × 10−3 s−1.The updraft (blue
line) is contoured at 2, 4, 6, 8,10 m s-1.The green filled triangles indicate the location of
the TVS.
Figure 7. Vertical cross sections of radar reflectivity (dBZ, color shading), storm-
relative wind vectors, vertical velocity (m s-1, blue contours), and vertical vorticity (1
×10-3 s-1, white contours) at 1530 LST, October 4, 2015 (at the time of tornadogenesis)
along (a) AB and (b) CD in Fig. 5c. The solid and dashed lines denote positive-negative
values, respectively. The green filled triangles indicate the location of TVS.
15
Figure 8. Distributions of (a,e) HADV, (b,f) VADV, (c,g) TILT, and (d, h) CONV terms
within the mesocyclone at 1.5 km at 1500 LST (upper row) and 1530 LST (bottom row),
corresponding to the times before and near tornadogenesis. Blue solid (dashed)
contours denote positive (negative) contributions to vertical vorticity production with
the interval of 2 × 10⁻⁶ s−2. Reflectivity (dBZ, color shading) is overlaid with storm-
relative wind vectors and vertical relative vorticity (white contours with intervals of 4
×10-3 s-1).