
Doped Perovskite Materials for Solid Oxide Fuel Cell (SOFC) …€¦ · V List of Figures Figure...
138
I Doped Perovskite Materials for Solid Oxide Fuel Cell (SOFC) Anodes and Electrochemical Oxygen Sensors William Donald Penwell Thesis Submitted to the Faculty of Graduate and Postdoctoral Studies in partial fulfillment of the requirements for the M.Sc. Degree in Chemistry Department of Chemistry Faculty of Science University of Ottawa © William D. Penwell, Ottawa, Ontario, Canada 2014
Transcript of Doped Perovskite Materials for Solid Oxide Fuel Cell (SOFC) …€¦ · V List of Figures Figure...

I
Doped Perovskite Materials for
Solid Oxide Fuel Cell (SOFC) Anodes and
Electrochemical Oxygen Sensors
William Donald Penwell
Thesis Submitted to the Faculty of Graduate and Postdoctoral Studies in partial fulfillment of the
requirements for the M.Sc. Degree in Chemistry
Department of Chemistry
Faculty of Science
University of Ottawa
© William D. Penwell, Ottawa, Ontario, Canada
2014

II
Table of Contents
List of Figures ………….…………………………………………………………. V
List of Tables ……………………………………………………………………… VIII
List of Abbreviations …..…………………………………………………………. IX
Abstract…..………………………………………………………………………... XI
Claim to Original Research ……………………………………………………… XIII
Summary ………………………………………………………………………….. XIV
Acknowledgments ………………………………………………………………… XVI
1. Introduction ……………………………………………………………………. 1
1.1 Scope …………………………………………………………………... 1
1.2 Perovskites ……………………………………………………………. 2
1.2.1 Structure and History …………………………………….….. 2
1.2.2 Elemental Doping and Oxygen Stoichiometry …………...….. 5
1.2.3 Conductivity of the Perovskites ……………………………… 6
1.2.4 Perovskite Applications ……………………………………… 8
1.3 SOFCs …………………………………………………………………. 9
1.3.1 Introduction and History …………………………………….. 9
1.3.2 SOFC Materials ……………………………………………... 12
1.4 Electrochemical Oxygen Sensors ……………………………………. 22
1.4.1 Introduction and Description………………………………… 22
1.4.2 Oxygen Sensors ……………………………………………… 23
1.5 References …………………………………………………………….. 26
2. Experimental Considerations …………………………………………………. 30
2.1 Summary ……………………………………………………………… 30
2.2 Synthetic Route ……………………………………………………….. 30
2.3 Material Characterization Techniques ……………………………… 31
2.3.1 X-Ray Diffraction …………………………………………….. 31
2.3.2 Scanning Electron Microscopy ………………………………. 33
2.4 Conductivity Measurements …………………………………………. 34
2.4.1 4-Point Conductivity …………………………………………. 34
2.4.2 Ionic vs. Electronic Conductivity …………………………….. 37
2.5 Sensor Experiments …………………………………………………… 38
2.6 Fuel Cell Testing Considerations …………………………………….. 39
2.6.1 Button Cell Fabrication ………………………………….…… 39
2.6.2 Fuel Cell Setup and Electrochemical Considerations ………… 39
2.6.3 Electrochemical Testing ……………………………………….. 43
2.7 References ………………………………………………………………. 47

III
3. Conductivity of Cerium Doped BaFeO3-δ and Applications for the Detection
of Oxygen ……………………………………………………………………………
48
3.1 Introduction 48
3.2 Experimental 51
3.2.1 Synthesis ……………………………………………………….. 51
3.2.2 Characterization ………………………………………………. 51
3.2.3 Total, Ionic and Electronic Conductivity Measurements ……… 52
3.2.4 Sensor Experiments ……………………………………………. 53
3.3 Results and Discussion …………………………………………………. 54
3.3.1 Characterization ………………………………………………. 54
3.3.2 Conductivity Properties ……………………………………….. 56
3.3.3 Gas sensing Properties ………………………………………... 59
3.4 Conclusion ……………………………………………………………… 65
3.5 References ………………………………………………………………. 66
4. Enhanced Performance of Transition Metal Doped Sm0.95Ce0.05FeO3-δ
SOFC Anodes in H2S ……………………………………………………………….
69
4.1 Introduction ……………………………………………………………. 70
4.2 Experimental …………………………………………………………… 71
4.2.1 Powder Synthesis ……………………………………………… 71
4.2.2 Characterization ………………………………………………. 72
4.2.3 Button Cell Fabrication ……………………………………….. 72
4.2.4 Fuel Cell Setup and Electrochemical Testing …………………. 73
4.3 Results and Discussion …………………………………………………. 75
4.3.1 Performance under 5% H2S …………………………………… 75
4.3.2 Performance under 0.5% H2S …………………………………. 84
4.3.3 Sulfur Recovery Tests ………………………………………….. 89
4.4 Conclusions ……………………………………………………………... 93
4.5 References ………………………………………………………………. 94

IV
5. Conductivity of Y doped BaMoO3 Perovskites and Applications
as IT-SOFC Anode Materials …………………………………………………….
96
5.1 Introduction …………………………………………………………….. 96
5.2 Experimental …………………………………………………………… 98
5.2.1 Powder Synthesis ……………………………………………… 98
5.2.2 Electronic Conductivity ……………………………………….. 98
5.2.3 Characterization ………………………………………………. 99
5.2.4 Button Cell Testing…………………………………………….. 100
5.3 Results and Discussion ………………………………………………… 101
5.3.1 Characterization ………………………………………………. 101
5.3.2 Electrical Conductivity ………………………………………... 106
5.3.3 Applications as SOFC anode materials ………………………. 108
5.4 Conclusion ……………………………………………………………… 115
5.5 References ……………………………………………………………… 115
6. Conclusions ………………………………………………………………………. 118

V
List of Figures
Figure 1.1: General cubic structure of the ABO3 perovskite oxides. A site = green, B site = red,
Oxygen = white
Figure 1.2: Schematic showing the principal operation of a SOFC with H2 fuel
Figure 1.3: Triple Phase Boundary (TPB) reactive sites at the SOFC cathode when using pure
LSM.
Figure 1.4: Ni-YSZ cermet anode with enhanced TPB reaction sites.
Figure 2.1: Pellet setup for 4-point conductivity measurement.
Figure 2.2: Sample setup for 4-point conductivity measurement.
Figure 2.3: Pellet setup for 2-point conductivity measurements.
Figure 2.4: Schematic of the SOFC button cell geometry used in this work.
Figure 2.5: Fuel cell test apparatus. The right portion of the figure is blown-up to show the
button cell mounted for testing.
Figure 2.6: Equivalent circuit model used to fit EIS Nyquist plots.
Figure 3.1: Experimental setups for sensor and conductivity tests showing the 2-point (a.b) and
4-point (c) methods used. The power supply provided a constant current of 100 mA.
Figure 3.2: SEM images of BaFeO3-δ (a,c) and Ba0.95Ce0.05FeO3-δ (b,d) as-prepared powders.
Figure 3.3: p-XRD of Ba1-xCexFeO3-δ x = 0-0.05. Spectra are in order of decreasing Cerium
content: x = 0.05, 0.03, 0.01, and 0 corresponding to a, b, c, and d respectively. Phase labels:
hexagonal = asterisk, cubic = square.
Figure 3.4: a) Conductivity of Ba1-xCexFeO3-δ (x=0, 0.05) between 25-1000˚C. b) Arrhenius
plot of conductivities between 600-1000˚C.
Figure 3.5: a) Electronic and b) Ionic conductivities of Ba1-xCexFeO3-δ (x=0, 0.05).
Figure 3.6: Low (a) and high (b) magnification SEM images of Ba0.95Ce0.05FeO3-δ sensor.
Figure 3.7: Sensor conductivity in O2 at temperatures of a) 700˚C and b) 500˚C. Features are
labelled by their O2 concentration: 25, 29, 33, 37 and 45 % O2 for A, B, C, D and E, respectively.
Figure 3.8: Sensor Response vs. O2 concentration for Ba0.95Ce0.05FeO3-δ sensor at 500˚C and
700˚C.
Figure 3.9: log(σ) vs log(pO2) plot for Ba0.95Ce0.05FeO3-δ sensor at 500 and 700°C.

VI
Figure 4.1: OCV’s of SCF cells at 500°C in a) H2 and b) 5% H2S/95% H2 and Power Density
curves in c) H2 and d) 5% H2S/95% H2.
Figure 4.2: EIS spectra of SCF-Ni cell at 500°C in H2 and 5% H2S/95% H2.
Figure 4.3: SEM images of SCF anodes pre (top row) and post (bottom row) testing in 5% H2S /
95% H2.
Figure 4.4: Cross sectional EDS analysis of SCF-Co cell after testing in 5% H2S.
Figure 4.5: Powder XRD of anode materials before and after testing in 5%.
Figure 4.6: OCVs of SCF cells at 500°C in a) H2 and b) 0.5% H2S/95% H2 and Power Density
curves in c) H2 and d) 0.5% H2S/95% H2.
Figure 4.7: EIS spectra of SCF-Co cell at 500°C in H2 and 0.5% H2S/99.5% H2.
Figure 4.8: SEM images of SCF anodes pre (top row) and post (bottom row) testing in 0.5%
H2S / 99.5% H2.
Figure 4.9: Powder XRD of anode materials before and after testing in 0.5% H2S.
Figure 4.10: Recovery tests of SCF-Co cell versus time. 0.5% H2S introduced at 14 hours and
removed at 28 hours. a) OCV b) Rct from EIS c) io from EIS d) power density at an overpotential
of 450 mV.
Figure 4.11: SEM images of SCF-Co anode post recovery testing.
Figure 4.12: Powder XRD of SCF-Co material as prepared and post recovery testing.
Figure 5.1: p-XRD of Ba1-xYxMoO4 (x= 0-0.07) scheelite materials. The asterisk in spectra
x=0.07 indicates the onset of yttria phase evolution.
Figure 5.2: SEM and p-XRD (zoomed region) of Ba0.93Y0.07MoO4 Scheelite material, indicating
the phase separation of yttria.
Figure 5.3: p-XRD of Ba1-xYxMoO3 (x=0-0.07) perovskites post reduction in H2.
Figure 5.4: Lattice parameter, a, versus Y concentration in Ba1-xYxMoO3 (x=0-0.20) perovskites.
Figure 5.5: SEM images of Ba0.95Y0.05MoO3 perovskite following reduction in H2.
Figure 5.6: Electrical conductivity of Ba1-xYxMoO3 (x=0-0.07) perovskites in dry H2 between
25-1000°C.
Figure 5.7: Power and voltage vs. current density plots of a) BaMoO3 and b) Ba0.95Y0.05MoO3
anode materials between 500-800°C.
Figure 5.8: Nyquist plot of EIS for Ba0.95Y0.05MoO3 anode at 500°C.
Figure 5.9: Post mortem cross sectional SEM of anode-electrolyte interface of Ba1-xYxMoO3 (x=
0.05) fuel cell.

VII
Figure 5.10: p-XRD spectra of Scheelite/SDC to perovskite /SDC composite material before and
an after reduction in H2 at 700°C.
Figure 5.11: EIS Nyquist plot of BaMoO3 / SDC composite anode at 800°C.
Figure 5.12: Post mortem p-XRD of Ba0.95Y0.05MoO3 anodes after a) quenching and b) slow
cooling.

VIII
List of Tables
Table 1.1: Effect of tolerance factor on possible perovskite structure.
Table 1.2: Perovskite oxidation state classifications and examples.
Table 1.3: Examples of ionic conductivity in perovskite materials.
Table 1.4: The five types of fuel cell devices and their respective parameters.
Table 1.5: Common electrolyte materials and their ionic conductivities at 800°C in air.
Table 1.6: Typical concentrations of H2S in natural gas.
Table 1.7: Performance of some Cr and Ti perovskite anodes in H2 and CH4.
Table 1.8: Performance summary for SmFeO3 anode materials in H2 and CH4.
Table 1.9: Examples of perovskite oxides investigated for the detection of oxygen.
Table 3.1: Response and recovery times for Ba0.95Ce0.05FeO3-δ O2 sensor at 500˚C and 700˚C.
Table 4.1: AC Impedance data of SCF cells at 500 °C in H2 and 5% H2S / 95 % H2.
Table 4.2: Atomic percentages from EDS point analyses in Figure 4.4.
Table 4.3: AC Impedance data of SCF cells at 500 °C in H2 and 0.5% H2S / 99.5% H2.
Table 5.1: Tolerance factors and P-XRD lattice parameters of Ba1-xYxMoO3 (x=0-0.20)
perovskites.
Table 5.2: EIS data for The Ba1-xYxMoO3 (x=0, 0.05) anode materials at 500-800°C

IX
List of Abbreviations
t-tolerance factor
SOFC- solid oxide fuel cell
IT-SOFC-intermediate temperature solid oxide fuel cell
LT-SOFC- low temperature solid oxide fuel cell
XRD- X-Ray diffraction
p-XRD- powder X-ray diffraction
SEM-scanning electron microscopy
EDS- energy dispersive spectroscopy
σ- conductivity
σT - conductivity
σi-ionic conductivity
σe-electronic conductivity
MIEC- mixed ionic/electronic conductor
OCV-open circuit voltage
Rct-charge transfer resistance
Rp-polarization resistance
Rs-serial resistance
io-exchange current density
PEMFC- proton exchange membrane fuel cell
PAFC- phosphoric acid fuel cell
MCFC- molten carbonate fuel cell
AFC- alkaline fuel cell

X
TPD- triple phase boundary
YSZ- yttria stabilized zirconia
SDC- samarium doped ceria
GDC- gadolinium doped ceria
LSM- lanthanum strontium manganate (La0.8Sr0.2MnO3)
LSCF- lanthanum strontium cobalt ferrite (La0.6Sr0.4Co0.2Fe0.8O3)
LSCM- lanthanum strontium chromium manganate (La0.8Sr0.2Cr0.5 Mn0.5O3)
TEC- thermal expansion coefficient
pO2- partial oxygen pressure
ρ- volume resistivity
S- sensor response
EIS- electrochemical impedance spectroscopy
CA- chronoamperometry
MFC- mass flow controller
BCF- Ba0.95Ce0.05FeO3-δ
SCF- Sm0.95Ce0.05FeO3-δ
SCF-Ni- Sm0.95Ce0.05Fe0.97Ni0.03O3-δ
SCF-Co- Sm0.95Ce0.05Fe0.97Co0.03O3-δ
XI
Abstract
This work focused on the study of three independent projects involving perovskite oxide
materials and their applications as solid oxide fuel cell (SOFC) anodes and electrochemical
oxygen sensors. The underlying theme is the versatility and tune-ability of the perovskite
structure. Reactivity and conductivity (ionic as well as electronic) are modified to optimize
performance in a specific application.
The effect of Ce doping on the structure and the conductivity of BaFeO3 perovskite
materials is investigated and the resulting materials are applied as oxygen sensors. The new
perovskite family, Ba1-xCexFeO3-δ (x=0, 0.01, 0.03, and 0.05), was prepared via a sol-gel
method. Powder XRD indicates a hexagonal structure for BaFeO3 with a change to a cubic
perovskite upon Cerium doping at the A site. The solubility limit of Ce at the A site was
experimentally determined to be between 5-7 mol %. Bulk, electronic and ionic conductivities of
BaFeO3-δ and Ba0.95Ce0.05FeO3-δ were measured in air at temperatures up to 1000˚C. Cerium
doping increases the conductivity throughout the entire temperature range with a more
pronounced effect at higher temperatures. At 800˚C the conductivity of Ba0.95Ce.05FeO3-δ reaches
3.3 S/cm. Pellets of Ba0.95Ce.05FeO3-δ were tested as gas sensors at 500 and 700˚C and show a
linear, reproducible response to O2.
Promising perovskite anodes have been tested in high sulfur fuel feeds. A series of
perovskite solid oxide fuel cell (SOFC) anode materials: Sm0.95Ce0.05FeO3-δ,
Sm0.95Ce0.05Fe0.97Ni0.03O3-δ and Sm0.95Ce0.05Fe0.97Co0.03O3-δ have been tested for sulfur tolerance
at 500°C. The introduction of the extreme 5% H2S enhances the performance of these anodes,
verified by EIS and CA experiments. Post mortem analyses indicate that the performance

XII
enhancement arises from the partial sulfidation of the anode, leading to the formation of FeS2,
Sm3S4 and S on the perovskite surface. Testing in lower concentrations of sulfur, more common
in sour fuels, 0.5% H2S, also enhances the performance of these materials. The SCF-Co anode
shows promising stability and an increase in exchange current density, io, from 13.72 to 127.02
mA/cm2 when switching from H2 to 0.5% H2S/99.5% H2 fuel composition. Recovery tests
performed on the SCF-Co anode conclude that the open cell voltage (OCV) and power density of
these cells recover within 4 hours of H2S removal. We conclude that the formation of metal
sulfide species is only partially reversible, yielding an anode material with an overall lower Rct
upon switching back to pure H2. Combining their performance in sulfur containing fuels with
their previously reported coke tolerance makes these perovskites especially attractive as low
temperature SOFC anodes in sour fuels.
A new perovskite family Ba1-xYxMoO3 (x=0-0.05) has been investigated in regards to
electrical conductivity and performance as IT-SOFC anode materials for the oxidation of H2.
Refinement of p-XRD spectra as well as SEM imaging conclude that the solubility limit of Y
doping at the A site is 5 mol%, beyond which Y2O3 segregation occurs. The undoped BaMoO3
sample has a colossal room temperature conductivity of 2500 S/cm in dry H2. All materials
maintain metallic conductivity in the temperature range of 25-1000°C with resistance increasing
with Y doping. The Ba1-xYxMoO3 (x=0, 0.05) materials exhibit good performance as SOFC
anode materials between 500-800°C, with Rct values at 500°C in dry H2 of 3.15 and 6.33
ohm*cm2 respectively. The catalytic performance of these perovskite anodes is directly related to
electronic conductivity, as concluded from composite anode performance.

XIII
Claim to Original Research
I, William D. Penwell performed all relevant experimental work and drafted the
manuscripts for this thesis. All work presented herein is published or in preparation for
publication.
Journal Publications Relevant to this thesis:
Chapter 3: W.D. Penwell, J.B. Giorgi, Sensors and Actuators B: Chemical 191 (2014) 171.
Chapter 4: S.M. Bukhari, W.D. Penwell, J.B. Giorgi, ECS Transactions 57 (2013) 1507.

XIV
Summary
This work focused on the study of three independent projects involving perovskite oxide
materials and their applications as solid oxide fuel cell (SOFC) anodes and electrochemical
oxygen sensors. The underlying theme is the versatility and tune-ability of the perovskite
structure. Reactivity and conductivity (ionic as well as electronic) are modified to optimize
performance in a specific application.
In Chapter 3 I investigated the structural and electronic effects of A site Ce doping in
BaFeO3-δ. The experimental solubility limit of Ce at the A site was determined to be 5 mol%. Ce
doping increased both the electronic and ionic conductivity of these materials, making them
applicable as sensors for the detection of oxygen. The sensor behavior of the Ba0.95Ce0.05FeO3-δ
was measured at temperatures of 500°C and 700°C and a defect chemical model was inferred
from the response data.
In Chapter 4 I focused on the Sm0.95Ce0.05Fe1-xMxO3-δ perovskite materials where the
dopant M is either Co or Ni in 3 mol%. These materials had previously been shown to be active
as SOFC anode materials at intermediate temperatures (500-800°C) for H2 and CH4 oxidation.
The primary goal of this work was to test the sulfur tolerance of these materials at 500°C. An
extremely high concentration of H2S (0.5-5%) in the fuel stream was used to accelerate anode
poisoning. Interestingly, these materials show drastically improved performance when fed with
H2S, a rare case in comparison to typical state of the art anode materials. The performance
increase was confirmed by AC impedance spectroscopy and DC chronoamperometry
experiments. Post-mortem analysis of these fuel cells showed that that the partial sulfidation of
the perovskite anode leads to a more electronically conductive and more reactive anode material
for fuel oxidation. As well, the sulfidation is limited to the perovskite surface, with the interior of

XV
the material remaining un-affected. The Co doped material performed the best, and was further
tested for recovery when switching back to H2 from sulfur containing fuels.
Finally, In Chapter 5 I investigated the effect of Y doping in BaMoO3, with the primary
goal of increasing the ionic conductivity of the material. These molybdenum perovskites have
colossal electronic conductivities, as high as 2500 S/cm in dry H2, which decrease with
increasing concentrations of Y. These materials were then tested as SOFC anode materials at
temperatures of 500-800°C in dry H2. The undoped material exhibited the most promising
performance, with low values for charge transfer resistance and high exchange current densities.
The redox behavior of these materials was most interesting; these perovskites rapidly oxidize to a
scheelite structure (BaMoO4) at elevated temperatures when exposed to air. This puts a high
demand on the Pyrex seal at the anode side of the SOFC test apparatus; we hypothesize that
slight leakages lead to partial oxidation to the scheelite structure during fuel cell operation,
evident from post mortem X-Ray diffraction (XRD). As well, drawing current from the button
cell may lead to partial oxidation at the anode-electrolyte interface from the diffusion of oxide
species through the SDC electrolyte. These molybdenum perovskite materials may offer
improved performance as SOFC anodes with further optimization of the gas seal.

XVI
Acknowledgments
First and foremost I would like to express my gratitude to Dr. Javier Giorgi, my
supervisor and mentor for all work outlined in this thesis. The inspiration and guidance he
provided throughout this research project have been crucial for my success and enjoyment of the
chemistry. His patience, generosity and sincere optimism are greatly appreciated.
I would also like to thank all current and former members of the Giorgi group, especially
Julie O’Brien for her invaluable help with instrumental and experimental procedures. I would
also like to thank Dr. Yun Liu and Dr. Tara Kell for help with experimental imaging and XRD
respectively.
Finally, I would like dedicate this work to my family and friends, who have given me the
utmost of confidence and support in every endeavor I have undertaken. Thank you.

1
Chapter 1
Introduction
1.1 Thesis Scope
This thesis work focuses on the development of new perovskite materials with
applications towards solid-state gas sensors and solid oxide fuel cell (SOFC) anodes. Chapter 1
covers an introduction to perovskites, their history and applications. As well, the applications of
perovskites for SOFCs and semiconductor oxygen sensors are thoroughly discussed. This work
was fundamentally carried out in a general procedure of synthesis, complete structural and
electrochemical characterization, followed by demonstrated application. Therefore, Chapter 2
covers the variety of synthetic and analytic procedures used as well as details regarding the
electrochemical procedures and apparatus.
Within Chapter 3, the material of interest is an alkali-earth perovskite BaFeO3. As
mentioned throughout this introduction, the ferrites offer many unique advantages over other
perovskites while also being a relatively un-investigated system. The doping of Ce at the A site
in BaFeO3 is performed and its effect on structure, ionic and electronic conductivity is
thoroughly investigated. The 5% Ce doped material, Ba1-xCexFeO3-δ, is then applied as a
conductometric gas sensor for the detection of oxygen at elevated temperatures.
Chapter 4 of this work deals with the sulfur tolerance of some previously developed
perovskites reported in our group. Perovskites of the form Sm0.95Ce0.05Fe1-xMxO3-δ where M= Ni,
Co have been reported as catalytically active IT-SOFC anode materials for the direct utilization
of H2 and hydrocarbon fuels. The work outlined in Chapter 3 tests three anode materials
(Sm0.95Ce0.05FeO3-δ, Sm0.95Ce0.05Fe0.97Co0.03O3-δ, and Sm0.95Ce0.05Fe0.97Ni0.03O3-δ) in high level

2
H2S fuels of 0.5% and 5%. The anodes are electrochemically tested at 500°C with complete post-
mortem analyses to investigate the effect of sulfur impurities on fuel cell performance.
Finally, Chapter 5 investigates a family of molybdenum based perovskites. As mentioned
throughout this introduction, Mo perovskites have high electronic conductivities and are
catalytically active as SOFC anode materials. The effect of A site Y doping in BaMoO3 is
investigated in an attempt to increase the ionic conductivity of these perovskites for application
as anode materials for H2. The effect of dopant on structure and conductivity is investigated as
well as the electrochemical testing of these materials as SOFC anodes.
1.2 Perovskites
1.2.1 Structure and History
The perovskite structure is one of the oldest, most studied configurations in solid-state
inorganic chemistry. Perovskite was originally the name given to the CaTiO3 mineral discovered
in the early 1900s by Russian scientist Gustav Rose, in honor of mineralogist Lev Perovski. It
has since become a general name to describe the family of materials comprising this structure.
Perovskites have a general formula ABX3 where A and B represent metal cations and X is a
charge balancing anion, typically oxygen. These perovskite oxides are therefore described by
formula ABO3. The A site cations are normally alkali, alkali earth or rare earth elements,
whereas transition metals are conventionally in the B site. The B site cation is coordinated to 6
oxygen atoms forming a corner sharing octahedral network. The A site cations are larger, and
coordinate to 12 oxygen atoms, laying within interstices formed by the octahedral network. The
ideal perovskite structure is cubic, as is shown in Figure 1.1 with the A and B site cations
represented in green and red respectively. Depending on the relative sizes of both A and B site

3
cations, the B site octahedra tilt, to stabilize the structure. This leads to other structural forms
such as orthorhombic, rhombohedral, hexagonal etc.
The ability of the perovskite structure to accommodate a variety of metal cations leads to
many potential structures, not all of which are cubic. The prediction of the crystal parameters is
an important aspect when developing and synthesizing new perovskite materials, therefore
extensive work has been done to understand the effect of cation size on the structure. The
majority of perovskite structures can be qualitatively predicted using the Goldshmidt Tolerance
Factor. Developed in the 1920s, Goldshmidt’s tolerance factor relates the ionic radii of the A and
B cations to the lattice parameters of the perovskite unit cell [1]. The tolerance factor, t, is
derived from trigonometry, utilizing a ratio between the A-O and B-O bond lengths. In the
perovskite structure, the anions (oxygen) separate both the A and B cations. This means that the
lattice constant, a, can be determined by the sum of the ionic diameters of oxygen and the B-
cation, as is shown in Equation 1.1. The relationship between the lattice constant, a, and the A
site cation is more complex due to their relative positions in the unit cell. Equation 1.2 is derived
from the Pythagoras theorem where, in an ideal cubic perovskite, a is equal to times the sum
Figure 1.1: General cubic structure of the ABO3 perovskite
oxides. A site = green, B site = red, Oxygen = white

4
of ionic radii of the A cation and oxygen. Also, in the ideal cubic structure the contact distance
between the A and B site cations are equal to each other, leading to Equation 1.3. Since most
elements do not satisfy the requirements for the ideal structure, the tolerance factor, t, is included
and is a direct ratio of the A-O to B-O bond lengths in the perovskite (Equation 1.4).
The value of t is calculated and used to qualitatively determine the stability of the
perovskite structure. Values between 0.9-1.0 are said to be the ideal case, giving rise to cubic
perovskite structures where the A and B cation radii match perfectly. If, for example, a smaller A
site metal cation is used, the B site octahedra tilt to accommodate the smaller A cation radius and
the tolerance factor decreases. Generally, if a combination of A and B metals gives a t value of
0.8-1.0, the perovskite structure will be obtained in some form. Table 1.1 illustrates the
relationship of t-value and potential perovskite structure.
[1.1]
[1.2]
[1.3]
[1.4]
5
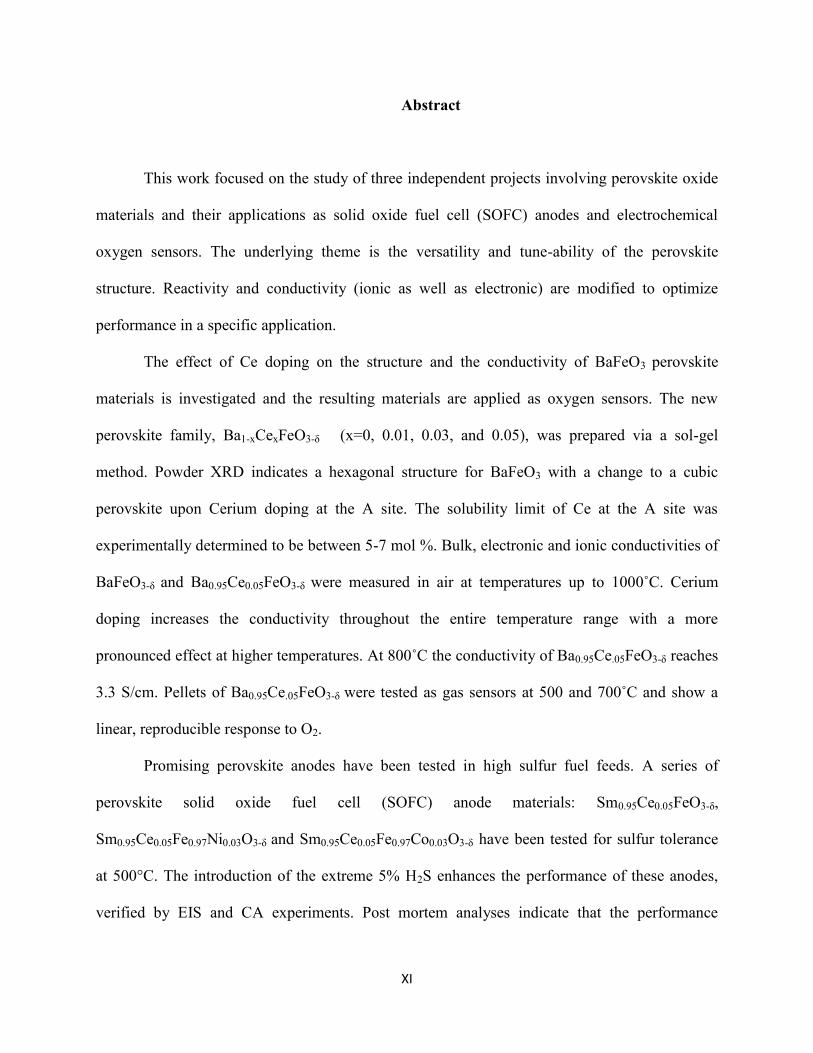
Table 1.1: Effect of tolerance factor on possible perovskite structure [2].
t-value Effect Possible Structure
>1 A-site cations are too large
to fit into their interstices Hexagonal perovskite
~0.9-1.0
A-site and B-site cations fit
exactly into their allotted
sites (Ideal condition)
Cubic Perovskite
0.75-0.9 A-site cations are too small
to fit into their allotted sites
Orthorhombic and
Rhombohedral
< 0.71 Both A-site cations and B-
site cations are of same size
Correndum and
Ilmenite structures
1.2.2 Elemental Doping and Oxygen Stoichiometry
Over 90% of the elements from the periodic table can be accommodated in the perovskite
structure, leading to a wide range of possible material combinations. This ability to include most
elements allows one to easily tailor the material properties for specific applications by doping at
the A and/or B site. Elemental doping has been shown to enhance many favorable properties
such as magnetism, electrical conductivity, surface area, mechanical strength, catalytic reactivity
etc. [3–5]. The dopant is typically chosen to specifically enhance a certain property of the
material. Depending on the nature of the material, the dopant can drastically affect the band
structure and hence the electronic properties. As well, dopants of varying oxidation states are
conventionally used to introduce oxygen vacancies within the perovskite [4]. The majority of
perovskites fall into three subcategories depending on the relative oxidation states of the A and B
site cations (Table 1.2). However, the perovskite structure is highly tolerant to oxide vacancies
and can therefore accommodate elements of various oxidation states in either the A and/or B
sites. For example, a perovskite with trivalent A and B site cations would have a general formula
A+3
B+3
O3. By substituting a divalent metal for the B site cation, the perovskite structure

6
necessarily loses oxygen in the form of vacancies to obey charge neutrality. This leads to the
form A+3
B+3
1-xB+2
x O3-δ where x equals the fraction of dopant and δ is the degree of oxygen
vacancies. The structure can be further modified by additional doping at the A site, leading for
example to a formula A+3
1-xA+2
xB+3
1-yB+2
yO3-δ. Clearly, the perovskite system can accommodate
a large level of dopants and become quite complex.
Table 1.2: Perovskite oxidation state classifications and examples.
Relative Oxidation
States Examples
A+3
B+3
O3 SmFeO3
A+2
B+4
O3 BaFeO3
BaMoO3
A+1
B+5
O3 NaWO3
1.2.3 Conductivity of the Perovskites
A key characteristic of the perovskite structure is its ability to conduct both electrons and
ionic species, thus leading to them being labeled as Mixed Electronic and Ionic Conductors
(MIECs). This mixed conductivity in the perovskites allows for their use in many applications
from catalysis to fuel cells to gas sensors. Therefore the understanding and optimization of
perovskite conductivity is currently an area of high interest. For the purposes of this work, the
total conductivity of a perovskite is equal to the sum of the ionic and electronic conductivities as
is shown in Equation 1.5.
[1.5]

7
Perovskites are further classified as being either p or n type semi-conductors. In a p type
material, the primary charge carriers are electron holes whereas in an n type material the carriers
are electrons. While this classification is based on band structure, p/n type conductivities
typically show a reversal of the atmospheric effect on total conductivity. P-type materials have
increased conductivities in oxidizing atmospheres such as air or oxygen and decreased
conductivities in reducing gases. N-type materials are the opposite, with increased conductivities
in a reducing atmosphere. Perovskites that exhibit n-type behavior are primarily electronic
conductors whereas p-type perovskites have mixed conductivities. Some perovskites have been
shown to exhibit metallic conductivity behavior; almost exclusively electronic conductivity that
decreases with increasing temperature. For example, Ikeda et al. reported a room temperature
conductivity of Scm-1
for a single-crystal sample of SrMoO3, the highest
conductivity value of any oxide material [6].
Ionic conductivity in perovskites is especially important for certain applications such as
sensors and SOFC electrode materials. As mentioned previously, the doping of certain elements
into the perovskite structure can lead to the formation of defects, allowing for the conduction of
ionic species. The ionic conductivity is essentially the ‘hopping’ of charge carrying ions through
site vacancies in the crystalline lattice. A defective structure, oxygen vacant in this case, is
necessary for this conduction to occur. The energy required for ionic conduction in perovskites is
typically quite large; therefore the majority of perovskites only conduct at elevated temperatures.
Ionic conductivity in perovskites is described as a thermally activated process, increasing
exponentially with temperature. Perovskites have been demonstrated to conduct several types of

8
ions, as is shown in Table 1.3 [4]. The mobile ionic species of interest for this thesis work is
primarily the oxide anion,
Table 1.3: Examples of ionic conductivity in perovskite materials [4].
Perovskite Ionic
Species
Temperature σionic (S/cm)
La0.8Sr0.2Ga0.8Mg0.2O2.85 800°C
SrCe0.95Yb0.05O3-δ
900°C
La0.51Li0.34TiO2.94
27°C
CsPbCl3
500°C
CsPbBr3 500°C
1.2.4 Perovskite Applications
Due to their elemental flexibility and unique electronic properties, perovskite oxides have
found applications in a variety of chemical fields [3]. Two applications are of particular interest
for this thesis work and are therefore discussed in detail within the following section. These
applications are: perovskites as solid oxide fuel cell (SOFCs) anode materials and as
electrochemical gas sensors.

9
1.3 Solid Oxide Fuel Cells
1.3.1 Introduction and History
The growing environmental and economic concerns on the use of highly polluting fossil
fuels is a continued driving force to find new, green energy sources for the production of
electricity. Fuel cells are widely believed to be the technology of the future and are an area of
extensive research in the scientific field. A fuel cell is defined as an electrochemical device
capable of directly converting chemical energy to electricity. The operating principal of a fuel
cell is quite simple; a fuel source, typically H2, is oxidized at the anode and releases electrons to
an external circuit. At the cathode, an oxidant (oxygen) is electrochemically reduced. The anode
and cathode are separated by an electrolyte that conducts ionic species, thus completing the
circuit. The net result is the production of electricity, heat and water with low emissions and
extremely high efficiencies as is shown in Equation 1.6.
The principles of a fuel cell were first developed in 1839 by William Grove, who was
studying the electrolysis of water to produce hydrogen and oxygen. He discovered that, when
switched off, an electrolysis cell constructed with sulfuric acid and Pt catalysts produced a small
current. The term ‘fuel cell’ was later coined by Mond and Langer where, in 1889, they
developed an electrolyte supported cell with porous Pt electrodes that operated on H2 and O2[7–
9]. Currently, 5 major types of fuel cells can be identified based upon the electrolyte used: Proton
Exchange Membrane Fuel Cells (PEMFCs), Solid Oxide Fuel Cells (SOFCs), Phosphoric Acid
Fuel Cell (PAFCs), Molten Carbonate Fuel Cells (MCFCs) and Alkaline Fuel Cells (AFCs).
[1.6]

10
Table 1.4 lists the common fuel cell types and their respective operating temperatures,
efficiencies and electrolytes.
Table 1.4: The five types of fuel cell devices and their respective parameters [9].
Electrolyte Cathode Anode Operating Temperature
AFC Liquid – KOH Pt/Au Pt/Pd 25-100°
PEMFC Polymer Polytetrafluoroethylene-Pt-C 80-100°C
PAFC H3PO4 Polytetrafluoroethylene-Pt-C 200°C
MCFC Li2CO3 Ni Li-NiO 650°C
SOFC
YSZ (Y2O3-ZrO2)
SDC (SmxCe1-xO2)
GDC (GaxCe1-xO2)
LSM (LaSrMnO3)
LSCF (LaSrCoFeO3) Ni-YSZ 500-1000°C
Solid oxide fuel cells are a topic of focus for this thesis and will therefore be discussed in
detail. SOFCs take their name from the dense, solid ceramic electrolyte used in the fuel cell. The
SOFC is operated at high temperatures, typically 500-1000°C, due to the low ionic conductivity
of the ceramic electrolyte at ambient temperatures. Historically speaking, research into solid
ceramic fuel cells began with Nernst in the late 1800s with his discovery of high temperature
ionic conductivity in doped zirconia [8,10,11]. Today, yttria stabilized zirconia (YSZ) remains
the most common electrolyte material for high temperature SOFCs whereas doped ceria
materials are used for low temperature operation. Baur and Preis were the first to demonstrate a
functional SOFC in the 1930s using a YSZ electrolyte, although the cell current output was quite
low [12]. Nevertheless, this work illustrated the concept of a solid ceramic fuel cell operating at
high temperatures. A schematic of a SOFC operating on H2 fuel is shown in Figure 1.2. The fuel,
H2, is oxidized at the anode in the presence of oxygen dianions, releasing electrons to an external
circuit. At the cathode, electrons reduce O2 in air to produce oxygen dianions that then migrate

11
through the electrolyte, thus completing an electronic circuit. The electrode half reactions and
overall cell reaction are shown in Equations 1.7 to 1.9.
Cathode
[1.7]
Anode [1.8]
Overall
[1.9]
SOFCs offer several advantages when compared to other fuel cell devices. The operation
at high temperature allows SOFCs to oxidize several types of fuel, not relying solely on pure H2.
For example, the SOFC can utilize fuel sources such as natural gas (methane, carbon monoxide),
liquid hydrocarbon fuels (biodiesel, ethanol etc) and also sour fuels containing sulfides. This fuel
flexibility is derived not only from the facility of direct oxidation at high temperature, but also
Figure 1.2: Schematic showing the principal operation of a
SOFC with H2 fuel

12
from the high temperature internal reforming at the anode, readily converting the natural fuels
into available hydrogen or methane. High temperature operation also allows for the use of non-
noble metal catalysts for cathode and anode materials, drastically reducing overall costs. Along
with being fuel flexible, SOFCs have the advantage of a solid, thermally and mechanically stable
electrolyte. Other fuel cell types rely on liquid or polymer electrolytes that suffer from poisoning
and thermal degradation, limiting the device applications [13,14]. Despite these advantages,
SOFCs have failed to find commercial success, mainly due to high materials costs resulting from
the high temperature operation. In order to increase their commercial viability, an intense area of
research focuses on optimizing the materials to reduce the overall cost of the SOFC device.
1.3.2 SOFC Materials
Electrolyte
The SOFC electrolyte plays the key role in conducting ionic species between the
electrodes, completing the electrical circuit. The material should have sufficiently high ionic and
low electronic conductivity to avoid a short circuit across the cell. Additionally, the material
must be stable in both oxidizing and reducing atmospheres at the operating temperature, and
capable of forming a thin, dense film. Currently, 8-mol% Y doped ZrO2 is the electrolyte of
choice for high temperature fuel cells due to its ionic conductivity, stability and compatibility
with other cell components. However, YSZ is limited to high temperature operation due to its
poor ionic conductivity at temperatures below 800°C. A target temperature for SOFC operation
is 500°C, reducing the requirement for high temperature materials and lowering the cost. As
well, this improves the balance of plant so that the generation of heat may be used for further
energy production, therefore maximizing efficiency of the device. These factors have led to the

13
development of several other materials for intermediate and low temperature SOFC electrolytes.
Promising candidates include doped-ceria materials as well as perovskites such as lanthanum
gallate and calcium titanate. Table 1.5 lists the most common SOFC electrolytes and their ionic
conductivities at 800°C in air [15].The electrolyte material used in this thesis work is 20 mol%
samarium doped ceria(SDC, (CeO2)0.80(Sm2O3)0.20), a doped ceria material with fluorite-type
structure. SDC functions well at intermediate to low temperatures, with an ionic conductivity of
S/cm at 500°C, but suffers from partial instability under the reducing atmosphere of
the anode [8,16]. The partial reduction of SDC in H2 at the anode side of the cell leads to current
leakage and an overall reduced open circuit voltage[16–18]. This is unfavorable however the
advantage of high ionic conductivity at low temperatures led the choice of SDC for this work. In
general, the electrolyte materials of today are adequately established, and are cheap enough to be
scaled for SOFC commercialization.
Table 1.5: Common electrolyte materials and their ionic conductivities at 800°C in air [15].
Electrolyte Material σi at 800°C ( S/cm)
(Y2O3)0.08(ZrO2)0.92 0.03
(ScO3)0.08(ZrO2)0.92 0.013
Ce0.8Gd0.2O1.9 0.053
Ce0.8Sm0.2O1.9 0.095
La0.9Sr0.1Ga0.8Mg0.2O2.85 0.1

14
Cathode
Materials for SOFC cathodes have been well established over the past 50 years, with
extensive work done to optimize conductivity, thermal stability and facilitating the oxygen
reduction reaction. Cathode materials should be chemically compatible with the electrolyte
system and also have sufficiently high conductivities (typically S/cm) to enhance
reactivity [5,8,15]. The combination of ionic and electronic conductivity is required to enhance
the size of the triple phase boundary (TPB), the reactive sites at the cathode where oxygen is
reduced and transferred to the electrolyte. Figure 1.3 illustrates the TPB reaction taking place at
the cathode side of a SOFC. In a purely electronic conducting cathode, such as La0.8Sr0.2MnO3
(LSM), the TPB sites are limited to the interface between cathode-electrolyte.
Today, the convention is to use an electronically conductive perovskite material mixed
with the electrolyte of choice, thus extending the TPB throughout the electrode and drastically
improving performance. For example, high temperature SOFCs typically use 50% w/w
La0.8Sr0.2MnO3/YSZ; a composite cathode to provide electronic conductivity from the perovskite
Figure 1.3: Triple Phase Boundary (TPB) reactive sites at the SOFC
cathode when using pure LSM.

15
and ionic conductivity from YSZ. At lower temperatures a composite cathode is also employed,
using 50% w/w La0.6Sr0.4Co0.2Fe0.8O3 (LSCF) and SDC. A complication arises from the use of
chromium containing interconnect materials, where the cathode can undergo Cr poisoning at
high temperatures in the oxidizing atmosphere [19]. Although the development of Cr tolerant
cathode materials is currently an area of interest, composite anodes of LSM and LSCF generally
have adequate performance for SOFC device applications.
Anode
The anode of the SOFC encounters the most rigorous conditions and requirements, and is
therefore a limiting factor in the commercialization of the device. The anodes crucial role lies in
providing reactive sites for fuel oxidation to occur in the presence of oxide anions delivered by
the electrolyte. The anode must be stable at high temperatures in reducing atmospheres
consisting of H2 to gaseous hydrocarbons, depending on the fuel source used. As well, the anode
must satisfy the same requirements as cathode materials, i.e. chemically compatible with the
electrolyte, thermally stable, and sufficiently high ionic and electronic conductivities at the
operating temperature. This must also be matched by maintaining fuel tolerance; the anode
material must be highly tolerant to carbon poisoning from hydrocarbon fuels and resistant to
sulfur in sour fuels. Clearly, the development of a cheap, suitable material for the SOFC anode is
a non-trivial task.
The conventional anode material used in high temperature SOFCs is a Ni-YSZ cermet.
Here, Ni provides reactivity for fuel oxidation and electronic conductivity whereas YSZ is used
to provide ionic conductivity and increase compatibility with the electrolyte. Similar to the
cathode, fuel oxidation occurs at the anode TPB where H2, and oxide anions react on the metal

16
catalyst to release electrons. In the case of Ni-YSZ cermets, YSZ extends the ionic conductivity
throughout the anode to allow for drastically increased area of the TPB. This is illustrated in
Figure 1.4.
Ni-YSZ anode materials perform quite well at temperatures greater than 800°C when
utilizing H2 fuels. For example, as of 2013 several companies currently market SOFC devices
utilizing Ni based anodes such as Bloom Energy (CA, USA) and Delphi (International). Ni-YSZ
cermet anodes are relatively cheap and effective but suffer from severe carbon and sulfur
poisoning when exposed to hydrocarbon or sour gas fuels [20–23]. Also, the low ionic
conductivity of YSZ restricts its use as an electrolyte to high operating temperatures. This
complicates the SOFC device from a commercialization standpoint; the restriction on fuels limits
the device to pure H2 or to the engineering of external fuel reformers, and the high temperature
operation requires the use of expensive ceramic supports.
The sulfur tolerance of several anode materials is investigated in this thesis work,
therefore the sulfur poisoning effect of an SOFC anode will be discussed more in depth than
coking. Ni-YSZ cermet anodes suffer severely when exposed to even ppm levels of sulfur,
Figure 1.4: Ni-YSZ cermet anode with enhanced TPB reaction
sites.

17
normally hydrogen sulfide, in the fuel stream. This is a serious issue for SOFC
commercialization since the world’s current natural gas sources contain anywhere from 50 ppm
to >1% H2S, as is shown in Table 1.6.
Table 1.6: Typical concentrations of H2S in natural gas [24].
Fuel type Typical composition H2S concentration
Syngas H2, CO, CO2, H2O, N2 100–300 ppm
Biogas H2, CO, CO2, CH4, H2O, N2 50–200 ppm
Sour Gas H2, CO2, N2, C2H6, CH4 >1%
The high sensitivity of Ni-YSZ to sulfur containing fuels is due to the affinity of the Ni
catalyst to undergo side reactions at elevated temperatures. At the operating temperature of a Ni-
based SOFC, H2S undergoes rapid adsorption and chemisorption at the TPB active sites on the
anode surface [20,22–24]. Many potential decomposition pathways for H2S have been
hypothesized, most of which involve the deposition of sulfur and formation of a nickel sulfide
species. A few commonly reported reactions for H2S are illustrated below [24]. The first reaction
involves direct oxidation of H2S, a favorable mechanism for the durability of the anode. The
second, however, leads to the formation of elemental sulfur at the TPB of the anode, ultimately
blocking the reactive sites. The third reaction involves high temperature reforming of H2S,
producing H2 fuel but also sulfur in the process.

18
[1.10]
[1.11]
[1.12]
As well, H2S can react directly with Ni to produce a nickel sulfide species, forming large
crystalline materials that may detrimentally alter the anode microstructure, conductivity and
performance [22,25]. A few of these possible reactions are listed below. The Ni-S materials may
also agglomerate and eventually lead to anode delamination. Interestingly, some studies have
shown that partial sulfidation of the Ni to nickel sulfide actually improves anode performance,
with higher power outputs and lower charge transfer resistances in 10% H2S than in pure H2 [26–
29]. This effect will be discussed further in Chapter 3.
[1.13]
[1.14]
Evidently, Ni cermets have many drawbacks as SOFC anode materials; therefore the
main area of SOFC research to date has been in the development of alternative anode materials,
with an emphasis on low temperature operation and coke/sulfur tolerance. The development of a
novel, catalytically active, fuel flexible anode material could allow SOFCs to operate on today’s
natural gas sources while maintaining a reasonable materials cost for commercialization.

19
Perovskite Anodes
Perovskites offer unique advantages over traditional metal-cermet type anodes and, in the
past decade, have been an area of extensive research in the SOFC field. The high temperature
stability, MIEC behavior and elemental flexibility of the perovskite structure are attractive
attributes for SOFC anode research.
One of the first and most widely studied perovskite anode materials is a doped chromate,
LSCM (La0.75Sr0.25Cr0.5Mn0.5O3), based the success of the LaCrO3 interconnect material. In 2003,
Tao and Irvine studied the p-type conductivity of LSCM and its stability in both oxidizing and
reducing atmospheres [30]. It was demonstrated as both an anode and cathode material for
symmetrical SOFCs with a suitable thermal expansion coefficient (TEC) for ceria and yttria
based electrolytes [31,32]. Unfortunately, its catalytic activity was deemed too low for practical
use. Nevertheless, the redox stability and high conductivity of LSCM in reducing atmospheres
led to a spur of research into perovskite type anodes. Many variants of lanthanum chromate have
been investigated that show promising performance, as listed in Table 1.7. For example, Sauvet
et al. investigated the effect of Sr and Ru concentrations in a La1-xSrxCr1-yRyO3 perovskite
system. The optimum performance was obtained when x=0.30 (Ru concentration had little
effect), with Rct values of 3.7 Ω cm2
in H2[33]. The inclusion of B site Ni was also investigated
and led to an anode material with high stability in methane that showed no carbon deposition
after testing. A wide range of chromium based systems have been investigated, all of which
exhibit high conductivities and Rct values comparable to Ni-YSZ, however their stability in
sulfur containing fuels is open to question.

20
Table 1.7: Performance of some Cr and Ti perovskite anodes in H2 and CH4.
Anode Fuel Temp. (°C) Rct (Ω*cm2) Ref.
La0.75Sr0.25Cr0.5Mn0.5O3
H2 900 0.26
[30]
CH4 900 0.87
La0.7Sr0.3Cr0.95Ru0.05O3/YSZ
H2 750 3.7
[33]
CH4 750 40
La0.75Sr0.25Cr0.5Mn0.5O3/GDC CH4 800 0.44 [34]
La0.5Sr0.5Ti0.5Ce0.5O3
H2 850 0.2
[23]
CH4 700 1.3
Another family of perovskites heavily investigated for SOFC anodes are the strontium
titanates. A and B site doped SrTiO3 materials have been demonstrated to have impressive
conductivities as well as high stabilities in a reducing atmosphere [23,35–38]. For example, Hui
et al. studied the effect of yttria and cobalt doping in SrTiO3 and found that
Sr0.85Y0.10Ti0.95Co0.05O3-δ has a total conductivity of 45 S/cm at 800°C with a large contribution
of ionic conductivity [37]. Marina et al. have employed heavily doped SrTiO3 based anodes
utilizing H2 fuels with polarization resistances as low as 0.2 Ω*cm2 at 850°C [23]. The
strontium titanates clearly display MIEC behavior and good catalytic performance although are
only partially tolerant to sulfur and carbon poisoning.

21
Currently, materials research has expanded beyond the chromates and titanates to more
diverse perovskite families. Two systems of interest for this thesis work are the ferrites and
molybdates. The inclusion of Fe at the B site has been shown to increase the conductivity and
catalytic activity in several perovskites [23,35,39,40]. As well, previous work in our group has
focused on the effect of A site Ce and B site transition metal doping in SmFeO3 [41–44]. The
inclusion of 5% Ce at the A site changes the material from a p to n type semiconductor and
stabilizes the perovskite in a reducing atmosphere. The inclusion of low level (3%) transition
metal doping at the B site makes these perovskites catalytically active for the oxidation of H2 and
CH4 and show high tolerance to coking. The performance of these materials as SOFC anodes is
summarized in Table 1.8. Although these anode materials function well in H2, no work has been
done on their tolerance to sulfur containing fuels.
Table 1.8: Performance summary for SmFeO3 anode materials in H2 and CH4.
Anode Fuel Temp. (°C) Rct (Ω*cm2) Ref.
Sm0.95Ce0.05FeO3
H2 500 0.65
[44]
CH4 550 15.85
Sm0.95Ce0.05Fe0.97Ni0.03O3
H2 500 ~4.5
[42]
CH4 500 61.1
Sm0.95Ce0.05Fe0.97Co0.03O3
H2 500 0.97
[41]
CH4 500 53.49
Recently, Mo based perovskites have shown very impressive performances as SOFC
anode materials [45–48]. As mentioned previously, the molybdates are some of the most

22
conductive perovskites found to date and Mo has also been shown to be catalytically active for
the oxidation of hydrogen as well as hydrocarbons and alcohols [45,48,49]. Perovskites utilizing
Mo at the B site are also typically regenerative anode materials; Mo readily undergoes a two
electron redox from Mo4+
/Mo6+
, useful for the removal of coke and sulfur impurities from the
anode [45]. In addition to high conductivities and catalytic reactivity, molybdates have similar
thermal expansion coefficients of several common electrolytes for intermediate temperature solid
oxide fuel cells (IT-SOFCs), making them even more attractive as anode materials [47]. The
doping of transition metals has also been shown to increase the ionic conductivity and anode
performance in several Mo perovskites [50]. For example, Zhao et al. investigated the effect of B
site Ni doping in the Sr2TiMo1-xNixO3-δ perovskite system, yielding high power densities and
polarization resistances as low as 0.305Ω*cm2 at 800°C [47]. The high performance of these
materials arises from the introduction of oxygen defects, hence increasing the ionic conductivity
of the perovskite. The optimization of ionic conductivity and catalytic activity of molybdenum
based perovskites may offer a new route to developing a fuel flexible IT-SOFC anode material.
1.4 Electrochemical Gas Sensors
1.4.1 Introduction and Description
The increasing population of our planet has directly led to the increase in manufacturing
and production of food and materials to meet our daily needs. This increase in manufacturing
also leads to more pollutants entering our atmosphere and reducing the quality of breathable air.
The control and monitoring of hazardous gases in industrial work places is becoming more and
more stringent. As well, the majority of our transportation methods rely on the operation of lean-
burn internal combustion engines. These engines require a constant monitoring of O2

23
concentration. This has led to the development of sensor materials for the detection of various
gases. Semi-conductor gas sensors, also known as conductometric sensors, function by a change
in material conductivity when exposed to various gases. These sensors are currently used in
many industrial facilities for detecting reducing and oxidizing gases as well as in the exhaust
manifolds of our vehicles.
Doped tin oxide, SnO2, is the main sensor material currently employed for the detection
of reducing gases such as H2, CO, CH4 etc. However SnO2 sensors suffer from poor stability in a
reducing atmosphere as well as poor reproducibility. TiO2 semi-conducting sensors have been
investigated as alternatives although these too have considerable drawbacks; TiO2 has a very low
sensitivity above 400°C, therefore limiting the operating temperature, and Ti also suffers from
oxidation issues in an oxidizing atmosphere [51,52]. Perovskites have been employed as
alternative materials for solid state gas sensors for the detection of oxidizing and reducing gases
[53]. The application of doped SmFeO3 sensors for the detection of reducing gases has been
investigated within our group [54,55]. The use of perovskites for the detection of oxygen is a
topic of interest for this thesis and is therefore discussed in detail in the following section.
1.4.2 Oxygen Sensors
Today’s automobiles typically operate on lean burn combustion engines in which the
concentration of O2 in the exhaust must be constantly monitored. A highly sensitive sensor is
required due to the constantly changing ratio of air to fuel (lambda value) injected into the
combustion engine. The concentration of oxygen is currently monitored using a zirconia based
material working as a lambda probe [56]. This probe functions by a change in material
conductivity when exposed to various concentrations of oxygen in the fuel exhaust. These

24
zirconia sensors have several drawbacks such as high cost and high temperature dependent
sensitivity. Therefore, much research in the past decade has focused on the development of
alternative O2 sensing materials for lean-burn exhaust systems. Metal oxides such as SnO2 and
TiO2 show promising sensitivity but maintain a temperature dependent sensitivity as well as long
term stability issues [57].
Perovskites of the type ABO3 are an excellent alternative to the zirconia sensors currently
employed. Several perovskites have been demonstrated to have impressive conductivities that are
also highly sensitive to the atmospheric concentration of O2. Some of these perovskites also
show a low temperature dependent sensitivity, making them attractive for conductometric
exhaust sensors [53,57,58]. The most commonly demonstrated perovskite sensor material is
SrTiO3, which shows typical n-type behavior at low partial oxygen pressure (pO2) and p-type
behavior at high pO2. SrTiO3 materials have demonstrated low temperature dependent O2
sensitivity through the incorporation of transition metal and rare earth metal dopants [59–62].
Specifically, the incorporation of B site Fe plays a key role in increasing the conductivity of
these materials, improving the operating range of pO2 as well as lowering the temperature
dependence of sensitivity [61,63–65]. Other alkali-earth titanates, such as CaTiO3 and BaTiO3,
have also been investigated as semi-conductor oxygen sensors. The defect structure of BaTiO3 is
very similar to SrTiO3 and it therefore behaves similarly but with a higher conductivity and
improved sensitivity [53,66,67]. Examples of some perovskite oxygen sensors are listed in Table
1.9.

25
Table 1.9: Examples of perovskite oxides investigated for the detection of oxygen.
Perovskite Ref.
SrTiO3 [53]
LaFe1-xCuxO3 [68]
La0.05Sr0.95Ti0.65Fe0.35O3-δ [69]
BaTi0.99Nb0.01O3 [65]
SrTi1-xFexO3-δ [61]
SrFeO2.5+x [58]
Aside from the titanates, ferrites have recently been shown to have impressive response
times and low temperature dependent sensitivities [61,69–72]. Un-doped alkali earth ferrites
such as SrFeO3 have been shown to have rapid equilibration with oxygen at relatively low
temperatures, indicating that these materials should have fast response times as resistive oxygen
sensors [58,61]. This work clearly demonstrates the potential of Fe based perovskites as
temperature independent O2 sensors.

26
1.5 References
[1] V. Goldschmidt, Naturwissenschaften 21 (1926) 477.
[2] C. Shinzer, Distortion of Perovskites (1998) URL: .http://www.ccp14.ac.uk/ccp/web-
mirrors/pki/uni/pki/members/schinzer/stru_chem/perov/di_gold.html
[3] A.S.B. Ruyan, G. Rustum, Mater. Res. Innov. (2000) 3.
[4] H. Iwahara, in:, T. Ishihara (Ed.), Perovskite Oxide Solid Oxide Fuel Cells, Springer US,
Boston, MA, 2009, pp. 45–63.
[5] J.T.S. Irvine, Perovskite Oxide for Solid Oxide Fuel Cells, Springer US, Boston, MA,
2009.
[6] I. Nagai, N. Shirakawa, S. Ikeda, R. Iwasaki, H. Nishimura, M. Kosaka, Appl. Phys. Lett.
87 (2005) 024105.
[7] S.C. Singhal, J. Mizusaki, Solid Oxide Fuel Cells IX, 2nd ed., The Electrochemical
Society, Pennington, New Jersey USA, 2005.
[8] S.C. Singhal, K. Kendall, High Temperature Solid Oxide Fuel Cells, Elsevier Ltd, New
York, USA, 2003.
[9] R.M. Ormerod, Chem. Soc. Rev. 32 (2003) 17.
[10] W. Nernst, Electrical Incandescent Lamp, US906550 A, 1897.
[11] W. Nernst, Glower for Electric Lamps, US 685 730, 1899.
[12] E. Baur, H. Preis, Ztschr. Elektrochem. 43 (1937) 727.
[13] G.F. Mclean, T. Niet, N. Djilali, Int. J. Hydrogen Energy 27 (2002) 507.
[14] E.H. Yu, U. Krewer, K. Scott, Energies 3 (2010) 1499.
[15] C. Sun, R. Hui, J. Roller, J. Solid State Electrochem. 14 (2009) 1125.
[16] H. Shi, W. Zhou, R. Ran, Z. Shao, J. Power Sources 195 (2010) 393.
[17] T. Miyashita, ECS Trans. 28 (2010) 39.
[18] T. Miyashita, Electrochem. Solid-State Lett. 14 (2011) B66.

27
[19] J. Richter, P. Holtappels, T. Graule, T. Nakamura, L.J. Gauckler, Monatshefte Für Chemie
- Chem. Mon. 140 (2009) 985.
[20] W.. Zhu, S.. Deevi, Mater. Sci. Eng. 362 (2003) 228.
[21] Y. Matsuzaki, I. Yasuda, Solid State Ionics 132 (2000) 261.
[22] Z. Cheng, J.-H. Wang, Y. Choi, L. Yang, M.C. Lin, M. Liu, Energy Environ. Sci. 4 (2011)
4380.
[23] C. Sun, U. Stimming, J. Power Sources 171 (2007) 247.
[24] M. Gong, X. Liu, J. Trembly, C. Johnson, J. Power Sources 168 (2007) 289.
[25] M. Lo Faro, V. Antonucci, P.L. Antonucci, a. S. Aricò, Fuel 102 (2012) 554.
[26] J.S. O’Brien, J.B. Giorgi, J. Power Sources 200 (2012) 14.
[27] C.M. Grgicak, J.B. Giorgi, J. Phys. Chem. C 111 (2007) 15446.
[28] C.M. Grgicak, R.G. Green, J.B. Giorgi, J. Power Sources 179 (2008) 317.
[29] C.M. Grgicak, M.M. Pakulska, J.S. O’Brien, J.B. Giorgi, J. Power Sources 183 (2008) 26.
[30] S. Tao, J.T.S. Irvine, Nat. Mater. 2 (2003) 320.
[31] S. Tao, J.T.S. Irvine, J. Electrochem. Soc. 151 (2004) A252.
[32] D.M. Bastidas, S. Tao, J.T.S. Irvine, J. Mater. Chem. 16 (2006) 1603.
[33] A. Sauvet, J. Fouletier, Electrochem. Commun. 47 (2001) 987.
[34] S.P. Jiang, X.J. Chen, S.H. Chan, J.T. Kwok, J. Electrochem. Soc. 153 (2006) A850.
[35] D.P. Fagg, V. V Kharton, A. V Kovalevsky, A.P. Viskup, J. Eur. Ceram. Soc. 21 (2001)
1831.
[36] S. Hui, A. Petric, J. Eur. Ceram. Soc. 22 (2002) 1673.
[37] S. Hui, A. Petric, Mater. Res. Bull. 37 (2002) 1215.
[38] S. Suthirakun, G. Xiao, S.C. Ammal, F. Chen, H.-C. zur Loye, A. Heyden, J. Power
Sources 245 (2014) 875.
[39] O. Paper, J. Solid State Electrochem. 3 (1998) 7.

28
[40] A. Sin, E. Kopnin, Y. Dubitsky, A. Zaopo, A.S. Aricò, L.R. Gullo, D. La Rosa, V.
Antonucci, J. Power Sources 145 (2005) 68.
[41] S.M. Bukhari, J.B. Giorgi, ECS Trans. 33 (2011) 81.
[42] S.M. Bukhari, J.B. Giorgi, ECS Trans. 35 (2011) 1539.
[43] S.M. Bukhari, J.B. Giorgi, Solid State Ionics 180 (2009) 198.
[44] S.M. Bukhari, J.B. Giorgi, J. Power Sources 198 (2012) 51.
[45] Q. Liu, D.E. Bugaris, G. Xiao, M. Chmara, S. Ma, H.-C. zur Loye, M.D. Amiridis, F.
Chen, J. Power Sources 196 (2011) 9148.
[46] T.G. Howell, C.P. Kuhnell, T.L. Reitz, a. M. Sukeshini, R.N. Singh, J. Power Sources 231
(2013) 279.
[47] B. He, Z. Wang, L. Zhao, X. Pan, X. Wu, C. Xia, J. Power Sources 241 (2013) 627.
[48] Y.-H. et al. Huang, Science (80-. ). 312 (2006) 254.
[49] J. Kubo, W. Ueda, Mater. Res. Bull. 44 (2009) 906.
[50] R. Martínez-Coronado, J. a. Alonso, a. Aguadero, M.T. Fernández-Díaz, Int. J. Hydrogen
Energy (2013) 1.
[51] H.-S. Kim, W.-T. Moon, Y.-K. Jun, S.-H. Hong, Sensors Actuators B Chem. 120 (2006)
63.
[52] C. Lu, Z. Chen, Sensors Actuators B Chem. 140 (2009) 109.
[53] J.W. Fergus, Sensors Actuators B Chem. 123 (2007) 1169.
[54] S.M. Bukhari, J.B. Giorgi, J. Electrochem. Soc. 158 (2011) J159.
[55] S.M. Bukhari, J.B. Giorgi, Sensors Actuators B Chem. 181 (2013) 153.
[56] P.T. Moseley, Sensors Actuators B Chem. 6 (1992) 149.
[57] R. Moos, F. Rettig, A. Hürland, C. Plog, Sensors Actuators B Chem. 93 (2003) 43.
[58] M.L. Post, B.W. Sanders, P. Kennepohl, Sensors Actuators B Chem. 14 (1993) 13.
[59] C. Yu, Y. Shimizu, H. Arai, Sensors and Actuators 14 (1988) 309.
[60] W. Menesklou, K.H. Hardtl, E. Ivers-tiffee, Sensors Actuators B Chem. 59 (1999) 184.

29
[61] A. Rothschild, S.J. Litzelman, H.L. Tuller, W. Menesklou, T. Schneider, E. Ivers-Tiffée,
Sensors Actuators B Chem. 108 (2005) 223.
[62] R. Moos, W. Menesklou, K.H. Hardtl, Sensors Actuators B Chem. (2000) 178.
[63] J. Gerblinger, H. Meixner, Sensors Actuators B Chem. 6 (1992) 231.
[64] F. Rettig, R. Moos, C. Plog, J. Electroceramics (2004) 733.
[65] U. Lampe, J. Gerblinger, H. Meixner, Sensors Actuators B Chem. 7 (1992) 787.
[66] J. Jeong, E.J. Lee, Y.H. Han, J. Eur. Ceram. Soc. 27 (2007) 1159.
[67] T. Ishihara, K. Kometani, Y. Nishi, Y. Takita, Sensors Actuators B Chem. 28 (1995) 49.
[68] R. Moos, F. Rettig, Resistiver Sauerstoffsensor, DE 10114645 C1, 2003.
[69] K. Sahner, R. Moos, N. Izu, W. Shin, N. Murayama, Sensors Actuators B Chem. 113
(2006) 112.
[70] A. Rothschild, W. Menesklou, H.L. Tuller, E. Ivers-tiffe, Chem. Mater. (2006) 3651.
[71] J.J. Tunney, M.L. Post, J. Electroceramics 51 (2000) 63.
[72] J.J. Tunney, M.L. Post, X. Du, D. Yang, J. Electrochem. Soc. 149 (2002) H113.

30

31
Chapter 2
Experimental Considerations
2.1 Summary
This chapter aims to cover the general methodologies and experimental techniques
utilized throughout this thesis work. The majority of techniques were universal throughout each
chapter/for each material and will therefore be covered in a general sense, however detailed
descriptions of materials and methods used are available at the beginning of Chapters 3-5.
2.2 Synthetic Route
Generally, the synthesis of perovskites is a straightforward procedure with few chemical
steps. Several synthetic routes are utilized throughout the literature however the solid state and
sol-gel methods are most commonly used. The solid state method is sometimes referred to as the
‘shake and bake’ synthetic route; solid, metal oxide precursors are thoroughly mixed and then
calcined to high temperature to form the perovskite phase. This synthetic route is facile, however
it requires a high temperature calcination, typically >1500°C, leading to large crystal/particle
sizes and therefore a lower surface area for the perovskite [1,2]. As well, metal evaporation from
the sample can alter the desired stoichiometry of the perovskite and the high temperature
calcination requires sophisticated equipment and immense energy. Additionally, several
intermediate grindings/calcinations may be required to adequately combine precursor materials
and obtain a single phase perovskite.
All perovskites investigated in this work were prepared via a sol-gel route. The sol-gel
method utilizes a homogeneous mixing of precursor solutions followed by solvent evaporation
and finally calcination to obtain the perovskite phase. This method allows for complete mixing

32
of starting materials with the help of a binding agent, requiring a lower temperature calcination
to obtain the perovskite in single phase [3]. This ultimately leads to a material with smaller
crystallite size and higher surface area.
Precursor materials are conventionally hydrated nitrates of the A and B site metals as
well as a binding agent, citric acid in this case. Nitrates are used as opposed to anionic salts to
avoid the incorporation of impurities that may remain in the perovskite structure following
calcination. The general procedure involves individual dissolution of precursor metal nitrates in
~ 100 mL distilled H2O followed by combination with aqueous citric acid under vigorous
stirring. The ratio of citric acid to total metal ion is 1:1 to ensure adequate binding of precursors.
The solution is then stirred overnight with heating at ~100°C to evaporate the solvent, resulting
in a gelatinous citrate precursor. The gel precursor is then ground with a mortar and pestle,
placed in a crucible and calcined in a high temperature furnace to remove the organic binder.
Calcination temperatures required for obtaining the perovskite phase varied depending on the
materials used. Typically a temperature of 600-950°C was adequate. Post calcination, the
perovskite is thoroughly ground and structurally/electrochemically characterized.
2.3 Material Characterization Techniques
2.3.1 X-Ray Diffraction
X-Ray diffraction is one of the most commonly used characterization techniques in solid-
state materials chemistry. All perovskite samples prepared in this thesis were characterized via
powder X-ray Diffraction (p-XRD). p-XRD is a valuable tool for the quantitative determination
of the crystalline parameters for each sample as well as providing qualitative evidence regarding
the purity of the perovskite. XRD works on the principle of Bragg’s Law, where incident X-Rays

33
diffract within a crystal lattice to form a constructive interference pattern. The interference
pattern witnessed from a sample is directly related to the wavelength of radiation used and the
path length, as is shown in Equation 2.1. Here, dhkl refers to the interspaced distance of lattice
planes within the crystal structure, n is and integer, θ is the incident photon angle and λ is the
radiation wavelength. Crystallite sizes were calculated according to the Scherrer equation
(Equation 2.2). Here, is the crystallite size, K is a peak shape factor, λ is the radiation
wavelength, β is the peak broadening at half maximum and θ is the Bragg angle.
A Philips PW 1830 powder diffractometer was used to determine the phase composition
of the perovskite powders in this work. The instrument used CuKα radiation (λ=1.54 Å) and the
scattering angle, 2θ, was scanned between 13-90° at a rate of 0.02°/s. The resulting diffractogram
was then completely analyzed using the Panalytical X’PertHighscore Plus software. This
software allows for phase indexing to the ICDD Powder Diffraction File database (PDF-4+,
2012) as well as refinement of the diffractogram to determine the lattice parameters of the
perovskite unit cell. The refinement was performed using the Reitveld method, where a
calculated diffraction pattern is mathematically fit to the experimental spectrum. The Reitveld
method utilizes a least-squares fitting procedure, altering specific profile parameters to minimize
the residual difference between calculated and experimental patterns [4,5].
[2.1]
[2.2]

34
2.3.2 Scanning Electron Microscopy
Scanning electron microscopy (SEM) is employed to a large degree in this thesis work.
SEM was used to image the as-prepared powders, sintered pellets for conductivity and sensor
experiments, as well as fuel cell anode morphologies before and after testing. Coupled to the
SEM, energy dispersive spectroscopy (EDS) was used to qualitatively determine the elemental
composition of samples. The electron microscope model used is a JEOL JSM-7500 Field
Emission SEM with an EDS X-sight attachment.
Samples were prepared on graphite paste or with carbon tape, and no additional coating
was applied in order to maintain original microstructure. For fuel cell samples, the button cell
was mechanically cracked and mounted horizontally for cross sectional imaging. Imaging was
primarily performed in LEI mode, collecting both secondary and backscattered electrons to
maximize topographical detail. Acceleration voltage and probe current were adjusted
accordingly to avoid sample charging while optimizing resolution. Typical conditions for
perovskite powders were: acceleration voltage between 1-2.0 kV, probe current of 8 mA, and a
working distance between 7-9 mm. Image exposure time was normally set to 12 seconds. These
conditions generally gave adequate resolution up to ~100 000x magnification. For EDS analysis,
acceleration voltage was increased to 15-20.0 kV and spectra were recorded in the INCA
software. Due to the requirement of 15-20 kV acceleration voltage, EDS measurements are
generally performed at magnifications less than 10 000X. This is due to the increased beam spot
size when using higher acceleration voltage on the sample. Single spot EDS analysis was
generally performed however line analyses were sometimes employed to probe a larger area.

35
2.4 Conductivity Measurements
2.4.1 4-Point Conductivity
Electronic conductivities of all perovskite materials were measured using a 4-point
method on dense, sintered pellets. The 4-point method was chosen in order to avoid contact
resistance issues, thereby improving measurement accuracy [6]. Pellets of the perovskites were
prepared by weighing between 4-6 grams of sample into a 1 inch die press and pressing to 10
000 – 20 000 lbs using a Carver laboratory press. Masses and pressures specific to each material
are included in respective Experimental sections of Chapters 3-5. The perovskites were pressed
for ~2 minutes and then placed on individual zirconia discs for sintering. Sintering was
performed in a Thermolyne 46100 high temperature furnace to temperatures between 1200-
1400°C for 4 hrs. Heating and cooling ramp rates were kept low, usually 2°C/min, in order to
avoid cracking the pellet.
Following sintering, the pellets were mechanically cut using a high-speed Dremel
equipped with a diamond cutting blade. A rectangular shape, with dimensions generally 12 mm x
6 mm x 1 mm, was chosen to simplify electrode placement. Four small, evenly spaced grooves
were cut into the exterior of the pellet followed by wrapping with Pt wire. Each section of Pt
wire was tightly bound to the pellet surface and subsequently painted over with Pt paste to ensure
a good electrode contact. The pellet was then fired at 800°C for 1 hr with heating/cooling ramp
rates of 2°C/min to remove the organic binder from the Pt paste. Figure 2.1 shows a schematic of
a pellet prepped for conductivity measurement.

36
The pellet is then mounted inside a quartz tube, with 4 lengths of Pt wire serving as leads
to the pellet electrodes. The quartz tube is contained within a horizontal tube furnace controlled
by a Barber-Colman temperature controller with K-type thermocouple. The quartz tube is sealed
on either end with rubber septa, with one end providing a gas inlet and the other an exhaust tube.
The atmosphere within the quarts sample chamber was controlled using Alicat Mass flow
controllers attached to a 2-way Swagelok fitting allowing for the mixing of gases. The gas flow
rate over the pellet was kept a constant 50 sccm. The 4 Pt leads extend from the quartz tube,
with 2 attached to a power supply and 2 to a digital multi-meter. The power supply provided a
constant current of 100 mA to the outer electrodes and the multi-meter measured the voltage
drop across the inner 2 electrodes. Figure 2.2 shows a pellet mounted inside the tube furnace,
ready for measurement. Rubber septa and gas lines are omitted from the figure for simplicity.
Figure 2.1: Pellet setup for 4-point conductivity measurement.

37
The gases used for conductivity measurements were typically compressed air or oxygen
for oxidizing atmospheres and H2 or 5% H2/95%N2 for a reducing atmosphere. Before
recording conductivity measurements, the pellets were ramped to 1000°C in the gas of interest
for approximately 4 hours and then cooled to room temperature. This pre-heating of the sample
leads to more reliable measurements for the following ramp cycles and checks for possible
changes upon initial exposure. The temperature was ramped in 50 or 100°C increments and the
sample was allowed to equilibrate for at least 30 mins at each temperature. To ensure
reproducibility, measurements were made on multiple cycles of both heating and cooling of the
furnace. The average voltage drop across the sample was then used to calculate the material
resistivity according to Ohm’s law and the dimensions of the pellet. Finally, the conductivity in
units of S/cm is calculated from the inverse of resistivity.
Figure 2.2: Sample setup for 4-point conductivity measurement.
38
2.4.2 Ionic vs. Electronic Conductivity Measurements
The contributions of ionic and electronic conductivity to the total conductivity were
measured using a 2-point contact method with an Al blocking electrode. The Al blocking
electrode stops the flow of O2-
species through the sample therefore the measured conductivity is
purely electronic. The ionic conductivity is then inferred from the difference between total and
electronic conductivities as is shown in Equation 2.3.
Similar to the 4-point measurements, 2-point conductivities were measured on dense,
sintered pellets of the perovskites. To make the pellets, ~2 grams of sample was weighed into a
die and pressed to 15 000 lbs using a Carver laboratory press. The pellets were then sintered on
zirconia discs to 1200°C for 4 hrs with heating/cooling ramp rates of 2°C/min. For total
conductivity measurements, Pt mesh current collectors (Alfa Aesar, 99.9%) were painted onto
either side of a pellet using Pt paste followed by removal of the organic binder at 800°C for 1 hr.
For the use of Al blocking electrodes, a similar procedure was followed on two separate
perovskite pellets along with the insertion of a thin film of Al. The entire ‘sandwiched’ array is
then heated to 660°C to partially soften the Al film and ensure good contact between the pellets.
Figure 2.3 illustrates the pellet setups for 2-point measurements (b) with and (a) without Al
blocking electrodes. The Pt leads in this case are attached directly to a power supply providing a
constant current of 100 mA and measuring the voltage across the sample.
[2.3]

39
The volume resistivity, ρ, of the material is calculated according to Equation 2.4. Here, R
is the electrical resistance as calculated from Ohm’s law, l is the sample thickness and A is the
cross sectional area of the pellet. The conductivity, σ, is then calculated as the inverse of
resistivity, shown in Equation 2.5. Similar to the 4-point method, samples were pre-heated and
cooled in the atmosphere of interest followed by measurement on multiple heating and cooling
cycles to ensure reproducibility.
[2.4]
[2.5]
2.5 Sensor Experiments
Sensor experiments were performed on sintered pellets of perovskites using a 4-point
contact method. The experimental setup was identical to that of the 4-point conductivity
measurements described in section 2.4.1. The conductivity of the material was recorded at 1 min
intervals while changing the concentration of test gas flowing through the quartz sample tube.
The total gas flow rate was a constant 50 sccm, maintained with a balance of compressed air.
Figure 2.3: Pellet setup for 2-point conductivity measurements.

40
The sensor response, S, was calculated from the ratio of relative conductivity change according
to Equation 2.6.
[2.6]
2.6 Fuel Cell Testing and Considerations
2.6.1 Button Cell Fabrication
The fuel cells fabricated in this thesis work used a thick, electrolyte supported button cell
with a 3 electrode design. The anode and cathode are positioned symmetrically on either side of
a ~2 mm SDC-20 disc with a Pt wire wrapped horizontally around the electrolyte to serve as a
reference electrode. The button cell configuration is outlined in Figure 2.4.
The main area of focus for this work is in the comparison of anode performance,
therefore it is critical to measure anode specific processes separate from the full cell [7,8]. This is
made possible by using a reference electrode, Pt in this case. Computational and experimental
studies have shown that, when using a reference electrode, cell geometry must meet several
requirements in order to produce reliable data [9,10]. For instance, the alignment of cathode and
anode is a crucial parameter when fabricating button cells with electrolytes less than ~200 µm.
Misalignment of anode and cathode electrodes must not exceed ‘electrolyte thicknesses’, in
order to avoid overpotential errors. In this work, the thick electrolyte allows for more error in
alignment; however the electrode alignment is still controlled to the highest degree possible by
the use of pre-fabricated masks. As well, the reference electrode is positioned ~ 3 ‘electrolyte
thicknesses’ away from both the cathode and anode, reducing cross talk and ensuring electrical
isolation. The use of a thick electrolyte, however, necessarily limits the maximum current and

41
power output of the fuel cell. As mentioned, this work focuses on a comparison of anode
performances, therefore the relative power densities are considered more important than the
absolute value of peak cell power.
To make the electrolyte, 6 grams of SDC-20 were weighed into a 1 inch die and pressed
to 10 000 lbs using a Carver laboratory press. The pellets were then sintered on zirconia discs to
1400°C for 4 hrs with ramp rates of 2°C/min, resulting in an electrolyte thickness of 2 mm. To
form the anode, a slurry of perovskite powder was prepared in an emulsion consisting of 20%
v/v Triton X-100 and 80% H2O. The slurry was then painted on one side of the SDC electrolyte
in a cast area of 1.5 cm2 using a mask of the appropriate dimensions and fired at 1400°C for 4 hrs
with heating/cooling ramp rates of 2°C/min. In the case of co-sintered anodes, the slurry is
prepared in an identical manner but cast painted before sintering the electrolyte. A Pt mesh
current collector was then added with additional perovskite slurry and fired again at 1400°C in a
similar manner. This leads to a well adhered anode ~100 µm in thickness.
The cathode consists of 50% w/w LSCF (fuelcellmaterials.com) and 50% SDC-20. The
addition of SDC forms a composite cathode to increase performance as outlined in Chapter 1. To
Figure 2.4: Schematic of the SOFC button cell geometry used in this work.

42
form the cathode, a slurry was prepared in an emulsion of Triton X-100 and H2O (same ratios as
anode) and painted in a cast area of 1.5 cm2 on the electrolyte opposite the anode. The cell was
sintered at 1400°C with heating/cooling ramp rates of 2°C, followed by addition of a Pt mesh
current collector and additional slurry/re-firing. The cathode thickness is also ~100 µm.
The reference electrode consists of Pt wire wrapped around the circumference of the SDC
electrolyte. The Pt wire is tightly bound and painted over with Pt paste followed by removal of
the organic binder at 800°C for 1 hr with heating/cooling ramp rates of 2°C/min. This completes
the button cell fabrication.
2.6.2 Fuel Cell Setup and Electrochemical Considerations
The setup used for fuel cell testing is depicted in Figure 2.5. The apparatus
consists of a stainless-steel Ultra-Torr fitting sealed to an alumina support tube with a Viton o-
ring. The Ultra-Torr fitting is custom-fit to a Swagelok manifold allowing for the mixing of up to
3 gases. Extending from the manifold (not shown), Swagelok lines connect to MKS mass flow
controllers for various gases including; H2, N2 and H2S. The alumina support tube is ~ 30 cm tall,
atop of which sits the button cell. Within the support tube, a smaller diameter alumina tube
carries fuel gas to the anode side of the button cell. The exhaust travels back down the outer
alumina support tube to an exhaust port, venting to the back of the fume hood. Atop the alumina
support, the button cell is attached via a Pyrex glass seal to ensure isolation from air. A short
section of alumina tube was used as a weight to facilitate the sealing of the cell. The cathode side
of the cell is open to air. This entire setup is mounted vertically in a tube furnace controlled by a
Barber-Colman temperature controller with K-type thermocouple. Inside the furnace, a Faraday
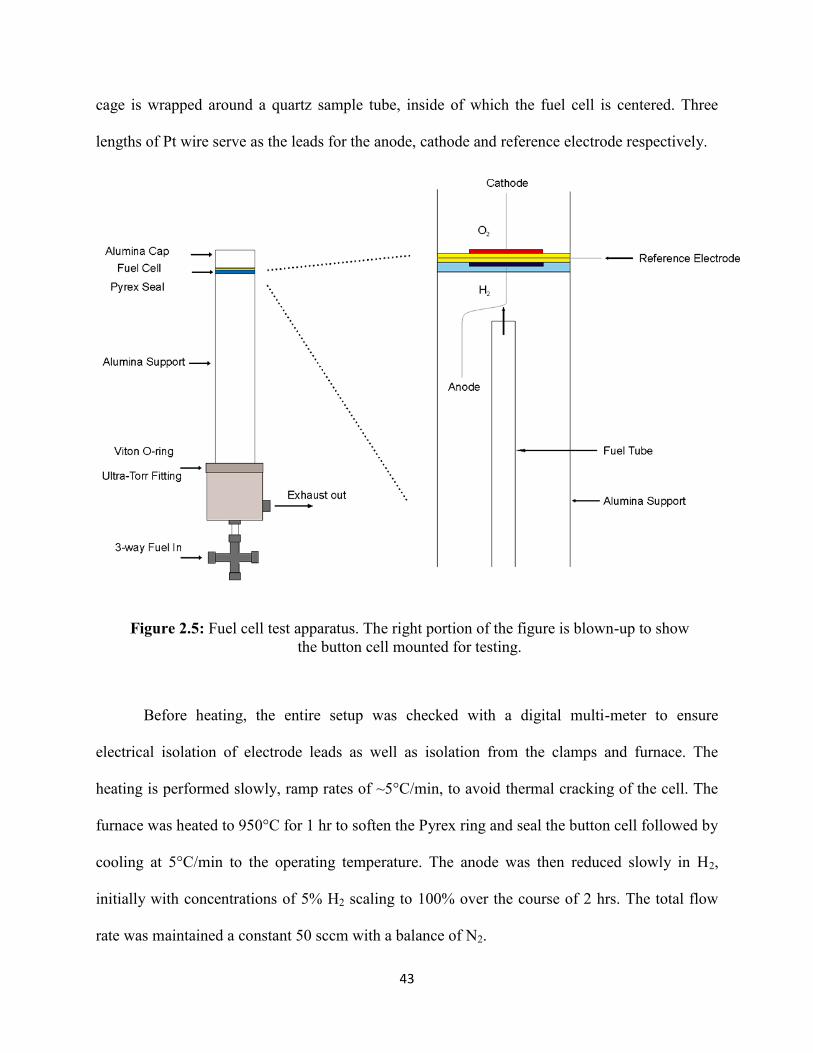
43
cage is wrapped around a quartz sample tube, inside of which the fuel cell is centered. Three
lengths of Pt wire serve as the leads for the anode, cathode and reference electrode respectively.
Before heating, the entire setup was checked with a digital multi-meter to ensure
electrical isolation of electrode leads as well as isolation from the clamps and furnace. The
heating is performed slowly, ramp rates of ~5°C/min, to avoid thermal cracking of the cell. The
furnace was heated to 950°C for 1 hr to soften the Pyrex ring and seal the button cell followed by
cooling at 5°C/min to the operating temperature. The anode was then reduced slowly in H2,
initially with concentrations of 5% H2 scaling to 100% over the course of 2 hrs. The total flow
rate was maintained a constant 50 sccm with a balance of N2.
Figure 2.5: Fuel cell test apparatus. The right portion of the figure is blown-up to show
the button cell mounted for testing.

44
2.6.3 Electrochemical Testing
Data Collection
The 3 electrode leads (anode, cathode and reference) are attached to a potentiostat
(VoltaLab, 40 PGZ301) for electrochemical measurements. The VoltaLab is controlled via a
computer, running VoltaMaster 4 electrochemistry program. The VoltaMaster software allows
for the collection of data from various programs that may be sequenced and repeated multiple
times.
Electrochemical experiments performed include: open circuit voltage (OCV),
electrochemical impedance spectroscopy (EIS) and current amperometry experiments (CA) at
various overpotentials. The OCV experiment measures cell potential between anode and cathode
vs. time under no applied load. OCV values in this work are low due to the electrolyte used in
fabricating the button cells. As discussed previously, the cells constructed for this work use an
SDC-20 electrolyte. SDC is known to undergo partial reduction when in a reducing atmosphere
at the anode side of the fuel cell. This partial reduction leads to current leakage across the
electrolyte and a lower OCV value [11,12]. As well, SDC has issues of low densification, further
affecting the OCV of the cell [13]. These drawbacks of using an SDC electrolyte are outweighed
by its high ionic conductivity at low temperatures, making it the electrolyte of choice for SOFCs
studied in this work. As well, these issues do not affect the results obtained in the following work
since the focus is on anode performance comparison, where impedance of the anode versus
reference electrode is the most relevant experiment.
Before running a programmed sequence, the cell was checked to ensure both an adequate
sealing of the Pyrex and a good electrode contact. To gauge the quality of seal obtained, an OCV
experiment was performed for ~2 mins at the operating temperature. If the OCV value was

45
stable, and above 0.95 V, the cell was deemed to be adequately sealed. As well, a single
impedance spectrum was collected at OCV at the operating temperature to check the serial
resistance (Rs) of the cell. If the Rs value was acceptable, < 50 Ω*cm2
at 500°C, the anode was
deemed to have an adequate interfacial contact with the electrolyte and the cell was run for a full
battery of experiments. A general programmed sequence of tests involved 20 mins OCV, 6
repeated impedance spectra at OCV in frequencies of 100 kHz to 100 mHz with AC amplitude of
50 mV, and CA experiments at overpotentials of 1000 mV to 0 mV in 50 mV increments. This
entire sequence was repeated 7 times for a total experiment time of ~ 14 hrs. In this period it is
possible to avoid any changes due to microstructural/poisoning effects. Performance after this
time is typically stable therefore values obtained after 14 hrs are typically compared.
Analysis
The 20 mins of OCV data recorded every 2 hours were averaged and plotted versus time.
Power density plots were calculated according to where V is the applied overpotential
and I is the average current density recorded.
Impedance spectra were collected as Nyquist plots and analysed in the ZView2 software
(Scribner Associates). An equivalent circuit model, shown in Figure 2.6, was chosen to fit the
high frequency arc of the Nyquist plot. This equivalent circuit model can be abbreviated as
(L1RS[RCTCPE1]) where L1 is an inductor to account for impedance of electrode leads and CPE1
is a constant phase element. The constant phase element is arbitrarily developed to fit typical
Nyquist plots of SOFC anodes, primarily the characteristic depressed semi-circle arc. The
depressed semi-circle is caused from several overlapping processes, mainly an electrode surface
with high roughness and inhomogeneous microstructure [14–16]. The anodes prepared in this
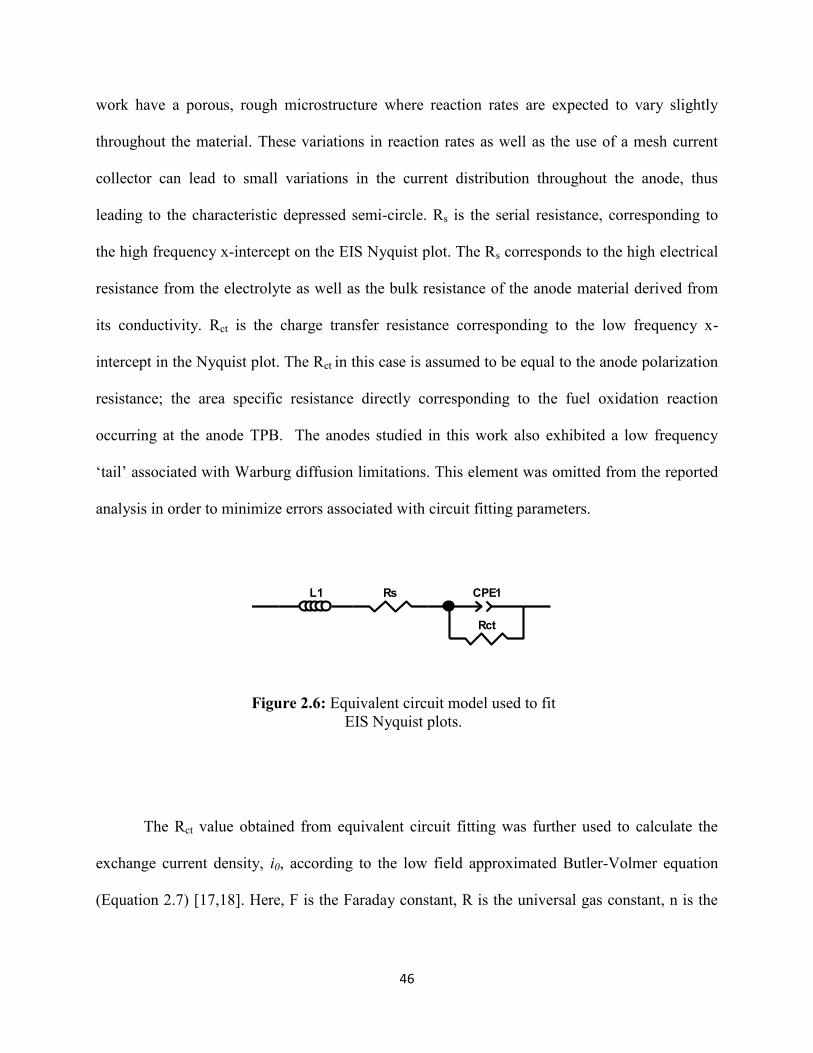
46
work have a porous, rough microstructure where reaction rates are expected to vary slightly
throughout the material. These variations in reaction rates as well as the use of a mesh current
collector can lead to small variations in the current distribution throughout the anode, thus
leading to the characteristic depressed semi-circle. Rs is the serial resistance, corresponding to
the high frequency x-intercept on the EIS Nyquist plot. The Rs corresponds to the high electrical
resistance from the electrolyte as well as the bulk resistance of the anode material derived from
its conductivity. Rct is the charge transfer resistance corresponding to the low frequency x-
intercept in the Nyquist plot. The Rct in this case is assumed to be equal to the anode polarization
resistance; the area specific resistance directly corresponding to the fuel oxidation reaction
occurring at the anode TPB. The anodes studied in this work also exhibited a low frequency
‘tail’ associated with Warburg diffusion limitations. This element was omitted from the reported
analysis in order to minimize errors associated with circuit fitting parameters.
The Rct value obtained from equivalent circuit fitting was further used to calculate the
exchange current density, i0, according to the low field approximated Butler-Volmer equation
(Equation 2.7) [17,18]. Here, F is the Faraday constant, R is the universal gas constant, n is the
L1 Rs CPE1
Rct
Element Freedom Value Error Error %
L1 Fixed(X) 0 N/A N/A
Rs Fixed(X) 0 N/A N/A
CPE1-T Fixed(X) 0 N/A N/A
CPE1-P Fixed(X) 1 N/A N/A
Rct Fixed(X) 0 N/A N/A
Data File:
Circuit Model File: C:\Users\wpenw039\Desktop\1.mdl
Mode: Run Simulation / Freq. Range (0.001 - 1000000)
Maximum Iterations: 100
Optimization Iterations: 0
Type of Fitting: Complex
Type of Weighting: Calc-Modulus
Figure 2.6: Equivalent circuit model used to fit
EIS Nyquist plots.

47
number of electrons involved in the process and T is the temperature. The exchange current
density values were calculated for all anode materials and tabulated with the EIS data.
[2.7]

48
2.7 References
[1] A. Feldhoff, M. Arnold, J. Martynczuk, T.M. Gesing, H. Wang, Solid State Sci. 10
(2008) 689.
[2] H. Taguchi, M. Nagao, K. Tanihata, J. Am. Ceram. Soc. 202 (1992) 201.
[3] M. Niederberger, N. Pinna, J. Polleux, M. Antonietti, Angew. Chemie 43 (2004) 2270.
[4] H.M. Rietveld, J. Appl. Crystallogr. 2 (1969) 65.
[5] H.M. Rietveld, Aust. J. Phys. 41 (1988) 113.
[6] T.R. Kuphaldt, in:, Lessons Electr. Circuits, Fifth Edit, 2006, p. 282.
[7] V. Krishnan, Solid State Ionics 166 (2004) 191.
[8] S. McIntosh, J.M. Vohs, R.J. Gorte, J. Electrochem. Soc. 150 (2003) A1305.
[9] S. Crystal, Solid State Ionics 67 (1994) 215.
[10] J. Rutman, I. Riess, Electrochim. Acta 52 (2007) 6073.
[11] T. Miyashita, ECS Trans. 28 (2010) 39.
[12] T. Miyashita, Electrochem. Solid-State Lett. 14 (2011) B66.
[13] H. Shi, W. Zhou, R. Ran, Z. Shao, J. Power Sources 195 (2010) 393.
[14] S. Koch, M. Mogensen, P. V. Hendriksen, N. Dekker, B. Rietveld, Fuel Cells 6 (2006)
117.
[15] S. Gewies, W.G. Bessler, J. Electrochem. Soc. 155 (2008) B937.
[16] T. Nakamura, T. Kobayashi, K. Yashiro, A. Kaimai, T. Otake, K. Sato, J. Mizusaki, T.
Kawada, J. Electrochem. Soc. 155 (2008) B563.
[17] D. a. Noren, M. a. Hoffman, J. Power Sources 152 (2005) 175.
[18] D.R. Peterson, J. Winnick, J. Electrochem. Soc. 145 (1998) 1449.
49
Chapter 3
Conductivity of Cerium Doped BaFeO3-δ and Applications for the Detection of Oxygen
The contents of this chapter have been published as:
W.D. Penwell, J.B. Giorgi, Sensors Actuators B Chem. 191 (2014) 171.
Abstract
The effect of Ce doping on the structure and the conductivity of BaFeO3 perovskite
materials is investigated and the resulting materials are applied as oxygen sensors. The new
perovskite family, Ba1-xCexFeO3-δ (x=0, 0.01, 0.03, and 0.05), was prepared via a sol-gel
method. Powder XRD indicates a hexagonal structure for BaFeO3 with a change to a cubic
perovskite upon Cerium doping at the A site. The solubility limit of Ce at the A site was
experimentally determined to be between 5-7 mol %. Bulk, electronic and ionic conductivities of
BaFeO3-δ and Ba0.95Ce0.05FeO3-δ were measured in air at temperatures up to 1000˚C. Cerium
doping increases the conductivity throughout the entire temperature range with a more
pronounced effect at higher temperatures. At 800˚C the conductivity of Ba0.95Ce.05FeO3-δ reaches
3.3 S/cm. Pellets of Ba0.95Ce.05FeO3-δ were tested as gas sensors at 500 and 700˚C and show a
linear, reproducible response to O2.
3.1 Introduction
Perovskites of the type ABO3 where A=lanthanide and B=transition metal have been
demonstrated for a range of applications such as catalysis, anode/cathode materials for solid
oxide fuel cells (SOFCs) and electrochemical gas sensors [1–4]. Substitution of various cations
into the A and B sites allows for fine tuning of the material properties to better suit the
application. The inclusion of alkaline earth metals at the A site has shown to produce oxides with

50
high electronic as well as ionic conductivity [5,6]. These mixed electronic and ionic conductors
(MIECs) are of current interest as cathode materials for SOFCs due to their stability and
conductivity in high temperature oxidizing atmospheres.
These parameters are equally important in the field of electrochemical gas sensors, where
p-type semiconductors are used for the detection of oxidizing gases such as O2, NO2 and ozone
[3,7]. In particular, the development of temperature independent O2 sensors is an area of intense
research for the automobile industry. The measurement of pO2 in automobile exhaust systems is
currently performed using expensive zirconia based lambda sensors [8]. To reduce
manufacturing costs, several groups have focused on semiconducting oxides that show resistivity
dependency towards pO2. Materials based on TiO2 and CeO2 have been investigated along with
several perovskite materials that show promising temperature independent O2 sensor behavior
[9–11]. For example, perovskite materials LaCu0.3Fe0.7O3−δ and La0.05Sr0.95Ti0.65Fe0.35O3−δ have
been demonstrated as O2 sensors with low temperature dependency and fast response times [12].
Also, a previous study showed that doping BaFeO3 with Ta increases its sensitivity towards pO2
while maintaining a temperature independent response [13]. Post et al. explored the non-
stoichiometric SrFeO3-x system showing that not only is the equilibrium between the oxide ions
and the gas phase directly related to sensor sensitivity, but also intrinsic phase transitions
resulting from rearrangement and changes in the oxidation state of the iron ions produce drastic
changes in sensitivity at specific oxygen partial pressures and temperatures. These non-
stoichiometric perovskites show extremely high values of sensitivity when tested as
conductometric O2 sensors [14–16]. It is evident in the literature that Fe based perovskites
exhibit many of the ideal material properties for O2 sensing.

51
Recent studies within our group have shown that doped samarium ferrites have
favourable characteristics such as high conductivity and stability in reducing atmospheres,
making them useful for SOFC anode materials and gas sensors [4,17–19]. The increased
conductivity in the Sm ferrites arises from Cerium doping at the A site, changing the material
from a p to n-type semiconductor [19]. The majority of Fe based perovskites utilize a trivalent A
site cation (lanthanide) leading to a Fe3+
oxide. Less common are Fe4+
oxides that contain a
divalent A site cation, despite several studies demonstrating enhanced properties such as
ferromagnetism and metallic conductivity [20–22]. Combining the stability and conductivity
enhancing properties of A site Cerium doping with an oxygen deficient Fe4+
oxide should
produce a material with high electronic and ionic conductivity.
Here we report on the synthesis, characterization and electrochemical properties of Ba1-
xCexFeO3-δ (x = 0, 0.01, 0.03, and 0.05). Dopant levels greater than 5% were investigated but led
to phase segregation; we estimate the solubility of Ce at the A site to be between 5-7 mol %. The
x = 0.05 sample showed the most promising results and therefore Ba0.95Ce0.05FeO3-δ is the focus
of this work. The following includes a study of the electronic and ionic conductivity as well as
applications as a gas sensor for O2 at various temperatures.

52
3.2 Experimental
3.2.1 Synthesis
Powders of Ba1-xCexFeO3-δ (x=0, 0.01, 0.03, and 0.05) were prepared by decomposition
of citrate precursors via a conventional sol-gel method. Barium nitrate (Ba(NO3)2, AlfaAesar,
99.9%), cerium nitrate hexahydrate (Ce(NO3)3·6H2O, AlfaAesar, 99.5%) and iron nitrate
nonahydrate(Fe(NO3)3·9H2O, AlfaAesar, >98%) were weighed according to the desired
stoichiometry (Ba1-x + Cex : Fe = 1:1) and dissolved in de-ionized water. The metal nitrate
solutions were combined and added to aqueous citric acid monohydrate (AlfaAesar, 99%) so that
the ratio of citric acid to total metal ion was 1:1. The resulting solution was dried at 120°C for 24
h to form a citrate gel that was then ground and calcined at 950°C for 24 h using heating/cooling
ramp rates of 5°C/min.
3.2.2 Characterization
Powder X-Ray Diffraction (XRD, Philips PW 1830) was used to determine the phase
composition and lattice parameters of the perovskite powders. The instrument used CuKα
radiation (λ=1.54 Å) and the scattering angle, 2θ, was scanned between 13-90° at a rate of
0.02°/s. Panalytical X’PertHighscore Plus software was used for profile refinement and phases
were indexed to the Powder Diffraction File database (JCPDS, 2012).
Scanning electron microscopy (SEM, JEOL JSM-7500F) with an energy dispersive x-ray
spectroscopy (EDS X-Sight) attachment was used to image the surface morphology of Ba1-
xCexFeO3-δ (x=0, 0.05) powders/pellets and provide qualitative elemental composition.

53
3.2.3 Total, Ionic and Electronic Conductivity Measurements
The total conductivity (σT) of the materials was measured on circular pellets using the 2
point contact method at temperatures 25-1000°C in air. Pellets (diameter = 6 mm, thickness = 2
mm) of Ba1-xCexFeO3-δ (x=0, 0.05) were made by pressing 2 grams of powder to 15000 lbs and
sintering in air at 1200°C for 4 h with ramp rates of 2°C/min. Platinum mesh (AlfaAesar,
99.9%) was added as a current collector on each face of the circular pellet by adhesion with
platinum paste followed by removal of the organic binder at 800°C for 1h. The test chamber
setup used a quartz tube heated inside a tube furnace as described previously for sensor
experiments [23].
To determine the contributions of ionic and electronic conductivity to the total
conductivity, an Al blocking electrode was used. The Al electrode blocks the flow of O22-
Figure 3.1: Experimental setups for sensor and conductivity tests showing the 2-point
(a.b) and 4-point (c) methods used. The power supply provided a constant current of 100
mA.

54
species, therefore σ = σE. The ionic conductivity was inferred from the difference between σT
and σE. To measure σE, two pellets of Ba1-xCexFeO3-δ (x = 0, 0.05) were made as previously
described and a thin film of Aluminum was added between pellets. The “sandwiched” pellets
were heated to 660°C for 4 h with ramp rates of 2°C/min to soften the aluminum and minimize
contact resistance. Platinum mesh was added as a current collector on each side of the combined
pellets and electronic conductivity measurements were recorded at temperatures 25-1000°C in
air. A schematic view of the different conductivity setups is shown in Figure 3.1. To ensure
reproducibility, multiple trials of each measurement (with and without blocking electrodes) were
performed under both heating and cooling cycles. The 2-point conductivity measurements were
repeated 3 to 6 times for the various samples yielding errors between 2 and 11%, shown with the
appropriate error bars in the relevant figures.
3.2.4 Sensor Experiments
Sensor experiments were performed by 4 point conductivity measurements in various
atmospheres. To form the sensor, 4 grams of Ba0.95Ce.05FeO3-δ powder was uniaxially pressed at
15000 lbs to form a circular pellet which was subsequently sintered at 1200°C for 4 h with
heating/cooling ramp rates of 2°C/min. The pellet was cut into a rectangular shape with
dimensions 12 6 1 mm and electrical contacts were made by wrapping 4 platinum wires
around the sensor. Platinum paste was applied to ensure electrode contact and the organic binder
was removed by heating to 800°C for 1h. The sensor was contained in a hollow quartz tube
sealed on each end by rubber septa and heated to the desired temperature using a tube furnace.
Mass flow controllers (MFC) allowed for the mixing of gases to create the desired atmosphere
that is then flowed through the quartz tube and over the sensor [23]. Figure 3.1c shows the 4

55
point measurement used for conductivity where the two exterior contacts supplied DC current
(100 mA) and the inner two electrodes monitored voltage drop with a digital multimeter. The
response of each sensor was calculated according to Equation 3.1. Here, the sensor response, S,
is defined as the ratio of the relative conductivity change and allows for the comparison of
sensors in various atmospheres.
[3.1]
The conductivity of the material was recorded at 1 minute intervals and the flow of test
gas through the test chamber was varied from 2.5-15 sccm with a balance of air so that the total
gas flow rate was 50 sccm.
3.3 Results and Discussion
3.3.1 Characterization
The effect of Cerium doping on surface morphology was investigated with scanning
electron microscopy (SEM). Figure 3.2 a,b shows low magnification images of un-doped
BaFeO3-δ and Ba0.95Ce0.05FeO3-δ respectively. Both samples have an inhomogeneous dispersion
of particle sizes, ranging from less than 500 nm to over 1 µm. Higher magnification imaging
reveals a similar trend in grain boundary sizes (Figure 3.2 c,d). Similar particle and grain sizes
for doped and undoped materials indicate that Ce doping has little effect on morphology,
however the BaFeO3-δ sample shows signs of phase separation. Higher magnification imaging of
BaFeO3-δ (Figure 3.2 c) depicts a uniform particle coated in a porous, powder-like material. This
could be indicative of a second phase present in the un-doped sample as is visible through further
characterization with x-ray diffraction.

56
X-Ray diffraction was used to determine the phase composition of the Ce doped
perovskites. Figure 3.3 shows the p-XRD spectra for the calcined powders of Ba1-xCexFeO3-δ
(x=0, 0.01, 0.03, 0.05). Spectra are in order of decreasing Cerium content: x = 0.05, 0.03, 0.01,
and 0 corresponding to a, b, c, and d, respectively. The spectrum for BaFeO3-δ (Figure 3.3 d)
shows a combination of phases resulting from the varying degrees of oxygen vacancies present.
This is a result of the preparation method, namely high temperature calcination in air. The
synthesis of stoichiometric BaFeO3 has been reported by further treatment in pressurized O2
environments and heating in ozone [21]. The prominent phase can be indexed to BaFeO3-δ (PDF:
00-023-1024) in a hexagonal structure with lattice constants a,b = 5.66 and c = 13.83. Other less
Figure 3.2: SEM images of BaFeO3-δ (a,c) and Ba0.95Ce0.05FeO3-δ (b,d) as-prepared powders.
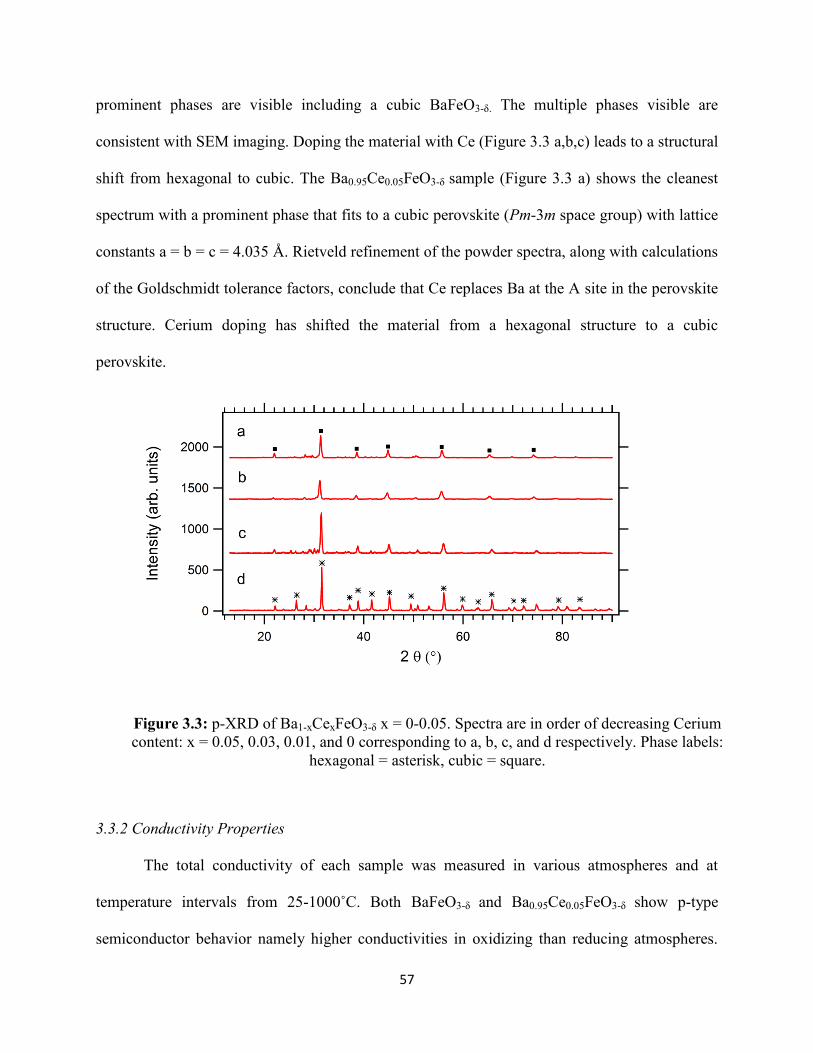
57
prominent phases are visible including a cubic BaFeO3-δ. The multiple phases visible are
consistent with SEM imaging. Doping the material with Ce (Figure 3.3 a,b,c) leads to a structural
shift from hexagonal to cubic. The Ba0.95Ce0.05FeO3-δ sample (Figure 3.3 a) shows the cleanest
spectrum with a prominent phase that fits to a cubic perovskite (Pm-3m space group) with lattice
constants a = b = c = 4.035 Å. Rietveld refinement of the powder spectra, along with calculations
of the Goldschmidt tolerance factors, conclude that Ce replaces Ba at the A site in the perovskite
structure. Cerium doping has shifted the material from a hexagonal structure to a cubic
perovskite.
3.3.2 Conductivity Properties
The total conductivity of each sample was measured in various atmospheres and at
temperature intervals from 25-1000˚C. Both BaFeO3-δ and Ba0.95Ce0.05FeO3-δ show p-type
semiconductor behavior namely higher conductivities in oxidizing than reducing atmospheres.
Figure 3.3: p-XRD of Ba1-xCexFeO3-δ x = 0-0.05. Spectra are in order of decreasing Cerium
content: x = 0.05, 0.03, 0.01, and 0 corresponding to a, b, c, and d respectively. Phase labels:
hexagonal = asterisk, cubic = square.

58
Tests under a reducing atmosphere (5% H2 in N2, 500°C) led to decomposition of the perovskite
phase and the formation of several phases, including Fe0. This indicates that these materials are
unstable in reducing atmospheres at elevated temperatures. Similar tests performed under air and
O2 indicate complete stability of these materials in oxidizing atmospheres up to 1200°C. The total
conductivities in air from 25-1000˚C are shown in Figure 3.4 with the appropriate error bars at
each temperature. Cerium doping increased the conductivity of the perovskite throughout the
entire temperature range with a more pronounced effect at higher temperatures. At 800°C the
conductivity of Ba0.95Ce0.05FeO3-δ reaches 3.3 S/cm. This value falls well in the range of other
perovskites containing Ba and Fe [24,25]. Figure 3.4.b shows an Arrhenius type plot of the
conductivity values between 600-1000˚C and the calculated activation energies. Both samples
exhibit similar changes in conductivity with respect to temperature including a dramatic increase
in ionic conductivity at 800˚C. This is indicative of a change in the dominant conduction type.
Both samples are p-type semiconductors where the prominent charge carriers are electron holes
[2]. As is shown in Equation 3.2, the replacement of Ba+2
with Ce+3
at the A site in the
perovskite structure decreases the number of oxygen vacancies and increases the number of
electron holes. The greater number of electron holes leads to an increased conductivity for the
Cerium doped material.
[3.2]

59
The Barium ferrite perovskite family was expected to be capable of ionic as well as
electronic conduction. It is therefore of interest to determine the individual contributions of ionic
(σI) and electronic conductivity (σE) to the total conductivity (σT) of the material. To measure the
electronic conductivity exclusively, an Al electrode was used as an ionic blocker. This forms a
gradient of oxygen anions on either side of the Al electrode through which only electronic
current can flow. Here it is assumed that σT = σE + σI therefore subtracting the electronic
conductivity from the total conductivity gives an estimate of the ionic conductivity. The
electronic conductivities of BaFeO3-δ and Ba0.95Ce0.05FeO3-δ were measured in the temperature
range of 25-1000˚C (shown in Figure 3.5.a with the appropriate error bars as measured) and were
subtracted from the bulk values to give the ionic conductivities (Figure 3.5.b). Both BaFeO3-δ and
Ba0.95Ce0.05FeO3-δ are largely ionic conductors throughout the temperature range. The addition of
5% Ce increased the electronic conductivity by an order of magnitude, from 0.04 to 0.56 S/cm at
800˚C. The ionic conductivity for doped and un-doped BaFeO3-δ increases in a similar manner
Figure 3.4: a) Conductivity of Ba1-xCexFeO3-δ (x=0, 0.05) between 25-1000˚C. b) Arrhenius plot of
conductivities between 600-1000˚C (activation energies calculated between 800-1000°C)

60
until 600˚C at which point the value for Ba0.95Ce0.05FeO3-δ increases whereas BaFeO3-δ decreases.
This indicates that 5% Ce doping has increased both σE and σI. Previous work has attributed the
increased resistance of BaFeO3-δ above 200 K to the Verwey transition (ferromagnetic to
antiferromagnetic transition) [21,26]. However, this explanation has been debated and is beyond
the scope of this work.
3.3.3 Gas Sensing Properties
The Ba0.95Ce0.05FeO3-δ perovskite has shown relatively high ionic conductivity and is
therefore of interest as a gas sensor, in this case for the detection of oxidizing gases.
Semiconducting gas sensors must have a porous microstructure with high surface area in order to
maximize response[27]. The measured response, conductivity in this case, is directly related to
grain size and separation. Here, sensor experiments were carried out as 4 point conductivity
measurements on a sintered pellet of Ba0.95Ce0.05FeO3-δ. The surface morphology of the sensor
was imaged with SEM (Figure 3.6). The sensor has a porous microstructure with well defined
grain boundaries and surface structures are apparent with sizes in the 100 nm range.
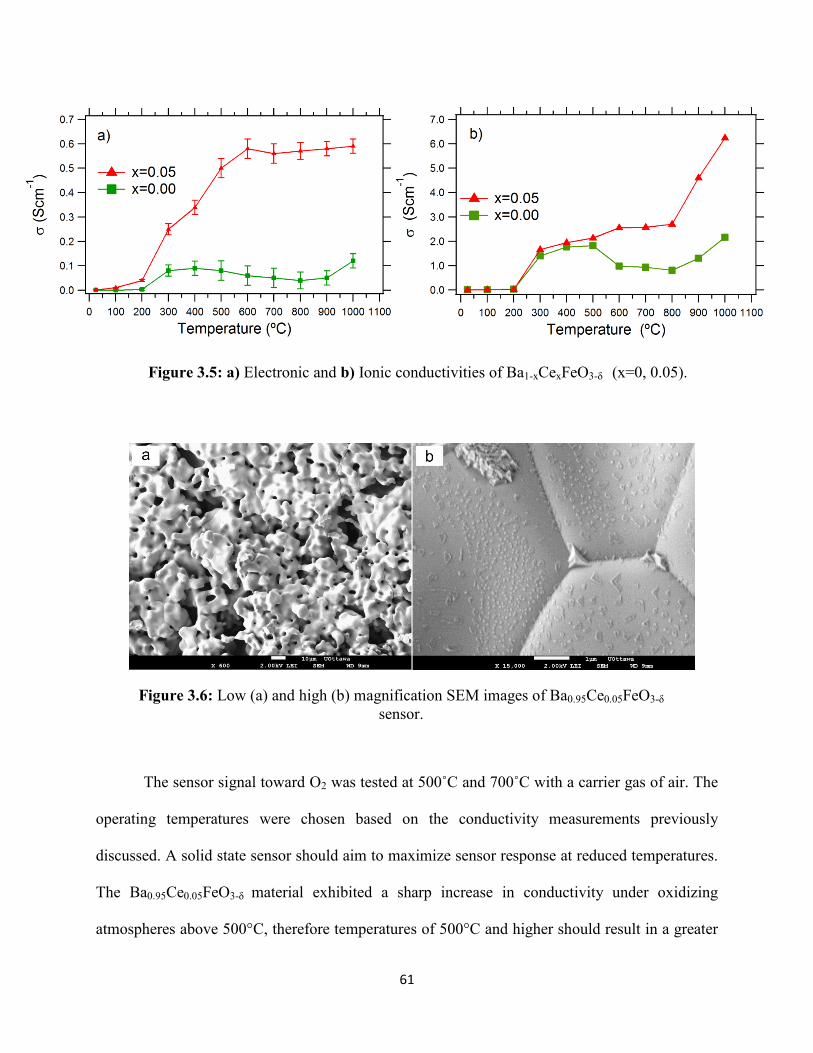
61
The sensor signal toward O2 was tested at 500˚C and 700˚C with a carrier gas of air. The
operating temperatures were chosen based on the conductivity measurements previously
discussed. A solid state sensor should aim to maximize sensor response at reduced temperatures.
The Ba0.95Ce0.05FeO3-δ material exhibited a sharp increase in conductivity under oxidizing
atmospheres above 500°C, therefore temperatures of 500°C and higher should result in a greater
Figure 3.5: a) Electronic and b) Ionic conductivities of Ba1-xCexFeO3-δ (x=0, 0.05).
Figure 3.6: Low (a) and high (b) magnification SEM images of Ba0.95Ce0.05FeO3-δ
sensor.

62
sensor response. The sensor maintained a baseline conductivity in air and a range of O2
concentrations were introduced through the test chamber to determine sensor response. The
concentration of O2 through the test chamber is calculated from a base of compressed air
containing 20.95% O2 by volume. The sensor response to a range of O2 concentrations (25-45%)
is shown in Figure 3.7. The sensor shows a completely reversible response to O2 at both 500˚C
and 700˚C. The time required for the sensor to achieve 99% of the stable response values
(response time) and for it to recover its original conductivity upon removal of the target gas
(recovery time) is an important measure in the design of sensors. Response and recovery times
for the Ba0.95Ce0.05FeO3-δ sensor are listed in Table 3.1. The sensor response to O2 increases with
temperature as expected and the response and recovery times at 700˚C are greater than those at
500˚C. At 500°C it is assumed that the sensor response is dependent upon adsorbed oxygen
species on the material surface [28,29]. This temperature is a typical switchover point below
which not only the cations, but also the oxygen non-stoichiometry can be considered to be frozen
and therefore the sensing mechanism is dominated by surface effects [30–33]. As previously
mentioned, the dominant charge carriers for p-type semiconductors are electron holes. Increasing
the concentration of O2 leads to a more oxidative atmosphere where electrons are more readily
removed from the conduction band. This increases the number of electron holes and in turn the
conductivity. This is shown in Equation 3.3.
[3.3]

63
Table 3.1: Response and recovery times for Ba0.95Ce0.05FeO3-δ O2 sensor at 500˚C and 700˚C.
Response Time (min) Recovery Time (min)
Peak
Oxygen
Content
%
T=
500°C
T =
700°C
T =
500°C
T =
700°C
A 25 6 9 10 14
B 29 4 17 8 19
C 33 7 17 7 21
D 37 10 14 9 23
E 45 8 10 12 22
Figure 3.7: Sensor conductivity in O2 at temperatures of a) 700˚C and
b) 500˚C. Features are labelled by their O2 concentration: 25, 29, 33,
37 and 45 % O2 for A, B, C, D and E, respectively.
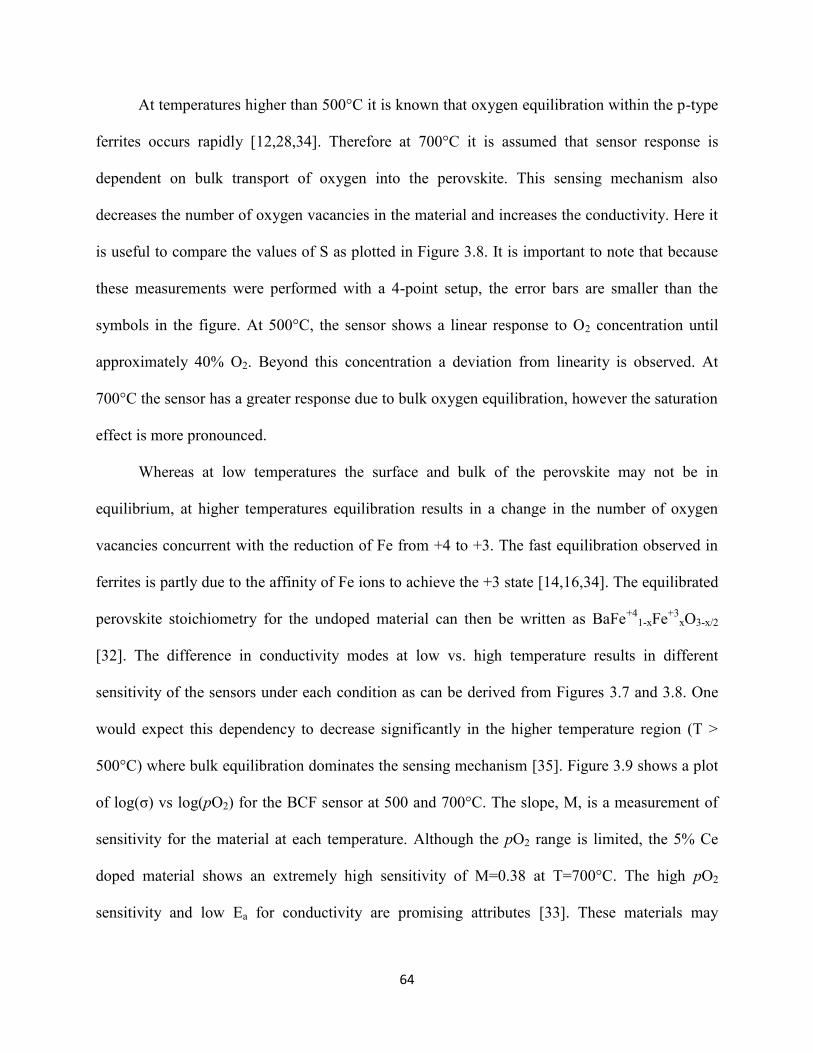
64
At temperatures higher than 500°C it is known that oxygen equilibration within the p-type
ferrites occurs rapidly [12,28,34]. Therefore at 700°C it is assumed that sensor response is
dependent on bulk transport of oxygen into the perovskite. This sensing mechanism also
decreases the number of oxygen vacancies in the material and increases the conductivity. Here it
is useful to compare the values of S as plotted in Figure 3.8. It is important to note that because
these measurements were performed with a 4-point setup, the error bars are smaller than the
symbols in the figure. At 500°C, the sensor shows a linear response to O2 concentration until
approximately 40% O2. Beyond this concentration a deviation from linearity is observed. At
700°C the sensor has a greater response due to bulk oxygen equilibration, however the saturation
effect is more pronounced.
Whereas at low temperatures the surface and bulk of the perovskite may not be in
equilibrium, at higher temperatures equilibration results in a change in the number of oxygen
vacancies concurrent with the reduction of Fe from +4 to +3. The fast equilibration observed in
ferrites is partly due to the affinity of Fe ions to achieve the +3 state [14,16,34]. The equilibrated
perovskite stoichiometry for the undoped material can then be written as BaFe+4
1-xFe+3
xO3-x/2
[32]. The difference in conductivity modes at low vs. high temperature results in different
sensitivity of the sensors under each condition as can be derived from Figures 3.7 and 3.8. One
would expect this dependency to decrease significantly in the higher temperature region (T ˃
500°C) where bulk equilibration dominates the sensing mechanism [35]. Figure 3.9 shows a plot
of log(σ) vs log(pO2) for the BCF sensor at 500 and 700°C. The slope, M, is a measurement of
sensitivity for the material at each temperature. Although the pO2 range is limited, the 5% Ce
doped material shows an extremely high sensitivity of M=0.38 at T=700°C. The high pO2
sensitivity and low Ea for conductivity are promising attributes [33]. These materials may
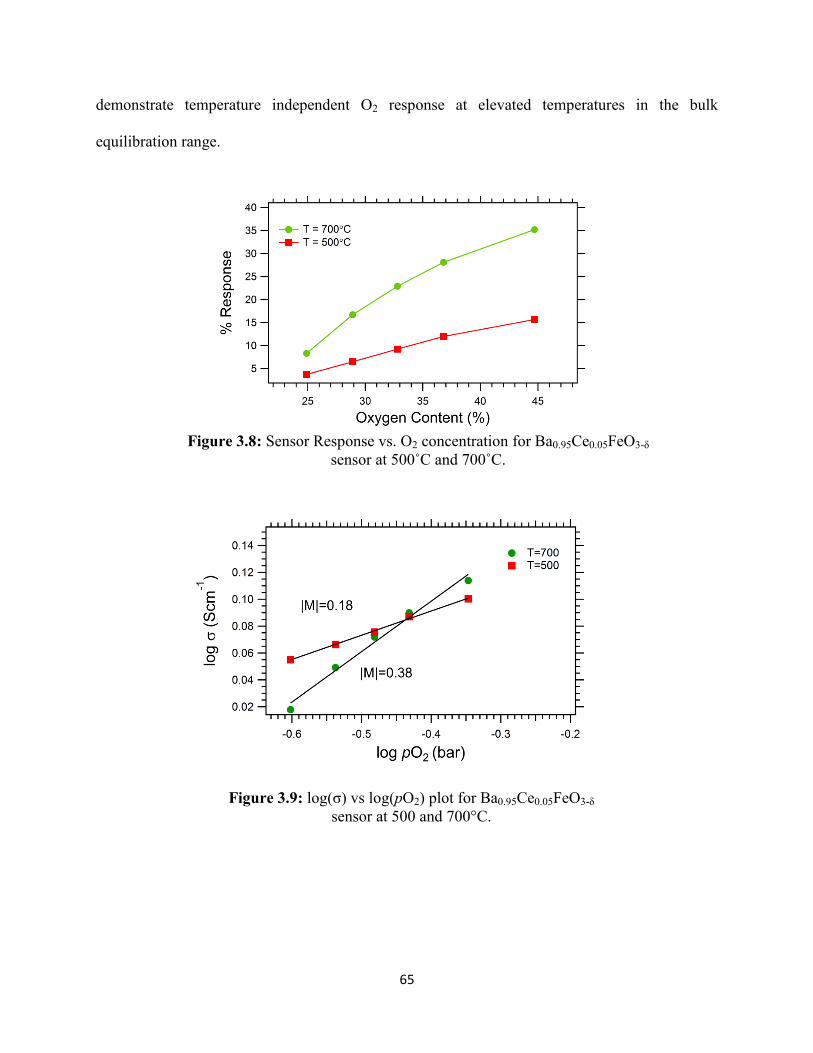
65
demonstrate temperature independent O2 response at elevated temperatures in the bulk
equilibration range.
Figure 3.8: Sensor Response vs. O2 concentration for Ba0.95Ce0.05FeO3-δ
sensor at 500˚C and 700˚C.
Figure 3.9: log(σ) vs log(pO2) plot for Ba0.95Ce0.05FeO3-δ
sensor at 500 and 700°C.

66
3.4 Conclusion
The Ba1-xCexFeO3-δ (x=0, 0.01, 0.03, and 0.05) perovskite family was prepared via a sol-
gel method. Ce doping at the A site leads to a structural shift from hexagonal to a cubic
perovskite. The incorporation of Ce substantially increases the electronic and ionic conductivity
of these materials, making the perovskites suitable as electrochemical gas sensors. A
Ba0.95Ce0.05FeO3-δ solid state gas sensor exhibited a completely reproducible response to O2 at
500 and 700°C. The sensing mechanism is consistent with a surface process at 500°C and a bulk
process at 700°C.

67
3.5 References
[1] Y. Niu, W. Zhou, J. Sunarso, F. Liang, Z. Zhu, Z. Shao, A single-step synthesized cobalt-
free barium ferrites-based composite cathode for intermediate temperature solid oxide fuel
cells, Electrochemistry Communications. 13 (2011) 1340–1343.
[2] S.P. Jiang, L. Liu, K.P. Ong, P. Wu, J. Li, J. Pu, Electrical conductivity and performance
of doped LaCrO3 perovskite oxides for solid oxide fuel cells, Journal of Power Sources.
176 (2008) 82–89.
[3] Y. Itagaki, M. Mori, Y. Hosoya, H. Aono, Y. Sadaoka, O3 and NO2 sensing properties of
SmFe1−xCoxO3 perovskite oxides, Sensors and Actuators B: Chemical. 122 (2007) 315–
320.
[4] S.M. Bukhari, J.B. Giorgi, Chemically stable and coke resistant Sm1−xCexFeO3−δ
perovskites for low temperature solid oxide fuel cell anode applications, Journal of Power
Sources. 198 (2012) 51–58.
[5] J. Matsuno, T. Mizokawa, a. Fujimori, Y. Takeda, S. Kawasaki, M. Takano, Different
routes to charge disproportionation in perovskite-type Fe oxides, Physical Review B. 66
(2002) 1–4.
[6] D. Rembelski, J.P. Viricelle, L. Combemale, M. Rieu, Characterization and Comparison
of Different Cathode Materials for SC-SOFC: LSM, BSCF, SSC, and LSCF, Fuel Cells.
12 (2012) 256–264.
[7] H. Aono, E. Traversa, M. Sakamoto, Y. Sadaoka, Crystallographic characterization and
NO2 gas sensing property of LnFeO3 prepared by thermal decomposition of LnFe
hexacyanocomplexes, Ln[Fe(CN)6]·nH2O, Ln = La, Nd, Sm, Gd, and Dy, Sensors and
Actuators B: Chemical. 94 (2003) 132–139.
[8] K.H. Friese, F. Stanglmeier, H.M. Wiedenmann, Electrochemical sensor to determine the
oxygen concentration in gas mixtures, U.S. Patent WO 95/25276, 1995.
[9] N. Izu, W. Shin, I. Matsubara, N. Murayama, The effects of the particle size and
crystallite size on the response time for resistive oxygen gas sensor using cerium oxide
thick film, Sensors and Actuators B: Chemical. 94 (2003) 222–227.
[10] A. Takami, Development of titania heated exhaust-gas oxygen sensor, Ceramic Bulletin.
(1988) 1956–1960.
[11] R. Moos, W. Menesklou, K.H. Hardtl, Materials for temperature independent resistive
oxygen sensors for combustion exhaust gas control, Sensors and Actuators B: Chemical.
(2000) 178–183.
68
[12] K. Sahner, R. Moos, N. Izu, W. Shin, N. Murayama, Response kinetics of temperature-
independent resistive oxygen sensor formulations: a comparative study, Sensors and
Actuators B: Chemical. 113 (2006) 112–119.
[13] P.T. Moseley, D.E. Williams, Gas sensors based on oxides of early transition metals,
Polyhedron. 8 (1989) 1615–1618.
[14] M.L. Post, B.W. Sanders, P. Kennepohl, Thin films of non-stoichiometric perovskites as
potential oxygen sensors, Sensors and Actuators B: Chemical. 14 (1993) 13–14.
[15] D. Wang, J.J. Tunney, X. Du, M.L. Post, R. Gauvin, Thermal stability of SrFeO3/Al2O3
thin films: Transmission electron microscopy study and conductometric sensing response,
Journal of Applied Physics. 104 (2008) 023530.
[16] J.J. Tunney, M.L. Post, The Electrical Conductance of SrFeO2.5+x Thin Films, Journal of
Electroceramics 5:1. (2000) 63–69.
[17] S.M. Bukhari, J.B. Giorgi, Redox Stability of Sm0.95Ce0.05Fe1-xCrxO3-δ Perovskite
Materials, Journal of The Electrochemical Society. 158 (2011) H1027.
[18] S.M. Bukhari, J.B. Giorgi, Surface and redox chemistry of Sm0.95Ce0.05Fe1−xNixO3−δ
perovskites, Solid State Ionics. 194 (2011) 33–40.
[19] S.M. Bukhari, J.B. Giorgi, Tuneability of Sm(1−x)CexFeO3±λ perovskites: Thermal
stability and electrical conductivity, Solid State Ionics. 180 (2009) 198–204.
[20] J.B. MacChesney, J.F. Potter, R.C. Sherwood, H.J. Williams, Oxygen Stoichiometry in
the Barium Ferrates; Its Effect on Magnetization and Resistivity, The Journal of Chemical
Physics. 43 (1965) 3317.
[21] N. Hayashi, T. Yamamoto, H. Kageyama, M. Nishi, Y. Watanabe, T. Kawakami, et al.,
BaFeO3: a ferromagnetic iron oxide., Angewandte Chemie (International Ed. in English).
50 (2011) 12547–50.
[22] T. Takeda, R. Kanno, Y. Kawamoto, M. Takano, Metal – semiconductor transition, charge
disproportionation, and low-temperature structure of Ca1–xSrxFeO3 synthesized under
high-oxygen pressure, Solid State Sciences. 2 (2000) 673–687.
[23] S.M. Bukhari, J.B. Giorgi, Cobalt Doped Sm0.95Ce0.05FeO3-δ for Detection of
Reducing Gases, Journal of The Electrochemical Society. 158 (2011) J159.
[24] H. Choi, A. Fuller, J. Davis, C. Wielgus, U.S. Ozkan, Ce-doped strontium cobalt ferrite
perovskites as cathode catalysts for solid oxide fuel cells: Effect of dopant concentration,
Applied Catalysis B: Environmental. 127 (2012) 336–341.
69
[25] A.K. Azad, A. Khan, S.-G. Eriksson, J.T.S. Irvine, Synthesis, structure and magnetic
properties of Sr2Fe1−xGaxMoO6 (0≤x≤0.6) double perovskites, Materials Research
Bulletin. 44 (2009) 2181–2185.
[26] H. Kronmuller, F. Walz, J. Rivas, D. Martinez, Influence of Ba Content on the Magnetic
After-Effect Spectra in Barium Ferrites, Physica Status Solidi (A). 137 (1994) 137–148.
[27] N. Barsan, D. Koziej, U. Weimar, Metal oxide-based gas sensor research: How to?,
Sensors and Actuators B: Chemical. 121 (2007) 18–35.
[28] W. Gopel, New materials and transducers for chemical sensors, Sensors and Actuators B:
Chemical. 19 (1994) 1–21.
[29] H. Iwahara, Ionic Conduction in Perovskite-Type Compounds, in: T. Ishihara (Ed.),
Perovskite Oxide for Solid Oxide Fuel Cells, Springer US, Boston, MA, 2009: pp. 45–63.
[30] R. Moos, K.H. Hardtl, Defect Chemistry of Donor-Doped and Undoped Strontium
Titanate Ceramics between 1000° and 1400°C, Journal of the American Ceramic Society.
10 (1997) 2549–2562.
[31] B. Boukamp, M. Pham, D. Blank, H. Bouwmeester, Ionic and electronic conductivity in
lead–zirconate–titanate (PZT), Solid State Ionics. 170 (2004) 239–254.
[32] A. Rothschild, W. Menesklou, H.L. Tuller, E. Ivers-tiffe, Electronic Structure, Defect
Chemistry, and Transport Properties of SrTi1-xFexO3-y Solid Solutions, Chemistry of
Materials. (2006) 3651–3659.
[33] P.T. Moseley, Materials selection for semiconductor gas sensors, Sensors and Actuators
B: Chemical. 6 (1992) 149–156.
[34] J.J. Tunney, M.L. Post, X. Du, D. Yang, Temperature Dependence and Gas-Sensing
Response of Conduction for Mixed Conducting SrFeyCozOx Thin Films, Journal of The
Electrochemical Society. 149 (2002) H113.
[35] R. Moos, N. Izu, F. Rettig, S. Reiss, W. Shin, I. Matsubara, Resistive oxygen gas sensors
for harsh environments., Sensors (Basel, Switzerland). 11 (2011) 3439–65.

70
Chapter 4
Enhanced Performance of Transition Metal Doped Sm0.95Ce0.05FeO3-δ SOFC
Anodes in H2S
Contributions from this chapter have been published in:
S.M. Bukhari, W.D. Penwell, J.B. Giorgi, ECS Trans. 57 (2013) 1507.
Abstract
Promising perovskite anodes have been tested in high sulfur fuel feeds. A series of
perovskite solid oxide fuel cell (SOFC) anode materials: Sm0.95Ce0.05FeO3-δ,
Sm0.95Ce0.05Fe0.97Ni0.03O3-δ and Sm0.95Ce0.05Fe0.97Co0.03O3-δ have been tested for sulfur tolerance
at 500°C. The introduction of the extreme 5% H2S enhances the performance of these anodes,
verified by EIS and CA experiments. Post mortem analyses indicate that the performance
enhancement arises from the partial sulfidation of the anode, leading to the formation of FeS2,
Sm3S4 and S on the perovskite surface. Testing in lower concentrations of sulfur, more common
in sour fuels, 0.5% H2S, also enhances the performance of these materials. The SCF-Co anode
shows promising stability and an increase in exchange current density, io, from 13.72 to 127.02
mA/cm2 when switching from H2 to 0.5% H2S/99.5% H2 fuel composition. Recovery tests
performed on the SCF-Co anode conclude that the open cell voltage (OCV) and power density of
these cells recover within 4 hours of H2S removal. We conclude that the formation of metal
sulfide species is only partially reversible, yielding an anode material with an overall lower Rct
upon switching back to pure H2. Combining their performance in sulfur containing fuels with
their previously reported coke tolerance makes these perovskites especially attractive as low
temperature SOFC anodes in sour fuels.

71
4.1 Introduction
Solid oxide fuel cells (SOFCs) are an attractive power source technology since they offer
the ability to directly convert chemical energy to electricity with low emissions and high
efficiency [1–3]. The commercial viability of SOFCs is currently limited by several factors,
mainly their high operating temperatures and material instability in carbon and sulfur containing
fuels. Ni-YSZ, the current state of the art SOFC anode material, performs well in H2 but suffers
from severe coke and sulfur poisoning when exposed to carbon and sulfur containing fuels [4,5].
Therefore, an active area of research focuses on the development of new, fuel flexible anode
materials for low temperature SOFCs (LT-SOFC). A suitable anode material for fuel flexible
LT-SOFC applications should be tolerant to CH4 and H2S, components of the current natural gas
sources [4,6].
Perovskites of the type ABO3 have unique structural and electronic properties making
them suitable for SOFCs. In the perovskite structure, A and B are cations (typically alkali earth,
rare earth, and transition metals) that can be tailored to suit the material needs. Many perovskites
demonstrate excellent properties as cathode materials for SOFCs and several have promising
anode performance in sulfur and carbon containing fuels [2,7]. Doped perovskite systems such
as LSV (lanthanum strontium vanadate) have shown tolerance to both CH4 and H2 fuels
containing up to 5% H2S, although these studies were performed at high temperatures [8,9]. The
development of coke and sulfur tolerant perovskite materials for LT-SOFC applications remains
an area of high interest.
Recent work in our group has focused on the doping of SmFeO3, leading to the
development of LT-SOFC anode materials and gas sensors [10–14]. Specifically, A site Ce
doping and B site transition metal doping makes these materials suitable as coke tolerant anodes

72
for CH4 fueled LT-SOFCs [13]. Although the performance of these anode materials in H2 has
been studied in depth, no work has been done on their tolerance to sulfur containing fuels.
The current study evaluates the sulfur tolerance of three recently developed and carbon
tolerant anode materials, Sm0.95Ce0.05FeO3-δ, Sm0.95Ce0.05Fe0.97Ni0.03O3-δ and
Sm0.95Ce0.05Fe0.97Co0.03O3-δ. In depth electrochemical testing and post mortem analyses are
performed to determine the effect of H2S on anode performance and microstructure.
4.2 Experimental
4.2.1 Powder Synthesis
Perovskite powders with formulae Sm0.95Ce0.05FeO3-δ, Sm0.95Ce0.05Fe0.97Ni0.03O3-δ and
Sm0.95Ce0.05Fe0.97Co0.03O3-δ were prepared by decomposition of citrate precursors via a sol-gel
method. The preparation and characterization of these perovskites has been previously reported
[10–16]. Starting materials included samarium nitrate Sm(NO3)3·6H2O, AlfaAesar, 99.9%),
cerium nitrate hexahydrate (Ce(NO3)3·6H2O, AlfaAesar, 99.5%), iron nitrate nonahydrate
(Fe(NO3)3·9H2O, AlfaAesar, >98%), cobalt nitrate hexahydrate (Co(NO3)2·6H2O, AlfaAesar,
99%), nickel nitrate hexahydrate (Co(NO3)2·6H2O, AlfaAesar, 99%) and citric acid monohydrate
(AlfaAesar, minimum 99%). The nitrates were weighed according to the desired stoichiometry
and dissolved separately in de-ionized water. The metal nitrate solutions were combined and
added to aqueous citric acid so that the ratio of citric acid to total metal ion was 1:1. The solution
was dried at 120°C for 24 hours resulting in a citrate gel precursor that was subsequently ground
and calcined at 850°C for 24 hours using heating/cooling ramp rates of 5°C/min. For the
remainder of the manuscript the perovskite materials Sm0.95Ce0.05FeO3-δ,
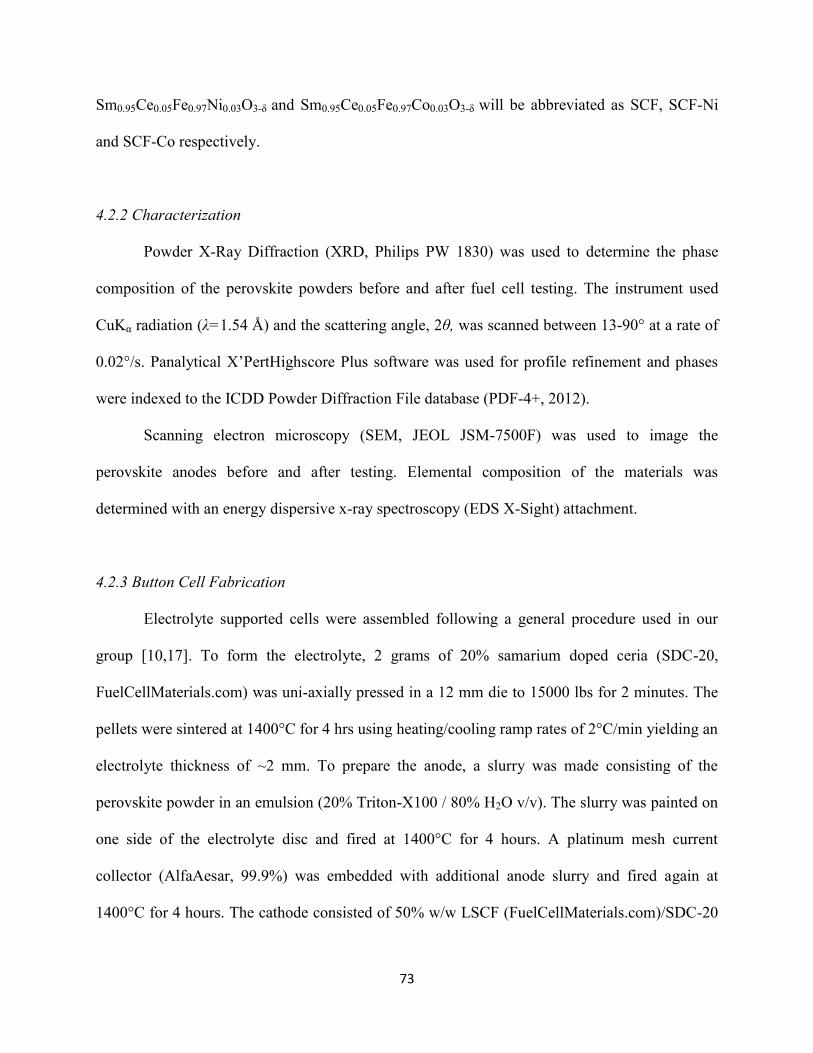
73
Sm0.95Ce0.05Fe0.97Ni0.03O3-δ and Sm0.95Ce0.05Fe0.97Co0.03O3-δ will be abbreviated as SCF, SCF-Ni
and SCF-Co respectively.
4.2.2 Characterization
Powder X-Ray Diffraction (XRD, Philips PW 1830) was used to determine the phase
composition of the perovskite powders before and after fuel cell testing. The instrument used
CuKα radiation (λ=1.54 Å) and the scattering angle, 2θ, was scanned between 13-90° at a rate of
0.02°/s. Panalytical X’PertHighscore Plus software was used for profile refinement and phases
were indexed to the ICDD Powder Diffraction File database (PDF-4+, 2012).
Scanning electron microscopy (SEM, JEOL JSM-7500F) was used to image the
perovskite anodes before and after testing. Elemental composition of the materials was
determined with an energy dispersive x-ray spectroscopy (EDS X-Sight) attachment.
4.2.3 Button Cell Fabrication
Electrolyte supported cells were assembled following a general procedure used in our
group [10,17]. To form the electrolyte, 2 grams of 20% samarium doped ceria (SDC-20,
FuelCellMaterials.com) was uni-axially pressed in a 12 mm die to 15000 lbs for 2 minutes. The
pellets were sintered at 1400°C for 4 hrs using heating/cooling ramp rates of 2°C/min yielding an
electrolyte thickness of ~2 mm. To prepare the anode, a slurry was made consisting of the
perovskite powder in an emulsion (20% Triton-X100 / 80% H2O v/v). The slurry was painted on
one side of the electrolyte disc and fired at 1400°C for 4 hours. A platinum mesh current
collector (AlfaAesar, 99.9%) was embedded with additional anode slurry and fired again at
1400°C for 4 hours. The cathode consisted of 50% w/w LSCF (FuelCellMaterials.com)/SDC-20

74
with a Pt mesh current collector and was prepared in the same manner as the anode. The
effective electrode areas were 1.5 cm2. The reference electrode in this setup was a Pt wire
wrapped horizontally around the electrolyte and coated in Pt paste that was subsequently heated
to 800°C for 2 hrs to remove the organic binder.
4.2.4 Fuel Cell Setup and Electrochemical Tests
The fuel cell setup used has been previously described [14,18]. The apparatus consists of
an alumina support tube attached to a custom made Ultra-Torr fitting with a Viton O-ring seal.
The Ultra-Torr fitting is attached to a three-way Swagelok gas manifold for fuel mixing. The
button cell sits atop the alumina support, inside of which a smaller diameter alumina tube carries
fuel gas to the anode. The cell is sealed to the alumina support using a Pyrex ring. A short
alumina tube placed on top of the cell provides weight to facilitate sealing of the Pyrex. The
cathode side of the cell is open to air. This entire setup is placed inside a vertical tube furnace
controlled by a Barber-Colman temperature controller using a K-type thermocouple. Three
lengths of Pt wire served as the electrode leads. Before testing, the Pyrex ring was softened at
950°C for 1 hour to seal the button cell. In all tests the total gas flow rate was maintained at 50
sccm using MKS mass-flow controllers and the temperature was a constant 500°C.
Electrochemical tests were performed as outlined in Chapter 2. Briefly, data collection
was performed using a Volta-Lab PGZ 301 (Radiometer Analytical) connected to a desktop
computer running VoltaMaster 4 software. A general sequence of tests included open cell
voltage (OCV), electrochemical impedance spectroscopy (EIS) at OCV (100 kHz to 100 mHz
with an AC amplitude of 10 mA), and current amperometry (CA) experiments at overpotentials
75
from 0 V to 1.0 V in increments of 50 mV. To ensure adequate sealing, only cells with initial
OCVs in H2 of 0.93 V at 500 °C and higher were accepted for complete electrochemical testing.
The analysis of EIS data was performed in the ZView program (Scribner Associates) by
fitting impedance curves to an equivalent circuit model. All impedance experiments were
performed in reference to the Pt reference electrode, therefore the resulting EIS data is
representative of anode specific processes. This simplifies the analysis of the Nyquist plot
because cathodic contributions are explicitly not part of the data collected in this fashion, leading
to the use of a simple circuit model where anode processes may be accurately obtained. In the
case of the SCF materials, only a single depressed semi-circle is apparent in impedance spectra
therefore a simplified equivalent circuit model is used, abbreviated as (L1RS[RCTCPE1]). Here, L1
is an inductor to account for impedance in electrode leads and CPE1 is a constant phase element
accounting for anode current variations (depressed Nyquist semi-circle). The circuit model also
consists of a serial resistance (Rs), and a charge transfer resistance of the anode (Rct) used to
calculate the exchange current density (io) according to the low field approximated Butler-
Volmer equation. This circuit model omits certain elements visible in the EIS data, such as
Warburg diffusion parameters, in order to minimize error in the fitting of polarization
resistances. In this study, and previous work on these SCF materials, the anode polarization
resistance (Rp) is assumed to be equal to Rct [10,13,14]. While the three electrode geometry is
used to collect anode specific data, the cell power densities were calculated from
chronoamperometry experiments at various overpotentials using both cathode and anode
electrodes for data collection.

76
4.3 Results and Discussion
4.3.1 Performance under 5% H2S / 95 % H2
Three promising perovskite anode materials are being considered: Sm0.95Ce0.05FeO3-δ,
Sm0.95Ce0.05Fe0.97Ni0.03O3-δ and Sm0.95Ce0.05Fe0.97Co0.03O3-δ abbreviated as SCF, SCF-Ni and
SCF-Co, respectively. To compare the performance of the different anode compositions under
H2S containing fuels, it is pertinent to first obtain cell data under pure H2. Performance in pure
hydrogen allows us to assess the cell stability and account for slight differences in cell to cell
values for initial OCV, Rct and power density which arise from the fabrication process. Therefore
in analyzing the data it is important to compare not only the quantitative values but also the
degree to which each cell measurement changes when altering fuel composition. The
performance of the three cells in pure H2 at 500°C is compared first by considering the OCVs
and power densities plotted in Figure 4.1 a and c, respectively. It is important to note that in this
study we expect low values for power and current due to the very thick electrolyte used [10,14].
As is seen in Figure 4.1 a, all three anode materials have similar OCVs in pure H2 ranging from
0.94-0.98 V. These values are lower than the theoretical Nernst potential at 500°C, a trend that is
consistent with the use of SDC electrolytes for SOFCs. The low densification of the SDC
electrolyte along with partial reduction at the anode lead to current leakage and reduced OCVs
[19–21].

77
The power density of each anode is plotted in Figure 4.1 c showing that all cells maintain
similar outputs at 500°C when operating in pure H2. After running each cell for 14 hours in H2,
5% H2S was introduced into the fuel stream and the same sequence of programmed experiments
was performed in repetition for 30 hours. The resulting change in OCV for each cell versus
sulfur exposure time is plotted in Figure 4.1 b. Clearly evident for all anodes is an immediate
decrease in OCV upon introduction of sulfur to the fuel stream, with SCF having the largest
decrease. After the initial 2-4 hr drop in OCV, the cells slightly stabilize and a moderately flat
potential is seen for all anode materials. The OCVs continues to decrease within the measured
time frame, however to a lesser extent. This is in contrast to trends observed in Ni-YSZ and other
Ni containing SOFC anode materials, where the cell potential continues to drop drastically when
Figure 4.1: OCV’s of SCF cells at 500°C in a) H2 and b) 5% H2S/95% H2 and Power Density curves
in c) H2 and d) 5% H2S/95% H2.

78
H2S is maintained in the fuel stream. This is characteristic of poisoning/delamination of the
anode from the electrolyte, ultimately leading to loss of the cell [4,5,22,23].
The I-P curves after 30 hours in H2S indicate stable power from each anode material. The
power density of each cell after 30 hours in 5% H2S is shown in Figure 4.1 d. It is clear that each
cell has had an increase in current density, representative of improved electrode-electrolyte
contact, as will be shown later in the text. The peak power densities of the SCF and SCF-Ni cells
have decreased slightly whereas the SCF-Co cell has increased from 2.8 to 4.5 mWcm-2
. This
increased power density in H2S containing fuels is uncommon; sulfur impurities are
conventionally associated with performance drop [4,23]. We attribute this increased performance
to the formation of metal sulfides that drastically increase the conductivity and connectivity of
the anode. The formation of active sulfides was demonstrated with Ni-YSZ cermets under high
sulfur conditions [17,18,24,25].The increase in power demonstrates the viability of the SCF cells
to operate in high concentration H2S fuel environments.
Figure 4.2: EIS spectra of SCF-Ni cell at 500°C in H2 and 5%
H2S/95% H2.

79
Analysis of the EIS data (Figure 4.2) also demonstrates the viable performance of these
anodes in 5% H2S. All cells exhibit a decreased serial resistance under 5% H2S, indicative of an
improvement in electrode-electrolyte contact and overall increased anode conductivity. The Rct,
determined as the difference between high and low frequency intercepts of a Nyquist plot, is
used to calculate the i0 for the charge transfer reaction taking place at the triple phase boundary
of the anode. A lower Rct leads to an increase in i0, indicative of an improvement in anode
performance for fuel oxidation. Figure 4.2 shows a typical EIS comparison of the SCF-Ni cell in
H2 and after 30 hours exposure to 5% H2S. The impedance arc has reduced in size drastically,
with a lower Rct than in pure H2. This is seen for all cells when exposed to 5% H2S. These result
are in drastic contrast with the poisoning observed in traditional Ni based anodes; state of the art
Ni-YSZ anodes undergo a rapid increase in polarization resistance when exposed to low
concentrations of H2S (1-8 ppm) [26,27]. Typically, the extent of degradation is proportional to
the concentration of H2S in the fuel, however some studies have demonstrated improved
performance of Ni-YSZ anodes when exposed to high concentrations (10%) of H2S at
temperatures >800°C [17,18,24]. The metal-sulfides produced in these anodes offer superior
polarization resistances and current densities in H2S than in pure H2, similar to the results
obtained in the current work however at much higher operating temperatures.
Table 4.1 summarizes the impedance data for the three anodes before and after
introduction of 5% H2S into the fuel stream. Here it is clear that all three anode materials have
improved performance in 5% H2S. A value of i0 H2S / i0 H2 greater than 1 indicates an increased
exchange current density in H2S containing fuels. The io has increased in each case with the SCF-
Co cell showing the greatest improvement from 53.29 to 302.77 mA/cm2 upon introducing 5%
H2S. The improved performance of SOFC anodes in high concentrations of H2S is an uncommon

80
phenomenon however it is not unique to this work. For example; Liu et al. reported perovskite
anodes of the type La0.7Sr0.3VaO3 that exhibit improved performance in fuel compositions as
high as 10% H2S [28]. The improvement in that case is attributed to the formation of a highly
conductive, sulfated perovskite anode that drastically reduces the anode-electrolyte interfacial
resistance [28,29]. In comparison to the current work, the LSV anode exhibited an Rct of ~5.5
Ωcm2 at 900°C in 10% H2S, an order of magnitude larger than the SCF anodes tested in this
work at 500°C.
Table 4.1: AC Impedance data of SCF cells at 500 °C in H2 and 5% H2S / 95 % H2.
Anode Material Fuel OCV
(Volts) Rs
(Ω*cm2)
Rct (Ω
*cm2)
i0 H2S / i0
H2
Sm0.95Ce0.05FeO3 H2 0.971 39.16 0.83
2.31
5% H2S 0.346 6.26 0.36
Sm0.95Ce0.05Fe0.97Ni0.03O3 H2 0.952 19.35 0.94
3.92
5% H2S 0.584 9.25 0.24
Sm0.95Ce0.05Fe0.97Co0.03O3 H2 0.981 40.25 1.25
5.68
5% H2S 0.748 11.63 0.22

81
In an attempt to determine the active species responsible for the performance increase, in
depth post mortem analyses are performed. The anode, after performance in H2S, is rapidly
quenched by complete removal of the fuel cell apparatus from the tube furnace. The anode
atmosphere is maintained as 5% H2S/ 95% H2. in an effort to preserve the active species without
further reaction. Once cooled, the anode is removed and characterized using SEM and p-XRD.
The exact anode species present under operating conditions cannot be determined; nevertheless,
post-mortem characterization of the quenched anodes provides an indication of what is
happening during operation. Figure 4.3 shows the anode microstructures before and after testing
in 5% H2S. The perovskite microstructure has been maintained but with a roughening of the
grain surfaces due to the production of sulfides and yielding an appearance similar to igneous
rock. The anodes show different degrees of surface modification with the SCF cell affected to the
Figure 4.3: SEM images of SCF anodes pre (top row) and post (bottom row) testing in 5% H2S
/ 95% H2.
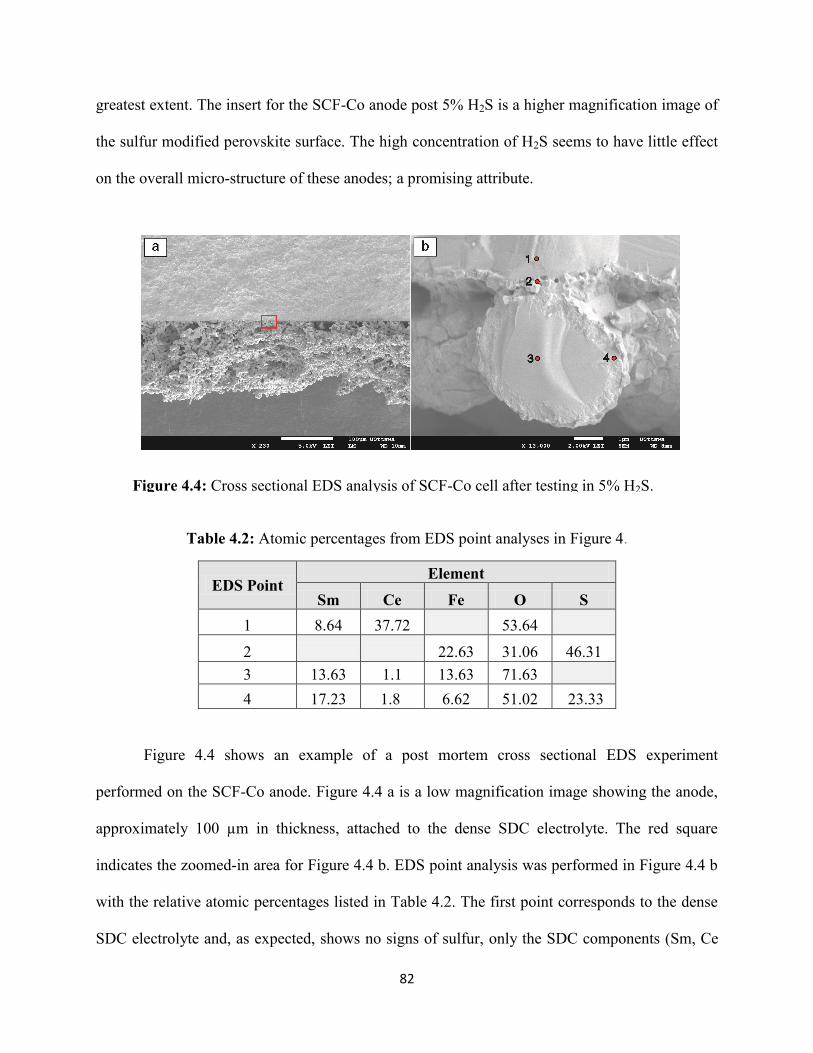
82
greatest extent. The insert for the SCF-Co anode post 5% H2S is a higher magnification image of
the sulfur modified perovskite surface. The high concentration of H2S seems to have little effect
on the overall micro-structure of these anodes; a promising attribute.
Table 4.2: Atomic percentages from EDS point analyses in Figure 4.
EDS Point Element
Sm Ce Fe O S
1 8.64 37.72 53.64
2 22.63 31.06 46.31
3 13.63 1.1 13.63 71.63
4 17.23 1.8 6.62 51.02 23.33
Figure 4.4 shows an example of a post mortem cross sectional EDS experiment
performed on the SCF-Co anode. Figure 4.4 a is a low magnification image showing the anode,
approximately 100 µm in thickness, attached to the dense SDC electrolyte. The red square
indicates the zoomed-in area for Figure 4.4 b. EDS point analysis was performed in Figure 4.4 b
with the relative atomic percentages listed in Table 4.2. The first point corresponds to the dense
SDC electrolyte and, as expected, shows no signs of sulfur, only the SDC components (Sm, Ce
Figure 4.4: Cross sectional EDS analysis of SCF-Co cell after testing in 5% H2S.

83
and O) are visible. As well, the SDC electrolyte appears to be Sm rich and oxygen deficient, as
expected for the anode side of a dense electrolyte. The second point analysis was performed on
the thin layer interfacing the anode and electrolyte. Here we see large incorporation of S and Fe,
an indication of FeS2 segregation at the functional layer of the anode. Point 3 corresponds to the
interior of the perovskite network and shows no sign of sulfur penetration., That is, the
micrometer perovskite structures contain a core of pure perovskite (no sulfur) with
approximately the nominal stoichiometry. EDS analysis of Point 4 in Figure 4.4 b represents the
~100 nm thick coating of the perovskite structure where large contributions of sulfide species are
apparent, giving it an igneous rock-type appearance. These results strongly indicate that 5% H2S
poisoning of the SCF-Co anode has resulted in only a surface modification of the perovskite
particles with the bulk perovskite microstructure remaining intact. The evolution of FeS2 on the
perovskite surface and at the interface between the anode and electrolyte is primarily responsible
for the improved performance of these anodes in H2S fuels. FeS2 (Pyrite) is known for its high
electronic conductivity and catalytic properties that make it especially applicable for Li battery
electrodes [30–32]. Our work indicates that it may also be of interest for SOFC anodes in sulfur
containing fuels.

84
Post mortem p-XRD of the anode materials was performed in an attempt to identify the
species responsible for the performance increase. The powder X-ray diffraction spectra for the
post mortem anodes are shown in Figure 4.5. For comparison, the as prepared SCF perovskite
spectrum is shown (Before spectrum). The bulk perovskite phase, SmFeO3-δ (PDF # 39-1490),
has been maintained in each anode after performance in 5% H2S along with the evolution of
additional peaks indicated by asterisks. No single material corresponds to the diffraction peaks,
but rather multiple metal sulfide species along with elemental sulfur appear to be present in the
quenched anode material. More specifically, the principal peaks of FeS2 (PDF # 006-0710),
Sm3S4 (PDF # 04-002-5993) and S (PDF # 04-007-2083) fit the additional peaks. Evolution of
these materials is consistent with the hypothesis that H2S leads to the partial sulfidation of the
anode, responsible for the performance increase. These results are consistent with the elemental
compositions from EDS analysis and reinforce the conclusion that even at 5% H2S fuel
concentration only a portion (the surface of the particles) of the anode material is sulfidated. The
extent of poisoning, or formation of metal sulfide phase, can be qualitatively compared by the
Figure 4.5: Powder XRD of anode materials before and after testing in 5% H2S.

85
intensities of the newly formed peaks. The SCF-Co material shows very low levels of sulfide
phase formation in comparison to the SCF and SCF-Ni anodes.
4.3.2 Performance under 0.5% H2S / 99.5% H2
The anode materials under study, particularly SCF-Co, have shown considerable
tolerance to H2S in the fuel stream and the increased performance of each anode in 5% H2S is of
great interest. This concentration of sulfur is extremely high, and while it has been used in the
past to test accelerated poisoning, it is only applicable to highly sour fuel feeds [33]. To
determine if this performance enhancement exists at a lower, more common sulfur concentration,
and to explore the stability of the surface sulfide species, the three anodes were tested similarly
in 0.5% H2S / 99.5% H2. The performance of the three cells in pure H2 at 500°C is compared first
by the OCVs and power densities plotted in Figure 4.6 a and c respectively. All three cells have
OCVs in H2 of 0.95-1.05 V and power densities on the order of 2 mWcm-2
. The resulting change
in OCV for each cell versus sulfur exposure time is plotted in Figure 4.6 b. Clearly evident for all
cells is an immediate decrease in OCV upon introduction of sulfur to the fuel stream. For the
SCF and SCF-Co cells the OCV drop occurs rapidly in the first 2 hours and then begins to
stabilize at a lower value than in H2. The OCV of the SCF-Ni cell does not stabilize and
continues to decrease throughout the entire measurement period. This is most likely due to
changes in the microstructure and poisoning/delamination of the SCF-Ni material. All three
anodes show increased current densities in H2S fuel conditions along with increased power
densities for the SCF and SCF-Co cells. The SCF-Ni cell shows almost an unchanged peak
power density whereas that of the SCF and SCF-Co cells has increased by a factor of ~2. Again,
we conclude that the increased current densities arise from the formation of conductive metal
sulfide species on the anode surface.
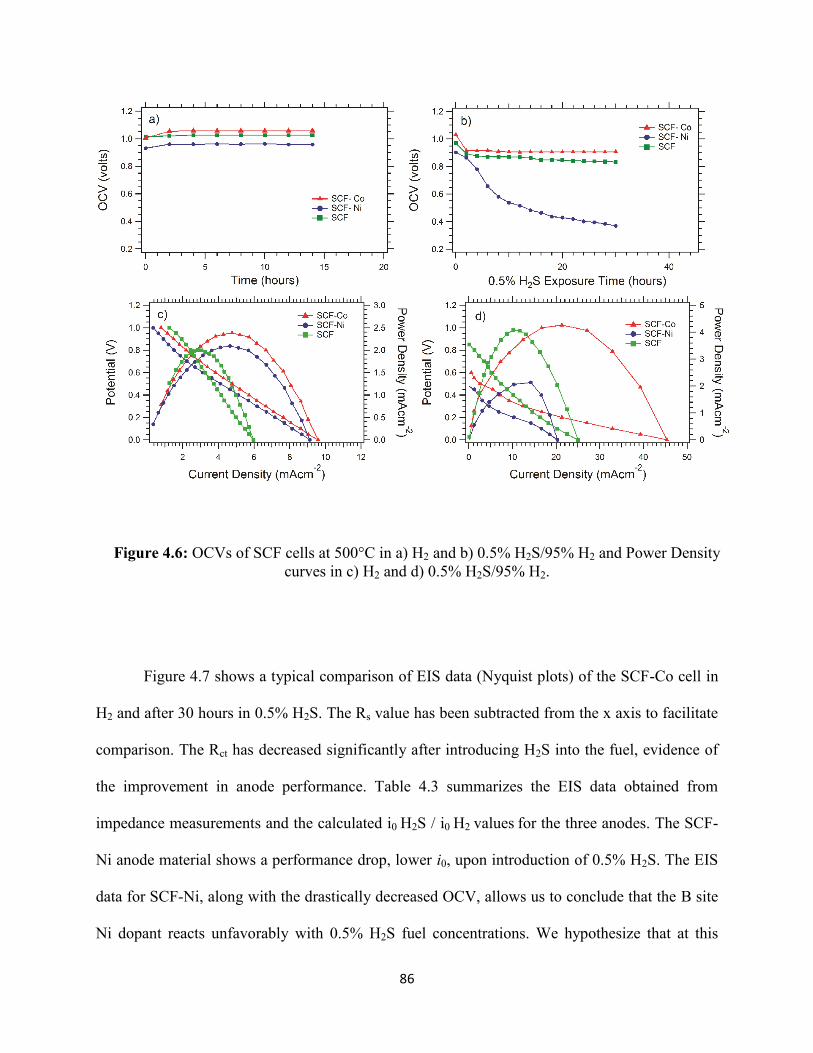
86
Figure 4.7 shows a typical comparison of EIS data (Nyquist plots) of the SCF-Co cell in
H2 and after 30 hours in 0.5% H2S. The Rs value has been subtracted from the x axis to facilitate
comparison. The Rct has decreased significantly after introducing H2S into the fuel, evidence of
the improvement in anode performance. Table 4.3 summarizes the EIS data obtained from
impedance measurements and the calculated i0 H2S / i0 H2 values for the three anodes. The SCF-
Ni anode material shows a performance drop, lower i0, upon introduction of 0.5% H2S. The EIS
data for SCF-Ni, along with the drastically decreased OCV, allows us to conclude that the B site
Ni dopant reacts unfavorably with 0.5% H2S fuel concentrations. We hypothesize that at this
Figure 4.6: OCVs of SCF cells at 500°C in a) H2 and b) 0.5% H2S/95% H2 and Power Density
curves in c) H2 and d) 0.5% H2S/95% H2.

87
temperature and sulfur concentration the affinity of nickel toward formation of nickel sulfide
species leads to the severe micro-structural changes in the perovskite anode that ultimately lower
performance. On the other hand, a decreased Rct is seen for the SCF and SCF-Co cells when
operating in 0.5% H2S with the SCF-Co cell having the greatest improvement. The io of the SCF
cell has increased by a factor of 1.9 whereas that of the SCF-Co has increased drastically, from
13.72 to 127.02 mA/cm2. The Rct and io of the SCF and SCF-Co cells before and after
performance in H2S are superior to other materials considered to be sulfur tolerant SOFC anodes
[9,34–36]. For instance, sulfur tolerant LSV/GDC anodes at 800°C exhibit Rct values of
approximately 12 and 14 Ω*cm2
in H2 and syngas/H2S, respectively [35].
Figure 4.7: EIS spectra of SCF-Co cell at 500°C in H2 and 0.5% H2S/99.5% H2.

88
Interestingly, the SCF-Ni material shows improved performance in 5% H2S fuel in
comparison to a reduced performance in 0.5% H2S. This indicates that the concentration of H2S
is directly affecting the micro-structure, and hence performance of the SCF-Ni anode material.
We hypothesize that in 5% H2S fuels, the formation of FeS2 and Sm3S4 on the perovskite surface
occurs rapidly. This highly conductive metal sulfide layer may deter the further sulfidation of the
anode and bypass the micro-structural changes observed under 0.5% H2S.
Table 4.3: AC Impedance data of SCF cells at 500 °C in H2 and 0.5% H2S / 99.5% H2.
Anode Material Fuel OCV
(Volts) Rs (Ω*cm
2) Rct (Ω *cm
2)
i0 H2S / i0
H2
Sm0.95Ce0.05FeO3 H2 1.026 53.71 2.28
1.91
0.5% H2S 0.833 13.72 1.20
Sm0.95Ce0.05Fe0.97Ni0.03O3 H2 0.959 46.75 3.87
0.86
0.5% H2S 0.369 34.58 4.51
Sm0.95Ce0.05Fe0.97Co0.03O3 H2 1.057 35.03 4.85
9.26
0.5% H2S 0.908 8.846 0.52
Post mortem analyses were performed on the quenched anodes with SEM images of the
anode surfaces before and after testing shown in Figure 4.8. The SCF and SCF-Co cells have
maintained the perovskite microstructure but with the same igneous surface modification
witnessed in the 5% tests. On the other hand, the SCF-Ni anode has a completely changed micro-
structure with the appearance of large crystallites on the order of 10 µm in size. EDS analysis
indicates that these crystals contain high concentrations of Fe and S. Cross sectional EDS
analyses of the SCF and SCF-Co anodes confirm that the perovskite structure has been
maintained but with a surface modification containing metal sulfides.

89
The p-XRD of anodes after performance in 0.5% H2S are shown in Figure 4.9 with the
as-prepared SCF spectrum for comparison. Again, the bulk orthorhombic SmFeO3-δ phase is
maintained but with varying degrees of sulfur modification to FeS2, Sm3S4 and S. The SCF-Ni
anode has prominent peaks for the sulfide phases and appears to be most affected by testing in
0.5% H2S fuel. This is consistent with the post mortem SEM imaging of the anodes shown in
Figure 4.8; concluding that the SCF-Ni cell has been severely poisoned, forming large crystals of
metal sulfides.
Figure 4.8: SEM images of SCF anodes pre (top row) and post (bottom row) testing in 0.5% H2S /
99.5% H2.
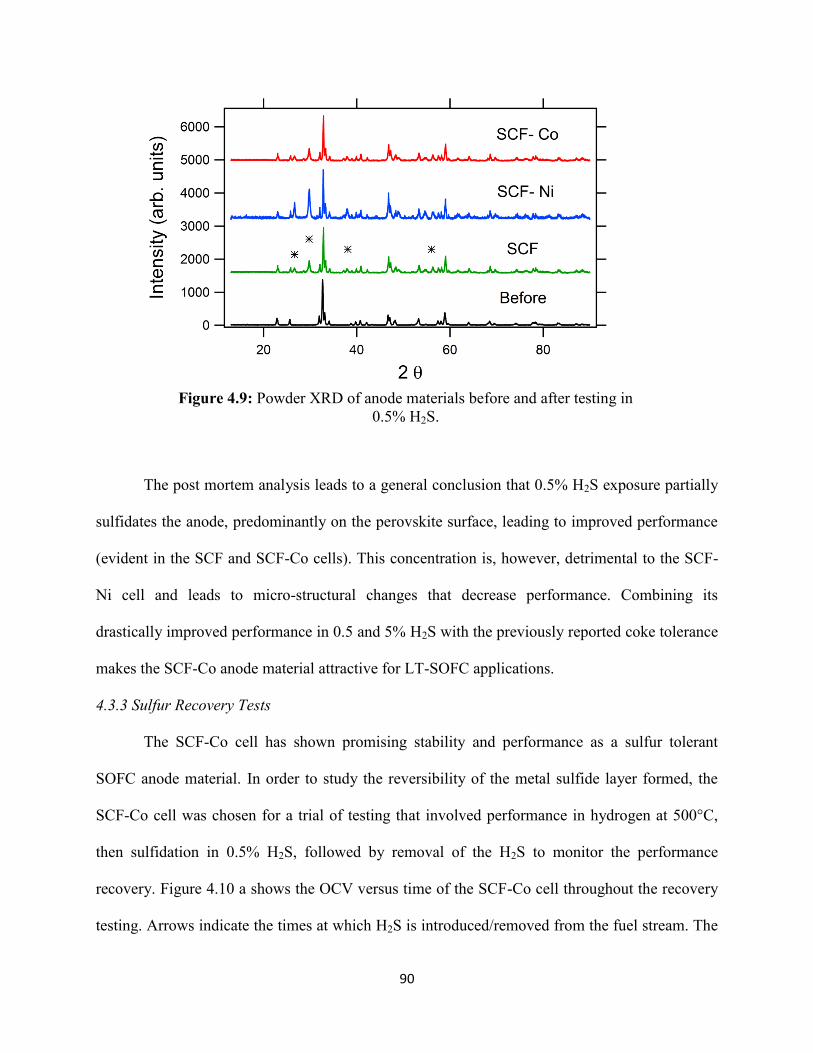
90
The post mortem analysis leads to a general conclusion that 0.5% H2S exposure partially
sulfidates the anode, predominantly on the perovskite surface, leading to improved performance
(evident in the SCF and SCF-Co cells). This concentration is, however, detrimental to the SCF-
Ni cell and leads to micro-structural changes that decrease performance. Combining its
drastically improved performance in 0.5 and 5% H2S with the previously reported coke tolerance
makes the SCF-Co anode material attractive for LT-SOFC applications.
4.3.3 Sulfur Recovery Tests
The SCF-Co cell has shown promising stability and performance as a sulfur tolerant
SOFC anode material. In order to study the reversibility of the metal sulfide layer formed, the
SCF-Co cell was chosen for a trial of testing that involved performance in hydrogen at 500°C,
then sulfidation in 0.5% H2S, followed by removal of the H2S to monitor the performance
recovery. Figure 4.10 a shows the OCV versus time of the SCF-Co cell throughout the recovery
testing. Arrows indicate the times at which H2S is introduced/removed from the fuel stream. The
Figure 4.9: Powder XRD of anode materials before and after testing in
0.5% H2S.
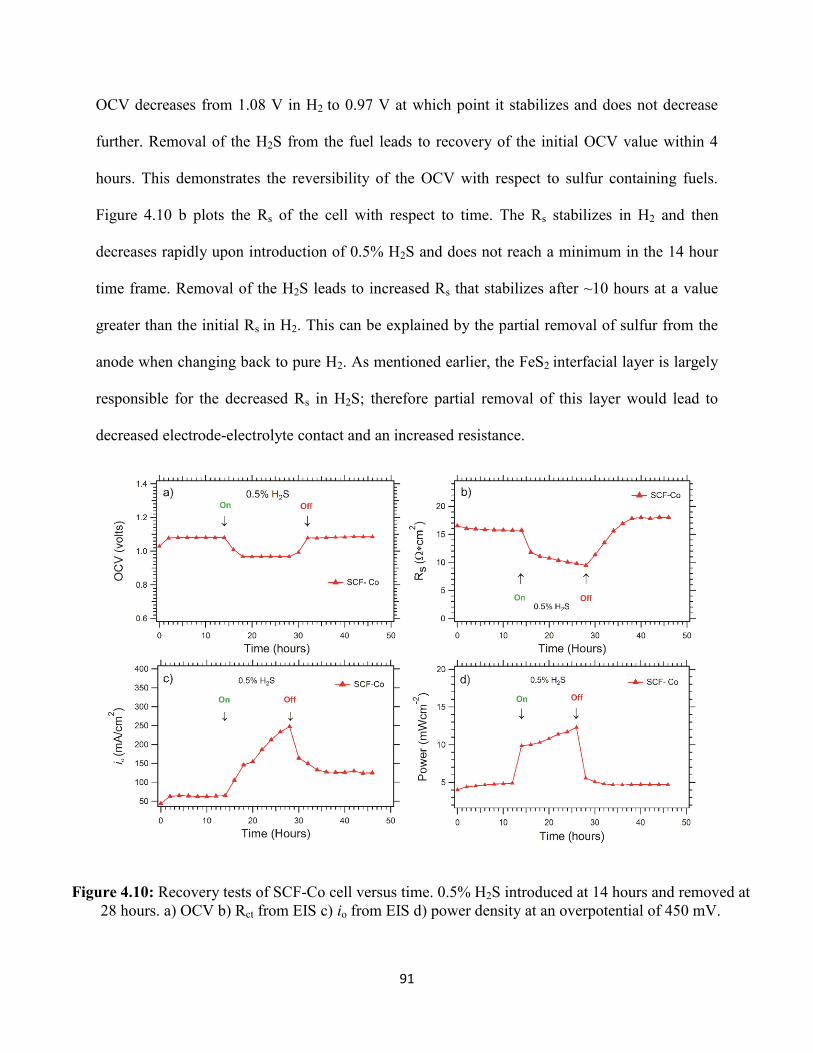
91
OCV decreases from 1.08 V in H2 to 0.97 V at which point it stabilizes and does not decrease
further. Removal of the H2S from the fuel leads to recovery of the initial OCV value within 4
hours. This demonstrates the reversibility of the OCV with respect to sulfur containing fuels.
Figure 4.10 b plots the Rs of the cell with respect to time. The Rs stabilizes in H2 and then
decreases rapidly upon introduction of 0.5% H2S and does not reach a minimum in the 14 hour
time frame. Removal of the H2S leads to increased Rs that stabilizes after ~10 hours at a value
greater than the initial Rs in H2. This can be explained by the partial removal of sulfur from the
anode when changing back to pure H2. As mentioned earlier, the FeS2 interfacial layer is largely
responsible for the decreased Rs in H2S; therefore partial removal of this layer would lead to
decreased electrode-electrolyte contact and an increased resistance.
Figure 4.10: Recovery tests of SCF-Co cell versus time. 0.5% H2S introduced at 14 hours and removed at
28 hours. a) OCV b) Rct from EIS c) io from EIS d) power density at an overpotential of 450 mV.
92
Figure 4.10 c shows the io values from impedance measurements every 2 hours for the
SCF-Co anode. Introducing 0.5% H2S leads to increased exchange current density that does not
stabilize within the measurement time frame. Removal of the H2S leads to a decrease in io that
stabilizes at a value greater than originally measured in H2. This indicates that sulfidation of the
anode leads to an irreversible change in the Rct, improving the anode performance even when
switching back to pure H2. This is most likely representative of sulfide species remaining on the
perovskite surface; the anode only partially returns to its initial composition and remains more
active. Figure 4.10 d plots the power density of the SCF-Co at an overpotential of 450 mV versus
cell operation time. This plot shows that the cell power output increases in sulfur containing fuels
and then returns to the original power after removal of the H2S. While these tests conclude that
the sulfidation process is not completely reversible, the anode performance recovers and
maintains an increased io when sulfur is removed from the fuel stream.
Post mortem SEM imaging of the SCF-Co cell (Figure 4.11 a) indicates that the anode
microstructure is maintained, as expected. Figure 4.11 b is a higher magnification image of the
anode after recovery and shows clusters of a separate phase on the perovskite surface. This
indicates that formation of the metal sulfide layer is only partially reversible within the
experimental time frame. This is also evident from the p-XRD shown in Figure 4.12; the phases
for S, FeS2 and Sm3S4 remain in the spectrum after recovery in H2. The remnants of conductive
metal sulfides on the anode surface are responsible for the increased io after recovery in H2.

93
Figure 4.12: Powder XRD of SCF-Co material as prepared and post recovery testing.
Figure 4.11: SEM images of SCF-Co anode post recovery testing.

94
4.4 Conclusions
A series of doped perovskite anode materials, SCF, SCF-Ni, SCF-Co, have been tested
for sulfur tolerance at 500°C. Results indicate that the introduction of 5% H2S enhances the
performance of these anodes, verified by EIS and CA experiments. Post mortem analyses
indicate that the performance enhancement arises from the partial sulfidation of the anode,
leading to the formation of FeS2, Sm3S4 and S on the perovskite surface. Testing in lower
concentrations of sulfur, 0.5% H2S, also enhances the performance of these anode materials.
Specifically, the SCF-Co anode shows an increased io from 13.72 to 127.02 mA/cm2 when
switching to 0.5% H2S/99.5% H2 fuel composition. Recovery tests performed on the SCF-Co
anode conclude that the OCV and power density of these cells are reversible within 4 hours of
removal of sulfur fuel. Also, we conclude that the formation of metal sulfide species is only
partially reversible, yielding an anode material with an overall lower Rct upon switching back to
pure H2. Combining their performance in sulfur containing fuels with their previously reported
coke tolerance makes these perovskites especially attractive as LT-SOFC anodes in sour fuels.

95
4.5 References
[1] E.D. Wachsman, K.T. Lee, Science 334 (2011) 935.
[2] J.T.S. Irvine, Perovskite Oxide for Solid Oxide Fuel Cells, Springer US, Boston, MA,
2009.
[3] S.C. Singhal, K. Kendall, High Temperature Solid Oxide Fuel Cells, Elsevier Inc., New
York, USA, 2003.
[4] Z. Cheng, J.-H. Wang, Y. Choi, L. Yang, M.C. Lin, M. Liu, Energy Environ. Sci. 4 (2011)
4380.
[5] W.. Zhu, S.. Deevi, Mater. Sci. Eng. 362 (2003) 228.
[6] A. Atkinson, S. Barnett, R.J. Gorte, J.T.S. Irvine, a J. McEvoy, M. Mogensen, S.C.
Singhal, J. Vohs, Nat. Mater. 3 (2004) 17.
[7] A. Ovalle, J. Ruizmorales, J. Canalesvazquez, D. Marrerolopez, J. Irvine, Solid State
Ionics 177 (2006) 1997.
[8] Z. Cheng, S. Zha, L. Aguilar, D. Wang, J. Winnick, M. Liu, Electrochem. Solid-State Lett.
9 (2006) A31.
[9] L. Aguilar, S. Zha, Z. Cheng, J. Winnick, M. Liu, J. Power Sources 135 (2004) 17.
[10] S.M. Bukhari, J.B. Giorgi, J. Power Sources 198 (2012) 51.
[11] S.M. Bukhari, J.B. Giorgi, J. Electrochem. Soc. 158 (2011) J159.
[12] S.M. Bukhari, J.B. Giorgi, Sensors Actuators B Chem. 181 (2013) 153.
[13] S.M. Bukhari, J.B. Giorgi, ECS Trans. 35 (2011) 1539.
[14] S.M. Bukhari, J.B. Giorgi, ECS Trans. 33 (2011) 81.
[15] S.M. Bukhari, J.B. Giorgi, Solid State Ionics 180 (2009) 198.
[16] S.M. Bukhari, J.B. Giorgi, Solid State Ionics 194 (2011) 33.
[17] C.M. Grgicak, R.G. Green, J.B. Giorgi, J. Power Sources 179 (2008) 317.
[18] C.M. Grgicak, J.B. Giorgi, J. Phys. Chem. C 111 (2007) 15446.
[19] H. Shi, W. Zhou, R. Ran, Z. Shao, J. Power Sources 195 (2010) 393.

96
[20] T. Miyashita, ECS Trans. 28 (2010) 39.
[21] T. Miyashita, Electrochem. Solid-State Lett. 14 (2011) B66.
[22] Z. Cheng, S. Zha, M. Liu, J. Electrochem. Soc. 153 (2006) A1302.
[23] Y. Matsuzaki, I. Yasuda, Solid State Ionics 132 (2000) 261.
[24] C.M. Grgicak, M.M. Pakulska, J.S. O’Brien, J.B. Giorgi, J. Power Sources 183 (2008) 26.
[25] J.S. O’Brien, J.B. Giorgi, J. Power Sources 200 (2012) 14.
[26] S. Zha, Z. Cheng, M. Liu, J. Electrochem. Soc. 154 (2007) B201.
[27] L. Yang, Z. Cheng, M. Liu, L. Wilson, Energy Environ. Sci. 3 (2010) 1804.
[28] L. Aguilar, S. Zha, S. Li, J. Winnick, M. Liu, Electrochem. Solid-State Lett. 7 (2004)
A324.
[29] S. Zha, P. Tsang, Z. Cheng, M. Liu, J. Solid State Chem. 178 (2005) 1844.
[30] Y. Shao-Horn, S. Osmialowski, Q.C. Horn, J. Electrochem. Soc. 149 (2002) A1499.
[31] M. Morsli, A. Bonnet, L. Cattin, A. Conan, S. Fiechter, Les Ed. Phys. (1995) 699.
[32] R. Schieck, A. Hartmann, S. Fiechter, R. Konenkamp, H. Wetzel, J. Mater. Res. 5 (1990)
1567.
[33] Environmental Protection Agency, Federal Air Quality Control Regions, Research
Triangle Park, NC, 1972.
[34] L. Zhang, S.P. Jiang, H.Q. He, X. Chen, J. Ma, X.C. Song, Int. J. Hydrogen Energy 35
(2010) 12359.
[35] M. Cooper, K. Channa, R. De Silva, D.J. Bayless, J. Electrochem. Soc. 157 (2010) B1713.
[36] Z. Xu, J. Luo, K.T. Chuang, J. Electrochem. Soc. 154 (2007) B523.

97
Chapter 5:
Conductivity of Y doped BaMoO3 perovskites and applications
as IT-SOFC anode materials
Abstract
A new perovskite family Ba1-xYxMoO3 (x=0-0.05) has been investigated in regards to
electrical conductivity and performance as IT-SOFC anode materials for the oxidation of H2.
Refinement of p-XRD spectra as well as SEM imaging conclude that the solubility limit of Y
doping at the A site is 5 mol%, beyond which Y2O3 segregation occurs. The undoped BaMoO3
sample has a colossal room temperature conductivity of 2500 S/cm in dry H2. All materials
maintain metallic conductivity in the temperature range of 25-1000°C with resistance increasing
with Y doping. The Ba1-xYxMoO3 (x=0, 0.05) materials exhibit good performance as SOFC
anode materials between 500-800°C, with Rct values at 500°C in dry H2 of 3.15 and 6.33
ohm*cm2 respectively. The catalytic performance of these perovskite anodes is directly related to
electronic conductivity, as concluded from composite anode performance.
5.1 Introduction
The solid oxide fuel cell (SOFC) is a promising device capable of direct chemical to
electrical energy conversion with high efficiencies and low emissions. However, the commercial
viability of SOFCs is limited by several factors, one of which is the extremely high operating
temperatures ( >800°C) required for adequate performance [1–4]. This has led to a spur of
research into new materials for low and intermediate temperature solid oxide fuel cells (IT-
SOFCs) in an attempt to reduce the material costs and facilitate the balance of plant. Perovskites
98
of the type ABO3, where A and B are metal cations, have been extensively reported in the past
decade as promising alternative SOFC anode materials due to their low cost, simple fabrication,
and high catalytic performance at reduced temperatures [3,5–9].
Molybdenum based perovskites (ABO3 where B = Mo) have long been known to exhibit
metallic like behavior with impressive electronic conductivities, as well as high stability in
reducing atmospheres at elevated temperatures [10–12]. Additionally, alkali earth molybdates
such as AMoO3 (A= Sr,Br) have been reported with high catalytic activity for the direct
oxidation of alcohols [13]. The catalytic activity of Mo and high electronic conductivity make
these materials attractive as SOFC anode materials.
Recently, the performance of several Mo perovskites as SOFC anode materials has been
reported in the literature [14–20]. For example, SrMo1-xFexO3 and SrMo1-xCrxO3 perovskites
have been demonstrated as SOFC anodes with impressive power densities in H2 at 800-850°C,
however the low temperature performance has not been investigated [15,16]. As well, double
perovskites such as Sr2MgMoO6 and Ba2MgMoO6 have been shown to have higher tolerance to
H2S (140 ppm) in comparison to traditional Ni-YSZ cermet anodes [19]. In all cases, the
catalytic performance is said to arise from the B site Mo in these perovskites.
Here we report on the synthesis, structural and electronic characterization of a new family
of perovskites with formulae Ba1-xYxMoO3 (x=0-0.05). The effect of Y doping on electronic
conductivity is investigated, in an attempt to increase the ionic conductivity in these materials.
As well, the application of these materials as SOFC anodes for the oxidation of H2 at 500-800°C
is reported.

99
5.2 Experimental
5.2.1 Powder Synthesis
The preparation of alkali-earth molybdate perovskites is generally performed by high
temperature reduction of the corresponding scheelite phase. Scheelite-type materials of formulae
Ba1-xYxMoO4 (x=0-0.07) were prepared by decomposition of citrate precursors using the sol-gel
method. Starting materials included: Barium nitrate (Ba(NO3)2, AlfaAesar, 99.9%), yttrium
nitrate hexahydrate (Y(NO3)3 6H2O), AlfaAesar, 99.9%), ammonium molybdate tetrahydrate
((NH4)6Mo7O24 4H2O, AlfaAesar, 99.9%) and citric acid monohydrate (AlfaAesar, minimum
99%). Solids were weighed according to the desired stoichiometry and dissolved separately in
de-ionized water. The resulting precursor solutions were combined and added to aqueous citric
acid so that the ratio of citric acid to total metal ion was 1:1. The solution was dried at 120°C for
24 hours resulting in a citrate gel precursor that was subsequently ground and calcined at 700°C
for 24 hours using heating/cooling ramp rates of 5°C/min.
The resulting white powder (Scheelite phase) was thoroughly ground and reduced in a
tube furnace at 700°C for 16 hours in an atmosphere of H2. The total gas flow rate of H2 was 50
sccm, maintained with an Alicat mass flow controller. Complete reduction to the perovskite
phase with formulae Ba1-xYxMoO3 (x=0-0.07) was indicated by a color change to dark red/black,
verified by XRD.
5.2.2 Electrical Conductivity
The electrical conductivities of Ba1-xYxMoO3 (x=0-0.07) perovskites were measured
using a 4-point contact method on sintered pellets as outlined in Chapter 2. To prepare pellets for
conductivity measurement, 3.5 grams of precursor scheelite phase was weighed into a die and

100
pressed to 15000 lbs for 2 minutes using a Carver laboratory press. The scheelite pellets were
sintered to 1100°C for 4 hours with heating/cooling ramp rates of 2°C/min. The resulting discs
were cut into rectangular pellets followed by the addition of 4 Pt wire electrodes. The Pt wire
electrodes were wrapped and subsequently painted over with Pt paste to ensure electrical contact.
The pellet was then fired at 800°C for 1 hr to remove the organic binder. The prepped pellet was
then contained in a quartz sample tube sealed on either end with rubber septa and placed in a
tube furnace controlled by a Barber-Colman temperature controller. 4 lengths of Pt wire served
as electrode leads, extending from the quartz sample tube.
The scheelite pellet was reduced at 700°C for 16 hours in flowing H2 at 50 sccm,
maintained with Alicat mass-flow controllers. Following reduction, the outer 2 electrodes were
connected to a power supply set to 100 mA constant current and the voltage drop across the inner
2 electrodes was monitored with a digital multi-meter. The temperature was ramped in
increments of 100°C with voltage measurements recorded after 30 mins of equilibration at each
temperature. The electrical conductivity of the sample was calculated from Ohm’s law and the
dimensions of the pellet.
5.2.3 Characterization
Powder X-Ray Diffraction (XRD, Philips PW 1830) was used to determine the phase
composition and lattice parameters of the perovskite powders. The instrument used CuKα
radiation( λ = 1.54 Å) and the scattering angle, 2θ, was scanned between 13° and 90° at a rate of
0.02°/s. Panalytical X’Pert Highscore Plus soft-ware was used for profile refinement and phases
were indexed to the Powder Diffraction File database (JCPDS, 2012).

101
Scanning electron microscopy (SEM, JEOL JSM-7500F) with an energy dispersive X-ray
spectroscopy (EDS X-Sight) attachment was used to image the surface morphology of the
powders/pellets and provide qualitative elemental composition.
5.2.4 Button Cell Testing
Electrolyte supported cells were assembled following a general procedure used in our
group [21,22]. To form the electrolyte, 2 grams of 20% samarium doped ceria (SDC-20,
FuelCellMaterials.com) was uni-axially pressed in a 12 mm die to 15000 lbs for 2 minutes. The
pellets were sintered at 1400°C for 4 hrs using heating/cooling ramp rates of 2°C/min yielding an
electrolyte thickness of ~2 mm. To prepare the anode, a slurry was made consisting of the
perovskite powder in an emulsion (20% Triton-X100 / 80% H2O v/v). The slurry was painted on
one side of the electrolyte disc and fired at 1400°C for 4 hours. A platinum mesh current
collector (AlfaAesar, 99.9%) was embedded with additional anode slurry and fired again at
1400°C for 4 hours. The cathode consisted of 50% w/w LSCF (FuelCellMaterials.com)/SDC-20
with a Pt mesh current collector and was prepared in the same manner as the anode. The
effective electrode areas were 1.5 cm2. The reference electrode in this setup was a Pt wire
wrapped horizontally around the electrolyte and coated in Pt paste that was subsequently heated
to 800°C for 2 hrs to remove the organic binder.
Electrochemical tests were performed using a Volta-Lab PGZ 301 (Radiometer
Analytical) connected to a desktop computer running VoltaMaster 4 software. The programmed
sequence of tests included open cell voltage (OCV), electrochemical impedance spectroscopy
(EIS) at OCV (100 kHz to 100 mHz with an AC amplitude of 10 mA), and chrono amperometry
(CA) experiments at overpotentials from 0 V to 1.0 V in increments of 50 mV. To ensure

102
adequate sealing, only cells with initial OCVs in H2 of 0.93 V at 500°C and higher were accepted
for complete electrochemical testing.
The analysis of EIS data was performed in the ZView program (Scribner Associates) by
fitting impedance curves to an equivalent circuit model (L1RS[RCTCPE1]). Only a single
depressed semi-circle is apparent in impedance spectra of these materials, therefore a simple
circuit model is used. Here, L1 is an inductor to account for impedance in electrode leads and
CPE1 is a constant phase element accounting for anode current variations (depressed Nyquist
semi-circle). The circuit model also consists of a serial resistance (Rs), and a charge transfer
resistance of the anode (Rct) used to calculate the exchange current density (io) according to the
low field approximated Butler-Volmer equation. This circuit model omits certain elements, such
as Warburg diffusion parameters, and the anode polarization resistance (Rp) is assumed to be
equal to Rct. The cell power densities were calculated from chronoamperometry experiments at
various overpotentials.
5.3 Results and Discussion
5.3.1 Characterization
Precursor scheelite materials of formulae Ba1-xYxMoO4 (x=0-0.07) were structurally
characterized using p-XRD, shown in Figure 5.1. The undoped material, BaMoO4, can be
indexed to previously prepared barium molybdate spectra in the literature (PDF: 04-007-8397).
The inclusion of Y leads to a slight shift in peak position due to the smaller ionic size of Y3+
compared to Ba2+
.

103
Doping in concentrations of 7% and higher leads to the evolution of new peaks in the
diffractogram at 2θ = 29° shown in Figure 5.2, indication of separate phase formation. The
formation of this phase is also evident from SEM imaging of the calcined material, shown in
Figure 5.2, where small particles on the order of 200-500 nm are visible on the material surface.
EDS spot analysis as well as database indexing of the p-XRD indicate that the new phase formed
is Y2O3 (PDF: 00-001-0831).
Figure 5.1: p-XRD of Ba1-xYxMoO4 (x= 0-0.07) scheelite materials. The
asterisk in spectra x=0.07 indicates the onset of yttria phase evolution.
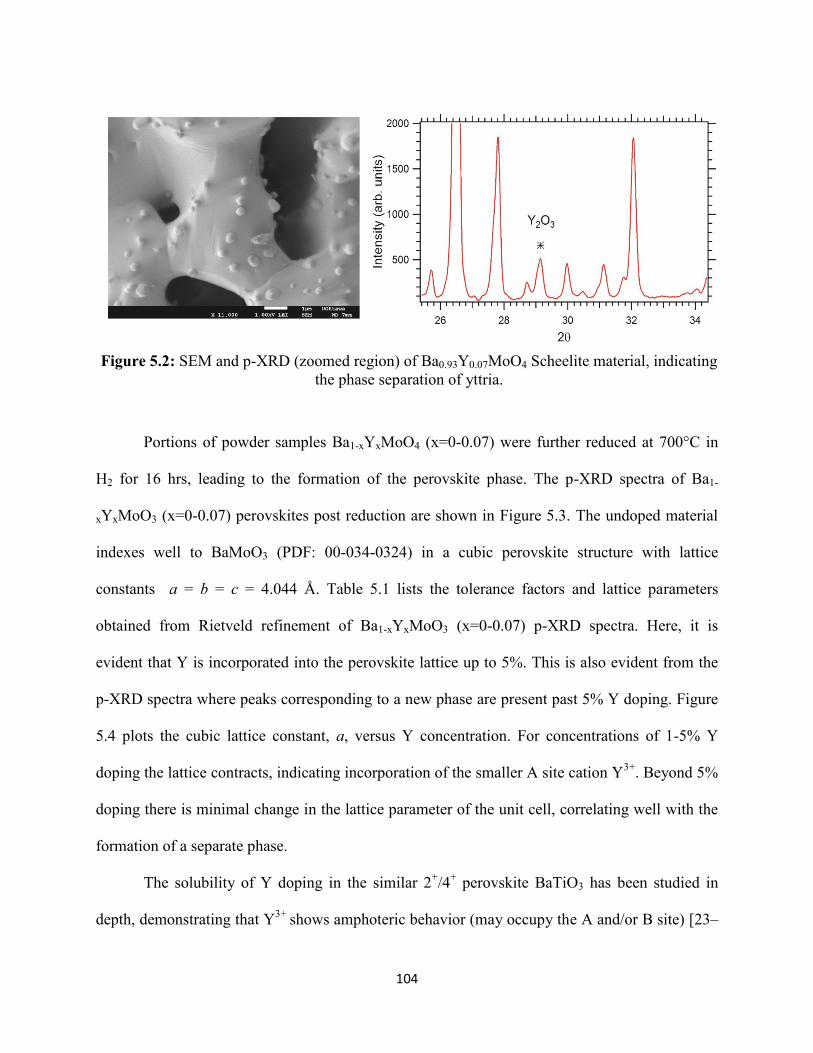
104
Portions of powder samples Ba1-xYxMoO4 (x=0-0.07) were further reduced at 700°C in
H2 for 16 hrs, leading to the formation of the perovskite phase. The p-XRD spectra of Ba1-
xYxMoO3 (x=0-0.07) perovskites post reduction are shown in Figure 5.3. The undoped material
indexes well to BaMoO3 (PDF: 00-034-0324) in a cubic perovskite structure with lattice
constants a = b = c = 4.044 Å. Table 5.1 lists the tolerance factors and lattice parameters
obtained from Rietveld refinement of Ba1-xYxMoO3 (x=0-0.07) p-XRD spectra. Here, it is
evident that Y is incorporated into the perovskite lattice up to 5%. This is also evident from the
p-XRD spectra where peaks corresponding to a new phase are present past 5% Y doping. Figure
5.4 plots the cubic lattice constant, a, versus Y concentration. For concentrations of 1-5% Y
doping the lattice contracts, indicating incorporation of the smaller A site cation Y3+
. Beyond 5%
doping there is minimal change in the lattice parameter of the unit cell, correlating well with the
formation of a separate phase.
The solubility of Y doping in the similar 2+/4
+ perovskite BaTiO3 has been studied in
depth, demonstrating that Y3+
shows amphoteric behavior (may occupy the A and/or B site) [23–
Figure 5.2: SEM and p-XRD (zoomed region) of Ba0.93Y0.07MoO4 Scheelite material, indicating
the phase separation of yttria.

105
25]. The amphoteric behavior arises from the intermediate ionic radius of Y3+
( rion= 0.9 Å),
allowing for its incorporation in both cation positions within the perovskite lattice [25]. The
preference of Y for the A or B site is related to several parameters such as firing atmosphere and
temperature, but can be controlled by the relative concentrations of parent A and B cations [23].
In this case, a stoichiometric deficit of A site Ba2+
is introduced for the preparation method,
leading to Y preferentially doping at the A site. We can conclude from p-XRD data and SEM
imaging that the solubility limit of A site Y doping in BaMoO3 is approximately 5% whereas
increasing concentrations of Y lead to amphoteric behavior as well as phase separation.
Figure 5.3: p-XRD of Ba1-xYxMoO3 (x=0-0.07) perovskites post reduction in H2.

106
Table 5.1: Tolerance factors and P-XRD lattice parameters of Ba1-xYxMoO3 (x=0-0.20)
perovskites.
Unit Cell
Ba1-xYxMoO3 Tolerance Factor (t) a,b,c (Å) Volume (Å3)
x=0.00 1.035 4.0440 66.135
x=0.01 1.033 4.0435 66.110
x=0.03 1.028 4.0427 66.072
x=0.05 1.023 4.0419 66.032
x=0.07 1.018 4.0416 66.018
x=0.10 1.011 4.0415 66.013
x=0.15 0.998 4.0413 66.003
x=0.20 0.987 4.0414 66.008
Figure 5.4: Lattice parameter, a, versus Y concentration in Ba1-
xYxMoO3 (x=0-0.20) perovskites.

107
Following reduction, the material undergoes significant microstructural changes, evident
from SEM imaging shown in Figure 5.5. Reduction to the perovskite phase leads to a highly
crystalline material with crystallite sizes ranging from 200-500 nm. The material has moderate
porosity with pore sizes on the order of 5-10 µm in diameter, as estimated from SEM imaging.
Figure 5.5: SEM images of Ba0.95Y0.05MoO3 perovskite following reduction in H2.
5.3.2 Electrical Conductivity
The electrical conductivities of Ba1-xYxMoO3 (x=0-0.07) perovskites were measured
using the 4-point contact method on sintered pellets between 25-1000°C in dry H2, as shown in
Figure 5.6. All materials exhibit metallic behavior, mainly, a decrease in electronic conductivity
with increased temperature. BaMoO3 has been previously shown to have impressive metallic
conductivity, a claim that is further reinforced in the current study where the undoped sample has
σ values of 2500 S/cm and 444 S/cm at 25°C and 800°C respectively [14]. The incorporation of
Y at the A site leads to increased resistance in these materials, a trend that is consistent with the
inclusion of other dopants such as K+1
[14]. Nevertheless, the Y doped samples maintain
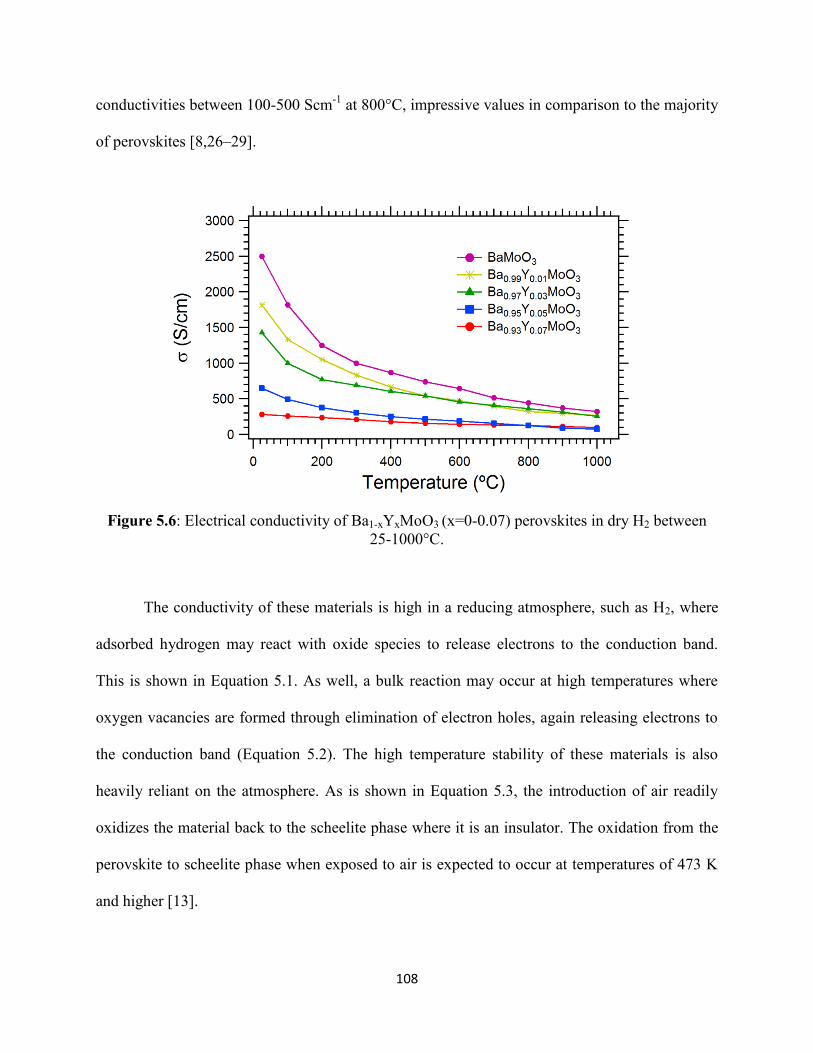
108
conductivities between 100-500 Scm-1
at 800°C, impressive values in comparison to the majority
of perovskites [8,26–29].
Figure 5.6: Electrical conductivity of Ba1-xYxMoO3 (x=0-0.07) perovskites in dry H2 between
25-1000°C.
The conductivity of these materials is high in a reducing atmosphere, such as H2, where
adsorbed hydrogen may react with oxide species to release electrons to the conduction band.
This is shown in Equation 5.1. As well, a bulk reaction may occur at high temperatures where
oxygen vacancies are formed through elimination of electron holes, again releasing electrons to
the conduction band (Equation 5.2). The high temperature stability of these materials is also
heavily reliant on the atmosphere. As is shown in Equation 5.3, the introduction of air readily
oxidizes the material back to the scheelite phase where it is an insulator. The oxidation from the
perovskite to scheelite phase when exposed to air is expected to occur at temperatures of 473 K
and higher [13].
109
[5.1]
[5.2]
[5.2]
5.3.3 Applications as SOFC anode materials
The effect of Y doping on the anode performance of these perovskites was studied via
button cell testing at temperatures between 500-800°C in dry H2. SDC electrolyte supported cells
with anode materials of Ba1-xYxMoO3 (x=0, 0.05) were fabricated and tested as outlined in
Chapter 2 with results shown in Figure 5.7. Power vs. current density plots of these cells between
500-800°C are shown in Figure 5.7 a and b for anode materials Ba1-xYxMoO3 (x=0, 0.05)
respectively. It is important to note that the low values for power in this case arise from the
button cell geometry used (thick electrolyte). Both anodes exhibit increased power densities at
higher temperatures, as expected, with the BaMoO3 anode outperforming the Y doped material.
We attribute the decreased power and current densities to the increased electrical resistance of
the Y doped perovskite. As previously discussed, the conductivity of Ba0.95Y0.05MoO3 at 500°C
is 216 S/cm compared to 741 S/cm for the BaMoO3 material. An increased material resistance
leads to an overall decrease in current density for the doped anode material.

110
The EIS spectra were fit according to the equivalent circuit (L1RS[RCTCPE1]), used
previously in this thesis work, with data listed in Table 5.2. The Ba1-xYxMoO3 (x=0, 0.05) anode
materials have low values for charge transfer resistance (Rct) and therefore high exchange current
densities (i0). An example Nyquist plot for the Ba0.95Y0.05MoO3 anode at 500°C is shown in
Figure 5.8. Both cells exhibit high values for serial resistance (Rs), an indication of poor anode-
electrolyte connectivity. This is directly related to the preparation of the button cell. This is due
to issues with sintering; the molybdate materials did not achieve a good contact when co-sintered
with the electrolyte during firing. This is most likely due to the difference in thermal expansions
coefficient (TEC) of these perovskites compared to SDC. Ultimately, this leads to an
Figure 5.7: Power and voltage vs. current density plots of a) BaMoO3 and b)
Ba0.95Y0.05MoO3 anode materials between 500-800°C.

111
inhomogeneous material connection at the anode-electrolyte interface, shown in Figure 5.9.
Nevertheless, this work demonstrates the activity of the Ba1-xYxMoO3 (x=0, 0.05) anode
materials for H2 oxidation.
Figure 5.8: Nyquist plot of EIS for Ba0.95Y0.05MoO3 anode at 500°C.
Table 5.2: EIS data for The Ba1-xYxMoO3 (x=0, 0.05) anode materials at 500-800°C.
Temperature
OCV (Volts) Rs
(ohm*cm2
) Rct
(ohm*cm2
) io (mA/cm2)
x=0 x=0.05 x=0 x=0.05 x=0 x=0.05 x=0 x=0.05
500°C 1.019 0.992 32.27 63.83 3.15 6.33 21.12 10.52
600°C 0.961 0.944 15.78 23.71 0.34 1.10 197.65 60.55
700°C 0.891 0.886 8.06 10.58 0.12 0.38 550.48 175.29
800°C 0.807 0.825 7.39 7.29 0.11 0.11 611.09 605.53

112
In an attempt to improve the anode-electrolyte contact, hence decreasing the serial
resistance, composite materials consisting of 50% SDC/50% perovskite (w/w) were prepared via
mixing of the scheelite precursor with SDC followed by 16 hrs reduction in dry H2 at 700°C.
This yields a dual phase perovskite/SDC material that is completely stable to ionic inter-
diffusion upon high temperature reduction in H2. This is illustrated in Figure 5.10. The inclusion
of SDC improved the TEC match between anode and electrolyte, thereby allowing for the high
temperature co-sintering of these anode materials. SDC is known to have high ionic conductivity
and should therefore increase the size of the triple phase boundary (TPB) as outlined in Chapter
1, however, when tested for performance at 800°C the EIS data revealed a drastic increase in
both serial resistance and charge transfer resistance. Figure 5.11 shows an EIS Nyquist plot for
the x=0.05 anode at 800°C. Clearly, the addition of SDC to form a composite anode material
immensely reduces the electronic conductivity of the anode, hindering performance. As well, it
has been previously concluded that the catalytic performance of similar perovskite materials is
directly related to the B site Mo. This means that the formation of a composite anode material
not only reduces the electronic conductivity, but also decreases the amount of Mo and therefore
Figure 5.9: Post mortem cross sectional SEM of anode-electrolyte interface of
Ba1-xYxMoO3 (x= 0.05) fuel cell.
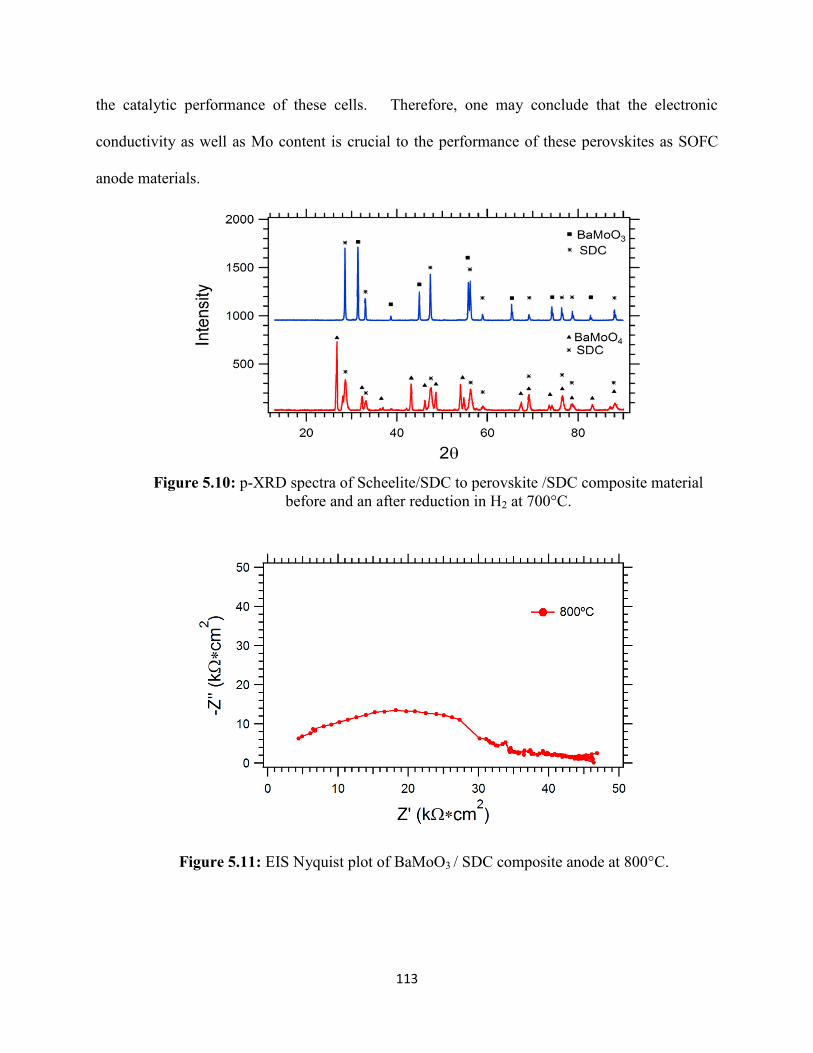
113
the catalytic performance of these cells. Therefore, one may conclude that the electronic
conductivity as well as Mo content is crucial to the performance of these perovskites as SOFC
anode materials.
Figure 5.11: EIS Nyquist plot of BaMoO3 / SDC composite anode at 800°C.
Figure 5.10: p-XRD spectra of Scheelite/SDC to perovskite /SDC composite material
before and an after reduction in H2 at 700°C.

114
As mentioned previously, the rapid high temperature oxidation of these materials means
that the perovskite structure, and hence high conductivity, is only stable in a reducing
atmosphere. Interestingly, post mortem p-XRD of the tested anode materials, Ba0.95Y0.05MoO3
anode for example, revealed that the dominant phase is the oxidized scheelite form (Figure
5.12a). The oxidation to the perovskite may occur during the quenching procedure, in which the
Pyrex seal at the anode side of the button cell is particularly susceptible to cracking. The
formation of even slight cracks in the seal would lead to an inflow of air to the anode at elevated
temperature; a possible explanation for the re-oxidation upon cooling. In addition to cracks in the
Pyrex seal, drawing current from the button cell during chronoamperometry experiments may
lead to partial oxidation of the perovskite at the anode-electrolyte interface from the diffusion of
oxide species through the SDC electrolyte. To test for oxidation due to cracks, another fuel cell
consisting of a Ba0.95Y0.05MoO3 anode was mounted on the test apparatus, sealed at 950°C in air,
and then reduced in a typical fashion in dry H2 overnight. An OCV experiment confirmed
complete sealing of the cell. Then, instead of quenching, the cell was slow cooled to room
temperature with a constant flow of H2 to the anode. The p-XRD of the anode post cooling
(Figure 5.12 b) indicates the retention of the perovskite phase. This confirms the hypothesis that
the re-oxidation witnessed previously is a result of cracks formed during rapid cooling of the fuel

115
cell.
This is intriguing when considering the results of the composite anode (Ba0.95Y0.05MoO3
/SDC) testing outlined previously (Figures 5.10 and 5.11). This cell exhibited extremely high
values for both Rs and Rct (Figure 5.11), an indication of poor anode performance or poor contact
from sintering. The high resistance of this anode may also be attributed to an incomplete sealing
of the cell, leading to the oxidized scheelite form of the anode instead of perovskite when
measuring the impedance. The highly insulating scheelite phase would exhibit large values for
both Rs and Rct when analyzing the EIS data. Repeated tests with optimized cell sealing may lead
to the retention of the perovskite and hence improved results. Aside from the integrity of the gas
seal, one cannot rule out the possibility of full or partial oxidation of the perovskite to the
scheelite phase due to the diffusion of oxide anions to the anode during operation.
Figure 5.12: Post mortem p-XRD of Ba0.95Y0.05MoO3 anodes after a) quenching and b) slow
cooling.
116
5.4 Conclusion
A new perovskite family Ba1-xYxMoO3 (x=0-0.05) has been prepared via high
temperature reduction of the corresponding scheelite type precursors followed by structural and
electronic characterization. Refinement of the p-XRD spectra as well as SEM imaging conclude
that the solubility limit of Y doping at the A site is 5 mol%, beyond which Y2O3 segregation
occurs. 4-point electronic conductivity measurements on sintered pellets indicate that the
undoped BaMoO3 sample has a colossal room temperature conductivity of 2500 S/cm in dry H2.
As well, all materials investigated maintain metallic conductivity in the temperature range of 25-
1000°C with resistance increasing upon Y doping. The Ba1-xYxMoO3 (x=0, 0.05) materials
exhibit good performance as SOFC anode materials between 500-800°C, with Rct values at
500°C in dry H2 of 3.15 and 6.33 ohm*cm2 respectively. The formation of a 50% SDC/50%
perovskite (w/w) composite anode yields a stable material that can be co-sintered with the SDC
electrolyte. Results of composite anode testing indicated poor performance, however we
conclude that the integrity of the Pyrex seal may be in question, confirmed by post mortem p-
XRD of quenched vs. slow cooled anodes.
5.5 References
[1] P. Cowin, C. Petit, R. Lan, J.T.S. Irvine, S. Tao, Adv. Energy Mater. 1 (2011) 314.
[2] J.B. Goodenough, Y.-H. Huang, J. Power Sources 173 (2007) 1.
[3] J.T.S. Irvine, Perovskite Oxide for Solid Oxide Fuel Cells, Springer US, Boston, MA,
2009.
[4] S.C. Singhal, K. Kendall, High Temperature Solid Oxide Fuel Cells, Elsevier Ltd, New
York, USA, 2003.
[5] C. Sun, U. Stimming, J. Power Sources 171 (2007) 247.

117
[6] S. Suthirakun, G. Xiao, S.C. Ammal, F. Chen, H.-C. zur Loye, A. Heyden, J. Power
Sources 245 (2014) 875.
[7] S. Hui, A. Petric, J. Eur. Ceram. Soc. 22 (2002) 1673.
[8] D.P. Fagg, V. V Kharton, A. V Kovalevsky, A.P. Viskup, J. Eur. Ceram. Soc. 21 (2001)
1831.
[9] S.M. Bukhari, J.B. Giorgi, ECS Trans. 33 (2011) 81.
[10] K. Kurosaki, T. Oyama, H. Muta, M. Uno, S. Yamanaka, J. Alloys Compd. 372 (2004) 65.
[11] S. Yamanaka, K. Kurosaki, T. Maekawa, T. Matsuda, S. Kobayashi, M. Uno, J. Nucl.
Mater. 344 (2005) 61.
[12] I. Nagai, N. Shirakawa, S. Ikeda, R. Iwasaki, H. Nishimura, M. Kosaka, Appl. Phys. Lett.
87 (2005) 024105.
[13] J. Kubo, W. Ueda, Mater. Res. Bull. 44 (2009) 906.
[14] S.B. Zhang, Y.P. Sun, B.C. Zhao, R. Ang, X.B. Zhu, W.H. Song, J. Alloys Compd. 479
(2009) 22.
[15] R. Martínez-Coronado, J. a. Alonso, a. Aguadero, M.T. Fernández-Díaz, J. Power Sources
208 (2012) 153.
[16] R. Martínez-Coronado, J. a. Alonso, a. Aguadero, M.T. Fernández-Díaz, Int. J. Hydrogen
Energy (2013) 1.
[17] Q. Liu, D.E. Bugaris, G. Xiao, M. Chmara, S. Ma, H.-C. zur Loye, M.D. Amiridis, F.
Chen, J. Power Sources 196 (2011) 9148.
[18] Y.-H. et al. Huang, Science (80-. ). 312 (2006) 254.
[19] T.G. Howell, C.P. Kuhnell, T.L. Reitz, a. M. Sukeshini, R.N. Singh, J. Power Sources 231
(2013) 279.
[20] B. He, Z. Wang, L. Zhao, X. Pan, X. Wu, C. Xia, J. Power Sources 241 (2013) 627.
[21] S.M. Bukhari, J.B. Giorgi, J. Power Sources 198 (2012) 51.
[22] C.M. Grgicak, R.G. Green, J.B. Giorgi, J. Power Sources 179 (2008) 317.
[23] M. Lin, H. Lu, Mateirials Sci. Eng. Sci. Eng. 335 (2002) 101.
[24] P. Blanchart, J.F. Baumard, P. Abelard, J. Am. Ceram. Soc. 72 (1992) 1068.

118
[25] Y. Tsur, T.D. Dunbar, C.A. Randall, J. Electroceramics 2 (2001) 25.
[26] Z. Cheng, S. Zha, L. Aguilar, D. Wang, J. Winnick, M. Liu, Electrochem. Solid-State Lett.
9 (2006) A31.
[27] T. Miruszewski, B. Bochentyn, J. Karczewski, M. Gazda, B. Kusz, Cent. Eur. J. Phys. 10
(2012) 1202.
[28] H. Wiemhofer, Solid State Ionics 175 (2004) 93.
[29] J.J. Tunney, M.L. Post, J. Electroceramics 51 (2000) 63.

119
Chapter 6
Conclusions
The development of new perovskite materials for SOFC anodes and electrochemical gas
sensors is currently an area of intense chemical research. The optimization of their electronic
properties through elemental doping may one day lead to the incorporation of perovskites into
many technological fields. Three separate perovskite systems have been investigated in this
work, with intriguing and promising results when applied as sensors and SOFC anode materials.
Primary findings of this work concluded that low mol% A site Ce doping in the BaFeO3
perovskite leads to several advantageous properties. The incorporation of 5 mol% Ce changes the
perovskite structure from hexagonal to cubic and, in doing so, leads to the formation of oxygen
vacancies through charge compensation. The net result is an increase in total conductivity
throughout the entire temperature range, reaching a value of 3.3 S/cm at 800°C in air. It was
further determined that the increase in total conductivity arises from increased electronic and
ionic conductivities in the material. The Ba0.95Ce0.05FeO3-δ material was found to have the highest
conductivity and was further tested as an oxygen sensor at temperatures of 500-700°C. The
sensor experiments yielded reproducible, linear sensing behavior for oxygen concentrations of
25-45% in air. As well, the high temperature bulk equilibration of oxygen throughout the
material leads to promising temperature independent sensing behavior. Testing of these materials
in a more predictable manner, with the utilization of a spray system and thin film sensor setup,
should yield a behavior that may be compared to conventional state of the art oxygen sensors
used in commercial lean burn engines.
Perovskites are also promising candidates as SOFC anode materials in light of the
limitations of conventional Ni-YSZ anodes employed today. Perovskites with formulae

120
Sm0.95Ce0.05Fe1-xMxO3-δ where the dopant M is either Co or Ni in 3 mol% have previously been
shown to be active as SOFC anode materials at intermediate temperatures (500-800°C) for H2
and CH4 oxidation. In order to advance research into these types of perovskites, an investigation
into their sulfur tolerance is crucial. Therefore, three perovskites Sm0.95Ce0.05FeO3-δ,
Sm0.95Ce0.05Fe0.97Ni0.03O3-δ and Sm0.95Ce0.05Fe0.97Co0.03O3-δ were tested as anode materials at
500°C in two concentrations of H2S: 0.5% and 5% balanced in H2. Interestingly, H2S
significantly enhances the performance of these anode materials, verified by impedance
spectroscopy and DC chronoamperometry experiments. The improvement arises from a surface
sulfidation of the perovskite anode microstructure, leading to the formation of metal sulfides that
increase the overall anode conductivity. Extensive post mortem analysis revealed that the
presence of H2S also forms a highly conductive FeS2 layer at the anode-electrolyte interface,
dramatically improving the electrode contact through a decrease in resistance. The SCF-Co
anode exhibited the most promising improvement, with an increase in exchange current density,
io, from 13.72 to 127.02 mA/cm2 when switching from H2 to 0.5% H2S/99.5% H2 fuel
composition. Recovery tests performed on the SCF-Co anode conclude that the open cell
voltage (OCV) and power density of these cells recover within 4 hours of H2S removal. We
conclude that the formation of metal sulfide species is only partially reversible, yielding an
anode material with an overall lower Rct upon switching back to pure H2. This is verified by post
mortem SEM imaging where clusters of metal sulfides remain on the perovskite surface after
recovering in H2.
Combining their performance in sulfur containing fuels with their previously reported
coke tolerance makes these perovskites especially attractive as low temperature SOFC anodes in
sour fuels. Especially of interest is the improvement witnessed when switching to a mixture of

121
H2S and H2 fuel. Further research should investigate the sulfur tolerance of these materials when
utilizing carbon based fuels such as CH4. The sulfidation improvement witnessed in H2S/H2 may
also be evident when utilizing methane with sulfur impurities. This is of interest when
considering the anode coking as well since these materials have previously been demonstrated to
be coke resistant.
The final area of research for this thesis involved the structural and electronic effects of Y
doping in the BaMoO3 perovskite system, with a primary goal of improving the ionic
conductivity in these materials. Structural characterization revealed that Y has a moderate
solubility at the A site in BaMoO3, with an experimental solubility limit of 5 mol%. As well,
these perovskites have colossal electronic conductivities, as high as 2500 S/cm in dry H2, which
decrease with increasing concentrations of Y. The decrease in electronic conductivity upon Y
doping is expected and, if accompanied by an improvement in ionic conductivity, should yield a
promising MIEC for SOFC anode applications. Difficulties arise when considering the redox
chemistry of these perovskites since they readily oxidize to the scheelite structure when exposed
to air at elevated temperatures. This limits the measurement of conductivity to a reducing
atmosphere. Further work should consider alternative methods to separate and measure the ionic
and electronic contributions to total conductivity.
To compare their performance as SOFC anode materials, the BaMoO3 and
Ba0.95Y0.05MoO3 perovskites were tested at temperatures of 500-800°C in dry H2. The undoped
material exhibited the most promising performance, with low values for charge transfer
resistance and high exchange current densities. Further testing as a composite anode material
(50% w/w perovskite/SDC) resulted in poor performance, evident from EIS experiments.
However, post mortem XRD imaging of the anode indicates that the Pyrex gas seal is especially

122
important when considering the performance of these materials due to the ease of oxidation when
exposed to air at high temperatures. Further experimentation with alternative sealing materials
may improve the performance of the barium molybdates by ensuring complete isolation from air
at the anode, thereby avoiding oxidation from perovskite to the insulating scheelite phase.


