Donor Selection: Cord Blood. Prof Elizabeth J Shpall
26
ELIZABETH J SHPALL, MD Houston, USA • Professor of Medicine and Chair of Cord Blood Transplant Program, UT MD Anderson Cancer Center • As a nationally recognized expert in stem cell transplantation, Medical Director of the GMP Cell Therapy Laboratory since 2002, and the Director of the Cord Blood Bank (CBB) at M. D. Anderson Cancer Center since 2004, Dr. Shpall's research covers a range of applications, among them: leukemia, lymphoma treatment, anti-tumor immunity enhancement, and tissue repair. Dr. Shpall’s influence is felt beyond the Texas Medical Center. She is the current vice-president of FACT Netcord, having chaired their Cord Blood Standards Committee since 1999, and she was the founding president and has been a board member of the Foundation Accreditation of Hematopoietic Cell Therapy since 1995.
Transcript of Donor Selection: Cord Blood. Prof Elizabeth J Shpall

ELIZABETH J SHPALL, MDHouston, USA
• Professor of Medicine and Chair of Cord Blood Transplant Program, UT MD Anderson Cancer Center
• As a nationally recognized expert in stem cell transplantation, Medical Director of the GMP Cell Therapy Laboratory since 2002, and the Director of the Cord Blood Bank (CBB) at M. D. Anderson Cancer Center since 2004, Dr. Shpall's research covers a range of applications, among them: leukemia, lymphoma treatment, anti-tumor immunity enhancement, and tissue repair. Dr. Shpall’sinfluence is felt beyond the Texas Medical Center. She is the current vice-president of FACT Netcord, having chaired their Cord Blood Standards Committee since 1999, and she was the founding president and has been a board member of the Foundation Accreditation of Hematopoietic Cell Therapy since 1995.

Selection of Optimal Cord Blood Units
Elizabeth J. Shpall MD
•

• Immune suppression
• Supportive care
-7 +28 +100 +180 +1 year0
Chemo-radiation
Intensity
Patient-Related Factors
• Biology of Malignancy: determines need for high dose conditioning vs reliance
on GVL or likelihood of futility
• Patient Characteristics (age, extent of prior Rx, organ function, comorbidities):
determines ability to tolerate chemoradiation, transplant meds, complications.
• Stem Cell Source:
• HLA-identical sibling
• URD
• Cord Blood
• Haplo-identical
Transplant-Related Factors
Determinants of Transplant Outcome

How to Select CB Units?
• Dose (TNC, CD34+) & quality
• Donor-recipient HLA-match
• RBC depletion (thaw & infusion)

Double Unit CBT: Why Does One Unit Win?
Interplay of hematopoietic potential
of each unit &
unit vs unit immune interactions
(T-cell mediated). Association with higher
infused CD3+ dose.
As important: what determines
engraftment success in patients?
Barker, Blood 2005; Scaradavou, BBMT
2010;
Eldjerou, Blood 2011; Avery, Blood 2011

MSKCC: Neut Engraftment after dCBT (n = 92)
0.0
0.2
0.4
0.6
0.8
1.0
Days Post-Transplant
Cu
mu
lative
In
cid
en
ce
0 10 20 30 40
• Engraftment mediated by 1 unit
• High rates of sustained donor engraftment.
Children: 93%
@ median 20 days
(range 12-33) Adults: 95%
@ median 25 days
(range 13-43)
Barker et al, unpublished 2013
Median inf. TNC:
Peds 4.4 + 2.9,
Adults 2.7 + 2.0

dCBT DFS in Engrafting Adults by Speed of
Neutrophil Recovery: Day 45 Landmark Analysis
P = 0.02
0.0
0.2
0.4
0.6
0.8
1.0
Months Post-Transplant
DF
S
45 days 6 12 18 24
Neut. recovery < 25 days (n = 32):
84% (95%CI: 72-98)
Neut. recovery > 25 days (n = 29):
54% (95%CI: 39-76)
Marked survival advantage if rapid engraftment
Barker et al, unpublished,
2014

PROBLEM:
Delayed or failed engraftment
increased TRM
SOLUTIONS
• Ex vivo
expansion
• 3rd party cells
• Facilitate homing
• Improved
unit
selection*
Traditional criteria: TNC dose –
can we do better?

Dose &
Post-Thaw Quality

Determinants of Dose & Quality

Pre-freeze CD34+ count
Post-thaw CD34+ recovery
CD34+ viability*
What Determines
Infused Viable CD34+ Cell Dose
and
Can it be Predicted at Unit Selection?:
* Tested at MSKCC by flow cytometry & 7-AAD
exclusion
Purtill et al, Blood 2014
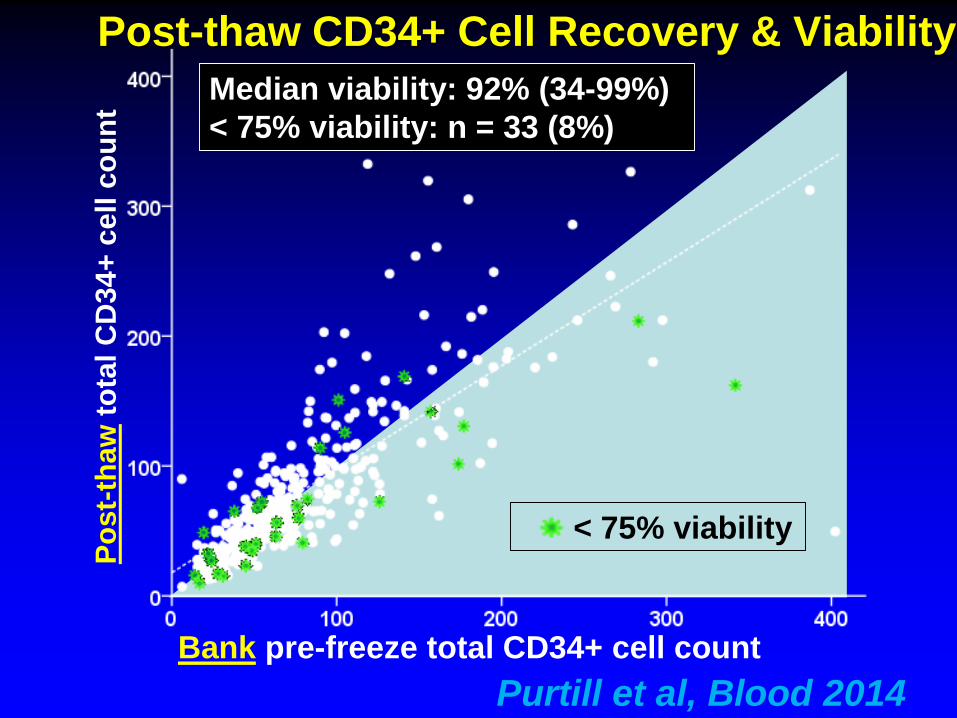
Median viability: 92% (34-99%)
< 75% viability: n = 33 (8%) P
ost-
thaw
tota
l C
D34+
cell
co
un
t
Post-thaw CD34+ Cell Recovery & Viability
Bank pre-freeze total CD34+ cell count
< 75% viability
Purtill et al, Blood 2014

Variable (N)N (%) < 75%
CD34+ Viability
OR*
(95% CI)
Multivariate
p value
Netcord-FACT accreditation
Yes (n = 350) 15 (4%) Reference0.002
No (n = 52) 18 (35%) 4.9 (1.8-13.3)
Cryopreservation year
1997 – 2004 (n = 119) 17 (14%) 1.47 (0.6-3.7)0.408
2005 – 2012 (n = 283) 16 (6%) Reference
Cryopreservation volume per bag (ml)
< 24.5 (n = 14) 5 (36%) 8.8 (1.9-41.7)
< 0.00124.5 – 26.0 (n = 298) 8 (3%) Reference
26.1 – 30.0 (n = 45) 7 (16%) 8.5 (2.6-28.0)
> 30.0 (n = 45) 13 (29%) 7.5 (2.5-22.0)
Processing method
Manual (n = 187) 24 (13%) 2.3 (0.8-6.5)
0.131Automated + semi-
automated (n = 215)9 (7%) Reference
Associations with Low Post-Thaw CD34+ Cell Viability
Purtill et al, Blood 2014

HLA-MatchTraditional donor-recipient match grade:
4-6/6 HLA-A, -B antigen, -DRB1 allele

10957303650
CI o
f Tra
ns
pla
nt-
Rela
ted
Mo
rta
lity
Years Post-Transplant
2 MM/ TNC <2.5
2 MM/ TNC ≥5.0
2 MM/ TNC 2.5-4.91 MM/ TNC 2.5-4.9
1 MM/ TNC <2.5
1 MM/ TNC ≥5.0
80
100
20
40
60
0 1 2 3
0 MM (all doses, mean TNC
4.4)
Any 6/6 Unit: Superior to 5/6 >2.5, or 4/6 >5.0
Barker et al, Blood 2010
TRM after Single Unit Ablative CBT (n=1061):
Better HLA-Match Compensates for Lower Dose
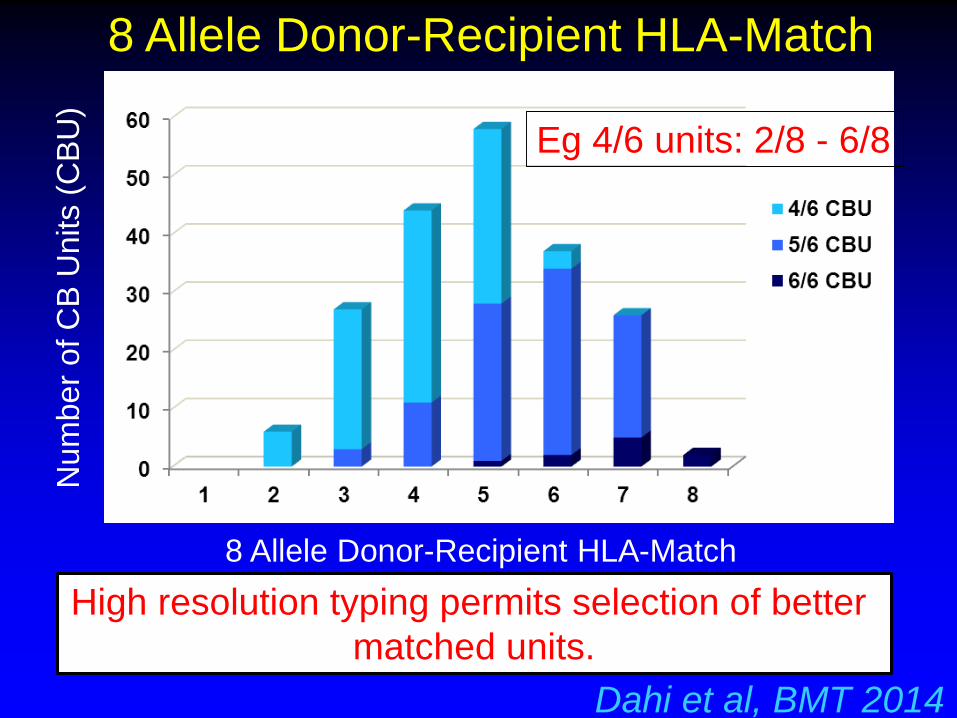
8 Allele Donor-Recipient HLA-Match
Num
ber
of C
B U
nits (
CB
U)
High resolution typing permits selection of better
matched units.
Dahi et al, BMT 2014
8 Allele Donor-Recipient HLA-Match
Eg 4/6 units: 2/8 - 6/8

Eapen et al, Blood 2013
CIBMTR: 3-Year TRM by 3-8/8 HLA-match
after Single Unit CBT (n = 1,568)
Donor-recipient allele match is critical. 8/8 units very good.
Problem: how low can you go? MSKCC median: 5/8
20
40
60
80
100
0
4-6/6 Allele
1-3/6 Allele
Months Post-Transplant0
100
80
60
40
20
0
1-7/10 Allele
8-9/10 Allele
1 2 3 4 5 6 0 1 2 3 4 5 6
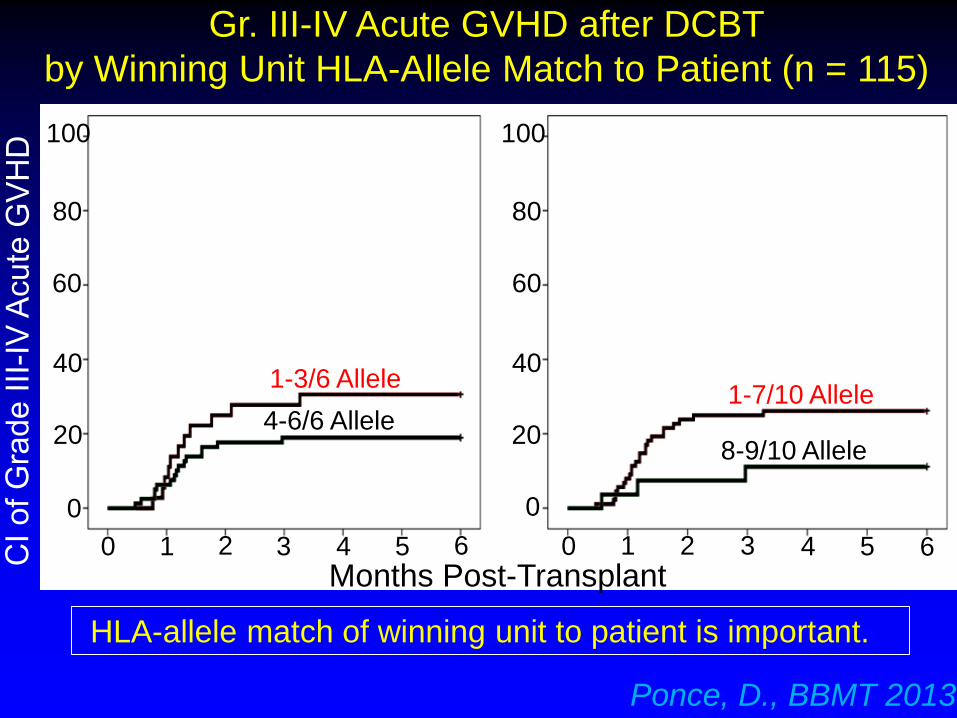
Ponce, D., BBMT 2013
Gr. III-IV Acute GVHD after DCBT
by Winning Unit HLA-Allele Match to Patient (n = 115)
HLA-allele match of winning unit to patient is important.

Double Unit CBT:
Is it Needed?

100
0
20
40
60
80
Pro
bab
ilit
y, %
Months 0 3 6 9 12
Double CBT: 64% (54 – 72)
Single CBT: 68% (58 –
76)
BMT CTN 0501 Pediatric Ablative Randomized
Trial: 1-Yr Disease-free Survival
P = 0.22
Wagner et al, NEJM 2014
Ped. myeloablative CBT: don’t need DCBT?
Median cryo. TNC (x107per Kg):
singles 4.8, doubles 8.9.
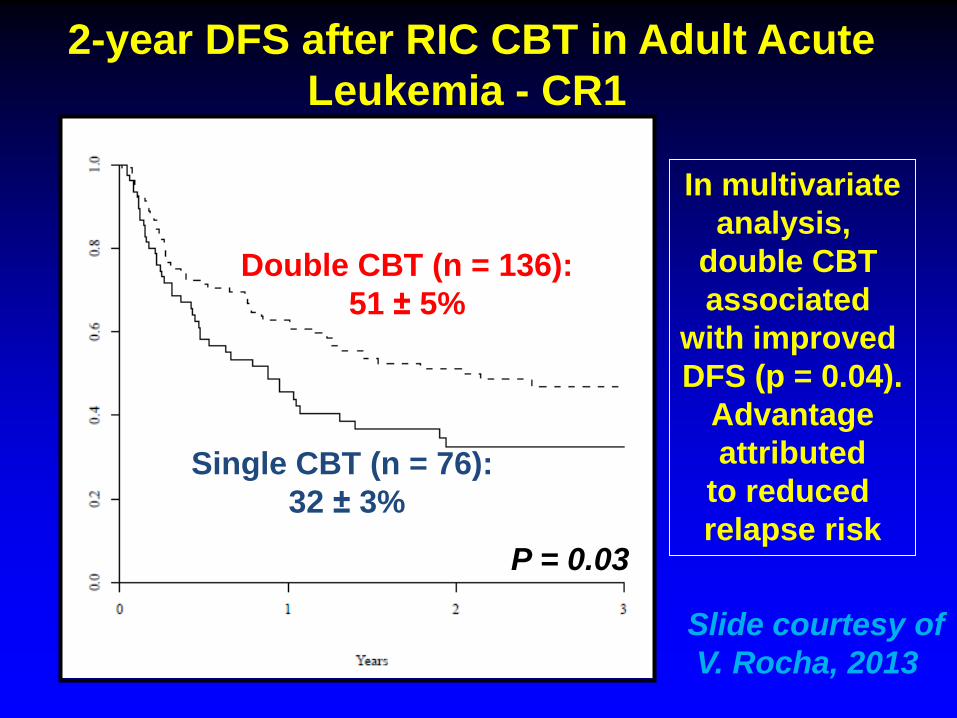
2-year DFS after RIC CBT in Adult Acute
Leukemia - CR1
P = 0.03
In multivariate
analysis,
double CBT
associated
with improved
DFS (p = 0.04).
Advantage
attributed
to reduced
relapse risk
Double CBT (n = 136):
51 ± 5%
Single CBT (n = 76):
32 ± 3%
Slide courtesy of
V. Rocha, 2013

Loser TNC > 3.0 (n = 36) Median ANC 19 days
(Median dominant CD34+ 1.28)
Loser TNC < 2.0 (n = 37) Median ANC 27 days
(Median dominant CD34+ 0.80)
Loser TNC 2.0 - 3.0 (n =56) Median ANC 25 days
(Median dominant CD34+ 0.89)p =
0.001
MSKCC dCBT Engraftment (n = 129) by
Losing Unit TNC Dose: High, Middle or Low
Purtill, ASH 2014
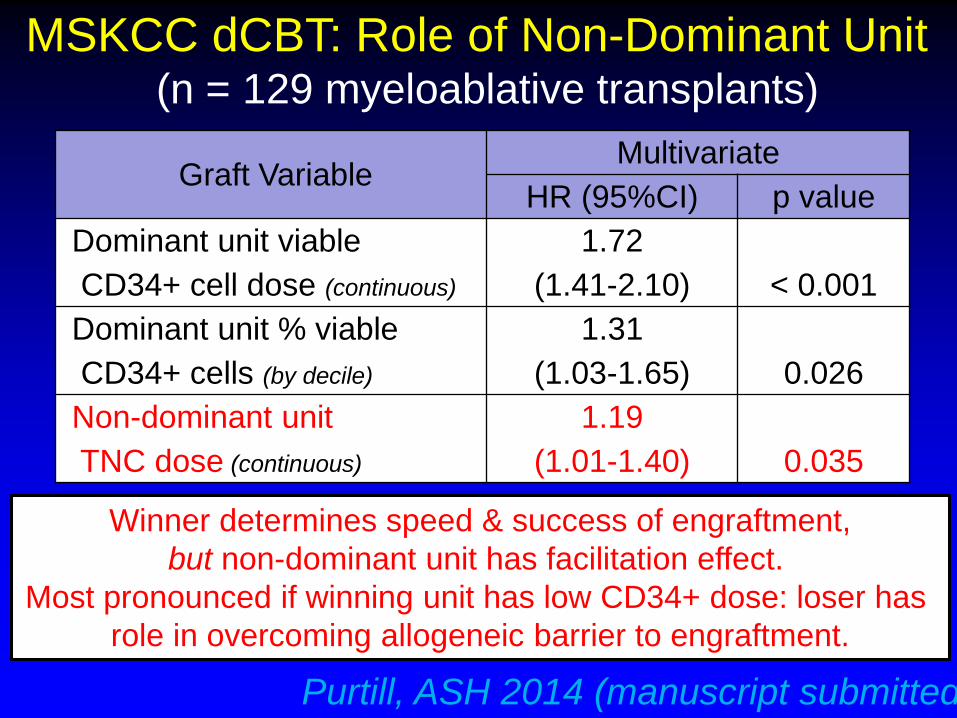
Graft VariableMultivariate
HR (95%CI) p value
Dominant unit viable
CD34+ cell dose (continuous)
1.72
(1.41-2.10) < 0.001
Dominant unit % viable
CD34+ cells (by decile)
1.31
(1.03-1.65) 0.026
Non-dominant unit
TNC dose (continuous)
1.19
(1.01-1.40) 0.035
MSKCC dCBT: Role of Non-Dominant Unit (n = 129 myeloablative transplants)
Purtill, ASH 2014 (manuscript submitted)
Winner determines speed & success of engraftment,
but non-dominant unit has facilitation effect.
Most pronounced if winning unit has low CD34+ dose: loser has
role in overcoming allogeneic barrier to engraftment.

A B
Double CBT: HLA matching between the dominant CB
unit and the recipient by standard criteria and high
resolution typing at (A) HLA –A, -B, andDRB1 (B) HLA –
A, -B, C andDRB1
0
5
10
15
20
25
30
35
40
45
No
4/6, n=72 5/6, n=53 6/6, n=8
HLA matching by standard criteria
3-4/8
5-6/8
7-8/8
0
10
20
30
40
50
60
No
4/6, n=72 5/6, n=53 6/6, n=8
HLA matching by standard criteria
2-3/6
4/6
5-6/6
Oran et al, submitted

0 3 6 9 12 15 18 21 24
Time (months)
0.0
0.1
0.2
0.3
0.4
0.5
0.6
0.7
0.8
0.9
1.0
High Risk
Intermediate Risk
Low Risk
Treatment Related Mortality Disease-Free Survival
0 3 6 9 12 15 18 21 24
Time (Months)
0.0
0.1
0.2
0.3
0.4
0.5
0.6
0.7
0.8
0.9
1.0
High Risk
Low Risk
Intermediate Risk
Molecular HLA matching defined three risk groupsLow: 7-8/8
Intermediate: 5-6/8
High Risk: 3-4/8
Oran et al.

Strategy Investigator Comments
Single Unit Graft
IBMI Frassoni Lancet Oncol 2008 Abandoned by U of MN.
sCBT + Haplo Van Besien Blood 2011 ATG based
Sitagliptin Broxmeyer Nat. Med. 2012 DDP4 inhibitor in Ph.II
Double Unit Graft
Notch Delaney Nat. Med. 2010
Now moved to 3rd party.
Problem-rejection.
Mesoblast Shpall NEJM 2012 Logistics.
Gamida: NiCord Horwitz JCI 2014 Logistics. Add back T-cells
Novartis: SR1 Wagner ASH 2014 Logistics. Add back T-cells
Endothelial
based expansion Rafii Blood 2013 No clinical data yet
PGE2 Cutler Blood 2013 Short incubation
Fucosylation Shpall Exp Hematol 2012 Short incubation
dCBT + Haplo Barker ASH 2013, 2014
No ATG: haplo can be
rejected
Speeding Engraftment Beyond Unit Selection