Dominant Factors Affecting Regional Inequality of Infant ...
8
Dominant Factors Affecting Regional Inequality of Infant Mortality in Vietnam: A Structural Equation Modelling Analysis Mai P. Nguyen 1,2* ID , Chi M. Nguyen 3 ID Abstract Background: Despite Vietnam’s acclaiming achievements of reducing overall infant mortality rate (IMR), the IMR decline does not occur equally in all regions in Vietnam. This study aims to investigate dominant factors that affect the inequality of infant mortality across regions in Vietnam during the period 2005-2015. Methods: We use nationally representative data to construct a panel data of 6 economic regions in Vietnam from 2005 to 2015. We employ the structural equation modelling (SEM) approach to quantify the causal effect of socio-economic status (SES), accessing to skilled birth attendance (SBA) and other relevant factors on the disparity of IMR across regions. Results: SES, which is measured by 3 indicators – illiteracy rate (IR), poverty rate (PR) and income per capita – is the dominant factor causing regional inequalities of infant mortality, followed by the use of SBA. Among these indicators, the PR is the most important one causing the regional disparity of IMR and accessing to SBA. The total effect of SES on infant mortality disparity is 2.6 times as high as that of accessing skilled healthcare personnel. Conclusion: Bridging the regional gap of using skilled health personnel would contribute to improving the infant mortality inequality in Vietnam. This inequality, however, is not significantly improved only with medical interventions but also with broader and more comprehensive socio-economic interventions at both national and regional levels. Our findings confirm that poverty reduction and growth strategies should be the main focus to boost medical interventions and improve IMR all over the country. Keywords: Infant Mortality, Regional Inequality, Skill Birth Attendance, Socio-Economic Status, Vietnam Copyright: © 2021 The Author(s); Published by Kerman University of Medical Sciences. This is an open-access article distributed under the terms of the Creative Commons Attribution License (https://creativecommons.org/licenses/ by/4.0), which permits unrestricted use, distribution, and reproduction in any medium, provided the original work is properly cited. Citation: Nguyen MP, Nguyen CM. Dominant factors affecting regional inequality of infant mortality in Vietnam: a structural equation modelling analysis. Int J Health Policy Manag. 2021;10(8):475–482. doi:10.34172/ijhpm.2020.59 *Correspondence to: Mai P. Nguyen Email: [email protected] Article History: Received: 29 August 2019 Accepted: 14 April 2020 ePublished: 29 April 2020 Original Article Full list of authors’ affiliations is available at the end of the article. hp://ijhpm.com Int J Health Policy Manag 2021, 10(8), 475–482 doi 10.34172/ijhpm.2020.59 Implications for policy makers • The findings would be evidence-based for both the medical interventions and poverty reduction interventions at regional and national levels in Vietnam. They would be of interest of policy-makers, healthcare providers and international organizations who are working hard in improving mother and child’s health and addressing health’s inequity in Vietnam. • The case of Vietnam would provide the World Health Organization (WHO) more evidence of the infant mortality disparity within a country, which in turn would inform WHO in setting guidelines and definitions and framework to support low- and middle-income countries (LMICs) to obtain 2030 Sustainable Development Goals (SDGs). Implications for the public The poverty rate (PR) in Asia countries is significantly affecting the infant mortality inequality and highlighted in the World Mortality Report 2015 by the United Nations, using national Health Demographic Surveys with no data of Vietnam. This study, therefore, contributes another evidence from Vietnam to strengthen the United Nations’ conclusions. More importantly, the poverty plays a critical role in not only the inequality of infant mortality rate (IMR) but also the regional disparity of accessing to skilled birth attendance (SBA) in Vietnam. Finally, the study employs structural equation modelling (SEM) to model a system of causal relationships among all related factors that would be applicable in other countries with similar socio-economic conditions. Key Messages Background Vietnam achieved a significant reduction of infant mortality rate (IMR) over the period 1990-2015, from 44.1 per 1000 live births in 1990 to 14.7 in 2015. However, the decline does not take place equally in all regions of the country. The highest mortality rates are seen in mountainous and underprivileged regions at 24.8 per 1000 live births, which is nearly 3 times as high as the rate in the most affluent area at 8.6 per 1000 live births, and nearly 2 times the overall country’s IMR in 2015. 1 The disparity between wealthy and disadvantaged areas tends
Transcript of Dominant Factors Affecting Regional Inequality of Infant ...
Dominant Factors Affecting Regional Inequality of Infant Mortality in Vietnam: A Structural Equation Modelling AnalysisMai P. Nguyen1,2* ID , Chi M. Nguyen3 ID
AbstractBackground: Despite Vietnam’s acclaiming achievements of reducing overall infant mortality rate (IMR), the IMR decline does not occur equally in all regions in Vietnam. This study aims to investigate dominant factors that affect the inequality of infant mortality across regions in Vietnam during the period 2005-2015.Methods: We use nationally representative data to construct a panel data of 6 economic regions in Vietnam from 2005 to 2015. We employ the structural equation modelling (SEM) approach to quantify the causal effect of socio-economic status (SES), accessing to skilled birth attendance (SBA) and other relevant factors on the disparity of IMR across regions. Results: SES, which is measured by 3 indicators – illiteracy rate (IR), poverty rate (PR) and income per capita – is the dominant factor causing regional inequalities of infant mortality, followed by the use of SBA. Among these indicators, the PR is the most important one causing the regional disparity of IMR and accessing to SBA. The total effect of SES on infant mortality disparity is 2.6 times as high as that of accessing skilled healthcare personnel. Conclusion: Bridging the regional gap of using skilled health personnel would contribute to improving the infant mortality inequality in Vietnam. This inequality, however, is not significantly improved only with medical interventions but also with broader and more comprehensive socio-economic interventions at both national and regional levels. Our findings confirm that poverty reduction and growth strategies should be the main focus to boost medical interventions and improve IMR all over the country.Keywords: Infant Mortality, Regional Inequality, Skill Birth Attendance, Socio-Economic Status, VietnamCopyright: © 2021 The Author(s); Published by Kerman University of Medical Sciences. This is an open-access article distributed under the terms of the Creative Commons Attribution License (https://creativecommons.org/licenses/by/4.0), which permits unrestricted use, distribution, and reproduction in any medium, provided the original work is properly cited.Citation: Nguyen MP, Nguyen CM. Dominant factors affecting regional inequality of infant mortality in Vietnam: a structural equation modelling analysis. Int J Health Policy Manag. 2021;10(8):475–482. doi:10.34172/ijhpm.2020.59
*Correspondence to:Mai P. Nguyen Email: [email protected]
Article History:Received: 29 August 2019Accepted: 14 April 2020ePublished: 29 April 2020
Original Article
Full list of authors’ affiliations is available at the end of the article.
http://ijhpm.comInt J Health Policy Manag 2021, 10(8), 475–482 doi 10.34172/ijhpm.2020.59
Implications for policy makers• The findings would be evidence-based for both the medical interventions and poverty reduction interventions at regional and national levels in
Vietnam. They would be of interest of policy-makers, healthcare providers and international organizations who are working hard in improving mother and child’s health and addressing health’s inequity in Vietnam.
• The case of Vietnam would provide the World Health Organization (WHO) more evidence of the infant mortality disparity within a country, which in turn would inform WHO in setting guidelines and definitions and framework to support low- and middle-income countries (LMICs) to obtain 2030 Sustainable Development Goals (SDGs).
Implications for the publicThe poverty rate (PR) in Asia countries is significantly affecting the infant mortality inequality and highlighted in the World Mortality Report 2015 by the United Nations, using national Health Demographic Surveys with no data of Vietnam. This study, therefore, contributes another evidence from Vietnam to strengthen the United Nations’ conclusions. More importantly, the poverty plays a critical role in not only the inequality of infant mortality rate (IMR) but also the regional disparity of accessing to skilled birth attendance (SBA) in Vietnam. Finally, the study employs structural equation modelling (SEM) to model a system of causal relationships among all related factors that would be applicable in other countries with similar socio-economic conditions.
Key Messages
BackgroundVietnam achieved a significant reduction of infant mortality rate (IMR) over the period 1990-2015, from 44.1 per 1000 live births in 1990 to 14.7 in 2015. However, the decline does not take place equally in all regions of the country. The highest
mortality rates are seen in mountainous and underprivileged regions at 24.8 per 1000 live births, which is nearly 3 times as high as the rate in the most affluent area at 8.6 per 1000 live births, and nearly 2 times the overall country’s IMR in 2015.1 The disparity between wealthy and disadvantaged areas tends
Nguyen and Nguyen
International Journal of Health Policy and Management, 2021, 10(8), 475–482476
to persist over time. Vietnam is divided into 6 economic regions, ie, Red River
Delta, Northern Midlands and Mountainous areas, North Central and Central Coastal areas, Central Highlands, Southeast area, and Mekong River Delta. These 6 regions differ significantly in terms of demographics, speed and level of their socio-economic developments. The Southeast area with a high annual income per capita, a high literacy rate and a low poverty rate (PR), has the best socio-economic status (SES), followed by the Red River Delta. Meanwhile, the Northern Midlands and Mountainous area has the lowest SES compared to other regions.
In addition to SES, the proportion of births attended by skilled health personnel (so-called the skilled birth attendance, SBA) is one of the key factors affecting the IMR, thus a benchmark to assessing the progress towards the targets of reducing IMR in low- and middle-income countries (LMICs).2 SBA is critical medical services to women and their newborns during pregnancy, childbirth and the postpartum period, contributing to the reduction of preventable causes of neonatal death of newborn babies such as birth asphyxia and severe infections in Vietnam.3 This proportion of SBA is significantly different among economic regions in Vietnam. For instance, it is varying from 100% in the Red River Delta to only 91% in Northern Midlands and Mountainous areas and 94.8% in Central Highlands.4
The huge gap of IMR among different economic regions has drawn a great deal of attention from policy-makers, healthcare providers, international donors and researchers in Vietnam. Particularly, the Vietnamese government report on the achievements of Millennium Development Goals has highlighted medical interventions such as SBA, vaccinations and family planning as major contributors to reduce the IMR.5 In a number of earlier studies, SES has been identified as the determinant of the use of SBA in Vietnam.6,7 In separate studies, SES also shows a strong relationship with the IMR.8,9 However, to our knowledge, no research considers these factors’ linkages as a systematic structure that affects the inequality in SBA and IMR simultaneously across economic regions in Vietnam.
As the goals of Vietnamese government is to bridge the gap of IMR among economic regions to move forward to Sustainable Development Goals (SDGs) in 2030,10 there is a need to advance understandings on which factors are dominant, and how they contribute to this disparity. In particular, we need to examine the pathways through which the determinants of IMR such as SES, SBA, vaccinations and other relevant factors are interrelated in a system of causal relationships and at varying levels of magnitude. This study, using structural equation modelling (SEM) analysis, can shed lights on those pathways to infant mortality inequality over the period 2005-2015 in Vietnam.
This study makes several contributions to the current literature and practice. First, it provides evidence of the determinants to reducing infant mortality inequality among regions of Vietnam. The findings would be of interest of policy-makers, healthcare providers and international organizations who are working hard in improving mother
and child’s health and addressing health’s inequity in Vietnam. Second, it uses SEM to model a system of causal relationships among all related factors that would be applicable in other countries with similar socio-economic conditions. Finally, the case of Vietnam provides the World Health Organization (WHO) more evidence of the infant mortality disparity within countries, which in turn would inform WHO in setting guidelines, definitions and framework to support LMICs to obtain 2030 SDGs.
MethodsData Construction and SourcesIn this study, we analyze data of 6 economic regions from 2005 to 2015 to identify the main factors affecting infant mortality across regions in Vietnam. In each economic region, we collected IMR indicators and medical interventions factors (SBA rate, vaccination rate), population growth (total fertility rate, TFR) and socio-economic factors (ie, PR, income per capita, and illiteracy rate [IR] as a basic level of education) other relevant indicators. All indicators are observed over 11 years. Therefore, the dataset contains a tally of 66 observations, The medical intervention indicators are collected from the annual Statistics Health Yearbooks of the Vietnam’s Ministry of Health (MoH).4 Meanwhile, the IMR, population growth and other socio-economic factors are sourced from Vietnam’s national statistical agency, so-called the General Statistics Office (GSO) of Vietnam which provides authentic official and nationally representative statistics on a wide range of economic, social, population and environmental issues. The IMR, population growth and other socio-economic factors are collected through household surveys of which samples are selected in the way to represent regions, provinces/cities and the entire country.1
Variables of InterestWe use the IMR of the 6 economic regions over 11 years as the dependent variable, and the others as the explanatory variables that include SES, the rate of non-fully vaccination, the proportion of SBA, and the TFR. The selection of explanatory variables is based on the literature and the availability of data in the Vietnamese context.10
SES has been well known as an important factor that determines the IMR in both LMIC and high-income countries.11,12 In this study, annual income per capita, PR and IR are used as proxies for SES. The income per capita captures the level of average income across regions. It however does not capture individual income, therefore, can mask disparities among individuals’ income. This indicator is estimated on a logarithmic scale because on such a scale, equal distances between income ranges represent equal percentage changes. For example, the distance between $500 and $1000 (a 100% change) is the same as the distance between $1000 and $2000 (a 100% change). The PR describes the distribution of low income across regions. The higher rate of poverty and illiteracy are expected to lead to a higher IMR.13 We believe that these SES variables are informative to roughly depict differences of regional socio-economic conditions and to examine its effect on IMR.

Nguyen and Nguyen
International Journal of Health Policy and Management, 2021, 10(8), 475–482 477
For the other explanatory variables, vaccinations and SBA have been reported as key medical interventions contributable to the decrease of infant mortality in Vietnam.5 In this study, we hypothesize that those interventions directly affect IMR.
The TFR is an element of population growth, reflecting both the causes and effects of economic and social developments. It also reflects the varying demand for infant professional healthcare. In response, skilled birth personnel need to adjust accordingly to the TFR. We, therefore, model the TFR as an input to the rate of SBA.2,5
The definition and measurement of our dependent and explanatory variables are presented in Table 1.
Data Analysis Using Structural Equation ModellingSEM is a multivariate statistical analysis technique that is used to construct and analyze structural relationships between measured variables and latent factors with a system of linear equations. This modelling technique allows us to track not only the direct effects but also the indirect ones of each variable to the dependent variable,15 in our study, ie, IMR. A pathway diagram, which is a flowchart showing variables interconnected with lines indicating causal flows to the dependent variable, present the structure and outcome of this analysis.
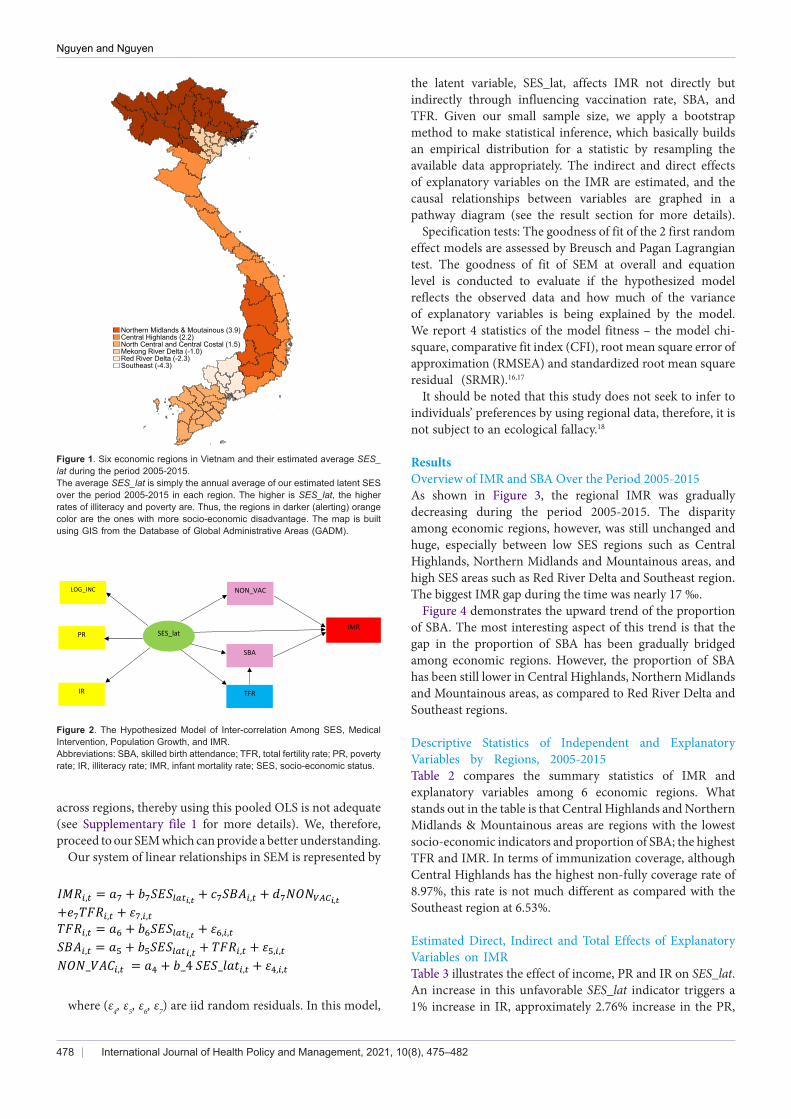
We hypothesize that besides the direct effect on IMR, the SES also affects the IMR through 2 indirect ways: the proportion of SBA and the non-fully vaccination rate. Those 2 latter variables, in turn, have direct effects on the IMR. As SES is not easily observable, we build a simple proxy for SES that is a common latent factor of 3 socio-economic measures, ie, IR, PR and log of income per capita. Hereinafter, we name this common latent factor as SES_lat. Figure 1 presented 6 economic regions in Vietnam and their estimated average SES_lat during the period 2005-2015.
Figure 2 illustrates the hypothesized model demonstrating
causal flows from our groups of explanatory variables (SES, medical intervention, and population growth) to the IMR. Lines with arrows represent the directional links among variables.
To test this hypothesis, we first estimate the latent factor of SES across regions by applying a maximum likelihood factor analysis to 3 highly correlated variables, ie, IR, PR and log of per capita income, as what follows:
IR = SES_lat+ε1PR = α SES_lat+ ε2LOG_INC = β SES_lat+ ε3
As clearly seen, the common factor SES_lat is based on the IR, thus representing an unfavourable socio-economic indicator of each region. That means higher SES_lat implies a lower SES. As a result, SES_lat has a positive effect on PR, and negative effect on the log of income.
We then use this estimated latent SES indicator to investigate its intertwined relationship with IMR and other factors. We start with a simple random effect model, where 2 separate linear relationships are estimated as follows:
𝐼𝐼𝐼𝐼𝑅𝑅𝑖𝑖,𝑡𝑡 = 𝑎𝑎1 + 𝑏𝑏1𝑆𝑆𝑆𝑆𝐴𝐴𝑖𝑖,𝑡𝑡 + 𝑐𝑐1𝑁𝑁𝑁𝑁𝑁𝑁𝑉𝑉𝑉𝑉𝐶𝐶𝑖𝑖,𝑡𝑡 + 𝑒𝑒1,𝑖𝑖,𝑡𝑡𝑆𝑆𝑆𝑆𝐴𝐴𝑖𝑖,𝑡𝑡 = 𝑎𝑎2 + 𝑏𝑏2𝑆𝑆𝑆𝑆𝑆𝑆_𝑙𝑙𝑎𝑎𝑙𝑙𝑖𝑖,𝑡𝑡 + 𝑐𝑐2𝑇𝑇𝑇𝑇𝑅𝑅𝑖𝑖,𝑡𝑡 + 𝑒𝑒2,𝑖𝑖,𝑡𝑡,
where i and t indicate region i at year t, and (e1, e2) are residuals. In this set-up, SES affects IMR indirectly through the SBA channel. As our sample size is small, we use bootstrap with 100 replications to obtain the statistics for all estimated models.
This simple model shows that there is a significant impact of SES on SBA, as well as SBA on IMR. However, the Breusch-Pagan Lagrangian tests for random effect of these 2 equations indicate that the residuals may have different random effects
Table 1. Definition and Measurements of Variables
Variables Unit Label Measurements Sources
Dependent
IMR Permille (per thousand) IMR The number of deaths under 1 year of age per 1000 live births Vietnam GSO
Explanatory
The rate of SBA Percentage SBA The proportion of births delivered by skilled birth attendants Vietnam MoH
The rate of non-fully vaccination Percentage NON_VAC The rate of infants under 1 year is not fully vaccinated against 10 diseases Vietnam MoH
TFR Percentage TFR
The average number of live births of a woman that would have during her whole life if during her reproductive period her age-specific fertility rates were similar to that observed in the reference period, usually the last 12 months prior to the survey
Vietnam GSO
The income per capita on a logarithmic scale Million VND LOG_INC Total income of households in reference year divided by their headcounts Vietnam GSO
PR Percentage PRThe proportion of the population living below the poverty lines calculated by the GSO and the World Bank based on consumption. Details of the methods of calculations can be found at World Bank documents 14
Vietnam GSO
Adult IR Percentage IR The proportion of illiteracy persons aged over 15 over the population aged over 15 Vietnam GSO
Abbreviations: SBA, skilled birth attendance; TFR, total fertility rate; GSO, General Statistics Office; MoH, Ministry of Health; PR, poverty rate; IR, illiteracy rate; IMR, infant mortality rate.
Nguyen and Nguyen
International Journal of Health Policy and Management, 2021, 10(8), 475–482478
across regions, thereby using this pooled OLS is not adequate (see Supplementary file 1 for more details). We, therefore, proceed to our SEM which can provide a better understanding.
Our system of linear relationships in SEM is represented by
𝐼𝐼𝐼𝐼𝑅𝑅𝑖𝑖,𝑡𝑡 = 𝑎𝑎7 + 𝑏𝑏7𝑆𝑆𝑆𝑆𝑆𝑆𝑙𝑙𝑙𝑙𝑡𝑡𝑖𝑖,𝑡𝑡 + 𝑐𝑐7𝑆𝑆𝑆𝑆𝐴𝐴𝑖𝑖,𝑡𝑡 + 𝑑𝑑7𝑁𝑁𝑁𝑁𝑁𝑁𝑉𝑉𝑉𝑉𝐶𝐶𝑖𝑖,𝑡𝑡 +𝑒𝑒7𝑇𝑇𝑇𝑇𝑅𝑅𝑖𝑖,𝑡𝑡 + 𝜀𝜀7,𝑖𝑖,𝑡𝑡𝑇𝑇𝑇𝑇𝑅𝑅𝑖𝑖,𝑡𝑡 = 𝑎𝑎6 + 𝑏𝑏6𝑆𝑆𝑆𝑆𝑆𝑆𝑙𝑙𝑙𝑙𝑡𝑡𝑖𝑖,𝑡𝑡 + 𝜀𝜀6,𝑖𝑖,𝑡𝑡𝑆𝑆𝑆𝑆𝐴𝐴𝑖𝑖,𝑡𝑡 = 𝑎𝑎5 + 𝑏𝑏5𝑆𝑆𝑆𝑆𝑆𝑆𝑙𝑙𝑙𝑙𝑡𝑡𝑖𝑖,𝑡𝑡 + 𝑇𝑇𝑇𝑇𝑅𝑅𝑖𝑖,𝑡𝑡 + 𝜀𝜀5,𝑖𝑖,𝑡𝑡𝑁𝑁𝑁𝑁𝑁𝑁_𝑉𝑉𝐴𝐴𝑉𝑉𝑖𝑖,𝑡𝑡 = 𝑎𝑎4 + 𝑏𝑏_4 𝑆𝑆𝑆𝑆𝑆𝑆_𝑙𝑙𝑎𝑎𝑙𝑙𝑖𝑖,𝑡𝑡 + 𝜀𝜀4,𝑖𝑖,𝑡𝑡
where (ε4, ε5, ε6, ε7) are iid random residuals. In this model,
Figure 1. Six economic regions in Vietnam and their estimated average SES_lat during the period 2005-2015.The average SES_lat is simply the annual average of our estimated latent SES over the period 2005-2015 in each region. The higher is SES_lat, the higher rates of illiteracy and poverty are. Thus, the regions in darker (alerting) orange color are the ones with more socio-economic disadvantage. The map is built using GIS from the Database of Global Administrative Areas (GADM).
Figure 2. The Hypothesized Model of Inter-correlation Among SES, Medical Intervention, Population Growth, and IMR.Abbreviations: SBA, skilled birth attendance; TFR, total fertility rate; PR, poverty rate; IR, illiteracy rate; IMR, infant mortality rate; SES, socio-economic status.
the latent variable, SES_lat, affects IMR not directly but indirectly through influencing vaccination rate, SBA, and TFR. Given our small sample size, we apply a bootstrap method to make statistical inference, which basically builds an empirical distribution for a statistic by resampling the available data appropriately. The indirect and direct effects of explanatory variables on the IMR are estimated, and the causal relationships between variables are graphed in a pathway diagram (see the result section for more details).
Specification tests: The goodness of fit of the 2 first random effect models are assessed by Breusch and Pagan Lagrangian test. The goodness of fit of SEM at overall and equation level is conducted to evaluate if the hypothesized model reflects the observed data and how much of the variance of explanatory variables is being explained by the model. We report 4 statistics of the model fitness – the model chi-square, comparative fit index (CFI), root mean square error of approximation (RMSEA) and standardized root mean square residual (SRMR).16,17
It should be noted that this study does not seek to infer to individuals’ preferences by using regional data, therefore, it is not subject to an ecological fallacy.18
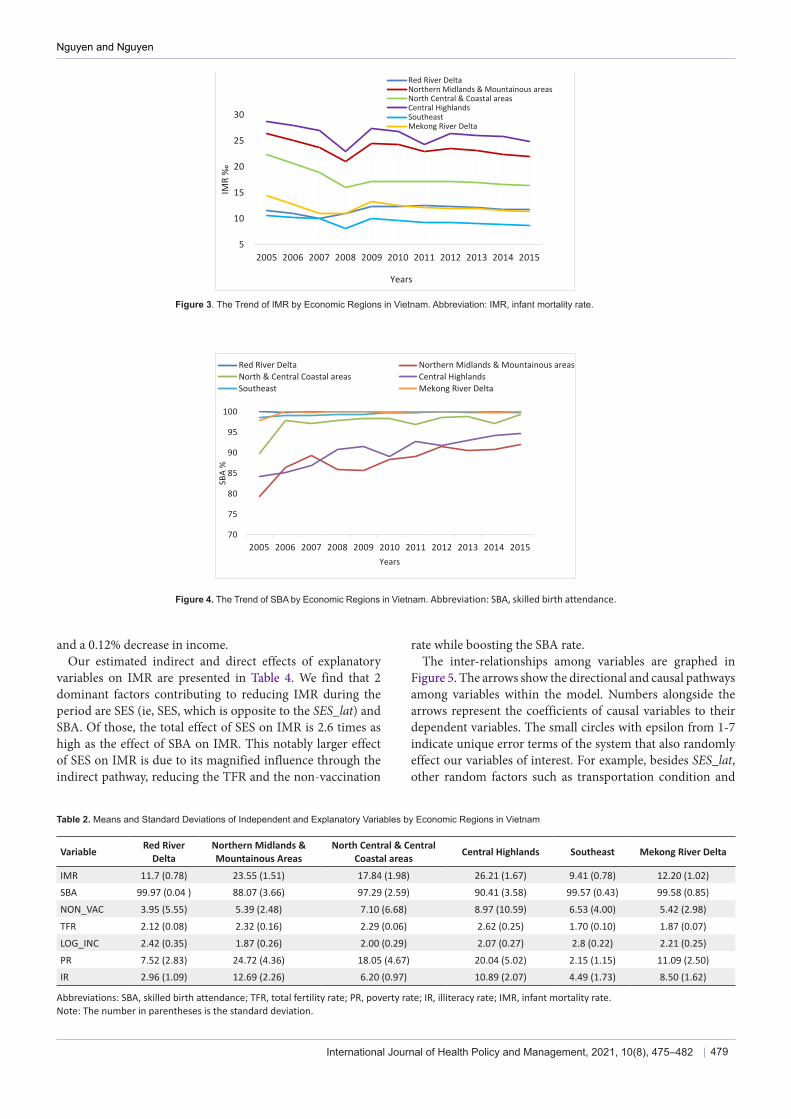
ResultsOverview of IMR and SBA Over the Period 2005-2015As shown in Figure 3, the regional IMR was gradually decreasing during the period 2005-2015. The disparity among economic regions, however, was still unchanged and huge, especially between low SES regions such as Central Highlands, Northern Midlands and Mountainous areas, and high SES areas such as Red River Delta and Southeast region. The biggest IMR gap during the time was nearly 17 ‰.
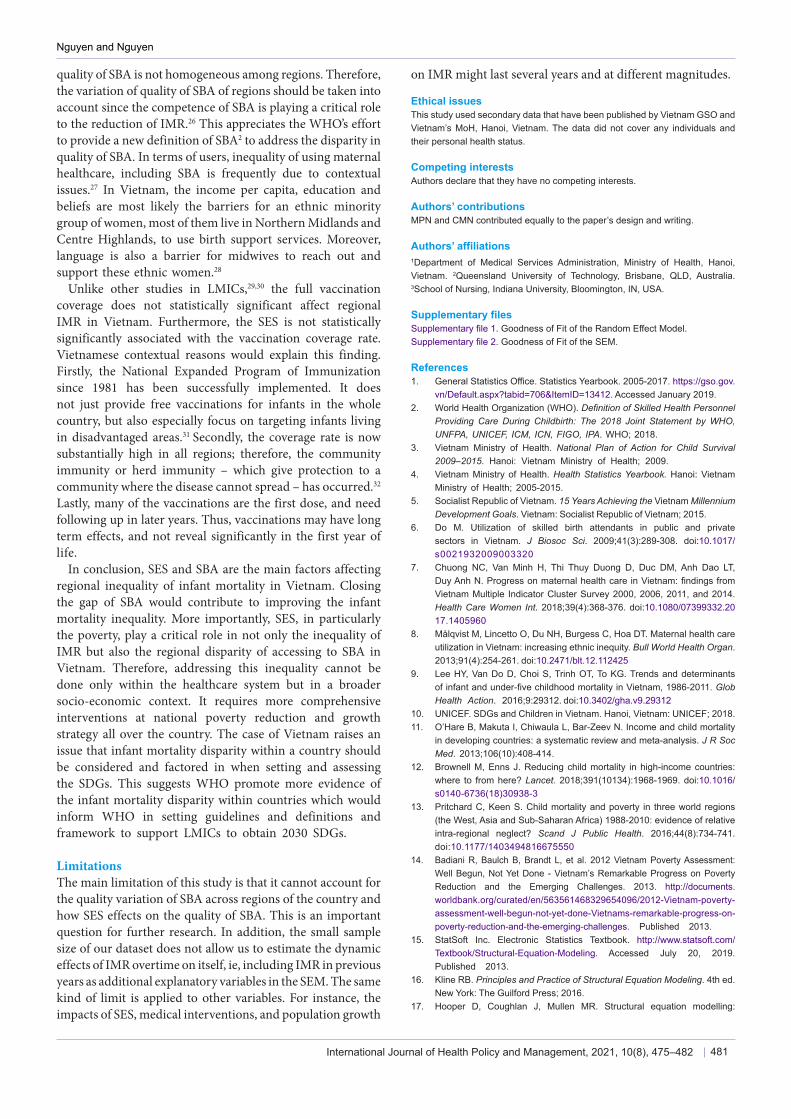
Figure 4 demonstrates the upward trend of the proportion of SBA. The most interesting aspect of this trend is that the gap in the proportion of SBA has been gradually bridged among economic regions. However, the proportion of SBA has been still lower in Central Highlands, Northern Midlands and Mountainous areas, as compared to Red River Delta and Southeast regions.
Descriptive Statistics of Independent and Explanatory Variables by Regions, 2005-2015Table 2 compares the summary statistics of IMR and explanatory variables among 6 economic regions. What stands out in the table is that Central Highlands and Northern Midlands & Mountainous areas are regions with the lowest socio-economic indicators and proportion of SBA; the highest TFR and IMR. In terms of immunization coverage, although Central Highlands has the highest non-fully coverage rate of 8.97%, this rate is not much different as compared with the Southeast region at 6.53%.
Estimated Direct, Indirect and Total Effects of Explanatory Variables on IMR Table 3 illustrates the effect of income, PR and IR on SES_lat. An increase in this unfavorable SES_lat indicator triggers a 1% increase in IR, approximately 2.76% increase in the PR,
Northern Midlands & Moutainous (3.9)Central Highlands (2.2)North Central and Central Costal (1.5)Mekong River Delta (-1.0)Red River Delta (-2.3)Southeast (-4.3)
IMR PR SES_lat
SBA
NON_VAC LOG_INC
IR TFR
Nguyen and Nguyen
International Journal of Health Policy and Management, 2021, 10(8), 475–482 479
and a 0.12% decrease in income.Our estimated indirect and direct effects of explanatory
variables on IMR are presented in Table 4. We find that 2 dominant factors contributing to reducing IMR during the period are SES (ie, SES, which is opposite to the SES_lat) and SBA. Of those, the total effect of SES on IMR is 2.6 times as high as the effect of SBA on IMR. This notably larger effect of SES on IMR is due to its magnified influence through the indirect pathway, reducing the TFR and the non-vaccination
rate while boosting the SBA rate. The inter-relationships among variables are graphed in
Figure 5. The arrows show the directional and causal pathways among variables within the model. Numbers alongside the arrows represent the coefficients of causal variables to their dependent variables. The small circles with epsilon from 1-7 indicate unique error terms of the system that also randomly effect our variables of interest. For example, besides SES_lat, other random factors such as transportation condition and
5
10
15
20
25
30
2005 2006 2007 2008 2009 2010 2011 2012 2013 2014 2015
IMR
‰
Years
Red River DeltaNorthern Midlands & Mountainous areasNorth Central & Coastal areasCentral HighlandsSoutheastMekong River Delta
Figure 3. The Trend of IMR by Economic Regions in Vietnam. Abbreviation: IMR, infant mortality rate.
Figure 4. The Trend of SBA by Economic Regions in Vietnam. Abbreviation: SBA, skilled birth attendance.
70
75
80
85
90
95
100
2005 2006 2007 2008 2009 2010 2011 2012 2013 2014 2015
SBA
%
Years
Red River Delta Northern Midlands & Mountainous areasNorth & Central Coastal areas Central HighlandsSoutheast Mekong River Delta
Table 2. Means and Standard Deviations of Independent and Explanatory Variables by Economic Regions in Vietnam
Variable Red River Delta
Northern Midlands & Mountainous Areas
North Central & Central Coastal areas Central Highlands Southeast Mekong River Delta
IMR 11.7 (0.78) 23.55 (1.51) 17.84 (1.98) 26.21 (1.67) 9.41 (0.78) 12.20 (1.02)SBA 99.97 (0.04 ) 88.07 (3.66) 97.29 (2.59) 90.41 (3.58) 99.57 (0.43) 99.58 (0.85)
NON_VAC 3.95 (5.55) 5.39 (2.48) 7.10 (6.68) 8.97 (10.59) 6.53 (4.00) 5.42 (2.98)
TFR 2.12 (0.08) 2.32 (0.16) 2.29 (0.06) 2.62 (0.25) 1.70 (0.10) 1.87 (0.07)
LOG_INC 2.42 (0.35) 1.87 (0.26) 2.00 (0.29) 2.07 (0.27) 2.8 (0.22) 2.21 (0.25)
PR 7.52 (2.83) 24.72 (4.36) 18.05 (4.67) 20.04 (5.02) 2.15 (1.15) 11.09 (2.50)IR 2.96 (1.09) 12.69 (2.26) 6.20 (0.97) 10.89 (2.07) 4.49 (1.73) 8.50 (1.62)
Abbreviations: SBA, skilled birth attendance; TFR, total fertility rate; PR, poverty rate; IR, illiteracy rate; IMR, infant mortality rate.Note: The number in parentheses is the standard deviation.

Nguyen and Nguyen
International Journal of Health Policy and Management, 2021, 10(8), 475–482480
religious diversity also affect the use of SBA, and included in a random error ε5.
The specification tests for the goodness of fit yields χ2
= 32.09, P < .01; CFI = 0.90; SRMR = 0.04; RMSEA=0.32. All standardized residual co-variances are less than 0.37. Although the chi-square and RMSEA are not within the cut-off good fit (see Supplementary file 2 for more details) because of the small sample size of this study, the other indices, CFI and SRMR, show that the model fits well to the data.
Overall, the results indicate that SES has causal relationships with IMR and SBA. The direct effect of SES on IMR is higher than the direct effect of SBA on IMR. In addition, SES also has an indirect effect on IMR through the SBA. Among the 3
Table 3. Effect of Income, Poverty Rate and Illiteracy Rate on SES_lat
Variable Estimated Coefficient Standard Error 95% CI
IR ReferenceLOG_INC -0.12** 0.03 (-0.18, -0.06)PR 2.76** 0.53 (1.71, 3.81)
Abbreviations: PR, poverty rate; IR, illiteracy rate.** P < .01.
Table 4. Effect of Explanatory Variables on IMR
Variable Direct Effect Indirect Effect Total Effect
IMR
SES_lat 0.88** 0.77** 1.65**
SBA -0.63** NA -0.63**
NON_VAC 0.05 NA 0.05
TFR NA 1.85 1.85
SBA
SES_lat -1.44** NA -1.44**
TFR -2.92* NA -2.92*
NON_VAC
SES_lat 0.27 NA 0.27
TFR
SES_lat 0.08** NA 0.08*
Abbreviations: SBA, skilled birth attendance; TFR, total fertility rate; IMR, infant mortality rate.* P < .05, ** P < .01.
Figure 5. Pathway Diagram Representing the Major Drivers of Infant Mortality Inequality in Vietnam. Abbreviations: TFR, total fertility rate; PR, poverty rate; IR, illiteracy rate; IMR, infant mortality rate.
indicators that measure the SES, the PR is the most important factor linked to the regional gap of SBA and IMR.
Discussion Although a steady upward trend in SES and in the access of SBA, together with a downward trend in IMR has been observed in all economic regions in Vietnam, the regional gap of infant mortality remains unchanged. This study provides evidence to explain this infant mortality inequality. It also goes beyond simply demonstrating the linear relationship among IMR and its predictors to understand the pathway through which these predictors are interrelated in a set of linear and causal relationships.
SES is at the center of driving the disparity of IMR across the country. It has both indirect and direct effects on IMR. The direct effect on IMR is consistent with findings in a large number of studies and reviews that have highlighted SES as the critical determinant of infant mortality.19-22 The PR significantly affects the infant mortality inequality in Asia countries is also highlighted in the World Mortality Report 2015 published by the United Nations using national Health Demographic Surveys. Vietnam case, unfortunately, is not covered in this analysis. Therefore, this study strengthens the conclusions by adding up more evidence from Vietnam.23 Moreover, it further support the views of the indirect effect of SES on IMR through SBA is also similar to findings by Afulani and Moyer in Ghana.24
Although all 3 SES indicators have direct and indirect effects on IMR, the PR has a stronger effect on the IMR and SBA than the income per capita and IR. This finding has an important implication for interventions that emphasizing the reduction of regional PR would be more likely to bridge the regional gap in IMR. Therefore, medical interventions should equally align with the implementation of the comprehensive poverty reduction and growth strategy across the country.
The proportion of SBA has a direct effect on the IMR, but it is also being affected by SES. This finding reflects 2 important issues of service users and providers in Vietnam. In terms of providers, the quantity, quality and distribution of skilled birth attendants have not been equally placed among economic regions.25 Given the regions with low SES have difficulties in attracting and retaining highly skilled health workers, the
Nguyen and Nguyen
International Journal of Health Policy and Management, 2021, 10(8), 475–482 481
quality of SBA is not homogeneous among regions. Therefore, the variation of quality of SBA of regions should be taken into account since the competence of SBA is playing a critical role to the reduction of IMR.26 This appreciates the WHO’s effort to provide a new definition of SBA2 to address the disparity in quality of SBA. In terms of users, inequality of using maternal healthcare, including SBA is frequently due to contextual issues.27 In Vietnam, the income per capita, education and beliefs are most likely the barriers for an ethnic minority group of women, most of them live in Northern Midlands and Centre Highlands, to use birth support services. Moreover, language is also a barrier for midwives to reach out and support these ethnic women.28
Unlike other studies in LMICs,29,30 the full vaccination coverage does not statistically significant affect regional IMR in Vietnam. Furthermore, the SES is not statistically significantly associated with the vaccination coverage rate. Vietnamese contextual reasons would explain this finding. Firstly, the National Expanded Program of Immunization since 1981 has been successfully implemented. It does not just provide free vaccinations for infants in the whole country, but also especially focus on targeting infants living in disadvantaged areas.31 Secondly, the coverage rate is now substantially high in all regions; therefore, the community immunity or herd immunity – which give protection to a community where the disease cannot spread – has occurred.32 Lastly, many of the vaccinations are the first dose, and need following up in later years. Thus, vaccinations may have long term effects, and not reveal significantly in the first year of life.
In conclusion, SES and SBA are the main factors affecting regional inequality of infant mortality in Vietnam. Closing the gap of SBA would contribute to improving the infant mortality inequality. More importantly, SES, in particularly the poverty, play a critical role in not only the inequality of IMR but also the regional disparity of accessing to SBA in Vietnam. Therefore, addressing this inequality cannot be done only within the healthcare system but in a broader socio-economic context. It requires more comprehensive interventions at national poverty reduction and growth strategy all over the country. The case of Vietnam raises an issue that infant mortality disparity within a country should be considered and factored in when setting and assessing the SDGs. This suggests WHO promote more evidence of the infant mortality disparity within countries which would inform WHO in setting guidelines and definitions and framework to support LMICs to obtain 2030 SDGs.
LimitationsThe main limitation of this study is that it cannot account for the quality variation of SBA across regions of the country and how SES effects on the quality of SBA. This is an important question for further research. In addition, the small sample size of our dataset does not allow us to estimate the dynamic effects of IMR overtime on itself, ie, including IMR in previous years as additional explanatory variables in the SEM. The same kind of limit is applied to other variables. For instance, the impacts of SES, medical interventions, and population growth
on IMR might last several years and at different magnitudes.
Ethical issues This study used secondary data that have been published by Vietnam GSO and Vietnam’s MoH, Hanoi, Vietnam. The data did not cover any individuals and their personal health status.
Competing interests Authors declare that they have no competing interests.
Authors’ contributions MPN and CMN contributed equally to the paper’s design and writing.
Authors’ affiliations1Department of Medical Services Administration, Ministry of Health, Hanoi, Vietnam. 2Queensland University of Technology, Brisbane, QLD, Australia. 3School of Nursing, Indiana University, Bloomington, IN, USA.
Supplementary filesSupplementary file 1. Goodness of Fit of the Random Effect Model.Supplementary file 2. Goodness of Fit of the SEM.
References1. General Statistics Office. Statistics Yearbook. 2005-2017. https://gso.gov.
vn/Default.aspx?tabid=706&ItemID=13412. Accessed January 2019.2. World Health Organization (WHO). Definition of Skilled Health Personnel
Providing Care During Childbirth: The 2018 Joint Statement by WHO, UNFPA, UNICEF, ICM, ICN, FIGO, IPA. WHO; 2018.
3. Vietnam Ministry of Health. National Plan of Action for Child Survival 2009–2015. Hanoi: Vietnam Ministry of Health; 2009.
4. Vietnam Ministry of Health. Health Statistics Yearbook. Hanoi: Vietnam Ministry of Health; 2005-2015.
5. Socialist Republic of Vietnam. 15 Years Achieving the Vietnam Millennium Development Goals. Vietnam: Socialist Republic of Vietnam; 2015.
6. Do M. Utilization of skilled birth attendants in public and private sectors in Vietnam. J Biosoc Sci. 2009;41(3):289-308. doi:10.1017/s0021932009003320
7. Chuong NC, Van Minh H, Thi Thuy Duong D, Duc DM, Anh Dao LT, Duy Anh N. Progress on maternal health care in Vietnam: findings from Vietnam Multiple Indicator Cluster Survey 2000, 2006, 2011, and 2014. Health Care Women Int. 2018;39(4):368-376. doi:10.1080/07399332.2017.1405960
8. Målqvist M, Lincetto O, Du NH, Burgess C, Hoa DT. Maternal health care utilization in Vietnam: increasing ethnic inequity. Bull World Health Organ. 2013;91(4):254-261. doi:10.2471/blt.12.112425
9. Lee HY, Van Do D, Choi S, Trinh OT, To KG. Trends and determinants of infant and under-five childhood mortality in Vietnam, 1986-2011. Glob Health Action. 2016;9:29312. doi:10.3402/gha.v9.29312
10. UNICEF. SDGs and Children in Vietnam. Hanoi, Vietnam: UNICEF; 2018.11. O’Hare B, Makuta I, Chiwaula L, Bar-Zeev N. Income and child mortality
in developing countries: a systematic review and meta-analysis. J R Soc Med. 2013;106(10):408-414.
12. Brownell M, Enns J. Reducing child mortality in high-income countries: where to from here? Lancet. 2018;391(10134):1968-1969. doi:10.1016/s0140-6736(18)30938-3
13. Pritchard C, Keen S. Child mortality and poverty in three world regions (the West, Asia and Sub-Saharan Africa) 1988-2010: evidence of relative intra-regional neglect? Scand J Public Health. 2016;44(8):734-741. doi:10.1177/1403494816675550
14. Badiani R, Baulch B, Brandt L, et al. 2012 Vietnam Poverty Assessment: Well Begun, Not Yet Done - Vietnam’s Remarkable Progress on Poverty Reduction and the Emerging Challenges. 2013. http://documents.worldbank.org/curated/en/563561468329654096/2012-Vietnam-poverty-assessment-well-begun-not-yet-done-Vietnams-remarkable-progress-on-poverty-reduction-and-the-emerging-challenges. Published 2013.
15. StatSoft Inc. Electronic Statistics Textbook. http://www.statsoft.com/Textbook/Structural-Equation-Modeling. Accessed July 20, 2019. Published 2013.
16. Kline RB. Principles and Practice of Structural Equation Modeling. 4th ed. New York: The Guilford Press; 2016.
17. Hooper D, Coughlan J, Mullen MR. Structural equation modelling:

Nguyen and Nguyen
International Journal of Health Policy and Management, 2021, 10(8), 475–482482
guidelines for determining model fit. Elecron J Bus Res Methods. 2008;6(1):53-60.
18. Idrovo AJ. Three criteria for ecological fallacy. Environ Health Perspect. 2011;119(8):A332. doi:10.1289/ehp.1103768
19. Say L, Raine R. A systematic review of inequalities in the use of maternal health care in developing countries: examining the scale of the problem and the importance of context. Bull World Health Organ. 2007;85(10):812-819. doi:10.2471/blt.06.035659
20. Gill CJ, Phiri-Mazala G, Guerina NG, et al. Effect of training traditional birth attendants on neonatal mortality (Lufwanyama Neonatal Survival Project): randomised controlled study. BMJ. 2011;342:d346. doi:10.1136/bmj.d346
21. Houweling TA, Caspar AE, Looman WN, Mackenbach JP. Determinants of under-5 mortality among the poor and the rich: a cross-national analysis of 43 developing countries. Int J Epidemiol. 2005;34(6):1257-1265. doi:10.1093/ije/dyi190
22. Gebretsadik S, Gabreyohannes E. Determinants of under-five mortality in high mortality regions of Ethiopia: an analysis of the 2011 Ethiopia Demographic and Health Survey data. Int J Popul Res. 2016; 2016:1602761. doi:10.1155/2016/1602761
23. Department of Economic and Social Affairs, Population Division. World Mortality Report 2015. United Nations; 2017.
24. Afulani PA, Moyer C. Explaining disparities in use of skilled birth attendants in developing countries: a conceptual framework. PLoS One. 2016;11(4):e0154110. doi:10.1371/journal.pone.0154110
25. World Health Organization. Human Resources for Health, Country Profiles: Vietnam. Manila: WHO Regional Office for the Western Pacific; 2016.
26. Singh K, Brodish P, Suchindran C. A regional multilevel analysis: can skilled birth attendants uniformly decrease neonatal mortality? Matern Child Health J. 2014;18(1):242-249. doi:10.1007/s10995-013-1260-7
27. Say L, Raine R. A systematic review of inequalities in the use of maternal health care in developing countries: examining the scale of the problem and the importance of context. Bull World Health Organ. 2007;85(10):812-819. doi:10.2471/blt.06.035659
28. United Nations Population Fund (UNFPA). Reaching Out to Minorities in Viet Nam with Midwives who Speak their Language. UNFPA; 2010.
29. McGovern ME, Canning D. Vaccination and all-cause child mortality from 1985 to 2011: global evidence from the Demographic and Health Surveys. Am J Epidemiol. 2015;182(9):791-798. doi:10.1093/aje/kwv125
30. Breiman RF, Streatfield PK, Phelan M, Shifa N, Rashid M, Yunus M. Effect of infant immunisation on childhood mortality in rural Bangladesh: analysis of health and demographic surveillance data. Lancet. 2004; 364(9452):2204-2211. doi:10.1016/s0140-6736(04)17593-4
31. National Institute of Hygiene and Epidemiology (NIHE). Achievements of Expand Program Immunization 2011. http://tiemchungmorong.vn/vi/content/lich-su-tcmr.html. Accessed July 27, 2019. Published 2011.
32. John TJ, Samuel R. Herd immunity and herd effect: new insights and definitions. Eur J Epidemiol. 2000;16(7):601-606. do i :10 .1023 /a :1007626510002