
DOLE RO7 Planning Tool Performance Scorecardro7.dole.gov.ph/fndr/mis/files/SCORECARD.pdf · Special...
42
DOLE RO7 Planning Tool Performance Scorecard (as of APRIL 2016)
Transcript of DOLE RO7 Planning Tool Performance Scorecardro7.dole.gov.ph/fndr/mis/files/SCORECARD.pdf · Special...

DOLE RO7 Planning Tool Performance Scorecard
(as of APRIL 2016)

PAPs/ Indicators 2016 Target
Accomplishment 2016 Budget
Allocation
Budget Utilization
Actual % Signal Utilized % Signal
Outcome 1: Enhanced Employability of Workers and Competitiveness of Enterprises Special Program for Employment of Students (SPES)
No. of youth beneficiaries 19,219 7,556 39.31%
Government Internship Program (GIP)
No. of youth beneficiaries 368 1,468 398.91%
Labor Market Information (LMI)
No. of individuals reached 235,000 127,824 54.39%
No. of institutions reached 2,200 810 36.82%
Public Employment Services
No. of qualified jobseekers referred for placement
120,915 76,177 63.00%
Productivity Toolbox – MSMEs Assisted 750 311 41.47%

PAPs/ Indicators 2016 Target
Accomplishment 2016 Budget
Allocation
Budget Utilization
Actual % Signal Utilized % Signal
Outcome 1: Enhanced Employability of Workers and Competitiveness of Enterprises
Job start
No. of youth beneficiaries 600 341 56.83%
Skills Registry System( SRS) LGUs covered in 6th wave of NSRPSlide 14 39 0 0
Career Guidance Advocacy Program Capacity –Building Activities conducted ( MEMBERS COVERED)
342 25 7.31%
Career Guidance and Employment Coaching (CGEC)Slide 16
85 92 108.24%

2016 Target
Accomplishment 2016 Budget
Allocation
Budget Utilization
Actual % Signal Utilized % Signal
Outcome 2: Sustained Cooperation Between Labor and Employers
LABOR STANDARDS ENFORCEMENT DIVISION
New Labor Laws Compliance System (LLCS) No. of establishments covered 6,662 1,828
27.44%
No. of establishments with deficiencies given appropriate assistance leading to compliance
100% 1,754/1,828 95.95%
LABOR RELATIONS DIVISION
Case Management Services Labor Strikes Cases
Actual strikes declared
Strike incidence not to exceed the single-
digit level 0 100

PAPs/Indicators 2016 Target
Accomplishment 2016 Budget Allocation
Budget Utilization
Actual % Signal Utilized % Signal
Outcome 2: Sustained Cooperation Between Labor and Employers Labor Laws Compliance System – Management Information System (MIS)
Provided Appropriate Assistance Leading to Compliance
100% 49.60% 49.60%
GLS Compliance Rate
73% LS -36% GLS-46.1%
49.32% 63.15%
OSHS Compliance Rate 73% 72.9% 99.86%
Data generated As of May 3, 2016

PAPs/ Indicators 2016 Target
Accomplishment 2016 Budget
Allocation
Budget Utilization
Actual % Signal Utilized % Signal
Outcome 3: Strengthened Social Protection for Vulnerable Workers
DOLE Integrated Livelihood and Emergency Employment Program (DILEEP)
No. of beneficiaries assisted
Regular Projects (DILP) 19,348 8,608 44.49%
TUPAD ( SF) 22,810 12,041 52.79%
Reintegration Services for OFWs
No. of beneficiaries of FAS & SBMT 112 0 0
No. of beneficiaries of livelihood assistance 112 0 0
NEXT

Conciliation Assistance (SEnA)
Settlement Rate 75% 374/535 69.91%
Disposition Rate1 100% within prescribed
period 458/535 85.61%
Compulsory Arbitration Cases (SpeED)
Disposition Rate 100% (within
prescribed period)
1,054/2,841 37.1%
Industry Self-Regulation through Voluntary Codes of Good Practices (VCGPs)
No. of VCGPs established 0 0 %
4 No. of existing VCGPs2 enhanced
3 activities conducted to
enhance VCGPs in
ITCs
%
PAPs/ Indicators 2016 Target
Accomplishment 2016 Budget
Allocation
Budget Utilization
Actual % Signal Utilized %
Outcome 2: Sustained Cooperation Between Labor and Employers

PERFORMANCE BY FIELD OFFICE
FO 2016 Target
Accomplishment 2016 Budget
Allocation
Budget Utilization
Actual % Signal Obligation % Signal
Outcome 1: Special Program for Employment of Students (SPES)
BFO 4,712 972 20.63%
CPFO 4,045 2,148 53.10%
NOFO 3,762 841 22.36%
SFO 700 389 55.57%
TCFO 6,000 3,206 53.43%
Total 19,219 7,556 39.32%
BACK

PERFORMANCE BY FIELD OFFICE
FO 2016 Target
Accomplishment 2016 Budget
Allocation
Budget Utilization
Actual % Signal Obligation % Signal
Outcome 1: Government Internship Program (GIP)
BFO 105 251 239.05%
CPFO 0 153
NOFO 33 330 1,000%
SFO 178 156 87.64%
TCFO 52 578 1,111.54%
Total 368 1,468 398.91%
BACK

PERFORMANCE BY FIELD OFFICE
FO 2016 Target
Accomplishment 2016 Budget
Allocation
Budget Utilization
Actual % Signal Obligation % Signal
Outcome 1: Labor Market Information (No. of individuals reached) 235,000
BFO 35,000 19,300 55.14%
CPFO 45,000 35,633 79.18%
NOFO 55,000 28,963 52.66%
SFO 5,000 2,210 44.2%
TCFO 95,000 41,718 43.91%
Total 235,000 127,824 54.39% BACK

PERFORMANCE BY FIELD OFFICE
FO 2016 Target
Accomplishment 2016 Budget
Allocation
Budget Utilization
Actual % Signal Obligation % Signal
Outcome 1: Labor Market Information (No. of institutions reached) 2,200
BFO 160 68 42.5%
CPFO 600 86 14.33%
NOFO 400 132 33%
SFO 40 38 95%
TCFO 1,000 486 48.6%
Total 2,200 810 36.82% BACK

PERFORMANCE BY FIELD OFFICE
FO 2016 Target
Accomplishment 2016 Budget
Allocation
Budget Utilization
Actual % Signal Obligation % Signal
Outcome 1: Public Employment Services (jobseekers referred for placement) 120,915)
BFO 17,654 16,950 96.01%
CPFO 30,471 19,592 64.30%
NOFO 42,320 21,086 49.83%
SFO 2,418 850 35.15%
TCFO 28,052 17,699 63.09%
Total 120,915 76,177 63.00% BACK

PERFORMANCE BY FIELD OFFICE
FO 2016 Target
Accomplishment 2016 Budget
Allocation
Budget Utilization
Actual % Signal Obligation % Signal
Outcome 1:Jobstart 600
BFO 200 119 59.5%
CPFO 0 0
NOFO 200 120 60.00%
SFO 0 0
TCFO 200 102 51.00%
Total 600 341 56.83%
BACK

PERFORMANCE BY FIELD OFFICE
FO 2016 Target
Accomplishment 2016 Budget
Allocation
Budget Utilization
Actual % Signal Obligation % Signal
Outcome 1:Skills Registry System (SRS) 39
BFO 15 0 0
CPFO 15 0 0
NOFO 7 0 0
SFO 2 0 0
TCFO
0
Total 39 0 0 BACK

PERFORMANCE BY FIELD OFFICE
FO 2016 Target
Accomplishment 2016 Budget
Allocation
Budget Utilization
Actual % Signal Obligation % Signal
Outcome 1: Capacity –Building Activities conducted 342 BFO 68 0 0
CPFO 75 0 0
NOFO 106 25 23.58%
1CGCs network covered with 25 members
SFO 10 0 0
TCFO 83
0
0
Total 342 25 7.31% BACK

PERFORMANCE BY FIELD OFFICE
FO 2016 Target
Accomplishment 2016 Budget
Allocation
Budget Utilization
Actual % Signal Obligation % Signal
Outcome 1: Career Guidance and Employment Coaching 85
BFO 19 24 126.32%
CPFO 34 9 26.47%
NOFO 21 12 57.14%
SFO 2 23 1,150%
TCFO 9 24 266.67%
Total 85 92 108.24% BACK
PERFORMANCE BY FIELD OFFICE
FO 2016 Target
Accomplishment 2016 Budget
Allocation
Budget Utilization
Actual % Signal Obligation % Signal
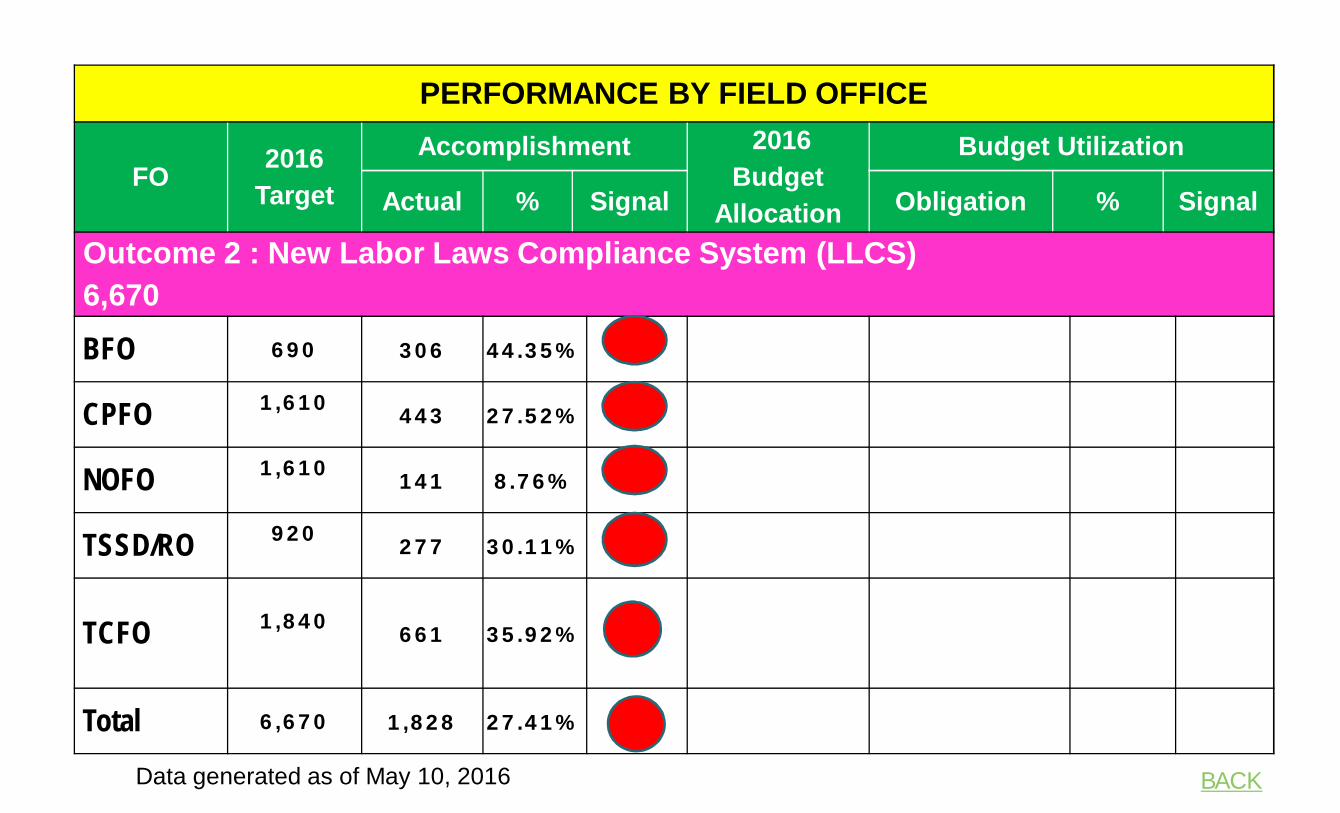
Outcome 2 : New Labor Laws Compliance System (LLCS) 6,670
BFO 690 306 44.35%
CPFO 1,610 443 27.52%
NOFO 1,610 141 8.76%
TSSD/RO 920 277 30.11%
TCFO 1,840 661 35.92%
Total 6,670 1,828 27.41%
BACK Data generated as of May 10, 2016

PERFORMANCE BY FIELD OFFICE
FO 2016 Target Accomplishment 2016
Budget Allocation
Budget Utilization
Actual % Signal Obligation % Signal
Outcome 2 : New Labor Laws Compliance System (LLCS)
BFO 100% of establishments
with deficiencies
given appropriate assistance leading to
compliance
301/306 98.36%
CPFO 416/443 93.91%
NOFO 123/141 87.23%
TSSD 267/277 96.39%
TCFO 647/661 97.88%
Total 1,754/1,828 95.95%
BACK Data generated As of May 10, 2016

PERFORMANCE BY FIELD OFFICE
FO 2016 Target
Accomplishment 2016 Budget
Allocation
Budget Utilization
Actual % Signal Obligation % Signal
Outcome 2 : Conciliation Assistance through Single Entry Approach or SEnA Indicator: Settlement Rate
BFO 75%
50/65
76.92%
CPFO
75%
45/69 65.22%
NOFO
75%
118/173
68.21%
SFO
75%
11/13
84.62%
TCFO
75%
150/215 69.77% Total 75% 374/535 69.91% BACK

PERFORMANCE BY FIELD OFFICE
FO 2016 Target
Accomplishment 2016 Budget
Allocation
Budget Utilization
Actual % Signal Obligation % Signal Outcome 2 : Conciliation Assistance through Single Entry Approach or SEnA Indicator: Disposition Rate
BFO 100% 56/65 86.15%
CPFO 100% 57/69 82.61%
NOFO 100% 156/173 90.17%
SFO 100%
13/13
100.00%
TCFO 100% 176/215 81.86%
Total 100% 458/535 85.61%
BACK All pending RFAs are current.

PERFORMANCE BY FIELD OFFICE
FO 2016 Target
Accomplishment 2016 Budget
Allocation
Budget Utilization
Actual % Signal Obligation % Signal
Outcome 3 : DOLE Integrated Livelihood and Emergency Employment Program
BFO 1,947 1,163 59.73%
CPFO 6,529 3,696 56.61%
NOFO 2,934 1,270 43.29%
SFO 1,063 920 86.55%
TCFO 3,635 1,559 42.89%
RO 3,240 0 0
Total 19,348 8,608 44.49%
BACK

PERFORMANCE BY FIELD OFFICE
FO 2016 Target
Accomplishment 2016 Budget
Allocation
Budget Utilization
Actual % Signal Obligation % Signal
Outcome 3 : TUPAD ( Special Fund)
BFO 1,324 o
CPFO 9,484 537 5.66%
NOFO 640 0
SFO 612 0
TCFO 10,750 11,504 107.01%
Total 22,810 12,041 52.79% BACK

DOLE RO7 Planning Tool Performance Scorecard
(as of APRIL 2016)

PAPs/ Indicators 2016 Target
Accomplishment 2016 Budget
Allocation
Budget Utilization
Actual % Signal Utilized % Signal
OPCR / SPRS Commitments
Special Program for Employment of Students (SPES)
Graduated/finished voc./college 32 1 3.13%
Child Labor Prevention and Elimination Program (CLPEP)
New-Frontiers barangays upgraded to Continuing
9 2 22.22%
Continuing barangays upgraded to Low-Hanging
20 0 0
Low-Hanging barangays certified as Child Labor-Free
16 0 0
Skills Registry System (SRS)
No. of LGUs covered 39 0 0

PAPs/ Indicators 2016 Target
Accomplishment 2016 Budget
Allocation
Budget Utilization
Actual % Signal Utilized % Signal
OPCR / SPRS Commitments Public Employment Service (PES) thru PESO
PESOs Institutionalized 5 3 60%
PESO Trainings/Orientations 19 12 63.16%
Family Welfare Program (FWP)
Establishments Serviced 152 21 15.82%
Workers Serviced 30,400 12,806 42.125%
Workers Organization and Development Program (WODP)
Training Grants Provided 6 0 0
Members Trained 100 0 0

PAPs/ Indicators 2016 Target
Accomplishment 2016 Budget
Allocation
Budget Utilization
Actual % Signal Utilized % Signal
OPCR / SPRS Commitments
Labor and Employment Education Program
LHP Seminars Conducted 137 23 16.79%
CLES Conducted 211 47 22.27%
LEGS Orientation to 7% of graduating students
3,019 12,130 401.79%
Technical Safety Inspection (TSI)
Establishments Inspected 74 17 22.97%

PERFORMANCE BY FIELD OFFICE
FO 2016 Target
Accomplishment 2016 Budget
Allocation
Budget Utilization
Actual % Signal Obligation % Signal
SPES (graduated/finished voc./college)
BFO 4 0 0
CPFO 4 0 0
NOFO 4 0 0
SFO 1 0 0
TCFO
19 1 0
Total 32 1 3.13%
BACK

PERFORMANCE BY FIELD OFFICE
FO 2016 Target
Accomplishment 2015 Budget
Allocation
Budget Utilization
Actual % Signal Obligation % Signal
CLPEP – NF (New-Frontiers ) 9
BFO 1 0 %
CPFO 2 0 %
NOFO 1 1 100%
SFO 0
TCFO
5 1 20.00%
Total 9 2 22.22% BACK

PERFORMANCE BY FIELD OFFICE
FO 2016 Target
Accomplishment 2016 Budget
Allocation
Budget Utilization
Actual % Signal Obligation % Signal
CLPEP - CLF( child labor free) 16
BFO 0 0 0
CPFO 2 0 0
NOFO 11 0 0
SFO 0
TCFO
3 0 0
Total 16 0 0
BACK

PERFORMANCE BY FIELD OFFICE
FO 2016 Target
Accomplishment 2016 Budget
Allocation
Budget Utilization
Actual % Signal Obligation % Signal
CLPEP – LH( Low Hanging) 20 BFO 1 0 0
CPFO 4 0 0
NOFO 8 0 0
SFO 0
TCFO
7 0 0
Total 20 0 0
BACK

PERFORMANCE BY FIELD OFFICE
FO 2016 Target
Accomplishment 2016 Budget
Allocation
Budget Utilization
Actual % Signal Obligation % Signal
Skills Registry System
BFO 15 0 0
CPFO 15 0 0
NOFO 7 0 0
SFO 2 0 0
TCFO
0
Total 39 0 0 BACK

PERFORMANCE BY FIELD OFFICE
FO 2016 Target
Accomplishment 2016 Budget Allocation
Budget Utilization
Actual % Signal Obligation % Signal
PESO Institutionalized 5
BFO 1 1 100%
CPFO 1 1 100%
NOFO 1 1 100%
SFO 1 0 0
TCFO
1 0 0
Total 5 3 60% BACK

PERFORMANCE BY FIELD OFFICE
FO 2016 Target
Accomplishment 2016 Budget
Allocation
Budget Utilization
Actual % Signal Obligation % Signal
PESO Trainings / Orientations 19
BFO 4 1 25.00%
CPFO 4 3 75.00%
NOFO 4 3 75.00%
SFO 3 2 66.67%
TCFO 4 3 75.00%
Total 19 12 63.16% BACK

PERFORMANCE BY FIELD OFFICE
FO 2016 Target
Accomplishment 2016 Budget Allocation
Budget Utilization
Actual % Signal Obligation % Signal
Family Welfare Program (FWP) Establishments Serviced 152
BFO 9 7 77.77%
CPFO 22 0 0
NOFO 24 9 37.5%
SFO
TCFO 97 5 5.15%
Total 152 21 13.82% BACK
PERFORMANCE BY FIELD OFFICE
FO 2016 Target
Accomplishment 2016 Budget
Allocation
Budget Utilization
Actual % Signal Obligation % Signal
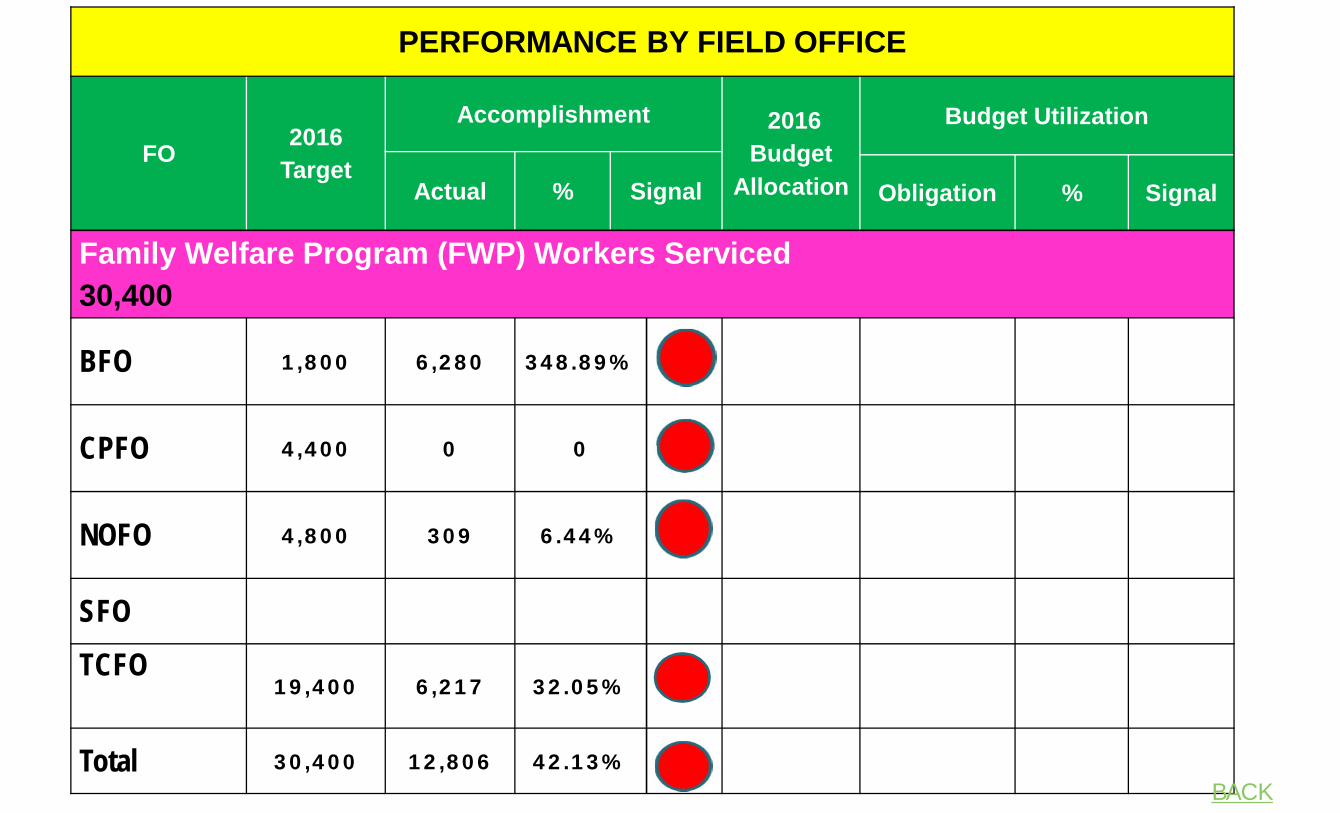
Family Welfare Program (FWP) Workers Serviced 30,400
BFO 1,800 6,280 348.89%
CPFO 4,400 0 0
NOFO 4,800 309 6.44%
SFO TCFO
19,400 6,217 32.05%
Total 30,400 12,806 42.13% BACK

PERFORMANCE BY FIELD OFFICE
FO 2016 Target
Accomplishment 2016 Budget
Allocation
Budget Utilization
Actual % Signal Obligation % Signal
WODP Training Grants
BFO 1 0 0
CPFO 1 0 0
NOFO 1 0 0
SFO
TCFO 3
0 0
Total 6 0 0
BACK

PERFORMANCE BY FIELD OFFICE
FO 2016 Target
Accomplishment 2016 Budget Allocation
Budget Utilization
Actual % Signal Obligation % Signal
WODP Members Trained
BFO 25 0 0
CPFO 25 0 0
NOFO 25 0 0
SFO
TCFO 25 0 0
Total 100 0 0
BACK

PERFORMANCE BY FIELD OFFICE
FO 2016 Target
Accomplishment 2016 Budget Allocation
Budget Utilization
Actual % Signal Obligation % Signal
LHP Seminars Conducted 137
BFO 20 6 30%
CPFO 35 1 2.86%
NOFO 28 7 25%
SFO 4 1 25%
TCFO
50 8 16%
Total 137 23 16.79% BACK

PERFORMANCE BY FIELD OFFICE
FO 2016 Target
Accomplishment 2016 Budget Allocation
Budget Utilization
Actual % Signal Obligation % Signal
CLES Conducted 211
BFO 32 31 96.88%
CPFO 52 0 0
NOFO 42 7 16.67%
SFO 7 0 0
TCFO
78 9 11.54%
Total 211 47 22.27% BACK

PERFORMANCE BY FIELD OFFICE
FO 2016 Target
Accomplishment Seminar/ School
Budget Utilization
Actual % Signal Obligation % Signal
LEGS 3,019
BFO 437 3,963 906.86% 23 seminars 23 schools
CPFO 513 1,093 213.06% 7seminars 7schools
NOFO 431 3,253 754.76% 15 seminars 14 schools
SFO 23 0 0
TCFO 1,615
3,821 236.59% 10 seminars 10 schools
Total 3,019 12,130 401.79% 55 seminars 54 schools
BACK

PERFORMANCE BY FIELD OFFICE
FO 2016 Target
Accomplishment 2016 Budget
Allocation
Budget Utilization
Actual % Signal Obligation % Signal
TSI Establishments Inspected 74
BFO 10 1 10%
CPFO 32 8 25%
NOFO 20 8 40%
SFO
TCFO
12 0 0
Total 74 17 22.97% BACK

“Wisdom is the sunlight of the soul”. German Proverb


![KATALOG - Vetos-Farma · KATALOG PRODUKTÓW – VETOS FARMA))) :( $ " LEKI WETERYNARYJNE 9 ..... ] F ] ruov ;h 7o ro7- -mb- o7 b; 7o rb1b- 7 t- h u](https://static.fdocuments.net/doc/165x107/5ec3fa66be55e42e4f4f2b5e/katalog-vetos-farma-katalog-produktw-a-vetos-farma-leki-weterynaryjne.jpg)


