
DOF Subsea Group Sub/IR/2013/DOF Subsea Group... · 2014-02-26 · DOF Subsea Group –In brief DOF...
36
Q4 2013 Presentation DOF Subsea Group
Transcript of DOF Subsea Group Sub/IR/2013/DOF Subsea Group... · 2014-02-26 · DOF Subsea Group –In brief DOF...
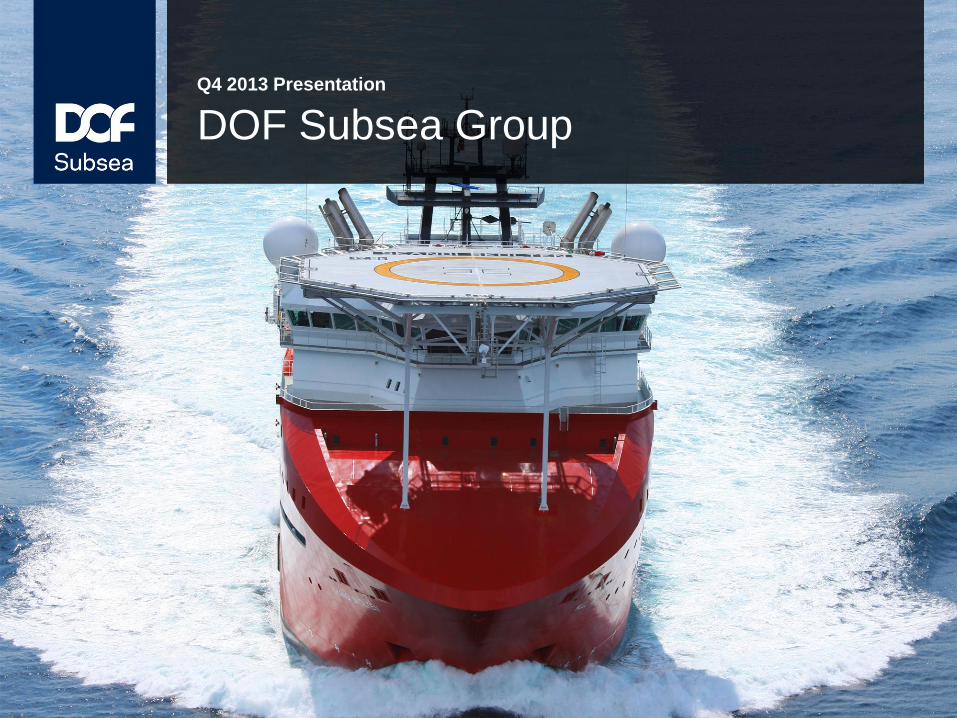
Q4 2013 Presentation
DOF Subsea Group

DOF Subsea
Agenda
In brief
Recent events
Group overview
Contract status
Financials
Outlook
Appendix
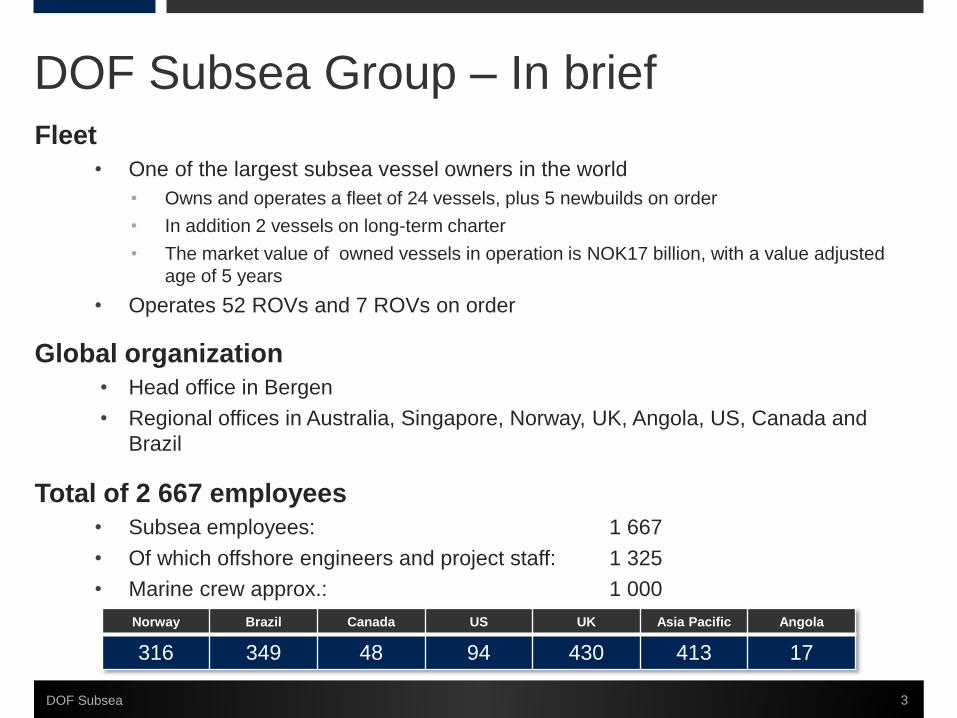
DOF Subsea Group – In brief
DOF Subsea 3
Fleet
• One of the largest subsea vessel owners in the world
• Owns and operates a fleet of 24 vessels, plus 5 newbuilds on order
• In addition 2 vessels on long-term charter
• The market value of owned vessels in operation is NOK17 billion, with a value adjusted
age of 5 years
• Operates 52 ROVs and 7 ROVs on order
Global organization
• Head office in Bergen
• Regional offices in Australia, Singapore, Norway, UK, Angola, US, Canada and
Brazil
Total of 2 667 employees
• Subsea employees: 1 667
• Of which offshore engineers and project staff: 1 325
• Marine crew approx.: 1 000
Norway Brazil Canada US UK Asia Pacific Angola
316 349 48 94 430 413 17

DOF Subsea Group – In brief
DOF Subsea 4
Key figures
Back-log incl. options NOK 34 billion
Market value of fleet NOK 17 billion
Number of shares 119 733 714
Total Per share
Book equity NOK 5.2 billion NOK 43.56
Value adj. equity NOK 8.5 billion NOK 71.05
Book equity ratio 26.8 %
Value adj. equity ratio 37.4 %
19.7 %
CAGR
20.1 %
CAGR
Quarterly figures
27%
28%
29%
30%
31%
32%
33%
-
200
400
600
800
1 000
1 200
1 400
1 600
1 800
2 000
Q4 2010 Q4 2011 Q4 2012 Q4 2013
NO
K m
illio
n
Operating revenue EBITDA EBITDA margin

Recent events
DOF Subsea 5
Fleet
• Chartered the Normand Reach for a 2 + 2 year period
• Skandi Bergen was delivered to new owners in beginning of January
• Skandi Aker purchase options was exercised by AKOFS 2 AS, transaction in February 2015
Contracts
• Statoil call-off under existing frame agreement, utilizing Geosund for minimum 4 months in
2014 and 8 months in 2015
• Several subsea contracts in the North America region, increasing the utilization of the vessel
Harvey Deep-Sea, including a two-year frame agreement
• Awarded mooring installation contract in Asia Pacific, utilizing Skandi Hercules for approx. 2
months
• Australian Customs and Border control extended the charter on Ocean Protector with 6 months
• Awarded 5 ROV contracts by Petrobras for a 4 + 4 years period
• Awarded an RSV contract with Petrobras for a period of 18 months
• Technip awarded DOF Subsea a 5 + 5 year charter agreement on the newbuild VARD800
Finance
• Sale of own holding in bonds DOFSUB05 and DOFSUB06 and bought back bonds in
DOFSUB04, with a total net cash effect of NOK 236 million

State-of-the-art PLSVs
DOF Subsea 6
PLSV 1+2 PLSV 3+4
• To be built in Brazil
• Delivered Q4 2016 and Q2 2017
• Design 316
• Type Pipe Lay support
• LOA 140 m
• Breadth 28 m
• VLS 340 t
• 2 ROVs
• DWT 10 800 t
• To be built in Norway, Søviknes
• Delivered Q2 2016 and Q4 2016
• Design 305
• Type Pipe Lay support
• LOA 150 m
• Breadth 30 m
• VLS 650 t
• 2 ROVs
• DWT 13 200 t
• Contract 8+8 years
• Norskan will provide Marine
Services
• Approx. USD 110 million in
annual EBITDA contribution for
DOF Subsea when all vessels
are in operations
• DOF Subsea part of CAPEX
approx. USD 625 million

DOF Subsea
Group overview

Ownership structure
DOF Subsea 8
Modern high-end fleet and equipment
A workforce of 2 667 highly skilled employees
24 owned subsea vessels in operation
5 vessels on order
2 vessels on charter
50 ROVs, 1 ROTV and 1 AUV in operation
7 ROVs on order
Leading subsea contractor
51% 49%
100%
DOF ASAFIRST RESERVE
CORPORATION
DOF SUBSEA
HOLDING AS
DOF SUBSEA AS
DOF Subsea AS
DOF Subsea Asia Pacific
Singapore
Australia
Indonesia
Malaysia
Mashhor DOF Subsea (50%)
Brunei
DOF Subsea Atlantic
UK
Angola
Norway
Arctic
Russia
DOF Subsea North America
US
Canada
DOF Subsea Brazil
Survey & Positioning
UK
US
Management companies
DOF Management
(34 %)
Marin IT
(35 %)
Engineering companies
CSL
Semar (50%)
Ship/asset owning
companies
DOF Subsea Rederi
DOF Subsea Rederi II
DOF Installer (83.66 %)
DOFTECH
(50 %)
TECHDOF
(50 %)
DOF Subsea ROV
DOF Subsea 9
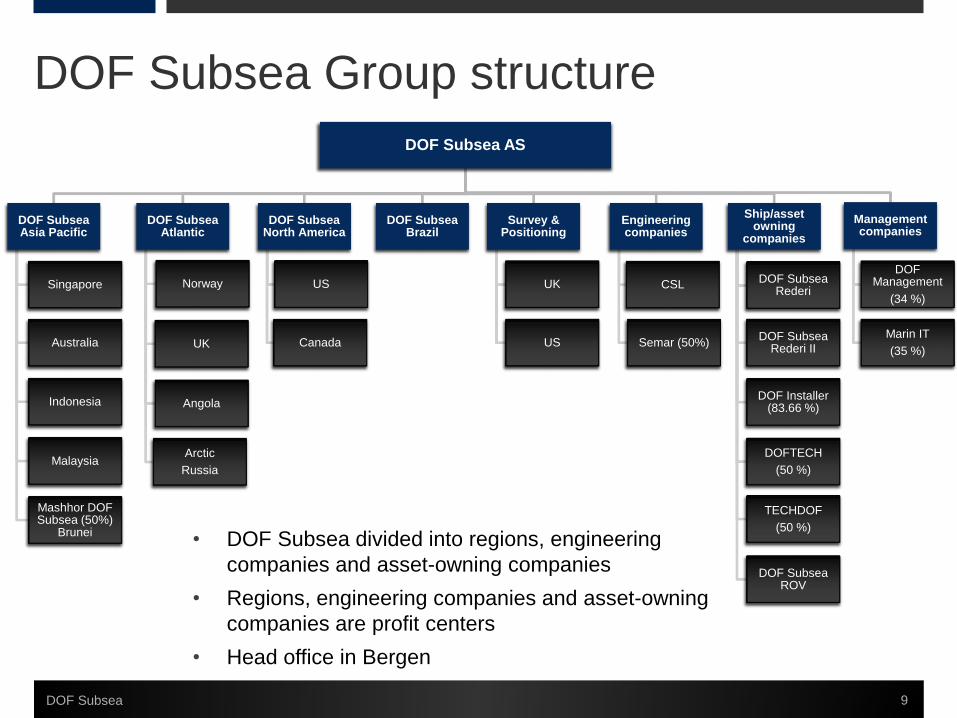
DOF Subsea Group structure
• DOF Subsea divided into regions, engineering
companies and asset-owning companies
• Regions, engineering companies and asset-owning
companies are profit centers
• Head office in Bergen

GEOGRAPHICAL FOCUS AREAS
PerthRio de Janeiro
Buenos Aires
Singapore
Houston
St. Johns
Aberdeen
Cairo
Brunei
Macaé
Jakarta
Manila
Angola
Moscow
Bergen
(142)
(349)
(17)
(413)
(746)
DOF Subsea - A global subsea player
10DOF Subsea
Malaysia

• Incorporated on 24th of May 2005 after DOF ASA acquired
GEO Group AS and its subsidiary Geoconsult AS
• DOF Subsea was established by DOF ASA in order to create a
more effective organization with the aim of establishing a
leading subsea services company
• DOF ASA transferred its multipurpose/ROV vessels to
DOF Subsea, constituting four vessels and one
newbuild
• DOF Subsea is headquartered in Bergen, Norway
DOF Subsea fleet evolution
-
2 000
4 000
6 000
8 000
10 000
12 000
14 000
16 000
18 000
0
4
8
12
16
20
24
28
2005 2006 2007 2008 2009 2010 2011 2012 2013
NO
K m
illio
n
Nu
mb
er
of o
pe
rate
d v
essels
Owned vessels Chartered vessels MV of owned fleet (r.a.)
MV of fleet
DOF Subsea – Company history
DOF Subsea 11
2005 2006 2007
Fleet: 11 vessels
May: DOF acquired Geoconsult and established GEO (now DOF Subsea)
May: Private placement of shares of NOK 715 mill
Nov: Listed on Oslo Stock Exchange
Nov: Acquisition of Century Subsea
Fleet: 11 vessels
Feb: Acquisition of Covus Corp
May: Set up of Geo do Brazil
Aug: Established 50/50 JV in Brunei
Fleet: 13 vessels
Jan: Acquired 50% of SEMAR
Jan: Acquired 100% of DOFCON
Mar: Establishment of Aker Oilfield Services
Mar: Name change to DOF Subsea
Apr: Acquisition of CSL
Aug: Merger of Mgmt company with DOF Management AS
2008
Fleet: 16 vessels
Feb: Delivery of Geograph
Jul: Delivery of Skandi Acergy
Nov: Delivery of Skandi Seven and sale of Geofjord
Dec: DOF Subsea acquired by DOF ASA and First Reserve
JV with Technip
2009 2010
Fleet: 18 vessels
Feb: Delivery of Skandi Salvador
Mar: Delivery of Skandi Arctic
Dec: Delivery of Skandi Santos
Fleet: 21 vessels
Jan: Delivery of Skandi Aker
Feb: Sale of GeoChallenger
Jun: Acquisition of SWG
Jul: Delivery of Skandi Vitoria and Skandi Skolten
Dec: Delivery of Skandi Hercules
JV with Technip
2011
Fleet: 24 vessels
Feb: Delivery of Skandi Niteroi
May: Sale of Geosounder
Jun: Acquisition Skandi Constructor
Jul: Delivery of Skandi Skansen
Sep: Delivery of Skandi Singapore
2012
Fleet: 25 vessels
Mar: Sale of OSCV newbuild.
Mar: Signed OSCV newbuildcontract
2013
Fleet: 26 vessels
Feb: Signed OSCV newbuildcontract
Feb: Chartered Harvey Deep-Sea
Mar: Sale ofGeobay
Jun: Delivery of Skandi Bergen
Aug: Signed newbuild contracts for 4 x PLSVs
Nov: Chartered Normand Reach

• DOF Subsea’s main presence is in segments with medium to high
barriers to entry and high complexity of operations
• Higher margins and earnings beyond the time charter rates
• DOF Subsea is gradually building engineering capabilities
12DOF Subsea
Le
ve
l o
f b
arr
iers
to
en
try
Incre
ase
d e
ng
ine
ering
re
qu
ire
me
nt
Complex
subsea operations
Marine transport/
services
Co
mp
lexity a
nd
siz
e o
f o
pe
ratio
ns
Incre
ase
d s
yste
m r
eq
uire
me
nt
Level of industry barriers to entry

New high-end fleet
DOF Subsea 13
• Majority of the fleet delivered after 2007
• Industry leading value adjusted average fleet age of 5 years
• High-end vessels capable of a wide scope of operations, world wide
Newbuild17 %
2007 - 201359 %
2000 - 200621 %
Before 20003 %
Building year DOF Subsea fleet
-
1,00
2,00
3,00
4,00
5,00
6,00
7,00
8,00
Average fleet age
Value adjusted

2009
Business management
Global business management system accredited by DNV to:
• Business Management System ISO 9001: 2008
• Health and Safety System OHSAS 18001:2007
• Environmental Management System ISO 14001:2004
• Global recertification by DNV December 2013
DOF Subsea 14

• DOF Subsea Lost Time Injury (LTI) frequencies compared with IMCA industry average
• High number of safety observations reported shows commitment to HSEQ
HSEQ key statistcs
DOF Subsea 15
Safety Observations 2013
0,00
2,00
4,00
6,00
8,00
10,00
12,00
2005 2006 2007 2008 2009 2010 2011 2012 2013
DOF Subsea LTI frequency
IMCA - LTI frequency
DOF Subsea - recordable incidentfrequency
IMCA - recordable incident frequency
0
200
400
600
800
1000
1200
1400
1600
Jan Feb Mar Apr May Jun Jul Aug Sep Oct Nov Dec
* Figures frequency per million man hours
* Figures represent number of safety observations

DOF Subsea
Projects

DOF Subsea – Life-of-field services
DOF Subsea 17
• DOF Subsea offers integrated subsea solutions across life-of-field
• Field development
• Production phase
• Field abandonment / decommissioning

DOF Subsea – Projects
• DOF Subsea has built a global project
organization over the last 8 years
• DOF Subsea has developed the project
business gradually
• Increased project activity driving growth
• Project business going forward
• Hire more engineers
• Gradually increase the complexity
of work done (Step by Step)
• Build a larger project back-log
• Mix between owned and chartered
in vessels
DOF Subsea 18
2012 2013
Operating Revenue 5 248 6 579
EBITDA 1 788 1 945
-
1 000
2 000
3 000
4 000
5 000
6 000
7 000
NO
K m
illio
n
Operating Revenue EBITDA
* Excluding gain on sale of assets

DOF Subsea – Projects
DOF Subsea 19
OMV Emergency FPSO
Mooring System Repair
• Skandi Singapore Q1 ‘12 &’13,
Skandi Hercules, Skandi Skansen,
Skandi Atlantic, Skandi Emerald
Q3 & Q4 ‘13
• Initially routine IRM scope including
saturation diving in NZ. Emergency
FPSO Mooring System Repair,
stabilising vessel, Engineering,
Project Management and
replacement vessel for Galoc EPIC
project.
• Innovation for diverless solution to
handle significant loads involved.
Developed and built the equipment
in time Hercules arrived in New
Zealand.
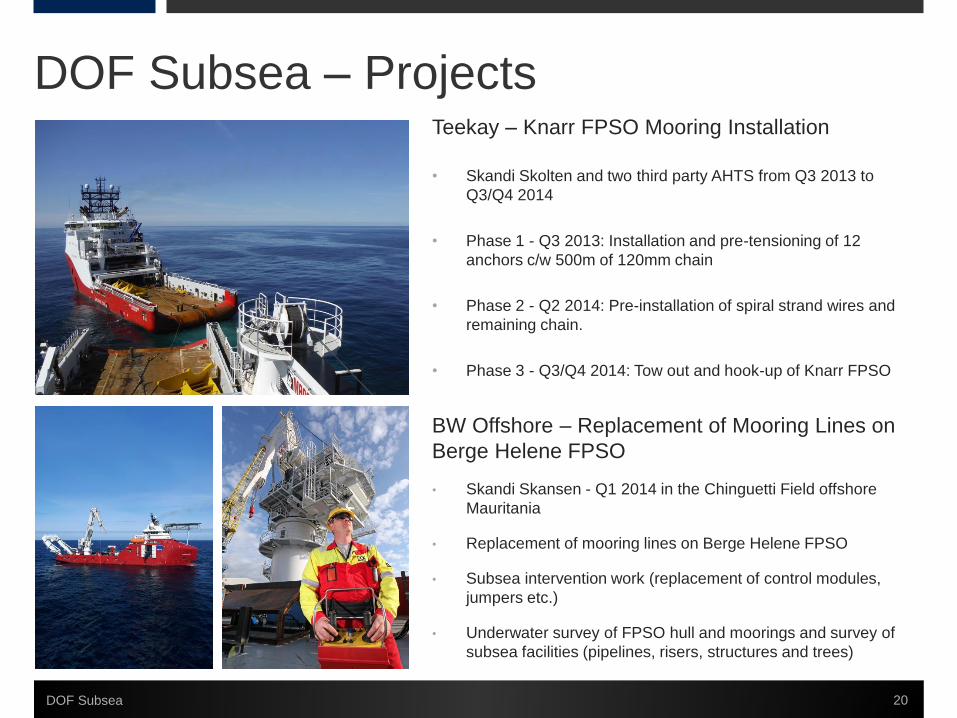
DOF Subsea – Projects
DOF Subsea 20
Teekay – Knarr FPSO Mooring Installation
• Skandi Skolten and two third party AHTS from Q3 2013 to
Q3/Q4 2014
• Phase 1 - Q3 2013: Installation and pre-tensioning of 12
anchors c/w 500m of 120mm chain
• Phase 2 - Q2 2014: Pre-installation of spiral strand wires and
remaining chain.
• Phase 3 - Q3/Q4 2014: Tow out and hook-up of Knarr FPSO
BW Offshore – Replacement of Mooring Lines on
Berge Helene FPSO
• Skandi Skansen - Q1 2014 in the Chinguetti Field offshore
Mauritania
• Replacement of mooring lines on Berge Helene FPSO
• Subsea intervention work (replacement of control modules,
jumpers etc.)
• Underwater survey of FPSO hull and moorings and survey of
subsea facilities (pipelines, risers, structures and trees)

DOF Subsea
Contract status

Contract coverage vessels
DOF Subsea 22
FIRM CONTRACTS
OPTIONAL PERIOD
CONSTRUCTION PERIOD
Chartered in vessels

Contract coverage vessels
DOF Subsea 23
• DOF Subsea Group has solid cash flow visibility over the next 3-5 years
• By December 2013 the total back-log (incl. options) was approx. NOK 34 billion
• Firm contracts counts for approx. NOK 17 billion
• Options counts for approx. NOK 17 billion
Note: includes options on long-term contracts
34
29
27
24
22
19
17
14
-
5
10
15
20
25
30
35
40
2014 2015 2016 2017 2018 2019 2020 2021
NO
K b
illio
n
DOF Subsea
Financials

Condensed profit & loss
• Operating income increased from NOK 1 288 million in Q4 2012 to NOK 1 871 million in Q4 2013.
• EBITDA (excl. gain on sale of assets) increased from NOK 417 million in Q4 2012 to NOK 550 million in Q4 2013.
• EBIT (excl. gain on sale of assets) increased from NOK 227 million in Q4 2012 to NOK 360 million in Q4 2013.
DOF Subsea 25

Condensed balance sheet
• From year end 2012 total fixed assets has increased from NOK 16 012 million to NOK 16 340 million
• From year end 2012 cash and cash equivalents has increased from NOK 1 478 million to NOK 1 833 million
• Total liabilities as per 31st December 2013 was NOK 14 594 million
• Net interest bearing debt of NOK 10 923 million as per 31st December 2013
• Book equity of NOK 5 216 million giving a ratio of 26.8 % to total assets as per 31st December 2013
• Value adjusted equity of NOK 8 507 million giving a ratio of 37.4 % as per 31st December 2013
DOF Subsea 26

Quarterly performance (excl. asset sales)
DOF Subsea 27
25.5 %
CAGR
34.0 %
CAGR
0%
5%
10%
15%
20%
25%
30%
35%
40%
-
200
400
600
800
1 000
1 200
1 400
1 600
1 800
2 000
Q4 2009Q1 2010Q2 2010Q3 2010Q4 2010Q1 2011Q2 2011Q3 2011Q4 2011Q1 2012Q2 2012Q3 2012Q4 2012Q1 2013Q2 2013Q3 2013Q4 2013
NO
K m
illio
n
Operating income EBITDA EBITDA margin
NOK million Q4 2009 Q1 2010 Q2 2010 Q3 2010 Q4 2010 Q1 2011 Q2 2011 Q3 2011 Q4 2011 Q1 2012 Q2 2012 Q3 2012 Q4 2012 Q1 2013 Q2 2013 Q3 2013 Q4 2013
Operating income 754 730 944 851 1 080 900 1 028 1 152 1 246 1 223 1 384 1 354 1 288 1 225 1 679 1 804 1 871
EBITDA 171 186 306 282 320 241 325 370 406 411 470 489 417 329 471 595 550
EBITDA margin 22.6% 25.4% 32.4% 33.2% 29.7% 26.8% 31.6% 32.1% 32.6% 33.6% 34.0% 36.1% 32.4% 26.9% 28.1% 33.0% 29.4%
Current assets 2 670 2 467 2 919 3 192 3 366 2 829 3 003 2 938 2 923 2 782 2 962 2 704 2 612 3 077 3 319 3 119 3 470
Fixed assets 10 933 11 738 12 499 13 325 14 179 14 520 15 089 16 178 16 305 16 455 16 230 16 056 16 012 16 043 16 344 16 330 16 340
Total assets 13 603 14 205 15 418 16 517 17 545 17 349 18 092 19 117 19 228 19 238 19 192 18 760 18 624 19 120 19 663 19 450 19 810
Current liabilities 1 489 2 035 2 496 2 942 2 167 2 311 2 458 2 640 2 637 2 543 2 495 2 260 1 989 2 000 2 805 2 808 3 167
Non-current liabilities 8 279 8 350 8 867 9 109 10 154 9 946 10 542 11 694 11 759 11 723 11 735 11 439 11 534 12 051 11 862 11 474 11 427
Equity 3 833 3 819 4 054 4 466 5 224 5 091 5 092 4 782 4 832 4 970 4 963 5 061 5 102 5 069 4 996 5 167 5 216

Debt maturity profile
DOF Subsea 28
DOFSUB04
- NOK 750 million
- Maturity April 2014
- Net NOK 453.5 million
DOFSUB05
- NOK 750 million
- Maturity April 2016
- Net NOK 750 million
DOFSUB06
- NOK 700 million
- Maturity Oct 2015
- Net NOK 700 million
DOFSUB07
- NOK 1 300 million
- Maturity May 2018
• The figures reflects amortization and balloon payments on debt drawn as per 31st December 2013.
• Debt maturity profile excludes approx. NOK 0.6 billion in payments to Eksportfinans which is serviced by corresponding
amount of restricted cash.
* As per 31st December 2013
Debt maturity profile DOF Subsea AS level, 2014E – 2018E
-
500
1 000
1 500
2 000
2 500
3 000
2014E 2015E 2016E 2017E 2018E After
NO
K m
illio
n
Bond Loan Bank Debt Balloons

Stable asset values over the last years
DOF Subsea 29
200
300
400
500
600
700
800
900
2002 2003 2004 2005 2006 2007 2008 2009 2010 2011 2012 2013
NO
K m
illio
n
Skandi Seven Ocean Protector Geoholm Skandi Patagonia
• Fair market values of the DOF Subsea fleet have been stable over time.
* As per 31st December 2013
Market value development

Asset coverage
DOF Subsea 30
• The figures reflects amortization and balloon payments on debt drawn as per 31st December 2013, including newbuilds
to be delivered assuming standard DOF Subsea leverage. Bonds not included.
Gearing forecast – summary Total assets (NOK billion) Market value
Vessels 17.1
Other equipment (a) 1.3
Total assets 18.4
• Note: vessel values as per 31st December 2013
(a) Includes ROVs, AUV, diving systems and other equipment
• Combined market value of DOF Subsea’s fleet is NOK 17 billion
• Vessel level gearing on the existing fleet is estimated to 44 % at year end 2014, decreasing to 36 % at year end 2015
• Provides a significant equity cushion on top of the existing vessel level financing
• Significant gearing reduction on the existing fleet in the years to come
0 %
10 %
20 %
30 %
40 %
50 %
60 %
70 %
80 %
90 %
100 %
2014E 2015E 2016E 2017E 2018E
44 %36 % 34 % 32 % 28 %
56 %64 % 66 % 68 % 72 %
Loan to value Market Value Cushion
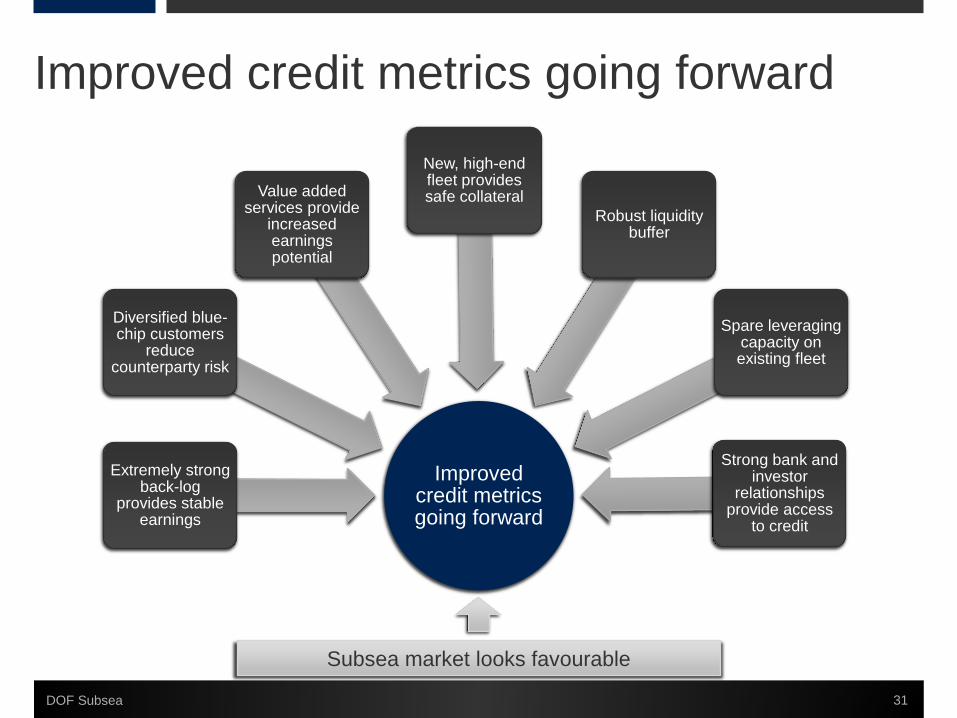
Improved credit metrics going forward
DOF Subsea 31
Improved credit metrics going forward
Extremely strong back-log
provides stable earnings
Diversified blue-chip customers
reduce counterparty risk
Value added services provide
increased earnings potential
New, high-end fleet provides safe collateral
Strong bank and investor
relationships provide access
to credit
Spare leveraging capacity on existing fleet
Robust liquidity buffer
Subsea market looks favourable

DOF Subsea
Outlook

Mixed fundamentals for subsea activity
DOF Subsea 33
Demand
• Stable oil price
• Expected growth in E&P spending
in 2014
• Increased deep water spending
• Increased infrastructure spending
• Growth expected in Brazil, North
Sea and Gulf of Mexico
• Increased focus on newer, larger
and more technologically
advanced vessels and
engineering capabilities
• DOF Subsea owns the world’s
most sophisticated fleet and has a
global project organization

Mixed fundamentals for subsea activity
DOF Subsea 34
Supply
• Fleet of high-end subsea vessels to
increase by 12 % in 2014
• Limited growth in supply of
engineering capabilities
• Qualified personnel will be the
bottleneck for asset utilization
Mixed market
conditions
Increasing demand
Increasing
supply

Thank you

Disclaimer
DOF Subsea 36
This presentation by DOF Subsea AS (“DOF Subsea” or the “Company”) is designed to provide a high level overview of aspects of the
operations of DOF Subsea and the DOF Subsea group.
The material set out in the presentation is current as at 31st December 2013.
This presentation contains forward looking statements relating to operations of DOF Subsea and the DOF Subsea Group that are
based on management’s own current expectations, estimates and projections about matters relevant to DOF Subsea‘s future financial
performance. Words such as “likely”, “aims”, “looking forward”, “potential”, “anticipates”, “expects”, “predicts”, “plans”, “targets”,
“believes” and “estimates” and similar expressions are intended to identify forward looking statements.
References in the presentation to assumptions, estimates and outcomes and forward looking statements about assumptions, estimates
and outcomes, which are based on internal business data and external sources, are uncertain given the nature of the industry,
business risks, and other factors. Also, they may be affected by internal and external factors that may have a material effect on future
business performance and results.
No assurance or guarantee is, or should be taken to be, given in relation to the future business performance or results of DOF Subsea
or the DOF Subsea Group or the likelihood that the assumptions, estimates or outcomes will be achieved.
While management has taken every effort to ensure the accuracy of the material in the presentation, the presentation is provided for
information only. DOF Subsea, its officers and management exclude and disclaim any liability in respect of anything done in reliance on
the presentation.
All forward looking statements made in this presentation are based on information presently available to management and DOF
Subsea assumes no obligation to update any forward looking statements. Nothing in this presentation constitutes investment advice
and this presentation shall not constitute an offer to sell or the solicitation of any offer to buy any securities or otherwise engage in any
investment activity.


