Does scored VET in Schools help or hinder access to … scored VET in Schools help or hinder access...
54
Does scored VET in Schools help or hinder access to higher education in Victoria? Cain Polidano Domenico Tabasso Rong Zhang MELBOURNE INSTITUTE OF APPLIED ECONOMIC AND SOCIAL RESEARCH NATIONAL VOCATIONAL EDUCATION AND TRAINING RESEARCH PROGRAM RESEARCH REPORT
Transcript of Does scored VET in Schools help or hinder access to … scored VET in Schools help or hinder access...
Does scored VET in Schools help or hinder access to higher education in Victoria?
Cain Polidano Domenico Tabasso Rong Zhang
MELBOURNE INSTITUTE OF APPLIED ECONOMIC AND SOCIAL RESEARCH
NATIONAL VOCATIONAL EDUCATION AND TRAINING RESEARCH PROGRAM
RESEARCH REPORT

Does scored VET in Schools help or hinder access to higher education in Victoria?
Cain Polidano Domenico Tabasso Rong Zhang
Melbourne Institute of Applied Economic and Social Research
The views and opinions expressed in this document are those of the author/
project team and do not necessarily reflect the views of the Australian Government,
state and territory governments or NCVER.
Any interpretation of data is the responsibility of the author/project team.
NATIONAL VOCATIONAL EDUCATION AND
TRAINING RESEARCH PROGRAM
RESEARCH REPORT
© Commonwealth of Australia, 2014
With the exception of the Commonwealth Coat of Arms, the Department’s logo, any material protected
by a trade mark and where otherwise noted all material presented in this document is provided under a
Creative Commons Attribution 3.0 Australia <http://creativecommons.org/licenses/by/3.0/au> licence.
The details of the relevant licence conditions are available on the Creative Commons website
(accessible using the links provided) as is the full legal code for the CC BY 3.0 AU licence
<http://creativecommons.org/licenses/by/3.0/legalcode>.
The Creative Commons licence conditions do not apply to all logos, graphic design, artwork and
photographs. Requests and enquiries concerning other reproduction and rights should be directed to the
National Centre for Vocational Education Research (NCVER).
This document should be attributed as Polidano, C, Tabasso, D & Zhang, R 2014, Does VET in Schools help
or hinder access to higher education in Victoria?, NCVER, Adelaide.
COVER IMAGE: GETTY IMAGES/THINKSTOCK
ISBN 978 1 925173 09 3
TD/TNC 118.13
Published by NCVER, ABN 87 007 967 311
Level 11, 33 King William Street, Adelaide SA 5000
PO Box 8288 Station Arcade, Adelaide SA 5000, Australia
Phone +61 8 8230 8400 Fax +61 8 8212 3436
Email [email protected] Web <http://www.ncver.edu.au> <http://www.lsay.edu.au>
Follow us: <http://twitter.com/ncver> <http://www.linkedin.com/company/ncver>
Publisher’s note
To find other material of interest, search VOCED (the UNESCO/NCVER international database
<http://www.voced.edu.au>) using the following keywords: access to education and training; higher education;
outcomes of education and training; participation; secondary education; students; university; VET in Schools; vocational
education and training.
About the research Does scored VET in Schools help or hinder access to higher education in Victoria?
Cain Polidano, Domenico Tabasso and Rong Zhang, Melbourne Institute of Applied Economic and Social Research
The systematic introduction of vocational subjects to the secondary school curriculum in the 1990s —
VET in Schools — was aimed at helping to retain less academically inclined students at school and to
provide students with a broad range of post-secondary options and pathways. The early 2000s saw a
broadening of the VET in Schools programs with the scoring of vocational subjects. This meant that
particular vocational subjects could count towards both nationally recognised training and a university
entrance score. The anticipated benefit of scored VET subjects was an improved status for vocational
education and training (VET) in the secondary school curriculum and a further benefit was that it
offered viable options to those students who were not entirely certain of which pathway to take —
university or vocational training.
This study, which focuses on the experiences of Victorian secondary school students who completed
‘scored’ VET subjects — counting towards the Victorian Certificate of Education (VCE) — looks at whether
taking these subjects affects their entry to university in terms of university entry score, receiving a
university offer or receiving an offer in a preferred course. Victoria is the focus for two reasons: since the
early 1990s, VET subjects have been highly integrated into the Victorian secondary school curriculum;
and, secondly, Victoria was the first state to allow scores from some VET subjects to count fully towards
a national vocational qualification, the Victorian Certificate of Education and a university entry score. In
this study, those who take scored VET subjects represent fewer than 10% of all Year 12 completers in
2011.
Key messages For Victorian students who intend to go to university and who complete a scored VET subject this
research indicates that there is a sizeable penalty. The average university entry scores for these
students are estimated to be six points lower than they would have been had a general subject been
chosen, representing around a 5% reduction in university entry scores, on average.
This reduction in university entry scores negatively impacts upon the chances of receiving a
university offer, from 79% to 67%, on average.
The largest negative impacts on average university entry scores are found with engineering and
technology; community, outdoor and recreation; and hospitality subjects.
The authors suggest that the down-scaling of scored VET subjects may partly explain this impact
and they offer an alternative scaling methodology for consideration.
This is an important study as it is the first to attempt to examine any impacts on university access of
taking a scored VET subject (in Victoria). In doing so however it highlights an apparent adverse
outcome of a pathway originally intended to offer students the best opportunities to pursue the post-
school studies most suited to their ability and motivation.
Dr Craig Fowler
Managing Director, NCVER

Acknowledgments
The authors would like to thank staff from the Department of Education and Early Childhood
Development; the Victorian Curriculum and Assessment Authority, and the Victorian Tertiary
Admissions Centre for making the data available for this project and for providing very helpful
feedback on an earlier draft of this report.
NCVER 5
Contents
Tables 6
Executive summary 8
Introduction 12
Integrating VET into the academic curriculum 15
VET in Schools in Victoria 15
Scoring VCE VET subjects 17
Data 20
Outcomes of interest 21
Descriptive statistics 22
Methodology 26
Propensity score matching methods used 26
Specification of the propensity score function 27
Results 29
Overall impacts on university entry scores 29
Results by VCE VET subject group 31
Impacts on university access 32
Conclusions 35
References 37
Appendices
A: Assessment 38
B: VCE VET subjects 39
C: Technical appendix 43
D: Probit results and balancing test results 45
E: Sensitivity analysis 48
NVETR Program Funding 50
6 Does scored VET in Schools help or hinder access to higher education in Victoria?
Tables
1 VCE VET subjects in 2011 16
2 Average VCE scaled scores for VET and selected general subjects
(out of 50) for students who completed school in 2011 19
3 Number of students in the sample 21
4 Field of education (1-digit ASCED) of first preference among students
who intend to go to university prior to sitting their final exams (row %) 24
5 Mean values of selected student characteristics 25
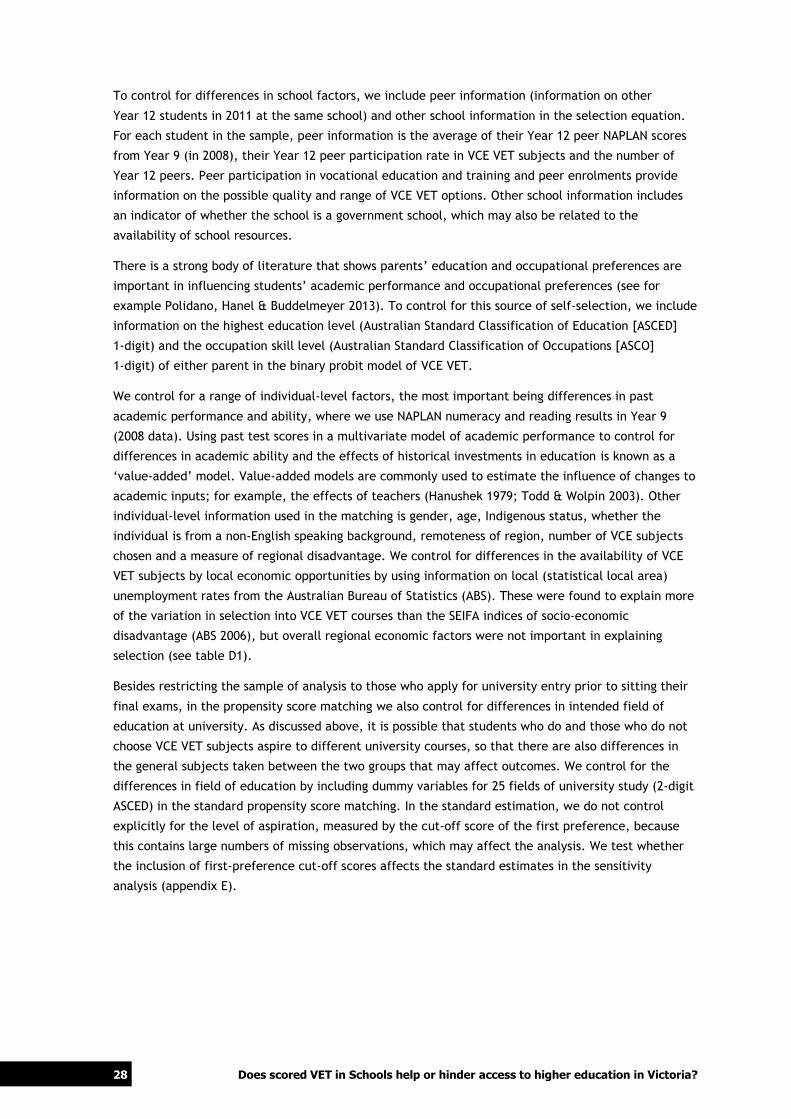
6 Estimated impacts from taking a VCE VET subject on university
entry scores (out of a maximum of 205) among those who intend
to go to university 29
7 Estimated total, direct and indirect impacts of taking a VCE VET
subject on university entry scores (out of a maximum of 205)
among those who intend to go to university 30
8 Estimated impacts from taking individual VCE VET subjects on
university entry scores (out of a maximum of 205) of those who
intend to go to university, Kernell matching 32
9 Estimated impacts from taking a VCE VET subject on the chances
of attaining entry to a university course 33
A1 Prescribed performance criteria for work performance task 38
B1 General subjects taken by students who enrol in business and
financial services 39
B2 General subjects taken by students who enrol in engineering studies 39
B3 General subjects taken by students who enrol in electrotechnology
studies 40
B4 General subjects taken by students who enrol in information
technology studies 40
B5 General subjects taken by students who enrol in music studies 41
B6 General subjects taken by students who enrol in community
services work 41
B7 General subjects taken by students who enrol in hospitality studies 41
B8 Subjects taken by students who enrol in interactive digital media 42
B9 Subjects taken by students who enrol in sport and recreation 42
D1 Results from the probit model of participation in a VCE VET subject
used in the propensity score matching 45
D2 The ten most common general subjects taken by students who
do and do not take a VCE VET subject 47
NCVER 7
D3 Estimated impacts from taking a VCE VET subject on university
entry scores (out of a maximum of 205) of those who intend to
go to university, alternative PSM methods 47
D4 Estimated total, direct and indirect impacts from taking a VCE VET
subject university entry scores (out of a maximum of 205) of those
who intend to go to university 47
E1 Estimated impacts from taking a VCE VET subject on university
entry scores (out of a maximum of 205) under various assumptions 48
8 Does scored VET in Schools help or hinder access to higher education in Victoria?
Executive summary
Despite comprising only a small fraction of all VET in Schools enrolments, programs that count
towards both national vocational education and training (VET) qualifications and university entry
potentially fill an important role in the upper-secondary school curriculum.
The aim of this study is to take a first step in gaining an understanding of the efficacy of VET in
Schools courses by estimating the relationship between enrolling in Victorian Certificate of Education
(VCE) VET subjects and university access. We choose to examine the outcomes from VCE VET courses
because they represent a model of assessment, known as ‘scored VET’, that closely resembles that
applied in general courses. In particular, the assessment involves both written exams and numerical
assessment of performance in job-specific tasks associated with units of competency. In this study,
the analysis is carried out on a sample of school completers in Victoria in 2011 who lodged a first
preference for enrolment in a university course prior to sitting their final year exams.
To meet the aim of this study, we address the following key research questions:
What is the relationship between taking a Victorian Certificate of Education VET subject and
university entry scores?
To what extent is any relationship explained by scores in VCE VET subjects (direct effect) as
opposed to scores in all other subjects taken by VCE VET students (indirect effect)?
Does any relationship depend upon the type of VCE VET subject chosen?
What is the relationship between participating in VCE VET subjects and the chances of being
offered a place at university?
What is the relationship between participating in VCE VET subjects and the chances of attaining a
first, third or sixth university entry preference?
As far as we are aware, this is the first study to estimate the relationship between taking a VCE VET
subject and university access. In estimating the relationship, we compare the outcomes of students
who do and who do not take VCE VET subjects, using a rich dataset and econometric techniques to
control for differences in a large number of characteristics. Most importantly, we control for
differences that may have an important bearing on university entry scores, such as prior academic
performance, using Year 9 NAPLAN scores; academic aspirations, using field of education and course
cut-off scores for each student’s first preference submitted for university entry; student and peer
socioeconomic background; and regional and school-level factors.1 Although we control for a large
range of differences between the two groups, to the extent that there are differences that are not
controlled for or are imperfectly controlled for the relationship between taking a VCE VET subject and
university access may not reflect a causal impact.
The econometric technique used in this study is propensity score matching, a quasi-experimental
method that simulates random assignment into VCE VET by selecting, for each student who chooses a
VCE VET subject, a control group with the same observable characteristics but who did not enrol in a
1 The course cut-off score to control for the level of academic aspiration is from 2010, which was the latest available at
the time students lodged their university course preferences. This control is not included in the standard results
because there are a number of missing student preferences. This control is added as part of the sensitivity analysis
(see appendix E).

NCVER 9
VCE VET subject. The outcomes from the matched control group represent counterfactual outcomes,
against which the VCE VET outcomes are compared to isolate the relationship between taking a VCE
VET subject and university access. A key feature of this study is the use of a unique Victorian dataset
that links, at the individual level, administrative population data on university preferences used in the
university admission process; university entry scores; characteristics of students, schools, parents and
place of residence; and university offer information (the last from a large survey of graduates).
Another key feature of this study is the development of a decomposition approach to help explain any
estimated relationship. The decomposition approach splits any relationship into direct and indirect
effects. For those who take a VCE VET subject, the direct effect is defined as the difference in the
score in a VCE VET subject relative to the score if a general subject had been chosen instead. The
indirect effect, or spillover, is defined as the average score in all general subjects when a VCE VET
subject is chosen, relative to the average score in these subjects had an alternative general subject
been chosen. The results are also estimated for scored VCE VET subjects across seven subject
groupings: business and finance; community, outdoor and recreation; dance and music; engineering
and technology; information technology; hospitality; and equine industry. The impacts are estimated
across subject groups because there are insufficient observations to allow robust estimation by
individual subjects.
Results
We find among students who intend to go to university, controlling for a range of differences between
those who do and who do not take a VCE VET subject, that those who take a VCE VET subject have a
six-point lower score on average than those who do not take a VCE VET subject (111 compared with 117
out of a possible 205). This represents around a 5% lower university entry score on average and is robust
to the range of alternative key assumptions that underpin the analysis. Across VCE VET subject
groupings, we find some variation in magnitude of the estimated negative association, with significant
negative associations found in four of the seven subject groupings (engineering and technology;
community, outdoor and recreation; hospitality; information technology) and no statistically significant
negative results found for the rest (business and finance; dance and music; equine industry).
Consistent with a lower entry score, we also find that those who take VCE VET subjects have a lower
chance of receiving a university offer. In particular, on average, taking a VCE VET subject is
associated with a 12-percentage-point lower chance of receiving a university offer. In other words,
67% of students who take VCE VET subjects who apply to go to university receive an offer, but it is
estimated that the chance of receiving an offer would be 79% (12 percentage points higher) if these
students had taken a general course instead. The large difference in the chances of attaining a
university offer, despite only relatively small differences in entry scores, is because VCE VET students
are on average around the middle of the entry score distribution. Therefore, their chances of
receiving an offer are sensitive to small changes in entry scores, including changes associated with
course choice. Similarly, taking a VCE VET subject is associated with a seven-percentage-point lower
chance of attaining a top six preference, from a total of 12 preferences.
We estimate that most of the six-point lower entry score associated with taking a VCE VET subject
(around four points or 70%) can be attributed to a negative direct effect, while the remainder is due
to a negative indirect effect. The dominance of the direct effect over the indirect effect reflects the
relatively low scores attained in VCE VET subjects among students who intend to go to university. On
average among VCE VET students who intend to go to university, their scores in VCE VET subjects are
lower than those attained in their other subjects. In this study, we cannot be precise about the
10 Does scored VET in Schools help or hinder access to higher education in Victoria?
underlying causes of the negative direct and indirect effects, but they may include the disruption
associated with accessing training off campus, poor suitability of VET training for students who intend
to go to university and down-scaling of VCE VET scores.
Although we cannot precisely pinpoint the source of the direct effect, an exploratory analysis suggests
that the down-scaling of VCE VET subjects may be a key source. Scaling ensures that scores across
different subjects can be compared on an equal footing so that students do not gain an unfair
advantage by choosing any particular combination of courses. Existing scaling arrangements in Victoria
correct for differences in the strength of competition or difficulty in attaining the mean score in a
given subject. Competition in a given subject is measured as the mean score in all other subjects
taken by students in that course. In subjects where competition is less than average (mean score in
other subjects is less than 30), the scores are scaled down; the opposite holds when competition is
above average. In VCE VET subjects, scores are scaled down, but we find evidence to suggest that the
extent of the down-scaling may be greater, on average, than in many general courses because a large
proportion of the students in these courses do not intend to go to university but appear to focus their
effort on these courses, to the detriment of performance in other courses. Therefore, the measure of
competition used in the scaling may underestimate the true difficulty of attaining the mean in VCE
VET courses. Unlike general courses, VCE VET students who do not intend to go to university have an
incentive to focus their effort to attain credit for, or attainment of, a national qualification.
In this study, we cannot rule out the possibility that the lower average entry score for VCE VET
students is due to the differences in factors that are not controlled for and which affect entry scores.
That said, the dominance of the direct effect suggests that this is unlikely. If there are uncontrolled
differences in factors that lead to lower entry scores for VCE VET students, then to explain the entire
gap they must have a disproportionately negative effect on scores in VCE VET subjects compared with
scores in other subjects. Such factors may be differences in preferences, such as a preference for
hands-on learning, but they are likely to disproportionately increase performance in VCE VET
subjects. If we assume that uncontrolled-for factors have the same effect on all subjects, then at the
most they are no larger than the per-subject indirect effect, which means they would explain no more
than a third of the estimated gap in university entry scores.2
Implications
The stated aim for the introduction of VCE VET subjects to the academic curriculum was to enhance
the status of VET programs by recognising performance in these subjects in the same way as
performance in other VCE subjects (Victorian Curriculum and Assessment Authority 2010). As well as
enhancing the status of vocational education and training, these subjects potentially also serve dual
purposes: to provide vocational options for those who do not intend to go to university and to allow
students in the middle of the academic distribution to pursue vocational options without closing off
their pathways to university. In theory, these two purposes are compatible, but in practice the results
presented in this paper suggest that there may be trade-offs.
To better meet the dual purposes of VCE VET subjects, we suggest two courses of action. First, more
research is needed into the extent to which different student motivations in scored VET subjects leads
2 If we assume that all of the indirect effect is due to differences in uncontrolled-for factors and that these factors
have the same negative effect on all subject scores, then we can say that 0.408 (1.632/4) percentage points of the
3.985-percentage-point gap due the direct effect is also explained by uncontrolled-for factors. Therefore, at the
most, uncontrolled-for factors would explain 2.04 out of 5.618-percentage-point gap.
NCVER 11
to greater down-scaling than would otherwise be the case. If further investigation were to confirm our
over-scaling explanation, then one possible response would be to adjust the scaling of VET subjects to
account for differences in motivation. One way to do this would be to restrict the scaling to only
those students who intend to go to university, measured by whether or not they lodge an application
for admission to a university course prior to sitting their final exam. Scaling subjects in this way
should have relatively minor impacts on scores in general subjects where a high proportion of students
intend to go to university. However, there are some general VCE subjects outside the VET system,
such as industry and enterprise studies, that also attract relatively high proportions of students who
do not intend to go to university but who may also focus their effort in a particular course because
the course is especially useful for employment preparation. Given that the main purpose of scaling is
to allow students to be equitably ranked for university entry, then the scaling should be based on the
scores of students who are competing for university entry.
Second, while the negative indirect effect is small and may be potentially explained by uncontrolled-
for factors, there are a number of possible low-cost precautionary measures that could be taken by
government and schools. For government, collecting data on the time spent in off-campus training
may help in assessing and monitoring any academic impacts. If necessary, these data would also allow
better coordination of training across local school clusters where close-by options in TAFE (technical
and further education) institutes may be inadequate. For schools, an appropriate response may be to
encourage their students to complete VCE VET subjects in Year 11 rather than in Year 12.
Importantly, we stress that this study only examines the impacts of taking VCE VET subjects on direct
access to university. Other important outcomes from VCE VET programs, such as indirect access to
university (for example, by completing a diploma course), participation in post-school VET study,
retention in post-school study, and employment outcomes are not investigated here, but should be
considered in any overall evaluation of these programs. Previous studies by Anlezark, Karmel and Ong
(2006), Lamb and Vickers (2006) and Polidano and Tabasso (2013) have demonstrated positive benefits
to school retention and initial labour market outcomes from unscored VET in Schools courses.
12 Does scored VET in Schools help or hinder access to higher education in Victoria?
Introduction
As occurred in other English-speaking countries such as Canada and the United States, vocational
education was first introduced into the general upper-secondary school curriculum in Australia to
keep less academically oriented youth at school and to improve their post-school pathways into
further study or work (Ministerial Council on Education, Employment, Training and Youth Affairs
1999). However, because they are designed for less academically capable students and because of the
strong emphasis on preparation for university in these countries, school vocational programs are often
stigmatised (OECD 2000).
In Australia, under the New Framework for Vocational Education in Schools (Ministerial Council on
Education, Employment, Training and Youth Affairs 2001) governments attempted to remove the
stigma and broaden the participation in VET in Schools subjects by encouraging performance in upper-
secondary VET subjects to count towards university entry.3 To date, all states and territories in
Australia, except Western Australia, have upper-secondary VET programs that can count towards both
a national qualification and a university entry score (Australasian Curriculum, Assessment and
Certificatation Authorities 2012). The way by which performance in upper-secondary VET contributes
towards university entry scores varies by state. For example, subject to certain conditions, VET in
Schools students in New South Wales can opt to take a written exam, their performance in which
counts towards their university entry score, while in South Australia, graded performance in VET
subjects is converted to numerical scores for use in the calculation of entry scores. In Victoria, some
VET subjects, known as VCE VET subjects, are scored in much the same way as academic subjects.4
For these subjects, an assessment framework has been developed to measure, on a numerical scale,
competency-based performance. Recognising VET subject performance in measures of university entry
not only helps to improve the status of VET, but for students who are in the middle of the academic
distribution and who intend to go to university, they provide an alternative pathway for consideration
without potentially compromising their chances of attaining access to university.
In this study, we make a first attempt to better understand the efficacy of VET programs that count
towards university entry by examining the relationship between taking a VCE VET course and attaining
university entry. A priori, the sign of any effect from taking VCE VET subjects is unclear. On the
positive side, the ‘real world’ context used to teach concepts, known as experiential learning
(Kolb 1984), may improve learning. In particular, it is argued that experiential learning gives students
the context in which theory is applied, which in turn helps them to understand the importance of
theory and engages them in the learning process (Kolb 1984). All else being equal, the more
complementary the VET subject is to other general subjects, the greater the effect on student
learning. Experiential learning has also been argued to better suit the learning styles of less academic
students (Smith 2002). However, while there is strong evidence suggesting that students have
different preferences for teaching practices, there is very little empirical evidence that matching
student preferences and teaching methods is important in learning (Pashler, McDaniel & Bjork 2008).
3 To achieve this end, the New Framework underlines the importance of course competency counting towards both the
attainment of a VET qualification and university entry scores. In practice, the group of vocational courses that count
towards a qualification and a university entry score vary across states. 4 It is also possible in Victoria to undertake a VET subject in Year 12 that counts towards a national VET qualification,
but does not attract a study score. In these cases, students who receive a university study score get a 10% bonus on
their ‘primary four’ subjects (English score plus their top three courses). However, to simplify things, we restrict the
analysis to examining the effects of undertaking VCE VET subjects.
NCVER 13
But taking a VCE VET subject may hinder access to university for three reasons. First, on average, the
scores used in the calculation of university entry scores for VCE VET subjects may be scaled down to a
degree because the measure of student competition that scaling corrects underestimates the intensity
of competition in these subjects. Second, because they are often, in part or in full, taken off-campus,
VCE VET subjects may have a disruptive effect on performance in other subjects. Finally, students
who intend to go to university who choose VCE VET subjects may be attracted by the opportunity to
attain a qualification, but they may not be well suited to the hands-on nature of VET training.
To estimate the relationship between taking VCE VET subjects and university access, we use a number
of measures of university access, including university entrance scores, the chances of receiving a
university offer and the chances of receiving an offer in a preferred course (top three and top six).
Because some students may take VCE VET subjects for reasons besides university entry, we restrict
the analysis to those who lodge a first preference (with the Victorian Tertiary Admissions Centre
[VTAC]) in a higher education course prior to sitting their final VCE exams. This sample represents 64%
of all Year 12 VCE VET students in 2011. We test the sensitivity of the results to this restriction.
The specific questions addressed in this study are:
What is the relationship between taking a VCE VET subject and university entry scores?
To what extent is any relationship explained by scores in VCE VET subjects (direct effect) as
opposed to scores in all other subjects taken by VCE VET students (indirect effect)?
Does any relationship depend upon the type of VCE VET subject chosen?
What is the relationship between participating in VCE VET subjects and the chances of being
offered a place at university?
What is the relationship between participating in VCE VET subjects and the chances of attaining a
first, third or sixth university entry preference?
We decompose the relationship between taking a VCE VET subject and university entry scores into
direct and indirect effects. A direct effect is defined as the score in a chosen VCE VET subject,
relative to the score if a general subject had been chosen instead. An indirect effect is defined as the
average scores in all general subjects when a VCE VET subject is chosen, relative to the scores had an
alternative general subject had been chosen. Indirect effects measure spillover effects. We only
decompose the relationship between taking a VCE VET course and university entry scores because it is
the main driver of university entry and should broadly reflect the decomposition of any relationship
explaining the chances of receiving university offer.
A key feature of the approach in this study is the use of propensity score matching to deal with non-
random selection into VCE VET subjects. Non-random selection is present when there are differences
in the characteristics that affect university entry scores, such as academic ability, between those who
do and those who do not participate in VET. The failure to fully control for non-random selection
means that estimates may not represent the causal impacts of taking a VCE VET subject. Another
feature of this study is the unique and rich dataset that is being assembled. The outcomes of interest
are subject scores from the Victorian Curriculum and Assessment Authority (VCAA) and university offer
information from the Victorian On Track5 survey of 2011 school completers. This information is linked
5 On Track surveys school leavers who have left school in the previous six months to ascertain whether they are on a
path to further education, training or employment. It also enables young people to seek further advice and assistance
via a referral service if required.

14 Does scored VET in Schools help or hinder access to higher education in Victoria?
at the student level with Year 9 NAPLAN scores (from 2008) and the university course preference data
submitted by students to the Victorian Tertiary Admissions Centre (VTAC) prior to sitting their final
exams. Linking data from these sources enables us to control for differences in academic ability and
past education investments, study aspirations, post-school subject preferences, socio-demographic
variables and school and peer-level factors.

NCVER 15
Integrating VET into the academic curriculum
The integration of vocational education and training into the school curriculum began in Australia in
the mid-1990s and coincided with a move to a competency-based VET qualification system nationally.
Under a competency-based system, qualifications are awarded for the demonstration of competency
in carrying out the job-specific tasks defined in nationally agreed training packages. The
incompatibility between competency-based and grade-based assessment was a key challenge in
integrating VET subjects in the upper-secondary curriculum (Barnett & Ryan 2005).
The degree to which VET subjects have been integrated into the upper-secondary school curriculum
varied across states. For example, in New South Wales and Queensland, many of the endorsed VET in
Schools subjects sat outside the academic curriculum and did not count towards a school completion
certificate. At the other extreme, Victoria, keen to promote VET in Schools programs, integrated
parts of the nationally accredited subjects into existing academic subjects, which meant that the
subjects contributed to both a secondary school certificate and a nationally accredited VET
qualification (known as the dual model). While academic scores from VET subjects initially did not
count towards university entry, to entice more academically inclined students to take them, a 10%
increment was offered on a student’s primary four academic scores.
Since the publication of the New Framework for Vocational Education in Schools (Ministerial Council
on Education, Employment, Training and Youth Affairs 2001), most VET subjects now count towards
both a national VET qualification and a secondary school certificate in all states. And in response to
the New Framework recommendation to extend participation in vocational education and training by
ensuring that it provides a pathway to university entry, to the best of our knowledge, all states except
Western Australia have upper-secondary VET subjects that count to both a national qualification and
university entry scores (Australasian Curriculum, Assessment and Certification Authorities 2012).
We concentrate on estimating the impacts of undertaking VCE VET subjects in Victoria for two
reasons. First, as noted above, since the inception of VET in Schools in 1994, Victoria has adopted a
model whereby VET subjects are highly integrated into the secondary school curriculum. Second,
Victoria was also the first state, in 1997, to allow scores for some VET subjects to count fully towards
a national qualification, a state secondary school certificate (the Victorian Certificate of Education)
and university entry.6 The analysis in this paper is based on outcomes for students in their final year
of study in 2011.
VET in Schools in Victoria
In Victoria in 2011 there were 27 subjects that counted towards both a nationally accredited VET
qualification and the Victorian Certificate of Education. Of these subjects, 17 (see table 1), which are
at the VCE unit 3 and 4 level, can be scored and included in the calculation of the university entry
score. It is important to note that scored VCE VET subjects are not designed as stand-alone subjects;
6 Following the Victorian Certificate of Education review.
16 Does scored VET in Schools help or hinder access to higher education in Victoria?
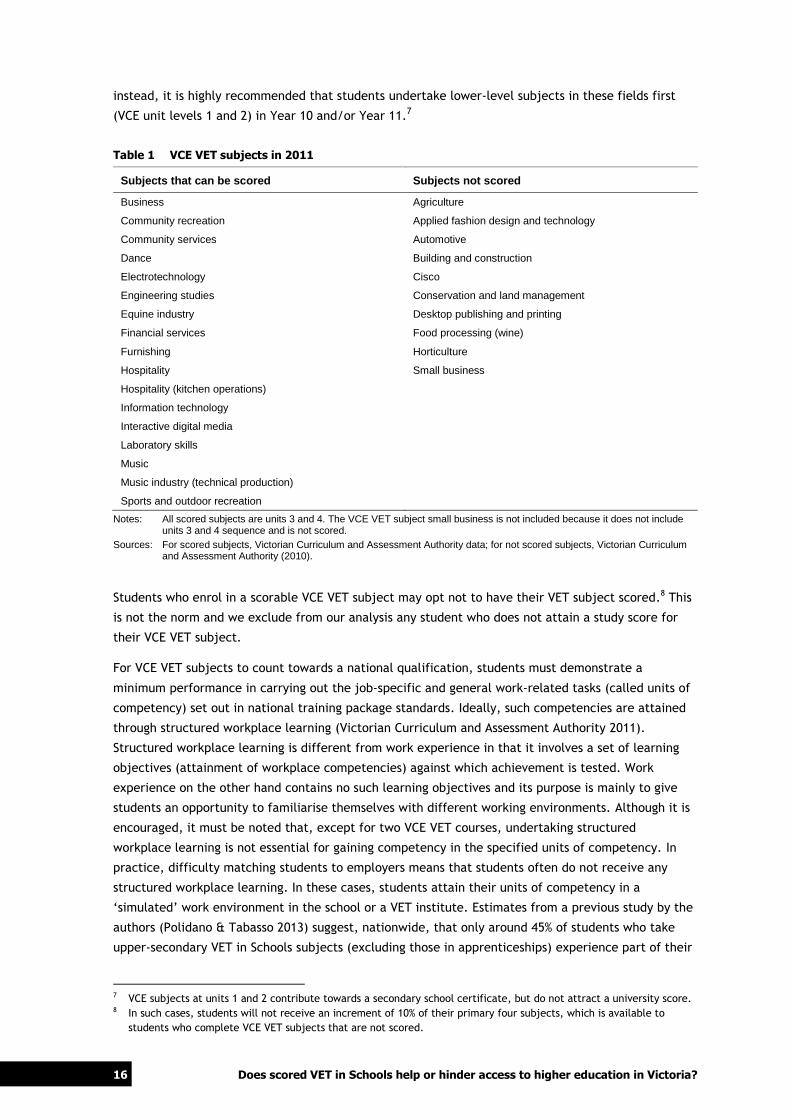
instead, it is highly recommended that students undertake lower-level subjects in these fields first
(VCE unit levels 1 and 2) in Year 10 and/or Year 11.7
Table 1 VCE VET subjects in 2011
Subjects that can be scored Subjects not scored
Business Agriculture
Community recreation Applied fashion design and technology
Community services Automotive
Dance Building and construction
Electrotechnology Cisco
Engineering studies Conservation and land management
Equine industry Desktop publishing and printing
Financial services Food processing (wine)
Furnishing Horticulture
Hospitality Small business
Hospitality (kitchen operations)
Information technology
Interactive digital media
Laboratory skills
Music
Music industry (technical production)
Sports and outdoor recreation
Notes: All scored subjects are units 3 and 4. The VCE VET subject small business is not included because it does not include units 3 and 4 sequence and is not scored.
Sources: For scored subjects, Victorian Curriculum and Assessment Authority data; for not scored subjects, Victorian Curriculum and Assessment Authority (2010).
Students who enrol in a scorable VCE VET subject may opt not to have their VET subject scored.8 This
is not the norm and we exclude from our analysis any student who does not attain a study score for
their VCE VET subject.
For VCE VET subjects to count towards a national qualification, students must demonstrate a
minimum performance in carrying out the job-specific and general work-related tasks (called units of
competency) set out in national training package standards. Ideally, such competencies are attained
through structured workplace learning (Victorian Curriculum and Assessment Authority 2011).
Structured workplace learning is different from work experience in that it involves a set of learning
objectives (attainment of workplace competencies) against which achievement is tested. Work
experience on the other hand contains no such learning objectives and its purpose is mainly to give
students an opportunity to familiarise themselves with different working environments. Although it is
encouraged, it must be noted that, except for two VCE VET courses, undertaking structured
workplace learning is not essential for gaining competency in the specified units of competency. In
practice, difficulty matching students to employers means that students often do not receive any
structured workplace learning. In these cases, students attain their units of competency in a
‘simulated’ work environment in the school or a VET institute. Estimates from a previous study by the
authors (Polidano & Tabasso 2013) suggest, nationwide, that only around 45% of students who take
upper-secondary VET in Schools subjects (excluding those in apprenticeships) experience part of their
7 VCE subjects at units 1 and 2 contribute towards a secondary school certificate, but do not attract a university score. 8 In such cases, students will not receive an increment of 10% of their primary four subjects, which is available to
students who complete VCE VET subjects that are not scored.
NCVER 17
training in the workforce. Structured workplace learning can take place over weekends, during school
holidays and/or during the school week.
Scoring VCE VET subjects
A key challenge when integrating competency-based VET subjects into an academic curriculum is
designing an assessment system that allows subject performance to be compared with performance in
academic subjects without compromising the vocational, task-based nature of the training.9 Because
competency-based training is task-based, assessment is geared towards ascertaining whether or not
vocational tasks can be performed to a minimum required standard.
In Victoria, to extend the minimum competency framework to an academic one, where assessment is
measured on a continuous scale, internal assessment (which comprises 66% of all assessment in scored
VCE VET subjects) is based on graded performance in three tasks.10
The available task types (work
performance, product, work project and portfolio) are designed by the Victorian Curriculum and
Assessment Authority; however, registered training organisations (RTOs) and schools have the
flexibility to design tasks to suit their specific needs. The task type selection must include all the (3
and 4) units of competency for the course and there must be only two of any one task type included.
Task assessment is carried out by a trained assessor who is approved by the relevant registered
training organisation. The assessor rates performance in each of the three tasks using five specific
criteria. For each criterion, performance is measured on a scale of 1 to 5, where 1 is base
performance and 5 is high performance. The five criteria vary with the task, but are generally all
related to demonstrating the application of knowledge to carry out a task, including the application of
technical job-specific knowledge as well as general knowledge, such as communication, personal
management and problem-solving techniques. To help the assessor rate the student on each of the
criteria, a description of the expected performance at three of the five levels is provided — 1 (base),
3 (medium) and 5 (high). (See appendix A for the expected performance for the five criteria related
to work performance tasks.) The contribution of each of the tasks to the overall subject score is
weighted by the nominal hours for each task as a proportion of the total nominal hours required for
(units 3 and 4) enrolment.
With the exception of dance and music, an external assessment for VCE VET subjects involves written
examinations carried out during the end-of-year examination period. The focus of the exam is on
testing students’ underpinning knowledge and understanding of the skills identified in the competency
standards relevant to the associated VET qualification. For more information on the assessment of
VET subjects, see Victorian Curriculum and Assessment Authority (2010).
Contribution to university entry scores
To generate a university entry score, raw subject scores are standardised to make performance
comparable across subjects. For each subject, the standardisation process sets the mean subject
score at 30 (out of a possible 50). However, it is important to note that the standardised scores
represent student rankings or relative positions within a subject. Those with a standardised score
above 30 are ranked above average in that subject and those with a standardised score below 30 are
9 Except for dance, where assessment is 50% examination and 50% coursework. The higher weighting given to internal
assessment is in contrast to assessment in general courses, where external assessment is given greater weight. 10 Only students who attain at least minimum competency in all units attain a study score. Students who attain a
minimum competency can also opt not to receive a study score.
18 Does scored VET in Schools help or hinder access to higher education in Victoria?
ranked below average. However, as relative ranks, these scores cannot be simply combined to
produce an overall rank because such a method would disadvantage students who chose subjects
where the strength of student competition is high. Therefore, to combine subject scores to produce
an overall rank, the Victorian Tertiary Admissions Centre scales standardised subject scores to correct
for differences in the strength of student competition, or how difficult it is in a subject to attain the
middle rank of 30. For a given subject, the strength of competition is measured by the mean score in
the student’s other subjects. The scaling works so that the mean score for a given subject is equal to
the mean (standardised and unscaled) score in the student’s other subjects (Victorian Tertiary
Admissions Centre 2011). Therefore, in subjects where the student’s mean score in other subjects is
greater than 30, the subject is scaled up, and in subjects where the opposite is the case, the scores
are scaled down.
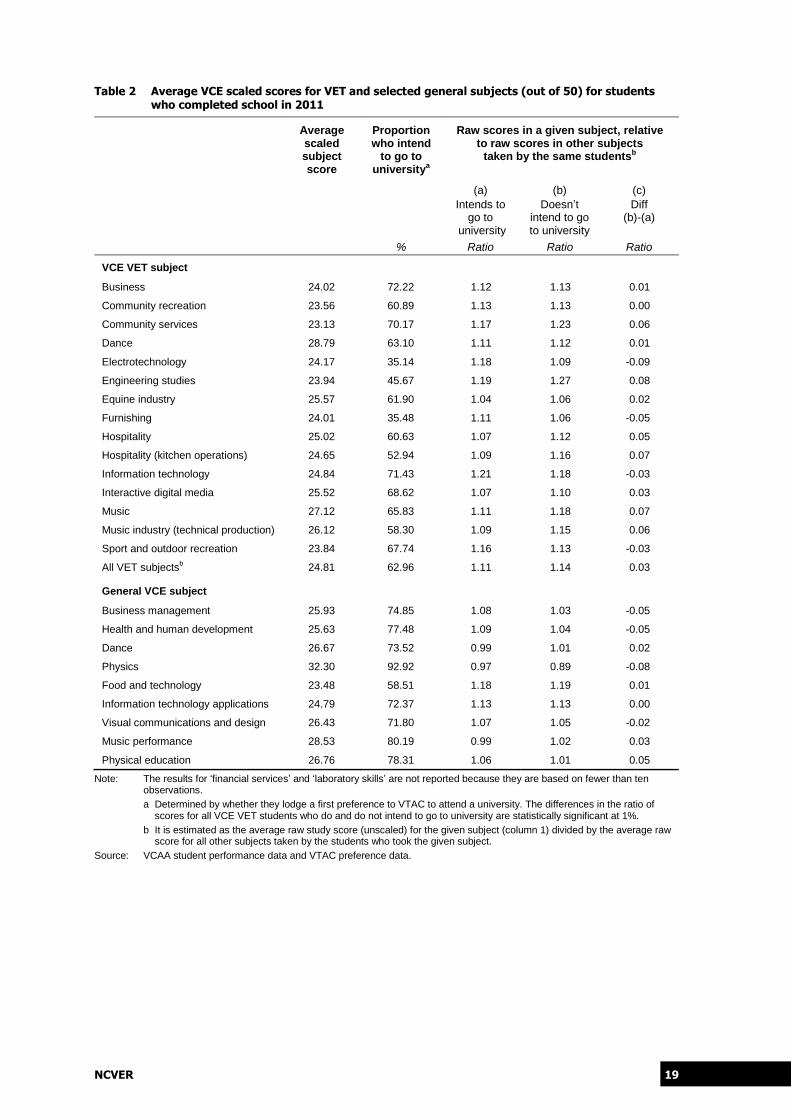
The average scaled VCE scores for VET subjects and the general subjects (non-VET) with which they
are most frequently combined are presented in table 2. From table 2, it is clear that raw VCE VET
subject scores are scaled down, and are scaled down by more than in the general subjects with which
VCE VET subjects are commonly combined (with the exception of food technology). However, VCE VET
scores are likely to be scaled down by more than general subjects because a relatively high proportion
of VCE VET students do not intend to go to university and focus their effort in VET to attain credit
towards a qualification to the detriment of their performance in other subjects. Therefore, using
measures of the performance of VCE VET students in other subjects may under-represent the true
difficulty of attaining the middle rank and lead to excessive down-scaling. Students who intend to go
to university cannot afford to concentrate their efforts to the same extent because their aim is to
maximise their aggregate score to gain entry to university.
The data presented in table 2 support the notion that VCE VET students who do not intend to go to
university concentrate their effort in VET. Columns (a) and (b) of table 2 are the average raw scores
(before scaling) for students who do and who do not intend to go to university, relative to the average
raw scores in all other subjects taken by the same students.11
Indices greater than 1 for all VCE VET
subjects for both groups suggest that on average both groups do better in VCE VET subjects than in
their other subjects, which is why VCE VET subjects are scaled below 30. However, there is a clear
difference between the two groups in the extent to which they do better in VCE VET subjects (column
[c]). The higher relative performance in VCE VET scores compared with scores in other subjects is
around three percentage points greater for students who do not want to go to university than for
those who do. For engineering studies, hospitality (kitchen operations), music, community services,
and music industry (technical production), the relative performance among those who do not intend
to go to university is over five percentage points greater compared with those who do intend to go to
university. The same pattern is not observed for the general VCE subjects commonly combined with
VCE VET subjects.
11 Whether or not students intend to go to university is determined by whether students apply to the Victorian Tertiary
Admissions Centre for entry to tertiary study with a university course as their first preference.
NCVER 19
Table 2 Average VCE scaled scores for VET and selected general subjects (out of 50) for students who completed school in 2011
Average scaled subject score
Proportion who intend
to go to universitya
Raw scores in a given subject, relative to raw scores in other subjects
taken by the same studentsb
(a)
Intends to go to
university
(b)
Doesn’t intend to go to university
(c)
Diff (b)-(a)
% Ratio Ratio Ratio
VCE VET subject
Business 24.02 72.22 1.12 1.13 0.01
Community recreation 23.56 60.89 1.13 1.13 0.00
Community services 23.13 70.17 1.17 1.23 0.06
Dance 28.79 63.10 1.11 1.12 0.01
Electrotechnology 24.17 35.14 1.18 1.09 -0.09
Engineering studies 23.94 45.67 1.19 1.27 0.08
Equine industry 25.57 61.90 1.04 1.06 0.02
Furnishing 24.01 35.48 1.11 1.06 -0.05
Hospitality 25.02 60.63 1.07 1.12 0.05
Hospitality (kitchen operations) 24.65 52.94 1.09 1.16 0.07
Information technology 24.84 71.43 1.21 1.18 -0.03
Interactive digital media 25.52 68.62 1.07 1.10 0.03
Music 27.12 65.83 1.11 1.18 0.07
Music industry (technical production) 26.12 58.30 1.09 1.15 0.06
Sport and outdoor recreation 23.84 67.74 1.16 1.13 -0.03
All VET subjectsb 24.81 62.96 1.11 1.14 0.03
General VCE subject
Business management 25.93 74.85 1.08 1.03 -0.05
Health and human development 25.63 77.48 1.09 1.04 -0.05
Dance 26.67 73.52 0.99 1.01 0.02
Physics 32.30 92.92 0.97 0.89 -0.08
Food and technology 23.48 58.51 1.18 1.19 0.01
Information technology applications 24.79 72.37 1.13 1.13 0.00
Visual communications and design 26.43 71.80 1.07 1.05 -0.02
Music performance 28.53 80.19 0.99 1.02 0.03
Physical education 26.76 78.31 1.06 1.01 0.05
Note: The results for ‘financial services’ and ‘laboratory skills’ are not reported because they are based on fewer than ten observations.
a Determined by whether they lodge a first preference to VTAC to attend a university. The differences in the ratio of scores for all VCE VET students who do and do not intend to go to university are statistically significant at 1%.
b It is estimated as the average raw study score (unscaled) for the given subject (column 1) divided by the average raw score for all other subjects taken by the students who took the given subject.
Source: VCAA student performance data and VTAC preference data.

20 Does scored VET in Schools help or hinder access to higher education in Victoria?
Data
A feature of this study is the use of population unit record data of Year 12 completers in Victoria in
2011 from all school sectors (government, Catholic and independent). The data comprise information
from four sources: student and subject choice information from the Victorian Curriculum and
Assessment Authority; preferences for post-school study and scaled subject scores from the Victorian
Tertiary Admissions Centre; Year 9 NAPLAN test scores from the Department of Education and Early
Childhood Development (DEECD); and self-reported information on university enrolments and offers
from the On Track survey of 2011 school completers. These datasets were linked by the Department
of Education and Early Childhood Development using a de-identified student number common to each
of the datasets, which ensured that the datasets could be linked with close to 100% accuracy. Linking
this information produces an extremely rich dataset, one that allows us to control for the differences
in academic ability, post-school preferences and personal, regional and school characteristics
between those who do and those who do not choose VCE VET subjects.
Overall, we observe 49 003 school completers, of which 3628 (or 7.4%) took at least one VCE VET
subject in their five (or six) VCE subjects (table 3). It is important to note that the students who
undertake unscored VET subjects as part of their upper secondary school are not part of this analysis.
The most popular VCE VET subjects are interactive digital media (around 18% of all VCE VET);
community recreation and sport and outdoor recreation (19% of all VCE VET); hospitality and
hospitality (kitchen operations) (18% of all VCE VET); music and music industry (11% of all VCE VET);
information technology and electrotechnology (9% of all VCE VET); and business (7% of all VCE VET).
We retain in the sample of analysis only those with a university entry score who had Year 9 NAPLAN
test score results and who lodged a first preference for a university course with the Victorian Tertiary
Admissions Centre prior to sitting their final exams (before the end of October 2011). Restricting the
sample to those who lodge a first-round university preference is to ensure that the analysis is only
conducted on those who have an intention to go to university. There may be other ways of measuring
intention to go to university, such as whether or not a student has lodged any preference for a
university course. To test the sensitivity of our results to this restriction, we also estimate results
with this restriction relaxed (see appendix E).
For VCE VET students, we also restrict the sample to those who only take one VCE VET subject and
who attain a study score for their VCE VET subject, which as discussed above is optional. These
restrictions reduce the sample by around 27%, to 35 511 observations. Most of this reduction in
observations is due to omitting those who did not lodge a first preference for a university course and
those with missing NAPLAN scores. All else being equal, those with missing NAPLAN scores are likely to
be below-average students, which means that if the chance of having a missing NAPLAN score is
strongly correlated with the chance of taking a VCE VET subject, the sample and results from the
analysis may be biased. However, from table 3, no evidence of a strong correlation exists, with a
slightly higher rate of omissions among those who did not take a VCE VET subject than among those
who did.

NCVER 21
Table 3 Number of students in the sample
Subjects Total number
of students
Less number
without a study score
Less number without Year 9
NAPLAN
Less number who don’t
attain a study score for VET
subject or take multiple
VCE VET subjects
Less those who
do not intend to go to
university
Business 257 244 214 210 194
Community recreation 572 547 497 487 361
Community services 274 251 216 209 182
Dance 90 88 72 70 54
Electrotechnology 96 84 70 66 34
Engineering studies 146 135 121 116 71
Equine industry 49 48 44 39 26
Financial services 8 8 6 6 5
Furnishing 102 96 85 83 43
Hospitality 338 327 273 269 226
Hospitality (kitchen operations) 297 288 246 240 183
Information technology 241 234 203 190 156
Interactive digital media 660 637 566 552 480
Laboratory skills 9 8 8 8 8
Music 128 127 115 112 95
Music industry (technical production)
253 238 218 217 178
Sports and outdoor recreation 108 104 92 86 68
Takes a VCE VET subject 3 628 3 464 3 046 2 960 2 364
% Reduction 0.00 -4.52 -12.07 -2.82 -20.01
Doesn’t take a VCE VET subject 45 375 43 700 36 907 36 457 33 147
% Reduction 0.00 -3.69 -15.54 -1.22 -26.95
Source: VCAA student performance data.
We remove from the sample those who do not lodge a first preference for a university course because
we assume that these students have no intention of attending university and hence their chances of
gaining entry to university are unaffected by whether or not they choose a VCE VET subject. Students
lodge up to 12 post-school course preferences, with their first preference being the most preferred
and the 12th being their least preferred, at any time between 1 April until just prior to Christmas.12
The robustness of the result to this restriction is tested in the sensitivity analysis section (appendix E).
Outcomes of interest
The main outcome of interest is students’ university entry score. University entry scores are derived
by adding the highest English study score (from English, English as a second language or English
literature) to the remaining best three scaled subject scores in the final year of study (known as the
primary four subjects) and adding 10% of the fifth-best scaled subject score. If a sixth subject is
taken, which is not the norm, an additional 10% of a sixth subject is also included. The maximum
university study score is 205 (or 210 if students undertake six subjects) and is used to derive the
12 Preferences entered prior to sitting their final exams can be altered in December once final results are released.
Students who have not entered preferences before the final exams can also do so in December.

22 Does scored VET in Schools help or hinder access to higher education in Victoria?
student’s rank within their year — their Australian Tertiary Admission Rank (ATAR). ATAR distributes
the university entry score as evenly as possible on a scale of 0 to 100, according to the level of their
university entry score and using an interval of 0.05. Therefore, the highest rank is 99.95, which means
that the student’s entry score is in the top 0.05% of students who commenced secondary school in the
same year.
A limitation of using university entry scores as the outcome of interest is that it is unclear whether
any effect of taking a VCE VET subject translates into an impact on the chance of attaining access to
university. For some university courses, entry is not solely based on entry scores, but on other criteria
such as performance in an interview and work produced as part of a Year 12 portfolio. To address this
issue, we use information on university offers from the On Track survey of 2011 school completers,
which are linked via a unique student identifier (conducted in 2012). The 2012 On Track survey of
school completers contains information from around 34 000 graduates at around six months after
completing school (April—May 2012).13
Receiving an offer is identified by whether graduates report
either being enrolled in a university course, receiving an offer and deferring, or receiving an offer and
declining the offer.
Not only may taking a VCE VET subject impact on the chances of attaining a university offer, but it
may also affect the receipt of a more preferred course offer. To examine how taking a VCE VET
subject may affect the attainment of a preferred offer, we compare the university entry cut-off
scores (measured as ATARs) for each student’s university preferences with their realised scores. All
else being equal, the higher their realised score relative to the cut-off scores of their preferred
courses, the more likely they received an offer from a preferred course. We measure entry to a
preferred course using three measures: a realised score that is higher than the cut-off for their first
preference; a realised score that is higher than the cut-off for their third preference; and a realised
score that is higher than the cut-off for their sixth preference. Cut-off scores are taken from the year
prior (2011) because they are the only ones available to students at the time they lodge their
preferences and may be considered as student target scores. However, these measures should be
considered as only indicative of the receipt of a course offer: universities still offer places to students
who did not attain the course cut-off score; for example, because of equity reasons. Also, in line with
year-on-year changes in student demand, the cut-off scores in 2011 may vary from the cut-off scores
in 2012.14
Descriptive statistics
Key to estimating causal impacts is controlling for self-selection bias, which occurs because allocation
to a VCE VET subject is not random. This means controlling for differences in the factors that may
affect both the choice of a VCE VET subject and university entry scores, such as academic aspirations
and academic ability. Failure to take into account self-selection bias may lead to the wrong
conclusion about the impacts of taking a VCE VET subject. As discussed above, restricting the sample
of analysis to those who intend to go to university controls for differences in aspirations to attend
university, but there are other factors, such as academic ability, that need to be controlled for as
well. We examine the differences in some of the other factors below.
13 For more information on On Track, including the survey questionnaires, visit the On Track website:
<http://www.education.vic.gov.au/about/research/Pages/ontrackdata.aspx>. 14 Ideally, we would compare course preferences from VTAC with course offers from On Track. However, On Track only
includes information on the field of education of course offer and cannot be accurately reconciled with course
preference.
NCVER 23
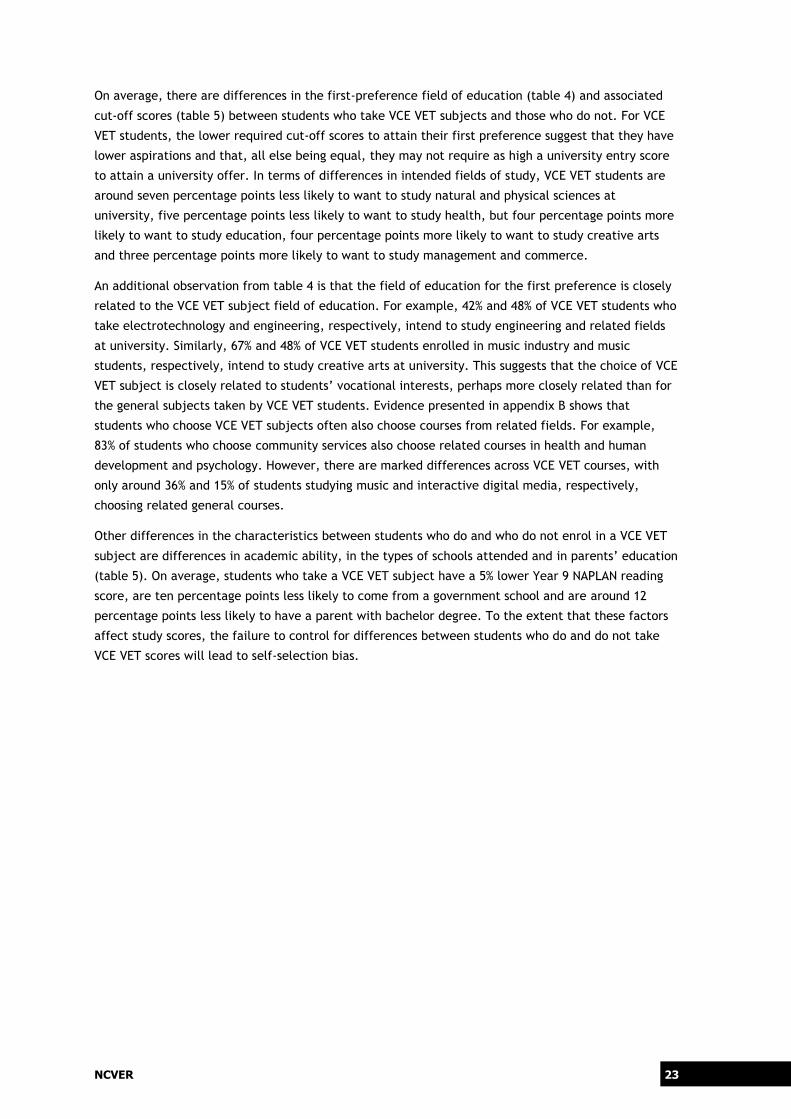
On average, there are differences in the first-preference field of education (table 4) and associated
cut-off scores (table 5) between students who take VCE VET subjects and those who do not. For VCE
VET students, the lower required cut-off scores to attain their first preference suggest that they have
lower aspirations and that, all else being equal, they may not require as high a university entry score
to attain a university offer. In terms of differences in intended fields of study, VCE VET students are
around seven percentage points less likely to want to study natural and physical sciences at
university, five percentage points less likely to want to study health, but four percentage points more
likely to want to study education, four percentage points more likely to want to study creative arts
and three percentage points more likely to want to study management and commerce.
An additional observation from table 4 is that the field of education for the first preference is closely
related to the VCE VET subject field of education. For example, 42% and 48% of VCE VET students who
take electrotechnology and engineering, respectively, intend to study engineering and related fields
at university. Similarly, 67% and 48% of VCE VET students enrolled in music industry and music
students, respectively, intend to study creative arts at university. This suggests that the choice of VCE
VET subject is closely related to students’ vocational interests, perhaps more closely related than for
the general subjects taken by VCE VET students. Evidence presented in appendix B shows that
students who choose VCE VET subjects often also choose courses from related fields. For example,
83% of students who choose community services also choose related courses in health and human
development and psychology. However, there are marked differences across VCE VET courses, with
only around 36% and 15% of students studying music and interactive digital media, respectively,
choosing related general courses.
Other differences in the characteristics between students who do and who do not enrol in a VCE VET
subject are differences in academic ability, in the types of schools attended and in parents’ education
(table 5). On average, students who take a VCE VET subject have a 5% lower Year 9 NAPLAN reading
score, are ten percentage points less likely to come from a government school and are around 12
percentage points less likely to have a parent with bachelor degree. To the extent that these factors
affect study scores, the failure to control for differences between students who do and do not take
VCE VET scores will lead to self-selection bias.
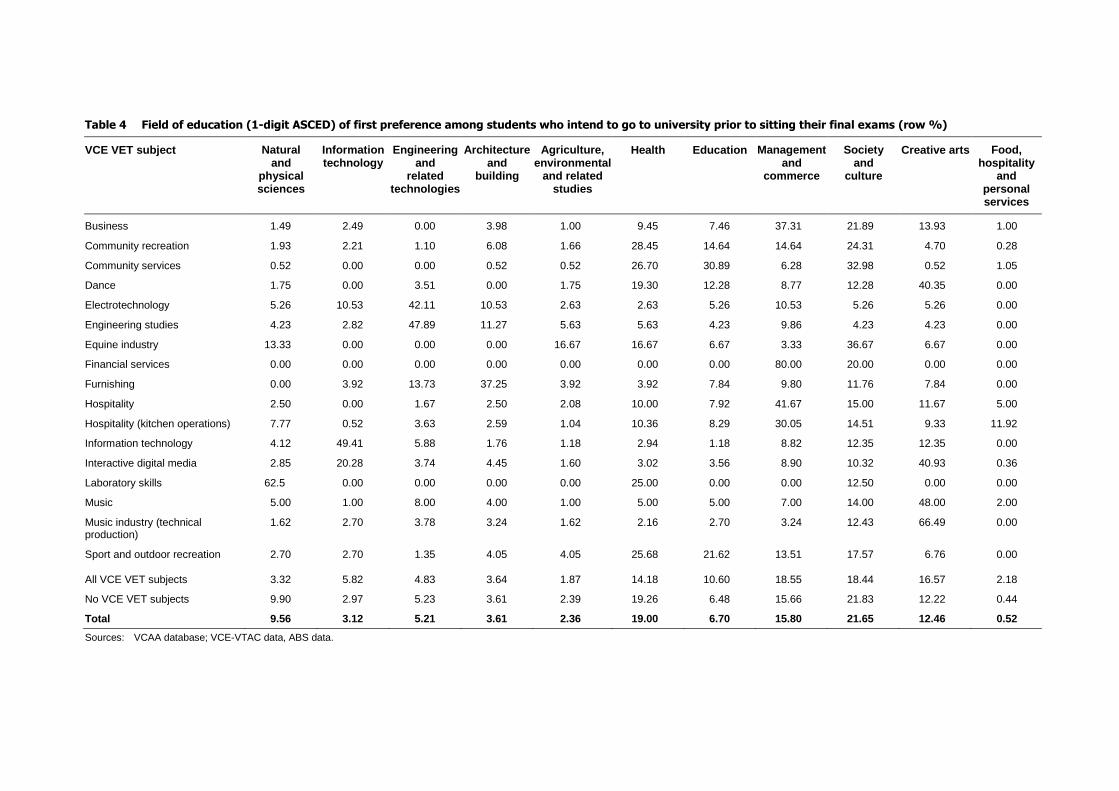
Table 4 Field of education (1-digit ASCED) of first preference among students who intend to go to university prior to sitting their final exams (row %)
VCE VET subject Natural and
physical sciences
Information technology
Engineering and
related technologies
Architecture and
building
Agriculture, environmental
and related studies
Health Education Management and
commerce
Society and
culture
Creative arts Food, hospitality
and personal services
Business 1.49 2.49 0.00 3.98 1.00 9.45 7.46 37.31 21.89 13.93 1.00
Community recreation 1.93 2.21 1.10 6.08 1.66 28.45 14.64 14.64 24.31 4.70 0.28
Community services 0.52 0.00 0.00 0.52 0.52 26.70 30.89 6.28 32.98 0.52 1.05
Dance 1.75 0.00 3.51 0.00 1.75 19.30 12.28 8.77 12.28 40.35 0.00
Electrotechnology 5.26 10.53 42.11 10.53 2.63 2.63 5.26 10.53 5.26 5.26 0.00
Engineering studies 4.23 2.82 47.89 11.27 5.63 5.63 4.23 9.86 4.23 4.23 0.00
Equine industry 13.33 0.00 0.00 0.00 16.67 16.67 6.67 3.33 36.67 6.67 0.00
Financial services 0.00 0.00 0.00 0.00 0.00 0.00 0.00 80.00 20.00 0.00 0.00
Furnishing 0.00 3.92 13.73 37.25 3.92 3.92 7.84 9.80 11.76 7.84 0.00
Hospitality 2.50 0.00 1.67 2.50 2.08 10.00 7.92 41.67 15.00 11.67 5.00
Hospitality (kitchen operations) 7.77 0.52 3.63 2.59 1.04 10.36 8.29 30.05 14.51 9.33 11.92
Information technology 4.12 49.41 5.88 1.76 1.18 2.94 1.18 8.82 12.35 12.35 0.00
Interactive digital media 2.85 20.28 3.74 4.45 1.60 3.02 3.56 8.90 10.32 40.93 0.36
Laboratory skills 62.5 0.00 0.00 0.00 0.00 25.00 0.00 0.00 12.50 0.00 0.00
Music 5.00 1.00 8.00 4.00 1.00 5.00 5.00 7.00 14.00 48.00 2.00
Music industry (technical production)
1.62 2.70 3.78 3.24 1.62 2.16 2.70 3.24 12.43 66.49 0.00
Sport and outdoor recreation 2.70 2.70 1.35 4.05 4.05 25.68 21.62 13.51 17.57 6.76 0.00
All VCE VET subjects 3.32 5.82 4.83 3.64 1.87 14.18 10.60 18.55 18.44 16.57 2.18
No VCE VET subjects 9.90 2.97 5.23 3.61 2.39 19.26 6.48 15.66 21.83 12.22 0.44
Total 9.56 3.12 5.21 3.61 2.36 19.00 6.70 15.80 21.65 12.46 0.52
Sources: VCAA database; VCE-VTAC data, ABS data.
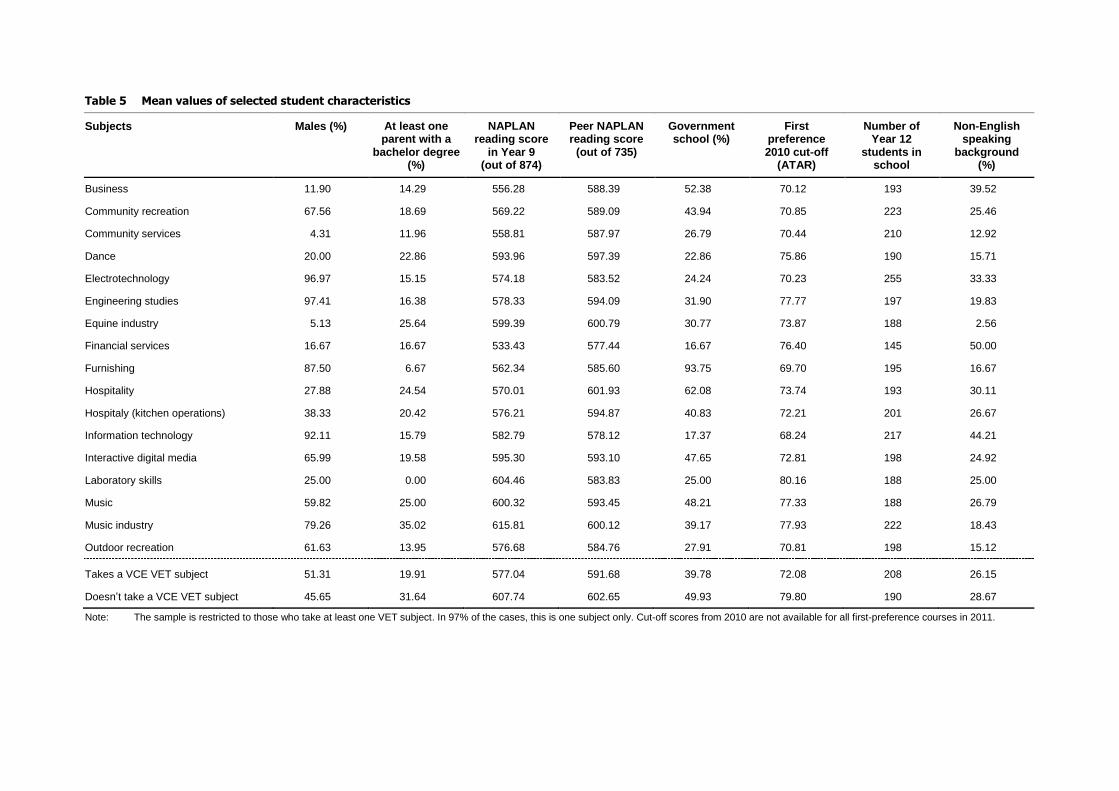
Table 5 Mean values of selected student characteristics
Subjects Males (%) At least one parent with a
bachelor degree (%)
NAPLAN reading score
in Year 9 (out of 874)
Peer NAPLAN reading score
(out of 735)
Government school (%)
First preference 2010 cut-off
(ATAR)
Number of Year 12
students in school
Non-English speaking
background (%)
Business 11.90 14.29 556.28 588.39 52.38 70.12 193 39.52
Community recreation 67.56 18.69 569.22 589.09 43.94 70.85 223 25.46
Community services 4.31 11.96 558.81 587.97 26.79 70.44 210 12.92
Dance 20.00 22.86 593.96 597.39 22.86 75.86 190 15.71
Electrotechnology 96.97 15.15 574.18 583.52 24.24 70.23 255 33.33
Engineering studies 97.41 16.38 578.33 594.09 31.90 77.77 197 19.83
Equine industry 5.13 25.64 599.39 600.79 30.77 73.87 188 2.56
Financial services 16.67 16.67 533.43 577.44 16.67 76.40 145 50.00
Furnishing 87.50 6.67 562.34 585.60 93.75 69.70 195 16.67
Hospitality 27.88 24.54 570.01 601.93 62.08 73.74 193 30.11
Hospitaly (kitchen operations) 38.33 20.42 576.21 594.87 40.83 72.21 201 26.67
Information technology 92.11 15.79 582.79 578.12 17.37 68.24 217 44.21
Interactive digital media 65.99 19.58 595.30 593.10 47.65 72.81 198 24.92
Laboratory skills 25.00 0.00 604.46 583.83 25.00 80.16 188 25.00
Music 59.82 25.00 600.32 593.45 48.21 77.33 188 26.79
Music industry 79.26 35.02 615.81 600.12 39.17 77.93 222 18.43
Outdoor recreation 61.63 13.95 576.68 584.76 27.91 70.81 198 15.12
Takes a VCE VET subject 51.31 19.91 577.04 591.68 39.78 72.08 208 26.15
Doesn’t take a VCE VET subject 45.65 31.64 607.74 602.65 49.93 79.80 190 28.67
Note: The sample is restricted to those who take at least one VET subject. In 97% of the cases, this is one subject only. Cut-off scores from 2010 are not available for all first-preference courses in 2011.
26 Does scored VET in Schools help or hinder access to higher education in Victoria?
Methodology
As mentioned earlier, the key methodological issue in this study is dealing with self-selection bias,
which arises because of the differences, such as academic ability, between students who take VCE VET
subjects and those who do not, that potentially also affect university entry scores. To deal with self-
selection bias, we rely on the richness of the controls in our data and propensity score matching (PSM).
PSM deals with self-selection by constructing a ‘like’ or ‘matched’ control group (from students who do
not take a scored VCE VET subject) against which the outcomes from the treatment group (those who
take a scored VCE VET subject) can be compared to isolate the effects of the treatment (those who
take a scored VCE VET subject). Propensity score matching is generally preferred to standard regression
techniques in dealing with self-selection bias because it ensures common support; that is, overlap in
the distribution of characteristics between those who do and those who do not receive a treatment
(Blundell & Costa Dias 2008). Standard regression techniques do not ensure common support, which
means that the estimated effects of treatment may be based on extrapolation, which makes them
difficult to interpret. A feature of propensity score matching in relation to other approaches used to
deal with self-selection, such as instrumental variables, is that it does not rely on a valid exclusion
restriction, which in practice, is often difficult to find (Blundell & Costa Dias 2008).15
However, a
limitation of PSM is its heavy reliance on rich data to create large control groups to control for
differences in all the factors that affect both selection and outcomes (conditional independence
assumption).
Ideally, to ensure that the conditional independence assumption holds, we would restrict the matched
control group to individuals who took the same subjects as those of the treatment group, except for
one, the VCE VET subject. However, given that students have great flexibility in choosing from around
60 VCE subjects, such an approach would impose a tight constraint on the matching, and any
estimates would be arbitrarily based on choosing a specific general subject as an alternative to taking
a VCE VET subject. In this study, we do not impose such a tight restriction on the matching, but
instead assume that the outcome from taking an alternative general subject instead of a VCE VET
subject is equal to the outcome from the matched control group, even though the general courses
taken by the two groups may be different. This is not likely to be a limiting assumption because after
selecting a matched control group, we find that there are only minor differences between the two
groups in the general subjects chosen (table D2 in appendix D).
Propensity score matching methods used
Constructing a matched counterfactual group using propensity score matching involves using a
function (usually predicted probabilities of treatment from a probit model) to choose individuals who
are estimated to have the same, within some range, propensity for treatment, but who did not
receive a treatment. In this study, two standard and common PSM approaches are used to construct a
matched control group — Nearest Neighbour and Kernell.
Nearest Neighbour involves using a propensity score to select, for each treated individual, the
individual from the control group with the closest propensity of treatment. A limitation of Nearest
Neighbour is that it only uses information from one control group observation per treated individual
and ignores information from control group members who may have similar predicted probabilities of
15 Exclusion restrictions are variables that affect selection into treatment, but do not affect the variable of interest.

NCVER 27
treatment. To better utilise the available information, we also use ‘closest-5’ Nearest Neighbour
estimation and Kernell matching. The closest-5 Nearest Neighbour chooses five control group
members with the closest predicted probabilities; the outcomes from each of the five are given equal
weight in constructing the counterfactual. In contrast, Kernell matching selects all control group
members within a certain range of the treated individual’s propensity score and takes a weighted
average of the selected control group outcomes. The weights depend on the distance between the
control and the treated propensity score.16
In small samples there is generally a trade-off between
bias and efficiency (Smith & Todd 2005). Notably, Nearest Neighbour estimators are less biased, while
Kernell are more efficient. Because we have a large control group, our default choice is estimation
using one-to-one Nearest Neighbour. Estimates using closest-5 Nearest Neighbour and Kernell
matching are also generated for the sake of robustness. When examining impacts by subject area
when the use of small samples is involved, Kernell matching is used because it produces more precise
estimates.
Because of the small sample sizes, we cannot precisely estimate impacts for individual subjects.
Instead, we estimate impacts across similar groups of subjects. The subject groups used are:
business and finance: business and financial services
community, outdoor and recreation: community services; community recreation; and sport and
outdoor recreation
dance and music: dance; music; and music industry (technical production)
engineering and technology: engineering studies; and electrotechnology
information technology: information technology; and interactive digital media
hospitality: hospitality; and hospitality (kitchen operations)
equine industry.
We do not estimate the impacts for students who take laboratory skills and furnishing because there
are too few observations with respect to scaled scores for robust estimation.
A feature of this study is the derivation of a decomposition method that attempts to explain any gap
in university entry scores between those who do and those do not take VCE VET subjects. The details
of this method are presented in appendix C.
Specification of the propensity score function
As mentioned above, for propensity score matching to deal with self-selection bias, the conditional
independence assumption must hold; that is, we must control for differences in all factors that affect
both the choice of VCE VET and the outcomes of interest. The key differences are likely to be in past
academic performance and ability; in school-level factors, such as school resourcing; in peer
characteristics; and in post-school study aspirations. The richness of our data allows us to control for
all of these differences by including them in our binary probit model of selection into a VCE VET
subject. See table D1 for a list of all the variables used in the selection equation and the selection
equation results.
16 Kernel matching is conducted using a conservative bandwidth of 0.02.
28 Does scored VET in Schools help or hinder access to higher education in Victoria?
To control for differences in school factors, we include peer information (information on other
Year 12 students in 2011 at the same school) and other school information in the selection equation.
For each student in the sample, peer information is the average of their Year 12 peer NAPLAN scores
from Year 9 (in 2008), their Year 12 peer participation rate in VCE VET subjects and the number of
Year 12 peers. Peer participation in vocational education and training and peer enrolments provide
information on the possible quality and range of VCE VET options. Other school information includes
an indicator of whether the school is a government school, which may also be related to the
availability of school resources.
There is a strong body of literature that shows parents’ education and occupational preferences are
important in influencing students’ academic performance and occupational preferences (see for
example Polidano, Hanel & Buddelmeyer 2013). To control for this source of self-selection, we include
information on the highest education level (Australian Standard Classification of Education [ASCED]
1-digit) and the occupation skill level (Australian Standard Classification of Occupations [ASCO]
1-digit) of either parent in the binary probit model of VCE VET.
We control for a range of individual-level factors, the most important being differences in past
academic performance and ability, where we use NAPLAN numeracy and reading results in Year 9
(2008 data). Using past test scores in a multivariate model of academic performance to control for
differences in academic ability and the effects of historical investments in education is known as a
‘value-added’ model. Value-added models are commonly used to estimate the influence of changes to
academic inputs; for example, the effects of teachers (Hanushek 1979; Todd & Wolpin 2003). Other
individual-level information used in the matching is gender, age, Indigenous status, whether the
individual is from a non-English speaking background, remoteness of region, number of VCE subjects
chosen and a measure of regional disadvantage. We control for differences in the availability of VCE
VET subjects by local economic opportunities by using information on local (statistical local area)
unemployment rates from the Australian Bureau of Statistics (ABS). These were found to explain more
of the variation in selection into VCE VET courses than the SEIFA indices of socio-economic
disadvantage (ABS 2006), but overall regional economic factors were not important in explaining
selection (see table D1).
Besides restricting the sample of analysis to those who apply for university entry prior to sitting their
final exams, in the propensity score matching we also control for differences in intended field of
education at university. As discussed above, it is possible that students who do and those who do not
choose VCE VET subjects aspire to different university courses, so that there are also differences in
the general subjects taken between the two groups that may affect outcomes. We control for the
differences in field of education by including dummy variables for 25 fields of university study (2-digit
ASCED) in the standard propensity score matching. In the standard estimation, we do not control
explicitly for the level of aspiration, measured by the cut-off score of the first preference, because
this contains large numbers of missing observations, which may affect the analysis. We test whether
the inclusion of first-preference cut-off scores affects the standard estimates in the sensitivity
analysis (appendix E).
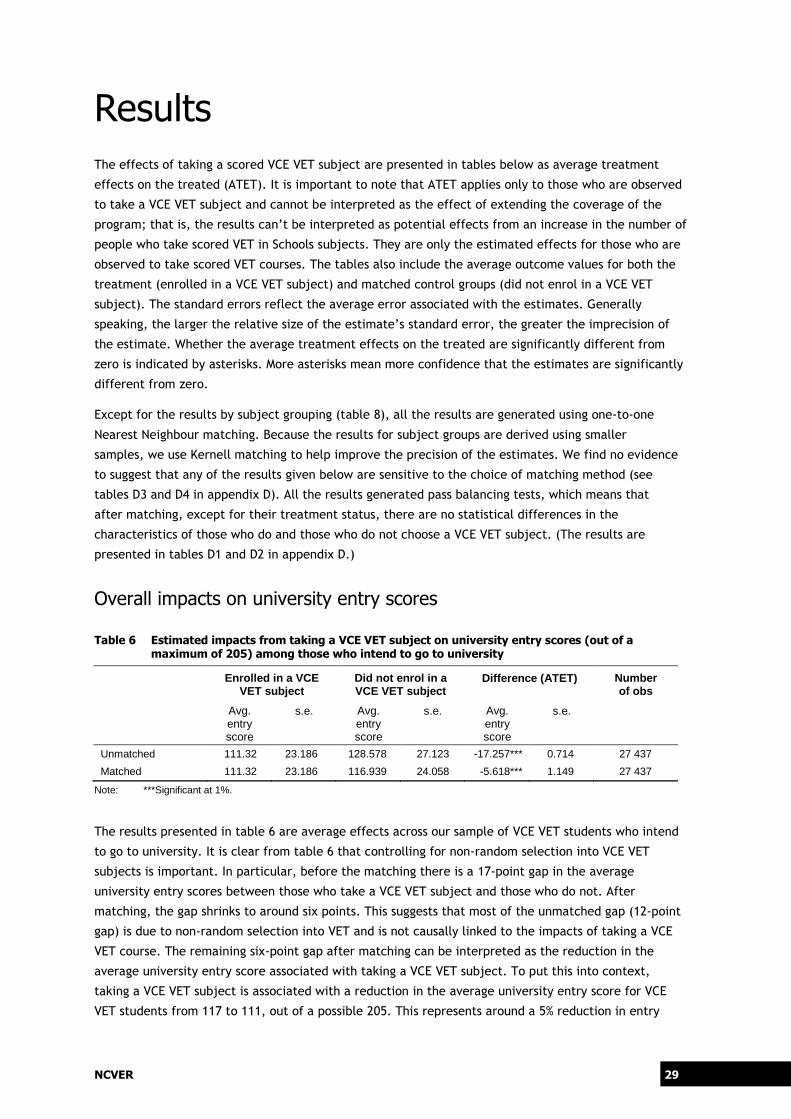
NCVER 29
Results
The effects of taking a scored VCE VET subject are presented in tables below as average treatment
effects on the treated (ATET). It is important to note that ATET applies only to those who are observed
to take a VCE VET subject and cannot be interpreted as the effect of extending the coverage of the
program; that is, the results can’t be interpreted as potential effects from an increase in the number of
people who take scored VET in Schools subjects. They are only the estimated effects for those who are
observed to take scored VET courses. The tables also include the average outcome values for both the
treatment (enrolled in a VCE VET subject) and matched control groups (did not enrol in a VCE VET
subject). The standard errors reflect the average error associated with the estimates. Generally
speaking, the larger the relative size of the estimate’s standard error, the greater the imprecision of
the estimate. Whether the average treatment effects on the treated are significantly different from
zero is indicated by asterisks. More asterisks mean more confidence that the estimates are significantly
different from zero.
Except for the results by subject grouping (table 8), all the results are generated using one-to-one
Nearest Neighbour matching. Because the results for subject groups are derived using smaller
samples, we use Kernell matching to help improve the precision of the estimates. We find no evidence
to suggest that any of the results given below are sensitive to the choice of matching method (see
tables D3 and D4 in appendix D). All the results generated pass balancing tests, which means that
after matching, except for their treatment status, there are no statistical differences in the
characteristics of those who do and those who do not choose a VCE VET subject. (The results are
presented in tables D1 and D2 in appendix D.)
Overall impacts on university entry scores
Table 6 Estimated impacts from taking a VCE VET subject on university entry scores (out of a maximum of 205) among those who intend to go to university
Enrolled in a VCE VET subject
Did not enrol in a VCE VET subject
Difference (ATET) Number of obs
Avg. entry score
s.e. Avg. entry score
s.e. Avg. entry score
s.e.
Unmatched 111.32 23.186 128.578 27.123 -17.257*** 0.714 27 437
Matched 111.32 23.186 116.939 24.058 -5.618*** 1.149 27 437
Note: ***Significant at 1%.
The results presented in table 6 are average effects across our sample of VCE VET students who intend
to go to university. It is clear from table 6 that controlling for non-random selection into VCE VET
subjects is important. In particular, before the matching there is a 17-point gap in the average
university entry scores between those who take a VCE VET subject and those who do not. After
matching, the gap shrinks to around six points. This suggests that most of the unmatched gap (12-point
gap) is due to non-random selection into VET and is not causally linked to the impacts of taking a VCE
VET course. The remaining six-point gap after matching can be interpreted as the reduction in the
average university entry score associated with taking a VCE VET subject. To put this into context,
taking a VCE VET subject is associated with a reduction in the average university entry score for VCE
VET students from 117 to 111, out of a possible 205. This represents around a 5% reduction in entry

30 Does scored VET in Schools help or hinder access to higher education in Victoria?
scores, on average. This estimate is robust to the range of alternative key assumptions that underpin
the analysis. (See the sensitivity analysis in appendix E for details.)
Decomposition of entry score results
A major innovation of this study is the derivation of a decomposition method that breaks the total
effects presented in table 6 into direct effects and indirect effects. All else being equal, the
direct effect is the change in the university entry score associated with taking a VCE VET subject
instead of a general subject; the indirect effect is the change in the university entry score in all
general subjects associated with a substitution of a VCE VET subject for a general subject.
Table 7 Estimated total, direct and indirect impacts of taking a VCE VET subject on university entry scores (out of a maximum of 205) among those who intend to go to university
VCE VET status Total Direct effect Indirect effect
Enrolled in a VCE VET subject 111.320 19.311 92.008
Did not enrol in a VCE VET subject 116.939 23.297 93.641
Difference (ATET) -5.618*** -3.985*** -1.632***
Note: ***Significant at 1%.
It is clear from the results in table 7 that most of the gap in test scores arises because of low scores in
VCE VET. For students who take a VCE VET subject, on average, their VET subject contributes 19
points out of a maximum 50 to their university entry score, compared with an average of around 23
points in all of their other subjects (92.008 divided by four). The average subject contribution of 23
points in subjects apart from VET is only marginally smaller than the per-subject contribution for
students who do not take VCE VET subjects (23.41). It is important to note that these scores are
average contributions to the university entry score and not average scores: they take into account the
different weighting given to subjects in making up individual entry scores.17
Overall, we can conclude that of the six-point reduction in university entry scores associated with
taking a VCE VET subject (table 6), around four points (or 70%) can be attributed to the direct effect
and the remainder due to indirect effects. We cannot be sure of the origin of the direct and indirect
effects and there may be a number of different explanations. The negative direct effect includes:
excessive down-scaling of VCE VET subjects; the onerous training commitments associated with VET
qualifications; and/or because students who intend to go to university are not well suited to these
subjects. A possible explanation for the negative indirect effect is that performance in other subjects
is affected by onerous off-campus training commitments. While schools try to minimise any disruptive
impact that off-campus training has on academic achievement, we cannot rule out this possibility
because no data are available on the time spent in off-campus training.
The decomposition results tell us something about the contribution of uncontrolled-for factors in
explaining our results. In this study, we cannot rule out the possibility that the lower average entry
score for VCE VET students is due to differences in factors that are not controlled for and which affect
entry scores. That said, the dominance of the direct effect suggests that this is unlikely. If there are
uncontrolled differences in factors that lead to lower entry scores for VCE VET students, then to
17 In Victoria, only English and the highest three contribute equal weight (100%) and the fifth subject (and potentially
sixth) only contributes 10%. See appendix C for technical details. Note that in working out the average contributions
of the indirect effect to the overall entry score, we divide by four because the vast majority students take five VCE
subjects.

NCVER 31
explain the entire gap, they must have a disproportionately negative effect on scores in VCE VET
subjects compared with scores in other subjects. The difference in preferences is an example of an
uncontrolled-for factor that may disproportionately affect performance in VCE VET. However,
differences in preferences are likely to disproportionately increase performance in VCE VET subjects.
At the most, if we assume that all of the indirect effect can be explained by uncontrolled-for
differences between the two groups and that uncontrolled-for factors impact on scores in all subjects
equally, then uncontrolled-for factors would only account for around a third of the estimated gap in
university entry scores.18
Results by VCE VET subject group
The results in table 8 show the estimated relationships between enrolling in different subject
groupings (presented in the methodology section) and university entry scores for students who intend
to go to university. A point of note when interpreting the results in table 8 is that the small number of
observations by subject group means that the results are estimated with less precision than in tables 6
and 7. Overall, the results by subject group are either insignificant or significant and negative.
Consistent with the aggregate results presented in table 6, the negative results are driven more by
negative direct than indirect effects. The largest negative relationships are from taking VCE VET
subjects in engineering and technology; community; outdoor and recreation; and hospitality, which
are associated with seven-point, six-point and six-point lower university entry scores respectively.
While these impacts are driven mostly by direct effects, there is variation in the indirect effects that
explain some of the differences in impacts across subjects. Of note, we find some evidence of
positive, albeit insignificant, indirect effects in dance and music and information technology that
suggest that the skills developed in these subjects may benefit learning in other general subjects. For
example, taking the VCE VET subject music may help in the learning of music performance, a general
course that it is commonly combined with studio arts (table B5 in appendix B).
18 If we assume that all of the indirect effect is due to differences in uncontrolled-for factors and that these factors
have the same negative effect on all subject scores, then we can say that 0.408 (1.632/4) percentage points of the
3.985-percentage-point gap due to the direct effect is also explained by uncontrolled-for factors. Therefore, at the
most, uncontrolled-for factors would explain 2.04 of the 5.618-percentage-point gap.

32 Does scored VET in Schools help or hinder access to higher education in Victoria?
Table 8 Estimated impacts from taking individual VCE VET subjects on university entry scores (out of a maximum of 205) of those who intend to go to university, Kernell matching
VCE VET status Total Direct effect Indirect effect
Business and finance
Enrolled in a VCE VET subjecta 108.16 20.762 87.398
Did not enrol in a VCE VET subject 111.664 22.195 89.469
Difference (ATET) -3.503 -1.432 -2.071
Community, outdoor and recreation
Enrolled in a VCE VET subjecta 105.033 18.626 86.407
Did not enrol in a VCE VET subject 111.529 22.279 89.249
Difference (ATET) -6.495*** -3.653*** -2.841**
Dance and music
Enrolled in a VCE VET subjecta 118.496 20.671 97.825
Did not enrol in a VCE VET subject 119.713 23.831 95.881
Difference (ATET) -1.216 -3.160*** 1.943
Engineering and technology
Enrolled in a VCE VET subjecta 111.982 18.47 93.512
Did not enrol in a VCE VET subject 119.024 23.615 95.409
Difference (ATET) -7.042* -5.144*** -1.897
Information technology
Enrolled in a VCE VET subjecta 113.974 18.991 94.983
Did not enrol in a VCE VET subject 117.5 23.417 94.083
Difference (ATET) -3.525** -4.425*** 0.899
Hospitality
Enrolled in a VCE VET subjecta 113.105 18.983 94.122
Did not enrol in a VCE VET subject 118.607 23.599 95.008
Difference (ATET) -5.502*** -4.616** -0.885
Equine industry
Enrolled in a VCE VET subjecta 116.308 20.402 95.905
Did not enrol in a VCE VET subject 122.719 24.47 98.249
Difference (ATET) -6.411 -4.068 -2.343
Notes: ***Significant at 1%, ** significant at 5%, *significant at 10%. a Using a bandwidth of 0.02.
Impacts on university access
A key question is the extent to which the six-point lower average university entry score associated
with taking a VCE VET course affects access to university and the gaining of a preferred university
offer. On face value, a six-point gap in entry scores does not seem to be a large effect and, given that
VCE VET students apply to courses with lower required cut-off scores than students who do not take
VCE VET subjects (table 5), we might expect only small or insignificant impacts. However, the results
in table 9 present a different picture. We estimate that taking a VCE VET subject is associated with a
12-percentage-point reduction in the reported chance of receiving a university offer. More
specifically, on average, taking a VCE VET subject is associated with a reduction in the reported
chances of receiving a university offer from 79% to 67%. This result suggests that a six-point reduction
in university entry scores translates into a large effect on the receipt of a university offer.
NCVER 33
Table 9 Estimated impacts from taking a VCE VET subject on the chances of attaining entry to a university course
Enrolled in a VCE VET subjecta
Did not enrol in a VCE VET subject
Difference (ATET) Number of obsa
Predicted probability
s.e. Predicted probability
s.e. Predicted probability
s.e.
Offered a university place
Unmatched 0.674 0.468 0.864 0.342 -0.189*** 0.012 16 923
Matched 0.674 0.468 0.792 0.405 -0.118*** 0.027 16 923
University course preference attained (out of 12 preferences)
First preference
Unmatched 0.216 0.411 0.291 0.454 -0.074*** 0.012 26 875
Matched 0.216 0.411 0.238 0.426 -0.021 0.021 26 875
One of first three preferences
Unmatched 0.404 0.490 0.543 0.498 -0.139*** 0.013 28 271
Matched 0.404 0.490 0.440 0.496 -0.035 0.024 28 271
One of first six preferences
Unmatched 0.509 0.500 0.686 0.463 -0.176*** 0.012 29 266
Matched 0.509 0.500 0.580 0.493 -0.070*** 0.024 29 266
Notes: ***Significant at 1%.
The number of observations for being offered a university place is fewer than in table 6 because the sample is based on On Track data, which is a sample of the population of school completers. The number of observations for attaining the preferred university preference and for attaining one of the first three and first six preferences is higher than in table 6 because of the higher number of non-missing observations in the outcome variable.
Given that we know that VCE VET students apply to courses with lower cut-off scores than students
who do not undertake VCE VET subjects, this result appears to contradict expectations. However,
there are good reasons for this result. First, the descriptive statistics that show VCE VET students
apply for courses with lower cut-off scores are based on unmatched data (table 5). In estimating the
relationships between VCE VET and receiving an offer, propensity score matching compares the offer
rate of VCE VET students with the offer rate of a select group of students who did not take a VCE VET
course but who have the same observable characteristics. In appendix E, we show that adding the
controls for the differences in the level of aspiration using the first-preference cut-off scores makes
very little difference to the estimated results. The clear interpretation of this result is that once we
control for the differences in the observable characteristics between those who do and those who do
not take VCE VET subjects (especially academic performance and intended field of study), their level
of aspiration is much the same as for the students who do not take VCE VET. Therefore, after
controlling for the differences in observable characteristics, any change in university entry score is
likely to have similar impacts on both groups’ chances of receiving a university offer.
Second, for VCE VET students who intend to go to university, the chances of receiving a university
offer are particularly sensitive to changes in entry scores because, on average, they are around the
middle of the entry-score distribution. For VCE VET students who are towards the bottom of the
academic distribution, small impacts in university entry scores are likely to have little effect on their
chances of receiving a university offer because their scores are too low to receive an offer, even
without the small impact. Similarly, for VCE VET students who are high up the academic distribution,
a small impact on their entry scores is likely to have only minor effects on their chances of receiving
an offer but may be more likely to affect their chances of receiving a more preferred offer.
The estimated results for the attainment of a preferred course, using Victorian Tertiary Admissions
Centre preference and course cut-off information, are also presented in table 9. As discussed above,

34 Does scored VET in Schools help or hinder access to higher education in Victoria?
the use of cut-off scores to identify the receipt of an offer should be considered at best as the
association between taking VCE VET courses and being ‘guaranteed’ a preferred offer. However, we
can take some comfort in the fact that the results generated using this measure are broadly
consistent with those using reported university offers from On Track. What we can assume from these
results is that taking a VCE VET course is only associated with a lower chance of receiving offers from
outside the three most preferred courses. Taking a VCE VET subject is associated with a seven-
percentage-point lower chance of attaining a top six preference, from a total of 12 preferences. The
effect on attaining a top and top three preferences is likely to be low because, on average, the
likelihood of VCE students attaining a high preference is low, regardless of whether or not they take a
VCE VET subject (around a 20% chance).
NCVER 35
Conclusions
VET in Schools in Australia was introduced in upper secondary school in the mid-1990s with the aim of
retaining less academic youth at school and preparing students for work and further training
(Ministerial Council on Education, Employment, Training and Youth Affairs 1999). However, to help
improve the status of students undertaking these courses and to provide them with opportunities to
pursue vocational options without closing off university pathways, the VET in Schools program has
been expanded to include upper-secondary subjects that count towards a national qualification and
university entry.19
In this study, we have taken a first step in evaluating the outcomes of VET courses that also
contribute to university entry by estimating the relationship between taking a VCE VET subject and
university access for those students who lodge a first preference to study a university course. Using a
rich dataset and propensity score matching to control for a range of contextual factors that may
explain academic performance, we find that, on average, taking a VCE VET subject is associated with
a 5% lower university entry score and a 12-percentage-point lower chance of receiving a university
offer. We find overall that the relationship between taking a VCE VET course and university entry
scores is robust to a range of modelling assumptions, but that the magnitude of the negative impacts
across courses varies somewhat. Using a decomposition method developed in this study, we estimate
that around 70% of the deficit in university entry scores of students who do VCE VET subjects is, on
average, because of the lower scores attained in their VCE VET subject (direct effect), with 30% due
to lower performance in their other subjects (indirect effect).
While we cannot rule out the possibility that the estimated relationship between taking a VCE VET
subject and university entry scores stems from a factor that is not fully controlled for, there are good
reasons for investigating the estimated relationship further. First, as demonstrated in this study, VCE
VET students are on average in the middle of the academic distribution, which means that small
impacts on university entry scores can potentially have large impacts on their attainment of a
university offer. Second, the fact that we can attribute most of the gap in university entry scores to
the lower performance of VCE VET students in their VCE VET subjects, rather than in their general
subjects, suggests that it is unlikely that the entire gap in entry scores is explained by uncontrolled
for factors. Third, evidence presented in this study points to a potential bias in the scaling applied to
scored VCE VET subjects; this is because a relatively high proportion of students in this study do not
apply for university study but, to attain credit towards a VET qualification, focus their efforts on VCE
VET subjects to the detriment of their performance in their other subjects. Under current scaling
arrangements in Victoria, for a given subject the scaling is conducted so that the average score is
equal to the student’s average score in their other subjects.
Given these findings, we suggest the following responses. First of all, the extent of any excessive
down-scaling of VCE VET subjects should be investigated further. If further investigation confirms our
findings, then a clear response should be to adjust the scaling of subjects to account for the
differences in motivation for specialisation that stems from courses being linked to the attainment of
19 Making VET in Schools more accessible for students of all academic backgrounds, including those who intend to go on
to university, is an objective of the Australian Government, as outlined in the New Framework for Vocational
Education in Schools (Ministerial Council on Education, Employment, Training and Youth Affairs 2001). To achieve this
end, the New Framework underlines the importance of course competency counting towards both the attainment of a
VET qualification and university entry scores.
36 Does scored VET in Schools help or hinder access to higher education in Victoria?
VET qualifications. One way to do this would be to scale subjects using only the scores of students
who intend to go to university, measured by whether or not they lodge an application for admission to
a university course prior to sitting their final exam. A second implication is that governments should
monitor and collect data on the time students spend in their VET training, including their off-campus
training. Not only will this assist in understanding the effect of training, but it will also help in
coordinating training across local school clusters where close-by options in TAFE institutes may be
inadequate. As a precaution, schools may help to reduce any burden on students in their final year of
study by encouraging them to take these subjects in Year 11.
Importantly, we stress that this study only examines the impacts of taking VCE VET subjects on direct
access to university. Other important outcomes from VCE VET programs, such as indirect access to
university (for example, by completing a diploma course); participation in post-school VET study;
retention in post-school study; and employment outcomes, are not investigated here, but should be
considered in any overall evaluation of these programs. Previous studies by Anlezark, Karmel and Ong
(2006), Lamb and Vickers (2006) and Polidano and Tabasso (2013) have demonstrated positive benefits
to school retention and initial labour market outcomes from unscored VET in Schools courses.
NCVER 37
References Anlezark, A, Karmel, T & Ong, K 2006, Have school vocational education and training programs been successful?
NCVER, Adelaide.
ABS (Australian Bureau of Statistics) 2006, Census of Population and Housing: Socio-economic Indexes for Areas (SEIFA), cat.no.2033.0.55.001, ABS, Canberra.
Australasian Curriculum, Assessment and Certification Authorities 2012, VET in senior secondary, certificates of education 2012, Board of Studies NSW, Sydney.
Barnett, K & Ryan, R 2005, ‘Vocational education and training in Australian schools: issues for practitioners’, International Education Journal, vol.5, no.5, pp.89—104.
Blundell, R & Costa Dias, M 2009, ‘Alternative approaches to evaluation in empirical microeconomics’, Journal of Human Resources, vol.44, no.3, pp.565—640.
Hanushek, E 1979, ‘Conceptual and empirical issues in the estimation of educational production functions’, The Journal of Human Resources, vol.14, no.3, pp.351—88.
Kolb, D 1984, Experiential learning: experience as a source of learning and development, Prentice Hall, New York.
Lamb, S & Vickers, M 2006, Variations in VET provision across Australian schools and their effects on student outcomes, LSAY research report no.48, Australian Council for Educational Research, Melbourne.
Ministerial Council on Employment, Education, Training and Youth Affairs 1999, The Adelaide declaration on national goals for schooling in the twenty-first century, MCEETYA, Canberra.
——2001, New framework for vocational education in schools: a comprehensive guide about pathways for young Australians in transition, MCEETYA, Canberra.
OECD (Organisation for Economic Co-operation and Development) 2000, From initial education to working life, making transitions work, OECD, Paris.
Pashler, H, McDaniel, M & Bjork, R 2008, ‘Learning styles: concepts and evidence’, Psychological Science in the Public Interest, vol.9, no.3, pp.106—16.
Polidano, C & Tabasso, D 2013, ‘Making it real: the benefits of workplace learning in upper-secondary vocational education and training courses’, Melbourne Institute Working Paper no. 31/13, University of Melbourne, Melbourne.
Polidano, C, Hanel, B & Buddelmeyer, H 2013, ‘Explaining the SES gap in school completion’, Education Economics, vol.21, no.3, pp.230—47.
Smith, J 2002, ‘Learning styles: fashion fad or lever for change? The application of learning style theory to inclusive curriculum delivery’, Innovations in Education and Teaching International, vol.39, no.1, pp.63—70.
Smith, J & Todd, P 2005, ‘Does matching overcome LaLonde's critique of nonexperimental estimates?’, Journal of Econometrics, vol.124, pp.305—53.
Todd, P & Wolpin, K 2003, ‘On the specification and estimation of the production function for cognitive achievement’, The Economic Journal, vol.113, pp.F3—F33.
Victorian Curriculum and Assessment Authority 2010, VCE VET assessment guide, VCAA, Melbourne.
——2011, An overview of VET in the VCE and VCAL, VCAA, Melbourne.
Victorian Tertiary Admissions Centre 2011, ABC of scaling, VTAC, Melbourne.

38 Does scored VET in Schools help or hinder access to higher education in Victoria?
Appendix A: Assessment Table A1 Prescribed performance criteria for work performance task
Criteria Performance level
1 (base) 2 3 (medium) 4 5 (high)
Application of knowledge underpinning work task
Displays an understanding of key knowledge and applies these in work functions
Displays a sound understanding of key knowledge and proficiently applies these in work functions
Demonstrates a thorough understanding of all knowledge and effectively applies these in work functions
Knowledge and use of communication, language and interpersonal skills
Displays an understanding and appropriate use of key industry and enterprise language
Uses communication and interpersonal skills appropriate for the audience and situation
Displays a sound understanding and correct use of key industry and enterprise language
Uses a range of communication and interpersonal skills appropriate for the audience and situation
Demonstrates a thorough understanding and correct use of key industry and enterprise language
Effectively selects and uses a range of communication and interpersonal skills appropriate for the audience and situation
Performance of techniques and processes
Performs key technical skills/procedures to the standard required in the workplace, including correct use of any equipment
Performs all technical skills/procedures to the standard required in the workplace, including correct use of any equipment
Effectively performs key technical skills/procedures to the standard required in the workplace, including correct use of any equipment
Understanding and application of work organisation
Demonstrates an awareness of the benefits of effective organisation. Describes the key stages in planning and organising a work function. Applies planning and organisational skills in the performance of work functions
Demonstrates a sound understanding of the benefits of effective organisation. Describes accurately the stages in planning and organising a work function. Applies sound planning and organisational skills in the performance of work functions
Demonstrates a thorough understanding of the benefits of effective organisation. Clearly and accurately explains the stages in planning and organising a work function. Independently applies planning and organisational skills in the performance of work functions
Performance of work tasks and need for supervision
Under normal workplace supervision, requires additional supervisor-initiated support to complete tasks safely in accordance with workplace requirements. Demonstrates competence in all units of all learning outcomes. Work performance complies with most enterprise work standards
Under normal workplace supervision, seeks limited additional supervisor support to complete tasks safely in accordance with workplace requirements. Demonstrates competence in all units of all learning outcomes. Work performance complies with all key enterprise work standards
Works independently under normal workplace supervision conditions to complete tasks safely in accordance with workplace requirements. Demonstrates competence in all units of all learning outcomes. Work performance complies with all enterprise work standards
Source: VCAA 2010.
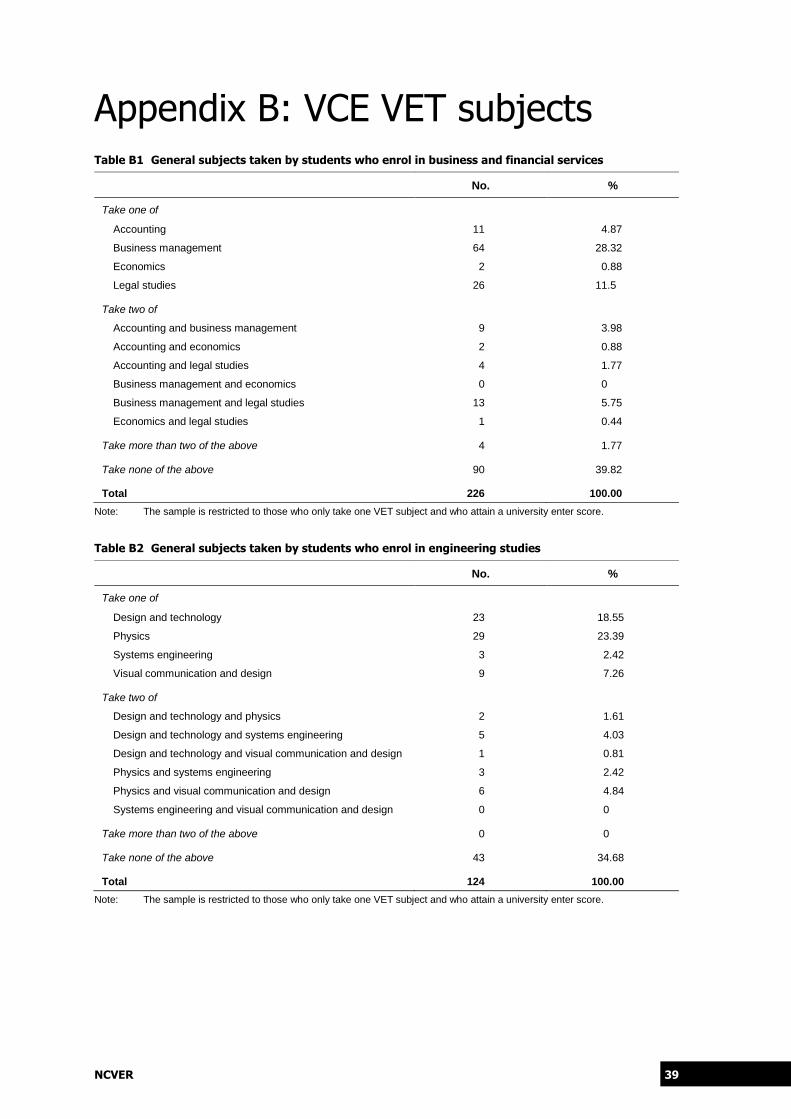
NCVER 39
Appendix B: VCE VET subjects Table B1 General subjects taken by students who enrol in business and financial services
No. %
Take one of
Accounting 11 4.87
Business management 64 28.32
Economics 2 0.88
Legal studies 26 11.5
Take two of
Accounting and business management 9 3.98
Accounting and economics 2 0.88
Accounting and legal studies 4 1.77
Business management and economics 0 0
Business management and legal studies 13 5.75
Economics and legal studies 1 0.44
Take more than two of the above 4 1.77
Take none of the above 90 39.82
Total 226 100.00
Note: The sample is restricted to those who only take one VET subject and who attain a university enter score.
Table B2 General subjects taken by students who enrol in engineering studies
No. %
Take one of
Design and technology 23 18.55
Physics 29 23.39
Systems engineering 3 2.42
Visual communication and design 9 7.26
Take two of
Design and technology and physics 2 1.61
Design and technology and systems engineering 5 4.03
Design and technology and visual communication and design 1 0.81
Physics and systems engineering 3 2.42
Physics and visual communication and design 6 4.84
Systems engineering and visual communication and design 0 0
Take more than two of the above 0 0
Take none of the above 43 34.68
Total 124 100.00
Note: The sample is restricted to those who only take one VET subject and who attain a university enter score.
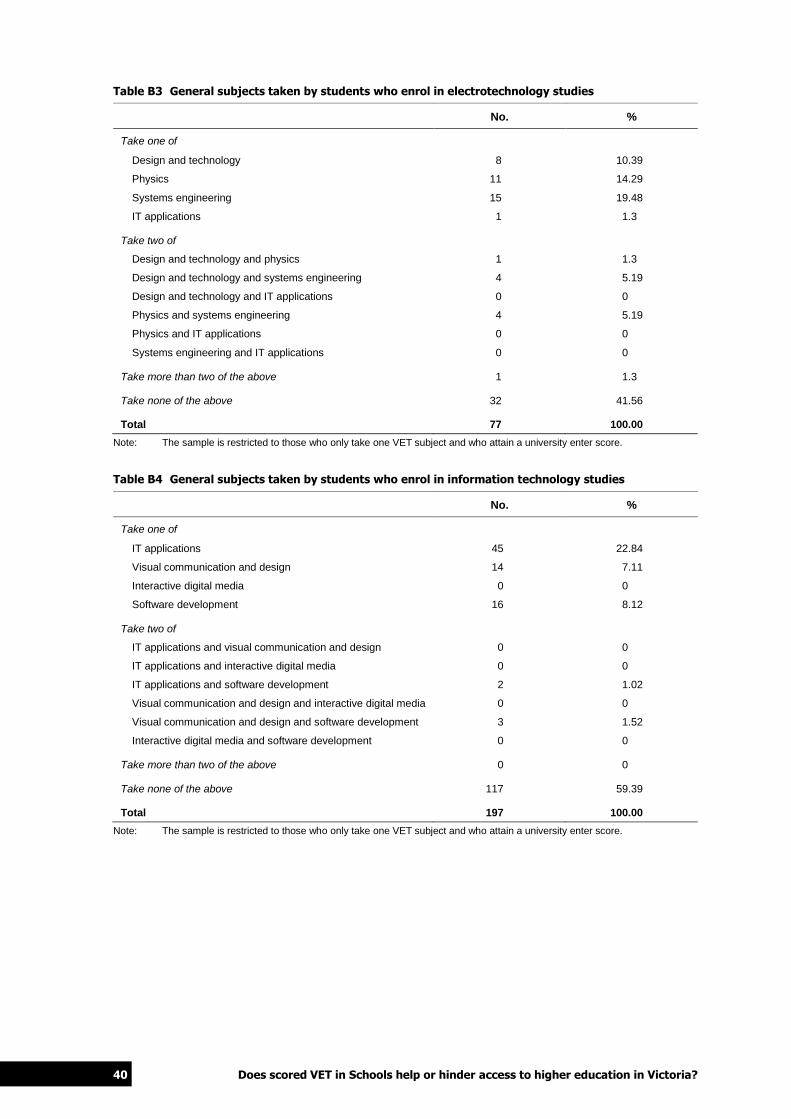
40 Does scored VET in Schools help or hinder access to higher education in Victoria?
Table B3 General subjects taken by students who enrol in electrotechnology studies
No. %
Take one of
Design and technology 8 10.39
Physics 11 14.29
Systems engineering 15 19.48
IT applications 1 1.3
Take two of
Design and technology and physics 1 1.3
Design and technology and systems engineering 4 5.19
Design and technology and IT applications 0 0
Physics and systems engineering 4 5.19
Physics and IT applications 0 0
Systems engineering and IT applications 0 0
Take more than two of the above 1 1.3
Take none of the above 32 41.56
Total 77 100.00
Note: The sample is restricted to those who only take one VET subject and who attain a university enter score.
Table B4 General subjects taken by students who enrol in information technology studies
No. %
Take one of
IT applications 45 22.84
Visual communication and design 14 7.11
Interactive digital media 0 0
Software development 16 8.12
Take two of
IT applications and visual communication and design 0 0
IT applications and interactive digital media 0 0
IT applications and software development 2 1.02
Visual communication and design and interactive digital media 0 0
Visual communication and design and software development 3 1.52
Interactive digital media and software development 0 0
Take more than two of the above 0 0
Take none of the above 117 59.39
Total 197 100.00
Note: The sample is restricted to those who only take one VET subject and who attain a university enter score.
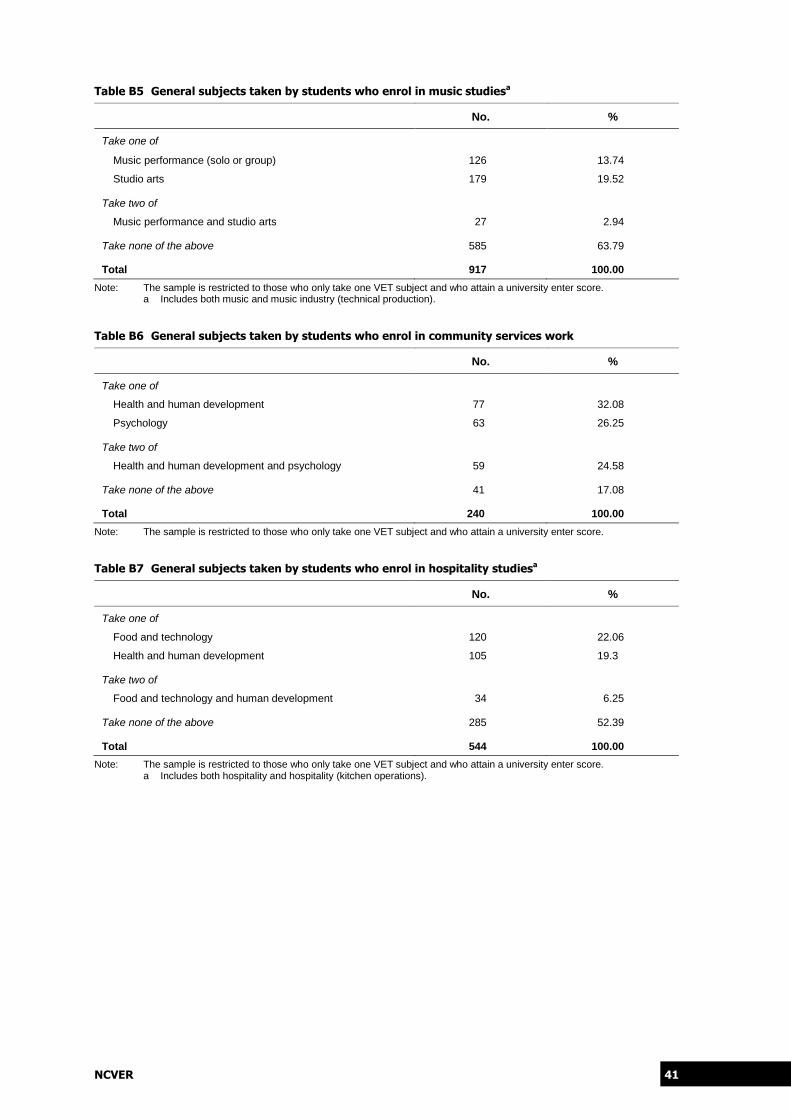
NCVER 41
Table B5 General subjects taken by students who enrol in music studiesa
No. %
Take one of
Music performance (solo or group) 126 13.74
Studio arts 179 19.52
Take two of
Music performance and studio arts 27 2.94
Take none of the above 585 63.79
Total 917 100.00
Note: The sample is restricted to those who only take one VET subject and who attain a university enter score. a Includes both music and music industry (technical production).
Table B6 General subjects taken by students who enrol in community services work
No. %
Take one of
Health and human development 77 32.08
Psychology 63 26.25
Take two of
Health and human development and psychology 59 24.58
Take none of the above 41 17.08
Total 240 100.00
Note: The sample is restricted to those who only take one VET subject and who attain a university enter score.
Table B7 General subjects taken by students who enrol in hospitality studiesa
No. %
Take one of
Food and technology 120 22.06
Health and human development 105 19.3
Take two of
Food and technology and human development 34 6.25
Take none of the above 285 52.39
Total 544 100.00
Note: The sample is restricted to those who only take one VET subject and who attain a university enter score. a Includes both hospitality and hospitality (kitchen operations).

42 Does scored VET in Schools help or hinder access to higher education in Victoria?
Table B8 Subjects taken by students who enrol in interactive digital media
No. %
Take one of
Visual communication and design 3 3.03
Studio arts 4 4.04
Media 5 5.05
Take two of
Visual communication and design and studio arts 1 1.01
Visual communication and design and media 1 1.01
Studio arts and media 1 1.01
Take more than two of the above 0 0
Take none of the above 84 84.85
Total 99 100.00
Note: The sample is restricted to those who only take one VET subject and who attain a university enter score.
Table B9 Subjects taken by students who enrol in sport and recreationa
No. %
Take one of
Physical education 177 34.3
Health and human development 70 13.57
Outdoor and environmental studies 15 2.91
Take two of
Physical education and health and human development 100 19.38
Physical education and outdoor and environmental studies 14 2.71
Health and human development and outdoor and environmental studies
7 1.36
Take more than two of the above 7 1.36
Take none of the above 126 24.42
Total 516 100.00
Note: The sample is restricted to those who only take one VET subject and who attain a university enter score. a Includes sport and outdoor recreation.
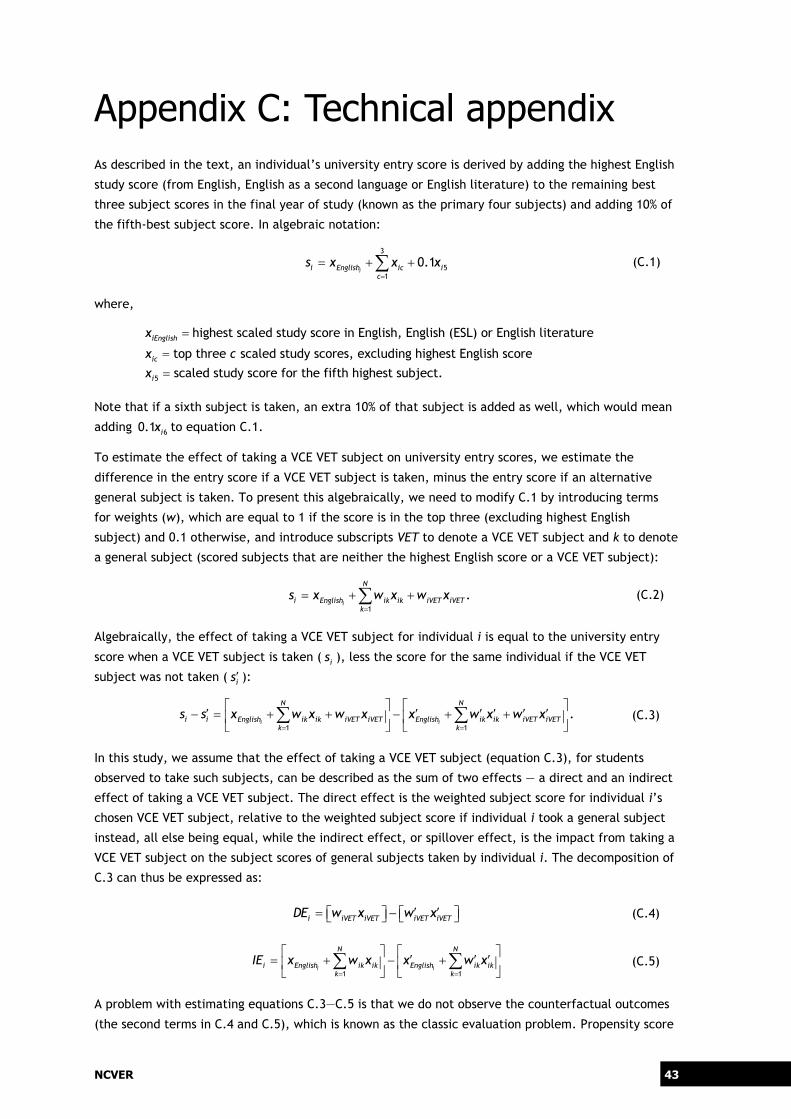
NCVER 43
Appendix C: Technical appendix
As described in the text, an individual’s university entry score is derived by adding the highest English
study score (from English, English as a second language or English literature) to the remaining best
three subject scores in the final year of study (known as the primary four subjects) and adding 10% of
the fifth-best subject score. In algebraic notation:
3
51
0.1ii English ic i
c
s x x x
(C.1)
where,
5
highest scaled study score in English, English (ESL) or English literature
top three scaled study scores, excluding highest English score
scaled study score for the fifth highest su
iEnglish
ic
i
x
x c
x bject.
Note that if a sixth subject is taken, an extra 10% of that subject is added as well, which would mean
adding 6
0.1i
x to equation C.1.
To estimate the effect of taking a VCE VET subject on university entry scores, we estimate the
difference in the entry score if a VCE VET subject is taken, minus the entry score if an alternative
general subject is taken. To present this algebraically, we need to modify C.1 by introducing terms
for weights (w), which are equal to 1 if the score is in the top three (excluding highest English
subject) and 0.1 otherwise, and introduce subscripts VET to denote a VCE VET subject and k to denote
a general subject (scored subjects that are neither the highest English score or a VCE VET subject):
1
.i
N
i English ik ik iVET iVETk
s x w x w x
(C.2)
Algebraically, the effect of taking a VCE VET subject for individual i is equal to the university entry
score when a VCE VET subject is taken (i
s ), less the score for the same individual if the VCE VET
subject was not taken (i
s ):
1 1
.i i
N N
i i English ik ik iVET iVET English ik ik iVET iVETk k
s s x w x w x x w x w x
(C.3)
In this study, we assume that the effect of taking a VCE VET subject (equation C.3), for students
observed to take such subjects, can be described as the sum of two effects — a direct and an indirect
effect of taking a VCE VET subject. The direct effect is the weighted subject score for individual i’s
chosen VCE VET subject, relative to the weighted subject score if individual i took a general subject
instead, all else being equal, while the indirect effect, or spillover effect, is the impact from taking a
VCE VET subject on the subject scores of general subjects taken by individual i. The decomposition of
C.3 can thus be expressed as:
i iVET iVET iVET iVETDE w x w x (C.4)
1 1
i i
N N
i English ik ik English ik ikk k
IE x w x x w x
(C.5)
A problem with estimating equations C.3—C.5 is that we do not observe the counterfactual outcomes
(the second terms in C.4 and C.5), which is known as the classic evaluation problem. Propensity score

44 Does scored VET in Schools help or hinder access to higher education in Victoria?
matching addresses this problem by constructing a counterfactual outcome using information from
‘matched’ or ‘like’ individuals who did not take a VET subject (control group). Before matching is
conducted, assumptions are needed on what the counterfactual outcomes for the control group are.
Ideally, we would limit the control group for each i treatment group member as individuals who take
the same subjects, except take another general subject instead of a VCE VET subject. However,
students have a great deal of flexibility in the choice of up to around 60 subjects (not including VCE
VET subjects), which means that such a control group limited on these grounds would be too small to
construct well-matched counterfactual outcomes. Instead, we have to make assumptions about the
counterfactual outcomes ik ik
w x and iVET iVET
w x . The standard assumption used in this study is that
individual i’s counterfactual outcome is the same for each subject and is equal to the average
weighted subject scores from j members of the control group:
1
CkN
jk jkk
iVET iVET ik ik jk jkC
k
w x
w x w x w xN
(C.6)
Because individuals from the control group generally take an extra general subject instead of a VET
subject, we distinguish between the number of general subjects taken by the control group ( C
kN ) from
the number of subjects taken by the treatment group ( T
kN ).
20 Substituting C.6 into the C.3, C.4 and
C.5 equations, the total, direct and indirect effects estimated in this study can be expressed as:
1 1
T Tk kN N
i i iEnglish ik ik iVET iVET jEnglish jk jk jk jkk k
s s x w x w x x w x w x
(C.7)
T T
i iVET iVET jk jkDE w x w x (C.8)
1 1
T Tk kN N
i iEnglish ik ik jEnglish jk jkk k
IE x w x x w x
(C.9)
Using average weighted scores across all general subjects from the control group to construct
counterfactual outcomes implicitly assumes that the students who take a VCE VET subject would, on
average, choose general subjects that are similar to those taken by the matched control group if VCE
VET subjects weren’t available.21
After matching, there are only minor differences in the choice of
general subjects between treatment and matched control group members (see table D2), which
validates the assumption of common general subjects between the two groups.
To estimate the total, direct and indirect effects of taking a VCE VET subject involves generating
three outcome variables using C.7, C.8 and C.9. The values of these outcome variables depend upon
whether or not individuals are in the treatment or control group. For example, for the direct effect
outcome, the values for the treatment group members are equal to the first term in equation C.8,
while for the control group members, the direct effect outcomes are equal to the second term. After
the three outcome variables are estimated, PSM is applied to select a matched control group for each
VCE VET student in the sample to construct the counterfactual outcomes. Refer to the methodology
section in the main text for information about the different PSM techniques used and how they derive
the counterfactual outcomes.
20 For simplicity of estimation, we assume that 1T C
k kN N , which it is in the vast majority of cases.
21 Or at least similar enough so that there are no differences in university entry scores between students who take VET
courses and those who do not due to differences in general courses taken.

NCVER 45
Appendix D: Probit results and balancing test results Table D1 Results from the probit model of participation in a VCE VET subject used in the propensity
score matching
All students Students that intend to start higher education
Marginal effect t-stat Marginal effect t-stat
Individual characteristics
Respondent is male 0.00211*** (2.59) 0.00116* (1.87)
Age of respondent -0.00107 (-1.42) -0.000684 (-1.22)
Indigenous status -0.00461 (-1.33) -0.00312 (-1.48)
Non-English speaking background 0.000547 (0.60) -0.000264 (-0.41)
Rural area -0.000922*** (-3.29) -0.000582*** (-2.69)
Unemployment rate in SLA -0.000173 (-1.12) -0.00000621 (-0.05)
NAPLAN numeracy score in Year 9 -0.00004*** (-4.60) -0.000024*** (-3.75)
NAPLAN reading score in Year 9 -0.0000154* (-1.92) -0.0000131** (-2.19)
Number of subjects taken in VCE 0.0165*** (7.68) 0.0104*** (6.45)
Taken VET subjects at unit 1 or 2 level 0.00275*** (15.72) 0.00174*** (11.36)
School-level factors
Non-government school 0.00585*** (6.02) 0.00352*** (4.97)
School average NAPLAN numeracy scorea -0.0000214 (-0.75) -0.000009 (-0.48)
School average NAPLAN numeracy scorea -0.0000648* (-1.80) -0.0000265 (-1.00)
School average % of students taking VCE VETa -0.0000009 (-0.01) 0.000120* (1.69)
Number of students in the school 0.0000353*** (7.59) 0.0000217*** (6.06)
Highest ANZSCO occupation among parents (ref. case: senior managers, qualified professionals)
Not stated 0.00357 (1.42) 0.00112 (0.68)
Not in paid work 0.00377 (1.53) 0.00405* (1.81)
Labourer 0.00374* (1.95) 0.00250* (1.66)
Tradesman/clerk 0.00140 (0.97) 0.00157 (1.36)
Other manager 0.00308** (2.22) 0.00181* (1.81)
Highest ASCED education level among parents (ref. case: Bachelor degree or above)
Not known 0.00122 (0.63) 0.00242 (1.39)
Year 9 or below -0.00256 (-1.43) -0.00163 (-1.29)
Year 10/11 -0.000156 (-0.11) -0.000468 (-0.46)
Year 12 -0.00104 (-0.79) -0.00132 (-1.54)
Certificates I–IV -0.000986 (-0.89) -0.000472 (-0.58)
Diploma -0.00165 (-1.53) -0.00102 (-1.33)
Intended field of education at university (ASCED code for VTAC first preference. ref. category: maths and science)b
Other natural and physical sciences -0.00636*** (-6.18) -0.00473*** (-8.54)
Computer science and it systems -0.00599*** (-6.16) -0.00635*** (-5.68)
Other IT 0.000694 (0.24) -0.00438*** (-5.88)
Engineering, manufacturing and technology 0.0194*** (3.05) -0.00323 (-1.38)
Maritime engineering and technology -0.00298 (-1.51) -0.00466*** (-7.32)
Other engineering and technology -0.00347** (-2.06) -0.00471*** (-8.42)
Architecture and building -0.00389** (-2.21) -0.00470*** (-8.09)
Agriculture; natural resources and environment -0.00429*** (-3.66) -0.00491*** (-7.38)
Other agriculture and related studies -0.00462*** (-3.40) -0.00479*** (-8.19)
Medical studies; pharmacy and nursing -0.00497 (-1.52) -0.00450*** (-8.69)

46 Does scored VET in Schools help or hinder access to higher education in Victoria?
All students Students that intend to start higher education
Marginal effect t-stat Marginal effect t-stat
Veterinary studies; public health and related -0.00528*** (-5.70) -0.00645*** (-5.03)
Other health -0.00471*** (-4.21) -0.00541*** (-6.69)
Teacher education; curriculum and education studies -0.00335*** (-2.58) -0.00511*** (-6.47)
Other education -0.000384 (-0.25) -0.00515*** (-4.90)
Accounting, business, marketing and related 0.000788 (0.22) -0.00438*** (-6.57)
Banking and finance and related -0.00139 (-1.16) -0.00604*** (-4.33)
Other management and commerce -0.00439 (-1.39) -0.00449*** (-8.64)
Behavioural science; law and related -0.00662*** (-7.55) -0.00553*** (-7.33)
Language and literature; economics; philosophy and related
-0.00314*** (-2.71) -0.00630*** (-4.61)
Sport and recreation -0.00115 (-0.47) -0.00454*** (-7.72)
Other society and culture 0.00208 (0.76) -0.00439*** (-6.03)
Arts; design; media studies and related -0.00566*** (-6.23) -0.00614*** (-5.65)
Other creative arts 0.00256 (1.58) -0.00534*** (-3.47)
Personal services 0.0158* (1.88) -0.00383*** (-2.79)
Observations 32 562 27 437
Notes: *** Significant at 1%, ** significant at 5%, *significant at 10%. a Excluding student’s own outcome. b These headings reflect the 2-digit ASCED fields of study based on the 4-digit headings that makeup the 2-digit categories. SLA = statistical local area.
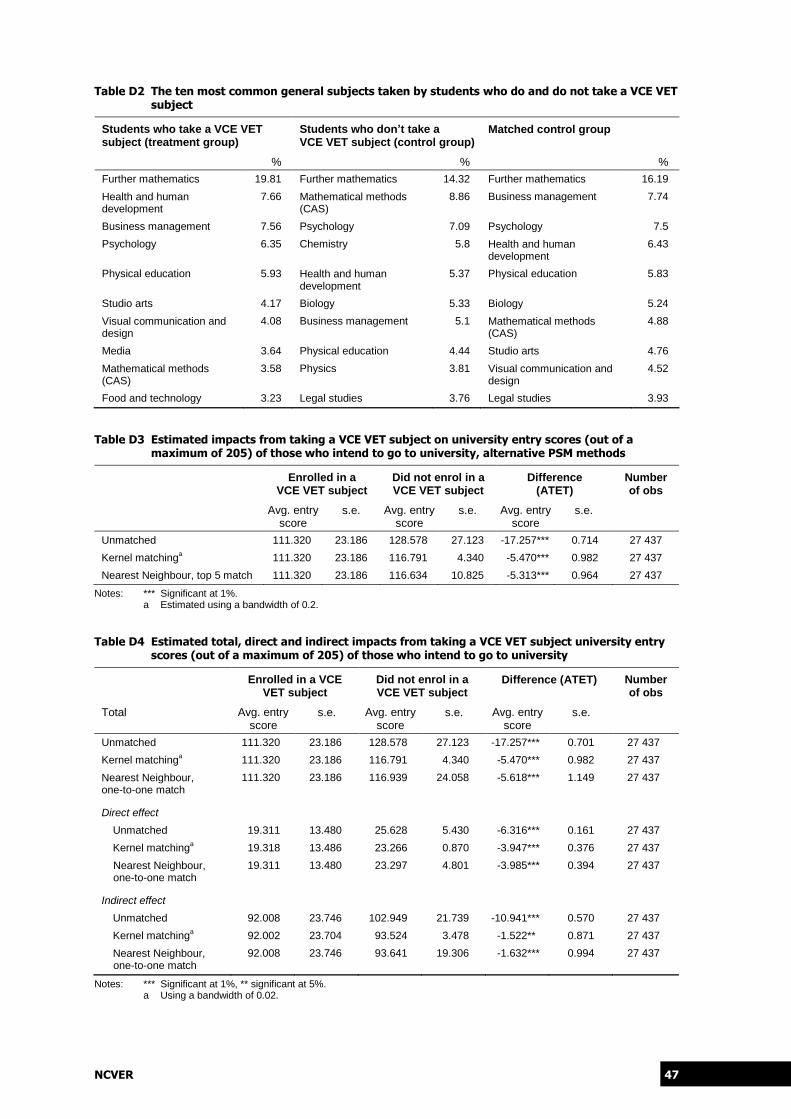
NCVER 47
Table D2 The ten most common general subjects taken by students who do and do not take a VCE VET subject
Students who take a VCE VET subject (treatment group)
Students who don’t take a VCE VET subject (control group)
Matched control group
% % %
Further mathematics 19.81 Further mathematics 14.32 Further mathematics 16.19
Health and human development
7.66 Mathematical methods (CAS)
8.86 Business management 7.74
Business management 7.56 Psychology 7.09 Psychology 7.5
Psychology 6.35 Chemistry 5.8 Health and human development
6.43
Physical education 5.93 Health and human development
5.37 Physical education 5.83
Studio arts 4.17 Biology 5.33 Biology 5.24
Visual communication and design
4.08 Business management 5.1 Mathematical methods (CAS)
4.88
Media 3.64 Physical education 4.44 Studio arts 4.76
Mathematical methods (CAS)
3.58 Physics 3.81 Visual communication and design
4.52
Food and technology 3.23 Legal studies 3.76 Legal studies 3.93
Table D3 Estimated impacts from taking a VCE VET subject on university entry scores (out of a maximum of 205) of those who intend to go to university, alternative PSM methods
Enrolled in a VCE VET subject
Did not enrol in a VCE VET subject
Difference (ATET)
Number of obs
Avg. entry score
s.e. Avg. entry score
s.e. Avg. entry score
s.e.
Unmatched 111.320 23.186 128.578 27.123 -17.257*** 0.714 27 437
Kernel matchinga 111.320 23.186 116.791 4.340 -5.470*** 0.982 27 437
Nearest Neighbour, top 5 match 111.320 23.186 116.634 10.825 -5.313*** 0.964 27 437
Notes: *** Significant at 1%. a Estimated using a bandwidth of 0.2.
Table D4 Estimated total, direct and indirect impacts from taking a VCE VET subject university entry scores (out of a maximum of 205) of those who intend to go to university
Enrolled in a VCE VET subject
Did not enrol in a VCE VET subject
Difference (ATET) Number of obs
Total Avg. entry score
s.e. Avg. entry score
s.e. Avg. entry score
s.e.
Unmatched 111.320 23.186 128.578 27.123 -17.257*** 0.701 27 437
Kernel matchinga 111.320 23.186 116.791 4.340 -5.470*** 0.982 27 437
Nearest Neighbour, one-to-one match
111.320 23.186 116.939 24.058 -5.618*** 1.149 27 437
Direct effect
Unmatched 19.311 13.480 25.628 5.430 -6.316*** 0.161 27 437
Kernel matchinga 19.318 13.486 23.266 0.870 -3.947*** 0.376 27 437
Nearest Neighbour, one-to-one match
19.311 13.480 23.297 4.801 -3.985*** 0.394 27 437
Indirect effect
Unmatched 92.008 23.746 102.949 21.739 -10.941*** 0.570 27 437
Kernel matchinga 92.002 23.704 93.524 3.478 -1.522** 0.871 27 437
Nearest Neighbour, one-to-one match
92.008 23.746 93.641 19.306 -1.632*** 0.994 27 437
Notes: *** Significant at 1%, ** significant at 5%. a Using a bandwidth of 0.02.

48 Does scored VET in Schools help or hinder access to higher education in Victoria?
Appendix E: Sensitivity analysis Table E1 Estimated impacts from taking a VCE VET subject on university entry scores (out of a
maximum of 205) under various assumptions
Enrolled in a VCE VET subject
Did not enrol in a VCE VET subject
Difference (ATET)
Number of obs
Avg. entry score
s.e. Avg. entry score
s.e. Avg. entry score
s.e.
Standard results (from table 6)
Unmatched 111.320 23.186 128.578 27.123 -17.257*** 0.714 27 437
Nearest Neighbour, one-to-one match
111.320 23.186 116.939 24.058 -5.618*** 1.149 27 437
Results with alternative assumptions
Alternative results 1 111.3205 23.187 117.825 23.630 -6.505*** 0.777 27 437
Alternative results 2 111.7403 22.809 116.220 22.857 -4.479*** 0.785 21 516
Alternative results 3 111.3205 23.187 117.267 23.181 -5.946*** 1.252 21 517
Alternative results 4 105.123 23.606 109.890 26.342 -4.766*** 1.078 32 562
Notes: *** Significant at 1%.
The results presented in the main body of the report (table 6) hinge on key assumptions in the
modelling. The most important assumption is that the counterfactual outcome (taking a VCE VET
subject) can be constructed from the outcomes from a matched control group who do not take a VCE
VET subject. Underlying this assumption is the notion that if they had not taken a VCE VET subject,
students would have chosen a set of subjects that are, on average, the same as those taken by the
matched control group. If, instead of choosing a VCE VET subject, students had chosen subjects that
were completely different from their matched control group counterparts, then the counterfactual
outcomes used here may not be valid. We test the robustness of our results by re-estimating the one-
to-one Nearest Neighbour results presented in table 6, but with different restrictions on the choice of
counterfactual outcomes. The alternative models and their added restrictions are:
Alternative 1: restrict each match (called exact matching) to the students who have exactly the same
university field of education preference (ASCED 2-digit) and also are from the same area (either
metropolitan or rural).
To the extent that there are regional differences in the availability of subjects, exact matching on
region will help to ensure that the subjects taken by the matched control group reflect the
alternatives foregone by the VCE VET student.
Alternative 2: include information in the standard one-to-one Nearest Neighbour matching on the
preferred subject’s required cut-off score from 2010. Generally speaking, the subject cut-off score
from the previous year is a good guide to the performance needed to attain entry in 2011.
While in the standard results we have controlled for differences in the field of study of the student’s
university course of preference, we have not controlled for differences in the level of university
subject aspirations. To the extent that students who aspire to a higher-ranked subject are more
ambitious and more committed to hard work, they may attain a higher aggregate study score. If
differences in aspiration level are related to taking a VCE VET subject, then such differences should
not be causally attributed to taking a VCE VET subject, but to the differences in the preferences of
the students who do and who do not take VCE VET subjects. This information is not included in the
standard results because there is a large number of preferences for which no cut-off could be found.

NCVER 49
Alternative 3: exclude all individuals from the counterfactual group who attended schools that did
not offer VCE VET in school subjects.
An important assumption underlying the analysis is that there are no uncontrolled school-level factors
that may explain the selection of a VCE VET subject and university entry scores. By excluding
observations from schools that do not offer VCE VET, we are removing observations that may have
different outcomes because of the nature of the schools these students attend.
Alternative 4: relax the sample restriction to those who lodge a first preference for a university
course.
From the results presented in table E1, we can conclude that the results presented in table 6 are
robust to the range of alternative assumptions underpinning the generation of counterfactual
outcomes. There is only a noticeable fall in impacts under alternative 2, but this may be because
there is a large number of missing observations under this scenario.

50 Does scored VET in Schools help or hinder access to higher education in Victoria?
NVETR Program funding
This work has been produced by NCVER under the National Vocational Education and Training
Research (NVETR) program, which is coordinated and managed by NCVER on behalf of the
Australian Government and state and territory governments. Funding is provided through the
Department of Industry.
The NVETR program is based on priorities approved by ministers with responsibility for vocational
education and training (VET). This research aims to improve policy and practice in the VET sector.
For further information about the program go to the NCVER website <http://www.ncver.edu.au>.
The author/project team was funded to undertake this research via a grant under the NVETR
Program. These grants are awarded to organisations through a competitive process, in which
NCVER does not participate.


National Centre for Vocational Education Research Ltd
Level 11, 33 King William Street, Adelaide, South Australia
PO Box 8288, Station Arcade, SA 5000 Australia
Telephone +61 8 8230 8400 Facsimile +61 8 8212 3436
Web www.ncver.edu.au Email [email protected]