Does openness reduce wage inequality in developing ... · Does openness reduce wage inequality in...
26
Does openness reduce wage inequality in developing countries? A Panel data Analysis By Farzana Munshi * Department of Economics School of Business, Economics and Law University of Gothenburg, Box 640, SE-40530, Sweden Revised January 2008 Abstract This paper provides panel data evidence on trade liberalization and wage inequality in Bangladesh. Using several standard econometric models, wage equations for skilled and unskilled workers in the formal manufacturing sector are estimated for the 1975-2002 period. The results, particularly the estimates from a dynamic fixed effects model, provide some weak evidence that openness contributes to a reduction in wage inequality between skilled and unskilled workers. The results also indicate that real wages of both unskilled and skilled workers increased during the period. Key words: Bangladesh; openness; wage inequality; panel data, panel unit root; dynamic model JEL codes: F14, F15, O15, C33 * Email: [email protected] . I wish to thank Arne Bigsten, Dick Durevall, Lennart Flood, Fredrik Sjöholm, Måns Söderbom, and Roger Wahlberg for very useful comments and suggestions. The usual disclaimer applies. 49
Transcript of Does openness reduce wage inequality in developing ... · Does openness reduce wage inequality in...

Does openness reduce wage inequality in developing countries? A Panel data Analysis
By
Farzana Munshi*
Department of Economics School of Business, Economics and Law
University of Gothenburg, Box 640, SE-40530, Sweden
Revised January 2008
Abstract
This paper provides panel data evidence on trade liberalization and wage inequality in
Bangladesh. Using several standard econometric models, wage equations for skilled and
unskilled workers in the formal manufacturing sector are estimated for the 1975-2002
period. The results, particularly the estimates from a dynamic fixed effects model, provide
some weak evidence that openness contributes to a reduction in wage inequality between
skilled and unskilled workers. The results also indicate that real wages of both unskilled
and skilled workers increased during the period.
Key words: Bangladesh; openness; wage inequality; panel data, panel unit root; dynamic
model
JEL codes: F14, F15, O15, C33
*Email: [email protected]. I wish to thank Arne Bigsten, Dick Durevall, Lennart Flood, Fredrik Sjöholm, Måns Söderbom, and Roger Wahlberg for very useful comments and suggestions. The usual disclaimer applies.
49

1. Introduction
The issues of wage inequality and openness to international trade have received
considerable attention in recent years. Many developing countries have undergone
significant liberalization of international trade since the 1980s. A widening wage gap
between skilled1 and unskilled workers has also been observed in many of these countries
(most notably in Latin American countries). A large number of studies have indicated that
the greater openness has contributed to this increase (see Williamson, 1997; Arbache et al.,
2004; Goldberg and Pavcnik, 2004). These findings have created an intense debate among
academics and policy makers, as trade theory predicts that greater openness is instead
expected to reduce wage inequality in developing countries.
The standard model used to investigate the effects of trade openness on wage
inequality is the Hecksher-Ohlin-Samuelson (H-O-S) model (Samuelson, 1953), which
under certain assumptions predicts a reduction in wage inequality in developing countries
via the “Stolper-Samuelson effect” (Stolper and Samuelson, 1941). This effect suggests that
for a given technology, trade and wages are linked through the changes in relative prices of
skilled and unskilled labor-intensive products. Hence, openness to trade leads to a reduction
in wage inequality in unskilled labor-intensive developing countries by raising the relative
price of unskilled labor-intensive products with a consequent increase in unskilled-labor
wages.
Empirical studies regarding the Stolper-Samuelson effect in the context of
developing countries, however, exhibit mixed results. While the East Asian experience in
1 The definition of skilled labor includes all professional and technical workers, managers, and craftsmen with advanced education, substantial training, or work experience (Wood, 1994).
50

the 1960s and 1970s is in line with this prediction (Wood, 1997), studies on Latin
American countries, on the contrary, show that openness contributes to an increase in wage
inequality (Beyer et al., 1999, in Chile; Galiani and Sanguinetti, 2003, in Argentina;
Attanasio et al., 2004, in Colombia). Most recent evidence for India (Mishra and Kumar,
2005) and Kenya (Bigsten and Durevall, 2006), however, suggests that openness
contributes to a reduction in wage inequality.
The divergent findings might be due to several reasons. Firstly, methodology and
the studied time period differ among studies. Secondly, the initial levels of inequality and
factor abundance, both important factors affecting wage inequality, vary among countries.
For example, compared to the natural resource abundance in many Latin American
countries, most Asian countries have a relative abundance of unskilled labor. Therefore, the
impact of increased trade on wage inequality may differ between countries in Latin
America and Asia. Finally, some of the assumptions on which the H-O-S model is based
are often too restrictive for developing countries. For example, due to lack of labor
reallocation across sectors, trade openness may affect wage inequality through changes in
wages. However, if wages are not as flexible as the H-O-S model requires, then changes in
labor demand may increase transitional unemployment or increase the size of the informal
sector. There is both theoretical (Goldberg and Pavcnik, 2003) and empirical (Attanasio et
al., 2004) evidence that greater openness often causes the informal sector, which constitutes
a greater share of the labor force in many developing countries, to grow. Since workers are
paid less in the informal sector, an increase in the size of this sector may keep real wages
down and thus raise the overall wage gap between skilled and unskilled workers.
51

This paper adds to the literature on openness and wage inequality2 by presenting an
empirical analysis using panel data from the Bangladesh manufacturing sector. Bangladesh
has a relative abundance of unskilled workers and has been pursuing trade liberalization
since the 1980s. Hence it provides an interesting opportunity to analyze the issue of
openness and wage inequality. A few studies on Bangladesh do exist. For example, based
on a single industry time series analysis, Durevall and Munshi (2008) find that openness
increases real wage for both skilled and unskilled workers while it does not affect skilled
and unskilled wages differently.3 The objective of this paper is to further investigate this
issue by using panel data – an approach that produces more precise estimates and to a
greater extent takes care of omitted variable biases. In this paper, four standard panel data
models are estimated. The results provide some weak evidence that openness to trade
reduces wage inequality in Bangladesh. The results also indicate that openness contributes
to an increase in both skilled and unskilled wages. These results are robust to both the
inclusion of a proxy of human capital and industry-specific prices as additional control
variables.
The remainder of the paper is organized as follows. Section 2 provides an
overview of Bangladesh trade policy and labor market issues. Section 3 describes the
econometric modeling and the data used in the paper. Section 4 presents the empirical
analyses and results, and Section 5 concludes the paper.
2 As in many other studies, wage inequality here refers to the wage gap between skilled and unskilled workers. 3 Using a general equilibrium approach, Mujeri and Khondker (2002) find increasing wage inequality in Bangladesh; however, they suggest that skill-biased technical change and changes in factor endowments were more important than trade in explaining the wage inequality in their study.
52

2. Overview of Bangladesh Trade Policy and Labor Market Issues
This section first provides an overview of the trade policy issues in Bangladesh since
independence. Then it briefly discusses the issues related to the labor market.
From its first year of independence in 1971, Bangladesh followed an import
substitution industrialization strategy for a decade. Trade policies were based on high tariffs
and quantitative restrictions on imports, resulting in an anti-export bias. The trade
liberalization process started in the mid-1980s, with the primary objective to create a
neutral trade regime by reducing and ultimately eliminating the anti-export bias.
Liberalization of the import regime was accomplished primarily through the removal of
import bans and quantitative restrictions. To increase the competitiveness of domestic
industries, customs duty was greatly reduced for raw materials and capital goods used as
inputs for manufacturing exports, while it was kept high on final goods. Overall, the
customs duty rate was reduced from 350% in 1991 to 37.5% in 2000 (Trade Policy Review,
2000). To increase transparency, the Harmonized System was introduced in July 1988, and
the multiple-rate sales tax was replaced by a 15% value-added tax in 1992 (Trade Policy
Review, 1992). Following this, the number of four digit codes subject to quantitative
restrictions was reduced from 550 (26%) in 1987 to 124 (10%) in 2000.
Export promotion was also one of the main objectives of Bangladesh trade policy
reform. Several measures were undertaken in order to encourage exports, including new
incentives and facilities for the exporters, duty and tax free imports of inputs for exporters,
creation of the Export Processing Zones, and most importantly, improvement of export
policy administration. These reforms helped expand the export base mainly by increasing
non-traditional exports; the remarkable success of the ready-made garments industry is an
53

example (Bhattacharya et al., 2002). To increase international competitiveness, a series of
other reform measures were undertaken: financial sector reform, privatization, removal of
restrictions on foreign direct investment, and exchange rate liberalization, just to name a
few.
Like in most developing countries, Bangladesh trade reform was mostly
concentrated in the manufacturing sector, which by contributing around 70 percent of
export revenue is the most important foreign-exchange earner. Jute, Cotton textile, Match,
Engineering, and Mustard oil are the five major industries in the manufacturing sector, and
are included in this study. These industries are mostly unskilled labor-intensive, tradable,
and dependent on imported raw materials. At the time of independence, they were all in the
public sector, but then underwent wide-scale reform including tariff reductions and
privatization. Competition has increased in the industries, and the effective rates of
protection have been reduced significantly. For example, the rates for Jute declined from
64.40% in 1993 to 26.80% in 2000 (Trade Policy Review, 2000). The rationalization of the
tariff structure allowed the industries to import raw materials and capital machineries at low
duty rates.
The Bangladesh labor market comprises formal and informal markets. The formal
sector workers constitute less than 20% of the total labor force and are mainly employed in
the manufacturing sector. Wage setting is regulated by the government and has not changed
much since independence. Wages in the public sector are determined and raised
periodically by the ad-hoc National Pay Commission. Wages in the formal private sector
are determined by collective bargaining, using government-determined wages as a
reference point. In sectors where trade unions do not exist or collective bargaining fail due
54

to weak trade unions, minimum wages are determined based on the recommendation of the
Minimum Wage Board. However, lack of organizational structure and legislative
provisions are important reasons why many private sector employees are still earning less
than minimum wage (Nordås, 2004). There have nevertheless been many interventions in
the labor market; market forces are likely to have played an important role in determining
the wages during the period of study.
3. Econometric Model and Data
This section first outlines the empirical model, and then describes the data and explains the
choice of the explanatory variables used in the analysis. Finally it reports the results of the
non-stationarity testing of the variables using a panel unit root test and the Augmented
Dickey-Fuller (ADF) test.
To test for the impact of greater openness on the relative wages of skilled and
unskilled workers, wage equations for skilled and unskilled workers are estimated
separately. The choice of variables is based on economic theory and data availability. The
generalized version of the model is as follows, where all the variables are measured in
logarithms:
( )
( )2
1
4321,10
4321,10
itttitttiit
itttitttiit
Dhumcaprpriceopenwuswus
uDhumcaprpriceopenwsws
ηβββββ
ααααα
++++++=
++++++=
−
−
.
In the above equations, represents the wages of skilled workers, the
wages of unskilled workers, where indexes individual industry in a cross section and t
indexes time. The variables and denote the one period lag of the skilled
itws itwus
i
1, −tiws 1, −tiwus
55

and unskilled wages, respectively. In both equations, and denote the level of
openness and the relative price, respectively, and denotes a measure of human
capital. The variable denotes a time trend, whereas and
topen itrprice
thumcap
tD itu itη are two disturbance
terms for both equations. As usual, 0α and 0β are intercept terms. To test whether greater
openness contributes to a reduction in wage inequality, we test whether openness increases
real wages for unskilled workers relative to wages for skilled workers. If it does, one would
expect that 022 >−αβ . The coefficients of interest are therefore in the short run 2α and
2β and in the long run ( )12 1/ αα − and ( )12 1/ ββ − .
3.1 Data and Variable Description
The data used in this paper is a balanced panel created on real wages of skilled and
unskilled workers4 of all organized plants5 in five manufacturing industries (Jute, Cotton
textile, Match, Engineering, and Mustard oil) with 28 time series observations covering the
1975-2002 period. Real wages are measured in constant 1996 prices using the GDP
deflator. As the choice of variables is often restricted due to a lack of available data, we
have openness, industry-specific relative prices, and human capital as explanatory variables
in our analysis. Although it would have been desirable to also include measures of
productivity and capital labor ratio as explanatory variables, the lack of data availability
4 Following Wood (1994) and the definition used by Bangladesh Bureau of Statistics, skilled workers are in this paper those who possess both professional training and skills to operate a machine, received either on-the-job or from any formal or informal training institute, and basic knowledge of repair, maintenance, and cleaning of the machine. An unskilled worker, on the other hand, does not have such professional training or skills and works as a helper to skilled workers. 5 Organized plants are those that employ ten or more workers from the formal sector. Plant-level data, however, was not available.
56

restricts our ambition to do so. In the absence of long time series data on tariffs and
quantitative restrictions, we use a price-based measure of openness, hereafter , to
examine the changes in the degree of protection. This measure is defined as the ratio of the
US manufacturing price index (converted to Bangladesh currency using the official
exchange rate) to the Bangladesh manufacturing price index. Import substitution policy
kept manufacturing prices high in Bangladesh for more than a decade, so reduced
protection is expected to result in an increase in the ratio. It would have been more
appropriate to compare domestic manufacturing prices with world market prices, but in the
absence of such data we use the US manufacturing price index since the US is the major
trading partner of Bangladesh. A similar measure is used by Athukorala and Rajapatirana
(2000) for Sri Lanka, Bigsten and Durevall (2006) for Kenya, and Durevall and Munshi
(2008) for Bangladesh.
open
6
According to the H-O-S assumption of perfect factor mobility, opening up leads to
changes in wage inequality via changes in relative prices,7 regardless of industries being
import-competing or export-competing. However, as the specific factor model suggests, the
implication is different for import-competing and export-competing industries, at least in
the short run when factors are not mobile. With reduced protection, prices should fall in
import-competing industries and rise in export-competing industries. Since the industries in
our study are mainly import-competing and likely to have a comparative advantage in
6 In addition to this price-based measure of openness, Durevall and Munshi (2008) use three other measures of openness: the ratio of export plus import to GDP, the ratio of aggregate export to GDP, and the ratio of imports of consumer goods to aggregate consumption. However, no statistically significant differences among their impacts on skilled and unskilled wages are found. 7 Beyer et al. (1999) find similar evidence for this in Chile. However, Hanson and Harrison (1999) find only weak correlation between price changes and changes in trade policy for Mexico.
57

unskilled labor-intensive goods, reduced protection is expected to have a negative impact
on prices. The industry-specific relative prices are measured as the price of output produced
by each industry divided by the GDP deflator.
Generally, increases in human capital are expected to lead to higher real wages.
Depending on the level of education and/or experience, human capital can have different
impacts on the relative demand for skilled/unskilled workers. For example, the returns to
post-secondary education play an important role compared to primary and secondary
education in explaining wage inequality in some studies (see Beyer et al., 1999, for Chile;
Attanasio et al., 2004, for Colombia). On the other hand, greater openness increased the
demand for unskilled workers with basic general education compared to those with
specialized skills in Korea and Taiwan in the 1960s and in Singapore in the 1970s, resulting
in reduced wage inequality (Wood, 1997). However, in our dataset, the main distinction
between skilled and unskilled workers is the years of on-the-job experience. While the
requirement to be an unskilled worker (apprentice, helper) is basic general education, an
unskilled worker could be promoted to a skilled worker (junior operator, operator, and
senior operator) according to his years of experience. Given that a good proxy for
measuring the stock of human capital is not available, we use the secondary school
enrolment ratio. This proxy, however, does not capture the years of on-the-job experience,
and can therefore only be regarded as a partial measure of human capital. In any case, the
inclusion of this variable (human capital) serves as a robustness check of the present
analysis of the impact of openness on the wage gap between skilled and unskilled workers.
58

Table 1 reports the descriptive statistics of the variables used in the analysis. The variables
are plotted in Figures 1-4.
>>> Table 1 here
Figure 1 depicts the real wage of skilled and unskilled workers in the five industries.
Both series exhibit low growth in all five until the beginning of the liberalization process in
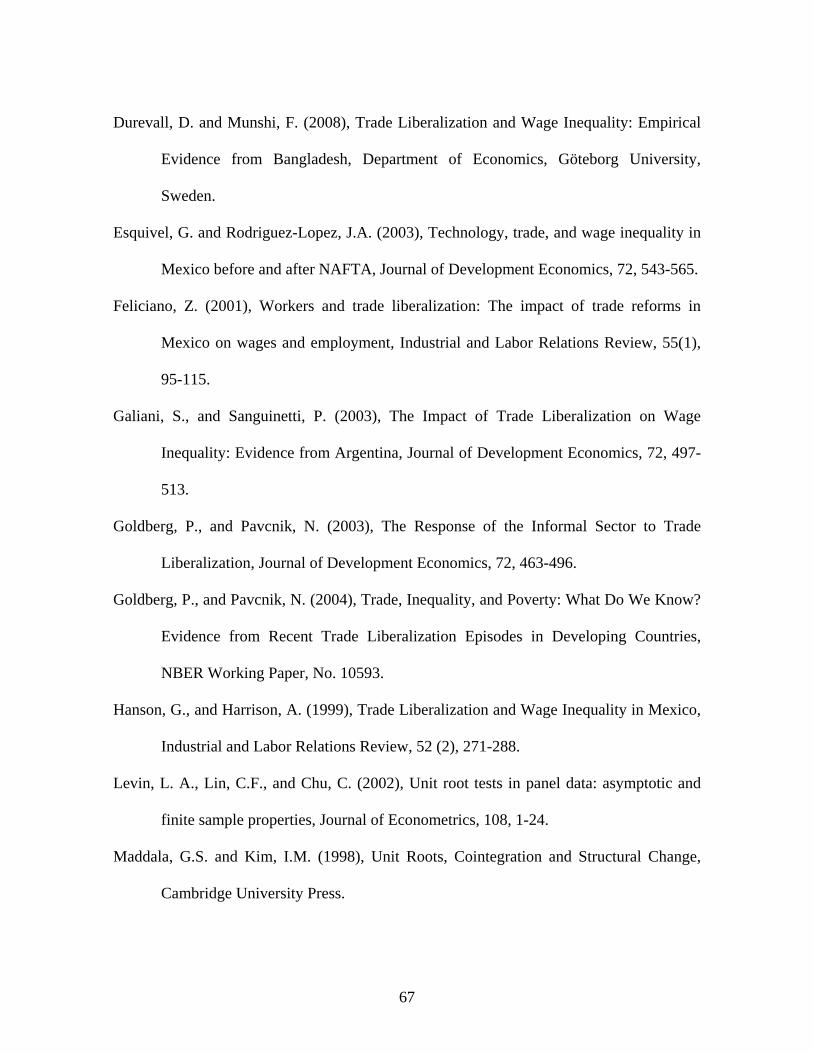
the mid-1980s when growth started to increase. As evident in Figure 2, the openness
variable too shows little growth until the mid-1980s and an increasing trend thereafter,
especially in the late 1990s. The relative prices are displayed in Figure 3; all sectors except
Mustard oil show high variability throughout the period. The human capital proxy, depicted
in Figure 4, shows an increasing trend starting in 1977.
>>> Figure 1 here
>>> Figure 2 here
>>> Figure 3 here
>>> Figure 4 here
59

3.2 Unit root test
Given that most of the variables described above exhibit trends, we formally test for the
presence of unit roots before proceeding with the econometric analysis. The panel unit root
test8 designed by Levin, Lin, and Chu (2002), the Levin-Lin test, is used to test for
stationarity of the three panel data series, i.e., log of skilled wage, log of unskilled wage,
and log of relative price. For the two variables that lack cross-section observations, i.e., log
of openness and log of human capital proxy, the ADF test is used instead. The Levin–Lin
test is designed for balanced panels and works very well even in panels with relatively
small dimensions, and hence it is appropriate in our case. Furthermore, it allows for
individual effects, time effects, and a time trend, and evaluates the null hypothesis that each
time series has unit root against the alternative hypothesis that each time series is
stationary. To allow for serial correlation, lags of the dependent variable are introduced and
hence the model may be viewed as an ADF test. The test statistics for the Levin-Lin panel
unit root test are reported in Table 2.
>>> Table 2 here
Out of the three panel variables, the test statistics are significant for two (log of
unskilled wages and log of relative price) at the 1% level, rejecting the null hypothesis of
unit root. Log of skilled wages is significant at the 5% level. It is therefore evident that all
8 The conventional unit root tests such as the Augmented Dickey-Fuller test or Phillips-Peron tests have low power, especially if the sample size is small (Maddala and Kim 1998). Panel data unit root test, on the other hand, is able to increase the power of unit root tests by combining time series with cross-section observations. See for example Breitung and Pesaran (2005) for a review of several methods to test panel unit root.
60

three variables are stationary around a trend. For log of openness and log of human capital,
we apply the ADF test with an intercept and a deterministic trend – see Table 3 for results.
>>> Table 3 here
The test statistics indicate that the log of openness series is significant at the 5% level,
whereas log of human capital is not significant. However, since the estimated root for the
latter is only 0.60, we proceed under the assumption that there is no unit root in any of the
series.
4. Empirical Analysis
There are several econometric models for analyzing panel data and, depending on the
assumptions about unobserved effects, all have relative advantages and disadvantages. In
this paper, four standard models are used to estimate the wage equations: the ordinary least
square method (OLS), the fixed effects method (FE), the dynamic FE method and the two-
stage least square method (2SLS).
We first estimate a simple non-dynamic specification of equations (1) and (2) with
OLS and FE, where log of skilled wages and log of unskilled wages are regressed on only
the key explanatory variable openness and on a time trend. We then estimate a simple
dynamic specification of both equations with the dynamic FE and 2SLS methods, where a
one period lag of the dependent variable is added as an explanatory variable, together with
openness and a time trend. The results are reported in Table 4. Finally we estimate the non-
dynamic and the dynamic specifications of both equations by adding two other explanatory
variables: log of relative price and log of human capital. The results are reported in Table 5.
61

Tables 4 and 5 present the pooled OLS, as a baseline model, in Column 2 and
Column 6 for skilled and unskilled workers respectively. The coefficients for most of the
variables are insignificant, probably due to omitted industry fixed effects. The FE estimator
takes care of this problem by eliminating the unobserved heterogeneity across industries
provided that the omitted variables are time-invariant.
Tables 4 and 5 report the non-dynamic FE estimates in Column 3 and Column 7 for
skilled and unskilled workers respectively. Here openness does not have a significant effect
on skilled and unskilled wages in the base specifications (i.e. without additional control
variables) (see Table 4). However, when adding relative price and human capital in the
model (Table 5), the coefficient for openness in the unskilled wage equation becomes
positive and statistically significant (Table 5, Column 7).
>>> Table 4 here
>>> Table 5 here
As current wage levels often depend on past wage levels, one would prefer to
estimate a dynamic model by adding a lagged dependent variable as an explanatory
variable. In that case the strict exogeneity assumption is violated, and estimating a dynamic
FE model may produce biased estimates due to the presence of correlation between the
lagged dependent variable and the disturbance term. However, in a panel with a large time
series dimension (a large T), as in our case, the bias is likely to be small (see Bond, 2002),
and hence we estimate a dynamic FE model after all. Nevertheless, as a robustness check,
we use the instrumental variable approach and estimate the model with the 2SLS method to
62

account for the endogeneity of the lagged dependent variable.9 It is difficult to find suitable
instruments, but we use the lagged dependent variable as an instrument for the differenced
dependent variable. The results from the dynamic FE and the 2SLS methods are presented
in Tables 4 and 5 (Columns 4 and 5 for skilled workers and Columns 8 and 9 for unskilled
workers). As observed, the large standard errors for the openness coefficient from the
2SLS estimation indicate that they are less precise than the dynamic FE estimates. This
might be due to using weak instruments. We therefore prefer the dynamic FE estimates and
hence focus on those results (Tables 4 and 5, Columns 4 and 8) in the following
discussions.
In both the basic and the general specifications, respectively in Table 4 and Table
5, we find that the coefficients for the lagged dependent variables are large and statistically
significant (Column 4 and Column 8 for skilled and unskilled workers respectively). This
suggests that the dynamics of the equations are important. The coefficients for the openness
variable are, as expected, significant and positive for both skilled and unskilled wages in
both the basic and the general specifications of the model. Importantly, the increase is
larger in magnitude for unskilled workers than for skilled workers; the coefficients are, for
instance, 0.278 (Table 5, Column 8) and 0.176 (Table 5, Column 4) for unskilled and
skilled wages respectively. The wage increase is even larger when we calculate the same
openness coefficients for a steady state of the model: 0.562 and 0.315, respectively. This
implies that a 1% increase in openness increases unskilled wages by about 0.3% in the short
9 The difference GMM by Arellano and Bond (1991) was also used, employing second lag of the dependent variable as an instrument for the differenced dependent variable. The estimator, however, provided less precise estimates and hence the results are not reported here.
63

run and by about 0.6% in the long run. For skilled workers, the short- and long-run
increases are about 0.2% and 0.3%, respectively. However, based on a Z test we can not
reject the null hypothesis of equality of the openness coefficients from the dynamic FE
specification as reported in Columns 4 and 8 of Table 5 (p-value >0.10), implying that the
larger increase in unskilled than skilled wages is not statistically significant at conventional
levels.
The coefficients for relative prices are insignificant (Table 5, Columns 4 and 8),
which may suggest that openness has increased real wages through channels other than
price changes. The coefficient for the human capital proxy is found to be statistically
insignificant for skilled wages but significant for unskilled wages. We do not have a good
explanation for this. It should be mentioned here that the measure of human capital used in
our analysis is partial and does not fully capture the stock of human capital. However, the
main results for the openness coefficient remain unchanged with the inclusion of the
human capital and relative price variables (Table 5, Columns 4 and 8), which indicates that
our main finding regarding the impact of openness on real wage of skilled and unskilled
workers is robust.
5. Conclusions
The findings in this paper, based on a panel data analysis, indicate some weak evidence that
trade openness contributes to a reduction in wage inequality between skilled and unskilled
workers in the Bangladesh manufacturing sector. The results also suggest that wages for
both skilled and unskilled workers increase, possibly caused by the overall productivity
increase resulting from the liberalization-induced increase in competition. The results are
64

broadly consistent with previous findings in Asia and Africa (Durevall and Munshi, 2008;
Bigsten and Durevall, 2006; Mishra and Kumar, 2005), but different from those in many
other developing countries. Regarding the previously mentioned Latin American
experience, increased wage inequality was mostly due to an increased demand for skilled
labor (Esquivel and Rodriguez-Lopez, 2003; Sanchez-Paramo and Schady, 2003; Attanasio
et al., 2004). This is in contrast to the East Asian experience of increased demand for
unskilled workers which contributed to a reduction in wage inequality (Wood, 1997). The
reduction in wage inequality in the Bangladesh manufacturing sector was possibly due to a
similar increased demand for unskilled workers. The increased inflow of foreign direct
investments (FDI) in the 1990s may also have influenced the wage gap reduction in our
case. However, we could not test this as the inclusion of FDI inflow as an explanatory
variable would substantially reduce our estimation sample.
Given their potential role in explaining skilled-unskilled wage inequality, the
incorporation of other issues into the analysis, such as informal sector, technological
progress, inflow of FDI, and extent of privatization, could provide additional insight.
However, lack of data restricts our ambition to analyze their effects. Future research should
focus on the above issues, given that more and more countries are pursuing trade
liberalization.
References
Arbache, J.S., Dickerson, S., and Green, F. (2004), Trade Liberalization and Wages in
Developing Countries, Economic Journal 114, F73-F96.
65

Arellano, M. and Bond, S. (1991), Some tests of specification for panel data: Monte Carlo
evidence and an application to employment equations, Review of Economic
Studies, 58, 277-297.
Athukorala, P-C. and Rajapatirana, S. (2000), Liberalization and Industrial Transformation:
Lessons from the Sri Lankan Experience, Economic Development and Cultural
Change, 48(3), 543-72.
Attanasio, O., Goldberg, P. K., Pavcnik, N. (2004), Trade Reforms and Wage Inequality in
Colombia, Journal of Development Economics, 74, 331-366
Beyer, H., Rojas, P. and Vergara, R. (1999), Trade Liberalization and Wage Inequality,
Journal of Development Economics, 59, 103-123.
Bhattacharya, D., Rahman, M., and Raihan, A. (2002), Contribution of the RMG Sector to
the Bangladesh Economy, Paper 50, Centre for Policy Dialogue, Dhaka, October.
Bigsten, A. and Durevall, D. (2006), Openness and Wage Inequality in Kenya: 1964-2000,
World Development, 34(3), 465-480.
Breitung, J. and Pesaran, M. (2005), Unit Roots and Cointegration in Panels, Cambridge
Working Papers in Economics 0528, Faculty of Economics, University of
Cambridge.
Bond, Stephen (2002), Dynamic Panel Data Models: A Guide to Micro Data Methods and
Practice, cemmap working paper CWP09/02, The Institute for Fiscal Studies, UCL,
UK
Currie, J. and Harrison, A. (1997), Trade Reform and Labor Market Adjustment In
Morocco, Journal of Labor economics, 15, S44-71.
66
Durevall, D. and Munshi, F. (2008), Trade Liberalization and Wage Inequality: Empirical
Evidence from Bangladesh, Department of Economics, Göteborg University,
Sweden.
Esquivel, G. and Rodriguez-Lopez, J.A. (2003), Technology, trade, and wage inequality in
Mexico before and after NAFTA, Journal of Development Economics, 72, 543-565.
Feliciano, Z. (2001), Workers and trade liberalization: The impact of trade reforms in
Mexico on wages and employment, Industrial and Labor Relations Review, 55(1),
95-115.
Galiani, S., and Sanguinetti, P. (2003), The Impact of Trade Liberalization on Wage
Inequality: Evidence from Argentina, Journal of Development Economics, 72, 497-
513.
Goldberg, P., and Pavcnik, N. (2003), The Response of the Informal Sector to Trade
Liberalization, Journal of Development Economics, 72, 463-496.
Goldberg, P., and Pavcnik, N. (2004), Trade, Inequality, and Poverty: What Do We Know?
Evidence from Recent Trade Liberalization Episodes in Developing Countries,
NBER Working Paper, No. 10593.
Hanson, G., and Harrison, A. (1999), Trade Liberalization and Wage Inequality in Mexico,
Industrial and Labor Relations Review, 52 (2), 271-288.
Levin, L. A., Lin, C.F., and Chu, C. (2002), Unit root tests in panel data: asymptotic and
finite sample properties, Journal of Econometrics, 108, 1-24.
Maddala, G.S. and Kim, I.M. (1998), Unit Roots, Cointegration and Structural Change,
Cambridge University Press.
67

Mishra, P. and Kumar, U. (2005), Trade Liberalization and Wage Inequality: Evidence
from India, IMF Working Paper No.05/20.
Mujeri, M. and Khondker, B. (2002), “Decomposing Wage Inequality Change in
Bangladesh: An Application of Double Calibration Technique”, DFID, UK.
Nordås, H.K. (2004), The Global Textile and Clothing Industry Post the Agreement on
Textiles and Clothing, WTO discussion paper, No. 5, 2004, World Trade
Organization, Geneva.
Sanchez-Paramo, C. and Schady, N. (2003), Off and Running? Technology, Trade, and the
Rising Demand for Skilled Workers in Latin America, World Bank Policy Research
Working Paper 3015, Washington, DC, World Bank.
Samuelson, P.A (1953), Prices of Factors and Goods in General Equilibrium, Review of
Economic Studies, 21, 1-20.
Stolper, W. and Samuelson, P. A. (1941), Protection and Real Wages, Review of Economic
Studies, 9(1), 51-68.
Trade Policy Review of Bangladesh (1992), World Trade Organization, Geneva.
Trade Policy Review of Bangladesh (2000), World Trade Organization, Geneva.
Williamson, J. (1997), Globalization and Inequality, Past and Present, World Bank
Research Observer Vol.12, 1997, pp.117-35.
Wood, A. (1994), North-South Trade, Employment and Inequality: Changing Fortunes in a
Skill-driven World, Oxford University Press.
Wood, A (1997), Openness and Wage Inequality in Developing Countries: The Latin
American Challenge to East Asian Conventional Wisdom, The World Bank
Economic Review 11(1), 33-57.
68

Table 1. Descriptive Statistics
Variable Mean Std. Dev Min Max N
Log of skilled wage 4.2311 .2768 3.3824 5.007 140
Log of unskilled wage 3.9456 .2834 3.2196 4.584 140
Log of relative price 3.6907 .6072 2.4604 4.8728 140
Log of openness -.0662 .1287 -.4099 .2070 140
Log of human capital 3.2561 .2191 2.8848 3.5698 140
Table 2. Levin-Lin Test Statistics for a Panel Unit Root Test
Variable Test statistics
Log of skilled wages -5.923**
Log of unskilled wages -6.242***
Log of relative price -7.753***
Notes: The time period is 1975-2002. One period lag is included. All the regressions contain an intercept and a time trend. *** and ** denote statistical significance at the 1% and 5% level respectively.
69

Table 3. The ADF Test Statistics for a Unit Root Test
Variable Lags t-ADF Estimated root
Log of openness 0 -4.00** 0.26
Log of human capital 0 -2.331 0.60
Notes: The time period is 1975-2002. All regressions contain an intercept and a time trend. The superscripts *** and ** denote statistical significance at the 1% and 5% level respectively.
Table 4. Estimated Wage Equations for Bangladesh Manufacturing Industries (1)
Dependent Variable
Skilled wages Unskilled wages
Regression method
(2) OLS
(3) FE
(4) Dynamic
FE
(5) 2SLS
(6) OLS
(7) FE
(8) Dynamic
FE
(9) 2SLS
Openness -0.032
(0.196) -0.032 (0.113)
0.180** (0.084)
0.223 (0.171)
0.178 (0.218)
0.178 (0.101)
0.286*** (0.079)
0.482** (0.123
Lagged skilled wages
0.456*** (0.065)
0.541***
(0.079)
Lagged unskilled wages
0.536*** (0.069)
0.573***
(0.074)
R Square 0.63 0.83 0.89 0.85 0.90 0.92
N 140 140 135 130 140 140 135 130 Notes: All variables are measured in logarithms. A linear time trend and a constant are included in the regressions. Robust standard errors in parentheses. ***, **, and * denote statistical significance at the 1%, 5%, and 10% level respectively.
70

Table 5. Estimated Wage Equations for Bangladesh Manufacturing Industries (2)
Dependent Variable
Skilled wages Unskilled wages
Regression method
(2) OLS
(3) FE
(4) Dynamic
FE
(5) 2SLS
(6) OLS
(7) FE
(8) Dynamic
FE
(9) 2SLS
Openness -0.015
(0.219) -0.017 (0.107)
0.176** (0.085)
0.156 (0.152)
0.173 (0.229)
0.172* (0.100)
0.278*** (0.079)
0.416*** (0.085)
Relative price
-0.157 (0.076)
0.076 (0.049)
0.007 (0.04)
0.033 (0.059)
-0.082* (0.035)
0.062 (0.046)
0.015 (0..039)
0.032 (0.073)
Human capital
-0.511* (0.207)
-0.468*** (0.122)
-0.142 (0.099)
-0.392*** (0.058)
0.082* (0.036)
0.178 (0.114)
0.197** (0.097)
-0.399** (0.094)
Lagged skilled wages
0.442*** (0.066)
0.451*** (0.076)
Lagged unskilled wages
0.506*** (0.07)
0.512*** (0.123)
R Square 0.765 0.876
N 140 140 135 130 140 140 135 130 Notes: All variables are measured in logarithms. A linear time trend and a constant are included in the regressions. Robust standard errors in parentheses. ***, **, and * denote statistical significance at the 1%, 5%, and 10% level respectively.
71

Figure 1. Real Wages, skilled(sk) and unskilled(usk), in Five Industries (1975-2002)
1975 1980 1985 1990 1995 2000
50
75
100 sk usk
1975 1980 1985 1990 1995 2000
50
75
100sk usk
1975 1980 1985 1990 1995 2000
50
75
sk usk
1975 1980 1985 1990 1995 2000
50
100
150sk usk
1975 1980 1985 1990 1995 2000
50
75
sk usk
Cotton Jute
Match Engineering
Mustard oil
72
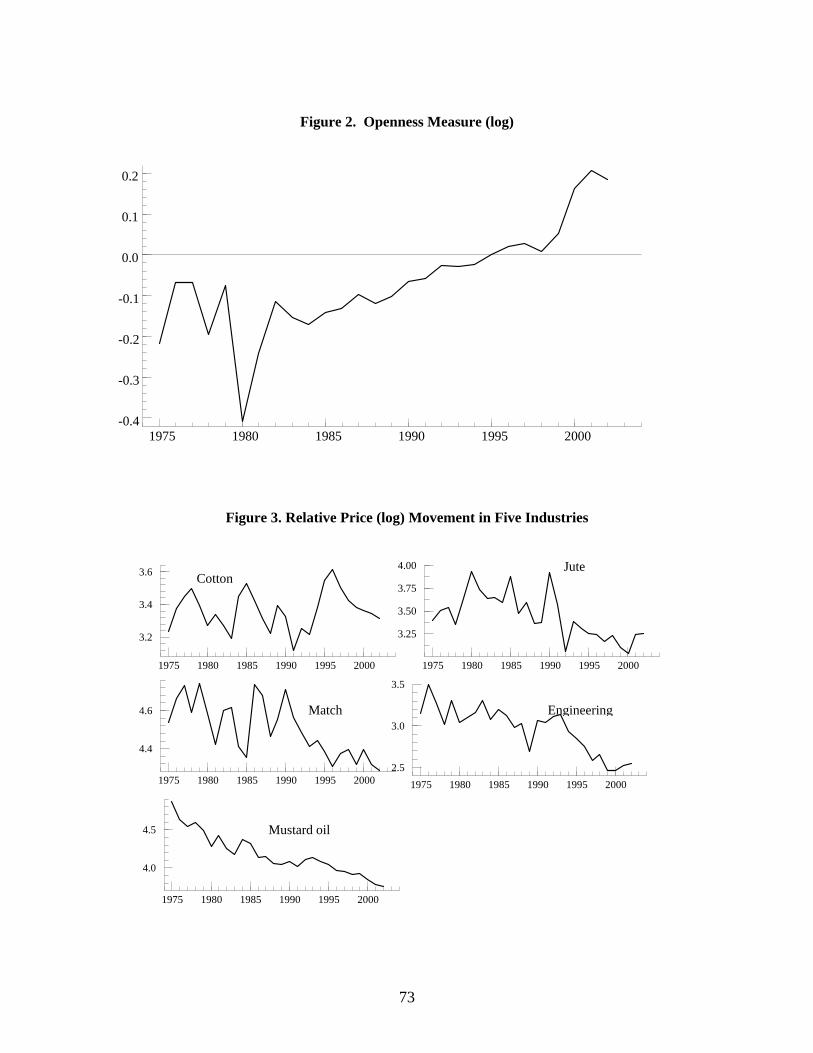
Figure 2. Openness Measure (log)
1975 1980 1985 1990 1995 2000 -0.4
-0.3
-0.2
-0.1
0.0
0.1
0.2
Figure 3. Relative Price (log) Movement in Five Industries
1975 1980 1985 1990 1995 2000
3.2
3.4
3.6
1975 1980 1985 1990 1995 2000
3.25
3.50
3.75
4.00
1975 1980 1985 1990 1995 2000
4.4
4.6
1975 1980 1985 1990 1995 2000
4.0
4.5
1975 1980 1985 1990 1995 20002.5
3.0
3.5
Jute
Match
Cotton
Engineering
Mustard oil
73

Figure 4. Log of Human Capital (proxy)
1975 1980 1985 1990 1995 2000
2.9
3.0
3.1
3.2
3.3
3.4
3.5
74