
Does non-interest income make banks more risky? Retail ...
44
Discussion Paper Deutsche Bundesbank No 17/2013 Does non-interest income make banks more risky? Retail- versus investment-oriented banks Matthias Köhler (University of Giessen) Discussion Papers represent the authors‘ personal opinions and do not necessarily reflect the views of the Deutsche Bundesbank or its staff.
Transcript of Does non-interest income make banks more risky? Retail ...

Discussion PaperDeutsche BundesbankNo 17/2013
Does non-interest incomemake banks more risky?Retail- versus investment-oriented banks
Matthias Köhler(University of Giessen)
Discussion Papers represent the authors‘ personal opinions and do notnecessarily reflect the views of the Deutsche Bundesbank or its staff.

Editorial Board: Klaus Düllmann
Heinz Herrmann
Christoph Memmel
Deutsche Bundesbank, Wilhelm-Epstein-Straße 14, 60431 Frankfurt am Main,
Postfach 10 06 02, 60006 Frankfurt am Main
Tel +49 69 9566-0
Please address all orders in writing to: Deutsche Bundesbank,
Press and Public Relations Division, at the above address or via fax +49 69 9566-3077
Internet http://www.bundesbank.de
Reproduction permitted only if source is stated.
ISBN 978–3–86558–915–6 (Printversion)
ISBN 978–3–86558–916–3 (Internetversion)
Non-technical Summary
In this paper, we analyze the impact of banks’ non-interest income share on risk in the Ger-
man banking sector for the period between 2002 and 2010. Using linear and quantile regres-
sion estimators, we find that the impact of non-interest income on risk depends on the busi-
ness model of a bank. More specifically, while banks with a retail-oriented business model
such as savings banks, cooperative banks and other retail-oriented banks become significantly
more stable if they increase their share of non-interest income, investment-oriented banks be-
come significantly less stable. In contrast to retail-oriented banks, the latter already generate a
large share of their income from non-interest activities. The activities used to generate non-
interest income significantly differ between retail- and investment-oriented banks as well.
Our results are in line with recent findings for the EU banking sector which indicate substan-
tial benefits from income diversification for smaller and more retail-oriented banks. Larger
and more investment-oriented banks, in contrast, should increase their share of interest in-
come to become more stable. Our results may, thus, not only be relevant for Germany, but al-
so for other European countries.
Our paper has two important implications. First, our results indicate that it might be beneficial
for retail-oriented banks to increase their share of non-interest income to become more stable,
since this allows them to better diversify their income structure and to become more resilient
to overall economic conditions that affect their loan portfolio. Furthermore, a higher share of
non-interest income makes them less dependent on maturity transformation and interest rate
risk. Investment-oriented banks, in contrast, become significantly less stable if they increase
their non-interest income share. They already have a large non-interest income share and en-
gage in different activities than retail-oriented banks. To become more stable, these banks
should increase their share of interest income. Overall, therefore, our results imply that banks
are more stable if they have a more diversified income structure and depend neither heavily
on interest nor on non-interest income. Second, the decomposition of non-interest income into
fee and commission and trading income shows that impact on bank stability comes from fee
and commission income. Trading income, which is significantly more volatile than fee and
commission income, in contrast, has no significant effect on bank stability.

Nicht-technische Zusammenfassung
In der vorliegenden Arbeit untersuchen wir, ob deutsche Banken mit einem hohen Anteil an
Nichtzinseinkommen im Verhältnis zu ihrem gesamten operativen Einkommen im Zeitraum
zwischen 2002 und 2010 riskanter waren als solche mit einem geringen Anteil an Nichtzins-
einkommen. Lineare Schätzverfahren und Quantilsregressionen deuten darauf hin, dass Ban-
ken mit einem retail-orientieren Geschäftsmodell wie beispielsweise Sparkassen, Kreditge-
nossenschaften sowie andere retail-orientierte Banken signifikant stabiler werden, wenn sie
ihren Anteil an Nichtzinseinkommen am gesamten Einkommen erhöhen. Banken mit einem
Fokus auf Investment Banking-Aktivitäten werden hingegen deutlich riskanter. Sie erzielen
im Unterschied zu retail-orientierten Instituten einen deutlich höheren Anteil ihres Einkom-
mens aus Nichtzinseinkommen. Darüber hinaus unterscheiden sich die Aktivitäten, mit denen
retail- und investment-orientiere Banken ihre Nichtzinseinkommen generieren, deutlich.
Die Resultate der vorliegenden Arbeit stimmen mit aktuellen Ergebnissen für den EU Ban-
kensektor überein. Danach profitieren insbesondere kleinere und stärker retail-orientere Ban-
ken von einer besseren Diversifikation ihres Einkommens. Größere Banken mit einer stärke-
ren Ausrichtung auf Investment Banking-Aktivitäten sollten hingegen ihr Zinseinkommen er-
höhen, um stabiler zu werden. Die Ergebnisse dieser Arbeit könnten somit nicht nur für den
deutschen Bankensektor von Relevanz sein, sondern auch für andere europäische Länder.
Die vorliegende Arbeit erlaubt zwei wichtige Schlussfolgerungen. Erstens deuten unsere Er-
gebnisse darauf hin, dass Banken, die sich auf das Einlagen- und Kreditgeschäft konzentrie-
ren, von Diversifikationseffekten profitieren, wenn sie den Anteil des Nichtzinseinkommens
im Verhältnis zu ihrem gesamten operativen Einkommen erhöhen. Das bedeutet, dass es für
diese Banken sinnvoll sein kann, ihr Nichtzinsgeschäft auszuweiten, anstatt es zu reduzieren,
wenn sie stabiler werden wollen. Banken mit einem Fokus auf Investment Banking-
Aktivitäten werden hingegen deutlich riskanter, wenn sie sich stärker im Nichtzinsgeschäft
engagieren. Sie erzielen bereits einen großen Teil ihrer Gewinne aus dem Nichtzinsgeschäft
und verfolgen andere Geschäftsaktivitäten als retail-orientierte Banken. Um stabiler zu wer-
den, sollten diese Banken den Anteil des Zinseinkommens am gesamten operativen Einkom-
men erhöhen. Insgesamt deuten unsere Ergebnisse somit darauf hin, dass Banken mit einer
diversifizierten Einkommensstruktur, die weder einseitig von Zins- noch von Nichtzinsein-
kommen abhängig sind, weniger riskant sind. Zum anderen weisen unsere Ergebnisse noch
darauf hin, dass der Einfluss des Nichtzinseinkommens auf die Stabilität einer Bank vom Pro-
visionsgeschäft ausgeht. Das Handelseinkommen, das deutlich volatiler ist als das Provisions-
einkommen, hat im Gegensatz hierzu keinen signifikanten Einfluss auf das Risiko einer Bank.
BUNDESBANK DISCUSSION PAPER NO 17/2013
Does non-interest income
make banks more risky?
Retail- versus investment-oriented banks
Matthias Köhler1
Deutsche Bundesbank
Abstract
In this paper, we analyze the impact of banks’ non-interest income share on risk in the German bank-
ing sector for the period between 2002 and 2010. Using linear and quantile regression estimators, we
find that the impact of non-interest income on risk significantly differs depending on banks’ overall
business model. More specifically, we show banks with retail-oriented business model such as savings
banks, cooperative banks and other retail-oriented banks become significantly more stable if they in-
crease their share of non-interest income. Investment-oriented banks, in contrast, become significantly
more risky. They do not only report a significantly higher share of non-interest income, but also differ
in terms of their activities from retail-oriented banks. Overall, this indicates that retail-oriented banks
should increase their share of non-interest income to become more stable. Investment-oriented banks,
in contrast, should decrease it. Our results imply that banks are significantly less risky if they have a
more balanced income structure and neither depend heavily on interest nor on non-interest income.
Furthermore, they indicate that the impact of non-interest income on risk significantly depends on the
activities used to generate non-interest income with retail-oriented activities being significantly less
risky than investment-oriented activities such as those pertaining to capital markets activities.
JEL-Classification: G 20, G 21, G 28
Keywords: Banks, risk-taking, business model, non-interest income, diversification
1 Deutsche Bundesbank, Wilhelm-Epstein-Straße 14, 60431 Frankfurt am Main, Germany. E-Mail: [email protected]. The paper represents the author’s personal opinions and does not necessarily reflect the views of the Deutsche Bundesbank or its staff. The author would like to thank Christoph Memmel, Heinz Herrmann and the participants at the Bundesbank seminar for helpful comments and sugges-tions.

1
1. Introduction
The financial crisis of 2007/2008 has revealed the weaknesses of many banks‘ business models. In
particular, investment-oriented banks were hit by the crisis due to their heavy reliance on wholesale
funding and non-interest income that exposed them to greater income fluctuations than retail-oriented
banks that provide traditional banking services such as lending and use customer deposits a primary
source of funding. Due to pressure from investors and regulators many investment-oriented banks
have started to change their business model. On the liability side, they have increased the share of cus-
tomer deposits to put their funding on a more stable basis. On the asset side, they have cut back their
trading activities and increased their lending to customers in order to reduce their reliance on non-
interest income.
While these adjustments may make investment-oriented banks less risky, retail-oriented banks that
generate the largest part of their income from interest may become more stable if they increase their
non-interest income share as this allows them to better diversify their income structure and to offset
declining interest margins. Figure 1, for example, shows that the net interest margin of German banks
declined between 2003 and 2008, while the non-interest income margin increased up to 2006. Starting
in 2008 this relationship has started to reverse with the non-interest margin starting to decline and the
interest margin beginning to increase again. In the future, the net interest margin is, however, expected
to decrease again as recent changes in banking regulations such as the introduction of a Liquidity Cov-
erage Ratio (LCR) will likely increase the competition for deposits which should increase deposit
rates. Lending rates, in contrast, will likely decrease, since many banks have increased their lending
activities in response to changes in their business models. The process of disintermediation will also
likely continue in the future and depress net interest margins further. This suggests that it may be ben-
eficial for retail-oriented banks to increase their non-interest income activities to offset declining inter-
est margins.
In this paper, we analyze the impact of banks’ non-interest income share on risk in the German bank-
ing sector for the period between 2002 and 2010. Using linear and quantile regression estimators, we
show that the impact of non-interest income on risk significantly differs between retail- and invest-
ment-oriented banks. More specifically, we find banks with a more traditional business model such as
savings banks, cooperative banks and other retail-oriented banks become significantly more stable if
they increase their share of non-interest income. Investment-oriented banks, in contrast, become sig-
nificantly more risky. They do not only report a significantly higher share of non-interest income, but
also differ in terms of their activities from retail-oriented banks. To the best of my knowledge, this is
the first paper that shows that these differences have an important impact on how non-interest income
affects bank risk-taking. Our results indicate that retail-oriented banks should increase their share of
non-interest income to become more stable. Investment-oriented banks, in contrast, should decrease it.
This implies that banks are significantly less risky if they have a more balanced income structure and
neither depend heavily on interest nor on non-interest income. Furthermore, they suggest that the im-
pact of non-interest income on risk significantly depends on the activities used to generate non-interest

2
income with retail-oriented activities being significantly less risky than investment-oriented activities
such as those pertaining to capital markets activities.
Theory provides no clear prediction regarding the impact of non-interest income on risk.2 On the one
hand, does a higher share of non-interest income make banks less dependent on interest income and
improve risk diversification which should make them more stable (Boyd et al., 1980). On the other
hand, non-interest income is usually more volatile than interest income, because it is more difficult for
borrowers to switch their lending relationship due to information costs (DeYoung and Roland, 2001).
Non-interest income also increases operational leverage, since expanding into non-interest income
may imply a rise in fixed costs (DeYoung and Roland, 2001). Financial leverage is also higher be-
cause regulators require banks to hold less capital against non-interest income activities (DeYoung and
Roland, 2001). Both increases the volatility of non-interest income and makes it more risky than inter-
est income.
Consistent with this view Altunbas et al. (2011) and Demirgüc-Kunt and Huizinga (2010) show that
banks with a high share of non-interest income are more risky. Common to both studies is that they
focus on listed banks which are larger and have a more investment-oriented business model than banks
not listed. Since the majority of banks in the EU are not listed, Köhler (2012) includes a large number
of unlisted banks to make more general conclusions about the impact of non-interest income on risk.
In contrast to listed banks, unlisted banks such as savings and cooperative banks are usually smaller
and have a more retail-oriented business model with a focus on lending and deposit-taking activities.
Enlarging the sample of banks significantly changes the results. While the previous studies find that
banks become more risky if they increase their share of non-interest income, Köhler shows substantial
benefits from income diversification, in particular, for smaller banks (Köhler, 2012). Larger banks, in
contrast, should increase their share of interest income to become more stable. They have a more in-
vestment-oriented business model and are more active in volatile and risky trading and off-balance
sheet activities such as securitization which may increase risk. Previous research for Germany shows
that banks have significantly higher risk-adjusted returns as well if they generate a large fraction of
their income from non-interest income activities (Busch and Kick, 2009 and Busch, 2011). However,
these studies also find that commercial banks have significantly more volatile returns if they are active
in non-interest income activities and conclude that a strong engagement in fee-generating activities
makes commercial banks more risky. Savings and cooperative banks, in contrast, are not affected.
Our paper is closely related to these papers. It examines the link between non-interest income and risk-
taking for the German banking sector. Using data from the prudential database of the Deutsche Bundesbank (BAKIS) we are able to construct a dataset on banks’ income structure for a large sample
of savings banks, cooperative banks and other banks such as the big banks, the head institutions of the
cooperative and savings banks sector, regional banks or other credit institutions for the period between
2002 and 2010. This allows us to investigate whether a higher share of non-interest income makes
2 Non-interest income includes activities such as income from trading and securitization, investment banking and advisory fees, brokerage
commissions, venture capital, and fiduciary income, and gains on non-hedging derivatives.

3
German banks more risky or whether it allows them to better diversify their income structure and to
become more stable.
A priori, we would expect banks with a higher share of non-interest income to be more risky, since
non-interest income is more volatile than interest income which is reflected in Figure 2, in particular
for the group of big banks and other banks. The non-interest income of savings and cooperative banks,
in contrast, is more stable. However, savings and cooperative banks’ non-interest income also seems
to be more correlated with their net interest income which reduces the potential for income diversifica-
tion. Overall, therefore, there seems to be a trade-off between income volatility and correlation in non-
interest income. While a higher share of non-interest income allows banks to better exploit diversifica-
tion advantages due to lower correlations with banks’ net-interest income, it also exposes them to sig-
nificantly higher income volatility.
Our paper is different from Busch and Kick (2009) and Busch (2011) in three important aspects. First,
while they have data up to 2007, we include the crisis years from 2008 to 2010. This allows us to ex-
amine whether a higher share of non-interest income has made banks more stable or more risky during
the crisis. This is particularly important from the policy perspective as, for instance, recent proposals
by the Liikanen Group (2012) on structural reforms in the EU banking sector have been made based
on experience made during the crisis. Second, we show that the effect of a higher share of non-interest
income on bank risk significantly differs depending on whether a bank has a more retail- or invest-
ment-oriented business model. The distinction is important because investment-oriented banks not on-
ly generate a significantly higher share of their operating income from non-interest income, but also
differ in terms of their activities from retail-oriented banks. For example, while the latter usually earn
account administration, insurance or consumer credit fees, investment-oriented banks derive most of
their fee and commission income from underwriting, brokerage, treasury management, securitization
and clearing and other transaction-related services. To my knowledge, this is the first paper that shows
that these differences have an important impact on how non-interest income affects bank risk-taking.
Finally, we use quantile regression to examine the relationship between bank’s business model and
risk. Quantile regression gives a more complete picture on the effect of a set of regressors on the dif-
ferent quantiles of bank risk and allows us to examine whether the effect of non-interest income differs
with to the level of risk (Koencker and Hallock, 2000). They are appropriate when a large degree of
variation in the data suggests that there may be more than a single slope parameter describing the rela-
tionship between the dependent variable and the regressors. For example, as we will show later there is
considerable heterogeneity in banks’ business models not only across, but also within bank groups in
Germany. There is also considerable variation in bank size as our dataset comprises a large number of
small and retail-oriented banks such as savings and cooperative banks, but also large, investment-
oriented banks such as the big banks and the head institutions of the cooperative and savings banks
sector. Thus, numerous factors suggest that bank risk may vary considerably across the distribution.
Quantile regressions better accommodate this heterogeneity and offer more detailed insights into the
factors driving bank risk across the distribution. Therefore, quantile regression can be considered su-

4
perior to the previously used estimation techniques, since it provides more precise estimates of the im-
pact of the determinants of bank risk.
We follow the literature and measure bank risk-taking with the Z-Score, defined as the number of
standard deviations that a bank’s return on asset has to fall for the bank to become insolvent (Laeven
and Levine, 2009, Altunbas et al., 2011 and Demirgüc-Kunt and Huizinga, 2010 and Köhler, 2012). In
addition, we examine the effect of a higher share of non-interest income on risk-adjusted returns and
return volatility.
Our sample indicates considerable heterogeneity in risk-taking across banks. We show that this is due
to differences in banks’ non-interest income share. We find that the impact of non-interest income on
risk significantly depends on banks’ overall business model. More specifically, our results indicate
that a higher share of non-interest income increases the stability of savings and cooperative banks. The
other banks in our sample, in contrast, are not affected. This changes significantly, however, if we split
the banks in this group based on their lending and deposit-taking activities into a group that comprises
retail-oriented banks such as consumer credit and car finance banks and a group that contains invest-
ment-oriented banks such as the big banks and the head institutions of the cooperative and savings
banks sector. While we confirm the diversification effect for the group of retail-oriented banks, in-
vestment-oriented banks become significantly less stable if they increase their non-interest income
share.
Our findings are consistent with the hypothesis that a higher non-interest income share helps banks
with a more retail-oriented business model such as savings banks, cooperative banks and other retail-
oriented banks to better diversify their income structure and to become more resilient to overall eco-
nomic conditions that affect their loan portfolio. Furthermore, a higher share of non-interest income
makes them less dependent on maturity transformation and interest rate risk. Investment-oriented
banks, in contrast, become significantly more risky if they increase their share of non-interest income.
They already derive a large share of their income from non-interest income and undertake different ac-
tivities than retail-oriented banks. The decomposition of non-interest income into fee and trading in-
come shows that it is fee and commission income that affects bank risk. It makes up the largest part of
non-interest income generated by German banks. Trading income which is significantly more volatile
than fee income, in contrast, is much less important. This might explain why we find no significant ef-
fect of trading income on the stability and the volatility of the returns of the average bank in our sam-
ple.
We confirm our findings using quantile regressions. In contrast to OLS that estimates the conditional
mean, quantile regression estimates the effect of the regressors on the dependent variable for different
quantiles of the distribution. This allows us to analyze whether the impact of the non-interest income
is non-linear. Our results indicate that the positive diversification effect of non-interest income on the
stability of retail-oriented banks is particularly large for the more stable banks in our sample. Quantile
regressions are also more robust to outliers than OLS because linear estimators would more likely
5
produce inefficient and biased estimates in the presence of outliers. Hence, quantile regressions allow
more robust inference than OLS.
Our paper has three important implications. First, our results indicate substantial benefits from income
diversification for savings, cooperative and other retail-oriented banks. This suggests that it might be
beneficial for banks that have a more traditional business model and generate the largest part of their
income from interests to increase their share of non-interest income to become more stable and not to
decrease it. The opposite is the case for investment-oriented banks. They become more risky if they
increase their non-interest income share. They already have a large non-interest income share. To be-
come more stable, these banks should increase their share of net interest income. This implies that
banks are more stable if they have a more diversified income structure and depend neither heavily on
interest nor on non-interest income. Furthermore, they indicate that the impact of non-interest income
on risk significantly depends on the activities used to generate non-interest income with retail-oriented
activities being significantly less risky than investment-oriented activities such as those pertaining to
capital markets activities.
Our paper is structured as follows. In the next section, we present the dataset. In Section 3 and 4, we
take a first look at German banks’ business models and present first descriptive statistics on the link
between non-interest income and bank risk. The empirical model is presented in Section 5 and our
baseline results in Section 6. In Section 7, we investigate whether our results are robust to the sample
of banks chosen and address endogeneity issues. Quantile regressions are performed in Section 8. Sec-
tion 9 summarizes our main findings and concludes.
2. Data
We use data from the prudential database (BAKIS) of the Deutsche Bundesbank. The panel includes
cooperative banks and savings banks. However, we have also included the big banks, the head institu-
tions of the savings (“Landesbanken”) and cooperative banks as well as regional banks and other cred-
it institutions. While savings and cooperative banks have a retail-oriented business model and focus on
lending and deposit-taking activities, the other banks included have very different business models and
provide services that range from more retail-oriented services such as consumer credit and car financ-
ing to more investment-oriented services such as clearing and transaction and other services pertaining
to capital markets. To examine whether these differences matter for bank risk-taking, we later test
whether the impact of non-interest income on risk differs between retail- and investment-oriented
banks within this group. Specialized governmental credit institutions, real estate and mortgage banks
and the German branches of foreign banks, in contrast, are excluded due to their distinct business
model and business objectives.
We start with 17,516 observations for the period between 2002 and 2010. To assure that we have a
sufficient number of observations to analyze bank risk-taking in the pre-crisis period and also include
those banks that became insolvent during the crisis, we require each bank to report at least four obser-
vations between 2002 and 2006. This leaves us with 16,760 observations. The distribution of banks
6
and observations is presented in Table 1. Overall, we have 461 savings banks (4,026 observations),
1,291 cooperative banks (11,132) and 192 other banks (1,602) in our sample. To reduce outliers all
observations are winsorized at the 1%- and 99%-level of their respective bank group (see also Busch
and Kick, 2009).
3. Non-Interest Income
We first analyze the importance of non-interest income for German banks. In line with the literature
(Altunbas et al., 2011, Demirgüc-Kunt and Huizinga, 2010 and Köhler, 2012) we measure the im-
portance of non-interest income activities with the ratio of net non-interest income to total operating
income (NNINC). Figure 3 shows the distribution of the non-interest income share across banks. The
average share of non-interest income to total operating income is 22%. Non-interest income, however,
considerably differs across banks ranging from banks having no non-interest income to banks generat-
ing almost all of their operating income from non-interest income activities. Overall, however, more
than 50% of the banks included in our sample have an average non-interest income share of between
15% and 25%. This indicates that most banks generate the largest part of their income from traditional
banking activities such as lending.
Table 2 presents further descriptive statistics on the income structure of German banks. It reveals at
least two important findings. First, savings (20%) and cooperative banks (21%) report, on average, a
significantly lower share of non-interest income to total operating income than the other banks includ-
ed in our sample (36%). Second, the variation of the non-interest income share is much lower among
savings and cooperative banks as indicated by the significantly lower standard deviation. This indi-
cates that cooperative and savings banks have a similar business model. The business models of the
other banks included, in contrast, considerably differ from each other and range from more retail-
oriented banks that generate only a small share of their operating income from non-interest income ac-
tivities to more investment-oriented bank that generate the largest part of their income from fees and
commissions.
4. Non-Interest Income and Bank Risk
We next examine the relationship between the non-interest income share and bank risk. In line with
the literature (Laeven and Levine, 2009, Altunbas et al., 2011 and Demirgüc-Kunt and Huizinga, 2010
and Köhler, 2012), our main indicator of bank risk is the Z-Score which is defined as follows:
it itit
i
ROA CARZ ScoreSDROA
+− = (1)
where ROA is the return on assets and CAR the ratio of total equity over total assets of bank i in year
t. SDROA denotes each bank’s standard deviation of the ROA. It is calculated over the whole sample
period. The Z-Score is the inverse of the probability of insolvency, i.e. a higher Z-Score indicates that
a bank incurs fewer risks and is more stable. More specifically, it indicates the number of standard de-
7
viations below the expected value of a bank’s return on assets at which equity is depleted and the bank
is insolvent (Boyd et al., 1993). Because the Z-Score is highly skewed, we use the natural logarithm of
the Z-Score in our empirical analysis.3
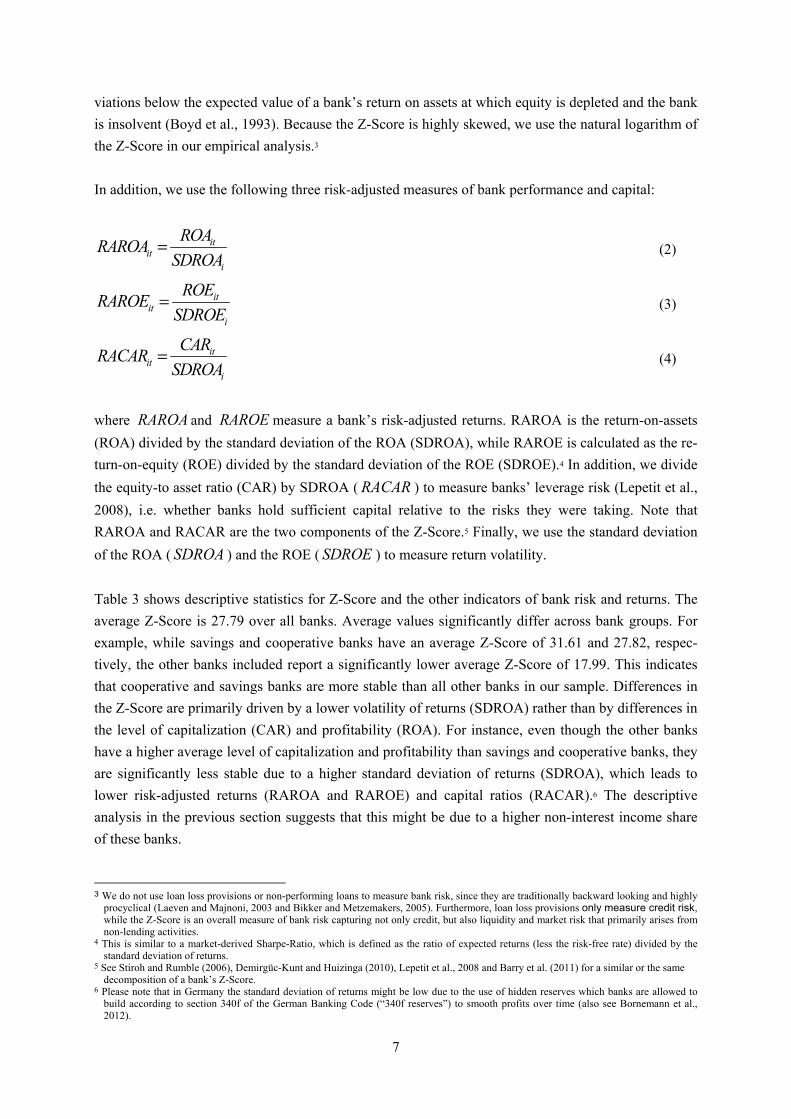
In addition, we use the following three risk-adjusted measures of bank performance and capital:
itit
i
ROARAROASDROA
= (2)
itit
i
ROERAROESDROE
= (3)
itit
i
CARRACARSDROA
= (4)
where RAROA and RAROE measure a bank’s risk-adjusted returns. RAROA is the return-on-assets
(ROA) divided by the standard deviation of the ROA (SDROA), while RAROE is calculated as the re-
turn-on-equity (ROE) divided by the standard deviation of the ROE (SDROE).4 In addition, we divide
the equity-to asset ratio (CAR) by SDROA ( RACAR ) to measure banks’ leverage risk (Lepetit et al.,
2008), i.e. whether banks hold sufficient capital relative to the risks they were taking. Note that
RAROA and RACAR are the two components of the Z-Score.5 Finally, we use the standard deviation
of the ROA ( SDROA ) and the ROE ( SDROE ) to measure return volatility.
Table 3 shows descriptive statistics for Z-Score and the other indicators of bank risk and returns. The
average Z-Score is 27.79 over all banks. Average values significantly differ across bank groups. For
example, while savings and cooperative banks have an average Z-Score of 31.61 and 27.82, respec-
tively, the other banks included report a significantly lower average Z-Score of 17.99. This indicates
that cooperative and savings banks are more stable than all other banks in our sample. Differences in
the Z-Score are primarily driven by a lower volatility of returns (SDROA) rather than by differences in
the level of capitalization (CAR) and profitability (ROA). For instance, even though the other banks
have a higher average level of capitalization and profitability than savings and cooperative banks, they
are significantly less stable due to a higher standard deviation of returns (SDROA), which leads to
lower risk-adjusted returns (RAROA and RAROE) and capital ratios (RACAR).6 The descriptive
analysis in the previous section suggests that this might be due to a higher non-interest income share
of these banks.
3 We do not use loan loss provisions or non-performing loans to measure bank risk, since they are traditionally backward looking and highly
procyclical (Laeven and Majnoni, 2003 and Bikker and Metzemakers, 2005). Furthermore, loan loss provisions only measure credit risk, while the Z-Score is an overall measure of bank risk capturing not only credit, but also liquidity and market risk that primarily arises from non-lending activities.
4 This is similar to a market-derived Sharpe-Ratio, which is defined as the ratio of expected returns (less the risk-free rate) divided by the standard deviation of returns.
5 See Stiroh and Rumble (2006), Demirgüc-Kunt and Huizinga (2010), Lepetit et al., 2008 and Barry et al. (2011) for a similar or the same decomposition of a bank’s Z-Score.
6 Please note that in Germany the standard deviation of returns might be low due to the use of hidden reserves which banks are allowed to build according to section 340f of the German Banking Code (“340f reserves”) to smooth profits over time (also see Bornemann et al., 2012).
8
To illustrate the relationship between risk and non-interest income, we group all banks according to
their non-interest income share into 10 groups each containing 10% of the observations. For each of
these groups, we calculate the average Z-Score between 2002 and 2010 and plot it on a solid line in
Figure 4. The figure indicates an inverse relationship between bank risk and non-interest income.
While a higher non-interest income share makes banks more stable at low levels of non-interest in-
come, bank stability decreases at high levels of non-interest income. This suggests that banks that ei-
ther specialize in interest or non-interest activities are more risky. This supports the idea that banks
with a diversified income structure are more stable.
The level of risk-taking may not only be determined by the share of non-interest income to total in-
come, but also by other characteristics such as their size, funding structure, liquidity and profitability.
Because all variables are interrelated, we include all of them in the subsequent empirical analysis. A
detailed list of variables used in our analysis is presented in Table 4.7 Descriptive statistics for all vari-
ables are shown in Table 5. They indicate large differences between savings and cooperative banks
and all other banks not only with respect to their non-interest income share, but also with respect to
their size, funding structure, liquidity and profitability.
5. Empirical Model
To analyze the impact of non-interest income on bank risk, we estimate the following regression mod-
el:
(5)
where is either the Z-Score, the risk-adjusted ROA (RAROA) and ROE (RAROE), respectively, or
the risk-adjusted capital ratio (RACAR) of bank i in year t. denotes each bank’s non-interest
income share. is a matrix of additional bank controls outlined below. , and are coefficients.
is an unobserved bank-specific fixed effect and a year dummy. is the error term. All models
are estimated with robust standard errors clustered at bank level.
In addition, we run cross-sectional regressions with the standard deviation of the ROA (SDROA) and
ROE (SDROE), respectively, as dependent variable to explain whether a higher share of non-interest
income to total operating income makes banks’ returns more volatile.
(6)
where is either the standard deviation of the return-on-assets (SDROA) or the standard deviation of
the return-on-equity (SDROE) of bank i over the whole sample period. is the average non-
interest income share and are additional averaged bank controls. In the regression for the entire
sample, we additionally include a dummy variable that indicates whether a bank is a savings (SAV-
INGS) and cooperative bank (COOPERATIVE), respectively. Finally, we follow Busch and Kick

9
(2009) and include a dummy variable for each period for which the standard deviation of bank i is cal-
culated (PERIOD). This is important because the period over which we calculate the standard devia-
tion is not the same for every bank in the sample.
6. Results
Our empirical analysis proceeds in steps. We first show the results for the entire sample and for each
bank group separately. In the second step, we split the group of other banks based on their lending and
deposit-taking activities into banks with a more retail- and more investment-oriented business model
to analyze whether a higher share of non-interest income has a different impact on banks that concen-
trate on retail- or investment-banking. Endogeneity issues are addressed in Section 7. In Section 8, we
run quantile regressions to test the robustness of our results and to find out whether the effect of non-
interest income differs with the level of risk experienced. All variables used in the regression analysis
are presented in Table 4. Descriptive statistics are shown in Table 5. The results of our baseline regres-
sions are presented in Table 6.
Table 6 shows that a higher share of non-interest income makes savings and cooperative banks more
stable as indicated by the significantly positive coefficient for NNINC in the regression for Z-Score.
This is consistent with the view that non-interest income improves income diversification and makes a
bank less dependent on overall economic conditions that affect their loan portfolio (Stiroh, 2004). Fur-
thermore, banks with a higher share of non-interest income are also more independent of maturity
transformation and changes in interest rate, which may reduce bank risk further. Finally, expanded
product lines and cross-selling opportunities associated with greater non-interest income may allow
banks to improve their risk-return trade-off (Stiroh, 2004).
Consistent with that we find that a higher share of non-interest income allows savings and cooperative
banks to generate higher risk-adjusted returns (RAROA). A higher share of non-interest income also
helps them to reduce their exposure to leverage risk (RACAR). In contrast, we find no evidence that
savings and cooperative banks’ returns will become more volatile if they increase their share of non-
interest income to total operating income. The returns of the other banks included, in contrast, become
significantly more volatile if they increase their share of non-interest income. However, we also find
that these banks report a significantly higher risk-adjusted ROA. Overall, both effects seem to offset
each other, as we do not find any significant link between NNINC and the Z-Score for the sample of
other banks.
We test the robustness of our results later when we split the group of other banks based on their lend-
ing- and deposit-taking activities into retail- and investment-oriented banks. Moreover, we run
quantile regressions for the entire sample and for each bank group separately. In contrast to OLS,
quantile regressions are more robust to outlier observations. This might be particularly appropriate for
the sample of other banks due to the large heterogeneity of their business model, size and other bank
characteristics. More importantly, however, quantile regressions allow us to identify whether the im-
pact of the non-interest income share is non-linear.

10
Bank risk not only depends on the non-interest income share, but also on other variables. Since these
variables are not in the focus of our research, we will briefly summarize the main results. First, banks
with higher net interest margins (NIM) and a higher level of cost-efficiency (CIR) are significantly
more stable. Large banks (SIZE), in contrast, are significantly more risky. This is because large sav-
ings and cooperative banks have significantly lower risk-adjusted returns. Large other banks, in con-
trast, report significantly higher risk-adjusted returns. However, they are also exposed to a significant-
ly higher level of leverage risk. Savings and cooperative banks that have a large share of customer
loans to total assets (LOANS) are more stable as well. Other banks are not affected.8 Banks with a
larger buffer of liquid assets relative to their total assets (LIQUID) are not significantly more stable ei-
ther. A larger share of customer deposits to total assets (DEPOSITS), in contrast, does matter. The ef-
fect on bank stability, however, differs across bank groups. While savings and cooperative banks be-
come significantly more stable if a larger fraction of their funding comes from customer deposits, the
other banks become significantly less stable. Overall, our findings are consistent with previous results
for the German banking sector obtained by Busch and Kick (2009) and Busch (2011).
To sum up, our results indicate that the share of non-interest income to total operating income
(NNINC) is an important determinant of bank risk. Consistent with the view that non-interest income
allows retail-oriented banks to better diversify their income sources and to become more stable we find
that savings and cooperative banks report significantly higher Z-Scores if they engage in non-interest
income activities. This indicates that a higher share of non-interest income increases and not decreases
the stability of savings and cooperative banks in Germany. In our model that includes all banks this ef-
fect would go unnoticed, since NNINC turns out to be insignificant. This indicates that the effect of
non-interest income on bank risk can be better identified if the sample is split into savings, cooperative
and other banks.
7. Robustness Tests
In this section, we test whether the results for the group of other banks are different if we distinguish
between banks with a retail- and investment-oriented business model. Furthermore, we address
endogeneity issues.
7.1 Retail-vs. Investment-Oriented Banks
Our results indicate that savings and cooperative banks will become significantly more stable if they
increase their share of non-interest income. This is consistent with the view that retail-oriented banks
benefit from a better diversification of income sources. In contrast, we find no effect of non-interest
income on the stability of the other banks included. As argued above this group is very heterogeneous
and comprises not only retail-oriented banks which might become more stable, but also investment-
oriented banks whose stability might decrease if they increase their share of non-interest income to to-
tal operating income.

11
Hence, to test whether the effect of non-interest income differs between retail- and investment-
oriented banks we split the group of other banks based on their lending and deposit-taking activities
into two different groups. The first group comprises all banks that have a customer loan-to-total asset
(LOANS) and customer deposit-to-total asset (DEPOSIT), respectively, of less than or equal to 50%
that do not belong to the group of savings and cooperative banks.9 This group comprises the big banks
and the head institutions of the cooperative and savings banks, but also other banks such as clearing
and transaction banks and banks that provide investment-oriented services such as those pertaining to
capital market activities. Due to their primary business activities we call this group “Investment-oriented banks”. The second group comprises all other banks. Consumer credit, car finance and other
retail-oriented banks are included in this group. However, the group also comprises some banks that
focus on private-banking. Due to their focus on retail- and private banking we call this group “Retail-oriented banks”.
Both groups not only differ with respect to the importance of their lending and deposit-taking activi-
ties, but also in terms of their non-interest income share from each other. Interestingly, based on their
median retail-oriented banks (24.63%) have a similarly low share of non-interest income than savings
(20.13%) and cooperative banks (21.32%) as indicated in Table 7. The median non-interest income
share of investment-oriented banks, in contrast, is significantly higher (40.64%). The decomposition of
non-interest income also significantly differs with investment-oriented banks having a significantly
larger trading income share than retail-oriented banks as we will show later. To find out whether these
differences matter for bank risk we run separate regressions for retail- and investment-oriented
banks.10 The results are reported in Table 8.
They significantly differ from our results for the entire sample of other banks. While NNINC was in-
significant in our previous regressions, it becomes significantly positive for Z-Score if we focus on re-
tail-oriented banks. This is because a higher share of non-interest income allows them to generate
higher risk-adjusted returns (RAROE) and to reduce their exposure to leverage risk (RACAR). As
previously, we find that a higher non-interest income share makes their returns significantly more vol-
atile (SDROA and SDROE). Overall, however, the positive effect of higher returns and capital out-
weigh the negative effect of more volatile returns. This suggests that the volatility of returns is not a
sufficient indicator to assess the level of bank risk and supports the use of the Z-Score as our main in-
dicator of bank risk.
Investment-oriented banks will have significantly more volatile returns as well if their share of non-
interest income increases (SDROA and SDROE). However, in contrast to retail-oriented banks, they
are more exposed to leverage risk indicating that they do not have sufficient capital relative to the risks
they were taking (RACAR). This might be due to different activities retail- and investment-oriented
banks undertake to generate their non-interest income. For example, while retail-oriented banks usual-
ly earn account administration, insurance or consumer credit fees in the case of retail banks and advi-
sory fees in case of banks that focus on private banking, investment-oriented banks derive most their
9 This papers‘ results hold if we increase the threshold and require investment-oriented commercial banks to not have a loan- and deposit-to
asset ratio, respectively, of more than 20%, 30% or 40%, respectively. 10 For brevity, we report the results for NNINC only. The results for the other control variables are available from the author upon request.
12
fees and commissions from underwriting activities, brokerage, treasury management, securitization
and clearing and other transaction-related services. Since regulators require banks to hold less capital
against such activities, investment-oriented banks can operate at a higher leverage which may increase
their risk. Investment-oriented banks also report a significantly lower risk-adjusted ROE (RAROE) if
their share of non-interest income increases. To sum up, while retail-oriented banks become more sta-
ble if they increase their share of non-interest income, investment-oriented banks become significantly
less stable if they increase their share of non-interest income as indicated by the significantly negative
coefficient for NNINC for Z-Score.
Overall, our results indicate that the impact of non-interest income on risk significantly differs depend-
ing on the overall business model of a bank. While banks that mainly focus on retail- and private-
banking activities such as savings banks, cooperative banks and other retail-oriented banks benefit
from the positive diversification effect of a higher share of non-interest income, investment-oriented
banks become significantly less stable. Both groups do not only differ with respect to the importance
of non-interest income from each other, but also in terms of their activities. Because the effect of non-
interest income on stability significantly differs between retail- and investment-oriented banks, we ad-
here to the sample split in our subsequent empirical analysis.
7.2 Endogeneity
Endogeneity issues cannot be ruled out in any study on bank risk, since changes in risk may cause
banks to adjust their activities. However, for several reasons we think that our results are not severely
biased by endogeneity. First, our sample includes a large number of savings and cooperative banks
whose primary business objective since they were established in the 19th century is to provide financial
services to specific sectors and to improve financial access in selected geographical areas. Due to this
focus they have a similar business model since decades and are traditionally more active in activities
such as lending than the other banks.
Second, banks would only have adjusted their business model if they were aware of the risks they had
been taking. This assumes that banks could correctly quantify the risks they incurred. This is ques-
tioned, because banks were usually assessing risk historically and were neglecting what appeared to be
low probability, non-salient events that turned out to be significant (Shleifer, 2011). This suggests that
banks were not fully aware of the risks they were taking.11 And even if they were aware of their risks,
they did not always adjust their business model to bank risk, because some banks were willing to be
more exposed to crisis risks than others (Fahlenbrach et al, 2012). We control for this risk culture of a
bank using bank-specific effects.
Third, investors that might force banks to adjust their business model were not fully aware of the risks
either. Beltratti and Stulz (2012), for example, show that the banks that were valued highly by the
market before the crisis, for instance, those banks with a successful securitization line of business, per-
formed worse when the crisis hit. This indicates that investors were not fully aware of the risks banks
11 See also Financial Stability Report of the Deutsche Bundesbank (2009).

13
were taking either and, thus, did not force banks to change their business model to reduce bank risk. In
contrast, banks would most likely have been punished by their investors if they had changed their
business model before 2008 to reduce their risk.12
Changes in business models are more likely after 2008, however, since the crisis has revealed the
weaknesses of many banks’ business models. Changes in business models are also necessary due to
pressure from regulators to reduce their leverage and to put their funding on a more stable basis.
Hence, to test whether this has biased our results, we drop all observations in 2009 and 2010 and re-
estimate our model. The results are reported in Table 9. They confirm our findings. While savings
banks, cooperative banks and retail-oriented banks become more stable if they generate a larger part of
their income from non-interest income activities share, investment-oriented banks become significant-
ly less stable.
Overall, we think that endogeneity problems are limited for our sample. And even if banks did adjust
their business model and reduced their share of non-interest income in response to a higher level of
risk-taking, this would have biased the coefficient for the non-interest income share (NNINC) in our
regressions downward and not upward. This suggests that in the presence of endogeneity the positive
effect of the non-interest income share on bank stability should be even larger.
8. Extensions
In this section, we test the robustness of our results using quantile regressions and analyze whether the
impact of non-interest income on bank stability differs between fee and commission and trading in-
come.
8.1 Quantile Regressions
In this section, we use the conditional quantile regression estimator developed by Koencker and Bas-
sett (1978) and re-estimate our model. In contrast to OLS that estimates the conditional mean, quantile
regression permits estimating conditional quantile functions, i.e. models in which quantiles of the de-
pendent variable are expressed as functions of a set of explanatory variables (Koenker and Hallock,
2001). Thus, quantile regressions give a more complete picture of the effect of a set of regressors on
the different quantiles of the dependent variable. This is particularly interesting from the financial sta-
bility perspective as it allows us to investigate whether the impact of the non-interest income share dif-
fers across the distribution of bank risk, i.e. we can analyze whether the impact of a higher share of
non-interest income is non-linear.
Quantile regressions are appropriate when a large degree of variation in the data suggests that there
may be more than a single slope parameter describing the relationship between the dependent variable
12 This is consistent with the following statement by Peter Hahn, Former Citigroup Managing Director in a Report to the Treasury Commit-
tee of the British Parliament” “If … banks in 2005 decided to be more conservative and hold back in their activity, they more than likely would have had their CEO and board even replaced in 2006 for failing to take advantage of the opportunities, so the structure was one which was one widely supported by players, shareholders and everybody.” (House of Commons Treasury Committee, 2009).

14
and the regressors. Quantile regressions are, therefore, particularly suitable for our sample, since the
descriptive analysis and our previous regressions have shown that savings, cooperative and the other
banks differ considerably with respect to their risk-taking behavior and their characteristics. For ex-
ample, savings, cooperative and other retail-oriented banks are usually less engaged in non-interest in-
come activities than investment-oriented banks. These differences not only exist across groups. Even
within these groups there is considerable heterogeneity among banks’ business models as indicated by
large variations in the non-interest income share. There is also considerable variation in the size of
banks as our dataset comprises a large number of small and domestic-oriented banks, but also large,
internationally oriented banks such as the big banks and the head institutions of the cooperative and
savings banks sector. Thus, numerous factors suggest that bank risk varies considerably across the dis-
tribution. Quantile regressions accommodate the heterogeneity in our dataset better and offer more de-
tailed insights into the factors driving bank risk across the distribution. Furthermore, it offers an esti-
mation procedure that is more robust to outlier observations because linear estimators would more
likely produce inefficient and biased estimates in the presence of outliers. Thus, quantile regressions
allow more robust inference than OLS.
In order to analyze whether our assertion of systematic differences in the impact of our regressors on
bank risk is correct, we estimate quantile regression models to obtain coefficients for the 10%, 25%,
50%, 75%, and 90% quantile. The results are reported in Table 10 next to our OLS results.13 For brevi-
ty, we only show the results for banks’ non-interest income share (NNINC).
The quantile regression results confirm our previous findings for savings banks, cooperative banks and
retail-oriented banks. NNINC turns out to be significantly positive in the regression with Z-Score as
dependent variable indicating substantial benefits from income diversification. In particular, the banks
in the right tail of the distribution of Z-Score become more stable banks if they increase their share of
non-interest income as indicated by the significantly higher quantile regression coefficient of NNINC
for banks in the higher quantiles. Investment-oriented banks, in contrast, become significantly more
risky if they increase their share of non-interest income consistent with our previous findings. Equality
of coefficients tests, however, indicate that the coefficients are not significantly different across
quantiles for this group reassuring that our quantile regression results are coherent with our OLS re-
sults. Overall, quantile regressions provide a more accurate picture of the underlying range of dispari-
ties in non-interest income that the classical estimation would have missed.
We also confirm our previous finding for the other indicators of bank risk and returns. First, while sav-
ings, cooperative and retail-oriented banks report significantly higher risk-adjusted returns if their
share of non-interest income increases, investment-oriented banks have significantly lower risk-
adjusted returns (RAROA and RAROE). They are also significantly more exposed to leverage risk if
non-interest income increases (RACAR). Savings banks, cooperative and retail-oriented banks, in con-
trast, are significantly less exposed. This is particularly the case for retail-oriented banks in the right
tail of the distribution of RACAR, i. e. the banks with a relatively low risk-adjusted capital ratio, as
indicated by the significant equality test statistic. We also confirm our findings for the volatility of re-
13Standard errors are obtained using 1,000 bootstrap replications.

15
turns. More precisely, our findings suggest that the positive effect of a higher non-interest income
share on the volatility of the ROA of retail- and investment-oriented banks is driven by the banks in
the right tail of the distribution. This suggests that the OLS results for SDROA and SDROE are driven
by the banks with very volatile returns. Equality tests indicate that the coefficients do not significantly
differ across quantiles, however, indicating that our quantile regression results are coherent with our
OLS results. Overall, the quantile regressions provide additional robust evidence that a higher share of
non-interest income is associated with a greater stability of savings banks, cooperative banks and other
retail-oriented banks. Investment-oriented banks, in contrast, become significantly less stable if they
increase their share of non-interest income.
8.2 Trading and Fee and Commission Income
In the previous sections, we have implicitly assumed that the sources from which German banks gen-
erate their non-interest income are equal across bank groups. We now examine whether fee and com-
mission income has a different impact on bank stability than trading income.
As a starting point, we break down banks’ non-interest income into fee and commission and trading
income. Table 7 shows that German banks generate most of their non-interest income from fees and
commissions. This is particularly the case for savings and cooperative banks. The other retail-oriented
banks show a similarly high provision and low trading income share as well.14 Trading income is more
important for investment-oriented banks. However, compared to fee and commission income their
trading income share is still small. For example, while the average share of trading income to total op-
erating income of investment-oriented banks is almost 5%, their average net fee and commission in-
come share is, on average, almost 45%. However, we have also included some banks that report net
trading income shares of almost 40%. Overall, therefore, there is much more heterogeneity in the fee
and trading income shares among the other banks included in our sample than among savings and co-
operative banks.
We use the greater heterogeneity among these banks to investigate whether fee and trading income
have a different impact on risk. A priori, we would expect banks with a higher share of trading income
to be more risky, since trading income is usually more volatile than fee and commission income. Fee
and commission income, in contrast, may reduce income volatility, in particular, if it is stable over
time. However, trading income is also less correlated with net interest income than fee and commis-
sion income which may increase the benefits from income diversification. To find out which effect
dominates, we replace the non-interest income share (NNINC) by the share of net fee and commission
income (COMMISSION) and net trading income to total operating income share (TRADING). The
OLS and quantile regression results are reported in Table 11.
They confirm our findings and indicate significant differences between retail- and investment-oriented
banks: While retail-oriented banks become more stable if they increase their non-interest income share
14 For example, while the median provision income share is 19.73% (average share 19.74%) for cooperative and 21.02% (20.79%) for coop-
erative banks, retail-oriented banks have a median provision income share of 21.90% (29.83%).

16
as indicated by the significant and positive coefficient for COMMISSION in the regression with Z-
Score as dependent variable, investment-oriented banks become significantly less stable. The results
for our other indicators of bank risk and returns are also similar to our previous results. Overall, our
results indicate that the effect of non-interest income on bank stability comes from fee and commis-
sion income. Trading income, in contrast, does not matter. The latter is more volatile, but also much
less important, on average, than fee and commission income which might explain why trading income
has no significant impact on the average bank in our sample. Quantile regressions confirm our previ-
ous findings.
In unreported regressions, we did several tests to check the robustness of our results with respect to
TRADING. First, not all banks report a high trading income share. To test whether this biases our re-
sults, we exclude all banks from the sample that do not have any trading income. In addition, we drop
all banks from the sample that do not report a net trading income share of 2.5% (75%-quantile) or
more. We also drop all banks from the sample which either have a very low (25%-quantile) or very
high share (75%-quantile) of non-interest and fee income share, respectively. In all regressions,
TRADING is insignificant. The share of net fee and commission income (COMMISSION), in con-
trast, remains significantly positive in all regressions for Z-Score. The results for the remaining indica-
tors of bank risk and returns are similar as well.
9. Conclusions
In this paper, we analyze the impact of banks’ non-interest income share on risk in the German bank-
ing sector for the period between 2002 and 2010. Using linear and quantile regression estimators, we
find evidence that the impact of non-interest income on bank risk depends on the business model of a
bank. More specifically, while banks with a more traditional, retail-oriented business model such as
savings banks, cooperative banks and other retail-oriented banks become significantly more stable if
they increase their share of non-interest income, investment-oriented banks become significantly less
stable. In contrast to retail-oriented banks, the latter already generate a large share of their income
from non-interest activities. Furthermore, while retail-oriented banks usually earn account administra-
tion, insurance or consumer credit fees, investment-oriented banks derive most their fees from under-
writing activities, brokerage, treasury management, securitization and clearing and other transaction-
related services. These activities are usually more closely linked to market or cyclical evolution and,
therefore, more volatile. Furthermore, since regulators require banks to hold less capital against such
activities, investment-oriented banks can also operate at a higher leverage which makes them signifi-
cantly more risky compared to retail-oriented banks. To my knowledge, this is the first paper that
shows that these differences have an important impact on how non-interest income affects bank risk-
taking.
Our results are in line with recent findings for the EU banking sector which indicate substantial bene-
fits from income diversification for smaller and more retail-oriented banks (Köhler, 2012). Larger and
more investment-oriented banks, in contrast, should increase their share of interest income to become

17
more stable. Our results may, thus, not only be relevant for German banking sector, but also for other
European countries.
Our paper has two important implications. First, our results indicate that it might be beneficial for re-
tail-oriented banks to increase their share of non-interest income to become more stable, since this al-
lows them to better diversify their income structure and to become more resilient to overall economic
conditions that affect their loan portfolio. Furthermore, a higher share of non-interest income makes
them less dependent on maturity transformation and interest rate risk. Investment-oriented banks, in
contrast, become significantly less stable if they increase their non-interest income share. They already
have a large non-interest income share and engage in different activities than retail-oriented banks. To
become more stable, these banks should increase their share of interest income. Overall, therefore, our
results imply that banks are more stable if they have a more diversified income structure and depend
neither heavily on interest nor on non-interest income. Furthermore, they indicate that the impact of
non-interest income on risk significantly depends on the activities used to generate non-interest in-
come with retail-oriented activities being significantly less risky than investment-oriented activities
such as those pertaining to capital markets activities. Finally, the decomposition of non-interest in-
come shows that impact on bank stability comes from fee and commission income. Trading income,
which is significantly more volatile than fee and commission income, in contrast, has no significant ef-
fect on bank stability.

18
Literature
Altunbas, Y., Manganelli, S. and Marques-Ibanez, D. (2011), “Bank Risk During the Financial Crisis
– Do Business Models Matter?”, ECB Working Paper Series, No. 1394, European Central Bank,
Frankfurt.
Barry, T. A., Lepetit, L. and Tarazi, A. (2011), “Ownership Structure and Risk in Publicly Held and
Privately Owned Banks”, Journal of Banking and Finance, Vol. 35, pp. 1327-1340.
Beltratti, A. and Stulz R. M. (2012), “Why Did Some Banks Perform Better During the Credit Crisis?
A Cross-country Study of the Impact of Governance and Regulation”, Journal of Financial Eco-nomics, Vol. 105(1), pp. 1-17.
Bikker, J. A. and Metzemaker, P. (2005), “Bank Provisioning Behavior and Procyclicality”, Journal of Financial Markets, Institutions and Money, Vol. 15, pp. 141-157.
Bornemann, S., Kick, T., Memmel, C. and Pfingsten, A. (2012), “Are Banks Using Hidden Reserves
to Beat Earnings Benchmarks”, Journal of Banking & Finance, Vol. 36, pp. 2403-2415.
Boyd, J. H., Hanweck, G. A. and Pithyachariyakul, P. (1980), “Bank Holding Company Diversifica-
tion”, in Proceedings from a Conference on Bank Structure and Competition, May,
Boyd, J. H., Graham, S. L. and Hewitt, S. R. (1993), “Bank Holding Company Mergers with Nonbank
Financial Firms: Effects on the Risk of Failure," Journal of Banking & Finance, Vol. 17, pp. 43-63.
Busch, R. and Kick, T. (2009), “Income Diversification in the German Banking Industry”,
Bundesbank Discussion Paper, No. 09/2009.
Busch, R. (2011), “Diversifikation von Einkommen und Kreditportfolien – Eine ökonometrische Ana-
lyse zu Rentabilität, Risiko und Effizienz im deutschen Bankenmarkt“, Dissertation, Friedrich-
Alexander-Universität Erlangen-Nürnberg.
Demirgüc-Kunt, A. and Huizinga, H. (2010), “Bank Activity and Funding Strategies: The Impact on
Risk and Returns”, Journal of Financial Economics, Vol. 98, pp. 626-650.
Deutsche Bundesbank (2009), „Financial Stability Report“.
DeYoung, R. and Roland, K. P. (2001), “Product Mix and Earnings Volatility at Commercial Banks:
Evidence from a Degree of Total Leverage Model”, Journal of Financial Intermediation, Vol. 10,
pp. 54-84.
Fahlenbrach, R., Prilmeier, R. and Stulz R. M. (2012), „This Time is the same: Using bank perfor-
mance in 1998 to Explain bank Performance during the Recent Financial Crisis”, The Journal of
Finance, Vol. LXVII (6), pp. 2139-2185.
House of Commons Treasury Committee (2009), “Banking crisis: Reforming corporate governance
and pay in the city”, Ninth report of the Session 2008-09.
Koencker, R. and Bassett, G. (1978), “Regression Quantiles”, Econometrica, Vol. 46(1), pp.33-50.
Köhler, M. (2012), “Which Banks are More Risky? The Impact of Loan Growth and Business Model
on Bank Risk-Taking?”, Discussion Paper, Deutsche Bundesbank, No. 33/2012.

19
Laeven, L. and Levine; R. (2009), “Bank Governance, Regulation and Risk-Taking”, Journal of Fi-nancial Economics, Vol. 93(2), pp. 259-275.
Laeven, L. and Majnoni, G. (2003), “Loan Loss Provisioning and Economic Slowdowns: Too Much,
Too Late?,” Journal of Financial Intermediation, Vol. 12, pp. 178-197.
Lepetit, L., Nys, E., Rous, P. and Tarazi, A. (2008), “The Expansion of Services in European Banking:
Implications for Loan Pricing and Interest Margins”, Journal of Banking and Finance, Vol. 32, pp.
2325-2335.
Liikanen (2012), “High-Level Expert Group on Reforming the Structure of the EU Banking Sector”.
Shleifer, A. (2011), “The transformation of Finance”, Lecture at American Finance Association Meet-
ings.
Stiroh, K. J. (2004), “Diversification in Banking: Is Non-Interest Income the Answer?”, Journal of Money, Credit, and Banking, Vol. 36, pp. 853-882.
Stiroh, K. J. (2006), “New Evidence on the Determinants of Bank Risk”, Journal of Financial Service Research, Vol. 30(3), pp. 237-263.
Stiroh, K. J. and Rumble, A. (2006), “The Dark Side of Diversification: The Case of US Financial
Holding Companies”, Journal of Banking and Finance, Vol. 30, pp. 2131-2161.

20
Appendix
Table 1: Bank Sample
Table 1 shows the distribution of observations across years for the entire sample as well as for savings, coopera-
tive and other banks separately. Other banks are the four big banks, the head institutions of the savings and co-
operative sector, regional banks and other credit institutions. We exclude real-estate and mortgage banks, spe-
cialized governmental credit institutions and the branches of foreign banks in Germany.
All
Banks Savings Banks
Cooperative Banks
Other Banks
2002 1,927 459 1,289 179
2003 1,932 459 1,290 183
2004 1,939 461 1,291 187
2005 1,942 461 1,291 190
2006 1,894 454 1,255 185
2007 1,854 443 1,230 181
2008 1,801 435 1,195 171
2009 1,747 428 1,155 164
2010 1,724 426 1,136 162
Total 16,760 4,026 11,132 1,602
(in percent) (100%) (24.02%) (66.42%) (9.56%)

21
Table 2: Non-Interest Income Share
Table 2 shows descriptive statistics for the ratio of net non-interest income to total operating income come
(NNINC) for the entire sample as well as for savings, cooperative and other banks separately. Other banks are
the four big banks, the head institutions of the savings and cooperative sector, regional banks and other credit in-
stitutions. We exclude real-estate and mortgage banks, specialized governmental credit institutions and the
branches of foreign banks in Germany. For a more detailed description of NNINC see Table 4.
All Savings Cooperative Other
Banks Banks Banks Banks
Observations 16,760 4,026 11,132 1,602
Mean 22.37 20.21 21.08 36.73
Median 21.04 20.13 21.32 28.59
Standard Deviation 11.46 3.27 6.03 29.41
Maximum 99.26 28.15 35.06 99.26
Minimum 0.01 11.91 2.53 0.01
Equality of Means Test (t-value)
Other Banks vs. Savings Banks -35.12*** -49.39*** -8.76***
Other Banks vs. Cooperative Banks
Savings Banks vs. Cooperative Banks

22
Table 3: Descriptive Statistics for Bank Risk and Returns
Table 3 shows descriptive statistics for different indicators of bank risk and returns. The Z-Score is defined as
the ratio of the return on assets (ROA) plus the capital-to-asset ratio (CAR) divided by the standard deviation of
the return on assets (SDROA). RAROA is the ratio of ROA over SDROA and RAROE is calculated as the re-
turn-on-equity (ROE) divided by the standard deviation of the ROE (SDROE). RACAR is the ratio of total equi-
ty divided by SDROA. Because SDROA and SDROE are calculated over the whole sample period, the number
of observations is significantly smaller for SDROA and SDROE. For a more detailed description of the variables
see Table 4. All variables are winsorized at the 1%- and 99%-level.
All Banks
Obs. Mean Median Std.Dev. Max. Min.
Z-Score 16,760 27.79 23.96 16.83 98.98 0.06
ROA 16,760 0.53 0.48 1.11 13.62 -18.77
CAR 16,760 6.49 5.67 5.55 85.22 1.06
RAROA 16,760 2.12 1.98 1.67 8.97 -2.89
RAROE 16,760 2.13 2.02 1.65 8.85 -2.76
RACAR 16,760 25.67 21.96 15.83 91.2 0.22
SDROA 1,944 0.48 0.26 1.65 38.13 0.06
SDROE 1,944 6.33 4.44 12.34 272.82 1.16
Savings Banks
Obs. Mean Median Std. Dev. Max. Min.
Z-Score 4,026 31.61 27.25 18.26 98.98 5.79
ROA 4,026 0.45 0.41 0.3 1.41 -0.06
CAR 4,026 5.05 4.95 1.06 8.14 2.86
RAROA 4,026 2.37 2.2 1.62 8.06 -0.23
RAROE 4,026 2.34 2.22 1.54 7.19 -0.27
RACAR 4,026 29.23 24.99 17.24 91.2 5.31
SDROA 461 0.23 0.2 0.13 0.75 0.06
SDROE 461 4.76 3.98 3.13 19.21 1.22
Cooperative Banks
Obs. Mean Median Std. Dev. Max. Min.
Z-Score 11,132 27.82 24.17 15.59 90.78 6.52
ROA 11,132 0.54 0.5 0.44 2.06 -0.96
CAR 11,132 6.1 5.87 1.44 11.12 3.29
RAROA 11,132 2.14 2 1.62 6.88 -2.38
RAROE 11,132 2.15 2.04 1.61 6.79 -2.37
RACAR 11,132 25.68 22.16 14.66 86.34 6.22
SDROA 1,291 0.31 0.27 0.18 1.01 0.07
SDROE 1,291 5.05 4.36 2.75 14.65 1.18
Other Banks
Obs. Mean Median Std. Dev. Max. Min.
Z-Score 1,602 17.99 12.99 17.4 89.68 0.06
ROA 1,602 0.68 0.53 3.37 13.62 -18.77
CAR 1,602 12.75 7.38 16.13 85.22 1.06
RAROA 1,602 1.4 1.05 1.96 8.97 -2.89
RAROE 1,602 1.46 1.09 2.02 8.85 -2.76
RACAR 1,602 16.62 11.57 16.42 83.19 0.22
SDROA 192 2.22 0.61 4.91 38.13 0.08
SDROE 192 18.72 9.11 36.09 272.82 1.16

23
Table 4: List of Variables
Table 4 shows the list of variables used in the regression analysis. All variables are winsorized at the 1%- and 99%-level. For descriptive statistics see Table 5.
Variable Description
CAR Winsorized fraction of total equity divided by total assets.
CIR Winsorized fraction of the cost-income ratio
COOPERATIVE Dummy variable that is one for cooperative banks and zero otherwise.
DEPOSITS Winsorized fraction of the customer deposits divided by total assets
LIQUID Wonsirized fraction of liquid assets divided by total assets. Liquid assets include cash.
LOANS Winsorized fraction of total customer loans divided by total assets
NIM Winsorized fraction of the net interest margin defined as the ratio of net interest income divided by total assets
NNINC Winsorized fraction of abs(Net non-interest income)/abs(Total operating income)
COMMISSION Winsorized fraction of abs(Net fee and commission income)/abs(Total operating income)
RACAR Winsorized fraction of the capital ratio (CAR) divided by the standard deviation of the return on assets
RAROA Winsorized fraction of the return-on-assets (ROA) divided by the standard deviation of the return on assets
ROA Winsorized fraction of the return-on-assets (ROA)
SAVINGS Dummy variable that is one for savings banks and zero otherwise.
SDROA Winsorized fraction of the standard deviation of the return-on-asset (ROA)
SDROE Winsorized fraction of the standard deviation of the return-on-equity (ROE)
SIZE Winsorized fraction of the logarithm of total bank assets
TRADING Winsorized fraction of abs(Net trading income)/abs(Total operating income)
ZSCORE Winsorized fraction of the Z-score is defined as the ratio of the return on assets (ROA) plus the capital-to-asset ratio (CAR) divided by the standard deviation of the return on assets (SDROA).

24
Table 5: Descriptive Statistics
Table 5 shows descriptive statistics for the variables used in our regression analysis. CAR is the ratio of equity
divided by total assets, DEPOSITS the ratio of customer deposits to total assets, COOPERATIVE a dummy var-
iable for cooperative banks and LIQUID the ratio of liquid assets to total assets. LOANS is defined as the ratio
of customer loans to total assets and NIM is the net interest margin. NNINC is the ratio of non-interest income to
total operating income and OVERHEAD the ratio of overhead costs to total assets. ROA is the return on assets,
RACAR the equity-to-asset ratio divided by the standard deviation of the ROA, RAROA the ROA divided by
the standard deviation of the ROA (SDROA) and RAROE the return-on-equity (ROE) divided by the standard
deviation of the ROE (SDROE). Z-SCORE is the ratio of the return-on-assets (ROA) plus the capital ratio
(CAR) divided by the standard deviation of the return on assets (SDROA). The sample comprises cooperative
banks, savings banks and other banks. Other banks are the four big banks, the head institutions of the savings
and cooperative sector and regional banks. For a more detailed description of the variables used in our regression
analysis see Table 4. All variables are winsorized at the 1%- and 99%-level.
Obs. Mean Median Std.dev. Max. Min.
CAR 16,760 6.49 5.67 5.55 85.22 1.06
CIR 16,760 75.67 73.02 33.62 788.05 10.92
COOPERATIVE 16,760 0.66 1.00 0.47 1.00 0.00
DEPOSITS 16,760 70.80 73.56 14.97 92.60 0.00
LIQUID 16,760 2.50 2.29 2.00 40.37 0.00
LOANS 16,760 57.12 59.08 15.48 99.65 0.00
NIM 16,760 2.53 2.53 0.76 11.74 -0.11
NNINC 16,760 22.37 21.04 11.46 99.26 0.01
RACAR 16,760 25.67 21.96 15.83 91.20 0.22
RAROA 16,760 2.12 1.98 1.67 8.97 -2.89
RAROE 16,760 2.13 2.02 1.65 8.85 -2.76
ROA 16,760 0.53 0.48 1.11 13.62 -18.77
ROE 16,760 8.92 8.39 9.07 87.01 -95.85
SAVINGS 16760 0.24 0.00 0.43 1.00 0.00
SDROA 16,760 0.46 0.26 1.54 38.13 0.06
SDROE 16,760 6.17 4.46 11.28 272.82 1.16
SIZE 16,760 12.94 12.86 1.51 19.87 7.20
ZSCORE 16,760 27.79 23.96 16.83 98.98 0.06
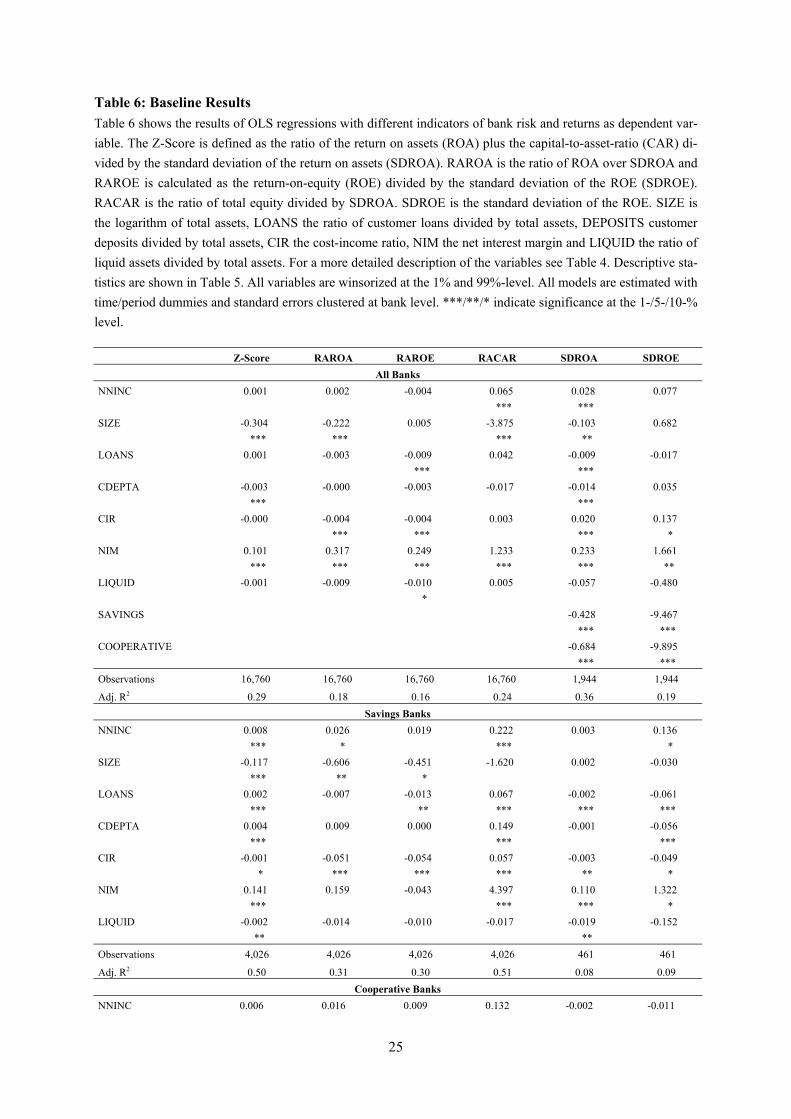
25
Table 6: Baseline Results
Table 6 shows the results of OLS regressions with different indicators of bank risk and returns as dependent var-
iable. The Z-Score is defined as the ratio of the return on assets (ROA) plus the capital-to-asset-ratio (CAR) di-
vided by the standard deviation of the return on assets (SDROA). RAROA is the ratio of ROA over SDROA and
RAROE is calculated as the return-on-equity (ROE) divided by the standard deviation of the ROE (SDROE).
RACAR is the ratio of total equity divided by SDROA. SDROE is the standard deviation of the ROE. SIZE is
the logarithm of total assets, LOANS the ratio of customer loans divided by total assets, DEPOSITS customer
deposits divided by total assets, CIR the cost-income ratio, NIM the net interest margin and LIQUID the ratio of
liquid assets divided by total assets. For a more detailed description of the variables see Table 4. Descriptive sta-
tistics are shown in Table 5. All variables are winsorized at the 1% and 99%-level. All models are estimated with
time/period dummies and standard errors clustered at bank level. ***/**/* indicate significance at the 1-/5-/10-%
level.
Z-Score RAROA RAROE RACAR SDROA SDROE
All Banks
NNINC 0.001 0.002 -0.004 0.065 0.028 0.077
*** ***
SIZE -0.304 -0.222 0.005 -3.875 -0.103 0.682
*** *** *** **
LOANS 0.001 -0.003 -0.009 0.042 -0.009 -0.017
*** ***
CDEPTA -0.003 -0.000 -0.003 -0.017 -0.014 0.035
*** ***
CIR -0.000 -0.004 -0.004 0.003 0.020 0.137
*** *** *** *
NIM 0.101 0.317 0.249 1.233 0.233 1.661
*** *** *** *** *** **
LIQUID -0.001 -0.009 -0.010 0.005 -0.057 -0.480
*
SAVINGS -0.428 -9.467
*** ***
COOPERATIVE -0.684 -9.895
*** ***
Observations 16,760 16,760 16,760 16,760 1,944 1,944
Adj. R2 0.29 0.18 0.16 0.24 0.36 0.19
Savings Banks
NNINC 0.008 0.026 0.019 0.222 0.003 0.136
*** * *** *
SIZE -0.117 -0.606 -0.451 -1.620 0.002 -0.030
*** ** *
LOANS 0.002 -0.007 -0.013 0.067 -0.002 -0.061
*** ** *** *** ***
CDEPTA 0.004 0.009 0.000 0.149 -0.001 -0.056
*** *** ***
CIR -0.001 -0.051 -0.054 0.057 -0.003 -0.049
* *** *** *** ** *
NIM 0.141 0.159 -0.043 4.397 0.110 1.322
*** *** *** *
LIQUID -0.002 -0.014 -0.010 -0.017 -0.019 -0.152
** **
Observations 4,026 4,026 4,026 4,026 461 461
Adj. R2 0.50 0.31 0.30 0.51 0.08 0.09
Cooperative Banks
NNINC 0.006 0.016 0.009 0.132 -0.002 -0.011

26
*** *** *** *
SIZE -0.124 -0.590 -0.439 -2.529 0.012 0.372
*** *** *** *** * ***
LOANS 0.001 -0.012 -0.017 0.059 -0.002 -0.032
** *** *** *** *** ***
CDEPTA 0.002 -0.001 -0.004 0.047 -0.003 -0.022
*** *** ***
CIR -0.000 -0.038 -0.042 0.046 0.001 0.006
*** *** ***
NIM 0.140 0.491 0.272 3.087 0.171 1.417
*** *** *** *** *** ***
LIQUID -0.000 0.000 0.001 0.010 -0.026 -0.222
*** *
Observations 11,132 11,132 11,132 11,132 1,291 1,291
Adj. R2 0.36 0.24 0.23 0.35 0.09 0.03
Other Banks
NNINC -0.001 0.006 0.001 0.018 0.042 0.214
* *** **
SIZE -0.344 -0.051 0.135 -2.970 -0.181 1.735
*** * *** ** **
LOANS 0.001 -0.000 -0.003 -0.016 -0.008 0.038
CDEPTA -0.005 -0.001 -0.002 -0.088 -0.013 0.060
*** ** **
CIR -0.000 -0.002 -0.002 -0.000 0.022 0.153
*** *** ***
NIM 0.087 0.166 0.127 0.727 0.242 2.232
*** *** *** *** ** **
LIQUID -0.001 -0.004 -0.007 0.004 -0.080 -0.488
Observations 1,602 1,602 1,602 1,602 192 192
Adj. R2 0.30 0.11 0.09 0.17 0.38 0.19
Time/ Period Dummies Yes Yes Yes Yes Yes Yes
Clustering Level Bank Bank Bank Bank Bank Bank

27
Table 7: Net Fee and Commission Income and Trading Income
Table 7 shows descriptive statistics for the net non-interest income (NNINC), net fee and commission (COMMISSION) and net trading income to total operating income share
(TRADING). The sample comprises savings banks, cooperative banks and retail- and investment-oriented banks. Investment-oriented banks are banks with a customer loans
(LOANS) and customer deposit-to-total asset ratio (DEPOSIT), respectively, of less than 50% that do not belong to the group of savings and cooperative banks. All other banks
belong to the group of retail-oriented banks. For a more detailed description of the variables see Table 4. Descriptive statistics are shown in Table 5. All variables are winsorized
at the 1% -/99%-level.
Net Non-Interest Income Share
Obs. Mean Median Std. Dev. Max. Min.
All Banks 16,589 21.95 20.98 10.15 99.26 0.01
Savings Banks 4,026 20.21 20.13 3.27 28.15 11.91
Cooperative Banks 11,132 21.08 21.32 6.03 35.06 2.53
Retail-Oriented Banks 1,164 31.87 24.63 26.67 99.26 0.00
Investment-Oriented Banks 438 49.65 40.64 32.31 99.26 0.00
Net Provision Income Share
Obs. Mean Median Std. Dev. Max. Min.
All Banks 16,589 21.42 20.59 9.81 99.14 0.00
Savings Banks 4,026 19.74 19.73 3.26 27.28 11.50
Cooperative Banks 11,132 20.79 21.02 5.99 34.20 2.26
Retail-Oriented Banks 1,164 29.83 21.90 26.05 99.14 0.00
Investment-Oriented Banks 438 44.92 31.85 34.00 99.13 0.00
Net Trading Income Share
Obs. Mean Median Std. Dev. Max. Min.
All Banks 16,589 0.50 0.04 1.94 38.44 0.00
Savings Banks 4,026 0.44 0.18 0.73 4.45 0.00
Cooperative Banks 11,132 0.26 0.01 0.69 4.43 0.00
Retail-Oriented Banks 1,164 1.98 0.00 5.06 38.44 0.00
Investment-Oriented Banks 438 4.62 0.96 8.08 38.44 0.00
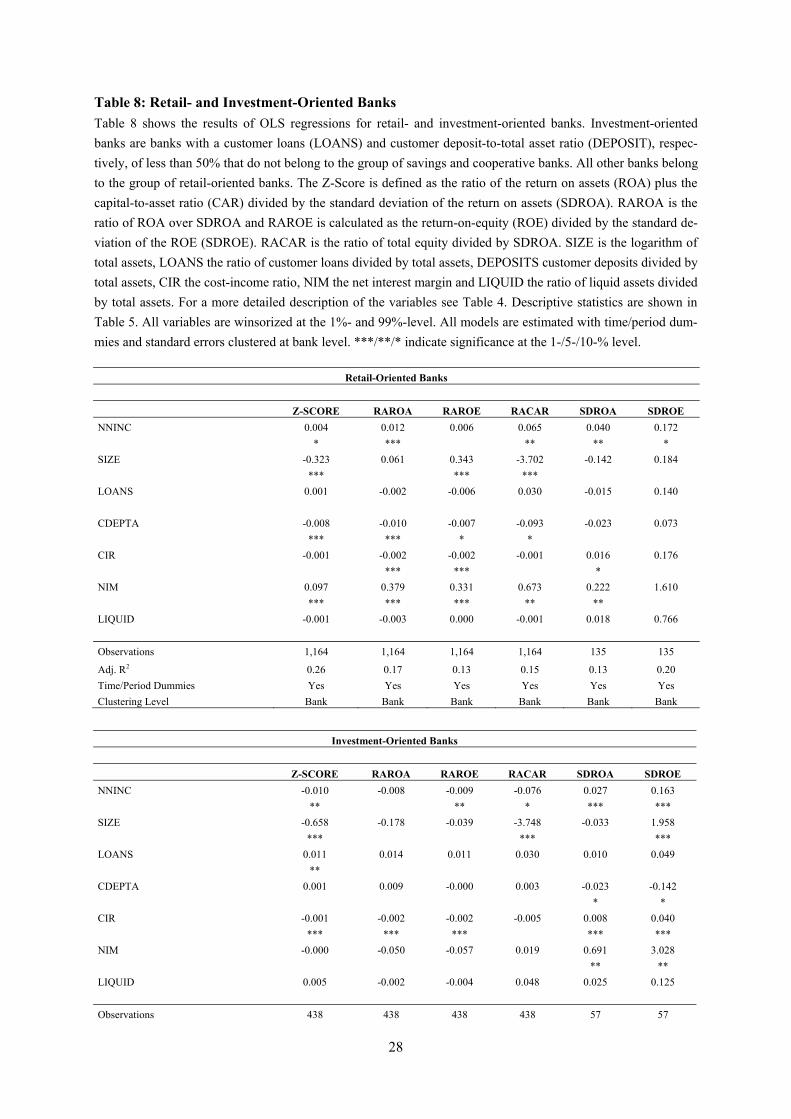
28
Table 8: Retail- and Investment-Oriented Banks
Table 8 shows the results of OLS regressions for retail- and investment-oriented banks. Investment-oriented
banks are banks with a customer loans (LOANS) and customer deposit-to-total asset ratio (DEPOSIT), respec-
tively, of less than 50% that do not belong to the group of savings and cooperative banks. All other banks belong
to the group of retail-oriented banks. The Z-Score is defined as the ratio of the return on assets (ROA) plus the
capital-to-asset ratio (CAR) divided by the standard deviation of the return on assets (SDROA). RAROA is the
ratio of ROA over SDROA and RAROE is calculated as the return-on-equity (ROE) divided by the standard de-
viation of the ROE (SDROE). RACAR is the ratio of total equity divided by SDROA. SIZE is the logarithm of
total assets, LOANS the ratio of customer loans divided by total assets, DEPOSITS customer deposits divided by
total assets, CIR the cost-income ratio, NIM the net interest margin and LIQUID the ratio of liquid assets divided
by total assets. For a more detailed description of the variables see Table 4. Descriptive statistics are shown in
Table 5. All variables are winsorized at the 1%- and 99%-level. All models are estimated with time/period dum-
mies and standard errors clustered at bank level. ***/**/* indicate significance at the 1-/5-/10-% level.
Retail-Oriented Banks
Z-SCORE RAROA RAROE RACAR SDROA SDROE
NNINC 0.004 0.012 0.006 0.065 0.040 0.172
* *** ** ** *
SIZE -0.323 0.061 0.343 -3.702 -0.142 0.184
*** *** ***
LOANS 0.001 -0.002 -0.006 0.030 -0.015 0.140
CDEPTA -0.008 -0.010 -0.007 -0.093 -0.023 0.073
*** *** * *
CIR -0.001 -0.002 -0.002 -0.001 0.016 0.176
*** *** *
NIM 0.097 0.379 0.331 0.673 0.222 1.610
*** *** *** ** **
LIQUID -0.001 -0.003 0.000 -0.001 0.018 0.766
Observations 1,164 1,164 1,164 1,164 135 135
Adj. R2 0.26 0.17 0.13 0.15 0.13 0.20
Time/Period Dummies Yes Yes Yes Yes Yes Yes
Clustering Level Bank Bank Bank Bank Bank Bank
Investment-Oriented Banks
Z-SCORE RAROA RAROE RACAR SDROA SDROE
NNINC -0.010 -0.008 -0.009 -0.076 0.027 0.163
** ** * *** ***
SIZE -0.658 -0.178 -0.039 -3.748 -0.033 1.958
*** *** ***
LOANS 0.011 0.014 0.011 0.030 0.010 0.049
**
CDEPTA 0.001 0.009 -0.000 0.003 -0.023 -0.142
* *
CIR -0.001 -0.002 -0.002 -0.005 0.008 0.040
*** *** *** *** ***
NIM -0.000 -0.050 -0.057 0.019 0.691 3.028
** **
LIQUID 0.005 -0.002 -0.004 0.048 0.025 0.125
Observations 438 438 438 438 57 57

29
Adj. R2 0.44 0.14 0.13 0.18 0.68 0.29
Time/Period Dummies Yes Yes Yes Yes Yes Yes
Clustering Level Bank Bank Bank Bank Bank Bank

30
Table 9: Results without 2009 and 2010
Table 9 shows the results of OLS regressions with different indicators of bank risk and returns as dependent var-
iable. The sample period is from 2002 to 2008. The sample comprises savings banks, cooperative banks and re-
tail- and investment-oriented banks. Investment-oriented banks are banks with a customer loans (LOANS) and
customer deposit-to-total asset ratio (DEPOSIT), respectively, of less than 50% that do not belong to the group
of savings and cooperative banks. All other banks belong to the group of retail-oriented banks. The Z-Score is
defined as the ratio of the return-on-assets (ROA) plus the capital-to-asset ratio (CAR) divided by the standard
deviation of the return-on-assets (SDROA). RAROA is the ratio of ROA over SDROA and RAROE is calculated
as the return-on-equity (ROE) divided by the standard deviation of the ROE (SDROE). RACAR is the ratio of
total equity divided by SDROA. SIZE is the logarithm of total assets, LOANS the ratio of customer loans divid-
ed by total assets, DEPOSITS customer deposits divided by total assets, CIR the cost-income ratio, NIM the net
interest margin and LIQUID the ratio of liquid assets divided by total assets. For a more detailed description of
the variables see Table 4. Descriptive statistics are shown in Table 5. All variables are winsorized at the 1%- and
99%-level. All models are estimated with time/period dummies and standard errors clustered at bank level.
***/**/* indicate significance at the 1-/5-/10-% level.
Z-Score RAROA RAROE RACAR SDROA SDROE
All Banks
NNINC 0.002 0.006 0.001 0.074 0.012 0.039
*** *** **
SIZE -0.230 -0.254 -0.031 -3.790 -0.062 0.296
*** *** *** *** ***
LOANS 0.002 -0.003 -0.009 0.063 -0.003 -0.018
*** * * *
DEPOSITS -0.002 -0.002 -0.002 -0.041 -0.008 -0.023
* *** *
CIR 0.000 -0.004 -0.004 0.002 0.006 0.022
*** *** *** **
NIM 0.057 0.222 0.170 1.268 0.150 0.592
*** *** *** *** *** **
LIQUID 0.000 -0.005 -0.006 -0.014 -0.007 -0.089
SAVINGS -0.380 -4.019
*** ***
COOPERATIVE -0.428 -3.208
*** ***
Observations 13,289 13,289 13,289 13,289 1,944 1,944
Adj. R2 0.26 0.15 0.15 0.23 0.48 0.20
Z-Score RAROA RAROE RACAR SDROA SDROE
Savings Banks
NNINC 0.006 0.043 0.042 0.205 -0.001 0.066
*** *** *** ***
SIZE -0.087 -0.610 -0.472 -1.489 -0.006 -0.118
*** *
LOANS 0.003 -0.011 -0.017 0.088 -0.001 -0.047
*** ** *** ***
DEPOSITS 0.005 0.008 0.002 0.172 -0.001 -0.051
*** *** ***
CIR -0.002 -0.059 -0.059 0.029 -0.001 -0.030
*** *** *** ***
NIM 0.093 0.044 -0.096 3.885 0.044 0.188
*** ***
LIQUID -0.004 -0.018 -0.009 -0.081 -0.016 -0.230
*** **
Observations 3,172 3,172 3,172 3,172 461 461
Adj. R2 0.41 0.28 0.29 0.51 0.05 0.09

31
Cooperative Banks
NNINC 0.006 0.023 0.018 0.175 -0.006 -0.047
*** *** ** *** ** *
SIZE -0.120 -0.869 -0.752 -2.588 0.013 0.311
*** *** *** *** ***
LOANS 0.001 -0.016 -0.021 0.062 -0.002 -0.019
*** *** *** ** *
DEPOSITS 0.000 -0.012 -0.012 0.042 -0.006 -0.041
*** ** ** *** **
CIR -0.000 -0.034 -0.037 0.059 0.001 -0.005
*** *** ***
NIM 0.140 0.406 0.212 3.993 0.211 1.535
*** *** ** *** *** ***
LIQUID -0.002 -0.002 0.001 -0.056 -0.036 -0.322
* *** **
Observations 8841 8841 8841 8841 1291 1291
Adj. R2 0.33 0.20 0.19 0.36 0.11 0.03
Retail-Oriented Banks
NNINC 0.004 0.014 0.010 0.042 0.018 0.069
* *** ** *** *
SIZE -0.285 0.045 0.279 -4.216 -0.090 0.820
*** * *** * *
LOANS 0.003 0.000 -0.007 0.079 0.003 0.026
DEPOSITS -0.006 -0.005 0.000 -0.181 -0.005 0.004
*** **
CIR -0.000 -0.002 -0.002 -0.003 0.006 0.036
** *** ** **
NIM 0.044 0.376 0.352 0.493 0.108 0.544
** *** *** *
LIQUID -0.001 0.006 0.010 -0.056 -0.048 0.145
Observations 912 912 912 912 135 135
Adj. R2 0.27 0.15 0.12 0.18 0.25 0.05
Investment-Oriented Banks
NNINC -0.010 -0.015 -0.016 -0.070 0.025 0.189
*** ** ** * *** ***
SIZE -0.365 -0.351 0.079 -2.779 -0.101 1.524
*** * ***
LOANS 0.009 0.018 0.014 0.069 0.020 0.097
*
DEPOSITS -0.002 0.013 0.007 -0.046 -0.020 -0.080
* *
CIR -0.001 -0.003 -0.002 -0.003 0.008 0.030
*** *** *** ***
NIM -0.005 -0.096 -0.128 0.199 0.784 2.369
** *** *
LIQUID 0.005 0.000 -0.004 0.102 0.031 0.081
Observations 364 364 364 364 57 57
Adj. R2 0.31 0.18 0.17 0.18 0.73 0.22 Time/Period Dummies Yes Yes Yes Yes Yes Yes
Clustering Level Bank Bank Bank Bank Bank Bank
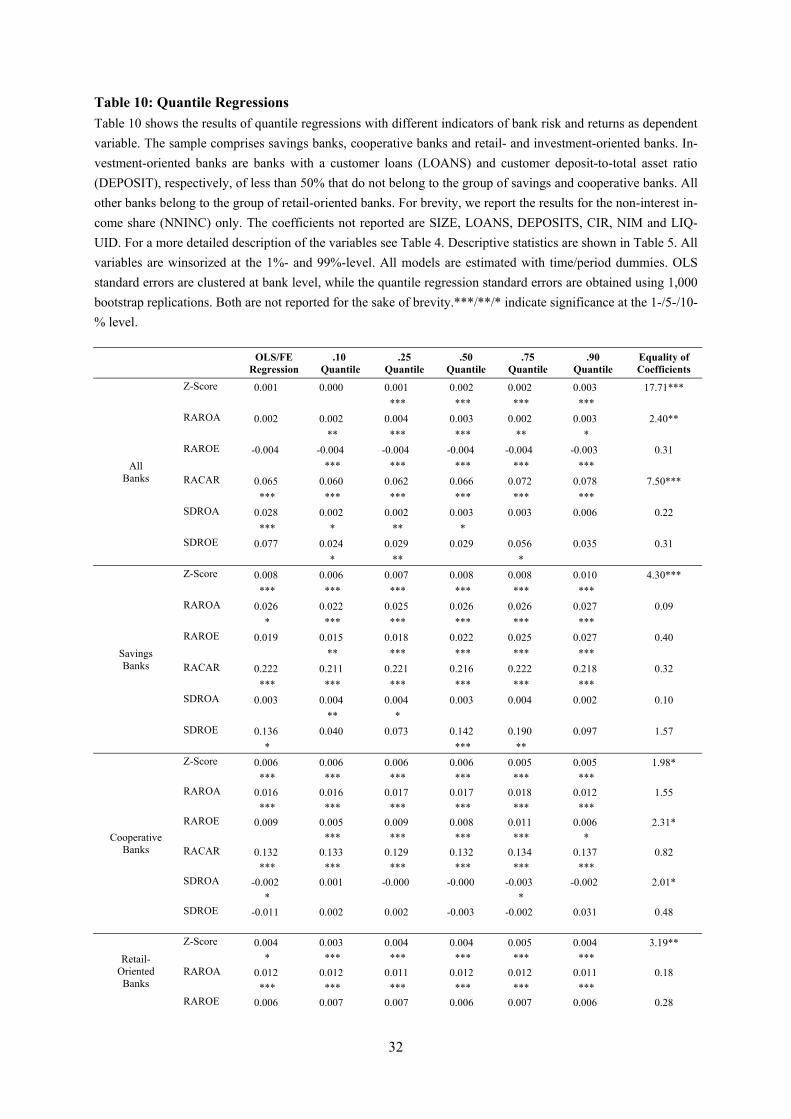
32
Table 10: Quantile Regressions
Table 10 shows the results of quantile regressions with different indicators of bank risk and returns as dependent
variable. The sample comprises savings banks, cooperative banks and retail- and investment-oriented banks. In-
vestment-oriented banks are banks with a customer loans (LOANS) and customer deposit-to-total asset ratio
(DEPOSIT), respectively, of less than 50% that do not belong to the group of savings and cooperative banks. All
other banks belong to the group of retail-oriented banks. For brevity, we report the results for the non-interest in-
come share (NNINC) only. The coefficients not reported are SIZE, LOANS, DEPOSITS, CIR, NIM and LIQ-
UID. For a more detailed description of the variables see Table 4. Descriptive statistics are shown in Table 5. All
variables are winsorized at the 1%- and 99%-level. All models are estimated with time/period dummies. OLS
standard errors are clustered at bank level, while the quantile regression standard errors are obtained using 1,000
bootstrap replications. Both are not reported for the sake of brevity.***/**/* indicate significance at the 1-/5-/10-
% level.
OLS/FE
Regression .10
Quantile .25
Quantile .50
Quantile .75
Quantile .90
Quantile Equality of Coefficients
All Banks
Z-Score 0.001 0.000 0.001 0.002 0.002 0.003 17.71***
*** *** *** *** RAROA 0.002 0.002 0.004 0.003 0.002 0.003 2.40**
** *** *** ** * RAROE -0.004 -0.004 -0.004 -0.004 -0.004 -0.003 0.31
*** *** *** *** *** RACAR 0.065 0.060 0.062 0.066 0.072 0.078 7.50***
*** *** *** *** *** *** SDROA 0.028 0.002 0.002 0.003 0.003 0.006 0.22
*** * ** * SDROE 0.077 0.024 0.029 0.029 0.056 0.035 0.31 * ** *
Savings Banks
Z-Score 0.008 0.006 0.007 0.008 0.008 0.010 4.30***
*** *** *** *** *** *** RAROA 0.026 0.022 0.025 0.026 0.026 0.027 0.09
* *** *** *** *** *** RAROE 0.019 0.015 0.018 0.022 0.025 0.027 0.40
** *** *** *** *** RACAR 0.222 0.211 0.221 0.216 0.222 0.218 0.32
*** *** *** *** *** *** SDROA 0.003 0.004 0.004 0.003 0.004 0.002 0.10
** * SDROE 0.136 0.040 0.073 0.142 0.190 0.097 1.57 * *** **
Cooperative Banks
Z-Score 0.006 0.006 0.006 0.006 0.005 0.005 1.98*
*** *** *** *** *** *** RAROA 0.016 0.016 0.017 0.017 0.018 0.012 1.55
*** *** *** *** *** *** RAROE 0.009 0.005 0.009 0.008 0.011 0.006 2.31*
*** *** *** *** * RACAR 0.132 0.133 0.129 0.132 0.134 0.137 0.82
*** *** *** *** *** *** SDROA -0.002 0.001 -0.000 -0.000 -0.003 -0.002 2.01*
* * SDROE -0.011 0.002 0.002 -0.003 -0.002 0.031 0.48
Retail- Oriented Banks
Z-Score 0.004 0.003 0.004 0.004 0.005 0.004 3.19**
* *** *** *** *** *** RAROA 0.012 0.012 0.011 0.012 0.012 0.011 0.18
*** *** *** *** *** *** RAROE 0.006 0.007 0.007 0.006 0.007 0.006 0.28

33
*** *** *** *** *** RACAR 0.065 0.093 0.072 0.064 0.061 0.049 3.02**
** *** *** *** *** *** SDROA 0.040 0.004 0.006 0.008 0.017 0.059 1.11
** ** ** ** SDROE 0.172 0.071 0.071 0.070 0.174 0.301 0.25 * ** ** *
Investment-Oriented Banks
Z-Score -0.010 -0.012 -0.011 -0.011 -0.009 -0.008 1.93
** *** *** *** *** *** RAROA -0.008 -0.007 -0.007 -0.008 -0.009 -0.009 0.08
*** *** *** *** ** RAROE -0.009 -0.009 -0.007 -0.007 -0.009 -0.013 0.99
** *** *** *** *** *** RACAR -0.076 -0.062 -0.072 -0.073 -0.085 -0.109 2.04*
* *** *** *** *** *** SDROA 0.052 0.009 0.003 0.032 0.085 0.077 1.92
** *** ** SDROE 0.388 0.049 0.059 0.119 0.254 0.546 0.57 * *

34
Table 11: Results with Fee and Commission and Trading Income Share
Table 11 shows the results of quantile regressions for different indicators of bank risk and returns as dependent variable. Investment-oriented banks are banks with a customer
loans (LOANS) and customer deposit-to-total asset ratio (DEPOSIT), respectively, of less than 50% that do not belong to the group of savings and cooperative banks. All other
banks belong to the group of retail-oriented banks. For brevity, we report the results for only the net fee and commission income (COMMISSION) and net trading income share
(TRADING) only. For a more detailed description of the variables see Table 4. Descriptive statistics are shown in Table 5. All variables are winsorized at the 1%- and 99%-level.
OLS standard errors are clustered at bank level, while the quantile regression standard errors are obtained using 1,000 bootstrap replications. Both are not reported for the sake of
brevity.***/**/* indicate significance at the 1-/5-/10-% level.
Retail-Oriented Banks
OLS/FE Regression
.10 Quantile
.25 Quantile
.50 Quantile
.75 Quantile
.90 Quantile
Equality of Coefficients
Z-Score
COMMISSION 0.004 0.003 0.004 0.004 0.005 0.005 2.64**
* *** *** *** *** ***
TRADING 0.002 0.001 0.001 0.001 0.002 -0.003 0.82
RAROA
COMMISSION 0.011 0.010 0.011 0.011 0.011 0.010 0.26
*** *** *** *** *** ***
TRADING 0.019 0.008 0.010 0.013 0.023 0.045 1.12
** *** **
RAROE
COMMISSION 0.005 0.007 0.006 0.006 0.006 0.005 0.26
*** *** *** *** **
TRADING 0.013 0.007 0.005 0.004 -0.003 0.031 0.85
*
RACAR
COMMISSION 0.064 0.091 0.073 0.064 0.061 0.051 2.50**
** *** *** *** *** ***
TRADING 0.060 0.131 0.096 0.060 0.059 0.026 1.94
*** *** *** ***
SDROA
COMMISSION 0.039 0.003 0.006 0.008 0.017 0.054 0.86
** * * *
TRADING 0.104 0.015 0.007 -0.006 0.049 0.141 0.40
SDROE
COMMISSION 0.170 0.078 0.066 0.069 0.177 0.268 0.38
** ** *
TRADING 0.257 0.053 0.242 0.350 0.511 1.026 0.40

35
Investment-Oriented Banks
OLS/FE Regression
.10 Quantile
.25 Quantile
.50 Quantile
.75 Quantile
.90 Quantile
Equality of Coefficients
Z-Score
COMMISSION -0.012 -0.014 -0.013 -0.012 -0.011 -0.011 1.12
*** *** *** *** *** ***
TRADING -0.003 -0.005 -0.006 -0.003 -0.001 -0.003 0.87
**
RAROA
COMMISSION -0.007 -0.006 -0.006 -0.008 -0.008 -0.007 0.31
* *** *** *** *
TRADING -0.013 -0.020 -0.013 -0.013 -0.012 -0.015 0.13
* *
RAROE
COMMISSION -0.008 -0.008 -0.007 -0.007 -0.009 -0.014 1.11
* ** *** *** *** ***
TRADING -0.012 -0.026 -0.011 -0.004 -0.008 -0.011 0.93
**
RACAR
COMMISSION -0.088 -0.071 -0.081 -0.085 -0.098 -0.116 1.60
* *** *** *** *** ***
TRADING -0.021 -0.049 -0.021 -0.028 -0.027 -0.040 0.20
SDROA
COMMISSION 0.059 0.011 0.004 0.032 0.088 0.087 1.57
** ** ***
TRADING -0.087 0.005 0.005 -0.007 0.005 -0.027 0.04
SDROE
COMMISSION 0.458 0.015 0.103 0.087 0.346 0.529 0.79
** *
TRADING -1.181 -0.231 -0.199 -0.370 -0.693 -1.469 0.11

36
Figure 1: Development of Net Interest and Net Non-Interest Margins
Figure 1 shows the development of the average net interest margin and the average net non-interest margin of
German banks between 2002 and 2010. The net interest margin is the ratio of net interest income divided by total
assets, while the net non-interest income share is net non-interest income divided by total assets. The sample in-
cludes savings banks, cooperative banks and other banks. Other banks are the four big banks, the head institu-
tions of the savings and cooperative sector, regional banks and other credit institutions. We do not include spe-
cial purpose institutions, real-estate and mortgage banks and the German branches of foreign banks. Please note
that the y-axes are scaled differently.
.8.9
11
.11
.2N
et N
on-I
nte
rest
Mar
gin
2.2
2.4
2.6
2.8
Net
Inte
rest
Ma
rgin
2002 2004 2006 2008 2010Year
Net Interest MarginNet Non-Interest Margin

37
Figure 2: Development of Interest and Non-Interest Income
Figure 2 shows the development of total net interest income and total net non-interest income between 2002 and
2010 for the entire sample and for savings banks, cooperative banks and other banks separately. The sample in-
cludes savings banks, cooperative banks and other banks. Other banks are the four big banks, the head institu-
tions of the savings and cooperative sector, regional banks and other credit institutions. We do not include spe-
cial purpose institutions, real-estate and mortgage banks and the German branches of foreign banks. Please note
that the y-axes are scaled differently.
1020
3040
Tot
al N
et N
on-I
nter
est I
ncom
e (B
ill.)
4050
6070
80T
otal
Net
Inte
rest
Inco
me
(Bill
.)
2002 2004 2006 2008 2010Year
Total Net Interest Income
Total Net Non-Interest Income
All Banks
05
10T
otal
Net
Non
-Int
eres
t Inc
ome
(Bill
.)
1015
2025
30T
otal
Net
Inte
rest
Inco
me
(Bill
.)
2002 2004 2006 2008 2010Year
Total Net Interest Income
Total Net Non-Interest Income
Savings Banks
05
10T
otal
Net
Non
-Int
eres
t Inc
ome
(Bill
.)
1015
2025
30T
otal
Net
Inte
rest
Inco
me
(Bill
.)
2002 2004 2006 2008 2010Year
Total Net Interest Income
Total Net Non-Interest Income
Cooperative Banks
1020
3040
Tot
al N
et N
on-I
nter
est I
ncom
e (B
ill.)
3040
5060
7080
90T
otal
Net
Inte
rest
Inco
me
(Bill
.)
2002 2004 2006 2008 2010Year
Total Net Interest Income
Total Net Non-Interest Income
Other Banks

38
Figure 3: Distribution of Banks’ Non-Interest Income Share
Figure 3 shows the distribution of banks’ average non-interest income to total operating income share for the pe-
riod between 2002 and 2010. The sample includes savings banks, cooperative banks and other banks. The sam-
ple includes savings banks, cooperative banks and other banks. Other banks are the four big banks, the head in-
stitutions of the savings and cooperative sector, regional banks and other credit institutions. We do not include
special purpose institutions, real-estate and mortgage banks and the branches of foreign banks in Germany.
0.0
2.0
4.0
6.0
8D
ensi
ty
0 20 40 60 80 100Non-Interest Income Share

39
Figure 4: Non-Interest Income Share and Bank Risk-Taking
Figure 4 shows the relationship between banks’ non-interest income share (NNINC) and the Z-Score. The Z-
Score (ZSCORE) is defined as the ratio of the return on assets (ROA) plus the capital ratio (CAR) divided by the
standard deviation of the return on assets (SDROA). Banks are divided according to their non-interest income
share into 10 groups each containing 10% of observations. For each of these groups, we calculate the mean Z-
Score plot them against the 10 bins of the distribution. The sample includes savings banks, cooperative banks
and other banks. Other banks are the four big banks, the head institutions of the savings and cooperative sector,
regional banks and other credit institutions.
20
22
24
26
28
30
Z-S
core
, Ave
rag
e
1 3 5 7 9Non-Interest Income Share


