Does market access improve dietary diversity and food ...
21
RESEARCH Open Access Does market access improve dietary diversity and food security? Evidence from Southwestern Ethiopian smallholder coffee producers Muhammed Abdella Usman * and Daniel Callo-Concha * Correspondence: mausman25@ gmail.com Center for Development Research (ZEF), University of Bonn, Genscherallee 3, 53113 Bonn, Germany Abstract Market access influences the dietary diversity and food security for smallholder households in many ways. In Ethiopia, most smallholders are subsistence farmers who have poor access to markets. This study used primary data from a household survey to examine the relationship between market access and the dietary diversity and food security for 324 smallholder households in the Yayu area of southwestern Ethiopia in early 2018. Multivariate regression analysis showed that households located far from market centers consumed not only less diverse foods but also spend less on food consumption than households located close to market centers. The correlation between market access and food security measured by Household Food Insecurity Access Scale (HFIAS) did not reach statistical significance, nor did the impact of market access on household consumption and dietary diversity through income. Rather, greater market access appeared to encourage smallholder households to rely on market purchases more than their own production to improve the diversity of household consumption. A direct action to improve the market accessibility would be investments in infrastructure to expand rural road connectivity, which would reduce transaction costs and benefit the welfare of smallholder farmers and communities. Keywords: Market access, Dietary diversity, Food security, Cash crop, Yayu agroforestry systems, Ethiopia JEL classifications: O12, O13, Q18 Introduction Food insecurity and undernutrition rates are high in many Sub-Saharan African coun- tries (UNDP 2012). In addition to compromising wellbeing, undernourishment in early life impairs proper cognitive and physical development, which affects later health out- comes, school performance, and labor productivity in adulthood (Alderman et al. 2006; Glewwe et al. 2001). Globally, around 815 million people were estimated to be chronic- ally undernourished in 2016 (FAO, IFAD, UNICEF, WFP, and WHO 2017). In Ethiopia, about 38% of children younger than 5 years have stunted growth, defined as © The Author(s). 2021 Open Access This article is licensed under a Creative Commons Attribution 4.0 International License, which permits use, sharing, adaptation, distribution and reproduction in any medium or format, as long as you give appropriate credit to the original author(s) and the source, provide a link to the Creative Commons licence, and indicate if changes were made. The images or other third party material in this article are included in the article's Creative Commons licence, unless indicated otherwise in a credit line to the material. If material is not included in the article's Creative Commons licence and your intended use is not permitted by statutory regulation or exceeds the permitted use, you will need to obtain permission directly from the copyright holder. To view a copy of this licence, visit http://creativecommons.org/licenses/by/4.0/. Agricultural and Food Economics Usman and Callo-Concha Agricultural and Food Economics (2021) 9:18 https://doi.org/10.1186/s40100-021-00190-8
Transcript of Does market access improve dietary diversity and food ...

RESEARCH Open Access
Does market access improve dietarydiversity and food security? Evidence fromSouthwestern Ethiopian smallholder coffeeproducersMuhammed Abdella Usman* and Daniel Callo-Concha
* Correspondence: [email protected] for Development Research(ZEF), University of Bonn,Genscherallee 3, 53113 Bonn,Germany
Abstract
Market access influences the dietary diversity and food security for smallholderhouseholds in many ways. In Ethiopia, most smallholders are subsistence farmerswho have poor access to markets. This study used primary data from a householdsurvey to examine the relationship between market access and the dietary diversityand food security for 324 smallholder households in the Yayu area of southwesternEthiopia in early 2018. Multivariate regression analysis showed that householdslocated far from market centers consumed not only less diverse foods but alsospend less on food consumption than households located close to market centers.The correlation between market access and food security measured by HouseholdFood Insecurity Access Scale (HFIAS) did not reach statistical significance, nor did theimpact of market access on household consumption and dietary diversity throughincome. Rather, greater market access appeared to encourage smallholderhouseholds to rely on market purchases more than their own production to improvethe diversity of household consumption. A direct action to improve the marketaccessibility would be investments in infrastructure to expand rural road connectivity,which would reduce transaction costs and benefit the welfare of smallholder farmersand communities.
Keywords: Market access, Dietary diversity, Food security, Cash crop, Yayuagroforestry systems, Ethiopia
JEL classifications: O12, O13, Q18
IntroductionFood insecurity and undernutrition rates are high in many Sub-Saharan African coun-
tries (UNDP 2012). In addition to compromising wellbeing, undernourishment in early
life impairs proper cognitive and physical development, which affects later health out-
comes, school performance, and labor productivity in adulthood (Alderman et al. 2006;
Glewwe et al. 2001). Globally, around 815 million people were estimated to be chronic-
ally undernourished in 2016 (FAO, IFAD, UNICEF, WFP, and WHO 2017). In
Ethiopia, about 38% of children younger than 5 years have stunted growth, defined as
© The Author(s). 2021 Open Access This article is licensed under a Creative Commons Attribution 4.0 International License, whichpermits use, sharing, adaptation, distribution and reproduction in any medium or format, as long as you give appropriate credit to theoriginal author(s) and the source, provide a link to the Creative Commons licence, and indicate if changes were made. The images orother third party material in this article are included in the article's Creative Commons licence, unless indicated otherwise in a creditline to the material. If material is not included in the article's Creative Commons licence and your intended use is not permitted bystatutory regulation or exceeds the permitted use, you will need to obtain permission directly from the copyright holder. To view acopy of this licence, visit http://creativecommons.org/licenses/by/4.0/.
Agricultural and FoodEconomics
Usman and Callo-Concha Agricultural and Food Economics (2021) 9:18 https://doi.org/10.1186/s40100-021-00190-8

low height for age (CSA and ICF International 2017), which indicates chronic
malnutrition.
Agricultural production remains the main source of livelihood for many rural house-
holds, and this industry employs over 60% of the labor force in Sub-Saharan Africa
(Thornton et al. 2011). The link between agriculture and security of food and nutrition
is, at first sight, straightforward. Paradoxically, most of the poor and undernourished
people live in smallholder households, defined as small farms operating within a small-
scale model of agriculture (Ogutu et al. 2020). Cultivating diverse crops and raising
livestock has a positive dietary effect on the supply of micronutrients to smallholder
households. Nevertheless, the empirical evidence that links agriculture and nutrition
outcome appears weak (Webb and Kennedy 2014).
The growth in agricultural productivity has done little to improve food and nutrition
security of farming households because gains in productivity are mainly from the pro-
duction of staple foods, such as rice, wheat, and maize, which are crops that provide
only a scarce amount of vitamins and minerals (UNDP 2012). Food and nutrition se-
curity are influenced not only by the quantity of available food but also by its diversity.
As a result, access to healthy, diverse, and affordable food is central to household food
security (Ruel et al. 2017). Furthermore, most smallholders sell their staples and buy
food items from local markets. Subsequently, identifying and understanding the inter-
actions between agriculture and nutrition is far more complicated than may be
assumed.
Smallholders need more than increasing agricultural productivity to ensure a sus-
tained supply of diverse foods and to safeguard their food and nutrition security. In-
creasing on-farm production diversity is positively associated with greater diversity in
household food consumption (e.g., Bellon et al. 2016; Chegere and Stage 2020; Islam
et al. 2018; Jones et al. 2014; Muthini et al. 2020; Sibhatu et al. 2015; Singh et al. 2020;
Usman and Haile 2019). However, this type of production may not happen if farming
income from specialized production outweighs the gains from farming diversification
(Sibhatu et al. 2015).
Smallholders face several constraints that prevent them from expanding and diversi-
fying their production beyond the subsistence level. In Ethiopia, most smallholders are
located in remote areas; therefore, they are poorly connected to local markets, which
results in high transaction costs in terms of buying and selling agricultural products
and other goods (Stifel and Minten 2017). Smallholders are also poorly linked to mar-
kets because of a lack of information, low production, and low farm-gate prices—prices
received by farmers for their produce at the location of a farm (Wiggins and Keats
2013). All these conditions are concomitant in Ethiopia.
Agroforestry is the dominant farming system in southwestern Ethiopia. Farmers pro-
duce a variety of food crops, fruits, and vegetables as well as shrubs and trees—some of
high value—on the same piece of land (Jemal et al. 2018). Agroforestry systems can be
a source of micronutrients and contribute to diversifying household food consumption
(Jemal et al. 2018); however, the farming system is dominated by a few high-value cash
crops, such as coffee (Coffea arabica) and khat (Catha edulis). This focus may affect
own-food crop production because more agricultural resources are freed from staple
food production to be used more efficiently for producing cash crops. In turn, small-
holder households become less self-sufficient and more dependent on markets.
Usman and Callo-Concha Agricultural and Food Economics (2021) 9:18 Page 2 of 21

Markets offer more diverse foods than any given household can produce (Bellon
et al. 2016). Markets also determine the price for agricultural produce and the
farmer’s revenue, which affects the household consumption expenditures (Stifel and
Minten 2017). Previous research showed that smallholders generating income from
cash crops spend more money on foods of better quantity (Negash and Swinnen
2013; Pierre-Louis et al. 2007). For example, Negash and Swinnen (2013) found a
positive relationship between household food caloric intake and the production of
castor beans (Ricinus communis), a species used for biofuel in Ethiopia. In contrast,
a study in Vietnam by Janssen (2018) reported that commercialized households
spend a larger share of their incomes on non-food items than on food. Taken to-
gether, these findings suggest that the effects of income from cash crops on the
food access for a smallholder household can be either positive or neutral, depend-
ing on the local context.
In this setting, this study aims to understand the extent to which market access
contributes to the dietary diversity and food security of smallholder households in
the Yayu area of southwestern Ethiopia. To measure food security, the study used
the Household Dietary Diversity Score (HDDS) as a proxy for diet quality and the
Household Food Insecurity Access Scale (HFIAS) score as proxies for both the be-
havioral and psychological aspects of insecure food access for the household. The
article is structured as follows: “Market access, household dietary diversity and food
security” section addresses the links between market access and household con-
sumption and food security. “Materials and methods” section presents the data
sampled and the statistical methods for analysis. “Results and discussion” section
provides the descriptive and the multivariate regression results and discusses the
findings. “Conclusions” section concludes with the implications of the study find-
ings and ad hoc suggestions.
Market access, household dietary diversity, and food securityAccess to markets can increase smallholders’ income and improve their food con-
sumption (Abay and Hirvonen 2017; Dercon et al. 2009), and consequently reduce
poverty and food insecurity (Pingali 1997). Because food and nutrition security re-
quire not only access to a sufficient amount of food but also access to diversified
foods, market access can directly contribute to those requirements by increasing
the availability and variety of micronutrient-rich foods (e.g., Abay and Hirvonen
2017; Sibhatu et al. 2015; Stifel and Minten 2017; Usman and Haile 2019). Thus,
market access can partially substitute for the need to produce diverse food crops
to diversify household consumption.
Greater market access can also increase the opportunities for livelihood diversifica-
tion (Jacoby and Minten 2009) and income generation, which can, in turn, empower
the household to purchase a variety of foods from local markets (Sibhatu et al. 2015).
In addition, higher incomes allow households to access better healthcare services,
which can improve health and nutrition outcomes (von Braun 1995). Better market ac-
cess also means that smallholders gain faster access to agricultural inputs that induce
farm productivity, which results in higher household income (UNDP 2012). In sum, the
World Bank (2012) suggests that better market access is central to improving the well-
being of the rural population in many low- and middle-income countries.
Usman and Callo-Concha Agricultural and Food Economics (2021) 9:18 Page 3 of 21

In a setting in which household consumption and farm production decisions are in-
separable due to imperfect input/output markets, decisions about production and con-
sumption are made jointly. Thus, a household’s production decision also affects a
household’s consumption. In one regard, the income from cash crop production can
also be used to purchase farm inputs for food crop production that increase productiv-
ity and thereby improve food availability (Govereh and Jayne 2003). In another regard,
household food consumption may be negatively affected if more agricultural inputs
such as land and labor shift away from food crop production (von Braun and Kennedy
1994) because non-cash crop production becomes an inferior income stream for house-
holds due to its low financial return. What determines smallholders’ priorities in re-
source allocation and investment decisions also affects the production of other food
crops, fruits, and vegetables (Immink and Alarcon 1993). Because food crops and vege-
tables that provide calories and micronutrients to rural households are produced in
limited quantities, market access determines the availability of foods for highly com-
mercialized farm households. Overall, market access may not always translate into en-
hanced household food and nutrition security because its impact is context-specific
(e.g., Linderhof et al. 2019; Ntakyo and van den Berg 2019; Radchenko and Corral
2018; Wood et al. 2013).
The conceptual framework shown in Fig. 1 illustrates the various market pathways
through which market can affect household consumption. As shown, the benefits of
market access on household dietary diversity and food consumption occur mainly
through the availability and diversity of foods, food prices, agricultural productivity,
and increasing household income, which may then be used to buy more varieties of
foods for household consumption. Accessing food markets is therefore important for
farm households engaged in cash crops production.
Materials and methodsDescription of the study area
This study was carried out in the Yayu Coffee Forest Biosphere Reserve, which is recog-
nized by UNESCO as an in-situ conservation area of wild coffee (Coffea arabica). Yayu
Fig. 1 Conceptual framework of the links between agriculture, the food system, nutrition, and public health.Source: Adopted from Kanter et al. (2015)
Usman and Callo-Concha Agricultural and Food Economics (2021) 9:18 Page 4 of 21

is one of the woreda of the Illubabor Zone, located 500 km from Addis Ababa, in
southwestern Ethiopia.1 The study area is situated between 8° 0′ 42′′ N–8° 44′ 23′′ N
latitude and 35° 20′ 31′′ E–36° 18′ 20′′ E longitude, and its altitude varies from 1140
to 2562 meters above sea level. The mean monthly temperature varies between 12 and
29 °C, and the annual rainfall ranges from 1400 to 3000 mm (Fig. 2). Yayu consists
mainly of forests, which account for 69% of its area, and agricultural lands with 26% of
the area; thus agriculture is the main economic activity, and it employs more than 90%
of the labor force (Assefa 2010). Smallholders are mainly engaged in the production of
cash crops—typically coffee and khat, as well as staple crops, such as maize, sorghum,
and teff.
Data
The study data are from a primary household survey conducted in Yayu in January
2018. The studied households followed a sampling framework of the BiomassWeb pro-
ject and were selected using a multistage random sampling design (see Jemal et al.
2018, for detailed information on household sample selection). The survey included 4
woredas, 8 kebeles, and 324 smallholder households. A structured questionnaire was
used to collect the following socioeconomic and demographic information from se-
lected households: demographic variables, including family size, household head age,
sex, and education; information on food consumption and expenditure in the past 7
days; self-reported food security in the past 12 months; non-farm income sources; agri-
cultural production and sales; and pre-defined indicators of market access, such as the
households’ distance to market centers and distance to tar roads. In compliance with
ethical considerations, selected households were consulted about their willingness to
participate in the study.
Variables and measurements
Household dietary diversity score (HDDS)
The Household Dietary Diversity Score (HDDS) was constructed based on the con-
sumption of 12 food groups over a recall period of the past 7 days (Swindale and
Bilinsky 2006). The pre-defined food groups included the following 12 food groups: (1)
cereals; (2) roots and tubers; (3) vegetables; (4) fruits; (5) meat; (6) poultry and offal; (7)
eggs; (8) fish and seafood; (9) pulses, legumes and nuts; (10) milk and milk products;
(11) oil and fats; (12) sweets, and spices/condiments. However, in Yayu, the maximum
number of food groups consumed was 11 because the consumption of fish and seafood
group is nonexistent. The study also used the food variety score (FVS) to count the
number of food items consumed in the past 7 days before the survey as a dependent
variable.
Household food (in)security
The Household Food Insecurity Access Scale (HFIAS) developed by Coates et al.
(2007) was used to estimate the household food (in)security. The HFIAS provides a rec-
ognized and widely applied food security indicator (e.g., Knueppel et al. 2010; Melgar-
Quinonez et al. 2006). The perceptions of food security by the household were captured
1Administratively, regions in Ethiopia are divided into zones, which are subdivided into administrative unitscalled woreda (district). Each district is further subdivided into the lowest geographic administrative unit,called kebele.
Usman and Callo-Concha Agricultural and Food Economics (2021) 9:18 Page 5 of 21

using the standard 9 food security questions, for which the full list is provided in Table
6 in the Appendix. Households are asked if they had experienced any food insecurity
issue in the previous 12 months, and if so, how frequent these episodes of food insecur-
ity were. Responses were rated as follows: 0 points if food insecurity did not occur, 1 if
it rarely occurred (1 or 2 times), 2 if it sometimes occurred (3 to 10 times), and 3 if it
often occurred (more than 10 times). The total score may range from 0 to 27. Follow-
ing Kuma et al. (2018), the HFIAS was computed using the total scores and was trans-
formed into a standardized z-score to ease interpretation.2 In the multivariate
regression models, the study used both, the binary indicator (= 1 if the household had
experienced any food insecurity in the preceding 12 months before the survey; 0 other-
wise), and the standardized HFIAS variable.
Market access
As a proxy for market access, the study used the distance between a household to the
nearest market center where the household buys and/or sells food and non-food items.3
Households were also asked how much walking-time (in minutes) it takes to reach a
given market center and the distance to the nearest tar road in kilometers.
The specific variables included in the multivariate regression analysis were based on
theoretical and empirical literature (e.g., Sibhatu et al. 2015; Usman and Haile 2019)
and data availability. The models were adjusted for household-level information, in-
cluding on-farm production diversity, participation in off-farm activities, livestock hold-
ing in tropical livestock units (TLUs), farm size, and sociodemographic characteristics
that may correlate with consumption diversity and food security as well as market
access.
Fig. 2 Location of the study areas and sampled kebeles (geographic administrative units). Source: Goleet al. (2009)
2The standardized z-scores are constructed by subtracting the household-specific food security value fromthe sample mean and then dividing this value with the standard deviation of the sample. This approach nor-malizes the variable with a mean of 0 and standard deviation of 1.3Four weekly marketplaces were identified in study areas: Wutete, Beteli-Gebecha, Werebo, and Elemo.
Usman and Callo-Concha Agricultural and Food Economics (2021) 9:18 Page 6 of 21

Statistical methods
The study authors are interested in understanding the relationship between market ac-
cess and household dietary diversity and food (in)security status. The study sought to
formalize the relationship between market access and household food consumption
based on a reduced farm household model. To model the level of dietary diversity and
food security reported by household i, a reduced regression model was estimated as
follows:
DDi ¼ β0 þ β1Mi þ β2Xi þ εi
where DDi is the outcome of interest (e.g., household dietary diversity score, food se-
curity); Mi is access to market indicator (distance or walking time to the nearest market
center), Xi represents all other sociodemographic characteristics that could potentially
influence dietary diversity and food security status of the households, and β1 measures
the relationship of interest, meaning the effect of market access on the household diet-
ary diversity and food security. The model was estimated using ordinary least squares
(for both household dietary diversity and the standardized HFIAS score) and logit (for
the binary food insecurity indicator outcome).4
Results and discussionDescriptive statistics
The descriptive statistics of the variables are reported in Table 1. Most of the food
groups consumed by an average household were purchased from markets. An average
household produced 2.96 food groups (6.47 crops and livestock spices), but consumed,
on average, 7.49 food groups—implying that the difference between these factors can
be attributed to food group purchases. About 53% of the households experienced food
insecurity in the preceding 12 months before the survey. An average household had to
travel 4.6 km to reach the nearest market center for buying or selling agricultural pro-
duce. Most of the sample households were disconnected from functioning roads; on
average, a given household was 18 km away from tar/asphalt road. Findings also
showed that the level of education was low; the average household head did not
complete the primary level of education. Only 11% of the sample households were
female-headed. The average household size was about 5 people, which is comparable to
data from a recent study in rural Ethiopia (Usman et al. 2019). Finally, about 44% of
households were engaged in non-farm activities.
Regarding the consumption of specific food groups, Fig. 3 presents the household
dietary and production diversity scores (PDS). As shown, households derived a large
proportion of their consumption diversity from cereals, vegetables, pulses, legumes and
nuts, oil/fat, and spices, all of which were consumed frequently. Milk, milk byproducts,
and eggs were the lowest among the food groups consumed. As expected, most food
groups, such as roots and tubers, vegetables as well as pulses and legumes, came from
market purchases. The survey also indicated that only 7.4% of sampled households con-
sumed all food groups (11 food groups) in the 7 days preceding the survey. It is,
4Although the Poisson model is preferred to ordinary least squares in the case of count outcomes, the studydata do not fit well in a Poisson model specification.
Usman and Callo-Concha Agricultural and Food Economics (2021) 9:18 Page 7 of 21

however, surprising that the consumption of meat was much higher than the national
average for rural households.5
The survey showed that about 47% of the households responded that they were en-
tirely food secure in the past 12 months before the survey because they reported zero
incidence of the 9 food insecurity questions (Figure 5 in the Appendix). Thus, the
remaining 53% of the households reported food insecurity in varying degrees, and this
result is comparable to that of Kuma et al. (2018). Using the same food security indica-
tor, the study found that about 60% of the sampled farm households, engaging in the
production of cash crops were food insecure.
Figure 4 presents the frequency of the positive responses to the HFIAS questions on
the food insecurity situation of the household. More than 50% of the surveyed house-
holds responded that they were not able to eat the kind of food they preferred, and
about 47% said that they had to limit the variety of foods consumed because of lack of
Table 1 Assessed variables and summary statistics for 324 smallholder households
Variables Mean/proportion SD Min Max
Dietary diversity and food security
HDDS—food groups 8.48 1.40 4.0 11.0
HDDS—purchase food items 7.29 1.40 3.0 11.0
Food variety score (FVS) 15.61 3.74 7.0 30.0
FVS with respect to purchase 11.62 3.29 4.0 25.0
Food insecure—Yes=1 0.53 0.50 0.0 1.0
Standardized HFIAS 0.00 1.00 − 0.8 3.6
Market access
Distance to market in km 4.59 4.29 0.5 17.0
Walking time to market in hours 0.77 0.72 0.1 3.0
Distance to road in km 18.33 17.78 0.0 45.0
Agriculture characteristics
Production diversity 6.47 2.70 0.0 16.0
Production diversity score (PDS) 2.96 1.02 0.0 6.0
Livestock holding in TLUs 1.85 2.50 0.0 21.4
Farm size 1.58 1.34 0.0 11.0
Nonfarm activities—Yes = 1 0.44 0.50 0.0 1.0
Total agricultural income (1000)a 8.48 14.80 0.0 174.50
Demographic characteristics
Household head age 44.67 14.90 20.0 92.0
Household head education 3.83 3.57 0.0 14.0
Female-headed household—Yes = 1 0.11 0.32 0.0 1.0
Household size 5.23 1.88 2.0 14.0
Table 5 in the Appendix provides a detailed description of variable measurementaExchange rate during the survey period was 1 Euro = 32 Ethiopian Birr. More than 96% of the farmers were involved inthe production of coffeeSource: Authors’ computation using survey data
5In the recent 2015/16 Living Standards Measurement Study-Integrated Surveys on Agriculture (LSMS-ISA),the consumption of meat among Ethiopian rural households is 30% lower for the same recall period. This dif-ference could be partially explained by the coincidence between the survey period and a religious celebrationin which slaughtering of livestock is common.
Usman and Callo-Concha Agricultural and Food Economics (2021) 9:18 Page 8 of 21

resources. Additionally, around 8% of the households experienced severe food insecur-
ity, implying that they did not have food to eat on at least one occasion in the 12
months preceding the survey.
Multivariate analysis
Table 2 summarizes the multivariate regression results of ordinary least squares
method, using household dietary diversity score as a dependent variable. The results
Fig. 3 Production diversity score and last 7 days dietary diversity by studied households. Source: authors’calculations based on survey data
Fig. 4 Distribution of Household Food Insecurity Access Scale (HFIAS) scores. Source: authors’ calculationsusing survey data
Usman and Callo-Concha Agricultural and Food Economics (2021) 9:18 Page 9 of 21

indicate that market access is significantly associated with the HDDS across all model
specifications, but not when market access is proxied by distance to a road (Table 2,
columns 5 and 6). Moreover, the effect of market access increases when assessing
HDDS only with respect to the food purchased in the market, suggesting that income
is not the only factor that influences household consumption expenditure and/or diet-
ary diversity, but that market infrastructure also plays an essential role. For example, 1
additional kilometer to market is associated with 0.2 units of reduction in the HDDS
(Table 2, column 1).
Regarding the control variables, the PDS is significantly associated with HDDS, but
the estimated coefficients are negative because the study considered only purchased
food groups. Production diversity is however positively correlated with household con-
sumption diversity (Figure 6 in the Appendix). This finding is in line with those of pre-
vious studies (e.g., Bellon et al. 2016; Sibhatu et al. 2015; Usman and Haile 2019),
asserting that households with diversified on-farm production tend to buy less food
to diversify their consumption. As expected, households that own livestock and lar-
ger farms have better dietary diversity. Similarly, off-farm activities are significantly
correlated with HDDS, which implies that households engaged in off-farm activities
consume more diversified diets than households who do not because off-farm in-
come increases the purchasing power of the household to buy more diversified
foods from local markets (e.g., Babatunde and Qaim 2010; Islam et al. 2018;
Table 2 Association between market access and HHDS for 324 smallholder households(1) (2) (3) (4) (5) (6)
HDDS HDDSpurchased
HDDS HDDSpurchased
HDDS HDDSpurchased
Distance to market − 0.188*** (0.069) − 0.397*** (0.061)
Distance to market(squared)
0.006 (0.004) 0.018*** (0.004)
Walking time tomarkets
− 1.101*** (0.381) − 2.245*** (0.353)
Walking time tomarkets (squared)
0.212 (0.132) 0.611*** (0.124)
Distance to a road 0.006 (0.020) − 0.021 (0.020)
Distance to a road(squared)
− 0.000 (0.000) 0.000 (0.000)
Production diversityscore
0.045 (0.074) − 0.155** (0.073) 0.049 (0.074) − 0.153** (0.073) − 0.032 (0.076) − 0.288*** (0.077)
Farm size 0.098* (0.050) 0.090* (0.046) 0.101** (0.050) 0.087* (0.046) 0.052 (0.053) 0.050 (0.051)
Nonfarm activities—Yes = 1
0.430*** (0.150) 0.400*** (0.145) 0.430*** (0.150) 0.416*** (0.145) 0.563*** (0.154) 0.637*** (0.152)
Livestock holding inTLUs
0.107*** (0.026) − 0.036 (0.022) 0.108*** (0.026) − 0.030 (0.022) 0.126*** (0.026) − 0.002 (0.026)
Household head age − 0.007 (0.006) − 0.009* (0.005) − 0.007 (0.006) − 0.009* (0.005) − 0.004 (0.006) − 0.006 (0.005)
Household headeducation
0.052** (0.023) 0.046** (0.021) 0.052** (0.023) 0.045** (0.021) 0.054** (0.023) 0.041* (0.022)
Female-headedhousehold—Yes = 1
0.222 (0.240) 0.120 (0.217) 0.217 (0.242) 0.123 (0.220) 0.204 (0.247) 0.007 (0.238)
Household size 0.087** (0.038) 0.075** (0.035) 0.086** (0.038) 0.073** (0.036) 0.072* (0.039) 0.055 (0.039)
Constant 8.065*** (0.436) 8.425*** (0.389) 8.055*** (0.435) 8.345*** (0.386) 7.671*** (0.431) 7.812*** (0.391)
R-squared 0.20 0.27 0.21 0.22 0.15 0.16
Model F-statistics 9.549 12.265 10.009 12.462 7.405 6.249
Model p value 0.000 0.000 0.000 0.000 0.000 0.000
Robust standard errors are in parentheses; statistical significance is *p < 0.10, **p < 0.05, ***p < 0.01
Usman and Callo-Concha Agricultural and Food Economics (2021) 9:18 Page 10 of 21

Rahman and Mishra 2020; Sibhatu et al. 2015; Usman and Haile 2019). The results
also showed that HHDS increased marginally with the household size because
more and varied household members require more and diverse foods based on
their age, sex, and personal preferences. The age of the household head was nega-
tively associated with HHDS, but was statistically significant at the 10% level for
purchased HHDS only. Finally, HDDS was positively related to the household
head’s level of education and was statistically significant at 5%. The effects of
household head’s sex on HDDS were found to be statistically non-significant, al-
though other studies have shown that female-head households are more prone to
food insecurity (Kairiza and Kembo 2019; Magaña-Lemus et al. 2016).
Additionally, the study re-estimated the same models using FVS as an outcome variable
instead of HDDS, which produced qualitatively similar results (Table 3). For example, a
reduction of 1 h of walking time to the market was associated with a 3-unit increase in
the number of food items consumed or the consumption of 4 additional units of pur-
chased food items (Table 3, columns 3 and 4). Unlike the results presented in Table 2, the
relationship between household head age and FVS became statistically significant (p <
0.05), implying that an older household head is associated with the consumption of a low
number of purchased food items (Table 3). The results also showed that distance to mar-
ket and household consumption expenditures were negatively associated and statistically
significant across all model specifications (Table 7 in the Appendix). The negative rela-
tionship between market access and consumption expenditure implies that a household
located far away from market centers spends less on food consumption, which in turn,
may reduce the diversity of food intake. Indeed, household dietary diversity and food con-
sumption expenditures are closely related (Thorne-Lyman et al. 2010; Usman and Haile
2019). In other words, when markets are not easily accessible, smallholder households are
obliged to rely more on their own produce than on market purchases.
The relationship between market access and household food security status through
a multivariate regression framework was tested (Table 4). The results indicate that, al-
though consistent, the relationship between market access and household food security
was not statistically significant at any conventional level. The study re-estimated the
models using HFIAS as a count variable; however, again, the relationship was far from
significant (Table 8 in the Appendix). The study further tested the relationship between
food consumption score (FCS) and market access.6 Although the signs of all the esti-
mated coefficients of market access indicator variables were negative as expected, only
the variable of the distance to a road was statistically significant at 1% (Table 9 in the
Appendix).7 Finally, the study tested if access to markets has a differential effect on
agricultural household income. Results show that market access did not lead to signifi-
cantly different household income, which indicates that the impact of market access on
household consumption and dietary diversity through income is weak.
Households with larger farm sizes, owning livestock, and led by educated household
heads, are more likely to be food secure. In contrast, larger households and households
6The FCS is closely related with HDDS and is considered an indicator of household caloric availability/intake.Using the FCS indicator, the current study shows that more than 96% of the sampled households were foodsecure based on the 7-day recall period, whereas the remaining households were at the borderline.7Appendix Figure A3 show the relationship between distance to market in terms of wlaking hours andkilometers.
Usman and Callo-Concha Agricultural and Food Economics (2021) 9:18 Page 11 of 21

engaged in non-farm activities are, on average, more likely to be food insecure. The
negative effect of non-farm activities on food security is counterintuitive. Households
engaged in non-farm activities are expected to be more resilient and food secure be-
cause the extra income would have meant an improvement in their food access (Baba-
tunde and Qaim 2010; Do et al. 2019). However, because off-farm income was
measured as a dummy variable in this study, it does not reflect the actual level of in-
come generated. Additionally, these data show that land-scarce households were 34%
more likely to look for jobs outside agriculture (p < 0.01, for a bivariate regression). An-
other possible explanation could be that the income generated from non-farm activities
may not be spent in a way that enhances household food security, and that non-farm
activities may reduce agricultural productivity due to labor constraints. The variable
may also suffer from recall bias because the time horizon used was 12 months.
Altogether, the study results indicate that households located closer to markets not
only spend more on food but also consume more diversified foods than households lo-
cated far away from markets. For smallholders, whose income is mainly generated from
selling agroforestry products such as coffee and Khat (Figure 8 in the Appendix), on-
farm diversification may not be an efficient way to diversify their diets because they
may not be able to produce all the food items that they require due to the limited resource
endowments, such as land. Therefore, improving market access could be important for
Table 3 Association between Market Access and Food Variety Score (FVS) for 324 smallholderhouseholds
(1) (2) (3) (4) (5) (6)
FVS FVSpurchased
FVS FVSpurchased
FVS FVSpurchased
Distance to market,km
− 0.596*** (0.170) − 0.782*** (0.144)
Distance to market(squared)
0.032*** (0.010) 0.040*** (0.008)
Walking time tomarket, hours
− 3.094*** (1.006) − 4.167*** (0.871)
Walking time tomarket (squared)
0.951*** (0.363) 1.251*** (0.315)
Distance to road, km − 0.065 (0.051) − 0.087* (0.047)
Distance to a road(squared)
0.001 (0.001) 0.001 (0.001)
Production diversityscore
0.260 (0.214) − 0.476** (0.192) 0.263 (0.215) − 0.474** (0.193) 0.084 (0.217) − 0.722*** (0.194)
Farm size 0.365** (0.157) 0.299** (0.124) 0.371** (0.157) 0.300** (0.125) 0.348** (0.152) 0.263** (0.127)
Nonfarm activities—Yes=1
1.097*** (0.403) 1.159*** (0.341) 1.136*** (0.405) 1.207*** (0.342) 1.398*** (0.413) 1.570*** (0.353)
Livestock holding inTLUs
0.320*** (0.089) 0.115 (0.092) 0.326*** (0.089) 0.126 (0.093) 0.365*** (0.101) 0.180* (0.108)
Household head age − 0.016 (0.016) − 0.025** (0.012) − 0.016 (0.016) − 0.025** (0.012) − 0.015 (0.016) − 0.023* (0.012)
Household headeducation
0.134** (0.062) 0.076 (0.056) 0.131** (0.062) 0.073 (0.056) 0.111* (0.061) 0.049 (0.055)
Female-headedhousehold—Yes=1
0.439 (0.600) 0.354 (0.483) 0.433 (0.611) 0.353 (0.495) 0.145 (0.643) − 0.017 (0.516)
Household size 0.147 (0.110) 0.165* (0.092) 0.146 (0.110) 0.163* (0.092) 0.134 (0.110) 0.144 (0.091)
Constant 14.061*** (1.123) 13.767*** (0.957) 13.854*** (1.125) 13.523*** (0.960) 13.666*** (1.161) 13.187*** (0.983)
R-squared 0.17 0.22 0.17 0.21 0.16 0.19
Model F-statistics 5.496 7.237 5.339 6.637 5.346 5.625
Model-p value 0.000 0.000 0.000 0.000 0.000 0.000
Robust standard errors are in parentheses; statistical significance is *p < 0.10, **p < 0.05, ***p < 0.01
Usman and Callo-Concha Agricultural and Food Economics (2021) 9:18 Page 12 of 21

promoting dietary diversification and also in helping farmers to be paid better prices for
their produce (Abu et al. 2016; Haile et al. 2015). Previous studies have also shown that
households located closer to markets are less dependent on their own production and con-
sume more diverse diets (Abay and Hirvonen 2017), and they are also able to smooth their
consumption patterns during the lean seasons (Handa and Mlay 2006).8 The effects of mar-
ket access on household food consumption may, however, depend on who controls the in-
come generated through increased market access.
This study has limitations. The data collection period was during January 2018,
which is right after the harvesting period (usually October through November).
During the harvesting period, households largely depend on their own produce
(Hirvonen et al. 2016), so the impact of market access on household consumption
may be low (Abay and Hirvonen 2017). The study findings should, therefore, be
taken with caution, because households may rely more on market purchases in the
lean season. Of note, June, July, and August were the months in which most
households did not have sufficient food provision in the past 12 months before the
survey (Figure 9 in the Appendix).
Table 4 Association between market access and food security for 324 smallholder households(1) (2) (3) (4) (5) (6)
Foodinsecurity—Yes = 1
StandardizedHFIAS
Foodinsecurity—Yes = 1
StandardizedHFIAS
Foodinsecurity—Yes = 1
StandardizedHFIAS
Distance to market 1.191 (0.141) − 0.004 (0.049)
Distance to market(squared)
0.996 (0.007) 0.001 (0.003)
Walking time tomarket
2.345 (1.596) − 0.098 (0.289)
Walking time tomarket (squared)
0.918 (0.222) 0.072 (0.100)
Distance to road 1.027 (0.036) 0.017 (0.016)
Distance to a road(squared)
1.000 (0.001) − 0.000 (0.000)
Production diversityscore
1.022 (0.123) 0.063 (0.056) 1.028 (0.123) 0.065 (0.056) 1.143 (0.135) 0.079 (0.053)
Farm size, ha 0.824* (0.083) − 0.098*** (0.037) 0.823* (0.083) − 0.100*** (0.037) 0.881 (0.084) − 0.092** (0.037)
Nonfarm activities—Yes=1
1.631* (0.442) 0.229** (0.113) 1.596* (0.427) 0.224** (0.114) 1.421 (0.369) 0.218** (0.108)
Livestock holding inTLUs
0.889 (0.066) − 0.045** (0.022) 0.889 (0.066) − 0.045** (0.022) 0.861** (0.061) − 0.052** (0.023)
Household head age 1.016* (0.009) 0.001 (0.004) 1.016* (0.009) 0.001 (0.004) 1.013 (0.009) 0.001 (0.004)
Household headeducation
0.782*** (0.033) − 0.078*** (0.015) 0.783*** (0.033) − 0.078*** (0.015) 0.787*** (0.032) − 0.080*** (0.015)
Female-headedhousehold—Yes = 1
0.607 (0.237) 0.061 (0.182) 0.617 (0.242) 0.066 (0.182) 0.683 (0.278) 0.068 (0.187)
Household size 1.235*** (0.087) 0.106*** (0.034) 1.237*** (0.087) 0.106*** (0.034) 1.257*** (0.090) 0.108*** (0.033)
Pseudo (R-squared) 0.17 0.16 0.17 0.16 0.15 0.16
Model F-statistic 7.33 7.38 6.82
Model chi-squared 65.52 64.75 60.72
Model p value 0.000 0.000 0.000 0.000 0.000 0.000
Robust standard errors are in parentheses; statistical significance is * p < 0.10, **p < 0.05, ***p < 0.01. Coefficients in columns 1, 3,and 5 are odds ratios. The constant term is omitted
8Consumption smoothing is a mechanism to maintain a stable path of consumption from periods of highincome to periods of low income.
Usman and Callo-Concha Agricultural and Food Economics (2021) 9:18 Page 13 of 21
ConclusionsUsing primary household survey data collected in Yayu, southwestern Ethiopia,
this study aimed to discover the association between market access and house-
holder dietary diversity and food security. The results show that, although the
majority of households consumed relatively diverse diets, households located
closer to marketplaces had much better dietary diversity and food consumption
expenditure than those located far away from markets. Furthermore, the effect of
the market on household consumption through income appeared to be trivial. A
direct action to improve the market accessibility would be investing in infrastruc-
ture to improve rural road connectivity and transportation, which would reduce
transaction costs and likely improve the consumption of diversified food among
smallholder farmers.
The findings suggest that market access neither significantly improves the house-
hold’s income nor that the increased income enhanced household dietary diversity. In-
stead, it appears that market access reduces transaction cost (time) for the households,
which encourages them to rely more on market purchases so that they can access more
diversified foods, specifically because markets provide more diverse foods than a given
individual household can produce. The findings should be interpreted with caution,
however, because the study did not consider seasonality, which may bias estimate of
the relationships between market access and household consumption and/or dietary
diversity.
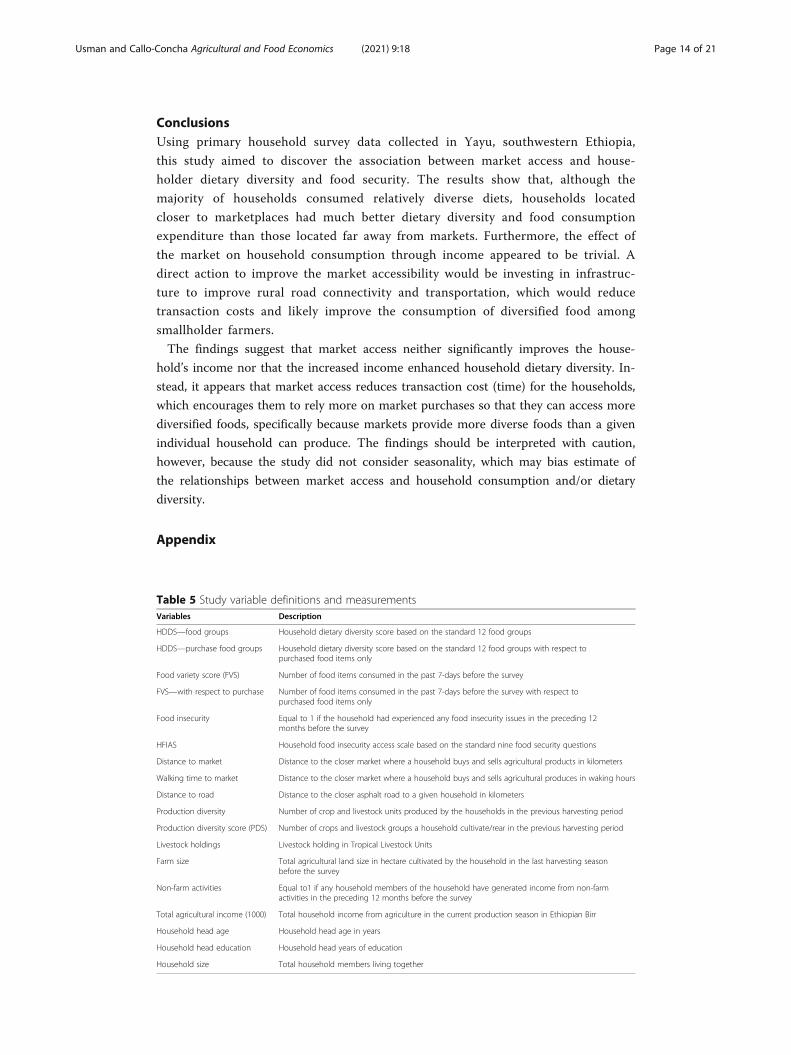
Appendix
Table 5 Study variable definitions and measurementsVariables Description
HDDS—food groups Household dietary diversity score based on the standard 12 food groups
HDDS—purchase food groups Household dietary diversity score based on the standard 12 food groups with respect topurchased food items only
Food variety score (FVS) Number of food items consumed in the past 7-days before the survey
FVS—with respect to purchase Number of food items consumed in the past 7-days before the survey with respect topurchased food items only
Food insecurity Equal to 1 if the household had experienced any food insecurity issues in the preceding 12months before the survey
HFIAS Household food insecurity access scale based on the standard nine food security questions
Distance to market Distance to the closer market where a household buys and sells agricultural products in kilometers
Walking time to market Distance to the closer market where a household buys and sells agricultural produces in waking hours
Distance to road Distance to the closer asphalt road to a given household in kilometers
Production diversity Number of crop and livestock units produced by the households in the previous harvesting period
Production diversity score (PDS) Number of crops and livestock groups a household cultivate/rear in the previous harvesting period
Livestock holdings Livestock holding in Tropical Livestock Units
Farm size Total agricultural land size in hectare cultivated by the household in the last harvesting seasonbefore the survey
Non-farm activities Equal to1 if any household members of the household have generated income from non-farmactivities in the preceding 12 months before the survey
Total agricultural income (1000) Total household income from agriculture in the current production season in Ethiopian Birr
Household head age Household head age in years
Household head education Household head years of education
Household size Total household members living together
Usman and Callo-Concha Agricultural and Food Economics (2021) 9:18 Page 14 of 21

Table 6 Questions in the food security module of the survey. We would like to ask you the foodsecurity situation of your household during the past 12 months
1 2 3
No In the past 12 months, 1= YES2= NO
next
How often did thishappen in the past 12months?1= Rarely (1-2 times)2= Sometimes (3-10)3=Often (more than 10times)
In which months did yourhousehold experience hungerperiod?Write the name of themonths
1 Did you worry that your household would not have enoughfood?
2 Were you or any household members not able to eat the kindof foods you preferred because of lack of resources?
3 Did you or any household members have to eat a limitedvariety of foods because of lack of resources?
4 Did you or any household member have to eat some foodsthat you really did not want to eat because of a lack ofresources to obtain other types of foods?
5 Did you or any household member have to eat a smaller mealthan you felt you needed because there was not enough food?
6 Did you or any household member have to eat fewer meals ina day because there was not enough food?
7 Was there ever no food to eat at all in your household becausethere were no resources to get any food?
8 Did you or any household member go to sleep at night hungrybecause there was not enough food?
9 Did you or any household member go a whole day withouteating anything because there was not enough food?
Table 7 Association between household food expenditure and market access for 324 smallholderhouseholds
(1) Model (2) Model (3) Model
Distance to market, km − 0.111*** (0.029)
Distance to market (squared) 0.006*** (0.002)
Walking time to market − 0.581*** (0.164)
Walking time market (squared) 0.200*** (0.059)
Distance to road, km − 0.040*** (0.008)
Distance to a road (squared) 0.001*** (0.000)
Production diversity score − 0.017 (0.032) − 0.017 (0.032) − 0.061** (0.030)
Farm size 0.069*** (0.024) 0.068*** (0.025) 0.070*** (0.021)
Nonfarm activities—Yes = 1 0.140** (0.068) 0.149** (0.067) 0.187*** (0.061)
Livestock holding in TLUs 0.012 (0.012) 0.014 (0.012) 0.027* (0.015)
Household head age − 0.003 (0.002) − 0.003 (0.002) − 0.004* (0.002)
Household head education 0.015 (0.009) 0.015 (0.009) 0.005 (0.009)
Female-headed household—Yes = 1 − 0.003 (0.109) − 0.002 (0.109) − 0.122 (0.107)
Household size 0.081*** (0.020) 0.081*** (0.020) 0.083*** (0.017)
Observations 324 324 324
R-squared 0.18 0.17 0.28
Model F-stat 7.677 7.327 11.601
Model-p value 0.000 0.000 0.000
Robust standard errors are in parentheses; statistical significance is *p < 0.10, **p < 0.05, ***p < 0.01
Usman and Callo-Concha Agricultural and Food Economics (2021) 9:18 Page 15 of 21

Table 8 Association between market access and food security: HFIAS scores for 324 smallholderhouseholds
(1) (2) (3)
Model Model Model
Distance to market 1.002 (0.061)
Distance to market (squared) 1.001 (0.003)
Walking time to market 0.947 (0.348)
Walking time to market (squared) 1.062 (0.132)
Distance to road 1.026 (0.021)
Distance to a road (squared) 0.999 (0.000)
Other controls Yes Yes Yes
R-squared 0.14 0.14 0.14
Model chi-squared 81.537 82.439 80.602
Model p value 0.000 0.000 0.000
Robust standard errors are in parentheses; statistical significance is *p < 0.10, **p < 0.05, ***p < 0.01. Coefficients aregiven as an incidence rate ratio
Table 9 Association between Market Access and Food Consumption Score (FCS) for 324smallholder households
(1) (2) (3)
Model Model Model
Distance to market, km − 0.172 (0.486)
Distance to market (squared) − 0.007 (0.028)
Walking time to market, hours − 0.659 (2.806)
Walking time market (squared) − 0.437 (0.987)
Distance to road, km − 0.484*** (0.151)
Distance to the road (squared) 0.011*** (0.004)
Other controls Yes Yes Yes
R-squared 0.17 0.17 0.19
Model F-statistic 4.314 4.633 5.097
Model p value 0.000 0.000 0.000
Robust standard errors are in parentheses; statistical significance is *p < 0.10, **p < 0.05, ***p < 0.01
Usman and Callo-Concha Agricultural and Food Economics (2021) 9:18 Page 16 of 21

Fig. 5 Distribution of Household Food Insecurity Access Scale (HFIAS) scores. Source: Authors’ computationusing study survey data
Fig. 6 Relationship between farm production diversity and household dietary diversity. Source: Authors’computation using study survey data
Usman and Callo-Concha Agricultural and Food Economics (2021) 9:18 Page 17 of 21

Fig. 7 Distances to markets are measured by both distance and time. Source: Authors’ computation usingstudy survey data
Fig. 8 Total household income by types of source. Source: Authors’ computation using study survey data
Usman and Callo-Concha Agricultural and Food Economics (2021) 9:18 Page 18 of 21

AbbreviationsCSA: Central Statistical Agency; FAO: Food and Agriculture Organization; FCS: Food Consumption Score; FVS: Foodvariety score; HDDS: Household Dietary Diversity Score; HFIAS: Household Food Insecurity Access Scale;PDS: Production Diversity Score; UNDP: United Nations Development Programme; UNESCO: The United NationsEducational, Scientific and Cultural Organization
AcknowledgementsWe are grateful to Dr. Omarsherif Jemal, Mr. Habtamu Aragaw, ECFF (Environment and Coffee Forest Forum), and theAgricultural offices of Yayu and the surrounding Woredas, for their support and facilitation to realize the fieldwork. Wethank Rebecca T (Enago, Crimson Interactive Inc.) for English editing the manuscript.
Authors’ contributionsMU conceived the study, conducted the fieldwork, drafted the manuscript, and performed part of the econometricsanalysis. DCC contributed to developing the concept note and revising the manuscript. Both authors have read andagreed to the published version of the manuscript.
FundingThis research was funded by the German Federal Ministry of Education and Research (BMBF) and the Ministry ofEconomic Cooperation and Development (BMZ) [Grant number: FKZ 031A258A-l]. Open Access funding enabled andorganized by Projekt DEAL.
Availability of data and materialsThe datasets used and/or analyzed during the current study are available from the corresponding author onreasonable request.
Fig. 9 Months of inadequate household food provisioning. Source: Authors’ computation using studysurvey data
Usman and Callo-Concha Agricultural and Food Economics (2021) 9:18 Page 19 of 21

Declarations
Competing interestsThe authors declare that they have no competing interests.
Received: 18 October 2019 Revised: 11 February 2021Accepted: 15 April 2021
ReferencesAbay K, Hirvonen K (2017) Does market access mitigate the impact of seasonality on child growth? Panel data evidence from
northern Ethiopia. J Dev Stud 53(9):1414–1429. https://doi.org/10.1080/00220388.2016.1251586Abu BM, Issahaku H, Nkegbe PK (2016) Farmgate versus market centre sales: a multi-crop approach. Agric Food Econ 4(1):21.
https://doi.org/10.1186/s40100-016-0065-6Alderman H, Hoddinott J, Kinsey B (2006) Long term consequences of early childhood malnutrition. Oxford Econ Papers
58(3):450–474. https://doi.org/10.1093/oep/gpl008Assefa AD (2010) Local institutions and their influence on forest resource management in Southwest of Ethiopia: The Case of
Yayu Forest. Addis Ababa University School of Graduate Studies, Addis Ababa Available at: http://etd.aau.edu.et/bitstream/123456789/1591/3/Andnet%20Deresse.pdf
Babatunde RO, Qaim M (2010) Impact of off-farm income on food security and nutrition in Nigeria. Food Policy 35(4):303–311. https://doi.org/10.1016/j.foodpol.2010.01.006
Bellon MR, Ntandou-Bouzitou GD, Caracciolo F (2016) On-farm diversity and market participation are positively associatedwith dietary diversity of rural mothers in Southern Benin, West Africa. PloS One 11(9):e0162535. https://doi.org/10.1371/journal.pone.0162535
Chegere MJ, Stage J (2020) Agricultural production diversity, dietary diversity and nutritional status: panel data evidence fromTanzania. World Dev 129:104856. https://doi.org/10.1016/j.worlddev.2019.104856
Coates J, Swindale A, Bilinsky P (2007) Household Food Insecurity Access scale (HFIAS) for measurement of household foodaccess: indicator Guide (Version 3). FHI 360/FANTA, Washington, D.C Retrieved from https://www.fantaproject.org/sites/default/files/resources/HFIAS_ENG_v3_Aug07.pdf
CSA & ICF International (2017) Ethiopia Demographic and Health Survey 2016. Central Statistical Authority & ICF Internation,Addis Ababa and Rockville Retrieved from https://dhsprogram.com/pubs/pdf/FR328/FR328.pdf
Dercon S, Gilligan DO, Hoddinott J, Woldehanna T (2009) The impact of agricultural extension and roads on poverty andconsumption growth in fifteen Ethiopian villages. Am J Agric Econ 91(4):1007–1021. https://doi.org/10.1111/j.1467-8276.2009.01325.x
Do TL, Nguyen TT, Grote U (2019) Nonfarm employment and household food security: Evidence from panel data for ruralCambodia. Food Security 11(3):703–718. https://doi.org/10.1007/s12571-019-00929-8
FAO, IFAD, UNICEF, WFP, & WHO (2017) The state of food security and nutrition in the world 2017. Building Resilience forPeace and Food Security. FAO, Rome
Glewwe P, Jacoby HG, King EM (2001) Early childhood nutrition and academic achievement: a longitudinal analysis. J PublicEcon 81(3):345–368. https://doi.org/10.1016/S0047-2727(00)00118-3
Gole WT, Senbeta F, Tesfaye K, Fite G (2009) Yayu coffee forest biosphere reserve nomination form. Ethiopian MAB NationalCommittee, Addis Ababa
Govereh J, Jayne TS (2003) Cash cropping and food crop productivity: synergies or trade-offs? Agric Econ 28(1):39–50. https://doi.org/10.1111/j.1574-0862.2003.tb00133.x
Haile MG, Kalkuhl M, Usman MA (2015) Market information and smallholder farmer price expectations. Afr J Agric Res Econ10(4):297–311
Handa S, Mlay G (2006) Food consumption patterns, seasonality and market access in Mozambique. Dev Southern Afr 23(4):541–560. https://doi.org/10.1080/03768350600929249
Hirvonen K, Taffesse AS, Worku Hassen I (2016) Seasonality and household diets in Ethiopia. Public Health Nutr 19(10):1723–1730. https://doi.org/10.1017/S1368980015003237
Immink MDC, Alarcon JA (1993) Household income, food availability, and commercial crop production by smallholderfarmers in the western highlands of Guatemala. Econ Dev Cultural Change 41(2):319–342. https://doi.org/10.1086/452013
Islam AHMS, von Braun J, Thorne-Lyman AL, Ahmed AU (2018) Farm diversification and food and nutrition security inBangladesh: Empirical evidence from nationally representative household panel data. Food Security 10(3):701–720.https://doi.org/10.1007/s12571-018-0806-3
Jacoby HG, Minten B (2009) On measuring the benefits of lower transport costs. Journal of Development Economics 89(1):28–38. https://doi.org/10.1016/j.jdeveco.2008.06.004
Janssen V (2018) The effect of agricultural commercialization on food security: the case of crop producing households inpost-reform Vietnam. Wageningen UR, Wageningen Retrieved from https://edepot.wur.nl/443236
Jemal O, Callo-Concha D, van Noordwijk M (2018) Local agroforestry practices for food and nutrition security of smallholderfarm households in southwestern Ethiopia. Sustainability 10(8):2722. https://doi.org/10.3390/su10082722
Jones AD, Ickes SB, Smith LE, Mbuya MN, Chasekwa B, Heidkamp RA et al (2014) World Health Organization infant and youngchild feeding indicators and their associations with child anthropometry: a synthesis of recent findings. Matern ChildNutr 10(1):1–17. https://doi.org/10.1111/mcn.12070
Kairiza T, Kembo GD (2019) Coping with food and nutrition insecurity in Zimbabwe: does household head gender matter?Agric Food Econ 7(1):24. https://doi.org/10.1186/s40100-019-0144-6
Kanter R, Walls HL, Tak M, Roberts F, Waage J (2015) A conceptual framework for understanding the impacts of agricultureand food system policies on nutrition and health. Food Security 7(4):767–777. https://doi.org/10.1007/s12571-015-0473-6
Knueppel D, Demment M, Kaiser L (2010) Validation of the household food insecurity access scale in rural Tanzania. PublicHealth Nutrition 13(3):360–367. https://doi.org/10.1017/S1368980009991121
Kuma T, Dereje M, Hirvonen K, Minten B (2018) Cash crops and food security: evidence from Ethiopian smallholder coffeeproducers. J Dev Stud 55(6):1267–1284. https://doi.org/10.1080/00220388.2018.1425396
Usman and Callo-Concha Agricultural and Food Economics (2021) 9:18 Page 20 of 21

Linderhof V, Janssen V, Achterbosch T (2019) Does agricultural commercialization affect food security: The case ofcrop-producing households in the regions of post-reform Vietnam? Sustainability 11(5):1263. https://doi.org/10.3390/su11051263
Magaña-Lemus D, Ishdorj A, Rosson CP, Lara-Álvarez J (2016) Determinants of household food insecurity in Mexico. AgricFood Econ 4(1):10. https://doi.org/10.1186/s40100-016-0054-9
Melgar-Quinonez HR, Zubieta AC, MkNelly B, Nteziyaremye A, Gerardo MFD, Dunford C (2006) Household food insecurity andfood expenditure in Bolivia, Burkina Faso, and the Philippines. J Nutr 136(5):1431S–1437S. https://doi.org/10.1093/jn/136.5.1431S
Muthini D, Nzuma J, Nyikal R (2020) Farm production diversity and its association with dietary diversity in Kenya. FoodSecurity 12(5):1107–1120. https://doi.org/10.1007/s12571-020-01030-1
Negash M, Swinnen JF (2013) Biofuels and food security: micro-evidence from Ethiopia. Energy Policy 61:963–976. https://doi.org/10.1016/j.enpol.2013.06.031
Ntakyo PR, van den Berg M (2019) Effect of market production on rural household food consumption: evidence fromUganda. Food Security 11(5):1051–1070. https://doi.org/10.1007/s12571-019-00959-2
Ogutu SO, Gödecke T, Qaim M (2020) Agricultural commercialisation and nutrition in smallholder farm households. J AgricEcon 71(2):534–555. https://doi.org/10.1111/1477-9552.12359
Pierre-Louis JN, Sanjur D, Nesheim MC, Bowman DD, Mohammed HO (2007) Maternal income-generating activities, childcare, and child nutrition in Mali. Food Nutr Bull 28(1):67–75. https://doi.org/10.1177/156482650702800108
Pingali PL (1997) From subsistence to commercial production systems: the transformation of Asian agriculture. Am J AgricEcon 79(2):628–634. https://doi.org/10.2307/1244162
Radchenko N, Corral P (2018) Agricultural commercialisation and food security in rural economies: Malawian experience. JDev Stud 54(2):256–270. https://doi.org/10.1080/00220388.2017.1283014
Rahman A, Mishra S (2020) Does non-farm income affect food security? Evidence from India. J Dev Stud 56(6):1190–1209.https://doi.org/10.1080/00220388.2019.1640871
Ruel MT, Garrett J, Yosef S, Olivier M (2017) Urbanization, food security and nutrition Nutrition and Health in a DevelopingWorld, pp 705–735 Springer
Sibhatu KT, Krishna VV, Qaim M (2015) Production diversity and dietary diversity in smallholder farm households. ProceedNatl Acad Sci 112(34):10657–10662. https://doi.org/10.1073/pnas.1510982112
Singh S, Jones AD, DeFries RS, Jain M (2020) The association between crop and income diversity and farmer intra-householddietary diversity in India. Food Security 12(2):369–390. https://doi.org/10.1007/s12571-020-01012-3
Stifel D, Minten B (2017) Market access, well-being, and nutrition: evidence from Ethiopia. World Dev 90:229–241. https://doi.org/10.1016/j.worlddev.2016.09.009
Swindale A, Bilinsky P (2006) Household Dietary Diversity Score (HDDS) for measurement of household food access: indicatorGuide (Version 2). FHI 360/FANTA, Washington, D.C
Thorne-Lyman AL, Valpiani N, Sun K, Semba RD, Klotz CL, Kraemer K, Akhter N, de Pee S, Moench-Pfanner R, Sari M, BloemMW (2010) Household dietary diversity and food expenditures are closely linked in rural Bangladesh, increasing the riskof malnutrition due to the financial crisis. J Nutr 140(1):182S–188S. https://doi.org/10.3945/jn.109.110809
Thornton PK, Jones PG, Ericksen PJ, Challinor AJ (2011) Agriculture and food systems in sub-Saharan Africa in a 4<sup>°</sup>C+ world. Phil Trans Royal Soc A 369(1934):117–136. https://doi.org/10.1098/rsta.2010.0246
UNDP. (2012). Africa Human Development Report 2012 Towards a Food Secure Future. Retrieved from http://ageconsearch.umn.edu/record/267636/files/UNDP-Africa%20HDR-2012-EN.pdf
Usman MA, Gerber N, von Braun J (2019) The impact of drinking water quality and sanitation on child health: evidence fromrural Ethiopia. J Dev Stud 55(10):2193–2211. https://doi.org/10.1080/00220388.2018.1493193
Usman MA, Haile MG (2019) Market access, food security and nutrition: evidence from selected sub-Saharan Africancountries. In: Paper presented at the 6th African Conference of Agricultural Economists: Rising to meet newchallenges—Africa's agricultural development beyond 2020 Vision, Abuja, Nigeria
von Braun J (1995) Agricultural commercialization: Impacts on income and nutrition and implications for policy. Food Policy20(3):187–202. https://doi.org/10.1016/0306-9192(95)00013-5
von Braun J, Kennedy ET (1994) Commercialization of agriculture, economic development, and nutrition. John Hopkins Press,Baltimore
Webb P, Kennedy E (2014) Impacts of agriculture on nutrition: nature of the evidence and research gaps. Food Nutr Bull35(1):126–132. https://doi.org/10.1177/2F156482651403500113
Wiggins, S., & Keats, S. (2013). Leaping and learning: linking smallholders to markets in Africa. Available at http://hdl.handle.net/10568/35246
Wood B, Nelson C, Kilic T, Murray S (2013) Up in smoke? Agricultural commercialization, rising food prices and stunting inMalawi (The World Bank Group, Policy Research Working Paper 6650). https://doi.org/10.1596/1813-9450-6650
World Bank (2012) Transforming through infrastructure: infrastructure strategy updates, FY 2012-2015. World Bank,Washington, DC
Publisher’s NoteSpringer Nature remains neutral with regard to jurisdictional claims in published maps and institutional affiliations.
Usman and Callo-Concha Agricultural and Food Economics (2021) 9:18 Page 21 of 21