Opening up electricity markets: Liberalisation in the EU and recommendations for Israel

www.eprg.group.cam.ac.uk
EP
RG
WO
RK
ING
PA
PE
R
Abstract
Does Liberalisation cause more electricity blackouts? Evidence from a global study of newspaper reports
EPRG Working Paper 0902 Cambridge Working Paper in Economics 0864
William Yu and Michael G.Pollitt
There is a public perception that electricity liberalisation is the major cause of recent electricity blackouts. This is reflected in the newspaper reporting of blackouts. By contrast, it was not listed as a cause in any official investigation reports. In this paper, we examine the common causes of a number of large blackouts worldwide by applying the qualitative content analysis technique to different investigation reports. We generate a regional blackout dataset, spanning European, Latin American and Asian regions, by using news articles derived from the Factiva database. We use the random effects model and sample means techniques in a detailed examination of the effect of liberalisation and regional factors on the number of ‘small’ electricity blackouts between 1998 and 2007. The results indicate that, contrary to what we might expect, liberalisation does not have a significant statistical effect on the frequency of small blackouts. The perception that there is an increase in the number of blackouts after liberalisation seems to be shaped by the media’s reporting of individual ‘large’ incidents rather than the number of incidents reported.
Keywords power outage, electricity blackouts, liberalisation
JEL Classification L15, L51, L94
Contact [email protected] Publication January 2009 Financial Support ESRC, TSEC 1

1
Does Liberalisation cause more electricity blackouts? Evidence from a global
study of newspaper reports
William Yu
Michael G. Pollitt *
Abstract
There is a public perception that electricity liberalisation is the major cause of recent electricity
blackouts. This is reflected in the newspaper reporting of blackouts. By contrast, it was not listed as
a cause in any official investigation reports. In this paper, we examine the common causes of a
number of large blackouts worldwide by applying the qualitative content analysis technique to
different investigation reports. We generate a regional blackout dataset, spanning European, Latin
American and Asian regions, by using news articles derived from the Factiva database. We use the
random effects model and sample means techniques in a detailed examination of the effect of
liberalisation and regional factors on the number of ‘small’ electricity blackouts between 1998 and
2007. The results indicate that, contrary to what we might expect, liberalisation does not have a
significant statistical effect on the frequency of small blackouts. The perception that there is an
increase in the number of blackouts after liberalisation seems to be shaped by the media’s reporting
of individual ‘large’ incidents rather than the number of incidents reported.
Keywords: power outage, electricity blackouts, liberalisation.
JEL Classification: L15, L51, L94
Acknowledgements
We acknowledge the support of the ESRC Electricity Policy Research Group. All remaining errors are the
responsibility of the authors.
* Corresponding author. University of Cambridge, Judge Business School, Trumpington Street, Cambridge, CB2
1AG, UK. Telephone: +44-(0)1223-339615, Fax: +44-(0)1223-339701, Email: [email protected]

2
1. Introduction
Electricity blackouts are a source of political and regulatory concern. They bring both economic and
social losses to business and society. Beyond the direct causes due to technical and human errors,
the recent occurrence of the significant blackouts in Western countries, such as those in North
America (August 14th, 2003) or Italy (Sept 28th, 2003), are thought to be the result of liberalisation
in the electricity sector. It is commonly believed that the frequency and scale of blackouts will
intensify in line with the increased competition, scale of operation and cross-regional trade of
electricity. Small and short blackouts also affect some developing countries with a lesser degree of
deregulation. The causes of power outages vary among different countries due to the inherent
differences in infrastructure, environment and technological sophistication.
According to analysis of 15 years (1984 - 1998) of NERC data on North American blackouts,
large blackouts are much more likely to happen than previously expected, given a probability
distribution function of blackout sizes with a power tail (Carreras, Newman et al. 2002). The
frequency distribution of the blackout sizes does not decrease exponentially with the size of the
blackout. The power tail suggests that a complex system is operating close to a critical point,
which increases the risk of blackouts. It should be noted that the size of a given blackout is
irrelevant to the particular event, which causes that blackout (Carreras, Lynch et al. 2004).
Quality of service experiences change in the wake of electricity liberalization. Electricity
liberalisation continues to be one of the longest running and challenging international
micro-economic experiments. However, the effect of liberalisation on the quality performance
remains controversial. Thomas and Hall (2003) reveal that a greater risk of blackouts is faced in
the current context of liberalisation and privatisation. They argue that the reduction in
maintenance, in order to maintain the profitability of generators, will increase the risk of blackouts.
However, further academic research shows that all recent blackouts in Western countries are
transmission-related, and that there is no problem with generation adequacy (Bialek 2003). Bialek
(2004) contends that there seems to be little formal evidence of a connection between electricity
reform and blackouts based on the US-Canada and Italian blackouts of summer 2003. Although
some operating rules have been violated in these cases, the main underlying reason for the
blackouts is the inadequacy of rules to accommodate the changes, which is a direct consequence
of significant increases in cross-border trades and tighter reserve margins. In Europe, in the wake
of liberalisation, it has become evident that the market is characterized both by underinvestment

3
in cross-border transmission capacity and by a reluctance to carry out costly upgrades of power
technologies, which would otherwise improve the quality of service (EurActiv 2008).
The aim of this paper is to examine the relations between the degrees of liberalisation and reported
blackouts on a regional comparative basis. We evaluate whether or not there is an increase in the
frequency of small and medium blackout incidents in developed and developing countries – all with
different degrees of liberalisation – over a specific time period (1998 – 2007). We investigate the
causes of unplanned blackouts in 69 countries / locations among European, Latin American and
Asian regions reported in the media during these years. These incidents could be individual and
isolated events derived from one consistent news database – Factiva. Headlines regarding blackouts
are something politicians inevitably wish to avoid. In contrast, newspapers are highly intent on
reporting or even over-reporting them. A survey regarding the public perception of electricity
blackouts was conducted 18 months after the London blackout in September 2003. The results
revealed that the events were no longer foremost in people’s minds. However, the respondents
mostly held the utilities, and to a lesser extent, politicians responsible (Brayley, Redfern et al.
2005).
Factiva is a database, which contains blackout news articles. Although the Factiva database is not
exhaustive, the blackout news record of the last 10 years might provide a lens that offers insight into
whether or not there is an actual increase in blackout incidents with the advent of liberalisation, or if
this perceived increase in blackouts is simply the result of proportionally increased media focus on
blackouts. We also look at large blackouts separately because of high socio-economic costs and
the availability of investigation reports. Using the content analysis technique, this paper identifies
the common threads emerging from a number of large failures which recently happened in the U.S.,
Europe, Latin America and Asia. This paper is the first study of its kind, at least in the context of
electricity deregulation, where the reporting of blackout incidents in regions of Europe, Latin
America and Asia over time is used to evaluate the causes of power outages.
Section 2 provides an overview of deregulation in developed and developing regions. Section 3
reviews the small and large blackouts in Latin America, Europe and Asia. Section 4 describes the
data used in the study. Section 5 is the methodology. Section 6 summarizes the results. Section 7 is
the conclusion.

4
2. Electricity Deregulation
2.1 Electricity reform in developed economies - Overview of the U.S. and Europe
Most electricity sectors began with the structure of vertically-integrated geographic monopolies.
The rationale for natural monopoly is based on the economic theory that a single utility, in one
region, is more efficient and exhibits lower costs of generation and transmission of electricity than
several utilities (Vickers and Yarrow 1988). A utility receives monopoly status in return for a tariff
structure that provides for a fair rate of return on invested assets (Spence 1975). However, in the
early 1970s, this belief began to change in Western countries, with the economic and technological
advancements that further challenged the rationale of economies of scale and scope (Byrne and Yu
2003). The new combined cycle gas turbines (CCGTs) was more efficient and less costly than coal
generation facilities owned by traditional utilities (Pineau and Hamalainen 1999). With the
increasing pressure from large industrial customers pressing for improving efficiency and thus
reducing prices, most governments passed laws to liberalise the electricity industry and open it up to
competition.
An increasing amount of research has also revealed that market liberalisation and privatisation in
the context of effective regulation could bring in substantial efficiency gains that would benefit
customers (Jamasb, Mota et al. 2004; Pollitt 1995). The main expected effect of privatization is that
the pursuit of profit by private entities will lead to efficiency improvements and cost savings (Pollitt
1997). Improvement in efficiency and quality of service levels in monopoly transmission and
distribution networks is expected in the wake of industry reform, in the presence of proper
regulation (Newbery 1997). Liberalisation of the electricity market therefore involves the creation
of a combination of competitive energy and retail markets, and regulated transmission and
distribution activities. Liberalisation generally involves one or more of the following inter-related
steps: sector restructuring, introduction of competition in wholesale generation and retail supply,
incentive regulation of transmission and distribution networks, establishing an independent
regulator, and privatisation (Jamasb 2002; Joskow 2003; Newbery 2002a).
Since the 1990s, electricity industry restructuring, characterised by liberalisation and privatisation,
has become a common phenomena amongst developed countries (Jamasb and Pollitt 2005).
However, in the US, in the wake of the California electricity crisis in 2000-01, the restructuring
process has slowed down significantly and many states have postponed their reform plans. In
response to the California crisis, the U.S. Vice President blamed the problem on the regulatory

5
scheme (Frontline 2001). The U.S. Secretary of Energy highlighted that the causes of the blackouts
was the new rules of the game, which were created by those that passed the flawed deregulation
plan in 1996. The media was filled with headlines such as ‘California’s Deregulation Disaster’ and
‘Deregulation Blamed for California’s Energy Crisis’ (CBC 2001; Wasserman 2001). Significant
power interruptions and large price spikes undermine support for liberalisation. The August 14,
2003 blackouts in New York and parts of Europe have dampened political enthusiasm for reform.
Competition among merchant power plants is thought to make the system unreliable as a result of
unpredictable power flows across the grid (Funk, Murray et al. 2003). The media also blamed
deregulation for the 2003 blackout which occurred in the northeast U.S. and Ontario, raising public
concern (Wilson 2003). Deregulation was not listed as a cause in the investigation report of the
August 14th 2003 blackout (POST 2004). The media cast doubt on why a separate study on the role
of deregulation in the blackout has never been done, even though the investigation reports called for
that (Wald 2005). An apparent contradiction seems to exist between the formal literature and public
perception towards the causes of blackouts.
In the EU utility liberalisation is justified in order to create an internal market for utilities including
electricity, gas and telecommunications. The first electricity directive of the European Union
became effective in February 1997. The European Commission, the European Parliament and the
European Court of Justice actively promote the creation of a single European electricity market for
increasing competitive advantage (Nylander 2001). The motivation behind this is similar to that of
the U.S., with the aim of opening the market to independent operators. This allows consumers to
purchase energy from non-national providers so as to drive energy prices lower. However, the
political cost for deregulating the market differs from country to country. For example, the cost in
France is higher than that in the U.K., due to the fact that all French utilities are significantly
state-owned, with strong involvement from the unions. The degree of liberalisation of electricity
markets in Europe also varies. The United Kingdom, the Netherlands and Scandinavia, followed by
Spain and Italy are regarded as more liberalised countries. On the contrary, Portugal, France, and
Belgium lag behind other EU member states in opening up their electricity sectors for competition,
due to political factors and the relative strength of their national utilities (Jamasb and Pollitt 2005).
Newbery (2002b) warns that much of the EU lacks the essential legislative and regulatory power to
mitigate generator market power. Liberalisation may lead to higher prices unless there are more
contestable markets, expanded transmission capacity and more investment in generation capacity.
2.2 Electricity liberalisation in developing countries - Overview of Latin America and
Asia

6
Since 1990, electricity reform has swept across developing countries, as much as in OECD
countries. The electricity reform in many non-OECD countries, however, occurs within ill-defined
or under-developed legal and institutional contexts (EIA 1999). The appointment of regulators in a
number of countries does not necessarily guarantee effective oversight of the sector. The sectors are
still troubled by scandals involving private power projects (so called IPPs – Independent Power
Projects), insider privatisation schemes of incumbents, and tariff regimes that range from being
highly inadequate to the draconian. The broad range of reform experience indicates that
disappointing results are often a product of a narrow focus on finance and cost recovery, which is
inflexibly applied (Williams and Ghanadan 2006). Cubbin and Stern (2006) suggests that good
regulatory governance has a positive and statistically significant effect on some electricity
industry outcomes in developing economies – notably increasing per capita generation capacity
levels. Unlike the developed countries, the rationale for liberalisation in developing countries is to
facilitate the growth of the national economy and relieve the government’s budget constraint
(Cubbin and Stern 2006). This aims to bring the investment flows into the industry rather than
achieving optimal efficiency in operation of the sector per se.
With regard to non-OECD countries, poor economic performance during the 1980s resulted in
deteriorating electricity infrastructures in many Latin American nations. Chile was the first country
in the world to deregulate its state-owned electricity utilities in 1982 (Pollitt 2004). Quality of
supply has significantly improved in the Chilean electricity sector since 1982. Technical losses (i.e.
wasted energy) and non-technical losses (due to theft) fell sharply. Across the country technical
energy losses in the distribution system fell from 10.2% in 1982 to 6.2% in 2002 (Pollitt 2004).The
positive experience of Chile provoked similar reforms in Argentina, Brazil, Bolivia, Columbia and
Peru (Bacon and Beasant-Jones 2001). In the first half of the 1990's, when most Latin American
countries experienced economic growth, several nations also began privatizing their electric power
industries. The deregulation in Argentina, which began in 1992, resulted in a significant increase in
competition in generation and retailing to large customers. The experience of the electricity sector
in Argentina cannot be separated from that of the rest of the economy. Pollitt (2008) concludes that
the reform was very successful prior to the collapse of the Argentine peso in early 2002. Quality of
supply has improved overall within the Argentine electricity sector since 1992. Technical and
non-technical losses have fallen sharply from around 26% in 1992 to 13% in 2002. Power outages
in the transmission system have fallen since privatisation. In Brazil, privatisation started in 1993,
while deregulation began in 1998. The quality of service has improved in terms of the reduced
7
duration of power interruptions after initiation of the market reform. However, the non-technical
losses remain the same (MAE 2003).
According to Pollitt (2004), Chile’s electricity reform is a clear example of how the protection of
property rights within a regulatory system which limits the ability of incumbents to exploit market
power can capture most of the gains from reform. In the case of Argentina, well-organised markets
and effective network regulation were undermined by political interference in the pricing of
electricity. Clearly the macroeconomic crisis of 2002 profoundly affected the Argentine economy as
a whole and the electricity sector in particular (Pollitt 2008b). In Brazil, there have had problems
with market power. The sub-market, for example, in the North East region works as a duopoly
rather than a competitive market (Arango, Dyner et al. 2006). According to Rufín (2004), in terms
of promoting competition, Argentina is the most pro-competitive in Latin America, with Brazil the
least favorable to competition.
Issues commonly faced by the Latin American Countries (LAC) include difficulties of establishing
an active forward market for electricity and establishing an independent regulatory body. The
capacity payments mechanism for ensuring energy adequacy in markets where there is rapid
demand growth is also a problem according to OECD (Wolak 2003). Brazil and Chile suffered from
major blackouts, in 1999 and 1998 respectively, due to a shortage of hydro. Coupled with the
unstable political environments, further reforms in these Latin American countries were postponed
(Arango et al. 2006).
In Asia, countries such as South Korea,1 Thailand, Indonesia, and the Philippines are legally bound
to accelerate electricity reforms as a consequence of the conditions attached to the macroeconomic
stabilization loans provided by the IMF (International Monetary Fund) and World Bank. The Asian
financial turmoil in late 1997 triggered sharp declines in foreign direct investment in power sectors.
Like many other developing countries, China has been embroiled in an intense process of debate
about how to carry out liberalisation in the electricity sector. The reforms in China were
implemented with the aim of reducing the government’s managerial role in electricity supply during
the late 1980s (APEC). In 1998, China deregulated electricity prices for rural areas. In late 2002, the
Chinese government restructured the largest utility firm, State Power Corporation and divided it
into separate regional transmission companies and divested its generation facilities (Xu and Chen
2006). The first phase of deregulation involves regrouping current power plants into 4-5 companies
1 OECD Asia.

8
and formation of six grid companies (Wu 2004). The former State Power Corporation still owned
46% of the electricity generation assets and 90% of the supply assets of the country in 2004.
With consecutive years of economic growth at an annual rate of 7 - 8% power outages affected
significant numbers of people in Chang Sha City of Hunan province. 1.5 million people were
subjected to regional power cuts and rotational electricity cuts in 2003 (Caijing 2003). More
recently, price reforms have been put in place to increase the attractiveness of investments in
China’s electricity sector. This aims at addressing the frequent blackouts resulting from capacity
shortages brought about by the booming economy. Different laws and processes are developed for
generation planning and investment as part of the experiment in restructuring.
In recent years, the prospects for further privatisation and the opening of monopolies in non-OECD
countries has been very uncertain. As a result of political and practical difficulties with privatisation,
often intermixed with disappointing results, electricity policy is undergoing a fundamental
reassessment in many non-OECD countries (OECD 2007). Future policies are unlikely to continue
based solely on the standard approach adopted in developed countries; involving asset sales to
private investors, unbundling and independent regulation2.
The degree of liberalisation varies among countries and is compounded by difficulties with
obtaining precise measures of it. Based on the combined reports of OECD, APEC Outlook and
Security Issues and EIA and literature review, we can roughly classify three regions into different
rankings (APEC; EIA 1999, 2000; OECD 2007). In some areas of Europe, more progress has been
made towards an open competitive market compared to Asian and Latin American regions.
However, the outstanding achievements of liberalisation in Chile and Argentina (at least until 2002)
and to lesser extent Columbia and Peru, make Latin America a more liberalised continent than Asia.
2.3 Effective liberalisation and blackouts
Globally, the evidence for the success of electricity reform is mixed. It is difficult to find clear
evidence of reform success demonstrated in econometric studies (Jamasb et al. 2004). The
Californian electricity crisis has increased concern over the security of supply in the context of
liberalisation. Joskow (2001) argues that the problems in California are not due to the inherent
2 For details on the contrast between OECD deregulation and non-OECD electricity reforms, please refer to Williams and
Ghandadan (2006).

9
deficiency of deregulation, but instead originates from the way that California implements its
reforms. This has been combined with significant ill fortune and ineffective government responses
to these problems (Joskow 2001). This viewpoint of poor implementation is supported by the
panelists at a conference co-sponsored by the Hoover Institution and Stanford Institute for
Economic Policy Research (Benson 2001). In contrast, Pennsylvania's deregulation is working
effectively. Norway and England also present examples of successful deregulation. Liberalisation
has often been accompanied by privatization. According to Fumagalli et al (2007), privatisation
does not necessarily bring a negative effect on the service quality of utilities. The case in point is
seen with the partial privatization of the Italian electricity utilities: all other things being equal,
partial privatisation does not lead to a deterioration of supply quality nor does it enhance service
(Fumagalli et al. 2007).
Successful liberalisation in the developed economies requires a well-organised sector, associated
ancillary services and transmission capacity markets. This will achieve competition with physical
balancing and appropriate regulation of monopoly power (Jamasb and Pollitt 2005). A key lesson is
that laws and frameworks alone do not guarantee success. There is a clear positive correlation
between the degree of development of liberalisation and the quality of the regulatory agency (Green,
Lorenzoni et al. 2005). Effective regulation requires political independence, professional capacity,
and financial resources to design and enforce regulations in the public interest (EIA 2000). Williams
(2006) concludes that improving reforms requires emphasis on a broader set of objectives,
including public benefits, service provision, effective regulation, and socio-political legitimacy.
The success of non-OECD reforms depends largely on attracting foreign investment.
The difficulty of replicating the success of the early reformers has become more apparent,
particularly in developing countries. The U.S. federal program has stalled and many jurisdictions
have failed to pursue electricity liberalisation to its logical conclusion (Pollitt 2008a). Policymakers
in developed economies may sometimes lose sight of the fact that hurdles (in terms of social and
political fabric, legal and financial frameworks and economic development factors) may prevent
rapid reform. The outcomes of reform in emerging economies may differ from what economists and
industry analysts in developed economies expect or consider ideal (APERC 2000). Above all,
reforms must be based on realistic assessments of national needs and capabilities.
3. Small and large electricity blackouts
3.1 Major blackouts in the U.S and Europe

10
The definition of a power outage, measured by its duration, appears to be similar among countries.
A customer interruption in the U.K. is defined as a power cut lasting more than 3 minutes, 1 minute
in Sweden and less than 5 minutes in the U.S. However, there is no official definition with regards
to the size of blackouts. In this paper, a large blackout refers to incidents that affect over a million
people in various locations; these blackouts can be international or cross-jurisdictional, involving
cascading events. The economic cost of a large blackout is significant compared to small, isolated
and localized blackouts. This is because they are unplanned (a significant number of small
interruptions are planned) and last a relatively long time. For example, the economic cost of the
disruption in electricity supply in the US-Canada region during the August 2003 blackout is
estimated at between US$4 billion and US$10 billion within the U.S., and close to CAD$1 billion in
Canada (IEA 2005). For planned interruptions, they are often related to the temporary suspension of
supply for reasons such as carrying out repairs, maintenance and construction (Ofgem 2007). In the
U.K. distribution networks (14 DNOs), unplanned interruptions account for 80% of the customer
minutes lost.
Large blackouts are more complex than smaller ones as they often involve cascading events in
which the primary failure triggers a sequence of secondary failures that lead to a blackout in a large
area of the grid. Apart from the news reported in the media, sources of information on blackouts are
limited. Often however, the government will set up a special task force to investigate the causes of
large blackouts and make recommendation. In the U.S., these investigators include US-Canada
Power System Outage Task Force, and independent research institutes such as The Electric Power
Research Institute (EPRI) and International Energy Agency. Other investigations are carried out by
the electricity regulators (IEA 2005; Ofgem 2004; POST 2003, 2004). Table 1 shows both the
significant and smaller blackouts, which occurred between 1998 and 2005.
Table 1: Significant and Small Blackout Incidents
Country Location/Region Year of
Occurrence
Population affected
Larger Scale
U.S. California 2001 1.5 million
U.S. NewYork-Canada 2003 50 million
U.S. Florida 2004 5 million
Europe Southern Sweden and Denmark 2003 5 million

11
Europe Italy 2003 57 million
Europe Moscow 2005 10 million
Latin America Chile 1998-99 ~13 million
Latin America Brazil 1999 75 million
Asia Taiwan 1999 8.46 million
Asia Luzon, Philippines 2002 30 million
Asia Java Island, Indonesia 2005 100 million
Smaller Scale
New Zealand Auckland 1998 82,000 people
Latin America Buenos Aires, Argentina 1999 600,000 people
U.S. San Francisco 2003 120,000 people
Europe London, U.K. 2003 500,000 people
Source: (AE 2002; Arango et al. 2006; BBC 1998; Bialek 2003; BNDES 1996; Bulletin 2002; Chang 1999; CNN
1999; CRISMART 2001; Fischer and Galetovic 2000; Joskow 2001; Kelman 2001; Kleindorfer 2004; Linhares,
Giambiagi et al. 2002; Mennel and Viecens 2007; Novosel 2003; NYtimes 1999; Pollitt 2005; POST 2004; SFOE
2003; Sioshansi and Pfaffenberger 2006b; Su, Wong et al. 2006; UCTE 2003)
Studying the large cascading blackout incidents would reveal the chain of events and often
identify several inter-linked causes. A number of studies have been conducted to analyze the
August 14, 2003 blackout, which covered 34,000 miles of transmission, affected 8 states in the
U.S. and 2 provinces in Canada and left 50 million people in the dark (POST 2003; Ray 2003).
The worst supply disruption in Europe ever recorded as occurred on Sept 28, 2003. This happened
in Italy and affected 57 million people. Around 19,000 MW of electricity load was lost over a
277,000 square kilometer area. The Scandinavian blackout on Sept 23, 2003 affected
approximately 5 million people, cutting off around 3,000 MW of generating capacity in Sweden,
and 1,850 MW in Denmark (Novosel 2003).
3.2 Major blackouts in Latin America (Brazil and Chile)
Brazil's three largest cities plunged into darkness by a blackout which occurred on March 11th,
1999, and involved a load loss of 24,730MW of electricity. The power system survived the initial

12
cause but later collapsed, and caused subsequent outages in the São Paulo area, followed by the loss
of both the HVDC and the 750 kV AC links from Itaipu, The blackout affected as many as 75
million people, and lasted as long as four hours. While several electricity ‘islands’ remained in
operation, totaling 10,000 MW, there was a complete blackout in the federal states of São Paulo, Rio
de Janeiro, Espírito Santo and Mato Grosso do Sul (NYtimes 1999).
The majority of Chile’s electricity supply comes from hydroelectricity and the total installed
capacity in Chile was 7858 MW in 1998. The central regions of Chile went through the hardest
drought of the century in 1998. Random outages and three-hour long rotating electricity cuts
occurred in Santiago, the capital city of Chile from November 1998 and continued through to April
1999 and a total of 500 GWh of electricity was lost (Fischer and Galetovic 2000; Pollitt 2004).
3.3 Major blackouts in Asia
Another significant blackout in Asia happened in the same year as the Chilean blackout on July 29th,
1999. The partial collapse of a transmission tower caused a large blackout in Central and Southern
Taiwan, which affected 8.5 million electricity consumers (Chang 1999).
The Philippines' main island of Luzon was hit by a power failure in May 21st, 2002, affecting 40%
of the country’s 76.5 million population. In Manila's Makati financial district, employees left the
offices to escape the tropical heat. Traffic lights malfunctioned, which subsequently caused traffic
congestion. The power outage crippled the transportation system, stranding thousands of
commuters on the road (Velasco et al., 2002).
Table 2 summarizes the major blackout incidents among four regions.
Table 2: Major blackouts in 4 Continental regions
Country Location Date
U.S. U.S.-Canada August 14th, 2003
Europe Italy; Sweden-Denmark Sept 28th, 2003; Sept 23rd, 2003
Latin America Brazil; Chile March 11th, 1999; 1998-99
Asia Taiwan, Philippines July 29th, 1999; May21st , 2002
Source: (Arango et al. 2006; Bialek 2003; Bulletin 2002; Chang 1999; Pollitt 2004; POST 2004;
UCTE 2003)

13
3.4 Small blackouts and category of causes
Although the impacts of small and medium blackouts are not comparable to the larger ones, they
still draw media attention. They happen more frequently and can be initiated by single or multiple
causes ranging from tree contact, adverse weather conditions to the occurrence of snakes entering
power sub-stations. Consequently, the socio-economic effects of the blackouts are perceived to be
significant.
In general, technical-related problems are the major causes of outages. Drawing on internal
statistics of outage causes derived from a U.S. electricity firm (Avista 2001), the pattern of
distribution of causes is as follows: Equipment problems ranked top (30.7%), followed by
tree-related problems (23.7%), weather-related problems (16.7%) and lastly those caused by
animals3 (around 3%).4
According to some studies, it is difficult to monitor longer sequences of events in blackout
situations as well as the huge range of possible rare occurrences, many of which cannot be
anticipated (Dobson, Carreras et al. 2004). Although much of the effort in avoiding cascading
failures has focused on reducing the chances of a failure commencing, it is hard to determine
whether or not power system design and operation is such that cascades will tend to propagate after
they have started (Dobson et al. 2004). As research indicates, mitigation of blackout risk should
remain highly sensitive to counter-intuitive effects in complex self-organized critical systems. For
example, the suppression of small blackouts could lead to the system, operating closer to the critical
limit and eventually increase the risk of large blackouts (Carreras et al. 2002). Human error in
attempting to contain a blackout is conversely often a factor which increases the extent of a
blackout. Often, blackouts are exacerbated by the slow response in restoring power by electricity
utility operators.
4. Methodology
4.1 Small blackout incidents – Generation of a worldwide dataset
3 Animal interference.
4 Equipment problems: Connectors, switch, insulator, transformer, etc; Tree problems: Tree fell on wires, tree is growing into wires,
etc; Weather: Lightning, snow, wind, etc; Animal: Bird, Squirrel, Underground vermin, etc.

14
Using the Factiva news database, a blackout incidents data set is generated, which enables us to
define the occurrence and extent of small and medium events in the European, Latin American and
Asian regions. The Factiva database is commonly used in other kinds of studies as a source for a
historical dataset that is based on news articles which can then be subjected to further analysis
(Freeman, Chapman et al. 2008; Tanzler, Feil et al. 2008). For example, Freeman et al. (2008) use a
12-year history of news related to in-car smoking to analyse how the advocacy for banning smoking
in cars carrying children attracts public and political support.
We scan and exclude the major blackout incidents such as the September 2003 Italian blackout
though there is a possibility that a major blackout can be misclassified as a small one. In our
analysis of news articles from the Factiva database, duplicated news were excluded. The key search
- ‘electricity blackout’ and ‘power outage’ - is used to identify the relevant incidents.
4.2 Small blackout incidents – frequency measurement
We compared the blackout incidents in the two 5-year periods from 1998 to 2002 and 2003 to 2007
in terms of frequency. We also compare the number of blackout incidents over the last ten years
among three continental regions (Europe, Latin America and Asia) covering 69 countries or
locations.
4.3 Small blackout causes – Categorization and Percentage of distribution
The causes of blackouts in these three continental regions are investigated and we compare the
proportions of the various causes. It is common practice to classify major blackouts as those due
either to technical and human error, or non-discretionary factors such as the weather. In this paper,
we classify the causes of blackouts into 11 categories (Table 3). Due to the above-mentioned
limitations of media coverage, we can only identify the primary cause of a blackout incident. Some
blackouts have multiple causes often linked to form a chain of events. For example, the initial cause
could be bad weather - heavy rainfall, this softens the soil and combined with strong winds, can
uproot the trees, which then fall on suspended electricity cables, resulting in a blackout (Yu, Jamasb
et al. 2008). Blackouts caused by deliberate human attacks, terrorism and war are excluded from the
study. Based on the reported news articles, it is possible to provide a clear overview of the
prevailing causes and their percentage distribution.
The category of ‘Technical’ blackout is a broad classification covering a number of

15
equipment-related problems. The category of ‘Unknown’ blackout refers to an incident that
requires further investigation. In most cases, the term ‘Unknown’ refers to causes not reported by
the media. Animal interference is categorized as one of the main causes of outages in the electric
service reliability report requested by law in some states of the U.S. (Dutzik and Sargent 2003).
Table 3: Category of blackout causes
Causes Examples
1.Technical Cable fault, Transformer explosion, Tripping, Short Circuit, breaker failure, defective parts
2. Weather Snowstorm, Tropical Storm, Heavy Rainfall, Lightning, Sleet, Strong Winds, Solar Storm,
Torrential Rains, High Temperature
3. Natural Disasters Earthquake, Avalanche, Tidal Waves, Landslides, Flooding, Tornado
4. Capacity Excess Demand, System Overloaded
5. Maintenance Lack of maintenance
6. Animal Python, Turkey, Cat, Raccoon, Snake
7. Human Contractor’s mistakes, cables cut & stolen, equipment theft, builder’s carelessness
8. Tree Uprooted Trees, Fallen Trees
9. Accident Fire, Kite entangled, Construction Crane fell off, Helicopter crashed, Tree cutting, car accident
hitting a power line pole
10. Disruption Gas and Water Supplies Interrupted, shortage of fuel
11. Unknown Unknown – to be investigated/Not reported
4.4 Degree of liberalisation – Categorization of Score Bands
To determine the degree of liberalisation of each country or location, we use three criteria:
‘Introduction of privatisation’5, ‘Establishment of wholesale electric power pool market’ and
‘Establishment of regulatory agency’ based on the findings of Nagayama (2007). A country is
scored 3 if it fulfills all three criteria, and 0 if none of them. The results derived here are solely
based on the data published in Nagayama (2007) without further investigation. According to our
knowledge, there is no change in the status of the selected countries in 2007 and therefore the
dataset in Nagayama, 2007 from 1982 to 2006 are considered valid. The average liberalisation
5 According to Nagayama’s article, privatisation is the passage of primary legislation of ‘Electric Privatization’ law and the
establishment of the regulatory framework. This includes partial and full equitization of state-owned companies.

16
score of countries in a region will give an overview on the degree of liberalisation of each
continental region.
4.5 Relationship between liberalisation, regions and blackouts – Random Effects model
We examine the effect of liberalisation and geographical locations on the small blackout incident
over 10 years for 69 countries/locations, spanning 3 continents and each with 4 liberalisation score
bands. An index is constructed to represent the blackout incidents. We define the index as the
number of blackout incidents per region per score per year. It is derived by using an average of total
incidents in all sample countries of the region within the same score band for a certain year. (See
Appendix 1 for the distribution of score band by country)
However, due to the intrinsic differences between these three continental regions, a random effects
model is used to account for individual heterogeneity. All explanatory variables are included as
dummy variables for liberalisation and region. We group the data into twelve groups based on the
score band by region. STATA software is used.
Random effects model has the following structure:
Tt
Ni
XY itiitit
,...,1
,,...,1
=
=
++′+= εαβλ
[1]
where iα is the individual effect and itε is idiosyncratic error. The distributional assumptions, in
matrix form, are given by α ~ ( NIασ 2,0 ), ε ~ (TNIεσ 2,0 ). In our case, itY refers to blackout
incidents. X denotes a matrix of all explanatory variables. β is a vector of all coefficients
(Equation 1).
4.6 Pre- and Post Liberalisation – Difference in Sample Means (t-test)
We partially examine the difference in the means of blackout incidents between pre- and post
liberalisation. We use the countries with liberalisation score changing from score 0 to 1 as our
sample. This is because this step change in score is the only one, for our period, where sufficient
data is available to perform the analysis. The number of blackout incidents per country is divided by
the number of years of pre- and post liberalisation. We compare the average number of incidents

17
between the two groups. The two-sample t-test is used to determine if two population means are
equal. A common application of this is to test if a new process or treatment is superior to a current
process or treatment.
The two sample t test is defined as follows:
2
2
21
2
121
21
210
///
:
:
NSNSYYT
H
H
a
+−=
≠
=
µµ
µµ
[2]
where N1 and N2 are the sample sizes, Y1 and Y2 are the sample means, and S1 and S2 are the sample
variances.
4.7 Large and small blackout causes – Content analysis
Content analysis is a useful tool for researchers who attempts to identify patterns, frequencies, or
potential categories with respect to the subjects of investigation (Carlson 2008). In this paper, we
apply the basic principle of this technique to our small and medium blackout incidents based on the
Factiva database. We count instances of certain characteristics across a set of blackouts, such as the
frequency of occurrence and causes, and then offer a descriptive statistics of the content. To avoid
complexity and address the limitations of the content analysis method related to subjectivity in
connection with the coding process, we use a more qualitative content analysis methodology rather
than the classical content approach, where quantification and coding are required, for large and
significant blackout incidents in four continental regions (The U.S., Europe, Latin America and
Asia) (Nielsen 2008). An analysis of the narrative sections of the 23 blackout special reports and
articles or news based on the theme of major causes of large blackouts is carried out. The content
analysis illustrates which types of common causes the analysts consider in each significant blackout
when evaluating the events based on technical and non-technical basis. We simply present the major
causes, which are in common stated in each report. We tend to select the large blackout incidents
which allow us to trace its multiple causes, preferably not merely caused by one dominant factor
such as natural disaster. For example, the blackout in Florida, U.S. in 2004, caused by Hurricane
Frances, which affected 5 million people, is not considered. The availability of relevant information
including expert reports and journal articles about the incidents also limit our choice.
4.8 Limitations

18
The results of this analysis do not represent a generalized global pattern, nor do they represent the
actual percentage distribution of blackout causes and frequency of blackouts. This study rather
provides a snapshot of the incidents as reported in news articles. The influence of the media
company’s or reporters’ discretion in choosing the specific blackout events and how to represent it
is a significant secondary factor. However, these matters do not fall within the scope of this study.
The blackout cause is prima facie and based on the preliminary knowledge of reporters. Also, the
precise scale of various blackouts is not considered in this study. The number of data points for each
country is not sufficient to provide a robust analysis at the country level. However as there are clear
regional differences in the degree of liberalisation, then regional comparisons have a clear rationale.
5. Data
5.1 Small blackouts – Factiva database
Using the global news database, Factiva, our analysis focuses on reported unplanned blackouts,
which occur in the regions of Asia, European and Latin America, regardless of their duration (Table
4). After filtering out the irrelevant news and duplicate reports, 481 out of 10,920 news articles from
European, Asian and Latin American regions over the last 10 years (1998 - 2007) are selected from
the Factiva news database. Of the total 10,920 articles, 3,049 are found in the first 5-year period
(01/01/1998 – 31/12/2002) and 7,871 in the second period (01/01/2003 – 31/12/2007). The number
of new articles from America over the last 10 years is 28,192, which is huge. We therefore analyse
separately the large and significant blackouts occurred in the U.S. Limitations of this study consist
of the brief coverage of each incident in the newspaper and the fact that only a basic cause of outage
is mentioned. The duration of the power outage and the number of people being affected might not
be specified in the news. The underlying causes are, therefore, not always clear.
Table 4: Blackout news by region (01/01/1998 – 31/12/2007)
Region No. of
countries
No. of
incidents
Countries
European region 32 178 Albania, Austria, Azerbaijan, Belarus, Belgium, Cyprus, Czech Republic, Denmark,
Estonia, Finland, France, Georgia, Germany, Greece, Ireland, Italy, Latvia, Lithuania,
Luxembourg, Netherlands, Norway, Portugal, Romania, Russia, Serbia, Slovenia, Spain,
Sweden, Switzerland, Turkey, UK, Ukraine
Latin America region 12 59 Argentina, Bolivia, Brazil, Chile, Colombia, Cuba, Guatemala, Honduras, Mexico, Peru,

19
Uruguay, Venezula
Asian region 25 244 Australia, Bangladesh, Brunei, China, Fiji, Hong Kong, India, Indonesia, Iraq, Israel,
Japan, Korea, Lanka, Lebanon, Malaysia, New Zealand, Pakistan, Philippines, Qatar,
Singapore, Sri Lanka,Uzbekistan, Taiwan, Tajikistan, Thailand, Vietnam
5.2 Large blackouts
Our analysis of the major blackouts is based on detailed investigation of reports and academic
studies produced by relevant authorities and scholars. We further analyse the causes of the August
14, 2003 blackout by drawing on several concluding reports including the ‘Final report on the
August 14, 2003 Blackout in the United States and Canada: Causes and Recommendations’ by
U.S.-Canada Power System Outage Task Force, Blackout of 2003: Description and Responses by
PSERC and others (Dutzik and Sargent 2003; GAO 2003; POST 2004; Ray 2003). The August
2003 Blackout reports in the United States and Canada spelled out 46 recommendations to prevent
future occurrences (POST 2004). We also study the worst blackout, which occurred on the
September 28th, 2003 in Italy (SFOE 2003; UCTE 2003) and the Scandinavian blackout of Sept
23th, 2003 (Novosel 2003). To enrich our analysis, we also draw on the general comments given by
the UK House of Commons and Labour Unions on the causes of several major incidents including
the one on August 28th, 2003 in the U.K . (GLA 2004; NationalGrid 2003; Ofgem 2003). The
London August 2003 incident is large in the U.K. context, though small compared to the worldwide
events. For Latin America, we choose the large blackout incidents in Brazil and Chile. We rely on
several expert reports and journal articles to carry out the analysis (Arango et al. 2006; BNDES
1996; Fischer and Galetovic 2000; Linhares et al. 2002; Williams and Ghanadan 2006). The
information on blackouts in Asia is very limited as references are rarely found in the academic
journal articles. One incident from Taiwan (Chang 1999) and another from Philippines are chosen
(AE 2002; Bulletin 2002). Most of the studies adopt only an engineering approach in investigating
the blackouts, which results in a limiting the scope of their findings (Lee and Hsieh 1999; Su et al.
2006) .

20
6. Results
6.1 Small blackout incidents – frequency measurement
The total number of blackout incidents reported in the Latin American and Asian regions in the
first period (1998-2002) is similar to those of the second period. It appears that the reporting of
electricity blackouts increases by two-fold in the second 5-year period (2003-2007) from 58 to
120 articles in European region (Table 5). It must be noted that a significant amount of causes
(30 incidents) within the ‘Unknown’ category in the second 5-year period may affect the quality
of our results. After dropping the category of ‘Unknown’ from the dataset, the number of news
articles almost doubles in the second 5-year period. This pattern is consistent with the previous
result. The proportional increase in Europe originates from the rising number of blackouts
related to ‘Weather’ and ‘Unknown’. The Asian and the Latin American regions show similar
numbers of blackout incidents over the two 5-year periods (Tables 6 and 7). The
technical-related blackout news increases significantly in the second 5-year period in the Asian
region while the European and the Latin American region display the opposite trend.
6.2 Small blackout causes – Categorization and Distribution percentage by region
The blackouts caused by technical problems account for 22% in the European region, 41% in the
Asian region and 36% in the Latin American region (Table 8). The percentage of technical-related
blackouts increases significantly in the Asian region and decreases in the Latin American region
in second 5-year period (Table 6 and 7). The causes on the surface appear to be similar in both
regions ranging from short circuits to breaker failure and cable fault. Although the primary causes
fall in the same category of ‘Technical’, they could be different in nature between regions.
Around 10 – 23% of news reported as category ‘unknown’. Besides the cause of ‘unknown’,
technical and weather-related causes ranked first and second respectively in the three continental
regions (Table 8). However, the type of weather causing blackouts is different within these
regions. Asia is more affected by lightning strikes and typhoons, while Europe is often affected by
heavy snow and snowstorms. Latin America is affected by tropical storms, strong winds and
lightning strikes.
‘Capacity’ appears to be a more dominant issue in the Asian region compared with Latin America
(Table 8). This is consistent with the fact that there has been high economic growth in this region
resulting in a shortage of capacity over the last 5 years. ‘Accident’ is ranked as the third cause of

21
blackout in the European and the Latin American regions, while in the Asian region, ‘Natural
Disaster’ ranked higher ahead of ‘Accident’. The reporting of ‘Natural Disasters’ such as
earthquakes largely increases in the second 5-year period in the Latin American region (Table 6).
‘Maintenance’ has never been reported as an issue in the Latin America region. This may,
however, be due to the style of reporting.
Table 5: Distribution percentage of blackout causes of two 5-year periods (Europe)
European Region First 5-year Period
(1998 – 2002)
Second 5-year Period
(2003 – 2007)
No. of incidents Percentage Distribution No. of incidents Percentage
Distribution
Causes / Total 58 100% 120 100%
Technical 16 28% 24 20%
Weather 11 19% 25 21%
Accident 10 18% 14 12%
Unknown 6 10% 30 25%
Natural Disasters 4 7% 3 2%
Capacity 2 3% 7 6%
Human 2 3% 4 3%
Disruption 3 5% 2 2%
Tree 2 3% 1 1%
Maintenance 1 2% 4 3%
Animal 1 2% 6 5%
Table 6: Distribution percentage of blackout causes of two 5-year periods (Latin America)
Latin America Region First 5-year Period
(1998 – 2002)
Second 5-year Period
(2003 – 2007)
No. of incidents Percentage Distribution No. of incidents Percentage
Distribution
Causes / Total 31 100% 28 100%
Technical 15 48% 9 31%
Weather 2 7% 6 21%
Accident 2 7% 1 4%
Unknown 11 35% 3 11%
Natural Disasters 0 0% 5 18%

22
Capacity 0 0% 2 7%
Human 0 0% 0 0%
Disruption 1 3% 0 0%
Tree 0 0% 1 4%
Maintenance 0 0% 0 0%
Animal 0 0% 1 4%
Table 7: Distribution percentage of blackout causes of two 5-year periods (Asia)
Asia Region First 5-year Period
(1998 – 2002)
Second 5-year Period
(2003 – 2007)
No. of incidents Percentage Distribution No. of incidents Percentage
Distribution
Causes / Total 124 100% 120 100%
Technical 37 30% 50 42%
Weather 18 15% 20 17%
Accident 14 13% 12 10%
Unknown 20 16% 4 3%
Natural Disasters 13 10% 6 5%
Capacity 8 6% 8 7%
Human 3 2% 7 6%
Disruption 0 0% 2 1%
Tree 4 3% 5 4%
Maintenance 5 4% 5 4%
Animal 2 1% 1 1%
Table 8: Total sum and distribution percentage of blackout causes (3 Regions)
1998 - 2007 European Region
Latin American Region Asian Region
Ten-year period No. of
incidents
Percentage
Distribution
No. of
incidents
Percentage
Distribution
No. of
incidents
Percentage
Distribution
Causes / Total 178 100% 59 100% 244 100%
Technical 40 22% 24 41% 87 36%
Unknown 36 20% 14 23% 24 10%
Weather 36 20% 8 14% 38 15%
Accident 24 13% 3 5% 26 11%
23
Natural Disasters 7 4% 5 8% 19 8%
Capacity 9 5% 2 3% 16 6%
Maintenance 5 3% 0 0% 10 4%
Human 6 4% 0 0% 10 4%
Disruption 5 3% 1 2% 2 1%
Animal 7 4% 1 2% 3 1%
Tree 3 2% 1 2% 9 4%
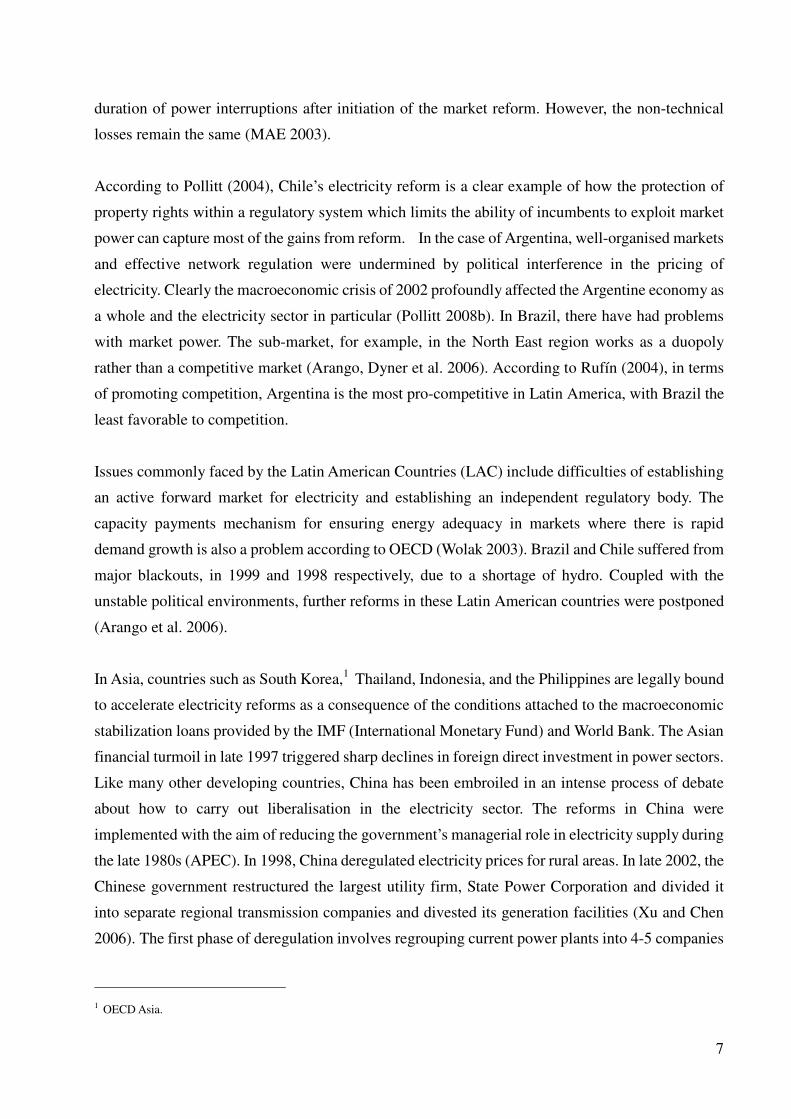
6.3 Degree of liberalisation – Categorization of Score Bands
Since the number of countries varies in each continental region based on our database, we use the
average liberalization score for comparison (0 to 3; 3=maximum as above). The average score is
1.94, 1.92 and 1.24 for European, Latin America and Asian regions respectively (See Appendix II
for the liberalization score by countries/location in 2007 - Table 11, 12 and 13). However, the
overall score in each region is highly affected by the number of countries/locations with score 0
given that the number of countries is not the same in each region. The results are consistent with
the general findings derived from the academic reports that the European region is a more
liberalised region, followed by the Latin American region and the Asian region (APEC; EIA 1999,
2000; OECD 2007).

24
6.4 Relationship between liberalisation, regions and small blackouts – Random Effects
model
Table 9: Panel Random Effects
Dependent variable: Average Blackout incidents per country by region by liberalisation score
Asia 0.6555**
(0.2643)
Europe 0.1895
(0.2218)
Score 0 -0.2523
(0.3062)
Score 1 -0.7467
(0.3109)
Score 2 -0.1117
(0.2492)
Number of Observations : 120
R-Square (between) : 0.5454
**significant at 5% level
The parentheses denote robust standard error
The regression results indicate that only the dummy variable for Asian region is significant (Table
9). The Asian region tends to have more blackout incidents per country per year than that of Latin

25
America. Liberalisation score has no significant effect on the blackout incidents.
6.5 Small Blackouts: Pre and Post Liberalisation – Difference in Sample Means (t-test)
The results indicate that the pooled data is significant at 10% level (Table 10). However, the
regional results of Asian and European regions are insignificant. The pooled result is probably
affected by the Latin American region, whose result is significant at 10% level. Although the
average number of incidents increases after liberalisation, the overall results are not significant. A
note of caution is necessary in interpreting the results. The sample size is too small as we only have
only 15 country observations. These results can serve as an indication only.
Table 10: Difference in sample means for Liberalisation score 0 and 1 (t-test)
Europe
Asia
Latin
America
Pooled
After Before After Before After Before After Before
Mean 0.480 0.132 0.59 0.35 0.388 0.000 0.500 0.182
Variance 0.210 0.033 0.45 0.21 0.074 0.000 0.245 0.106
No. of
Observations 5 6 4 15
t Stat 1.342 0.697 2.850 1.987
Two-tail P value 0.251 0.517 0.065*** 0.067***
*** significant at 10% level
6.6 Large blackout causes in the U.S. and Europe
The above snapshot of blackouts, which occurred in the Asian, Latin American and European
regions, provides a good overview of the nature of outage causes. Most of the recent large blackouts
such as the U.S. (August, 2004), Italy (Sept., 2003) and Denmark (Sept., 2003) have been
transmission-related. The initial cause might be different in each case. However, some common
threads among the blackouts are evident as follows:
6.6.1 Infrastructure – strained transmission systems and interconnected grid
Some believe that deregulation has a negative effect on the reliability of the electricity grid.
Historically grids only had to ensure sufficient capacity for local utilities and their customers.
After deregulation, the increases in trading have overloaded the grid by bulk transfers of

26
electricity from state to state and region to region (Vittal 2002). The interconnectedness of the
American electric grid is its greatest strength, allowing the transfer of electricity to areas of
highest demand and removing the need for excess generating capacity. However, it becomes a
weakness when isolating blackouts (EPRI 2003).
According to the recommendation 23 in the final report on the August 2003 blackout in the U.S.,
reactive power and voltage control practices need to be strengthened. Reactive power problems
were a significant factor in the August 14, 2003 US blackout. They were also important elements
in several of the earlier blackouts (POST 2003, 2004). In a competitive environment the transfers
across the systems will increase. The vulnerability to voltage problems will be higher (SFOE 2003)
due to the increased transmission distances, despite the presence of load shedding. The deficiency
in reactive power causes voltage failures which then spread to the adjacent areas. Reactive support
will draw on neighboring systems, thus dragging down the voltages of the adjacent systems and
causing them to trip (Bialek 2004).
6.6.2 Technical systems
Mechanical faults, component defects, transformer and feeder cable failures are commonly found
as the initial causes of system failure (US-Canada 2003). Further causes can involve tripping lines
due to faults and/or protection actions, which have the effect of causing heavy overloads on other
lines. The underlying causes of the 2003 Italian blackout are the unresolved conflicts between the
trading interests of the involved countries and operators and the technical requirements of the
existing transnational electricity system (SFOE 2003). In the case of London blackout in 2003, the
fault was due to an incorrectly installed protection relay during the replacement of an old
equipment in 2001 (National Grid 2003).
6.6.3 Procedures and training
Outdated operational paradigms, and inadequate security assessment and control contribute to
worsening the situation (Bialek 2003). Apart from some technical factors, it is commonly agreed
that other factors also include a lack of coordination on system protection, e.g. failure to identify
emergency situations and communicate that status to neighboring systems, and a lack of safety
nets and a lack of inadequate training of operating personnel to ensure operation within secure
limits (NERC 2002).
6.6.4 Regulatory and governance

27
In the context of the U.S., a Reliability Council is formed by some electricity utility companies to
govern the reliability of the generation and transmission systems. At the regional level operating
reliably requires compliance to a consistent reliability standard that is not only limited to the
functions within individual electricity utilities but also the interconnected regions formed by
different utilities and independent power producers (IPPs) within or outside the country
(Kleindorfer 2004). However, during the 2003 blackout, only members within the region of the
reliability council are bound by a consistent set of reliability principles and a standard procedure
of contingency operation. The problem is not new according to the North America Electric
Reliability Corporation (NERC). The Reliability Council has no legally sanctioned authority to
demand non-members to comply with its rules. It appears that jurisdiction over individual
electricity utilities will help regulate transmission and ensure an effective method of protecting
mutual interest within interconnected regions; however, this has not yet been fully achieved
(Kleindorfer 2004). A consistent reliability standard is also needed to apply across the functions,
ranging from generation, transmission, distribution to retail supply, to govern the process of power
services and prevent one deficient part from developing into a cascading collapse of the whole
operation (NERC 2002). This increases the difficulty in coordination between each function,
which becomes independent after liberalisation.
6.6.5 Communication and cross-border cooperation
In several significant blackouts, in the U.S. or Europe, neither security coordinators nor control
area operators saw the big picture. Transmission system operators rely mostly on telephone
communications, which slows down the reaction to address the crisis. Sharing timely information
and coordinating between generation and transmission on the condition is critical to mitigate the
impact of blackouts. The ambiguous controversy between the Swiss operator, ETRANS and the
Italian operator GRTN on the matter of requesting a reduction in imports by 300MW to the
previously agreed levels reflects the issue of cross-border cooperation and communication, ahead
of the 2003 Italian blackout. Within control areas (such as the whole of Great Britain) there is no
such issue of inadequate communication.
6.6.6 Lack of investment and incentive
In the U.S. 2003 context, transmission bottlenecks not only created congestion that significantly
decreased reliability but also reflected investors lack of incentives to invest in transmission and
upgrade equipment. The basic rationale behind investors’ commitment to investment is the ability
to quantify the risks, how to collect the benefits, and to be compensated for the costs with
identifiable revenue streams. If investors do not understand what returns to expect for their

28
transmission investment, or the cash flow that will accrue to specific assets, they have difficulty in
making such decisions (Kleindorfer 2004). The different emphasis put on the long-term and
short-term planning horizons, and reliability control versus commercial considerations between
potential investors and the regulators result in the investment gap under the current regulatory
framework. In the long run, when there is no clear ownership and governance structure with clear
economic incentives, this will turn into a matter of who pays and who suffers.
Another difficulty in designing appropriate incentives for transmission utilities is the complexity
and interdependence of the power grid. The problems of complexity and interdependence are
believed to be the sources of disruption and cascading failure as the system approaches its
physical limits in any socio-technical system. Electricity reliability has become a regional issue in
the case of transmission after liberalisation. Although power systems are owned by different
utilities, interconnected transmission facilities must be physically operated in coordination with
each other. This brings in the problem of the tragedy of the commons mentioned in the NERC
report (NERC 2002) that the benefits of a new transmission line are distributed to all parties
economically, but the costs incurred and other negative impacts are imposed only on a limited
number of participants. Pecuniary and technological externalities may emerge easily in this type
of relationship where the aggregate performance is the sum of the individual performance.
In London August, 2003 blackout, it remains unproven that the power failure is due to under
investment (GLA 2004). According to Ofgem’s investigation, none of the equipment involved
with the transmission failures was old or due for replacement. Rather, the equipment that caused
the fault was less than two years old and had either been incorrectly installed or malfunctioned.
Thus, there is no evidence to prove that the failure was due to underinvestment (Ofgem 2003).
6.7 Large blackout causes in Latin America
The major blackout in Brazil occurred in 2001. 90-95% of Brazil's electricity is generated by
hydroelectric plants. Water levels started dropping in 1996 and worsened by an extreme dry
season in 2001, resulted in a substantial decline in generation output. In May 2001, the average
level of water in the reservoirs in the south-eastern, central-western and north-eastern regions was
about 30% of their maximum storage capacity. The 2001 crisis in Brazil highlights the weakness
of its wholesale market model and the particular threats posed by the transition to a liberalised
market. Arguably, electricity reform should make prices and investment more responsive to such
risks. According to Linhares (2002), Oliveira (2007), BNDES (1996) and Kelman (2001) the
main reasons for the crisis were the lack of investment in new generation capacity, unfavourable
29
grid development, and incomplete legislation, as well as a lack of flexibility in planning and delay
in the adjustment of the rules before and during the crisis. There was no appropriate incentive
scheme in place for the new capacity building which later resulted in the shortage of supply. This
also led to a surge in electricity prices during 2001. The difficulty in capacity planning worsened
the situation. The government agency, Comitê de Palnejamento da Expansão (CCPE), which is
responsible for consolidating all the power firms projections for future demand has never actually
fulfilled its function (Oliveira 2007). Volatility in economic growth also exacerbates risks to
investment. According to the Kelman report (Hermes de Araujo, 2006), the main source of this
crisis was ineffective government management and lack of communication between governmental
agencies and departments. The lack of clear responsibility for overseeing energy policy, lack of
clear rules, lack of faith in contracts and incomplete and inadequate legislation were institutional
causes (Linhares et al. 2002). Oliveira (2007) highlights that the government’s institution, the
National System Operator (ONS) only manages to optimize the system and supply of the
hydropower industry, assuming that thermal capacity would be available in case of shortfall.
However, ONS do not have responsibility for assuring that such capacity is actually available.
In the case of the Chilean blackout in 1999, the country had an energy shortage due to a sustained
period of low water availability. Chile faced a La Nin˜a event, which lead to a reduction in the
levels of the Las Lajas Lake (Fischer and Galetovic 2000). The cause of the shortage appeared to
be related to gambling with the weather problem with an unrealistic aim to achieve a political goal
by the government (Millán 2006). The high probability of occurrence of water shortage resulted
from the inappropriate setting of a low cost-of-deficit parameter. However, this is not agreed by
Pollitt, who contends that the problem is the combination of the regulator and deregulation (Pollitt
2004). Immediately before the crisis, the Chilean government takes a risky approach by ignoring
logical implications of using stochastic dynamic programming models to set the opportunity cost of
water (Mennel and Viecens 2007). It is contended that the failure mainly relates to the delay of the
regulatory mechanism which sets prices to react and prevents the shortage period from happening.
On the one hand, the Chilean experience exemplifies the trade-off between the creditability of the
regulatory commitments and the flexibility required to accommodate unforeseen environment and
changes of interests of the various institutions (Fischer and Galetovic 2000). The authorities have
changed the law and tightened the sanctions for generators who cannot fulfill supply contracts for
distribution firms. Drought is not considered a “force majeure”. As a result, generators lost interest
in signing long-term contracts (Memel et al, 2007). A contrast can be drawn with Norway 2002-03
which let the market successfully handle the implications of a water shortage (Amundsen et al.,

30
2006).
On the other hand, risks associated with the blackouts could be further minimized and diversified by
avoiding a hydro-dominated Electricity Supply Industry (ESI) and adopting a risky level of the
cost-of-deficit parameter. The regulator did not respond to the potential crisis when an alert was
issued by the Ministry of Public Works in regard to the abnormally low snow level of the snowfall.
Price increases would be a more realistic solution to reflect the higher opportunity cost of electricity
during a drought. Unfortunately, the Chilean electricity legislation held the belief that consumers
and generation companies are too risk averse to accept the price variability. As a result, it is
estimated that the Chilean economy suffered $300 million in damages (Fischer and Galetovic 2000).
There was strong evidence that it was possible to run the system with no outages and similar supply
restrictions were managed in 1989 and 1990 without outages. The response to the 1998-99 crisis
was technically and politically very poor: political interference in the use of water worsened the
crisis and the industry unnecessarily engaged in random (rather than planned) blackouts (Pollitt
2004).
6.7 Large blackout causes in Asia
During the blackout in 2002 in the Philippines, the power system was overloaded, which caused a
trip. The tripping was due to a technical fault in the Sta. Rosa line brought by a power line carrier
(PLC) failure (Bulletin 2002). A domino effect on the neighboring grid occurred, thus causing a
Luzon-wide power blackout according to the state-run National Power Corporation (AE 2002).
The 1999 blackout in Taiwan was caused by the collapse of the no. 326 transmission tower, due to a
landslide. According to a study conducted by the Chinese Institute of Engineers in Taipei, poor
repair and maintenance as well as the lack of remote and real-time monitoring equipment
contributed to the collapse of the transmission tower (Chang 1999). The relay system did not
function properly during the crisis. Unbalanced electricity supply between North and South placed
a heavy load on the system, and the requirements of long distance transfer further created instability
to the system.
7. Conclusions
The contribution of the present study is threefold. First, we analyse the causes of major and small

31
blackouts and compare them across the major regions of the world. Second, we examine whether
the statistical and expert report evidence from 69 countries behind the claim that liberalisation is
associated with more blackouts. Third, we compare the sample means of blackout incidents in three
continental regions before and after liberalisation. The public perception on the cause of blackout
incidents has been dominated by the reporting style and content of media. Despite the interest of
media in reporting liberalisation as a major cause of blackouts, we do not find any statistically
significant evidence of a connection between the frequency of small blackouts and the degree of
sector liberalisation. The relations between liberalisation and regional factors are not statistically
significant between the European and Latin American regions. However, Asia, which is the least
liberalised region, shows more blackout incidents than Latin America. There is no evidence of a
statistical difference in the mean of blackout incidents before and after liberalisation in the
European and Asian regions. Latin American region is an exception. However, the sample size is
too small to be deemed fully reliable. A note of caution is necessary in interpreting the results.
Looking at the larger blackouts, the U.S. seems to be troubled by under-investment and ineffective
coordination across utility borders, while Europe requires more international coordination and Asia
is characterised by technical incompetence. Political interference and poor planning appears to be a
contributing factor to the major blackout crises in Latin America.
According to the percentage distribution of causes of small blackouts, the top three causes are
similar in nature but different in proportion across regions. Due to the limitation of the news
database, it is difficult to compare the scale of blackouts. Comparing several large blackout
incidents in the four continental regions, the scale of blackouts seems to be larger in developed
economies such as the U.S., U.K., Sweden and Italy. This is due to the fact that the network
coverage and inter-regional electricity trades are larger in US and European regions.
The probability of a blackout, in general, does not seem to be increasing. However, the scale of the
worst incidents may be getting larger, affecting more people. It is possible that the degree of
liberalisation follows a U-shape relationship with blackouts, improving under basic forms of
liberalisation (privatisation plus independent regulation) but leading to high blackout risk as
markets become more developed.
Energy economists have long contemplated the nature of complex links between liberalisation,
efficiency and productivity gains. Blackouts appear to be a side product of liberalisation. Our
findings indicate that large blackouts are caused by multiple contingencies at various locations with

32
complex interactions. It is difficult to prevent or accurately predict the sequence of all these low
probability events. Liberalisation itself does not directly contribute to the cause of blackout
incidents. By its very nature, liberalisation creates markets which are continuously in a state of flux.
Drawing on our analysis, liberalisation brings changes to the legal and operating environments of
the sector. A new accountability for system operators and increased transparency of system status
between control areas are in the process of formation. This also implies liberalisation brings risks to
the industry and government. If the regulatory governance cannot be put in pace, the quality of
service will be harmed by liberalisation. In the wake of deregulation, there is a tendency for utilities
to shift their focus from regulation to emphasizing markets. The increasing market competition and
cross-regional electricity trades leave the utilities in a more complex operating environment than
ever before. Regulating quality of service, thus reducing the number of blackouts amidst the
increasing liberalisation, becomes challenging.
Electricity reforms in many countries are still in transition. Some countries continue to move
forward regardless of the obstacles faced. Other countries have postponed their plans due to
different internal and external factors. Inevitably, adjustments in policy, operational paradigm and
institutional reform are required, not to mention the appropriate quality regulation. This includes
setting clear goals, responsibilities and incentives for security of supply; minimizing regulatory risk
and simplifying administration processes; and ensuring consistency among policies. To harmonize
and rationalize the interests of different market participants under a fair regulatory framework is one
approach. Incentivising the efficiency of the grid supervising organization without compromising
the reliability standard with financial goals is another way to prevent the occurrence of blackouts.
Our results are preliminary but highly suggestive. A larger and better quality dataset would improve
the statistical reliability of the results. While, more detailed examination and comparison of
individual blackout causes and effects should be carried out to enrich and complement the findings
of this paper.

33

34
References
AE (2002), "Philippines' main island hit by power blackout," Asian Economic News, May 27th .
Amundsen, E.S., Bergman, L. and von der Fehr, N.M., (2006), The Nordic Electricity market:
Robust by design in Sioshansi, F.P., Pfaffenberger, W. (eds.), Electricity Market Reform: An
International Perspective, Oxford: Elsevier.
APEC, "APEC's energy regulator's forum, electricity regulatory arrangements, summary
submission China," in Department of Agriculture, Fisheries, and Forestry Australia: web site
http://dpie.gov.au/ resources.
APERC (2000), "Electricity sector deregulation in the APEC region," ed. Institute of Energy
Economics Asia Pacific Energy Research Centre, Japan.
Arango, S., Dyner, I., and Larsen, E.R (2006), "Lessons from deregulation: Understanding
electricity markets in South America," Utilities Policy, 14, 196-207.
Avista, Utilities (2001), "Electric service reliability monitoring and reporting plan," ed. Gas and
Electric Technical Services, WA: Avista Utilities.
Bacon, R.W and Beasant-Jones, J. (2001), "Global electric power reform, privatization and
liberalization of the electric power industry in developing countries," Annual Review of Energy and
the Environment, 26, 331-59.
BBC (1998), "Auckland blackout sparks people power," ed. BBC News Online, 20th March.
Benson, E. (2001), "Panelists maintain support of energy deregulation, criticize Gov. Davis," in
Stanford Report, 24th October.
Bialek, J. (2003), "Recent blackouts in US, UK, Scandinavia and Italy: Is it contagious?," in
Powerpoint presentation, University of Edinburgh, Scotland.
Bialek, J, (2004), "Recent blackouts in US and continental Europe: Is liberalization to blame?," in
Working Paper CMI EP 34 Department of Applied Economics, University of Cambridge.
BNDES (1996), "Informe Infra-Estrutura," Area de Projetos de Infra-Estrutura (Agosto/96 in
Arango, S, Dyner, I, and Larsen, E.R (2006), "Lessons from Deregulation: Understanding
Electricity Markets in South America," Utilities Policy, 14, 196-207.
Brayley, H., Redfern, M.A., and Bo, Z.Q. (2005), "The public perception of power blackouts,"
Transmission and Distribution Conference and Exhibition: Asia and Pacific, 2005 IEEE/PES, 1-5.

35
Byrne, J. and Yu, M.M. (2003), "Rethinking reform in the electricity sector: Power liberalisation or
energy transformation in Electricity reform: social and environmental challenges," in United
Nations Environment Program, ed. N Wamuknoya, UNEP Riso Centre, Roskilde, Denmark.
Caijing (2003)in Economic and Finance Monthly (Chinese), Dec
www.chinapostnews.com.cn/543/05430302.htm.
Carlson, L (2008), "Use, misuse and abuse of content analysis for research on the consumer
interest," Journal of Consumer Affairs, 42 (1), 100-05.
Carreras, B.A., Lynch, V.E., Dobson, I., and Newman, D.E. (2004), "Complex dynamics of
blackouts in power transmission systems," Chaos, 14 (3), 643-52.
Carreras, B.A., Newman, D.E., Dobson, I., and Poole, A.B. (2002), "Evidence for self-organized
criticality in a time series of electric power system blackouts," IEEE Transactions on Circuits and
Systems, Part I (Preprint).
CBC (2001), "Deregulation blamed for California's energy crisis," CBC online news, February 14th.
Chang, I. (1999), "Summary of the 29th July, 1999 blackout in Taiwan (in Chinese)," Taiwan:
Chinese Institute of Engineers, Taipei.
CNN (1999), "Argentinians steaming over weeklong Buenos Aires blackout," CNN.com, February
22nd.
CRISMART (2001), "The Buenos Aires blackout - Corporate and public crisis management in
Argentina 1999," ed. Crisis Management Research and Training, Sweden: Swedish National
Defence College.
Cubbin, J and Stern, J. (2006), "The impact of regulatory governance and privatisation on electricity
industry generation capacity in developing economies," The World Bank Economic Review, 20 (1),
115-41.
Dobson, I, Carreras, B.A, Lynch, V.E., and Newman, D.E. (2004), "Complex systems analysis of
series of blackouts: Cascading failure, criticality, and self-organization," in Bulk Power System
Dynamics and Control - VI, August 22-27, 2004, Italy.
Dutzik, T. and Sargent, R. (2003), After the blackout: Achieving a cleaner, more reliable electric
system, Boston MA: National Association of State PIRGS.
EIA (1999), International Energy Outlook 1999, Electricity, Washington DC: Department of
Energy (DOE) Energy Information Administration.

36
EIA (2000), Electric Power Annual 1999 Vol. 1, Washington DC: Energy Information
Administration.
EPRI (2003), "Factors relating to the series of outages on August 14, 2003," in A White Paper 20th
November.
EurActiv (2008), "Policy Summary in EU electricity market liberalisation," EurActiv.com.
Fischer, R and Galetovic, A. (2000), "Regulatory Governance and Chile's 1998 - 1999 Electricity
Shortage," in Serie Economia Nº 84 , Universidad de Chile, 1-38.
Freeman, B, Chapman, S, and Storey, P. (2008), "Banning smoking in cars carrying children: An
analytical history of a public health advocacy campaign," Australian and New Zealand Journal of
Public Health, 32 (1), 60-65.
Frontline (2001), "Blackout - The roots of the crisis: A flawed deregulation schemes," PBS.
Fumagalli, E, Garrone, P, and Grilli, L (2007), "Service quality regulation in electricity industry:
The role of privatisation and managerial behaviour " Energy Policy, 35 (12), 6212-24.
Funk, J, Murray, T.D, and Krouse, P. (2003), "Analysts blame deregulation in blackout.", The Plain
Dealer, 18th November.
GAO (2003), Electricity Restructuring: 2003 Blackout identifies Crisis and Opportunity for the
Electricity Sector, Washington DC: United States General Accounting Office.
GLA (2004), "The power cut in London on 28 August 2003: A report from the London assembly's
public service committee," ed. London: Greater London Authority.
Green, R, Lorenzoni, A, Perez, Y, and Pollitt, M. (2005), "Policy assessment and good practices," In
Sustainable Energy Specific Support Assessment (SESSA): Conference on implementing the
internal market of electricity: proposals and timetables, 9 September 2005, Brussels.
IEA (2005), Learning from the Blackouts: Transmission system security in competitive electricity
markets, Paris: OECD.
Jamasb, T (2002), "Reform and regulation of the electricity sectors in developing countries," in
DAE Working Paper 0226 (CMI EP 08), Department of Applied Economics, University of
Cambridge.
Jamasb, T, Mota, R, Newbery, D, and Pollitt, M. (2004), "Electricity sector reform in developing
countries: A survey of empirical evidence on determinants and performance," Cambridge working
Papers in Economics, No. 0439.

37
Jamasb, T and Pollitt, M. (2005), "Electricity market reform in the European Union: Review of
progress toward liberalization and integration," The Energy Journal, 26 (Special Issue), 11-41.
Joskow, P.L. (2001), "California's Electricity Crisis," Working Paper WP2001-006, MIT Center for
Energy and Environmental Policy Research.
Joskow, P.L. (2003), "Electricity sector restructuring and competition: Lessons learned, Working
Paper 2003-014, MIT Center for Energy and Environmental Policy Research.
Kelman, J. (Co-ordinator) (2001), 'Relatório sobre o desequilíbrio entre oferta e demanda de
energia elétrica. Comissão de Análise do Sistema Hidrotérmico de Energia Elétrica, Brasília
31/07/2001' quoted by Hermes de Araujo, J. L. R., (2006), The Case of Brazil: Reform by trial and
error? in Sioshansi, F.P. and Pfaffenberger, W., (eds.), Electricity Market Reform: An International
Perspective, Oxford: Elsevier.
Kleindorfer, P.R (2004), Economic regulation under distributed ownership: the case of electric
power transmission, Mimeo.
Lee, C.H. and Hsieh, S.C. (1999), "A technical review of the power outage on July 29, 1999," in
Proceedings of the IEEE Power Engineering Society Transmission and Distribution Conference 3
(Winter Meeting), 1353-58.
Linhares, J.C., Giambiagi, F, and Sales, A.F (2002), "As Perspectivas do Setor Ele`trico apuˆs o
Racionamento. Revista Do BNDES," Rio De Janeiro, 9 (18), 163-204 in Arango, S, Dyner, I, and
Larsen, E.R (2006), "Lessons from Deregulation: Understanding Electricity Markets in South
America," Utilities Policy, 14, 196-207.
MAE (2003), "<http://www.mae.org.br/index.jsp> and <http://www.mercadoelectricoandino.com>
in Arango, S, Dyner, I, and Larsen, E.R, (2006), Lessons from Deregulation: Understanding
Electricity Markets in South America," Utilities Policy, 14, 196-207.
Mennel, T. and Viecens, M.F (2007), "Latin versus European power –A tale of two market reform,"
in Discussion Paper No. 07-080 in ZEW Centre for European Economic Research.
Millán, J. (2006), "Power sector reform in Latin America: Accomplishments failure and challenges,
WP in Sustainable Development Department Technical Papers Series," Electricity, Chapter 12,
Inter-American Development bank report ( www.iadb.org/res/publications/).
Nagayama, H. (2007), "Effects of regulatory reforms in the electricity supply industry on electricity
prices in developing countries," Energy Policy, 35, 3440-62.
National Grid (2003), Investigation report into the loss of supply incident affecting parts of South
London at 18:20 on Thursday, 28 August 2003, Warwick: National Grid Company Plc.

38
NERC (2002), Reliability Assessment Report: The Reliability of Bulk Electric Systems in North
America, Princeton, N.J.: North America Electrical Reliability Council.
Newbery, D. (1997), "Privatisation and liberalization of network utilities," European Economic
Review, 41, 357-83.
Newbery, D. (2002a), "Issues and options for restructuring electricity supply industries," in Working
Papers E0210 (CMI EP01), Department of Applied Economics, University of Cambridge.
Newbery, D (2002b), "Problems of liberalising the electricity industry," European Economic
Review, 46 (4-5), 919-27.
Nielsen, C. (2008), "A content analysis of analyst research: Health care through the eyes of
analysts," Journal of Health Care Finance, 34 (3), 66-90.
Novosel, D. (2003), "System blackouts, description and prevention," in IEEE PSRC, System
Protection SC, KEMA T&D Consulting.
Nylander, J. (2001), "The construction of a market - a frame analysis of the liberalization of the
electricity market in the European Union," European Societies, 3 (3), 289-314.
New York Times (1999), "Wide Power Failure Strikes Southern Brazil " The New York Times, 12th
March.
OECD (2007), Infrastructure to 2030: Mapping policy for electricity, water and transport, Paris:
Organization for Economic Co-operation and Development.
Ofgem (2003), Preliminary report into the recent electricity transmission faults affecting South
London and East Birmingham, London: Ofgem.
Ofgem (2004), Report on support investigations into recent blackouts in London and West
Midlands, Volume 1, Main Report, London: Ofgem.
Ofgem (2007), 2006/07 Electricity Distribution Quality of Service Report, London: Ofgem.
Oliveira, A.d. (2007), "Political economy of the Brailian power industry reform in D.G. Victor and
T.C Heller (eds.), The political economy of power sector reform: The experiences of five major
developing countries, Cambridge: Cambridge University Press.
Pineau, P.O. and Hamalainen, R.P. (1999), "What are the grounds for electricity markets
deregulations?," Online at
www.hut.fi/Units/SAL/Teaching/Mat-2.142/elmarket/Saarieslka/Grounds.pdf.
Pollitt, M (1995), Ownership and performance in electric utilities Oxford: Oxford University Press.

39
Pollitt, M (1997), "The impact of liberalisation on the performance of the electricity supply industry:
An international survey," The Journal of Energy Literature, 3 (2), 3-31.
Pollitt, M (2004), "Electricity reform in Chile: Lessons for developing countries," Journal of
Network Industries, 5 (3-4), 221-262.
Pollitt, M (2008a), Liberalisation and regulation in electricity systems - How can se get the balance
right in Sioshansi, F.P. (ed.), Competitive electricity markets - Design, implementation,
performance. Oxford: Elsevier.
Pollitt, M (2008b), "Electricity reform in Argentina: Lessons for developing countries, " Energy
Economics, 30 (4), 1536-1567.
POST (2003), "Interim Report: Causes of the August 14th blackout in the Unites States," ed.
US-Canada Power System Outage Task Force, Natural Resources Canada, U.S. Department of
Energy.
POST (2004), "Final Report on the August 14, 2003 Blackout in the United States and Canada:
Causes and Recommendations," US-Canada Power System Outage Task Force, Natural Resources
Canada, U.S. Department of Energy.
Ray, D (2003), "Blackout of 2003: Description and responses," ed. Power Systems Engineering
Research Centre (PSERC).
Rufín, C. (2004), The political economy of institutional change in the electricity supply industry:
Shifting currents, Cheltenham: Edward Elgar Publishing.
SFOE (2003), "Report on the blackout in Italy on 28 September 2003', November 2003 Swiss
Federal Office of Energy (SFOE).
Spence, A.M (1975), "Monopoly, Quality and Regulation," Bell Journal of Economics, 16, 314-27.
Su, C.T, Wong, J.J, Liu, C.S, and Chang, C.L. (2006), "Analysis of the power blackout of July 29,
1999 in the Taiwan power system ", Journal of the Chinese Institute of Engineers, 29 (5), 827-40.
Tanzler, D.A, Feil, M.A., Kromker, D.B, and Eierdanz, F.C. (2008), "The challenge of validating
vulnerability estimates: the option of media content analysis for identifying drought-related crises,"
Regional Environmental Change, 8 (4), 187-195.
Thomas, S and Hall, D. (2003), "Blackouts: Do liberalisation and privatisation increase the risk?,"
in Working Paper, Public Service International Research Unit (PSIRU), University of Greenwich,
London.

40
UCTE (2003), "A visit to UCTE in 2003," ed. Union for the co-ordination of transmission of
electricity, Brussels: UCTE.
US-Canada, Power System Outage Task (2003), "Interim Report: Causes of the August 14th
blackout in the Unites States," Natural Resources Canada, U.S. Department of Energy.
Velasco, M.M,Obanil, R.S., Ros, B.R. (2002), "7-hr blackout hits entire Luzon grid; Due to tripping
of Laguna lines; No sabotage, Napocor assures", Manila Bulletin, May 21st.
Vickers, J and Yarrow, G.. (1988), Privatization: An economic analysis: Cambridge:MIT Press.
Vittal, V (2002), "Consequences and Impact of Electric Utility Industry Restructuring on Transient
Stability and Small Signal Stability Analysis," ed. Department of Electric and Computer
Engineering Working Paper, Iowa State University.
Wald, M.L. (2005), "Experts assess deregulation as factor in '03 blackout," The New York Times,
16th September.
Wasserman, H (2001), "California's deregulation disaster," in The Nation, 12th February.
Williams, J.H and Ghanadan, R (2006), "Electricity reform in developing and transition countries,
A reappraisal," Energy Journal, 31, 815-44.
Wilson, J. (2003), "Close deregulated electricity market," Toronto Star Newspaper, Dec., 10, 2003.
Wolak, F.A (2003), "Designing competitive wholesale electricity markets for Latin American
Countries," in Meeting of Latin American Competition Forum, 7-8th April, ed. Inter-American
Development Bank, 1-127.
Wu, Y. (2004), "Deregulation and growth in China's energy sector: a review of recent
development," Energy Policy, 31, 1417-25.
Xu, S and Chen, W. (2006), "The reform of electricity power sector in the PR of China," Energy
Policy, 34, 2455-65.
Yu, W, Jamasb, T, and Pollitt, M. (2008), Does weather explain the cost and quality performance?
An analysis of UK electricity distribution companies, Electricity Policy Research Group Working
Paper No.0827.
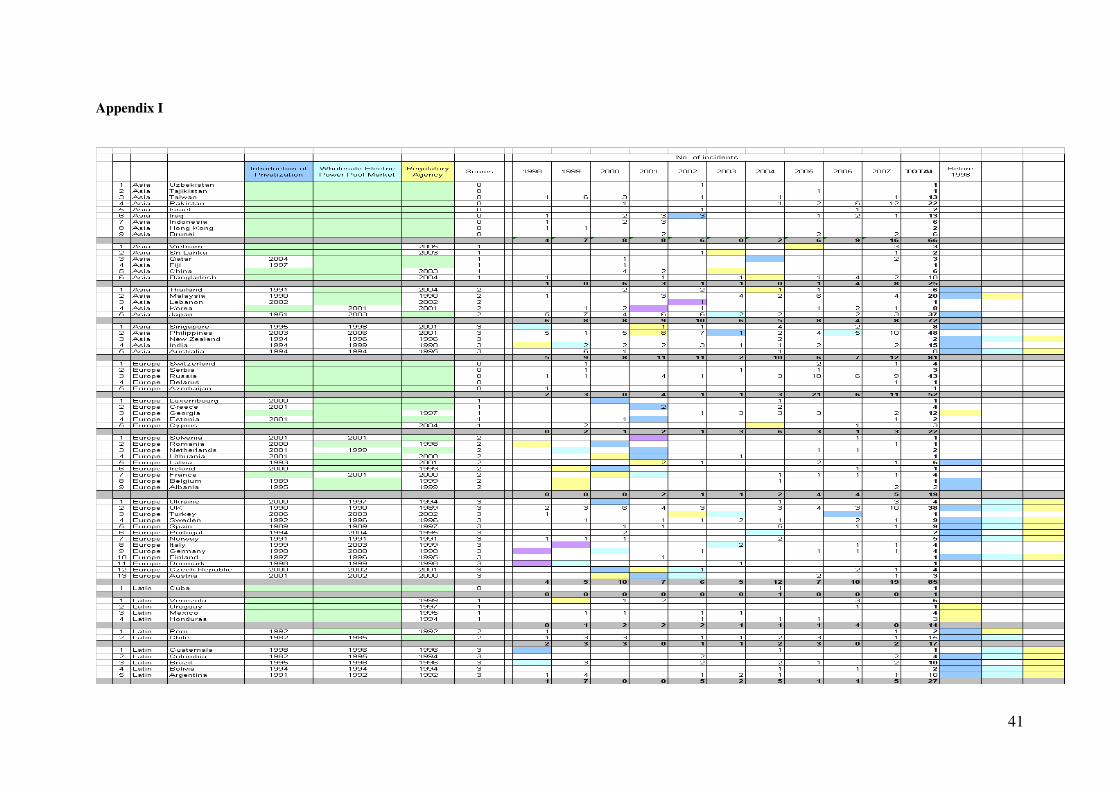
41
Appendix I

42
Appendix II
Table 11: Liberalisation score by countries/locations in 2007 (European Region)
Europe Privatisation Wholesale Mkt Regulator Scores
1 Ukraine � � � 3
2 UK � � � 3
3 Turkey � � � 3
4 Sweden � � � 3
5 Spain � � � 3
6 Portugal � � � 3
7 Norway � � � 3
8 Italy � � � 3
9 Germany � � � 3
10 Finland � � � 3
11 Denmark � � � 3
12 Czech Republic � � � 3
13 Austria � � � 3
14 Solvenia � � 2
15 Romania � � 2
16 Netherlands � � 2
17 Lithuania � � 2
18 Latvia � � 2
19 Ireland � � 2
20 France � � 2
21 Belgium � � 2
22 Albania � � 2
23 Luxembourg � 1
24 Greece � 1
25 Georgia � 1
26 Estonia � 1
27 Cyprus � 1
28 Switzerland 0
29 Serbia 0
30 Russia 0
31 Belarus 0

43
32 Azerbaijan 0
Avg Score 1.94
Source :(Nagayama 2007)
Table 12: Liberalisation score by countries/locations in 2007 (Latin America Region)
Latin America Privatisation Wholesale Mkt Regulator Scores
1 Guatemala � � � 3
2 Colombia � � � 3
3 Brazil � � � 3
4 Bolivia � � � 3
5 Argentina � � � 3
6 Peru � � 2
7 Chile � � 2
8 Venezula � 1
9 Uruguay � 1
10 Mexico � 1
11 Honduras � 1
12 Cuba 0
Avg Score 1.92
Source :(Nagayama 2007)
Table 13: Liberalisation score by countries/locations in 2007 (Asia Region)
Asia Privatisation Wholesale Mkt Regulator Scores
1 Singapore � � � 3
2 Philippines � � � 3
3 New Zealand � � � 3
4 India � � � 3
5 Australia � � � 3
6 Thailand � � 2
7 Malaysia � � 2
8 Lebanon � � 2
9 Korea � � 2
10 Japan � � 2

44
11 Vietnam � 1
12 Sri Lanka � 1
13 Qatar � 1
14 Fiji � 1
15 China � 1
16 Bangladesh � 1
17 Uzbekistan 0
18 Tajikistan 0
19 Taiwan 0
20 Pakistan 0
21 Israel 0
22 Iraq 0
23 Indonesia 0
24 Hong Kong 0
25 Brunei 0
Avg Score 1.24
Source :(Nagayama 2007)