DOES HIGHER EDUCATION REDUCE POVERTY AMONG YOUTHS …1)-1-19.pdf · Asian Economic and Financial...
19
Asian Economic and Financial Review, 2014, 4(1):1-19 1 DOES HIGHER EDUCATION REDUCE POVERTY AMONG YOUTHS IN NIGERIA? Ukwueze Ezebuilo R. Department of Economics, University of Nigeria, Nsukka, Enugu State, Nigeria Nwosu Emmanuel O. Department of Economics, University of Nigeria, Nsukka, Enugu State, Nigeria ABSTRACT Poverty is a serious problem in Nigeria with estimated 70.2 percent of Nigerians on less than 1$ daily. Poverty in Nigeria resembles a paradox, with her wealth; she still faces an enormous challenge in her effort to reduce poverty. The government has vigorously pursued poverty reduction policies through educational and other policies yet the issue of high rate of poverty is still problematic. This study aims at finding the impact of higher education on poverty among youths in Nigeria. We used propensity score matching and Logistic regressions to estimate the impact of higher education on youth poverty. We used data from 2004 National Living Standard Survey. We found that higher education has the capacity to reduce poverty. Those who had a higher education had the average treatment effect on the treated (ATT), an average gain in expenditure per capita by higher education receiving households, using nearest neighbor matches as N20,106.87. Keywords: Poverty, Youths, Logit model, Probability, Propensity Score matching, treatment effect. 1. INTRODUCTION Nigeria is about the 27 th poorest country in the world, according to the United Nations Development Programme(UNDP 2001). Poverty has been rising in for some decades now, and as at 2002 more than 60% of Nigerians lives on less than $1 a day (United Nations Economic Commission for Africa, 2002); thisindicates that the incidence of poverty is extremely high. Nigeria has enormous or abundant natural and human resources, but still faces an enormous challenge in her poverty reduction strategy/effort. Poverty in Africa in general and Nigeria in particular is often described as mostly a rural phenomenon not only because the majority of the population live in rural areas but also because of the pattern of distribution of economic activity between rural and urban areas. In Africa, rural- Asian Economic and Financial Review journal homepage: http://aessweb.com/journal-detail.php?id=5002
Transcript of DOES HIGHER EDUCATION REDUCE POVERTY AMONG YOUTHS …1)-1-19.pdf · Asian Economic and Financial...
Asian Economic and Financial Review, 2014, 4(1):1-19
1
DOES HIGHER EDUCATION REDUCE POVERTY AMONG YOUTHS IN
NIGERIA?
Ukwueze Ezebuilo R.
Department of Economics, University of Nigeria, Nsukka, Enugu State, Nigeria
Nwosu Emmanuel O.
Department of Economics, University of Nigeria, Nsukka, Enugu State, Nigeria
ABSTRACT
Poverty is a serious problem in Nigeria with estimated 70.2 percent of Nigerians on less than 1$
daily. Poverty in Nigeria resembles a paradox, with her wealth; she still faces an enormous
challenge in her effort to reduce poverty. The government has vigorously pursued poverty
reduction policies through educational and other policies yet the issue of high rate of poverty is
still problematic. This study aims at finding the impact of higher education on poverty among
youths in Nigeria. We used propensity score matching and Logistic regressions to estimate the
impact of higher education on youth poverty. We used data from 2004 National Living Standard
Survey. We found that higher education has the capacity to reduce poverty. Those who had a
higher education had the average treatment effect on the treated (ATT), an average gain in
expenditure per capita by higher education receiving households, using nearest neighbor matches
as N20,106.87.
Keywords: Poverty, Youths, Logit model, Probability, Propensity Score matching, treatment
effect.
1. INTRODUCTION
Nigeria is about the 27thpoorest country in the world, according to the United Nations
Development Programme(UNDP 2001). Poverty has been rising in for some decades now, and as
at 2002 more than 60% of Nigerians lives on less than $1 a day (United Nations Economic
Commission for Africa, 2002); thisindicates that the incidence of poverty is extremely high.
Nigeria has enormous or abundant natural and human resources, but still faces an enormous
challenge in her poverty reduction strategy/effort.
Poverty in Africa in general and Nigeria in particular is often described as mostly a rural
phenomenon not only because the majority of the population live in rural areas but also because of
the pattern of distribution of economic activity between rural and urban areas. In Africa, rural-
Asian Economic and Financial Review
journal homepage: http://aessweb.com/journal-detail.php?id=5002

Asian Economic and Financial Review, 2014, 4(1):1-19
2
urban differentials in the incidence of poverty are large and persistent (United Nations Economic
Commission for Africa, 2005). Poverty and the effects on the victims are multidimensional and
self-reinforcing.
Poverty is somewhat like vicious circle:poor people have low incomes and low consumption
levels, and many depend for their livelihoods on (low yield) subsistence agriculture or on the
informal sector. We now have the poor working class: wage-earning workers have low salaries,
limited protection from shocks and frequent bouts of unemployment. The poor tend to have low
education because they cannot pay for it and tend to have less health than the rest of the population
(UNDP 2004).
It has become axiomatic that there is a strong relationship between basic education and poverty
reduction (Akooje and McGrath, 2005). If this is true, then it is indisputably true that there is
stronger positive relationship between higher education and poverty reduction. This is particularly
so because at theoretical and empirical levels, it has become a sort of consensus that unemployment
is central to poverty and that higher education is a key factor in job creation.
There has been much theoretical debate about the role of education in development and
economic growth. This debate has focused on whether education is productive or not in real sense
of it. There is much evidence that the proportion of the population with better education highly
correlates with levels of economic development.
We should note that whether the levels of schooling have helped to cause the economicgrowth,
or whether causality runs from income growth to educational expansion, is an empirical issue.
Higher education is one of the most powerful yet underestimated means that countries can rely
on to reduce poverty and achieve social and economic development goals. Most people recognize
its value for productivity and growth in developed countries, but some people inexplicably consider
university education a luxury for developing countries.
It is not a luxury; it is an essential part of life. Higher education provides fundamental
expertise to all sectors of society and the economy, including the key sectors that drive
development – health, education, governance, private sector development and the environment.
According to Zoë Oxaal (1997),the linkages between education and poverty can be understood
in two ways: (i) investment in education as a poverty reduction strategy can enhance the skills and
productivity among poor households; (ii) poverty is a constraint to educational achievement both at
the macro-level (poor countries generally have lower levels of enrolment) and the micro-level
(children of poor households receive less education). He also asserted that education is a key factor
for confronting the multiple challenges of social dislocation, environmental degradation and
poverty eradication.
This assertion is that education is a vital process to attain human development goals and to
place the African continent and other developing countries on a pathway of sustainability (Asmal,
2002). There is another debate on whether higher education is an important strategy to poverty
reduction or not. The first argument is that higher education correlates with economic growth by
supplying the necessary labour and skills (human resources) for a knowledge driven economy,

Asian Economic and Financial Review, 2014, 4(1):1-19
3
learning by doing, and by promoting access and use of knowledge. The next argument is that
higher education has the potential of increasing access to education by providing higher income for
them and in turn increasing the employability of those who have the skills for a knowledge- driven
economy. The third argument is that higher education could play a role in supporting the
educational sector development by supplying trained personnel for curriculum development of
lower levels of education.
According to UNECA Report in 2002, Nigeria has at the tertiary level 62 colleges of education
(with 86,000 students), 47 polytechnic institutes (120,000), and 42 universities and interuniversity
centres (325,000). As the national population continued to grow, enrolments grew more than
budget allocations. Faculty recruitment doubled between 1991 and 1998, but enrolment more than
quadrupled, and the average enrolment per university in the federal universities rose from 8,300 in
1991/92 to 13,200 in 1998/99 (Dabalen and Oni, 2000).
There has been a mismatch between growth in university enrolment in some areas and labour
market demand, while enrolment in such critical areas as medicine and administration has not
grown significantly. As an example, between 1987 and 1997 the proportion of science students
among university graduates dropped drastically from 29.4% to 24.5%.
Under the National Rolling Plan for 2001–2003, the federal government increased science
enrolments to more than 54% of the total by 2003.The country is faced with two major problems in
human resource development, namely, unemployment among the educated youth and the
dwindling federal budgetary allocations to educational institutions.
Another teething problem is the growing unemployment among recent graduates, particularly
at the tertiary level, which emanates in part from the mismatch between educational output and
requirements of the labour market. The quality and relevance of education have declined as
academic resources, whether faculty or equipment and facilities, have become increasingly in short
supply. According to Nigeria Ministry of Finance, (2000a), ―Nigeria’s education system turns out
more than 3 million secondary and tertiary graduates every year, but it is estimated that the
economy can absorb only around 10% of these graduates annually‖.
As a result, the economy is saddled with more than 15 million unemployed or underemployed
youth, a situation that is undermining living standards throughout the country. Under the National
Rolling Plan for 2001–2003, the government envisaged growth in employment of 1.8 million
jobs—600,000 a year—but that number was still a mere 20% of what is needed just to hold
unemployment and underemployment constant among the educated youth. According to Dabalen
and Oni, (2000), an increase in the number of university graduates from 15,000 in 1980/81 to
55,000 in 1998/99, in the face of slow economic growth and productivity improvement, has
increased the unemployment rate among university graduates to an estimated 17–25%.
There was a peaceful demonstration match in October 2000 by the unemployed graduates at
the presidential offices in Abuja to demand for the government to provide them with jobs. The
urban registered unemployment rose from 4.9% in 1998 to 5.5% in 1999 due to the dwindling

Asian Economic and Financial Review, 2014, 4(1):1-19
4
public and private sector expansion (especially the private sector) and due to low absorptive
capacity (Nigeria Ministry of Finance, 2000a).
This paper has the main focus to examine the situation regarding gender and higher education
attainment in Nigeria. It is also of utmost importance to determine the nature of higher education
and income generation among the youths; and to determine the impact of higher education on
poverty among youths.
This paper has section two as the review of the relevant literature. Section three discusses the
data on higher education enrolment and the output of graduates at higher institutions. Also
discussed here is the analysis of propensity score matching and the logistic regression. Finally,
section four concludes the research by making some recommendations.
2. LITERATURE REVIEW
Human Capital Theory, associated with the work of Becker (1975), asserts that education
creates skills which facilitate higher levels of productivity amongst those who possess them in
comparison with those who do not. Education, then, is costly but it brings associated benefits which
can be compared with its costs in much the same way as what happens with any investment project.
Those who propounded human capital theory have found evidence to support the above assertions.
First, they have found a strong, and empirically verifiable, positive relationships across all
societies between the wages and salaries people receive at work and the level of education they
attained.
They assumed competitive labour and goods markets, and found that those with higher levels
of education seem to have, on average, higher levels of productivity. Employers usually use
educational characteristics as a condition for qualification and suitability for a job, and potential
productivity, of their employees.
Secondly, the earnings of the more educated not only start at a higher level, but increase more
rapidly to a peak level - which happens later in life - than the earnings profiles of the less educated.
Indeed, those with no education tend to have earning profiles which remain pretty flat throughout
their lives.
These patterns are said to indicate not just that education makes people more productive but
also enhances the ability to learn-by-doing, causing productivity, and thus earnings, to increase at a
faster rate than for those with less education.
The fact, however, that the profiles peak and then decline beyond a certain age suggests that
the skills created by education are prone to obsolescence and that their productive value decline
when technology has outpaced them.
Early criticisms of Human Capital Theory came from a group of radical economists who
argued that education was valued by employers not because of the cognitive skills which it
engendered, but because of the non-cognitive qualities and attributes inculcated at different levels
of the education system.

Asian Economic and Financial Review, 2014, 4(1):1-19
5
These critics argue that the non-cognitive traits encouraged by different levels of the school
system correspond strongly to the features or characteristics required of employees at unskilled,
middle and higher levels of the occupational hierarchy. Education is has been accepted to be
responsible for reproducing the social hierarchies and classes in society in a stable and predictable
way, rather more than enhancing the productive capacities of labour.
Another set of arguments assert that education is merely an attenuated selection process, where
the most talented people are distinguished from the less talented. In other words, schooling
identifies the most able people but does not necessarily create or enhance those abilities, or by
implication, individual productivity.
In this view, the argument is that ranking procedures may not be efficient since the benefits of
ten years schooling could be short-circuited by aptitude tests which might last a matter of hours or
at most days rather than years.
This group of theorists argues that the associations between education and earnings adduced by
human capital theorists to imply that education has productive value can be shown to be entirely
consistent with its negation.
Human Capital Theory also asserts that there is a link between education and poverty in terms
of education as a means of poverty reduction; this link can be drawn both at the macro- and micro-
levels of poverty and on the levels of education.
At the macro-level, it is generally believed that the levels of enrolment correlate with GNP.
Countries that have low per capita incomes usually have low enrolment ratios.
However, there are some exceptions to this rule. In Africa, for example, Colclough(1994)
asserted that extremely poor countries such as Lesotho, Madagascar and Togo have primary
gross enrolment ratios in excess of 100.
Also, among poor countries there is considerable variation, showing that low GNP does not
necessarily translate into low levels of educational enrolment. Recent debates on poverty have
highlighted the need to expand understanding (and measurement) of poverty beyond household
income/consumption figures. This is demonstrated by the introduction in the 1996 Human
Development Report of the Capability Poverty Measure (CPM) which includes female education
(in the form of female literacy levels) as part of a composite poverty measurement.
In this context, education is seen not just as an instrument for poverty reduction (in the sense
of increasing productivity and incomes) but also as an asset which can be realised in terms of
wealth (e.g. to labour, capital, social welfare support).
According to World Bank (1995: 1), education - especially basic (primary and lower-
secondary) education - helps reduce poverty by increasing the productivity of the poor, by reducing
fertility and improving health, and by equipping people with the skills they need to participate fully
in economy and society.
According to Organisation for Economic Cooperation and Development (2012), greater gender
equality in economic opportunities contributes to stronger and more sustainable economic growth.
Investing in formal education and training increases the skill-set of individuals throughout their

Asian Economic and Financial Review, 2014, 4(1):1-19
6
lives and increases employment and entrepreneurial opportunities for both men and women. In
addition to the direct effects of education on economic participation or activity, education also
affects other societal outcomes such as life expectancy, child mortality, fertility, personal health
outcomes, and greater investment in the education and health of future generations.
In addition, gender equality is also a key driver of the degree of self-reported well-being and
happiness across the world and life satisfaction increases over time as gender equality increases
(Veenhoven, 2011; Veenhoven, 2012).
Growth and technological change can endogenously trigger further female education and
empowerment which in turn feeds back into economic development (Doepke et al., 2011).
No modern country has been able to prosper without a strong and quality higher education
system. Misperceptions about the role of higher education in ensuring sustainable development
have persisted for a long time.
But it is lack of adequate and sustained investment in higher education, and at all levels that
continues to fail to achieve poverty reduction. It should be clear and unequivocal in the reasons
why poverty cannot be overcome without the benefits of higher education while it is difficult to get
on with the work of building stable, high quality higher education systems in all countries
(Ramphele, 2003).
Higher education has in the past contributed to development by providing national economies
with the necessary human resources but criticized for not dealing directly with poverty reduction
issues (Ramphele, 2003).Education is a key in raising earning potentials of individuals and
productivity of the economy.
Vener (2004) posits that a more educated workforce produces high value output, which is a
necessity for economic growth and poverty reduction. It is known that education, apart from
enhancing human capital, also creates social capital because it may transmit cultural messages and
build social cohesion. Although the positive effect on economic growth of education investment is
gradual and takes time to appear, the benefits to the individuals that receive the investment are
more instant (Vener, 2004).
Many of the poverty-reducing assets discussed above, such as education, experience, and
labour market association, are important correlates of poverty and the dynamics thereof. In the
study by Vener (2004), he investigates the marginal impact of each individual attribute on the
likelihood of a household falling below the indigence poverty line in Paraiba, Brazil, taking into
account other characteristics.
The study reveals two important and remarkable findings: (a) a conditional correlation between
poverty and characteristics of household heads and (b) information about groups that are
particularly vulnerable in 1999.
The probability of a household being poor is analyzed based on relevant individual and
household characteristics. One of the salient findings is that poverty can be attributed to the lack of
income-generating assets, particularly human capital.

Asian Economic and Financial Review, 2014, 4(1):1-19
7
Another poverty study for Brazil, such as Ferreira et al. (1998), shows that in 1996 education
was a cardinal personal attribute that can determine the possibility that a household would be
subjected to poverty. Other poverty-causing factors include age, family size, race, and rural living.
The link between education and poverty reduction has been discussed extensively by economists.
All their discussions point to the same direction: that education reduces poverty. Education is
essential to a person’s development.
It also ensures the development of families, of the local and national communities, and the
world at large. Education is universally necessary and has also positive effects on health, poverty
reduction and elimination of hunger and gender equality. Higher levels of more relevant learning
outcomes are thus both a condition for, as well as a result of, progress in other social sectors
(UNESCO, 2012).
There is usually a wide disparity between the earnings of those who have bachelor degree or
higher than those who drop out and this earnings differential translates into vastly different
opportunities and resources for children growing up in these families (Carnevale, 2012). The
assertion that education and training have short-term and long-term effects on life-course patterns,
at least on the individual’s career and (life) wages, is generally accepted and its correctness seems
to be fairly obvious.
It is debated that the health status of the youth is also a parameter for their future life. The
youthful life begins with adolescence (teenage age bracket), and thus exposes them to health,
social, psychological challenges which are capable of affecting their future.
One of these challenges includes adolescence pregnancy among the young girls which could
increase the rate of drop-outs. Sawyer et al., (2012) said that adolescence, has been identified as a
distinct life phase characterized by both sociological and biological benchmarks, and has been
identified by many public health experts and policymakers as central to lifelong health and
psychological wellbeing.
While literature review finds strong correlations between adolescent fertility and school drop-
out, the question of causation remains far more ambiguous, as the robustness of results decrease
sharply with more rigorous research methods.
Also, while fertility is often correlated with school dropout, other factors such as current
school enrollment, marital status, anticipated economic returns to education, family attitudes, drive
both school continuation and the likelihood of experiencing an adolescent pregnancy (McQueston
et al., 2012).
In addition, it is well-established such conditions produce health risks, so that policymakers
believe that adolescent pregnancy can lead to poor socioeconomic outcomes such as school
dropout, lost productivity, and the intergenerational transmission of poverty.

Asian Economic and Financial Review, 2014, 4(1):1-19
8
3. DATA PRESENTATION AND ANALYSIS
3.1. Descriptive Statistics
It is expedient at this point to describe the available data on education enrolment and
attainment to enlighten the readers on the development of education sector in Nigeria. We will start
with the enrolment in the Polythecnics, then the Universities before proceeding to the graduates.
Table-3.1. Enrolment of Poly/Mono-thecnics
Year Total
Inst.
%
growth
Total
Enrolment
%
growth
Total
Teachers
%
growth
Teacher/pupil
ratio
%
growth
2001 163 348,016 8,472 41
2002 172 5.52 518,421 49 17,673 109.0 29 -29
2003 178 3.49 521,889 0.67 18,199 3 29 0
2004 178 0 577,327 10.62 16,499 -9 35 21
2005 178 0 237,708 -58.83 16,499 0 14 -60
Source: National Bureau of Statistics Social Statistics in Nigeria (2005:22). Percentages calculated by the authors.
From table 3.1, we can see that the enrolment of students into Polythenics grew at a high value
of 49% from 2001 to 2002. The enrolment declined to as much as 0.67% between 2002 and 2003,
while it rose again to 10.62% between 2003 and 2004.
There was a serious decline in the enrolment from 577,327 in 2004 to 237,708 in 2005, thus,
showing a growth rate of -58.83% between the two periods. However, NBS (2005:22) showed that
the teacher/pupil ratio grew at -29% between 2001 and 2002 and did not change between 2002 and
2003. It grew to 21% between 2003 and 2004, and declined to -60% between 2004 and 2005.
Table-3.2. Enrolment in Universities
Year Total
Inst.
%
growth
Total
Enrolment
%
growth
Total
Teachers
%
growth
Teacher/p
upil ratio
%
growth
2001 51 358,758 18,867 19
2002 57 11.76 444,949 24 18,426 -2 24 26
2003 59 3.51 606,104 36.22 22,046 19.36 27 12.5
2004 63 6.78 727,408 20.01 23,871 8.28 30 11.11
2005 80 26.98 724,856 -0.35 23,535 -1.28 31 3.33
Source: National Bureau of Statistics Social Statistics in Nigeria (2005:23). Percentages calculated by the authors.
From the table above, we note that the total number of universities has been growing over
time. The number of the universities grew at a rate of 11.76% between 2001 and 2002, whereas it
declined at a rate of 3.51%. Meanwhile, it increased to 6.78% between 2003 and 2004, and grew at
a higher rate of 26.985 between 2004 and 2005.
The enrolment grew at 24.0%, 36.22%, 20.01% and -0.35% over the same periods. The
teacher/pupil ratio has been growing over the periods. Between 2001and 2002, the ratio grew at
26.0%, which signified a high ratio to manage. The ratio became better at the subsequent years of
2002 – 2005, with their respective growth rates as 12.50%, 11.11% and 3.33%.

Asian Economic and Financial Review, 2014, 4(1):1-19
9
Table-3.3. Graduate Output by (Faculties) Bachelor’s Degree (2000/2001 – 2004/2005) 2000/2001 2001/2002 2002/2003 2003/2004 2004/2005
Faculty M F M F M F M F M F Total
Administration 3294 2298 4727 3413 6380 5321 4089 3201 2521 1843 37087
Agriculture 1086 604 1366 705 1366 873 1268 828 299 167 8562
Arts 2732 2351 2938 2982 3672 3963 2706 2746 1687 1495 27272
Education 4129 4117 3221 3248 3560 3391 2361 3008 2352 2095 31482
Eng/Tech 4194 581 4558 679 5425 800 4182 689 1051 116 22275
Envirn. Scs 932 375 1079 395 1201 560 940 368 643 243 6736
Law 1558 990 2112 1781 2846 2664 1901 1461 1007 626 16946
Medicine 1200 568 1538 613 1489 903 1219 721 359 230 8840
Pharm. Scs 242 78 312 138 186 144 320 235 12 10 1677
Sciences 4743 2494 4461 2840 5839 4347 4390 2581 2190 1379 35264
Social Scs 5021 3223 8459 4996 8187 5856 6017 4220 2893 2296 51168
Dentistry 0 0 45 22 67 30 48 21 0 0 233
Vet. Medicine 68 19 99 47 155 54 47 21 30 6 546
Others 583 311 1059 457 879 401 617 214 273 209 5003
Total 29782 18009 35989 22316 41252 29109 30105 20314 15327 10715 252918
Grand Total 47791 58305 70361 50419 26042
Source: National Bureau of Statistics Social Statistics in Nigeria (2005:37)
From the table above, we see that the total number of graduates has been changing from year
to year. It rose from 47, 791 graduates to 58, 305 between 2001 and 2002, about 22%. Between
2002 and 2003 academic sessions, the total number of graduates increased from 58, 305 to 70,361,
a growth rate of 20.68%.
However, the total number of graduates declined from 70, 361 to 50,419, rate of -28.51%; it
continues declining in absolute value from 50, 419 to 26, 042, a growth rate of -70.65%. This goes
to show that the Nigerian Universities have been producing graduates.
Also observed from the table is that the attainment of higher education by females is also
encouraging. The female graduates have been increasing in number and with respect to discipline
over the period of time. This goes to show that higher education in Nigeria is not gender sensitive.
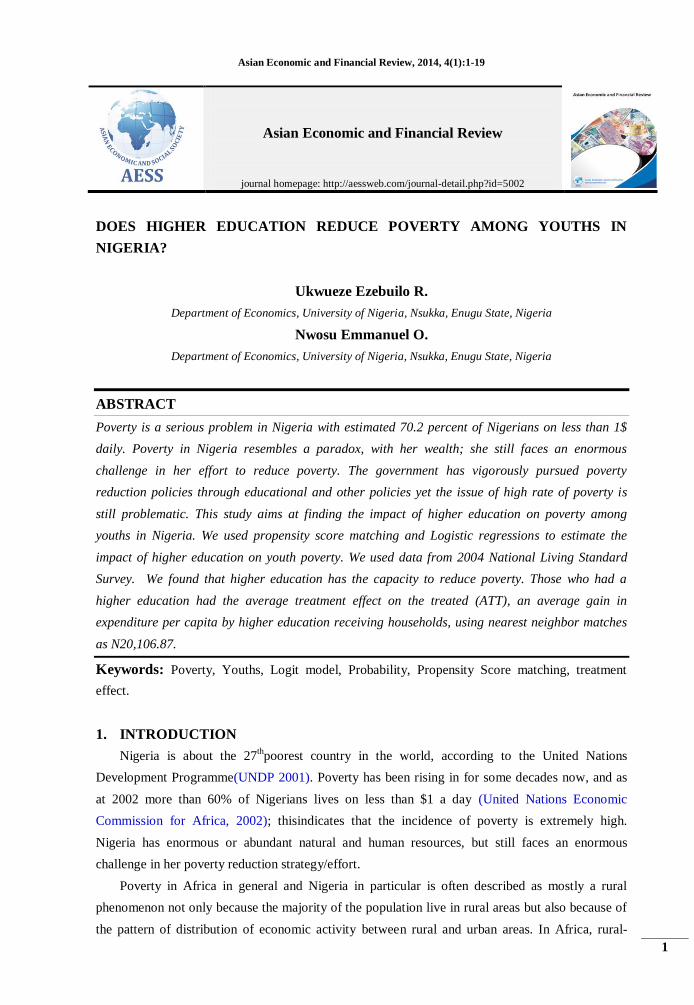
Figure-3.1. Graduate Output by (Faculties) Bachelor’s Degree (2000/2001 – 2004/2005)

Asian Economic and Financial Review, 2014, 4(1):1-19
10
From the graph above, we can see that Faculty of the Social Sciences has the largest number of
graduates followed by the Faculty of the Business Administration, Faculties of Sciences,
Engineering/Technology, Education, Arts, etc, in that order. The least in turning out graduates is
Faculty of Dentistry/Health Sciences, followed by Veterinary medicine, Pharmaceutical Sciences,
Environmental Sciences, etc, in that order.
Table-3.4. Graduate Output by Post-Graduate Diploma (2000/2001- 2004/2005)
2000/2001 2001/2002 2002/2003 2003/2004 2004/2005
Faculty M F M F M F M F M F Total
Administration 3456 1055 1461 594 950 527 1341 701 1095 599 11779
Agriculture 287 30 169 42 101 37 214 40 136 46 1102
Arts 405 105 105 43 100 118 75 53 74 41 1119
Education 415 237 818 519 590 397 451 476 304 206 4413
Eng/Tech 693 32 534 52 329 63 346 58 570 49 2726
Envirn. Scs 96 17 129 28 129 82 162 36 159 31 869
Law 10 3 89 65 0 0 0 0 0 0 167
Medicine 15 11 51 31 100 62 25 12 22 18 347
Pharm. Scs 0 0 0 0 0 0 0 0 0 0 0
Sciences 810 475 413 98 243 90 343 123 269 111 2975
Social Scs 1188 456 1111 193 694 476 765 292 533 388 6096
Dentistry 0 0 0 0 0 0 0 0 0 0 0
Vet. Medicine 8 0 0 0 0 0 4 3 0 0 15
Others 190 95 180 42 235 87 36 39 0 0 904
Total 7573 2516 5060 1707 3471 1939 3762 1833 3162 1489 32512
Grand Total 10089 6767 5410 5595 4651
Source: National Bureau of Statistics Social Statistics in Nigeria (2005:38)
From the table 3.4, the total number turnouts of Postgraduate Diploma followed the certain
pattern of the output of graduates. The total number of turnouts continued declining over the period
covered by the table. However, the Faculty of Business Administration has the highest turnouts at
this level of education, followed by the Faculty of the Social Sciences and the Faculty of
Education.
The Faculties of Pharmaceutical sciences and Dentistry/ Health Sciences and Law have no
postgraduate Diploma and that is why they have zero values as their sum. However, at the
postgraduate level the males dominate the female counterparts at the graduation time. The male
graduates double the number of female graduates at the Postgraduate Diploma between 2000/2001
and 2004/ 2005 sessions.
The chart below illustrates the discussion made concerning table 3.4. It shows that the Faculty
of Business Administration has the largest turnouts followed by the Faculty of the Social Sciences
and Education. It also portrayed zero values for the Faculties Law, Pharmaceutical Sciences, and
Dentistry.

Asian Economic and Financial Review, 2014, 4(1):1-19
11
Figure-3.2. Graduate Output by (Faculties) Post-Graduate Diploma (2000/2001 – 2004/2005)
Table-3.5. Graduate Output by Masters’ Degree (2000/2001- 2004/2005)
2000/2001 2001/2002 2002/2003 2003/2004 2004/2005
Faculty M F M F M F M F M F Total
Administration 3470 1241 2879 987 5326 992 2334 1212 1676 768 20885
Agriculture 138 38 418 142 368 136 324 94 202 59 1919
Arts 681 304 1074 365 568 189 637 310 280 169 4577
Education 723 736 1406 962 1061 854 1043 849 328 317 8279
Eng/Tech 296 23 539 97 409 162 416 71 166 21 2200
Envirn. Scs 252 39 127 39 154 56 220 81 296 122 1386
Law 218 137 253 91 250 132 329 183 33 12 1638
Medicine 95 25 279 125 219 98 517 129 66 36 1589
Pharm. Scs 23 7 25 15 58 27 105 39 11 3 313
Sciences 393 165 820 322 557 145 566 239 258 106 3571
Social Scs 1327 362 3096 996 1719 500 1987 733 688 412 11820
Dentistry 21 12 1 0 0 0 9 1 2 0 46
Vet. Medicine 16 2 38 4 28 9 22 6 12 6 143
Others 53 15 39 12 31 8 20 16 6 2 202
Total 7714 3106 10994 4157 10748 3308 8529 3963 6352 2033 60904
Grand Total 10820 15151 14056 12492 8385
Source: National Bureau of Statistics Social Statistics in Nigeria (2005:38)
From table 3.5, we still see that the Faculty of Administration has the highest number of
graduates for the entire periods. The total number of Masters Degree graduates for the review
periods is 20, 885, signifying the many people want to possess this professional certificate, MBA.

Asian Economic and Financial Review, 2014, 4(1):1-19
12
Many people will always want to identify with managerial position and without this certificate, it
becomes doubtful if one is actually qualified to handle such positions.
The next largest number of graduates at this level comes from the Faculty of the Social
Sciences with a sum of 11, 820, followed by the Faculty of Education. The least number of turnouts
comes from the Faculty of Dentistry/ Health Sciences with a sum of 46 graduates. At the Masters
level, the male graduates double their female counterparts over the period reviewed. This explains
that the graduate output at the Masters Degree level is biased toward the male.
Figure-3.3. Graduate Output by Masters’ Degree (2000/2001- 2004/2005)
From the chart above, we can see a clear picture of the discussion about table 3.5. It illustrates
the fact that Faculty of Administration has the largest turnout at this level of education, followed by
the Social Sciences and Education. The least on the hierarchy is Dentistry/Health Sciences
followed by Veterinary Medicine.

Asian Economic and Financial Review, 2014, 4(1):1-19
13
Table-3.6. Graduate Output by Doctorate Degree (2000/2001- 2004/2005)
2000/2001 2001/2002 2002/2003 2003/2004 2004/2005
Faculty M F M F M F M F M F Total
Administration 27 6 13 4 14 3 13 2 23 5 110
Agriculture 47 17 90 19 104 27 76 25 53 12 470
Arts 67 11 125 13 93 40 120 45 63 20 597
Education 103 60 130 54 102 71 103 72 47 16 758
Eng/Tech 32 1 34 4 36 3 45 1 27 2 185
Envirn. Scs 63 13 12 2 4 1 13 2 7 1 118
Law 11 0 5 2 3 1 3 0 3 0 28
Medicine 6 1 22 6 13 11 15 6 1 0 81
Pharm. Scs 4 1 3 1 1 1 8 3 2 4 28
Sciences 74 20 87 19 76 11 76 35 47 14 459
Social Scs 97 15 42 16 93 28 84 24 56 17 472
Dentistry 0 0 0 0 0 0 0 0 0 0 0
Vet. Medicine 6 0 15 2 7 1 13 2 6 1 53
Others 6 2 0 1 7 1 8 0 1 0 26
Total 543 147 578 143 553 199 577 217 336 92 3385
Grand Total 690 721 752 794 794
Source: National Bureau of Statistics Social Statistics in Nigeria (2005:39)
Table 3.6 illustrates the total number of turnouts at the Doctorate level. The Faculty of
Education has the largest turnout with 758 Doctorate Degree graduates between the review periods.
The next highest is the Faculty of Arts with 597 graduates, then the Faculty of the Social Sciences
with a total of 472 and the Faculty of Agriculture following very closely with 470 graduates. There
was no graduate from the Faculty of Dentistry/Health Sciences for the review periods, whereas
Faculty of Law had 28 Ph. D graduates. At the doctorate level, the number of female graduates is
less than half of the male graduates for nearly all the disciplines (Courses) over the review period.
This would imply that males have the capacity to further their education more than their female
counterparts.
Figure-4.4. Graduate Output by (Faculties) Doctorate Degree (2000/2001 – 2004/2005)

Asian Economic and Financial Review, 2014, 4(1):1-19
14
3.2. Methodology and Analysis
The Propensity Score Matching Approach
Propensity score matching technique was used in ascertaining the impact of youth higher
education on poverty. Propensity score matching in its simplest form involves predict ing the
probability of treatment on the basis of observed covariates for both the treatment and the control
group samples (Rawlings and Schady, 2002). In propensity score matching, one picks an ideal
comparison group from a larger survey and then matches the comparison group to the treatment
group on the basis of set of observed characteristics on the predicted probability of participation
given observed characteristics (propensity score) (Ravallion, 2001). The observed characteristics
are those used in selecting individuals but not affected by programme participation and act as the
control variables. For example, for estimating the impact of higher education of youths on poverty,
two groups are identified, those with higher education (denoted as Ri =1 for household i and those
without (Ri = 0). Defining youth is difficult, as a person who is neither a child nor an adult, but in
between. The United Nations defines the individual in between the age 13 and 30 as a youth.
Different countries and administrative regions use more narrow definitions within that age frame.
However, we define youth here as people between the age of 16 and 35 years. The rationale is that
at the age of 16 years, a person is qualified to attend a higher institution of learning in Nigeria. The
upper boundary of 35 years is used so that the period of job search may have been taken care of;
the person may have gotten a job.
Those with higher education (treated) are matched to those without (control group) on the basis of
the propensity score: (probability of acquiring higher education given observed characteristics)
where xi is a vector of pre-higher education control variables. If the Ri’s are independent over
all i, and the outcomes are independent of higher education given xi then outcomes are also
independent of higher education given p(xi), just as they would be if higher education were
transferred randomly.
Propensity score matching is a better methodology for dealing with differences in population
characterisitics. However, a few tests that have been done suggest that with good data, propensity
score matching can greatly reduce the overall bias and outperforms regression-based methods
(Ravallion, 2001).
The estimation of the average treatment effect on the treated (ATT) based on the propensity
score matching for with and without higher education was carried out based on the following
procedures:
1. Pooling of two groups of individuals, that is, the treatment and comparison group of those
who receive higher education and those who do not receive higher education. After the
)|1()( iii xRprobxp (0 ( ) 1)............................................3.1ip x

Asian Economic and Financial Review, 2014, 4(1):1-19
15
pooling, a logit model of higher education receiving and non-higher education receiving as
a function of some socio-economic variables will be estimated. The variables to be
selected are those that were not affected by receiving higher education. Some of the socio-
economic variables included are Sex, household total income, Father with no education,
Sector (urban as 1, otherwise 0), education with respect to South East, South South, South
West, North East, North Central, monogamous marriage, Polygamous marriage, Age of
first Marriage, population weight. The equation is presented thus:
12 3 4
1
5 6 7 8 9 10
11 12 13
log log _ sec 11
...........
i i i i
PP O a b Sex b Houtotincome b father noedu b tor
P
b Southeast b Southsouth b Southwest b Northeast b Northcentral b monmarriage
b pmarriage b agefirstmarried b popwt
...................................3.2
2. From the logit regression, a predicted value of the probability of having received higher
education was created. These were the propensity scores and each individual had a
propensity score.
3. For each higher education receiving household, a non-higher education receiving
household that has the closest propensity score, as measured by the absolute difference in
scores, referred to as nearest neighbor was obtained. For more precise estimate, the nearest
five neighbors was used. Thus the nearest neighbour matching was used.
4. The mean values of the outcome indicator (per capita expenditures) for the nearest
neighbours were calculated. The difference between the mean and actual value for the
higher education receiving households (beneficiaries) is the estimate of the gain due to
higher education.
5. The mean of individual gains is calculated to obtain the average overall gain i.e. the
average treatment effect on the treated (ATT).
The result of the logit estimation for the derivation of the p-scores is presented in Table 3.7. The
dependent variable for the logit was receiving or not receiving higher education coded as 1 and 0.
The result in the below shows that sex of the respondents, father not educated, education with
respect to South west, North east, Monogamous marriage, Polygamous marriage, Age at first
marriage, do not significantly influence higher education receiving. Household total income
significantly influenced higher education receiving. Sector 1(urban), education with respect to
South East, South South, and North Central are statistically significant, showing that they
influenced higher education receiving.

Asian Economic and Financial Review, 2014, 4(1):1-19
16
Table-3.7. Parameter estimates of higher education receiving and non-receiving for the propensity
score matching
Higher Edu Coefficient Std Error Z-Stat P-Value
Constant -3.108082 1.353166 -2.30 0.022
Sex 0.1570613 0.4536126 0.35 0.729
houtotincome 8.65e-06 2.96e-06 2.92** 0.008
Father_noedu -0.3499398 0.3948406 -0.89 0.375
Sector 1 1.339933 0.4480636 2.99** 0.008
Southeast 1.896026 0.8085812 2.34* 0.019
Southsouth 1.701277 0.6659233 2.55* 0.011
Southwest 1.02048 0.8772991 1.16 0.245
Northeast -0.2163396 0.8483566 -0.26 0.799
Northcentral 1.725592 0.6575207 2.62** 0.009
Monmarriage -0.7641238 0.9004586 -0.85 0.396
Pmarriage -0.9496606 1.004767 -0.95 0.345
Agefirstmaried 0.0476011 0.0895648 1.20 0.229
Popwt -0.0000117 0.0000306 -0.38 0.702
Source: Calculations from NLSS merged data file
Variables in parenthesis are standard errors
Log likelihood = -94.407402
* indicate significant at 0.05 & 0.10 probability levels while ** indicates significant at 0.01, 0.05 &
0.10 levels
Table-3.8. Result of the propensity score matching showing the overall gain (ATT) in expenditure
per capita of higher education receiving households
Method No of
treatment
No of
controls
ATT Standard
error
t-value
Analytic
standard error
598 3962 20106.872 8369.781 2.402
Bootstrapped
standard error
598 3962 19930.523 7997.275 2.492
Source: Calculations from NLSS merged data file
Note: The numbers of treated and controls refer to actual nearest neighbor matches. ATT refers average treatment effect on
the treated using nearest neighbor matches
The result showing the average overall gain in expenditure per capita due to higher education
(step 5 as described in the analytical framework) after the nearest neighbour matches of propensity
scores obtained after the logit analysis is presented in Table 3.8. The result shows that the average
treatment effect on the treated (ATT), that is, average gain in expenditure per capita by higher
education receiving households, using nearest neighbor matches is N20106.87. This shows that the
higher education receiving households gained by N20106.87 after the matches. The t value (2.402)
for test of difference between the expenditure per capita based on the gain between higher
education receiving and non-receiving households, as shown in Table 3.8 was greater than the
tabular value of 1.96 at a probability value of 0.05. This shows that the impact of higher education
on per capita expenditure between higher education receiving and non-receiving households was

Asian Economic and Financial Review, 2014, 4(1):1-19
17
different. Thus using propensity score matching, the findings suggest that higher education had
significant effect on poverty as the gain in expenditure per capita due to higher education was
positive and significant.
4. CONCLUSION
We have seen that the Nigerian higher education has been improving for some time, as could
be seen in the enrolment both at the Polytechnics and at the University levels. The student-teacher
ratio has also been improving over the same period. The female enrolment has been impressive as
revealed from the output of graduate females. At the first degree level, even though the male
graduates are larger in number, the rate at which the female number matches that of the males is
really encouraging. One can infer unequivocally that higher education, as it affects the first degree
is not gender bias. But at the postgraduate level, the size of male graduates more than doubles that
of the females. This is exemplified in the number of graduates at the postgraduate diploma, masters
and the doctorate levels where the number of male graduates more than double that of females.
The Propensity Score Matching and the logistic regression show that higher education has
impact on youth poverty. We have seen that higher education with respect to some zones is
statistically significant while to some other zones and other variables are not significant. For the
result of the propensity score matching, the average gain in expenditure per capita by higher
education receiving households, using nearest neighbor matches is N20106.87. This shows that the
higher education receiving households gained by N20106.87 after the matches. The t value (2.402)
for test of difference between the expenditure per capita based on the gain between higher
education receiving and non-receiving households, implying that higher education has impact of
reducing poverty among the youths in Nigeria. We therefore recommend that the Federal
Government of Nigeria should include higher education as one of the priority projects in the yearly
budget. Funding of education should improve by adapting the benchmark of the International
Agencies’ suggestion that all governments should devote about 30% the Gross Domestic Product
(GDP) to funding of education. This will help the education sector to grow and also improve the
human capital development. The national policy on education should be such that funding and
emphasis laid on higher education research and training that would position the graduates for
gainful employment and career life.
REFERENCES
Akooje, S. and McGrath S, 2005. Post-basic education and training and poverty reduction
in South Africa: Progress to 2004 and vision to 2014, Post-basic education and
training, working paper series - No.2, Centre of African Studies, University of
Edinburgh.
Asmal, K., 2002. Education, Development and poverty reduction, being a paper presented
by Professor Kader Asmal, MP, Minister of education (South Africa) during the

Asian Economic and Financial Review, 2014, 4(1):1-19
18
national assembly debate on the world summit for sustainable development, Cape
Town.
Becker, G.S., 1975. Human capital: A theoretical and empirical analysis, with special
reference to education. 2nd Edn., New York: National Bureau of Economic
Research.
Carnevale,A. P., 2012. For a middle-class life, College is crucial. Available from
http://www.nytimes.com/roomfordebate/2012/03/01/shouldcollege-be-for-
everyone/for-a-middle-class-life-college-is-crucial.
Colclough, C., 1994. Under-enrolment and low quality in African Primary Schooling:
Towards a gender-sensitive solution, IDS Working Paper, 7, Brighton: IDS.
Dabalen, A. and Oni B., 2000. Labour market prospects of university graduates in Nigeria.
Paper prepared for a world bank–sponsored study on tertiary education in Nigeria.
Doepke, M., M. Tertilt and A. Voena, 2011. The economics and politics of women’s
rights, National bureau of economic research, Working Paper,17672,
Forthcoming.
Ferreira, F., P. Lanjouw and Neri M., 1998. The urban poor in Brazil in 1996: A new
poverty profile using PPV, PNAD and census data. World Bank, Mimio.
McQueston, K., Silverman R and Glassman A., 2012. Adolescent fertility in lowand
middle-income countries: Effects and solutions, Center for global development,
Working Paper, 295.
National Bureau of Statistics, 2005. Social statistics in Nigeria, Federal republic of
Nigeria.
Nigeria Ministry of Finance, 2000a. National rolling plan, 2001–2003. Abuja.
Organisation for Economic Cooperation and Development (OECD), 2012. Gender
equality in education, Employment and entrepreneurship: Final Report to the
MCM, C/MIN 5.
Ramphele, M., 2003. The role of higher education in reducing poverty and promoting
prosperity, Speech delivered to the conference, Policies and models for
international co-operation in higher education Bergen, Norway.
Ravallion, M., 2001. The mystery of the vanishing benefits: An introduction to impact
evaluation. The World Bank Economic Review, 15(1): 115-140.
Rawlings, L. and N.R. Schady, 2002. Impact evaluation of social funds: An introduction.
The world Bank Economic Review, 16(2): 213-217.
Sawyer, S.M., Afi fi R. A., BearingerL. H., Blakemore S. J., Dick B., Eze A. E. and
PattonG. P., 2012. Adolescence: A foundation for future health,centre for
adolescent health,Royal Children’sHospital,Parkville, VIC,Australia, Series,
Adolescent Health 1, The Lancet, 379: 1630-1640.
United Nations Development Programme (UNDP) 2004. Human Development Report:
Cultural liberty in today’s diverse world. New York.

Asian Economic and Financial Review, 2014, 4(1):1-19
19
United Nations Development Programme(UNDP) 2001. Human development report:
Nigeria 2000/2001 millennium edition. Lagos.
United Nations Economic Commission for Africa (2002).EconomicreportonAfrica:
Tracking performance and progress, Addis ababa, Ethiopia.
United Nations Economic Commission for Africa (2005). Economic report on
Africa: Meeting the challenges of unemployment and poverty in Africa, Addis
Ababa, Ethiopia
United Nations Education, Scientific and Cultural Organization(UNESCO)., 2012.
Education and skills for inclusive and sustainable development beyond 2015:
Thematic think piece, UNESCO, UN task team on the post 2015 UNN
development agenda.
Veenhoven, R., 2011. Social development and happiness in nations 1990-2010,
Presentation atconference taking stock: Measuring social development,
International Institute of Social Studies,December, 14-15
Veenhoven, R., 2012. World database of happiness, Erasmus universiteit rotterdam, The
Netherlands.
Vener, D., 2004. Education and its poverty-reducing effects: The case of paraíba, Brazil,
World bank policy research, Working Paper, 3321.
World Bank, 1995, Development in practice: Priorities and strategies for education,
Washington D.C: World Bank
Zoë Oxaal, 1997. Education and poverty: A gender analysis, report prepared for the
gender equality unit, Swedish international development cooperation agency
(SIDA), Institute of development studies, University of Sussex, UK.