
Does High Involvement Management Improve Worker Wellbeing? · might include union representation...
33
1 Does High Involvement Management Improve Worker Wellbeing? Petri Böckerman*, Alex Bryson** and Pekka Ilmakunnas*** *Corresponding author. Labour Institute for Economic Research, Pitkänsillanranta 3A, 00530 Helsinki, Finland. E-mail: [email protected] **National Institute of Economic and Social Research and CEP, London, UK [email protected] ***Aalto University School of Economics, Helsinki, Finland [email protected] Abstract Employees exposed to high involvement management (HIM) practices have higher subjective wellbeing, fewer accidents but more short absence spells than "like" employees not exposed to HIM. These results are robust to extensive work, wage and sickness absence history controls. They are consistent with the view that employers recognise the value of short absences in reducing accidents and ensuring worker wellbeing, particularly in more demanding working environments such as those characterised by HIM practices. These wellbeing effects are most evident among employees in receipt of performance-related pay and training. Key-words: health; subjective well-being; sickness absence; job satisfaction; pain; high involvement management; high performance work system; performance-related pay; training; team working; information sharing. JEL-codes: I10; J28; J81; M52; M53; M54 Acknowledgement: We thank the Finnish Work Environment Fund for funding (grant no.108294) and Statistics Finland for access to the QWLS, FLEED and KELA data.
Transcript of Does High Involvement Management Improve Worker Wellbeing? · might include union representation...
1
Does High Involvement Management Improve Worker Wellbeing?
Petri Böckerman*, Alex Bryson** and Pekka Ilmakunnas***
*Corresponding author. Labour Institute for Economic Research, Pitkänsillanranta 3A, 00530 Helsinki, Finland. E-mail: [email protected]
**National Institute of Economic and Social Research and CEP, London, UK
***Aalto University School of Economics, Helsinki, Finland [email protected]
Abstract Employees exposed to high involvement management (HIM) practices have higher subjective wellbeing, fewer accidents but more short absence spells than "like" employees not exposed to HIM. These results are robust to extensive work, wage and sickness absence history controls. They are consistent with the view that employers recognise the value of short absences in reducing accidents and ensuring worker wellbeing, particularly in more demanding working environments such as those characterised by HIM practices. These wellbeing effects are most evident among employees in receipt of performance-related pay and training. Key-words: health; subjective well-being; sickness absence; job satisfaction; pain; high involvement management; high performance work system; performance-related pay; training; team working; information sharing. JEL-codes: I10; J28; J81; M52; M53; M54 Acknowledgement: We thank the Finnish Work Environment Fund for funding (grant no.108294) and Statistics Finland for access to the QWLS, FLEED and KELA data.
2
1. Introduction
What people do affects how they feel at the time and how they subsequently evaluate themselves and their life more generally (Kahneman and Krueger, 2006). What happens at work matters partly because working individuals spend so much of their time at work, but also because it is salient in the way they think about themselves and the value they attach to their lives. This is borne out in empirical research. For instance, studies focusing on reflexive wellbeing indicate that job satisfaction is strongly positively associated with life satisfaction, even after controlling for satisfaction with other aspects of one's life (Rice et al., 1980). Job satisfaction is also strongly associated with better mental health measured in a variety of ways (Warr, 2007; Llena-Nozal, 2009). However, recent research paints a more nuanced picture. Day reconstruction method (DRM) studies show time spent with one's supervisor is often among the most stressful and least enjoyable parts of the day (Kahneman et al., 2004). So, paid employment can be both good and bad for wellbeing. The type of work one undertakes also appears to be important. Thus, although moving into employment from non-employment is usually associated with improvements in mental health, the gains to entering non-standard employment contracts are often much lower (Llena-Nozal, 2009). Standard models assume employers make adjustments to the production process to maximise profits, rather than employee wellbeing. Consistent with this, there is empirical evidence that management practices will be adopted if their productivity benefits exceed the costs of introducing and maintaining them (Bloom and Van Reenen, 2007) and that firms will switch management practices - even if they are productivity enhancing - if the costs outweigh the benefits (Freeman and Kleiner, 2005). However, the way jobs are designed can also have a profound impact on workers’ mental and physical wellbeing (Wood, 2008). There is also evidence that happier workers are more productive (Oswald et al., 2009). It does not follow, however, that employers will invest to maximise the wellbeing of their workers since such investments are themselves costly. In recent decades many employers have introduced practices designed to maximise employees' sense of involvement with their work, and their commitment to the wider organisation, in the expectation that this will improve their organisation's performance. These “high involvement practices” include teams, problem-solving groups, information sharing, incentive pay, and supportive practices such as training and associated recruitment methods. Collectively they constitute “high involvement management” (HIM). A sizeable literature explores the links between these practices and firm performance (Bloom and Van Reenen, 2010) but far less is known about the effects of HIM on employees’ health and other measures of wellbeing. The investigation of links between HIM and worker wellbeing is timely because HIM has become increasingly common in developed industrialised economies (Wood and Bryson, 2009) while, at the same time and perhaps coincidentally, there are indications of a decline in worker wellbeing (Oswald, 2010; Green, 2006, 2009). A priori, it is uncertain what impact HIM is likely to have on employee wellbeing. On the one hand, if HIM enriches employees' working lives by offering them greater job autonomy, more mental stimulation, team-based social interaction, and a heightened sense of achievement this may improve worker wellbeing. On the other hand, if HIM is simply a means of intensifying worker effort this may lead to a higher incidence of illness, injury, absence and stress. We contribute to the literature in four ways. First, using nationally representative data for employees in Finland, we establish whether healthier workers are more likely to use high involvement practices in their jobs, as one might expect if HIM jobs demand more of workers than non-HIM jobs. We do so by linking register data on Finnish workers’ absence histories to a survey in which employees identify which, if any, high involvement practices they are exposed to in their jobs. Second, we estimate the impact of HIM practices on employee wellbeing having controlled for worker sorting into HIM jobs by conditioning on sickness absence histories and work and wage histories. Third, unlike most of the literature that tends to focus on specific aspects of worker wellbeing we explore HIM effects across a broad range of wellbeing measures. Specifically, we estimate the effects of HIM on three types of
3
wellbeing measure, namely sickness absences, both short-term and long-term; subjective wellbeing (job satisfaction, work capacity, the state of one's health, and feelings of tiredness); and physical discomfort at work, as measured by the experience of pain in four different parts of the body (lumber, legs, arms and neck). Finally, we estimate the models for a full set of different “bundles” of HIM practices. The remainder of the paper is structured as follows. Section Two reviews the theoretical and empirical literatures linking HIM to employees’ wellbeing. Section Three introduces our data. Section Four presents a simple model which informs our empirical strategy. Section Five reports our results and Section Six concludes. 2. Theoretical and Empirical Literatures
Since the early 1980s management theorists and practitioners have advocated innovations in job design expressly intended to elicit greater labour productivity via greater employee involvement (Beer et al. 1984, 1985; Walton 1985). Those scholars in the Harvard Business School tradition identify human resources as a key asset in value production and maintain that firms can gain a hard-to-replicate competitive advantage over rivals through investment in management practices which devolve responsibilities to employees in the organization of work (Walton, 1987; Pfeffer, 1998). The shift towards job autonomy is often perceived as a move away from the deskilling imperatives associated with Taylorist principles of hierarchical work organization towards job enrichment and "high commitment". In return, employers might expect improved labour productivity through increased worker effort - since the marginal costs of effort would decline - or through "smarter" working arising from employees’ increased opportunities to utilize tacit knowledge about efficient working which would not have been sought in a more hierarchically structured organization. 2.1: Theory
One might assume that if HIM entails job enrichment it might improve worker wellbeing by increasing worker control over job tasks, increasing mental stimulation, providing greater opportunities for social interaction via team-working, and via a greater sense of achievement at work. However, demanding more of workers through the introduction of high involvement management practices may also have negative effects on employees' subjective wellbeing. According to Karasek (1979) workers' mental and emotional well-being is negatively related to job demands and positively related to job control. Both are implied by a shift to HIM. Even if HIM enhances job control, the process of HIM introduction can generate uncertainty leading to increased anxiety among risk-averse workers, in much the same way as other processes of change. These effects on employee subjective wellbeing are unlikely to persist since those worst affected will choose to leave the organisation while the remainder are liable to adapt over time (Kahneman et al., 1999). Whether HIM innovations will lead to deterioration in employee wellbeing depends, in part, on what Payne (1979) and Karasek and Theorell (1990) term "social supports". These supports, which might include union representation and consultative management, have the capacity to buffer individuals against the worst effects of workplace innovation. High involvement management may also affect employee physical wellbeing either positively or negatively for a number of reasons. First, changes in physical health often accompany changes in mental and emotional wellbeing. Thus, HIM effects on subjective wellbeing may feed through to changes in physical wellbeing. Second, where workers have job autonomy which gives them a say in the way their work is organised they can instigate innovations in work practices which can reduce workers' exposure to risks of injury and disease. Third, introducing HIM entails a fundamental review of work organisation to rationalise job tasks and the interaction between workers which management can use to "build in" better working conditions for workers, resulting in improved physical wellbeing, irrespective
4
of the degree of job autonomy those HIM practices offer workers. Fourth, the training that is integral to so many HIM innovations can raise worker competence thus reducing risks of accidents and injury. On the other hand, if HIM is used as a form of labour intensification it may lead to an increased risk of accidents, job-related pain or injury. HIM effects on employees' subjective and physical wellbeing may also affect their absence rates. HIM-induced increases (reductions) in injury and illness should have a direct bearing on the amount of sickness absence employees take relative to what they would have taken in the absence of HIM. There are other less clear-cut scenarios in which whether a worker chooses to be absent from work is a marginal cost-benefit decision (Allen, 1981). This choice will turn, in part, on whether HIM is viewed by the employee as an amenity or disamenity. If it is viewed as a disamenity which is not compensated with increased financial rewards - either through base pay or incentive pay - HIM may increase absence taking. However, certain HIM practices can be expected to reduce absenteeism. In the case of incentive pay, loss aversion will encourage workers to attend because absent workers forgo incentive payments (Merriman and Deckop, 2007). Where worker inputs are complementary, as in the case of team-working, workers may come under co-worker pressures to minimise absence, particularly if performance is judged on team outputs (Drago and Wooden, 1992; Heywood and Jirjahn, 2004; Knez and Simester, 2001; Kandel and Lazear, 1992). HIM may also affect absences through its impact on the firms’ optimizing behaviour. One can think of firms choosing an optimal rate of absence. Increasing worker well-being is likely to benefit firms, but at a decreasing rate. The marginal cost of decreasing absenteeism can be increasing. Equality of marginal benefits and costs determines the absence rate that is optimal from the point of view of the firm. Since firms differ in terms of production processes, the optimal rate varies across firms. In particular, HIM practices have a bearing on the absence rate. What Coles et al. (2007) and Coles and Treble (1996) term the "shadow price of absenteeism" may be higher in HIM firms than non-HIM firms, especially in the case of long absences. In the sort of multitasking environment which predominates in many HIM firms, workers can substitute for one another in the short term without the firm having to bring in additional labour. Therefore, it may be worthwhile paying the additional short run cost of absences if it means that the firm can meet production schedules. HIM employees may also be encouraged by HIM employers to reduce "presenteeism" - the practice of attending work even when not fully fit - to reduce more prolonged absences arising either through failure to recuperate or passing on infections to co-workers. Additional tiredness associated with the intensity of HIM production may require short absences to recuperate in order to avoid longer term absences. All of these arguments suggest likely differences in the impacts of HIM on the length of absences, with HIM employees taking more short absences but fewer longer-term absences. We return to this issue in Section Four. In the presence of such differences workers may be prepared to take up an HIM job knowing that there is some increased probability of short absences, but they are compensated financially for this in terms of higher pay, whereas for long absences there would not be such wage compensation. 2.2: Evidence
The evidence on the link between subjective wellbeing and job control and job demands tends to support Karasek's theory. Using linked employer-employee data for Britain Wood (2008) confirms that worker well-being is negatively related to job demands and positively related to job control, and that high job controls reduce the negative association between job demands and well-being. Studies which examine the effects of specific HIM practices indicate they are often associated with high levels of work intensity and worker stress (Barker, 1993; Godard, 2001), even when they are also associated with higher work commitment (Ramsay et al., 2000) or higher job control (Gallie, 2005).1
1 In his review of the literature Godard (2004) suggests the evidence is more mixed. For instance, there are some studies such as Appelbaum et al. (2000) who find no adverse effects.
5
The process of innovating can also generate anxiety. In a case study Bordia et al. (2004) link organizational change to psychological stress through perceived loss of control. Pollard (2001) shows that workplace reorganization caused significant increases in distress and in systolic blood pressure and that uncertainty was a key factor. However, as predicted by theory, social supports can help workers cope with workplace innovation. Using the same linked employer-employee survey as Wood, Bryson et al. (2009) find supportive evidence for the buffering effect of unionisation in ameliorating the negative impacts of workplace innovation on job anxiety. Using data for the late 1990s Green (2006) shows that task discretion has been declining in most European countries. Green and Tsitsianis (2005) show that in Britain there has also been a decline in job satisfaction which is accounted for by declining task discretion and the intensification of work effort. Rather than being a force for job enrichment, it appears that HIM was introduced over the period as part of a lean production system geared to cost reductions and just-in-time production. There is direct evidence that this is the case in Britain (Wood and Bryson, 2009). Just-in-time production is associated with poorer sick pay provision (Lanfranchi and Treble, 2010), as predicted under Coles and Treble’s (1996) model. Taken together, findings from these studies suggest HIM may well be associated with injuries, accidents and higher levels of absenteeism. However, other British studies suggest HIM increases job satisfaction. Green and Heywood (2008) find performance pay increases job satisfaction while Jones et al. (2009) report that satisfaction with employer-provided training reduces absenteeism. The evidence for continental Europe is also ambiguous. Askenazy and Caroli (2010) find that in France innovative workplace practices are positively associated with mental strain and with worker perceptions of occupational risks but not with occupational injury. Heywood and Jirjahn (2004) find absence rates are lower in German manufacturing in the presence of team-working. However, Frick and Simmons's (2010) case study of a large German steel plant supports the contention that HIM increases accidents and absenteeism via labour intensification. In their study the introduction of production bonuses for teams leads to an increase in both absence rates and the number and severity of accidents. The steel workers face a capped incentive structure allowing them to achieve their maximum bonus without fully utilising labour, thus enabling them to share out leisure time in the form of coordinated absences. Furthermore, incentive payments in the absence of teams result in an increased accident rate which they suggest is evidence of "excessive incentivization ... workers work too hard and cause accidents through carelessness and/or fatigue" (p.14). In the presence of teams, incentive pay is not associated with increased accidents, a finding the authors say is consistent with team members taking care of one another to ensure they make the team bonus. Empirical evidence for North America is equally ambiguous. Establishment-level studies for the United States have identified a positive link between managerial innovations and workplace injuries (Askenazy, 2001; Fairris and Brenner, 2001) and cumulative trauma disorders (Brenner et al., 2004). On the other hand, using linked employer-employee data for Canada Mohr and Zoghi (2008) find a robust positive association between HIM and job satisfaction and no association with work-related stress. Using the longitudinal component in their data they find higher job satisfaction predicts increased participation in HIM whereas participation does not predict future satisfaction, a result which raises questions about a causal linkage between HIM and improved worker wellbeing. Furthermore, using similar survey instruments in Canada and England in 1998 and 2003/4, Godard (2010) reports different relationships between workplace practices and worker subjective wellbeing over time and place, leading him to suggest that the associations “may be historically and institutionally contingent and thus should be interpreted using a historical P institutional perspective” (2010: 466).
6
Our study utilises nationally representative data from Finland, a country with very high rates of unionisation (~70%) and a Scandinavian social model which places greater emphasis on social dialogue in the workplace than the European and North American countries which account for most of the empirical studies. One might expect Finnish employees to have a greater say in the process of workplace innovation, offering them opportunities to influence the nature of HIM and the way it is introduced in a manner which may be less common in other settings. In fact, Green (2006: 103) notes that, whilst job discretion has been on the decline in many countries, it has been rising in Finland. The Finnish Quality of Working Life Surveys (QWLS) provide consistent data over time to map changes in work organisation in Finland, and they paint a more nuanced picture. For instance, while employees' ability to influence the way their own work is organised has increased in most dimensions, perceptions of work intensity have increased (Lehto and Sutela, 2009). Furthermore, Finland has the highest sickness absence rate in the European Union (Gimeno et al., 2004). Finland is thus of particular interest when analysing the effects of work practices on worker wellbeing. Using the QWLS 2003 - the same survey we use in this paper - Kalmi and Kauhanen (2008) find HIM is negatively correlated with worker stress and positively correlated with both job satisfaction and job security. These associations strengthen with the number of HIM practices to which the employee is exposed. Bockerman et al. (2009) examine the relationship between HIM and sickness absence and accidents using the QWLS 2008. Their results are not so clear cut. Using single equation models, they find that innovative work practices increase short-term sickness absence for blue-collar and lower white-collar employees. However, in two-equation models that treat innovative workplace practices as endogenous variables and control for unobserved correlations between HIM and the wellbeing outcomes they do not find relationships between innovative work practices and sickness absence or accidents at work. The difficulty interpreting the results from the studies reviewed above is establishing whether the relationship between HIM and wellbeing outcomes is causal. If HIM jobs are more demanding than other jobs, it is plausible that only healthier employees, or those who are mentally and physically more resilient, will put themselves forward for HIM jobs, or be offered them by HIM employers. Failure to account for selection of healthier workers into HIM jobs will upwardly bias any estimated effect of HIM on worker wellbeing since the wellbeing of HIM workers would have been higher than their non-HIM counterparts even in the absence of HIM. Market frictions mean workers cannot simply choose to shift easily between the HIM and non-HIM sectors so that the sector they work in will not necessarily reflect preferences but it remains a source of potential estimation bias. We address this concern by conditioning on employees' prior sickness absence. To our knowledge, the only other author to do this is Llena-Nozal (2009) in her study of the effect of labour market transitions on mental health. She finds that failure to account for previous health histories leads to an upward bias in the mental health returns to entering employment. A further threat to causal interpretation of the link between HIM and employee wellbeing arises from the fact that HIM and non-HIM workers may differ in dimensions other than their health histories which are unobservable to the analyst but which may nevertheless influence their propensity to take HIM jobs and their current state of wellbeing. For example, we do not observe risk preferences, yet those with high risk preferences may be more prepared to take the demanding and responsible work in an HIM job and be more prepared to engage in risky behaviour which adversely affects health. If so, this would induce a negative bias in the effects of HIM on employees' wellbeing. To help overcome this problem we also condition on employees' work and earnings histories which are plausibly highly correlated with unobserved worker traits, thus reducing the potential for omitted variables bias. Omitted variables bias may also arise due to unobserved differences between HIM and non-HIM jobs. For instance, HIM jobs may simply be 'better' jobs than non-HIM jobs in terms of pay or working
7
conditions, in which case they may generate higher worker wellbeing for reasons that are not strictly due to the amount of employee involvement they entail. For this reason, we test the sensitivity of our results to a full set of job controls including a range of highly detailed job disamenities. 3. Data
Our data are the Quality of Working Life Survey (QWLS) 2003 of Statistics Finland (SF). The initial sample for QWLS is derived from a monthly Labour Force Survey (LFS), where a random sample of the working age population is selected for a telephone interview. The 2003 QWLS was based on LFS respondents in October and November who were 15-64-year-old wage and salary earners with a normal weekly working time of at least five hours. 5,270 LFS participants satisfied these conditions and were invited to participate in a personal face-to-face interview for the QWLS. Eventually 4,104 persons participated (Lehto and Sutela, 2005) in the interviews (a 77.9 percent response rate), which took place mostly in October-December 2003, with some taking place in the beginning of January 2004. Owing to missing information on some variables for some workers, the sample size used in this study is 3,755 observations. In addition to the HIM practices the worker is exposed to in her employment, the QWLS contains information on the type of job the employee does and the nature of the employer, together with employees’ personal characteristics and work experience. SF supplements QWLS with information from the LFS on, for example, working time and exact labor market status, and information on annual earnings from tax registers and on education (level and field) from the register of completed degrees. Supplementary information on the industry and location of the employer is gathered from various other registers maintained by SF. The QWLS is a cross-section data set that includes only limited self-reported information on past labour market experience. However, we match the QWLS data to comprehensive longitudinal register data. These are the Finnish Longitudinal Employer-Employee Data (FLEED). FLEED is constructed from a number of different registers on individuals and firms that are maintained by Statistics Finland. In particular, FLEED contains information from Employment Statistics, which records each employee’s employer during the last week of each year. We match QWLS and FLEED using unique personal identifiers (i.e. ID codes for persons). We can follow the employees backwards over the period 1990-2003. In each year, we can link information on the firm and establishment to each person. Following Kalmi and Kauhanen (2008) we capture four different aspects of HIM using dummy variables for them. These indicators are incentive pay for those who are personally subject to performance-related pay; training for employees who have participated in employer-provided training during the past 12 months; self-managed teams for individuals who work in a team that selects its own foreman and decides on the internal division of responsibilities; and information sharing for employees who are informed about the changes at work at the planning stage rather than shortly before the change or at its implementation. If HIM practices are complementary (Milgrom and Roberts, 1995) it may be that productivity and thus wage effects are more clearly discernible when HIM practices are combined. We therefore construct a categorical variable identifying all possible combinations of the four HIM practices to establish the effects of different "bundles". The dependent variables describe different aspects of worker well-being. First we consider sickness absence. The QWLS survey has information on the number and length of absences during the last 12 months. The questions relating to absences are the following: “How many times have you been absent 1 to 3 days?”; “How many times have you been absent 4 to 9 days?”; “How many times have you been
8
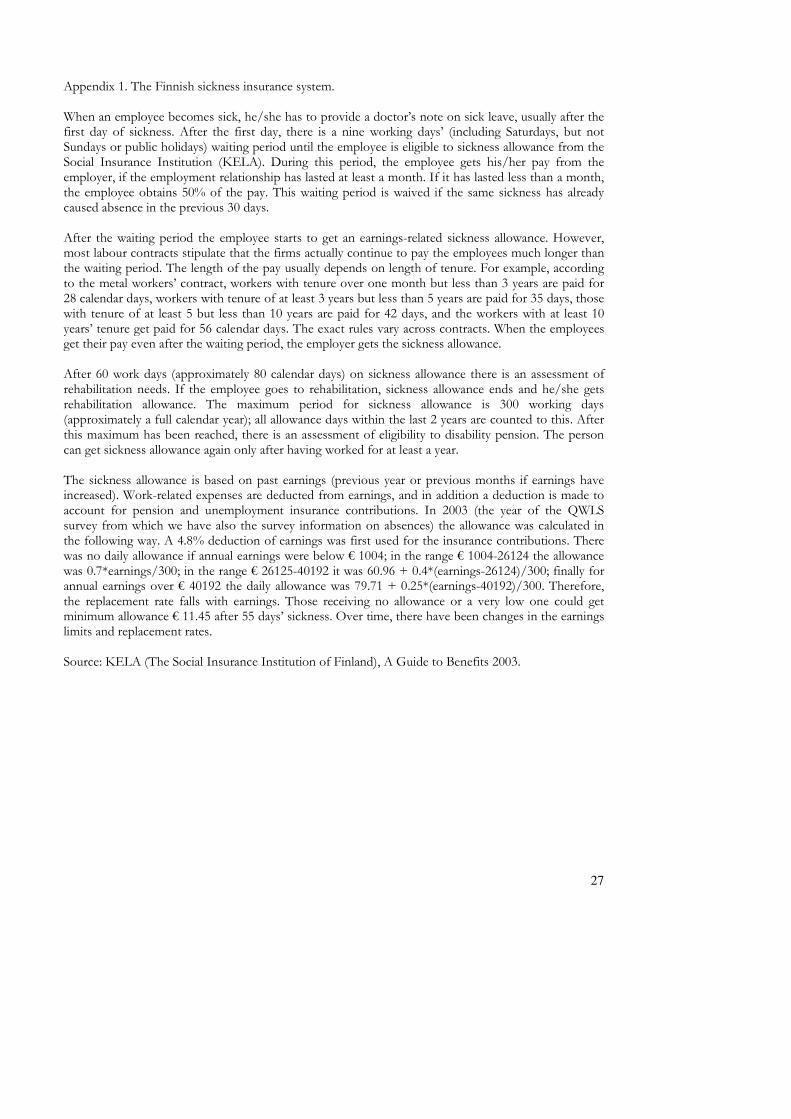
absent at least 10 days?”; and regarding the longest absences, “How long were you absent from work? (Add up several absences of over 10 days.)”. With this information we can form variables for the total number of absences. In addition, we can approximate the total days of absences by using 2 days as the length of the short 1-3 day absences, 6.5 as the length of the 4-9 day absences, and the actual number of days for the long absences.2 An alternative measure is based on information from the Social Insurance Institution (KELA). This is the number of days for which the worker has obtained sickness allowance from the sickness insurance system. (The details of the Finnish sickness insurance system are described in Appendix 1). Since there is a waiting period of 10 days until eligibility to the sickness allowance, this measure only includes long absences. On the other hand, the information on the allowance days is available for the whole period 1995-2006, so we can use it both as a control variable for past absence history and as an outcome variable.3 Related to the absence variables is an indicator for accidents. QWLS has a question on whether the person has had an accident at work that has resulted in absence from work in the last 12 months. The other well-being variables are from the QWLS. The second set capture subjective measures of employee well-being. There is a question on job satisfaction measured on a four-point scale from “Very dissatisfied” (coded 1) to “Very satisfied” (coded 4). There is also a question on working capacity: “Assuming that your top working capacity would score 10 points while your total inability to work would score zero, how many points would you give to your working capacity at the moment?”. The state of self-assessed health is measured in the survey with answers on a 5-point scale from “Poor” (coded 1) to “Good” (coded 5). We also have a measure of tiredness from answers to the question: “How often do you feel reluctant or mentally tired on leaving for work?”. The answers range on a 6-point scale from “Daily or almost daily” (coded as 1) to “Never” (coded as 6). The third set of dependent variables capture pain felt at work. We use answers to the questions on specific conditions to identify whether the person suffers from recurrent aches or pains in a) neck, cervical spine or shoulders; b) hands or arms; c) lumbar region; or d) legs, including hips. We code these answers so that 1 indicates no pain and 0 indicates pain. As control variables, we use indicators for gender, age, marital status, educational level, plant size, multi-plant firms, foreign ownership, public sector employer and a set of 14 single digit industry dummies. All of these variables are based on the data on individuals in QWLS. Furthermore, we have several work and earnings history variables for the period 1990-2001. These include the number of past job switches (defined as a change of establishment), unemployment episodes (both number of episodes and their length in months), past employment months, an indicator for having worked in a big firm (firm with more than 300 employees), past average earnings (1990-2001) and past earnings growth (average over periods 1999-2000 and 2000-2001). The past earnings data are introduced as the log of annual earnings. Earnings include the base wage, overtime pay, bonuses, and wage supplements. All of the above work history variables are from the longitudinal register data. In addition, we use information in the QWLS to measure the length of tenure with current employer and to form an indicator for persons who have had more than three different professions over their working life. We also control for employees’ past sickness absence history by using the total number of sickness absence days over the period 1995-2001, as recorded by KELA.
2 Although the question in the survey refers to days of absence from work, it is nor clear whether the respondents think of these days as actual working days, e.g. Monday to Friday, 'official' working days which also include Saturdays but not Sundays or holidays, or as calendar days which may include the weekends. 3 According to the rules of the sickness insurance and labor contracts, the workers get paid during the waiting period, after which there is an earnings-related allowance. The replacement rate declines with earnings. According to many labour contracts the workers are actually paid for a considerably longer period. However, we do not have information on the contracts that the workers in our data belong to, so we cannot tell whether they have received full pay or the allowance during their illness. Therefore we cannot use the replacement rate as an explanatory variable.
9
Finally, we have three job disamenity variables, based on the QWLS. For perceived harms, there is a five-point scale in which the highest category corresponds to the perception by a worker that a certain feature of working conditions is ‘very much’ an adverse factor at the workplace. Harms include heat, cold and dust, among other things. For perceived hazards, the highest category among three possibilities is the one in which the respondent considers a certain feature at the workplace as ‘a distinct hazard’. Hazards include accident risk, risk of strain injuries and risk of grave work exhaustion, among other things. For insecurities, the respondents answer whether certain aspects are insecurity factors or not. These aspects include the threat of temporary dismissal and the threat of unemployment. Responses to the questions about adverse working conditions are aggregated by forming a dummy variable that equals one if there is at least one clearly adverse factor (Harm), a dummy that equals one if there is at least one distinct hazard (Hazard), and a dummy if there is at least one insecurity factor (Uncertainty).4 Descriptive statistics for all variables used in the analysis are presented in Appendix (Table 1A). 4. A Simple Model of Absence Length, Accidents and HIM
In Section Two we alluded to heterogeneity in the optimal rate of absence across firms and the importance of distinguishing between short-term and longer-term absences. To illustrate the tradeoff between short and long absences and/or accidents, consider the following simple set-up. The firm takes wages as given and chooses the labour input n and the HIM practice, described by work intensity
i. Without absences, the profits are π = F(e(i)n)-wn-c(i), where F(.) is the production function (price is assumed to be 1), e(i) is the relationship between work intensity and productivity, and c(i) is the cost of maintaining the HIM system. The firm would equate marginal revenue and marginal cost of labour and work intensity: F’e = w and F’e’n = c’. If there are absences, their costs depend on whether the lost labour input can be covered by the remaining employees or by substitute labour. Let p be the probability of a short absence and a (0≤a≤1) the extent to which short-run absences can be covered by the other employees, whereupon 1-a is the extent to which the absences lead to production loss. d is the probability of an accident, and 1-b is the extent to which accidents lead to production loss that cannot be covered by substitute labour (0≤b≤1). On the other hand, hiring the substitute labour leads to additional wage costs dwn. It is assumed that during absence the workers are paid their normal wage. The profits are now:
π = F(e(i)(1-(1-a)p-(1-b)d)n) – (1+d)wn – c(i) where L = e(i)(1-(1-a)p-(1-b)d)n is the effective labour input, given the absences and accidents. If work intensity increases both absences and accidents, p=p(i), p’>0 and d=d(i), d’>0. Absences and accidents reduce the marginal revenue of labour, leading to reduced labour demand. They also reduce the marginal revenue and increase the marginal cost of intensity, leading to lower optimal intensity levels. The negative effects on revenues are diminished if the absences are easily covered by the other workers, i.e. with high a and/or b, but accidents would still have an impact on costs. The optimal intensity level determines the optimal level of absences and accidents. However, the short absences may be a mechanism for reducing accidents. In this case the accident function would be d=d(i,p(i)), di>0, dp<0. If the accident-reducing effect of short absences is large enough, it can outweigh the intensity effect on absences. In any case, with the accident reducing effect, the optimal intensity level and labour demand are higher than without it. Since higher intensity leads to higher absences, this also means that with accident reduction the optimal rate of short-run absences is higher.
4 The full description of these variables is available in Böckerman and Ilmakunnas (2008).
10
5. Estimation results
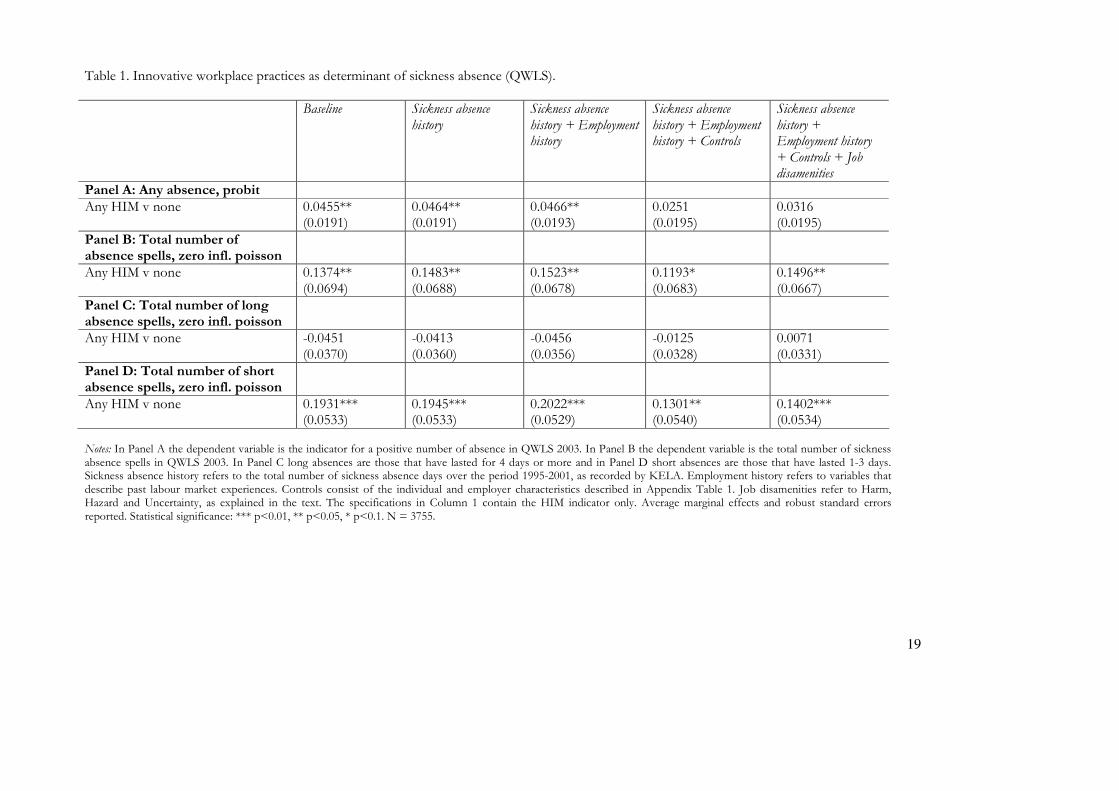
As discussed earlier, those taking HIM jobs may be healthier than other workers if HIM jobs are more demanding than non-HIM jobs and, recognising this, employers select and allocate workers accordingly. To examine this proposition we first establish whether absence histories are related to current self-assessed working capacity. It was indeed the case that absence history had a significant negative relationship with working capacity.5 Next we examined the relationship between absences and HIM practices. The results from probit estimations revealed that sickness absence history over the period 1995-2002 was not related to current exposure to any of the four HIM practices in our data.6 We explored the role of health in the exposure to the HIM practices further by adding working capacity and self-assessed health to the set of control variables. Current working capacity was positively related to the exposure to any HIM practice, but only at a 10% significance level. Thus, this relationship is not strong. Self-assessed health was not statistically significant. Next we turn to the relationship between HIM practices and sickness absences. Table 1 (Panel A) shows the average marginal effects from a probit model for having any absences, where the dependent variable is based on absences reported in QWLS 2003. The columns refer to different control sets, starting from the baseline model that includes only an indicator for being exposed to any HIM practice (vs. none), and then successively adding sickness absence history, employment history, personal and firm characteristics, and finally the three measures of job disamenities. That strategy allows us to test for the significance of sickness absence histories as we load in more information to the models. It is particularly useful to explore the sensitivity of the results to the inclusion of job disamenities in the final column because it is possible that these variables are picking up stressful outcomes that we measure via sickness absence, at least to some degree. The tables only report the coefficients for the HIM variables. (Full estimation results are available on request). HIM practices are associated with a 5 per cent increase in the probability of having a sickness absence spell. However, when demographic and employer characteristics are included the estimate drops and loses significance. This remains the case when we add and job disamenities in the last column. This is natural, since the absences are often related to job hazards and stress factors. ==== TABLE 1 HERE ==== In Panel B we use the total number of absence spells as the dependent variable. Since this is a count, but has a very high concentration of zeros, we use zero inflated Poisson model in the estimation. The coefficient for any HIM practice is positive and becomes statistically significant once we add controls for demographic and job characteristics. It remains significant when we control for job disamenities. However, Panels C and D reveal that the effect is driven by the total number of short absence spells (spells that lasted less than 4 days). HIM is positively correlated with the number of short absence spells in all specifications, but it remains negative and non-significant for long absence spells (spells that
5 We estimated this relationship using an ordered probit model containing the controls for demographic characteristics used throughout the paper. The coefficient of absence history was clearly significant (coefficient -0.0036 with a standard error of 0.0005). 6 Sickness absence histories were statistically non-significant in probits estimating any HIM practice vs. none, any profit related pay (i.e. in any combination with other practices) vs. no HIM, any training vs. no HIM, any self-managed teams vs. no HIM, and any information sharing vs. no HIM. We also investigated the impact of very recent sickness absence history (over the period 2000-2002) before QWLS 2003, because it is arguably more easily observable to the current employer and thus could have a larger impact on the allocation of workers into various tasks. The recent absence history was not statistically significant in any of the models. Furthermore, we excluded the employment history variables from the set of controls, because employment and sickness absence history may be closely related. However, this did not have any significant effect on the estimates. A full set of these estimates is available from the authors on request.
11
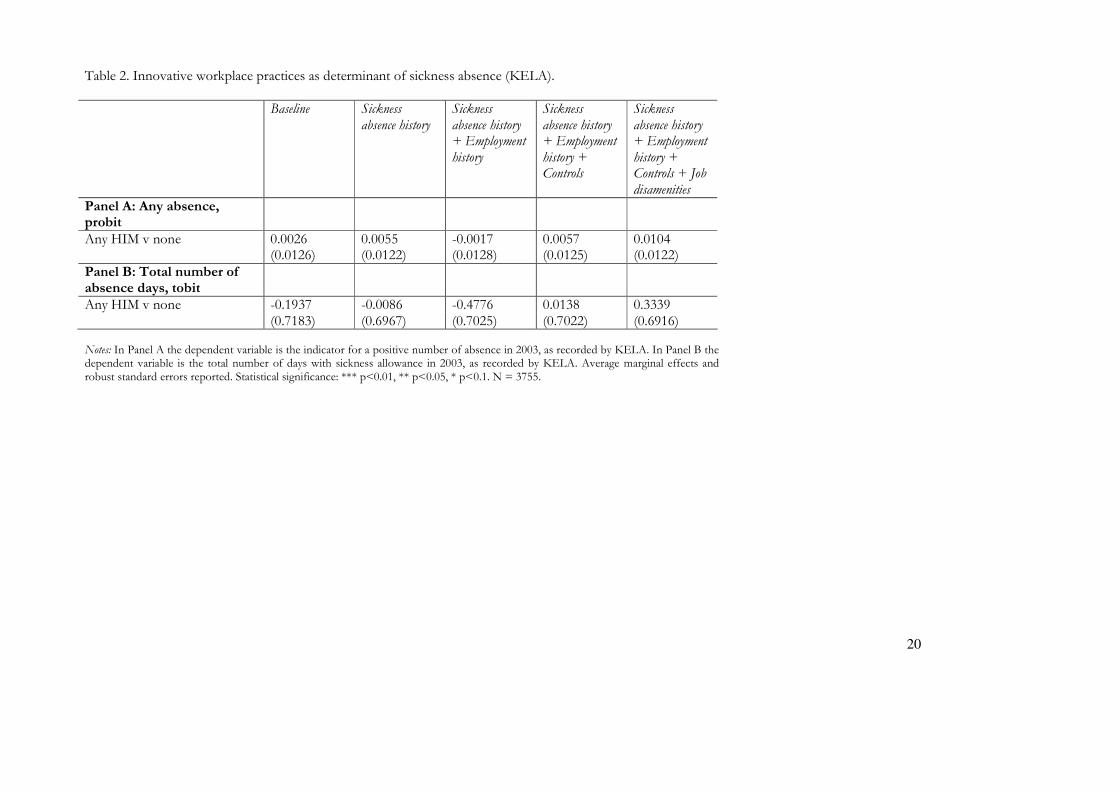
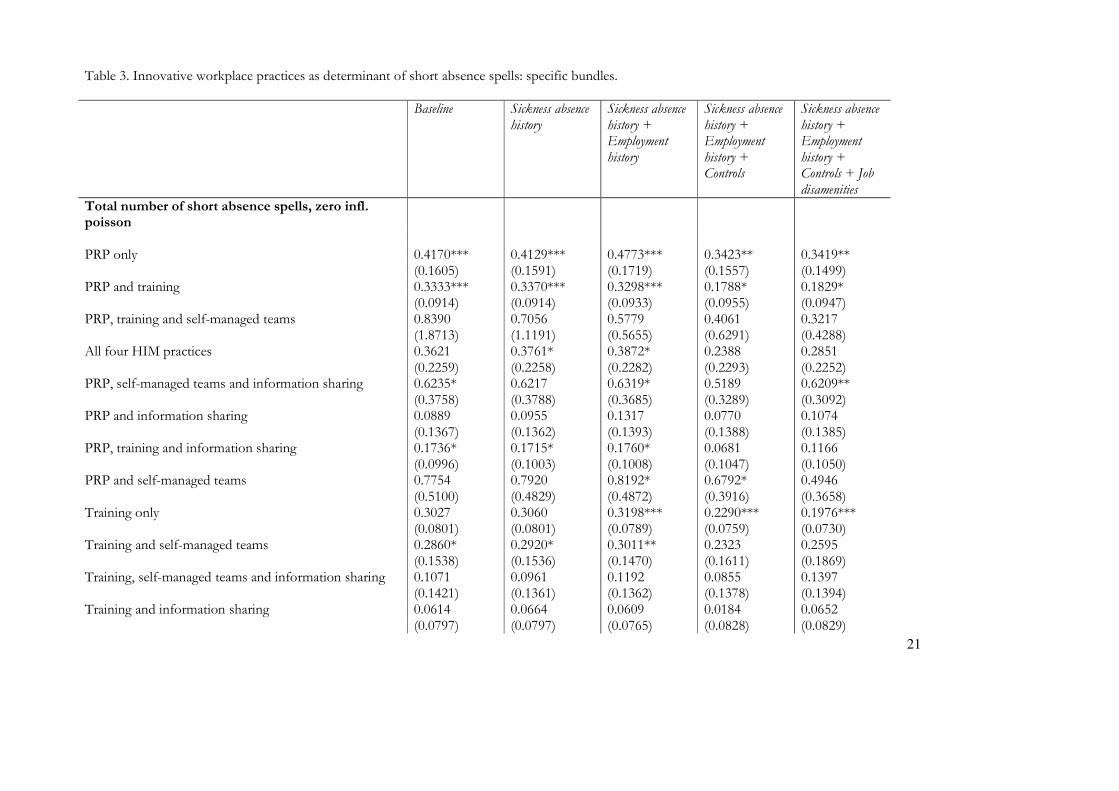
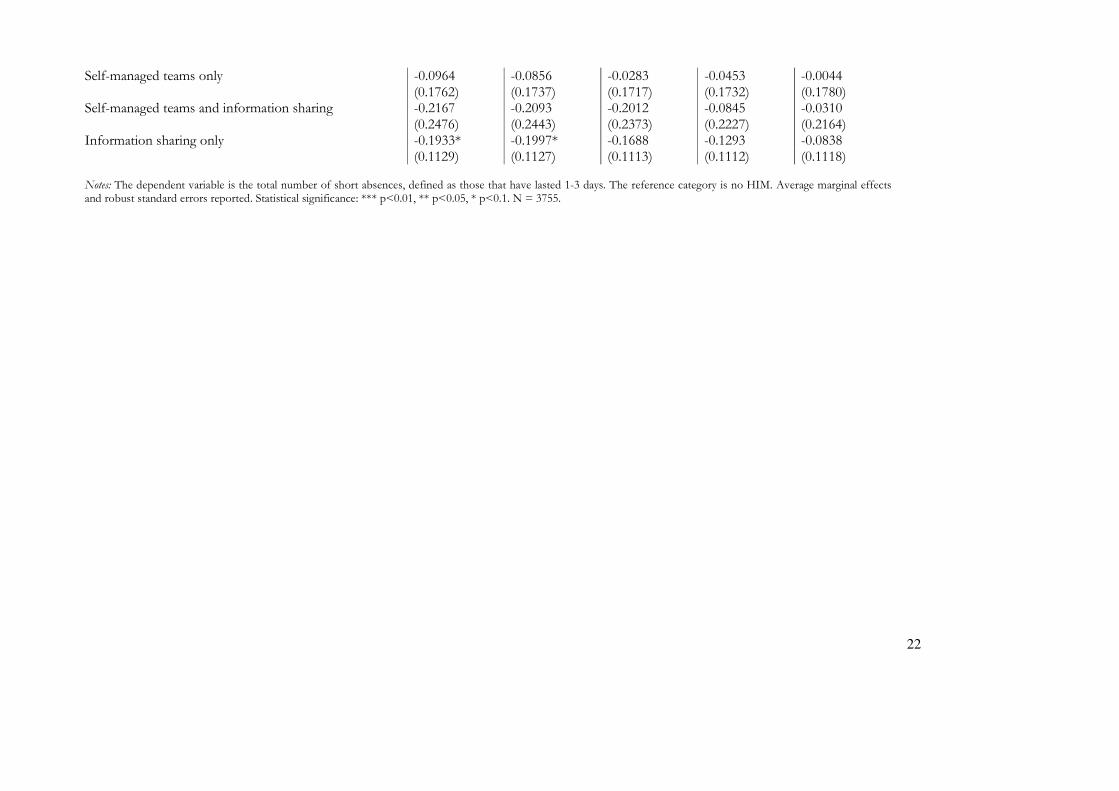
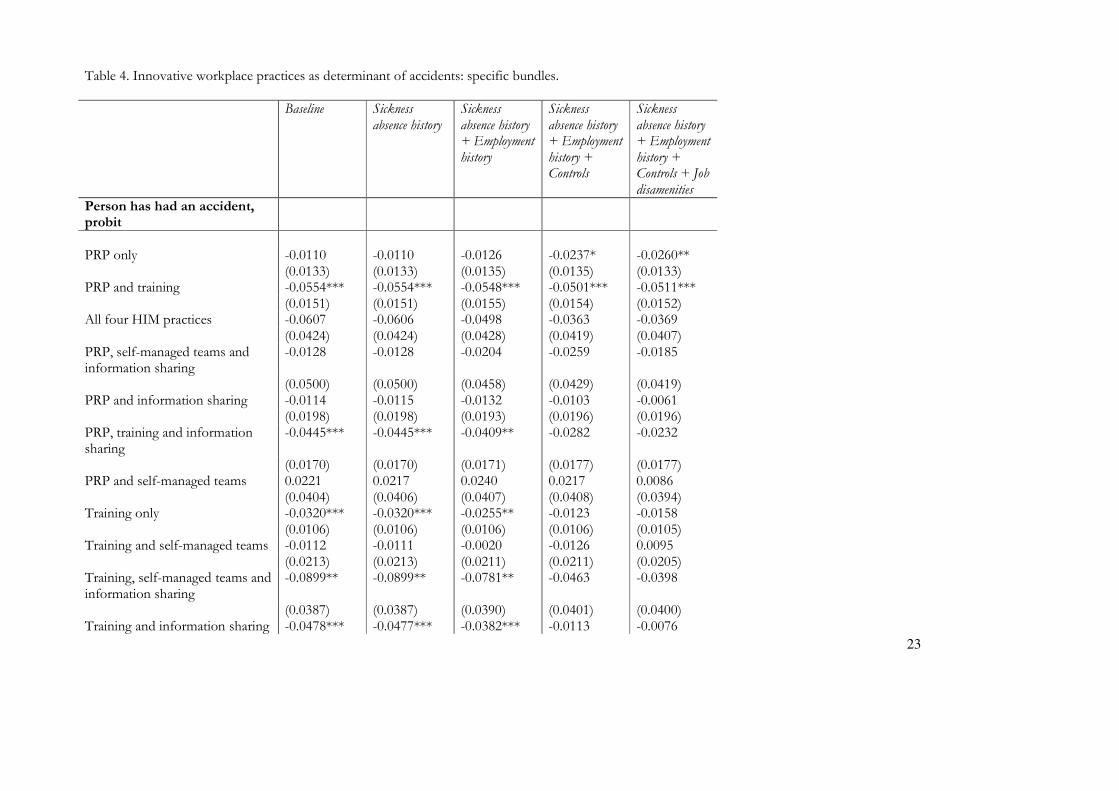
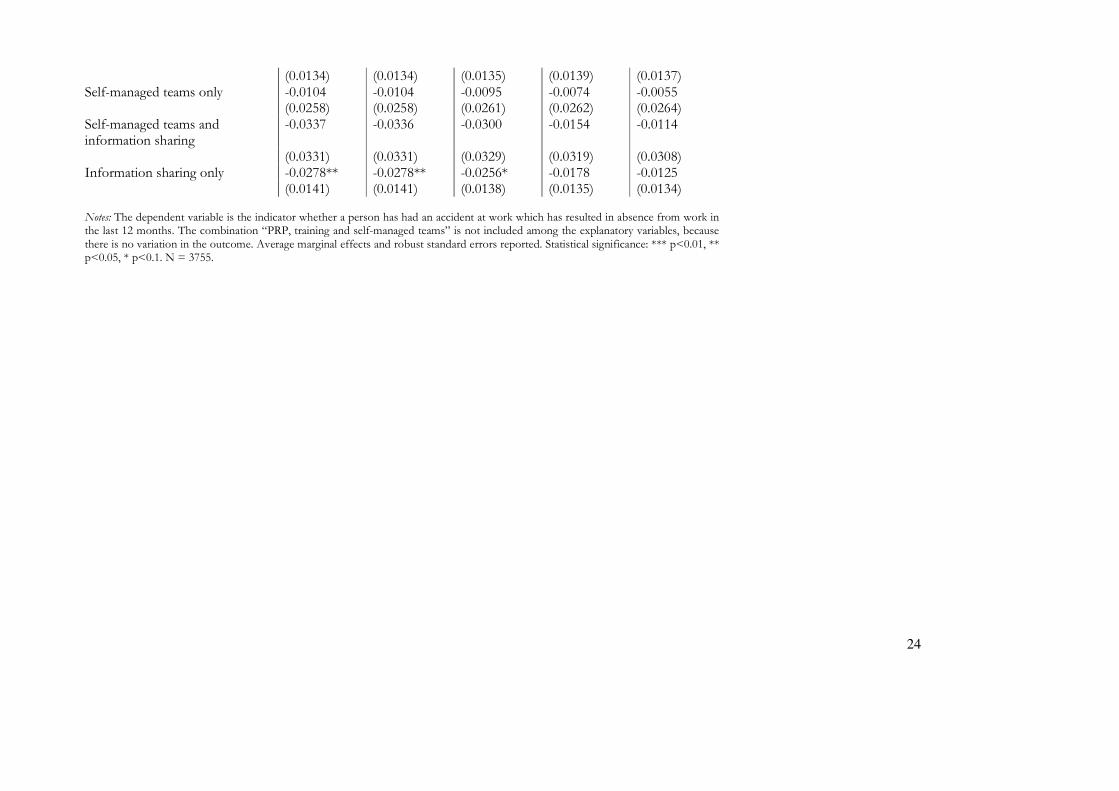
lasted 4 days or more).7 This is consistent with the possible effects of HIM practices discussed in Section 2 above.8 Table 2 shows the results for the number of days of absence reported by KELA. We present a probit for having any absences, and a tobit for the number of absence days (treating it as a continuous variable). The probit shows positive, but not significant marginal effects, while the HIM effects in the tobit estimation switch from negative to positive as we load in more controls, but they remain statistically non-significant throughout. All KELA absences are relatively long spells, thus the non-significant effects confirm the results for longer spells in the QWLS data. ==== TABLE 2 HERE ==== In Table 3 we rerun the short absences model from Table 1 but this time we consider the effects of "bundles" of the four HIM practices on the number of short absence spells. All combinations of the four HIM practices are included in the models. The reference group in all of the specifications is no HIM practices. The results reveal that it is performance-related pay (PRP) and training that are most clearly related to a higher number of short absences. The most robust results across all model specifications are the positive associations with PRP in isolation and the combination of PRP and training. The largest impact comes from PRP combined with team work and information sharing. Also Table 3 reports average marginal effects. Therefore, PRP alone, for example, increases the number of short absence spells by 40-60%, depending on the model specification9. The link between PRP and more short absences is intuitive since PRP can be thought to involve work intensification. However, the positive link to training is somewhat surprising. A possible explanation is that on-the-job training is almost always accompanied by changes or adjustments in work roles and it is these, rather than training per se, that can generate increased short absences. Alternatively, if training reduces the amount of "down-time" at work, it could be linked to labour intensification. ==== TABLE 3 HERE ==== We repeated the same kind of analysis as in Table 3 also for the number of long absence spells. (Results available on request). Overall, the HIM bundles seem to have no significant connection to long spells. When all controls were included, “PRP only” was the only HIM variable with a significant coefficient. Its relationship to spells was positive, so that PRP seems to increase both short and long spells, but when used in combination with other HIM practices, the effect is confined to short spells. Table 4 repeats the analyses in Table 3 but for having had work accidents leading to absence in the last 12 months. In many ways the results are the mirror image of those in Table 3: those "bundles" associated with a higher incidence of short-term absences are also associated with fewer accidents. PRP and training are the practices most likely to be associated with fewer accidents, the most robust result 7 We also find that adverse working conditions are strongly related with sickness absence, a finding which confirms results from a study on the 1997 QWLS (Böckerman and Ilmakunnas, 2008). Absence history is a strong predictor of the probability of current absences. There is also evidence that females have more absences, older employees have fewer absence spells although they have longer absences measured by absence days (see also Ilmakunnas et al., 2010, for age effects on absenteeism in the QWLS data), and union members are less likely to have absences. We also find more absences in larger firms. 8 We obtained evidence to support this also by estimating a model for the number of absence days, conditionally on a positive number of days. One can think of the probit model and this model for positive days as a two-part model. To guarantee that the predictions are positive, the model was estimated using the logarithm of the number of days as the dependent variable. The coefficient of HIM was negative, which is consistent with HIM increasing short absences but decreasing the long ones. 9 For example, with all the controls the workplaces with PRP only have exp(0.3419)=1.4076 times the absences of workplaces with no HIM.
12
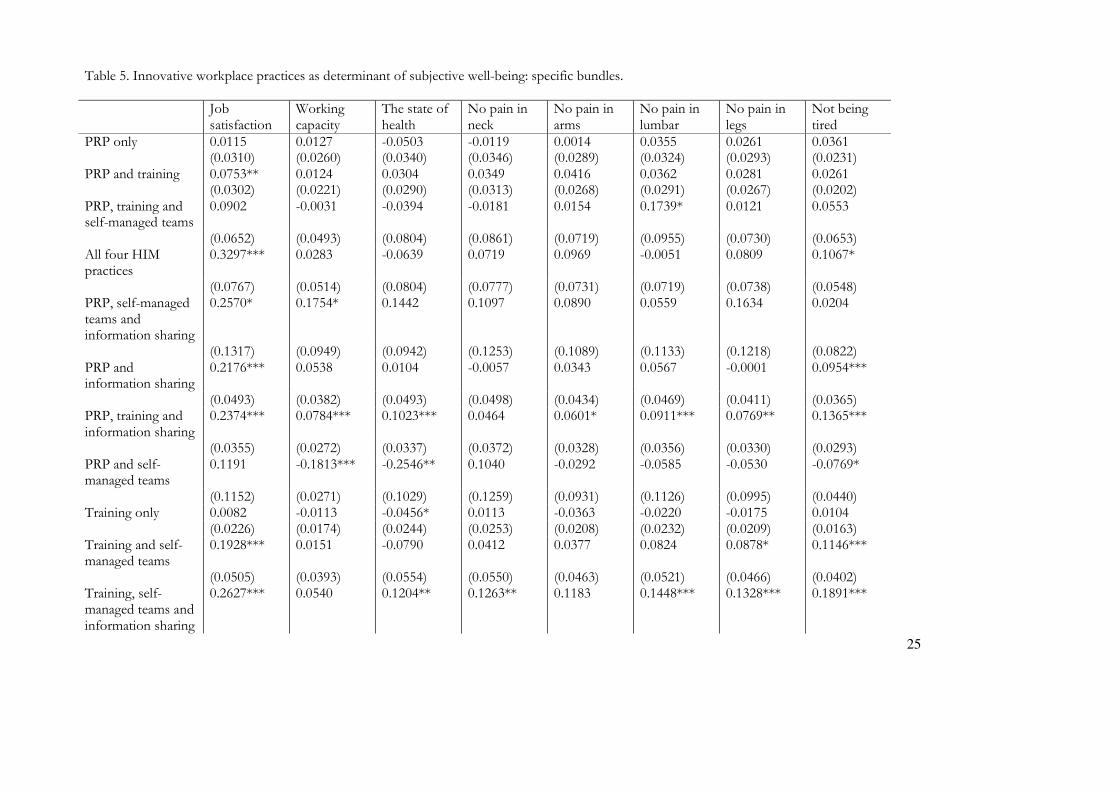
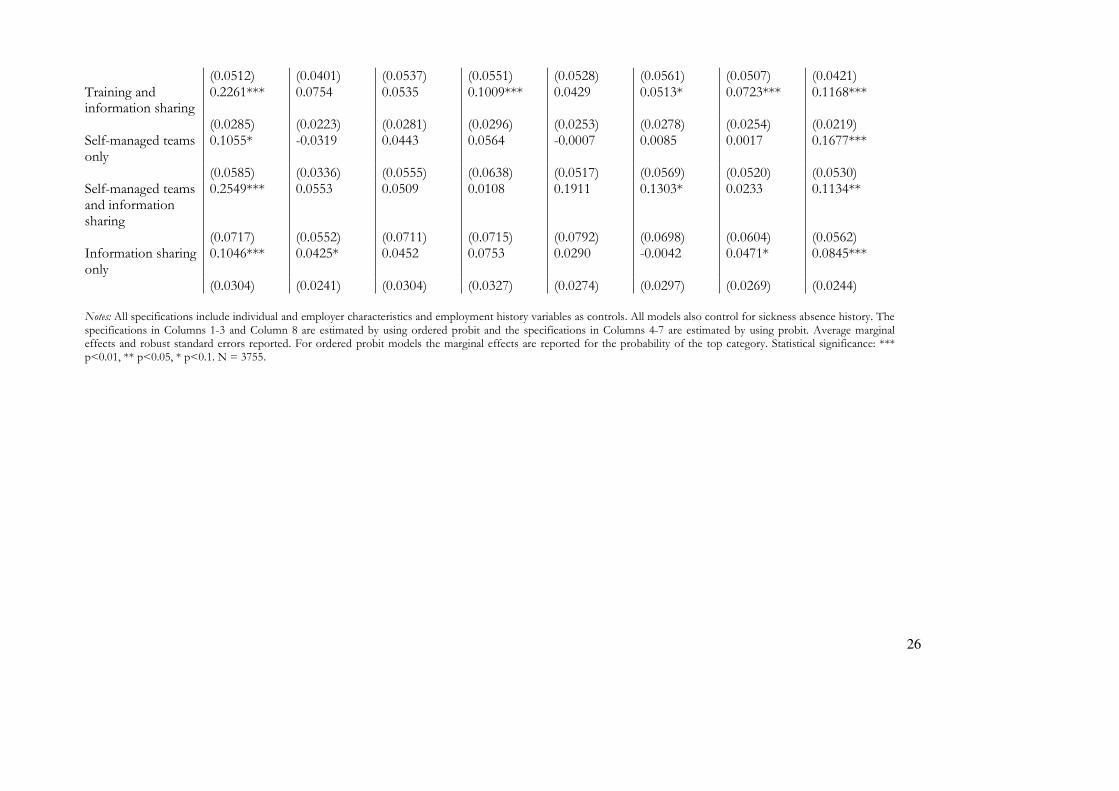
being the negative association between accidents and the "bundle" of PRP plus training. With all controls, “PRP only” and the bundle “PRP and training” were the only significant ones: both HIM regimes were negatively associated with the probability of accidents. The effects are sizeable given that slightly fewer than 5 per cent of the sample have had accidents. As noted earlier, HIM practices lead to work intensification, but also to increased control over the working environment. The former may increase accident rates, but the latter should have an opposite effect. Our finding is therefore consistent with increased control dominating intensification. ==== TABLE 4 HERE ==== To explore the relationship between absence, accidents and HIM a little further we ran bivariate probit models where the two dependent variables were having any spell of short-term absence and having any accident leading to sickness absence. The controls and model specifications are identical to those presented in Tables 3 and 4. The results are reported in Appendix Tables 2A-2B. The last row of Table 2B reports the highly statistically significant rho identifying a positive unobserved correlation between short absences and accidents. The rho is strong and robust to model specification and is something we would fully expect since employees suffering an accident at work will often need to take a short absence to recuperate. Having accounted for this correlation the results presented in Tables 3 and 4 are confirmed. The links between HIM "bundles" containing PRP or training and a higher probability of short-term absence are very well-determined, as are the links between these practices and a reduced likelihood of an accident. The negative relationship between PRP and training bundles and accidents, on the one hand, and their positive association with short absences is consistent with a safer working environment in which accidents are less likely and employees are encouraged not to practice "presenteeism" whereby they turn up for work even when they are not fully fit. This interpretation is also consistent with the fact that PRP has a much stronger effect on short absence spells than on long ones. It is plausible that accidents lead more often to long rather than short absences from work. ==== TABLE 5 HERE ==== In Table 5 we turn to subjective indicators of worker well-being and pain. The entries in the table are again the average marginal effects of the HIM variables on various well-being measures from separate specifications which use the full set of controls used in the penultimate column of Tables 3 and 4, that is, they exclude job amenities.10 Each column corresponds to a different dependent variable. In columns 1-3 and 8 the dependent variables are ordered categories, so we use ordered probit models. In columns 4-7 the dependent variables are binary, so we use probit models with the pain measures and the marginal effects from these models give the impact on the probability of not having the negative symptoms. Eleven of the fifteen HIM regimes have a positive, statistically significant association with job satisfaction, and none were negatively associated with job satisfaction (column 1). It is clear, therefore, that HIM is positively associated with employee positive affect. Column 8 provides overwhelming evidence that HIM is also associated with less likelihood of being tired: nine of the fifteen HIM regimes were positively associated with not feeling tired at work. On the other hand, only three HIM regimes were consistently associated with a lower likelihood of feeling pain on at least three of the four types of pain recorded in the survey. All three of these "bundles" included training and information sharing. HIM positive associations with work capacity and self-assessed state of one's health were less evident. The HIM "bundle" most consistently positively significantly associated with employees' wellbeing is the
10 The results reported here are not sensitive to the inclusion of job disamenities. Formatted: English (U.K.)
13
"bundle" containing PRP, training and information sharing. It was positive and statistically significant for all wellbeing outcomes in Table 5 with the exception of no neck pain. In general there is little evidence of HIM being associated with poorer employee wellbeing. But there is one exception: the combination of PRP and team working was associated with feeling more tired, having a lower self-assessed working capacity, and having a lower assessment of one's own state of health. Although we are not able to conclude that there is a causal relationship between exposure to team working allied to PRP and poorer employee wellbeing, this correlation is independent of employee demographic characteristics, the nature of the workplace, and the employees' own absence, work and earnings histories. It is also consistent with the proposition that PRP coupled with team working can incentivise workers who respond by working more intensively. The fact that this negative relationship does not show up in other bundles including these two HIM practices suggests that the effects are ameliorated when combined with training and information sharing. To explore the potential heterogeneity in the effects, we have estimated separate specifications for females and males and for young (aged less than 45) and old (aged 45 or more) workers. (The results are available on request.) It is useful to study the relationships in these groups, because the prevalence of sickness absence is at much higher level for females and old workers. Generally, there are no large differences in the results between different groups of workers. However, the effect of HIM practices on experiencing no pain in neck is not significant for the young workers. This finding is not particularly surprising, because the prevalence of neck pain is much higher for the older workers. We have also estimated a set of specifications separately for blue-collar workers and white-collar workers, defined based on socio-economic status (2000). The most interesting finding is that the white-collar workers are actually a very heterogeneous group in terms of accidents. The share of accidents is roughly 3% for the lower while-collar workers, but they are practically non-existent for the upper white-collar workers. For the lower white-collar workers the negative effect of HIM practices on accidents seems to be somewhat larger in the full sample (without adding all the controls to the model). Finally, we have splitted the full sample by using the Harm and Hazard variables and experimented with different ways to define workers who are facing substantial risk at the workplace. We obtain a very clear-cut result that the negative effect of HIM practices on accidents is roughly twice the effect in the full sample (after adding all the controls) if workers who are "at risk" are defined as those who have experiencing both harms and hazards at their workplaces. Thus, the protective effects of HIM practices are clearly more pronounced for those who are in the zone of risk. 6. Conclusions Using nationally representative survey data for Finnish employees linked to register data on their work, wage and sickness absence histories we observe that high involvement management (HIM) practices are generally positively and significantly associated with various aspects of employee wellbeing. In particular, HIM is strongly associated with higher evaluations of subjective wellbeing including higher job satisfaction and non-tiredness. HIM is also associated with a lower probability of having a workplace accident. However, HIM exposure - especially performance-related pay and training - is also associated with having more short absence spells. Although sickness absence histories predict future absence, all of these HIM effects are unaffected by conditioning on employees’ sickness absence histories. The positive association between HIM and the incidence of short absence spells is consistent with the view that for firms using HIM practices zero absences may not be optimal. Rather, the optimal absence rate may involve short spells if the firm can meet production schedules by intensifying work. On the other hand, avoiding long absences is likely to be beneficial for the firms. We find no strong evidence that HIM reduces the number of long-term absences, but we do find clear evidence that HIM practices are associated with a lower probability of having accidents at work.
14
Our results are rather positive from the employee point of view whereas the previous literature presents more mixed findings. It is plausible that the co-operation between employees and employers which characterises employment relations in Finland, together with the strong role of trade unions in implementing work reorganization, results in mutual gains for firms and workers (see also Kalmi and Kauhanen, 2008). That said the combination of PRP and team working, which is central to notions of devolved responsibilities underpinned by incentive structures, is also the HIM "bundle" most clearly associated with negative outcomes for employee wellbeing. Short-term absences and workplace accidents are positively correlated, but both are negatively correlated with HIM. This result might be driven by unobservable features of the working environment, such as having a "good" employer capable of investing in HIM, keeping absences low and minimising accidents all by virtue of good management rather than HIM per se. Future research on this issue would benefit from taking into account employer unobserved heterogeneity which may simultaneously affect worker well-being and the propensity for HIM adoption.11 Our data have only a few observations from many of the firms, thus preventing us from exploring this issue.
11 Dionne and Dostie (2007) is an example of a linked employer-employee data study where employer heterogeneity in absenteeism is accounted for.
15
References
Abowd, J. M. and Farber, H. S. (1982) “Job queues and the union status of workers”, Industrial and Labor Relations Review 35: 354-367
Allen, S. G. (1981) “Compensation, safety and absenteeism: evidence from the paper industry”, Industrial and Labor Relations Review 34: 207-218
Appelbaum, E., Bailey, T., Berg, P. and Kalleberg, A. (2000) Manufacturing Advantage: Why High-Performance Work Systems Pay Off, Ithaca, NY: Cornell University Press
Ashenfelter, O. (1978) “Estimating the Effect of Training Programs on Earnings”, Review of Economics and Statistics 60: 47-57
Askenazy P. (2001) “Innovative workplace practices and occupational injuries and illnesses in the United States”, Economic and Industrial Democracy 22: 485-516
Askenazy P. and Caroli E. (2010) “Innovative work practices, information technologies and working conditions: Evidence for France”, Industrial Relations 49: 544-565
Barker J.R. (1993) “Tightening the Iron Cage: Concertive Control in Self-Managing Teams” Administrative Science Quarterly 38: 408-37
Beer, M., Spector, B., Lawrence, P.R., Mills, Q.D., and Walton, R.E. (1984) Managing human assets, New York: Free Press
Beer, M., Spector, B., Lawrence, P.R., Mills, Q.D., and Walton, R.E. (1985) Human Resource Management: A General Manager's Perspective. New York: Free Press.
Black, S. E., Lynch, L. M. and Krivelyova, A. (2004) “How Workers Fare When Employers Innovate”, Industrial Relations 43:44-66
Bloom, N. and Van Reenen, J. (2010) “Human Resource Management and Productivity”’, CEP Discussion Paper No. 982, London School of Economics
Bloom, N. and Van Reenen, J. (2007) ”Measuring and Explaining Management Practices across Firms and Countries”, The Quarterly Journal of Economics122: 1351-1408
Bockerman, P., Johansson, E. and Kauhanen, A. (2009) Innovative Work Practices and Sickness Absence: What Does A Nationally Representative Employee Survey Tell?, Labour Institute for Economic Research Discussion Paper No. 255
Bockerman, P. and Ilmakunnas, P. (2008) “Interaction of working conditions, job satisfaction and sickness absences: evidence from a representative sample of employees”, Social Science & Medicine 67: 520-528
Bordia, P., Hunt, E., Paulsen, N., Tourish, D., DiFonzo, N. (2004) “Uncertainty during organizational change: is it all about control?”, European Journal of Work and Organizational Psychology 13: 345–365
Brenner, M. D, Fairris, D. and Ruser J. (2004) “Flexible work practices and occupational safety and health: Exploring the relationship between cumulative trauma disorders and workplace transformation", Industrial Relations 43: 242-266
Bryson, A., Dale-Olsen, H. and Barth, E. (2009) “How Does Innovation Affect Worker Well-being?”, CEP Discussion Paper No. 953
16
Bryson, A. Gomez, R.., Kretschmer, T. and Willman, P. (2007) “The Diffusion of Workplace Voice and High-Commitment Human Resource Management Practices in Britain, 1984-1998”, Industrial and Corporate Change 16: 395-426
Coles, M., Lanfranchi, J., Skalli, A. and Treble, J. (2007) “Pay, technology, and the cost of worker absence”, Economic Inquiry 45: 268-285
Coles, M. A. and Treble, J. (1996) “Calculating the price of worker reliability”, Labour Economics 3: 169-188
Dionne, G. and Dostie, B. (2007) “New Evidence on the Determinants of Absenteeism Using Linked Employer-Employee Data”, Industrial and Labor Relations Review 61: 108-120
Drago, R. and Wooden, M. (1992) “The Determinants of Labor Absence: Economic Factors and Workgroup Norms Across Countries”, Industrial and Labor Relations Review 45: 764-778
Fairris, D. and Brenner, M. (2001) “Workplace transformation and the rise in cumulative trauma disorders: Is there a connection?”, Journal of Labor Research 22: 15-28
Farber, H. S. (1983) “The determination of union status of workers”, Econometrica 51: 1417-1438
Freeman, R. and Kleiner, M. (2005) “The Last American Shoe Manufacturers: Decreasing Productivity and Increasing Profits in the Shift from Piece Rates to Continuous Flow Production,” Industrial Relations 44: 307-330
Frick, B. and Simmons, R. (2010) “The Hidden Costs of High Performance Work Practices: Evidence from a Large German Steel Company”, mimeo
Gallie, D. (2005) “Work Pressure in Europe 1996-2001: Trends and Determinants”, British Journal of Industrial Relations 43: 351-375
Gimeno, D., Benavides, F. G., Benach, J., and Amick, B. C. (2004) “Distribution of sickness absence in the European Union countries”, Occupational and Environmental Medicine 61: 211-227
Godard, J. (2001) “The transformation of work and high performance? The implications of alternative work practices for the experience and outcomes of work” Industrial and Labor Relations Review 54: 776-805
Godard, J. (2004) “A Critical Assessment of the High-Performance Paradigm”, British Journal of Industrial Relations 42: 349-378
Godard, J. (2010) “What Is Best For Workers? The Implications of Workplace and Human Resource Management Practices Revisited”, Industrial Relations, Vol. 49, 3: 466-488
Green, C. and J. S. Heywood (2008) “Does performance pay increase job satisfaction?”, Economica 75: 710-728
Green, G. F. (2009) “The Non-material Aspects of the Employee Work Experience: Trends and Distribution”, Chapter 2 in K. Whitfield (ed.) Employee Wellbeing and Working Life: Towards an Evidence-based Policy Agenda
Green, G. F. (2006). Demanding Work. The Paradox of Job Quality in the Affluent Economy. Woodstock, Princeton University Press
Green, G. F. and N. Tsitsianis (2005) “An investigation of national trends in job satisfaction in Britain and Germany” British Journal of Industrial Relations 43: 401-429
17
Handel, M. J. and Levine, D. I. (2004) “Editors’ Introduction: The Effects of New Work Practices on Workers”, Industrial Relations 43: 1-43
Handel, M. J. and Levine, D. I. (2006) “The Effects of New Work Practices on Workers”, Institute for Research on Labor and Employment Working Paper Series #131, University of Berkeley California, http://repositories.cdlib.org/cgi/viewcontent.cgi?article=1130&context=iir
Heckman, J., Ichimura, H., Smith, J. and Todd, P. (1998) “Characterizing selection bias using experimental data”, Econometrica 66: 1017-1098
Heywood, J. S. and Jirjahn, U. (2004) “Teams, teamwork and absence”, Scandinavian Journal of Economics 106: 765-782
Ilmakunnas, P., van Ours, J., Skirbekk, V., and Weiss, M. (2010) ”Age and productivity”, in P. Garibaldi, J. Oliveira Martins, and J. van Ours, (eds.) Ageing, Health, and Productivity, Oxford University Press, 133-240
Jones, M. K., Jones, R. J., Latreille, P. L. and Sloane, P. J. (2009) “Training, job satisfaction, and workplace performance in Britain: Evidence from WERS 2004”, Labour: Review of Labour Economics and Industrial Relations 23: 139-175 Kalmi, P. and Kauhanen, A. (2008) “Workplace Innovations and Employee Outcomes: Evidence from Finland”, Industrial Relations 47: 430-549
Kahneman, D., Diener, E. and Schwarz, N. (1999) Well-being: The Foundation of Hedonic Psychology, New York: Russell Sage Foundation
Kahneman, D. and Krueger, A. B. (2006) ‘Developments in the measurement of subjective well-being’, Journal of Economic Perspectives 20: 3-24
Kahneman, D., Krueger, A. B., Schkade, D. A., Schwarz, N. and Stone, A. A. (2004) “A Survey Method for Characterising Daily Life Experience: The Day Reconstruction Method”, Science 306: 1776-1780
Karasek, R. A. (1979) “Job Demands, Job Decision Latitude, and Mental Strain: Implications for Job Redesign”, Administrative Science Quarterly 24: 285-308
Karasek, R. and T. Theorell (1990) Healthy Work, New York: Basic Books Kandel, E. and E.P. Lazear (1992) Peer Pressure in Partnerships. Journal of Political Economy 100: 801-817 Knez, M. and D. Simester (2001) Firm-Wide Incentives and Mutual Monitoring at Continental Airlines. Journal of Labor Economics 19: 743-772 Lanfranchi, J. and Treble, J. (2010) “Just-in-time production, work organization and absence control”, The Manchester School, Vol. 78, 5: 460-483 Lazear, E. P. (2000) “Performance Pay and Productivity,” American Economic Review 90:1346-1361
Lechner, M. and Wunsch, C. (2010) “Which control variables do we really need for matching based evaluations of labour market programmes?”, University of St. Gallen mimeo
Lehto, A-M and Sutela, H. (2009) Three Decades of Working Conditions: Findings of Finnish Quality of Work Life Surveys 1977-2008. Statistics Finland: Helsinki
18
Llena-Nozal, A. (2009) “The Effect of Work Status and Working Conditions on Mental Health in Four OECD Countries”, National Institute Economic Review 209: 72-87
Merriman, K. K. and Deckop, J. R. (2007) “Loss aversion and variable pay: a motivational perspective”, International Journal of Human Resource Management 18: 1026-1041
Mohr, R. D. and Zoghi, C. (2008) “High-involvement work design and job satisfaction”, Industrial and Labor Relations Review, 61, 3: 275-296
Oswald, A. J. (2010) “Emotional Prosperity and the Stiglitz Commission”, British Journal of Industrial Relations 48: 651-669
Oswald, A. J., Proto, E. and Sgroi, D. (2009) “Happiness and Productivity”, IZA Discussion Paper No. 4645
Payne, R. L. (1979) “Demands, Supports, Constraints and Psychological Health”, in C. J. Mackay and T. Cox (eds), In Response to Stress: Occupational Aspects,London, IPC Business Press, 85–105 Pfeffer, J. (1998) The Human Equation. Boston: Harvard Business School Press.
Pollard, T. M. (2001) “Changes in mental well-being, blood pressure and total cholesterol levels during workplace reorganization: the impact of uncertainty”, Work and Stress 15: 14-28
Prendergast, C. (1999) “The Provision of Incentives in Firms”, Journal of Economic Literature 37: 7-63
Ramsey, H., Scholarios, D. and Harley, B. (2000) “Employees and high-performance work systems: Testing inside the black box”, British Journal of Industrial Relations 38: 501-32
Rice, R. W., Near, J. P. and Hunt, R. G. (1980) “The Job Satisfaction/Life Satisfaction Relationship: A Review of Empirical Research”, Basic and Applied Social Psychology 1: 37-64
Walton, R.E. (1985) “From ‘Control’ to ‘Commitment’ in the Workplace”, Harvard Business Review 63: 77–84 Walton, R.E. (1987) Innovating to Compete, London: Jossey-Bass. Warr, P. (2007) Work, Happiness, and Unhappiness, Mahwah: New Jersey Wood, S. (2008) “Job characteristics, employee voice and wellbeing in Britain”, Industrial Relations Journal, 39: 2, 153-168 Wood, S. and Bryson, A. (2009) “High involvement management”, Chapter 7 in W. Brown, A. Bryson, J. Forth and K. Whitfield (eds.) The Evolution of the Modern Workplace, Cambridge University Press, 151-175
19
Table 1. Innovative workplace practices as determinant of sickness absence (QWLS). Baseline Sickness absence
history Sickness absence history + Employment history
Sickness absence history + Employment history + Controls
Sickness absence history + Employment history + Controls + Job disamenities
Panel A: Any absence, probit Any HIM v none 0.0455** 0.0464** 0.0466** 0.0251 0.0316 (0.0191) (0.0191) (0.0193) (0.0195) (0.0195) Panel B: Total number of absence spells, zero infl. poisson
Any HIM v none 0.1374** 0.1483** 0.1523** 0.1193* 0.1496** (0.0694) (0.0688) (0.0678) (0.0683) (0.0667) Panel C: Total number of long absence spells, zero infl. poisson
Any HIM v none -0.0451 -0.0413 -0.0456 -0.0125 0.0071 (0.0370) (0.0360) (0.0356) (0.0328) (0.0331) Panel D: Total number of short absence spells, zero infl. poisson
Any HIM v none 0.1931*** 0.1945*** 0.2022*** 0.1301** 0.1402*** (0.0533) (0.0533) (0.0529) (0.0540) (0.0534)
Notes: In Panel A the dependent variable is the indicator for a positive number of absence in QWLS 2003. In Panel B the dependent variable is the total number of sickness absence spells in QWLS 2003. In Panel C long absences are those that have lasted for 4 days or more and in Panel D short absences are those that have lasted 1-3 days. Sickness absence history refers to the total number of sickness absence days over the period 1995-2001, as recorded by KELA. Employment history refers to variables that describe past labour market experiences. Controls consist of the individual and employer characteristics described in Appendix Table 1. Job disamenities refer to Harm, Hazard and Uncertainty, as explained in the text. The specifications in Column 1 contain the HIM indicator only. Average marginal effects and robust standard errors reported. Statistical significance: *** p<0.01, ** p<0.05, * p<0.1. N = 3755.
20
Table 2. Innovative workplace practices as determinant of sickness absence (KELA). Baseline Sickness
absence history Sickness absence history + Employment history
Sickness absence history + Employment history + Controls
Sickness absence history + Employment history + Controls + Job disamenities
Panel A: Any absence, probit
Any HIM v none 0.0026 0.0055 -0.0017 0.0057 0.0104 (0.0126) (0.0122) (0.0128) (0.0125) (0.0122) Panel B: Total number of absence days, tobit
Any HIM v none -0.1937 -0.0086 -0.4776 0.0138 0.3339 (0.7183) (0.6967) (0.7025) (0.7022) (0.6916)
Notes: In Panel A the dependent variable is the indicator for a positive number of absence in 2003, as recorded by KELA. In Panel B the dependent variable is the total number of days with sickness allowance in 2003, as recorded by KELA. Average marginal effects and robust standard errors reported. Statistical significance: *** p<0.01, ** p<0.05, * p<0.1. N = 3755.
21
Table 3. Innovative workplace practices as determinant of short absence spells: specific bundles. Baseline Sickness absence
history Sickness absence history + Employment history
Sickness absence history + Employment history + Controls
Sickness absence history + Employment history + Controls + Job disamenities
Total number of short absence spells, zero infl. poisson
PRP only 0.4170*** 0.4129*** 0.4773*** 0.3423** 0.3419** (0.1605) (0.1591) (0.1719) (0.1557) (0.1499) PRP and training 0.3333*** 0.3370*** 0.3298*** 0.1788* 0.1829* (0.0914) (0.0914) (0.0933) (0.0955) (0.0947) PRP, training and self-managed teams 0.8390 0.7056 0.5779 0.4061 0.3217 (1.8713) (1.1191) (0.5655) (0.6291) (0.4288) All four HIM practices 0.3621 0.3761* 0.3872* 0.2388 0.2851 (0.2259) (0.2258) (0.2282) (0.2293) (0.2252) PRP, self-managed teams and information sharing 0.6235* 0.6217 0.6319* 0.5189 0.6209** (0.3758) (0.3788) (0.3685) (0.3289) (0.3092) PRP and information sharing 0.0889 0.0955 0.1317 0.0770 0.1074 (0.1367) (0.1362) (0.1393) (0.1388) (0.1385) PRP, training and information sharing 0.1736* 0.1715* 0.1760* 0.0681 0.1166 (0.0996) (0.1003) (0.1008) (0.1047) (0.1050) PRP and self-managed teams 0.7754 0.7920 0.8192* 0.6792* 0.4946 (0.5100) (0.4829) (0.4872) (0.3916) (0.3658) Training only 0.3027 0.3060 0.3198*** 0.2290*** 0.1976*** (0.0801) (0.0801) (0.0789) (0.0759) (0.0730) Training and self-managed teams 0.2860* 0.2920* 0.3011** 0.2323 0.2595 (0.1538) (0.1536) (0.1470) (0.1611) (0.1869) Training, self-managed teams and information sharing 0.1071 0.0961 0.1192 0.0855 0.1397 (0.1421) (0.1361) (0.1362) (0.1378) (0.1394) Training and information sharing 0.0614 0.0664 0.0609 0.0184 0.0652 (0.0797) (0.0797) (0.0765) (0.0828) (0.0829)
22
Self-managed teams only -0.0964 -0.0856 -0.0283 -0.0453 -0.0044 (0.1762) (0.1737) (0.1717) (0.1732) (0.1780) Self-managed teams and information sharing -0.2167 -0.2093 -0.2012 -0.0845 -0.0310 (0.2476) (0.2443) (0.2373) (0.2227) (0.2164) Information sharing only -0.1933* -0.1997* -0.1688 -0.1293 -0.0838 (0.1129) (0.1127) (0.1113) (0.1112) (0.1118)
Notes: The dependent variable is the total number of short absences, defined as those that have lasted 1-3 days. The reference category is no HIM. Average marginal effects and robust standard errors reported. Statistical significance: *** p<0.01, ** p<0.05, * p<0.1. N = 3755.
23
Table 4. Innovative workplace practices as determinant of accidents: specific bundles. Baseline Sickness
absence history Sickness absence history + Employment history
Sickness absence history + Employment history + Controls
Sickness absence history + Employment history + Controls + Job disamenities
Person has had an accident, probit
PRP only -0.0110 -0.0110 -0.0126 -0.0237* -0.0260** (0.0133) (0.0133) (0.0135) (0.0135) (0.0133) PRP and training -0.0554*** -0.0554*** -0.0548*** -0.0501*** -0.0511*** (0.0151) (0.0151) (0.0155) (0.0154) (0.0152) All four HIM practices -0.0607 -0.0606 -0.0498 -0.0363 -0.0369 (0.0424) (0.0424) (0.0428) (0.0419) (0.0407) PRP, self-managed teams and information sharing
-0.0128 -0.0128 -0.0204 -0.0259 -0.0185
(0.0500) (0.0500) (0.0458) (0.0429) (0.0419) PRP and information sharing -0.0114 -0.0115 -0.0132 -0.0103 -0.0061 (0.0198) (0.0198) (0.0193) (0.0196) (0.0196) PRP, training and information sharing
-0.0445*** -0.0445*** -0.0409** -0.0282 -0.0232
(0.0170) (0.0170) (0.0171) (0.0177) (0.0177) PRP and self-managed teams 0.0221 0.0217 0.0240 0.0217 0.0086 (0.0404) (0.0406) (0.0407) (0.0408) (0.0394) Training only -0.0320*** -0.0320*** -0.0255** -0.0123 -0.0158 (0.0106) (0.0106) (0.0106) (0.0106) (0.0105) Training and self-managed teams -0.0112 -0.0111 -0.0020 -0.0126 0.0095 (0.0213) (0.0213) (0.0211) (0.0211) (0.0205) Training, self-managed teams and information sharing
-0.0899** -0.0899** -0.0781** -0.0463 -0.0398
(0.0387) (0.0387) (0.0390) (0.0401) (0.0400) Training and information sharing -0.0478*** -0.0477*** -0.0382*** -0.0113 -0.0076
24
(0.0134) (0.0134) (0.0135) (0.0139) (0.0137) Self-managed teams only -0.0104 -0.0104 -0.0095 -0.0074 -0.0055 (0.0258) (0.0258) (0.0261) (0.0262) (0.0264) Self-managed teams and information sharing
-0.0337 -0.0336 -0.0300 -0.0154 -0.0114
(0.0331) (0.0331) (0.0329) (0.0319) (0.0308) Information sharing only -0.0278** -0.0278** -0.0256* -0.0178 -0.0125 (0.0141) (0.0141) (0.0138) (0.0135) (0.0134)
Notes: The dependent variable is the indicator whether a person has had an accident at work which has resulted in absence from work in the last 12 months. The combination “PRP, training and self-managed teams” is not included among the explanatory variables, because there is no variation in the outcome. Average marginal effects and robust standard errors reported. Statistical significance: *** p<0.01, ** p<0.05, * p<0.1. N = 3755.
25
Table 5. Innovative workplace practices as determinant of subjective well-being: specific bundles.
Job satisfaction
Working capacity
The state of health
No pain in neck
No pain in arms
No pain in lumbar
No pain in legs
Not being tired
PRP only 0.0115 0.0127 -0.0503 -0.0119 0.0014 0.0355 0.0261 0.0361 (0.0310) (0.0260) (0.0340) (0.0346) (0.0289) (0.0324) (0.0293) (0.0231) PRP and training 0.0753** 0.0124 0.0304 0.0349 0.0416 0.0362 0.0281 0.0261 (0.0302) (0.0221) (0.0290) (0.0313) (0.0268) (0.0291) (0.0267) (0.0202) PRP, training and self-managed teams
0.0902 -0.0031 -0.0394 -0.0181 0.0154 0.1739* 0.0121 0.0553
(0.0652) (0.0493) (0.0804) (0.0861) (0.0719) (0.0955) (0.0730) (0.0653) All four HIM practices
0.3297*** 0.0283 -0.0639 0.0719 0.0969 -0.0051 0.0809 0.1067*
(0.0767) (0.0514) (0.0804) (0.0777) (0.0731) (0.0719) (0.0738) (0.0548) PRP, self-managed teams and information sharing
0.2570* 0.1754* 0.1442 0.1097 0.0890 0.0559 0.1634 0.0204
(0.1317) (0.0949) (0.0942) (0.1253) (0.1089) (0.1133) (0.1218) (0.0822) PRP and information sharing
0.2176*** 0.0538 0.0104 -0.0057 0.0343 0.0567 -0.0001 0.0954***
(0.0493) (0.0382) (0.0493) (0.0498) (0.0434) (0.0469) (0.0411) (0.0365) PRP, training and information sharing
0.2374*** 0.0784*** 0.1023*** 0.0464 0.0601* 0.0911*** 0.0769** 0.1365***
(0.0355) (0.0272) (0.0337) (0.0372) (0.0328) (0.0356) (0.0330) (0.0293) PRP and self-managed teams
0.1191 -0.1813*** -0.2546** 0.1040 -0.0292 -0.0585 -0.0530 -0.0769*
(0.1152) (0.0271) (0.1029) (0.1259) (0.0931) (0.1126) (0.0995) (0.0440) Training only 0.0082 -0.0113 -0.0456* 0.0113 -0.0363 -0.0220 -0.0175 0.0104 (0.0226) (0.0174) (0.0244) (0.0253) (0.0208) (0.0232) (0.0209) (0.0163) Training and self-managed teams
0.1928*** 0.0151 -0.0790 0.0412 0.0377 0.0824 0.0878* 0.1146***
(0.0505) (0.0393) (0.0554) (0.0550) (0.0463) (0.0521) (0.0466) (0.0402) Training, self-managed teams and information sharing
0.2627*** 0.0540 0.1204** 0.1263** 0.1183 0.1448*** 0.1328*** 0.1891***
26
(0.0512) (0.0401) (0.0537) (0.0551) (0.0528) (0.0561) (0.0507) (0.0421) Training and information sharing
0.2261*** 0.0754 0.0535 0.1009*** 0.0429 0.0513* 0.0723*** 0.1168***
(0.0285) (0.0223) (0.0281) (0.0296) (0.0253) (0.0278) (0.0254) (0.0219) Self-managed teams only
0.1055* -0.0319 0.0443 0.0564 -0.0007 0.0085 0.0017 0.1677***
(0.0585) (0.0336) (0.0555) (0.0638) (0.0517) (0.0569) (0.0520) (0.0530) Self-managed teams and information sharing
0.2549*** 0.0553 0.0509 0.0108 0.1911 0.1303* 0.0233 0.1134**
(0.0717) (0.0552) (0.0711) (0.0715) (0.0792) (0.0698) (0.0604) (0.0562) Information sharing only
0.1046*** 0.0425* 0.0452 0.0753 0.0290 -0.0042 0.0471* 0.0845***
(0.0304) (0.0241) (0.0304) (0.0327) (0.0274) (0.0297) (0.0269) (0.0244)
Notes: All specifications include individual and employer characteristics and employment history variables as controls. All models also control for sickness absence history. The specifications in Columns 1-3 and Column 8 are estimated by using ordered probit and the specifications in Columns 4-7 are estimated by using probit. Average marginal effects and robust standard errors reported. For ordered probit models the marginal effects are reported for the probability of the top category. Statistical significance: *** p<0.01, ** p<0.05, * p<0.1. N = 3755.
27
Appendix 1. The Finnish sickness insurance system. When an employee becomes sick, he/she has to provide a doctor’s note on sick leave, usually after the first day of sickness. After the first day, there is a nine working days’ (including Saturdays, but not Sundays or public holidays) waiting period until the employee is eligible to sickness allowance from the Social Insurance Institution (KELA). During this period, the employee gets his/her pay from the employer, if the employment relationship has lasted at least a month. If it has lasted less than a month, the employee obtains 50% of the pay. This waiting period is waived if the same sickness has already caused absence in the previous 30 days. After the waiting period the employee starts to get an earnings-related sickness allowance. However, most labour contracts stipulate that the firms actually continue to pay the employees much longer than the waiting period. The length of the pay usually depends on length of tenure. For example, according to the metal workers’ contract, workers with tenure over one month but less than 3 years are paid for 28 calendar days, workers with tenure of at least 3 years but less than 5 years are paid for 35 days, those with tenure of at least 5 but less than 10 years are paid for 42 days, and the workers with at least 10 years’ tenure get paid for 56 calendar days. The exact rules vary across contracts. When the employees get their pay even after the waiting period, the employer gets the sickness allowance. After 60 work days (approximately 80 calendar days) on sickness allowance there is an assessment of rehabilitation needs. If the employee goes to rehabilitation, sickness allowance ends and he/she gets rehabilitation allowance. The maximum period for sickness allowance is 300 working days (approximately a full calendar year); all allowance days within the last 2 years are counted to this. After this maximum has been reached, there is an assessment of eligibility to disability pension. The person can get sickness allowance again only after having worked for at least a year. The sickness allowance is based on past earnings (previous year or previous months if earnings have increased). Work-related expenses are deducted from earnings, and in addition a deduction is made to account for pension and unemployment insurance contributions. In 2003 (the year of the QWLS survey from which we have also the survey information on absences) the allowance was calculated in the following way. A 4.8% deduction of earnings was first used for the insurance contributions. There was no daily allowance if annual earnings were below € 1004; in the range € 1004-26124 the allowance was 0.7*earnings/300; in the range € 26125-40192 it was 60.96 + 0.4*(earnings-26124)/300; finally for annual earnings over € 40192 the daily allowance was 79.71 + 0.25*(earnings-40192)/300. Therefore, the replacement rate falls with earnings. Those receiving no allowance or a very low one could get minimum allowance € 11.45 after 55 days’ sickness. Over time, there have been changes in the earnings limits and replacement rates. Source: KELA (The Social Insurance Institution of Finland), A Guide to Benefits 2003.
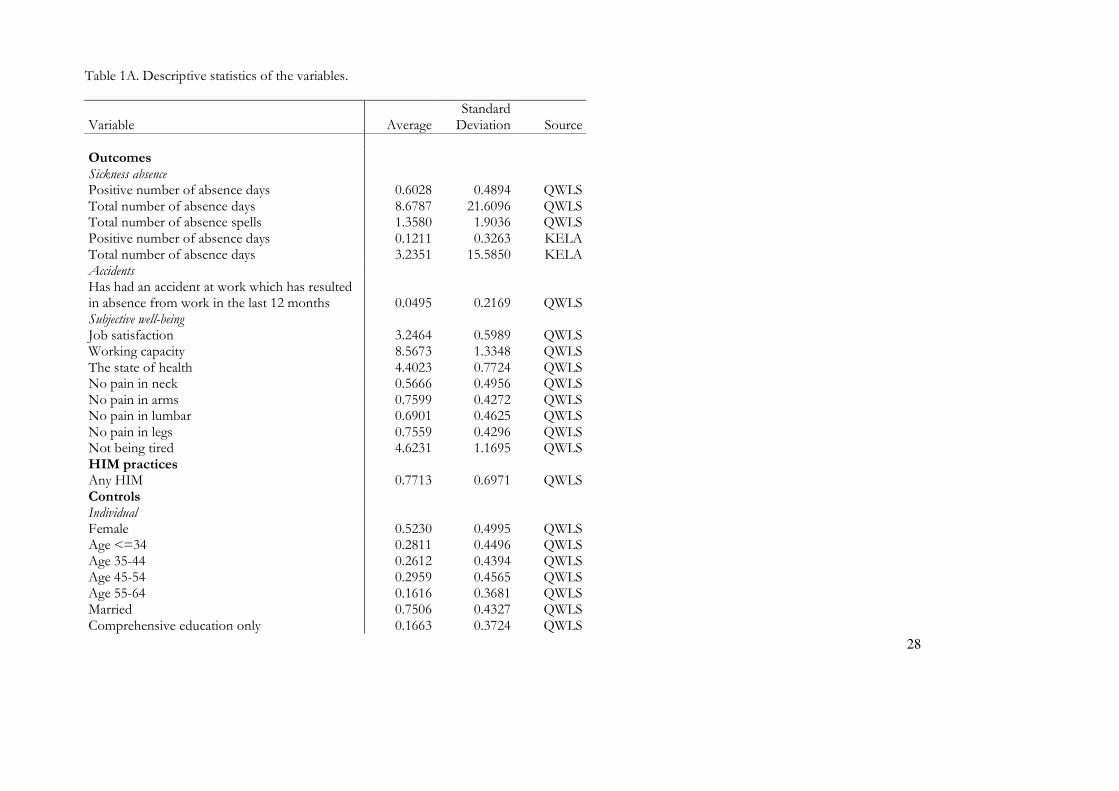
28
Table 1A. Descriptive statistics of the variables.
Variable Average Standard Deviation Source
Outcomes Sickness absence Positive number of absence days 0.6028 0.4894 QWLS Total number of absence days 8.6787 21.6096 QWLS Total number of absence spells 1.3580 1.9036 QWLS Positive number of absence days 0.1211 0.3263 KELA Total number of absence days 3.2351 15.5850 KELA Accidents Has had an accident at work which has resulted in absence from work in the last 12 months 0.0495 0.2169 QWLS Subjective well-being Job satisfaction 3.2464 0.5989 QWLS Working capacity 8.5673 1.3348 QWLS The state of health 4.4023 0.7724 QWLS No pain in neck 0.5666 0.4956 QWLS No pain in arms 0.7599 0.4272 QWLS No pain in lumbar 0.6901 0.4625 QWLS No pain in legs 0.7559 0.4296 QWLS Not being tired 4.6231 1.1695 QWLS HIM practices Any HIM 0.7713 0.6971 QWLS Controls Individual Female 0.5230 0.4995 QWLS Age <=34 0.2811 0.4496 QWLS Age 35-44 0.2612 0.4394 QWLS Age 45-54 0.2959 0.4565 QWLS Age 55-64 0.1616 0.3681 QWLS Married 0.7506 0.4327 QWLS Comprehensive education only 0.1663 0.3724 QWLS
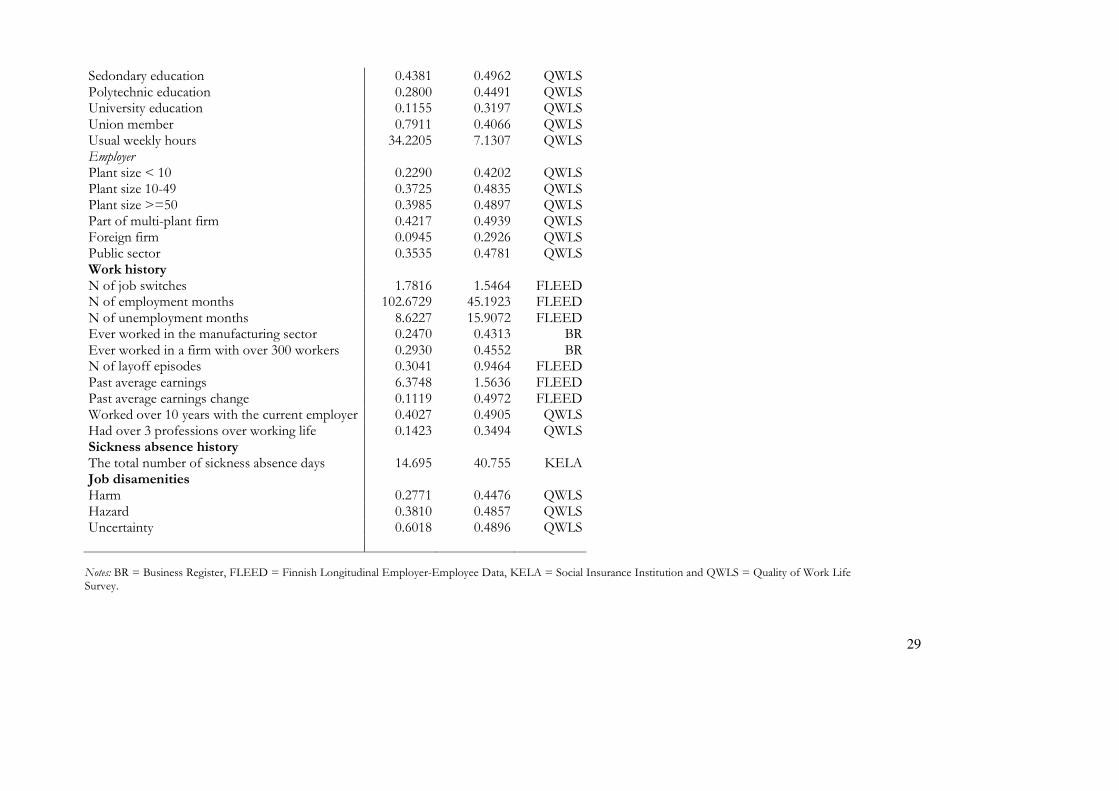
29
Sedondary education 0.4381 0.4962 QWLS Polytechnic education 0.2800 0.4491 QWLS University education 0.1155 0.3197 QWLS Union member 0.7911 0.4066 QWLS Usual weekly hours 34.2205 7.1307 QWLS Employer Plant size < 10 0.2290 0.4202 QWLS Plant size 10-49 0.3725 0.4835 QWLS Plant size >=50 0.3985 0.4897 QWLS Part of multi-plant firm 0.4217 0.4939 QWLS Foreign firm 0.0945 0.2926 QWLS Public sector 0.3535 0.4781 QWLS Work history N of job switches 1.7816 1.5464 FLEED N of employment months 102.6729 45.1923 FLEED N of unemployment months 8.6227 15.9072 FLEED Ever worked in the manufacturing sector 0.2470 0.4313 BR Ever worked in a firm with over 300 workers 0.2930 0.4552 BR N of layoff episodes 0.3041 0.9464 FLEED Past average earnings 6.3748 1.5636 FLEED Past average earnings change 0.1119 0.4972 FLEED Worked over 10 years with the current employer 0.4027 0.4905 QWLS Had over 3 professions over working life 0.1423 0.3494 QWLS Sickness absence history The total number of sickness absence days 14.695 40.755 KELA Job disamenities Harm 0.2771 0.4476 QWLS Hazard 0.3810 0.4857 QWLS Uncertainty 0.6018 0.4896 QWLS
Notes: BR = Business Register, FLEED = Finnish Longitudinal Employer-Employee Data, KELA = Social Insurance Institution and QWLS = Quality of Work Life Survey.
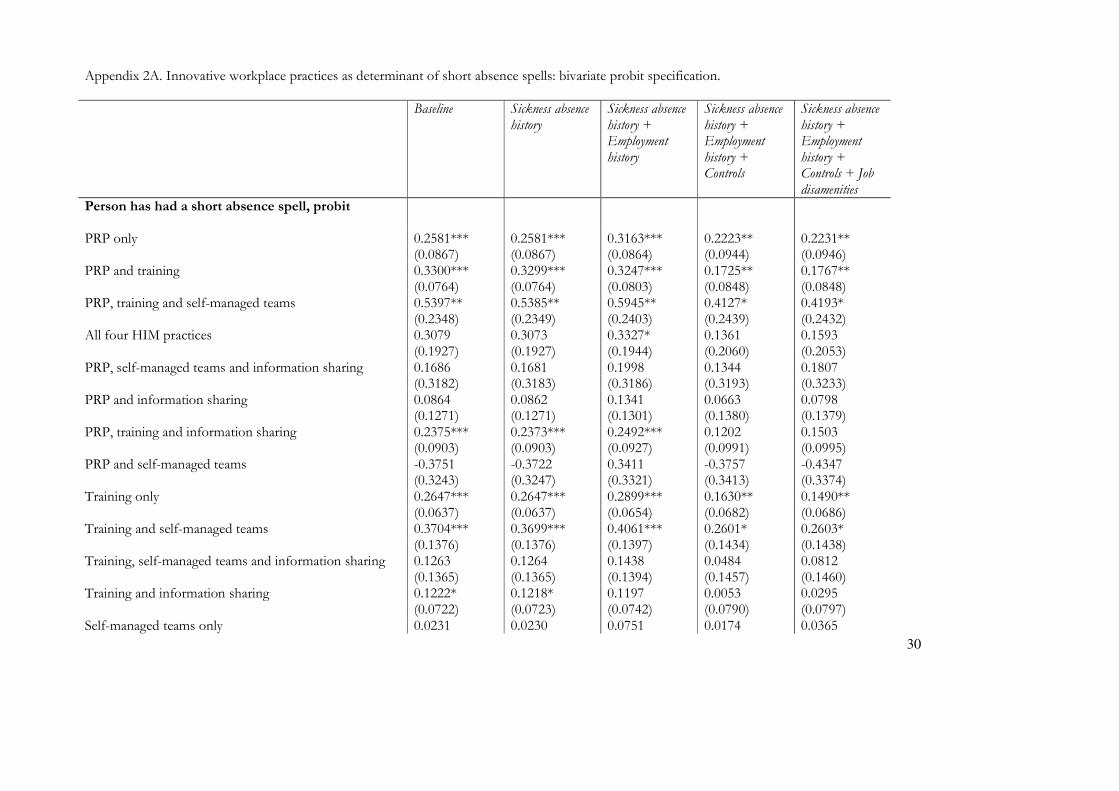
30
Appendix 2A. Innovative workplace practices as determinant of short absence spells: bivariate probit specification. Baseline Sickness absence
history Sickness absence history + Employment history
Sickness absence history + Employment history + Controls
Sickness absence history + Employment history + Controls + Job disamenities
Person has had a short absence spell, probit PRP only 0.2581*** 0.2581*** 0.3163*** 0.2223** 0.2231** (0.0867) (0.0867) (0.0864) (0.0944) (0.0946) PRP and training 0.3300*** 0.3299*** 0.3247*** 0.1725** 0.1767** (0.0764) (0.0764) (0.0803) (0.0848) (0.0848) PRP, training and self-managed teams 0.5397** 0.5385** 0.5945** 0.4127* 0.4193* (0.2348) (0.2349) (0.2403) (0.2439) (0.2432) All four HIM practices 0.3079 0.3073 0.3327* 0.1361 0.1593 (0.1927) (0.1927) (0.1944) (0.2060) (0.2053) PRP, self-managed teams and information sharing 0.1686 0.1681 0.1998 0.1344 0.1807 (0.3182) (0.3183) (0.3186) (0.3193) (0.3233) PRP and information sharing 0.0864 0.0862 0.1341 0.0663 0.0798 (0.1271) (0.1271) (0.1301) (0.1380) (0.1379) PRP, training and information sharing 0.2375*** 0.2373*** 0.2492*** 0.1202 0.1503 (0.0903) (0.0903) (0.0927) (0.0991) (0.0995) PRP and self-managed teams -0.3751 -0.3722 0.3411 -0.3757 -0.4347 (0.3243) (0.3247) (0.3321) (0.3413) (0.3374) Training only 0.2647*** 0.2647*** 0.2899*** 0.1630** 0.1490** (0.0637) (0.0637) (0.0654) (0.0682) (0.0686) Training and self-managed teams 0.3704*** 0.3699*** 0.4061*** 0.2601* 0.2603* (0.1376) (0.1376) (0.1397) (0.1434) (0.1438) Training, self-managed teams and information sharing 0.1263 0.1264 0.1438 0.0484 0.0812 (0.1365) (0.1365) (0.1394) (0.1457) (0.1460) Training and information sharing 0.1222* 0.1218* 0.1197 0.0053 0.0295 (0.0722) (0.0723) (0.0742) (0.0790) (0.0797) Self-managed teams only 0.0231 0.0230 0.0751 0.0174 0.0365
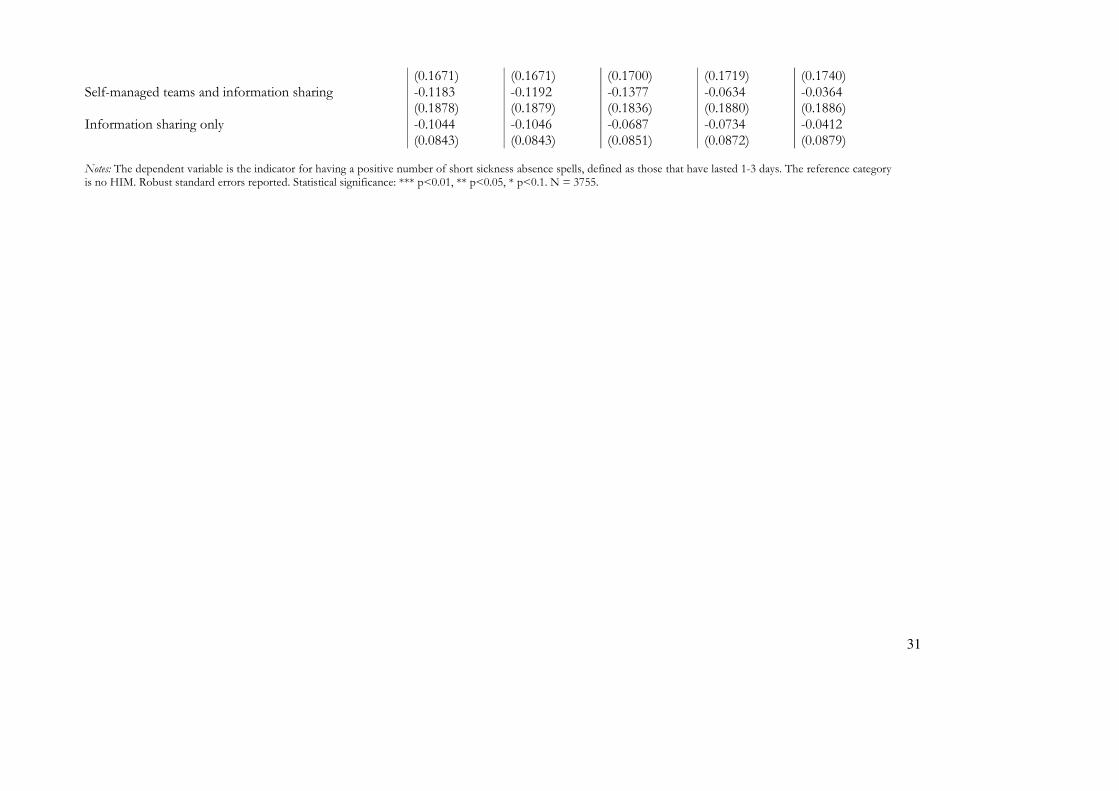
31
(0.1671) (0.1671) (0.1700) (0.1719) (0.1740) Self-managed teams and information sharing -0.1183 -0.1192 -0.1377 -0.0634 -0.0364 (0.1878) (0.1879) (0.1836) (0.1880) (0.1886) Information sharing only -0.1044 -0.1046 -0.0687 -0.0734 -0.0412 (0.0843) (0.0843) (0.0851) (0.0872) (0.0879)
Notes: The dependent variable is the indicator for having a positive number of short sickness absence spells, defined as those that have lasted 1-3 days. The reference category is no HIM. Robust standard errors reported. Statistical significance: *** p<0.01, ** p<0.05, * p<0.1. N = 3755.
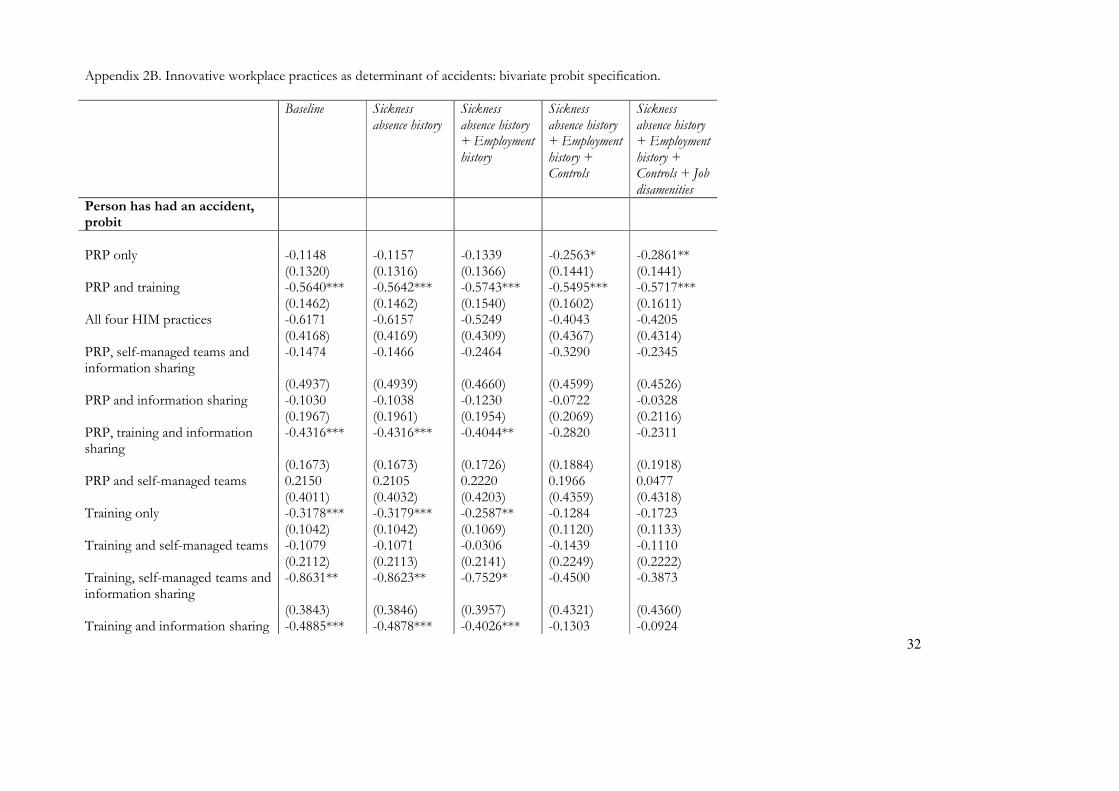
32
Appendix 2B. Innovative workplace practices as determinant of accidents: bivariate probit specification. Baseline Sickness
absence history Sickness absence history + Employment history
Sickness absence history + Employment history + Controls
Sickness absence history + Employment history + Controls + Job disamenities
Person has had an accident, probit
PRP only -0.1148 -0.1157 -0.1339 -0.2563* -0.2861** (0.1320) (0.1316) (0.1366) (0.1441) (0.1441) PRP and training -0.5640*** -0.5642*** -0.5743*** -0.5495*** -0.5717*** (0.1462) (0.1462) (0.1540) (0.1602) (0.1611) All four HIM practices -0.6171 -0.6157 -0.5249 -0.4043 -0.4205 (0.4168) (0.4169) (0.4309) (0.4367) (0.4314) PRP, self-managed teams and information sharing
-0.1474 -0.1466 -0.2464 -0.3290 -0.2345
(0.4937) (0.4939) (0.4660) (0.4599) (0.4526) PRP and information sharing -0.1030 -0.1038 -0.1230 -0.0722 -0.0328 (0.1967) (0.1961) (0.1954) (0.2069) (0.2116) PRP, training and information sharing
-0.4316*** -0.4316*** -0.4044** -0.2820 -0.2311
(0.1673) (0.1673) (0.1726) (0.1884) (0.1918) PRP and self-managed teams 0.2150 0.2105 0.2220 0.1966 0.0477 (0.4011) (0.4032) (0.4203) (0.4359) (0.4318) Training only -0.3178*** -0.3179*** -0.2587** -0.1284 -0.1723 (0.1042) (0.1042) (0.1069) (0.1120) (0.1133) Training and self-managed teams -0.1079 -0.1071 -0.0306 -0.1439 -0.1110 (0.2112) (0.2113) (0.2141) (0.2249) (0.2222) Training, self-managed teams and information sharing
-0.8631** -0.8623** -0.7529* -0.4500 -0.3873
(0.3843) (0.3846) (0.3957) (0.4321) (0.4360) Training and information sharing -0.4885*** -0.4878*** -0.4026*** -0.1303 -0.0924
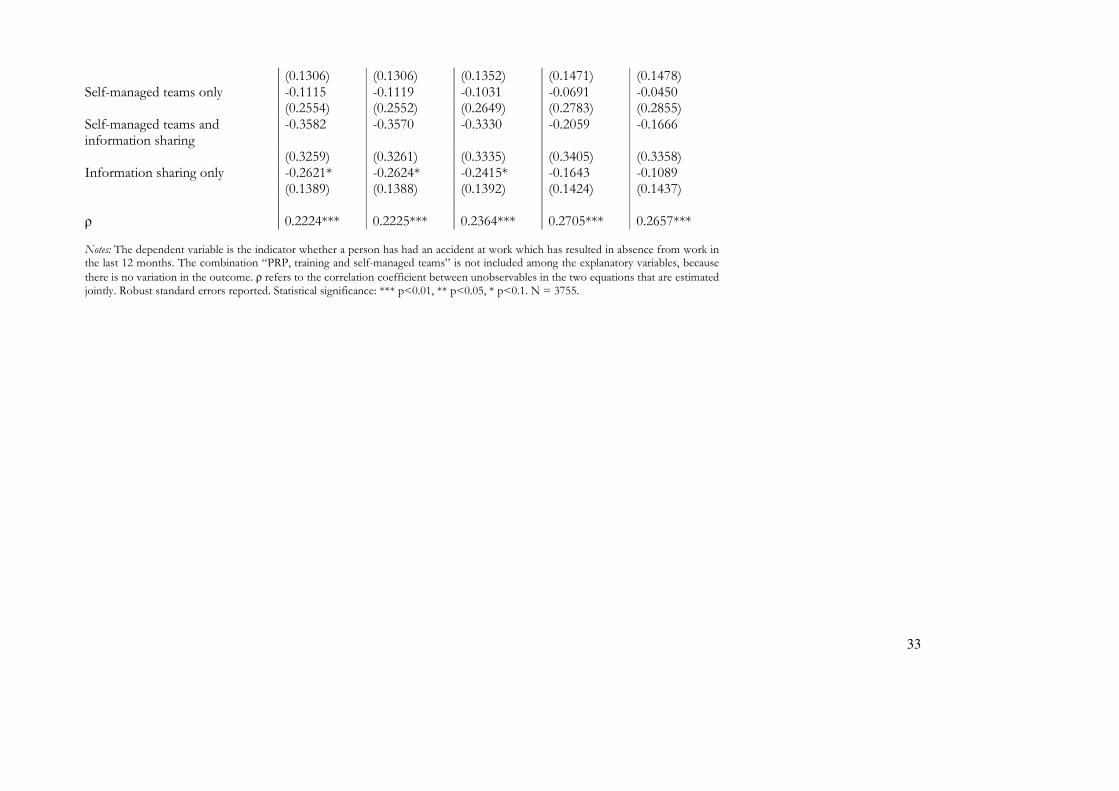
33
(0.1306) (0.1306) (0.1352) (0.1471) (0.1478) Self-managed teams only -0.1115 -0.1119 -0.1031 -0.0691 -0.0450 (0.2554) (0.2552) (0.2649) (0.2783) (0.2855) Self-managed teams and information sharing
-0.3582 -0.3570 -0.3330 -0.2059 -0.1666
(0.3259) (0.3261) (0.3335) (0.3405) (0.3358) Information sharing only -0.2621* -0.2624* -0.2415* -0.1643 -0.1089 (0.1389) (0.1388) (0.1392) (0.1424) (0.1437) ρ 0.2224*** 0.2225*** 0.2364*** 0.2705*** 0.2657*** Notes: The dependent variable is the indicator whether a person has had an accident at work which has resulted in absence from work in the last 12 months. The combination “PRP, training and self-managed teams” is not included among the explanatory variables, because
there is no variation in the outcome. ρ refers to the correlation coefficient between unobservables in the two equations that are estimated jointly. Robust standard errors reported. Statistical significance: *** p<0.01, ** p<0.05, * p<0.1. N = 3755.