DOES HEDGE FUND «ACTIVISM» CREATE LONG TERM … Hedge Fund Activism... · Source: Alon Brav et...
66
Electronic copy available at: http://ssrn.com/abstract=2530594 Yvan Allaire, Ph.D. (MIT), FRSC Executive Chair, Institute for governance of private and public organizations (IGOPP) November 14 th 2014 DOES HEDGE FUND «ACTIVISM» CREATE LONG TERM SHAREHOLDER VALUE? PRESENTATION AT THE ANNUAL MEETING OF THE CENTER FOR CORPORATE GOVERNANCE CONFERENCE BOARD OF NEW YORK
Transcript of DOES HEDGE FUND «ACTIVISM» CREATE LONG TERM … Hedge Fund Activism... · Source: Alon Brav et...

Electronic copy available at: http://ssrn.com/abstract=2530594
Yvan Allaire, Ph.D. (MIT), FRSC
Executive Chair,
Institute for governance of private and public organizations (IGOPP)
November 14th 2014
DOES HEDGE FUND «ACTIVISM» CREATE LONG
TERM SHAREHOLDER VALUE?
PRESENTATION AT THE ANNUAL MEETING OF
THE CENTER FOR CORPORATE GOVERNANCE
CONFERENCE BOARD OF NEW YORK
Electronic copy available at: http://ssrn.com/abstract=2530594
…..AND IS THAT THE RIGHT QUESTION?
SHOULD WE ASK WHETHER THESE PLAYERS ARE MAKING CORPORATIONS BETTER FOR
ALL STAKEHOLDERS?
© Allaire – IGOPP, 2014
Electronic copy available at: http://ssrn.com/abstract=2530594
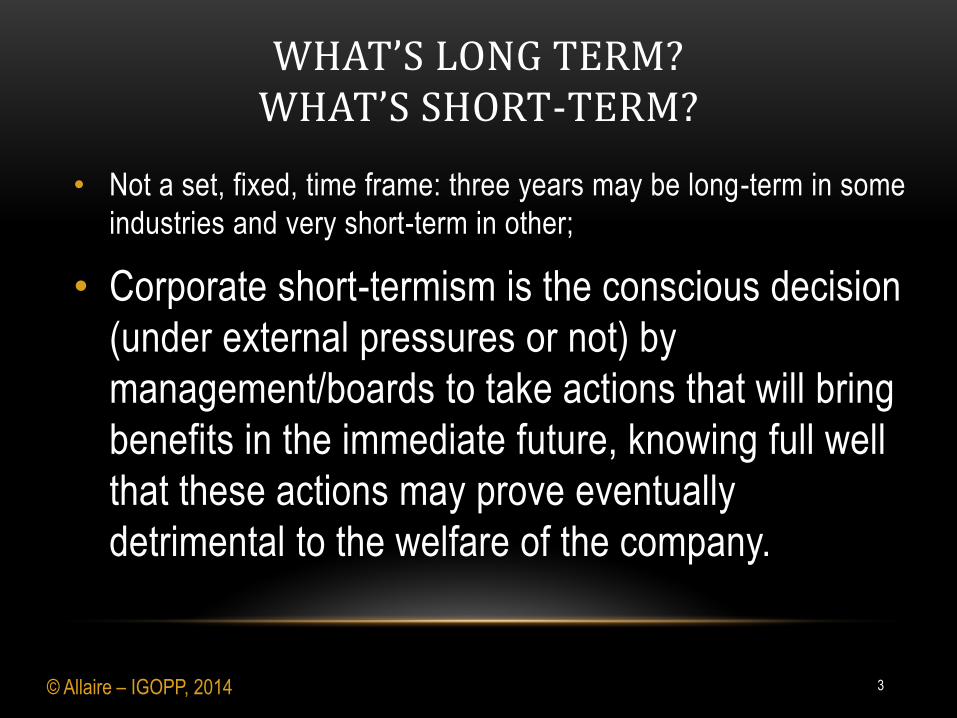
WHAT’S LONG TERM? WHAT’S SHORT-TERM?
• Not a set, fixed, time frame: three years may be long-term in some
industries and very short-term in other;
• Corporate short-termism is the conscious decision
(under external pressures or not) by
management/boards to take actions that will bring
benefits in the immediate future, knowing full well
that these actions may prove eventually
detrimental to the welfare of the company.
© Allaire – IGOPP, 2014 3
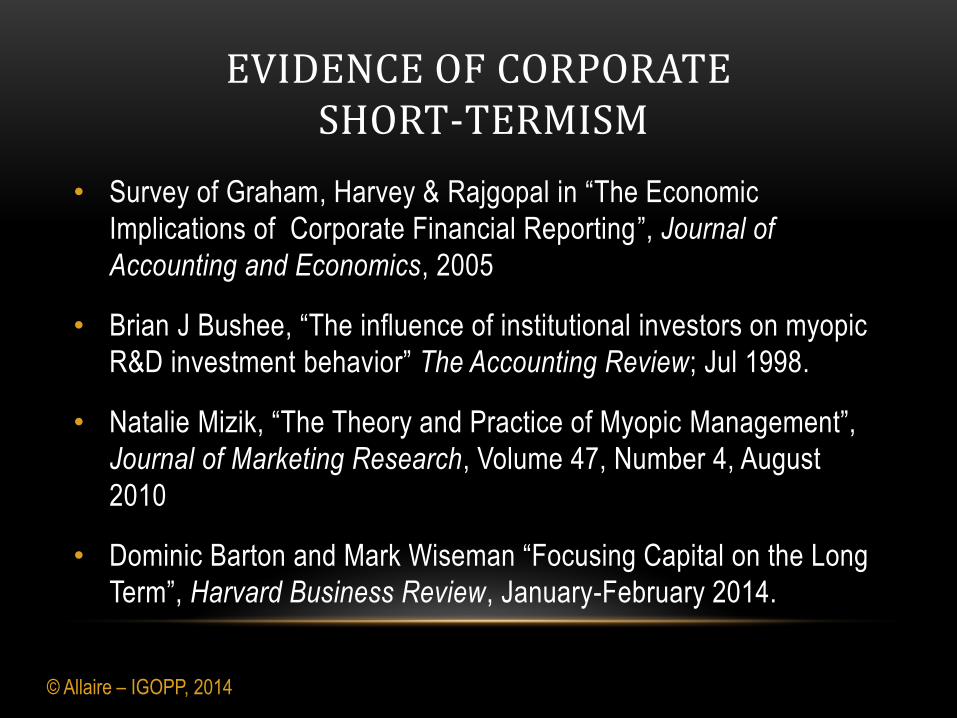
EVIDENCE OF CORPORATE SHORT-TERMISM
• Survey of Graham, Harvey & Rajgopal in “The Economic
Implications of Corporate Financial Reporting”, Journal of
Accounting and Economics, 2005
• Brian J Bushee, “The influence of institutional investors on myopic
R&D investment behavior” The Accounting Review; Jul 1998.
• Natalie Mizik, “The Theory and Practice of Myopic Management”,
Journal of Marketing Research, Volume 47, Number 4, August
2010
• Dominic Barton and Mark Wiseman “Focusing Capital on the Long
Term”, Harvard Business Review, January-February 2014.
© Allaire – IGOPP, 2014
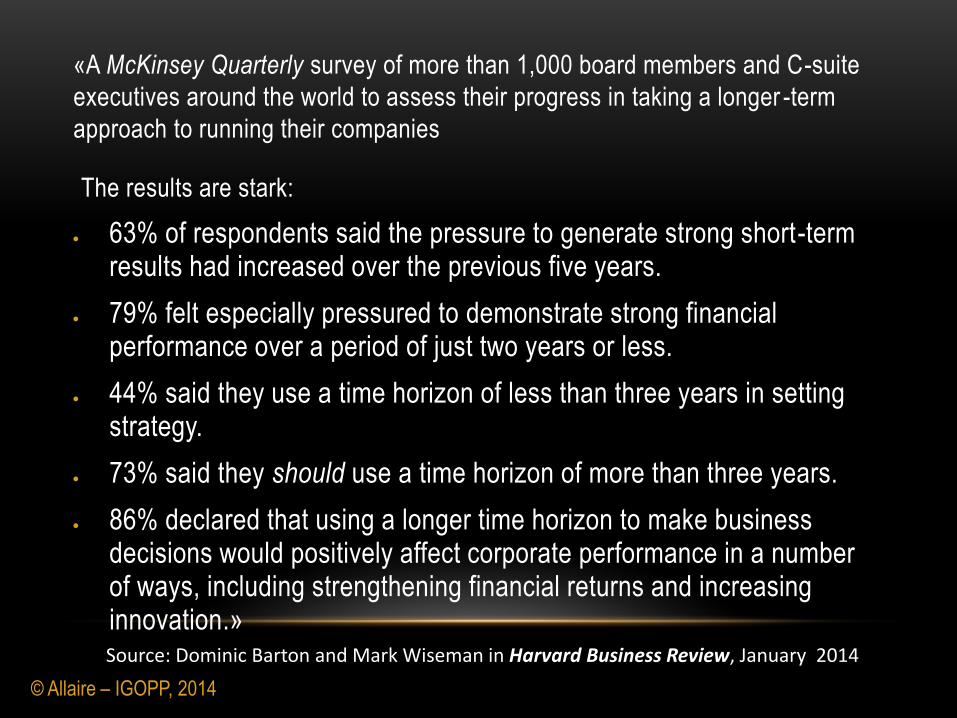
«A McKinsey Quarterly survey of more than 1,000 board members and C-suite
executives around the world to assess their progress in taking a longer -term
approach to running their companies
The results are stark:
63% of respondents said the pressure to generate strong short-term results had increased over the previous five years.
79% felt especially pressured to demonstrate strong financial performance over a period of just two years or less.
44% said they use a time horizon of less than three years in setting strategy.
73% said they should use a time horizon of more than three years.
86% declared that using a longer time horizon to make business decisions would positively affect corporate performance in a number of ways, including strengthening financial returns and increasing innovation.»
Source: Dominic Barton and Mark Wiseman in Harvard Business Review, January 2014
© Allaire – IGOPP, 2014
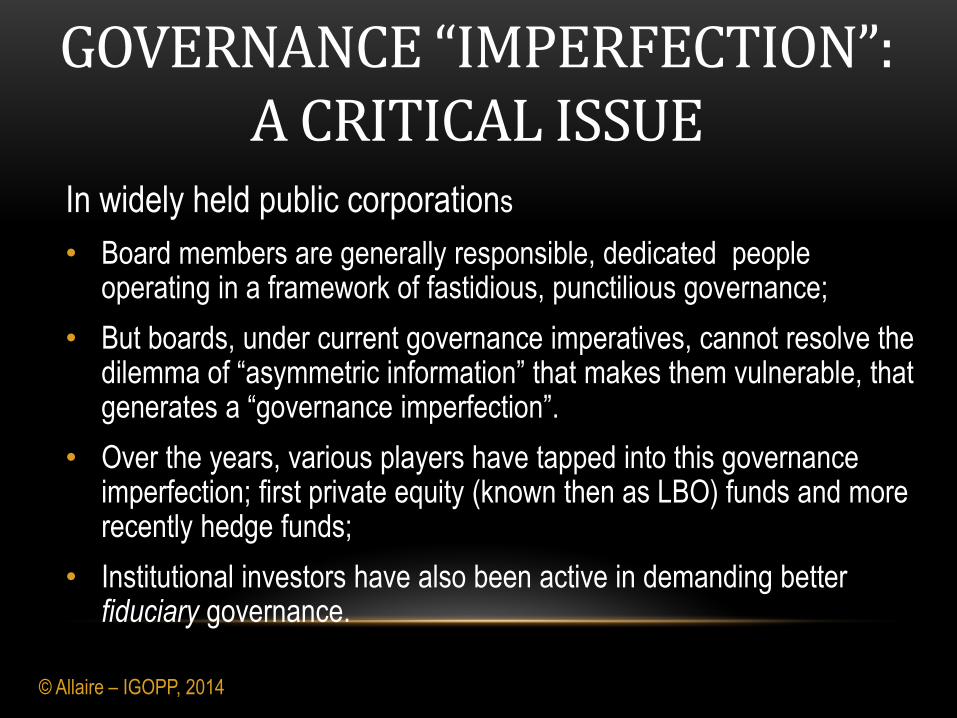
GOVERNANCE “IMPERFECTION”: A CRITICAL ISSUE
6
In widely held public corporations
• Board members are generally responsible, dedicated people operating in a framework of fastidious, punctilious governance;
• But boards, under current governance imperatives, cannot resolve the dilemma of “asymmetric information” that makes them vulnerable, that generates a “governance imperfection”.
• Over the years, various players have tapped into this governance imperfection; first private equity (known then as LBO) funds and more recently hedge funds;
• Institutional investors have also been active in demanding better fiduciary governance.
© Allaire – IGOPP, 2014
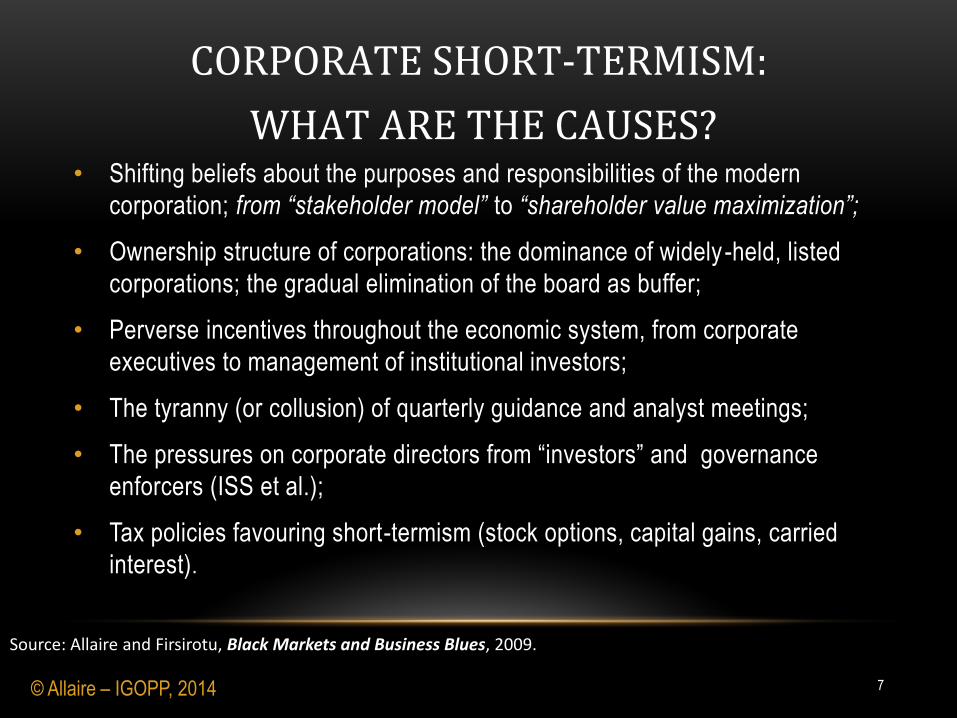
• Shifting beliefs about the purposes and responsibilities of the modern
corporation; from “stakeholder model” to “shareholder value maximization”;
• Ownership structure of corporations: the dominance of widely -held, listed
corporations; the gradual elimination of the board as buffer;
• Perverse incentives throughout the economic system, from corporate
executives to management of institutional investors;
• The tyranny (or collusion) of quarterly guidance and analyst meetings;
• The pressures on corporate directors from “investors” and governance
enforcers (ISS et al.);
• Tax policies favouring short-termism (stock options, capital gains, carried
interest).
Source: Allaire and Firsirotu, Black Markets and Business Blues, 2009.
© Allaire – IGOPP, 2014
CORPORATE SHORT-TERMISM:
WHAT ARE THE CAUSES?
7
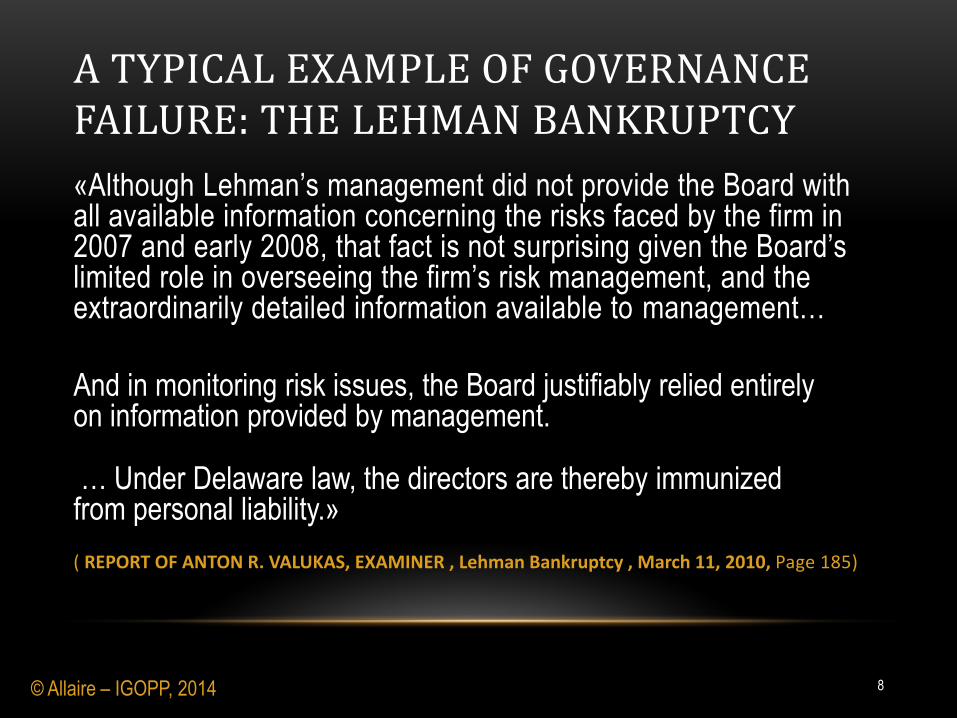
A TYPICAL EXAMPLE OF GOVERNANCE FAILURE: THE LEHMAN BANKRUPTCY
«Although Lehman’s management did not provide the Board with all available information concerning the risks faced by the firm in 2007 and early 2008, that fact is not surprising given the Board’s limited role in overseeing the firm’s risk management, and the extraordinarily detailed information available to management…
And in monitoring risk issues, the Board justifiably relied entirely on information provided by management.
… Under Delaware law, the directors are thereby immunized from personal liability.»
( REPORT OF ANTON R. VALUKAS, EXAMINER , Lehman Bankruptcy , March 11, 2010, Page 185)
8 © Allaire – IGOPP, 2014
© Allaire – IGOPP, 2014
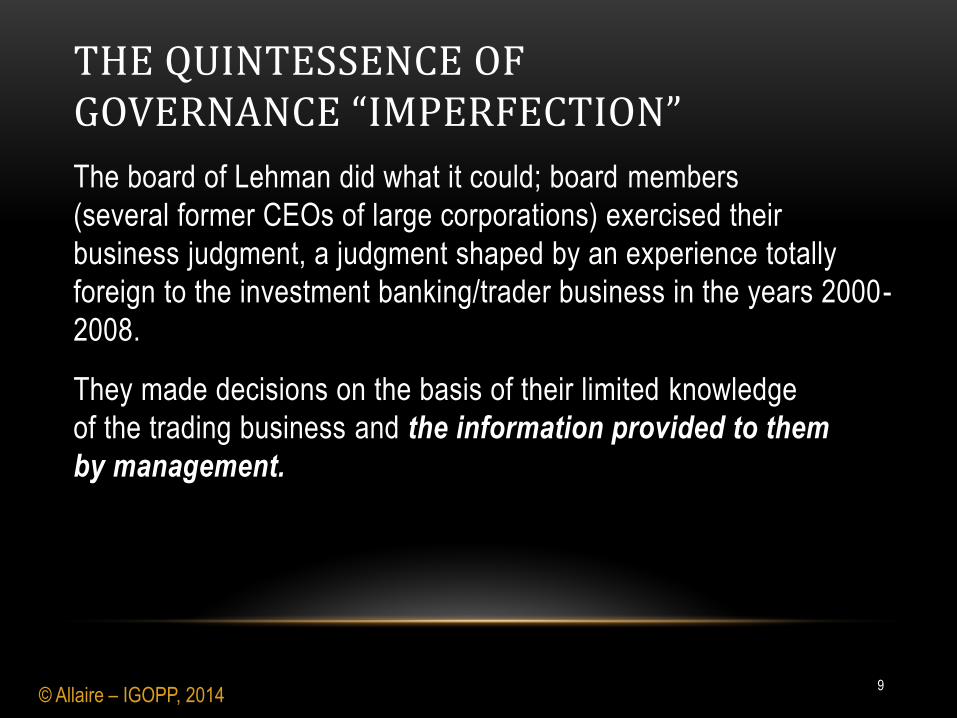
THE QUINTESSENCE OF GOVERNANCE “IMPERFECTION”
The board of Lehman did what it could; board members
(several former CEOs of large corporations) exercised their
business judgment, a judgment shaped by an experience totally
foreign to the investment banking/trader business in the years 2000-
2008.
They made decisions on the basis of their limited knowledge
of the trading business and the information provided to them
by management.
9
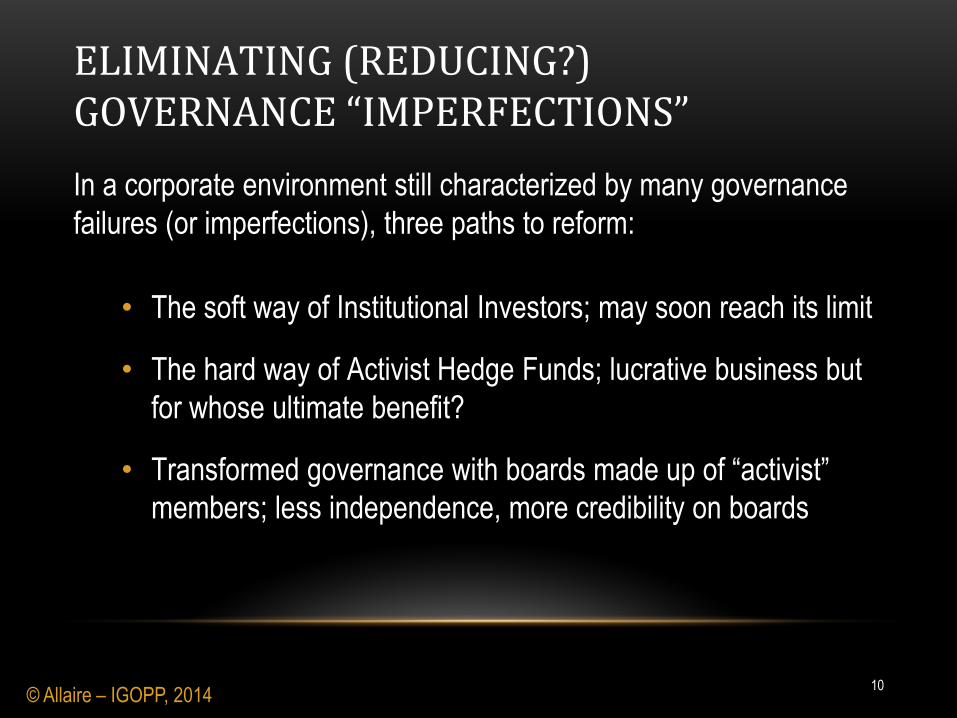
In a corporate environment still characterized by many governance
failures (or imperfections), three paths to reform:
• The soft way of Institutional Investors; may soon reach its limit
• The hard way of Activist Hedge Funds; lucrative business but
for whose ultimate benefit?
• Transformed governance with boards made up of “activist”
members; less independence, more credibility on boards
© Allaire – IGOPP, 2014
ELIMINATING (REDUCING?) GOVERNANCE “IMPERFECTIONS”
10
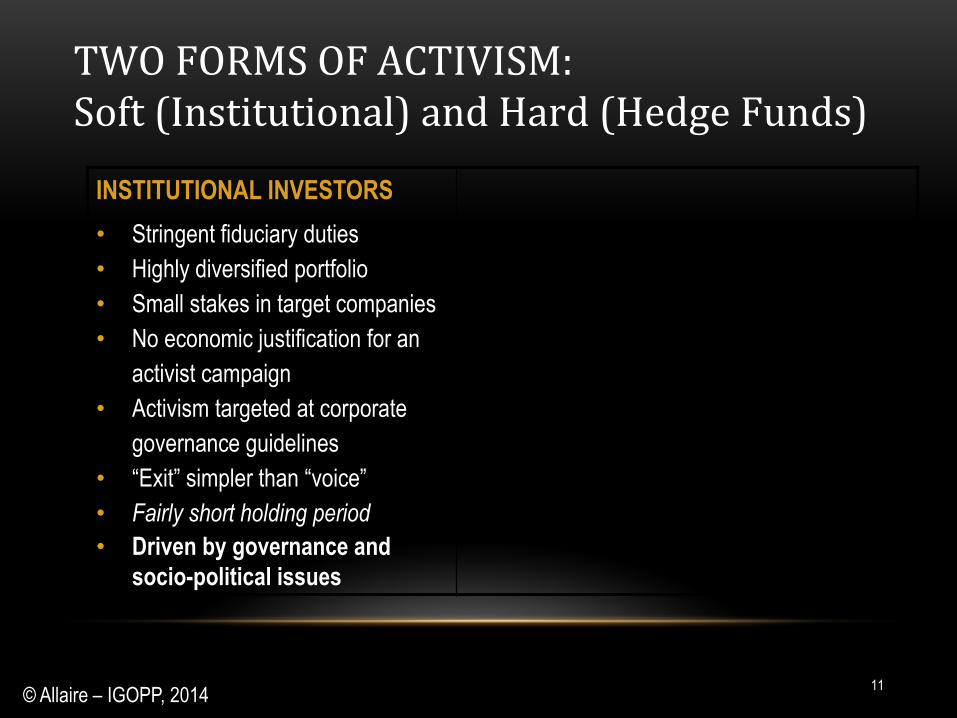
INSTITUTIONAL INVESTORS
• Stringent fiduciary duties
• Highly diversified portfolio
• Small stakes in target companies
• No economic justification for an
activist campaign
• Activism targeted at corporate
governance guidelines
• “Exit” simpler than “voice”
• Fairly short holding period
• Driven by governance and
socio-political issues
© Allaire – IGOPP, 2014
TWO FORMS OF ACTIVISM: Soft (Institutional) and Hard (Hedge Funds)
11
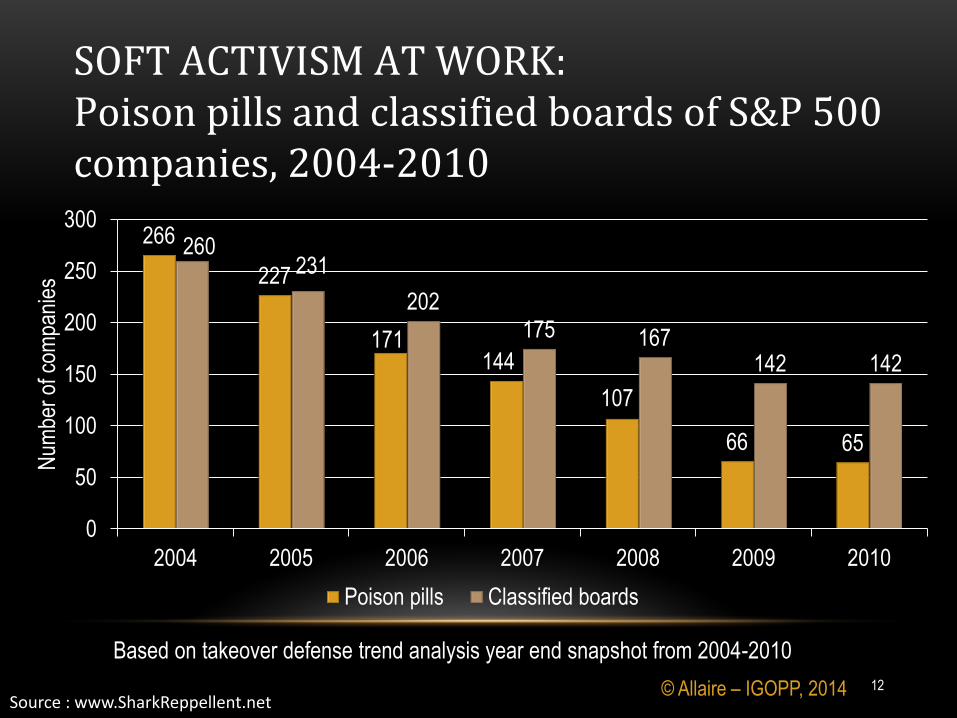
266
227
171 144
107
66 65
260 231
202 175 167
142 142
0
50
100
150
200
250
300
2004 2005 2006 2007 2008 2009 2010
Num
ber
of c
ompa
nies
Poison pills Classified boards
Source : www.SharkReppellent.net
Based on takeover defense trend analysis year end snapshot from 2004-2010
SOFT ACTIVISM AT WORK: Poison pills and classified boards of S&P 500 companies, 2004-2010
12 © Allaire – IGOPP, 2014
© Allaire – IGOPP, 2014
SOME EVIDENCE OF INVESTOR SHORT-TERMISM
…BUT NOT A VERY RECENT PHENOMENON
13
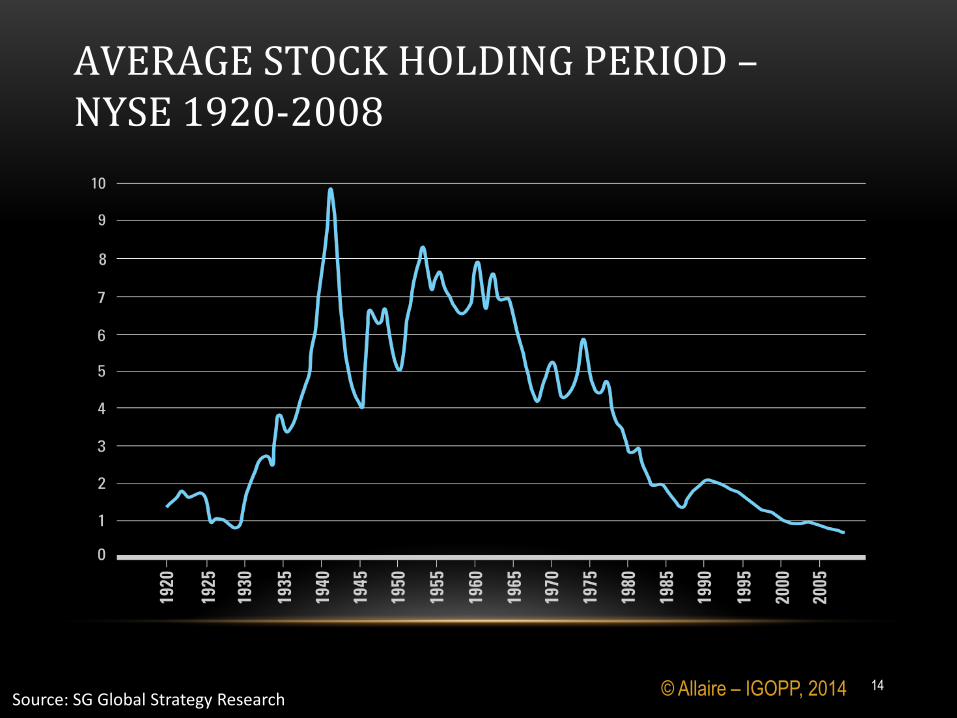
Source: SG Global Strategy Research
AVERAGE STOCK HOLDING PERIOD – NYSE 1920-2008
14 © Allaire – IGOPP, 2014
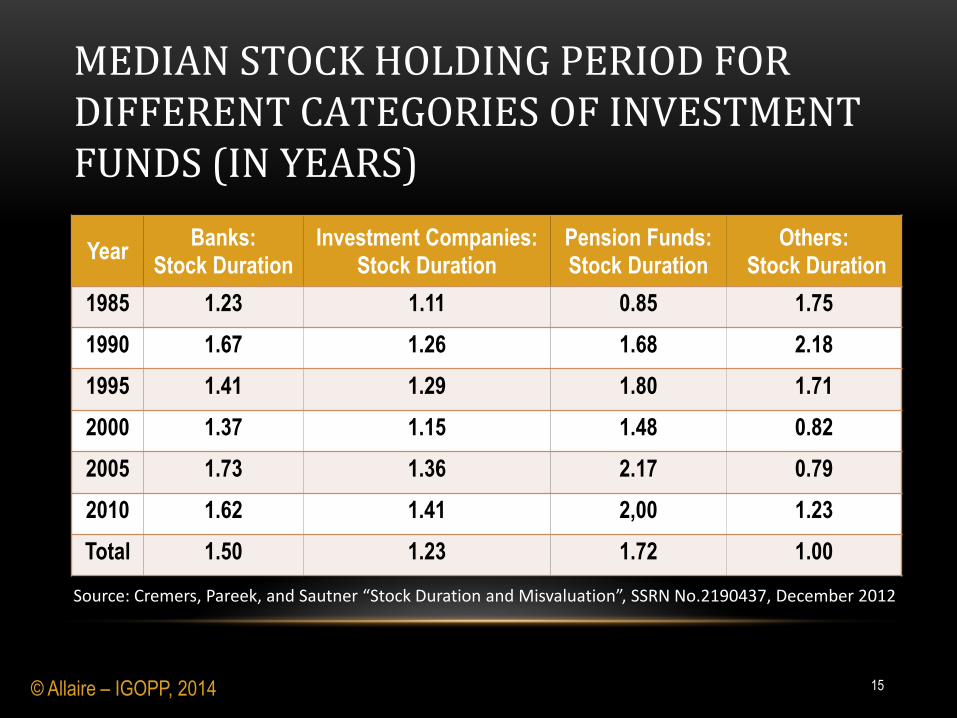
Source: Cremers, Pareek, and Sautner “Stock Duration and Misvaluation”, SSRN No.2190437, December 2012
Year Banks:
Stock Duration Investment Companies:
Stock Duration Pension Funds: Stock Duration
Others: Stock Duration
1985 1.23 1.11 0.85 1.75
1990 1.67 1.26 1.68 2.18
1995 1.41 1.29 1.80 1.71
2000 1.37 1.15 1.48 0.82
2005 1.73 1.36 2.17 0.79
2010 1.62 1.41 2,00 1.23
Total 1.50 1.23 1.72 1.00
MEDIAN STOCK HOLDING PERIOD FOR DIFFERENT CATEGORIES OF INVESTMENT FUNDS (IN YEARS)
15 © Allaire – IGOPP, 2014
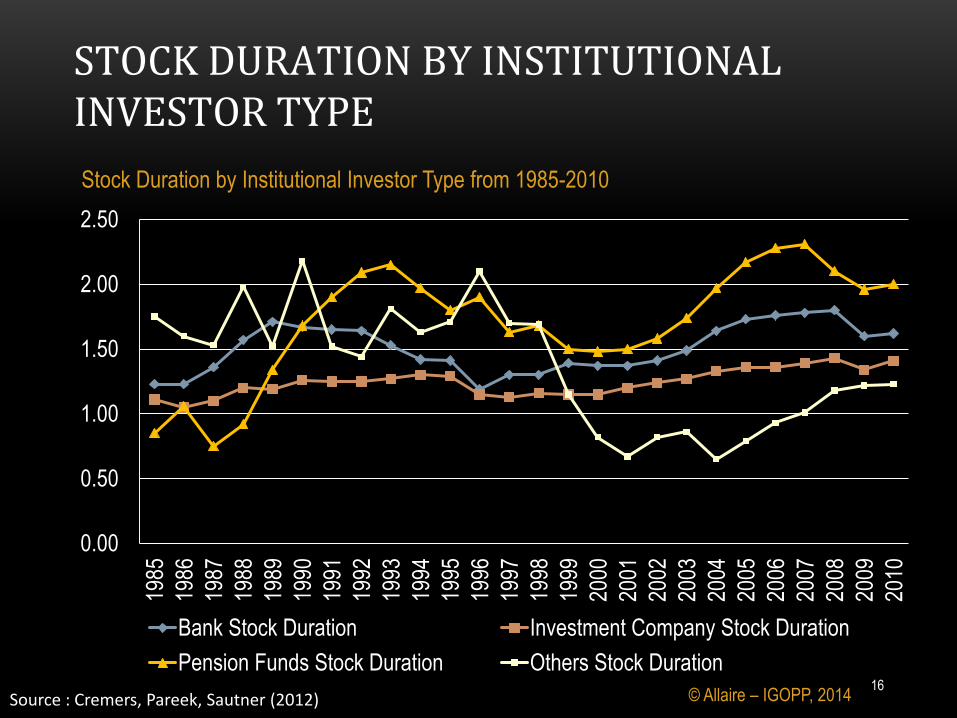
Source : Cremers, Pareek, Sautner (2012)
Stock Duration by Institutional Investor Type from 1985-2010
0.00
0.50
1.00
1.50
2.00
2.50
1985
1986
1987
1988
1989
1990
1991
1992
1993
1994
1995
1996
1997
1998
1999
2000
2001
2002
2003
2004
2005
2006
2007
2008
2009
2010
Bank Stock Duration Investment Company Stock Duration
Pension Funds Stock Duration Others Stock Duration
STOCK DURATION BY INSTITUTIONAL INVESTOR TYPE
16 © Allaire – IGOPP, 2014
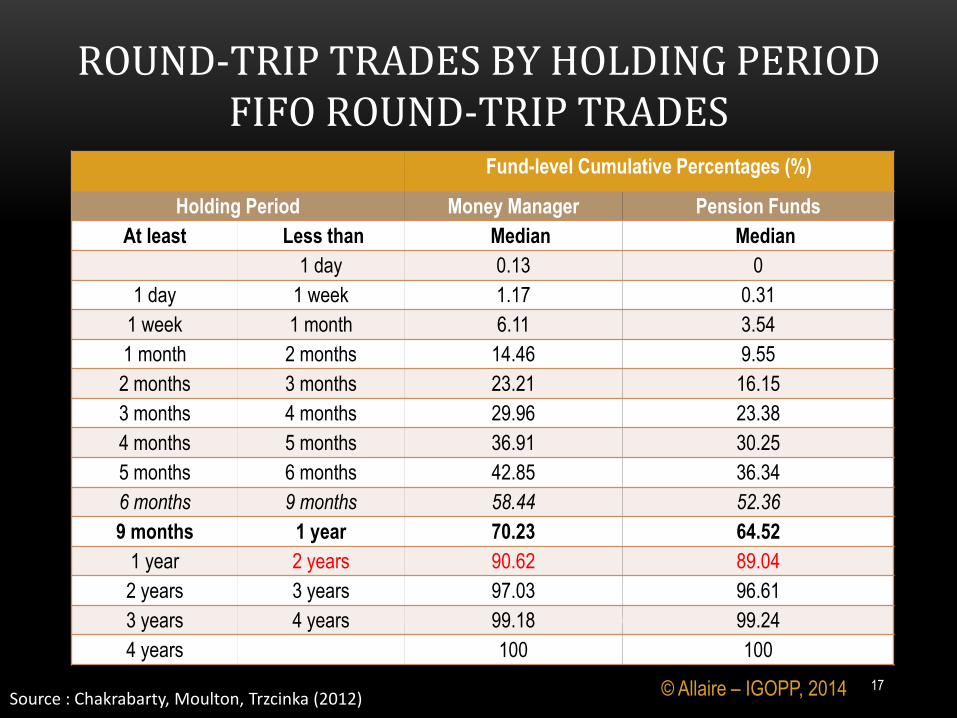
Source : Chakrabarty, Moulton, Trzcinka (2012)
Fund-level Cumulative Percentages (%)
Holding Period Money Manager Pension Funds
At least Less than Median Median
1 day 0.13 0
1 day 1 week 1.17 0.31
1 week 1 month 6.11 3.54
1 month 2 months 14.46 9.55
2 months 3 months 23.21 16.15
3 months 4 months 29.96 23.38
4 months 5 months 36.91 30.25
5 months 6 months 42.85 36.34
6 months 9 months 58.44 52.36
9 months 1 year 70.23 64.52
1 year 2 years 90.62 89.04
2 years 3 years 97.03 96.61
3 years 4 years 99.18 99.24
4 years 100 100
ROUND-TRIP TRADES BY HOLDING PERIOD FIFO ROUND-TRIP TRADES
17 © Allaire – IGOPP, 2014
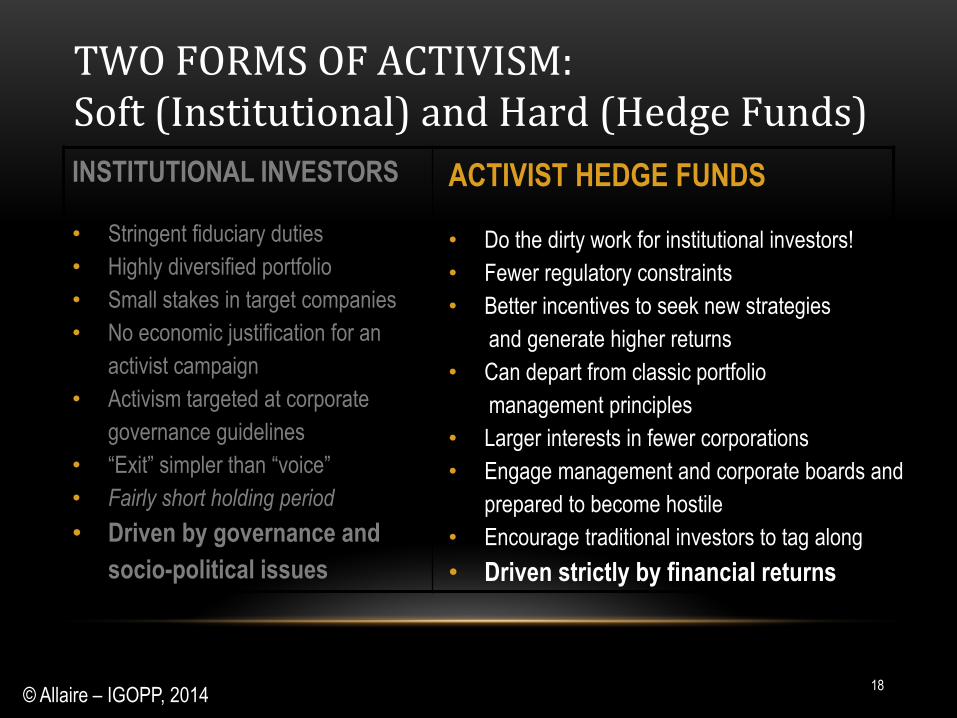
INSTITUTIONAL INVESTORS
• Stringent fiduciary duties
• Highly diversified portfolio
• Small stakes in target companies
• No economic justification for an
activist campaign
• Activism targeted at corporate
governance guidelines
• “Exit” simpler than “voice”
• Fairly short holding period
• Driven by governance and
socio-political issues
© Allaire – IGOPP, 2014
TWO FORMS OF ACTIVISM: Soft (Institutional) and Hard (Hedge Funds)
18
ACTIVIST HEDGE FUNDS
• Do the dirty work for institutional investors!
• Fewer regulatory constraints
• Better incentives to seek new strategies
and generate higher returns
• Can depart from classic portfolio
management principles
• Larger interests in fewer corporations
• Engage management and corporate boards and
prepared to become hostile
• Encourage traditional investors to tag along
• Driven strictly by financial returns
Source : Adapted from Bratton, 2006 / Brav et al., 2007
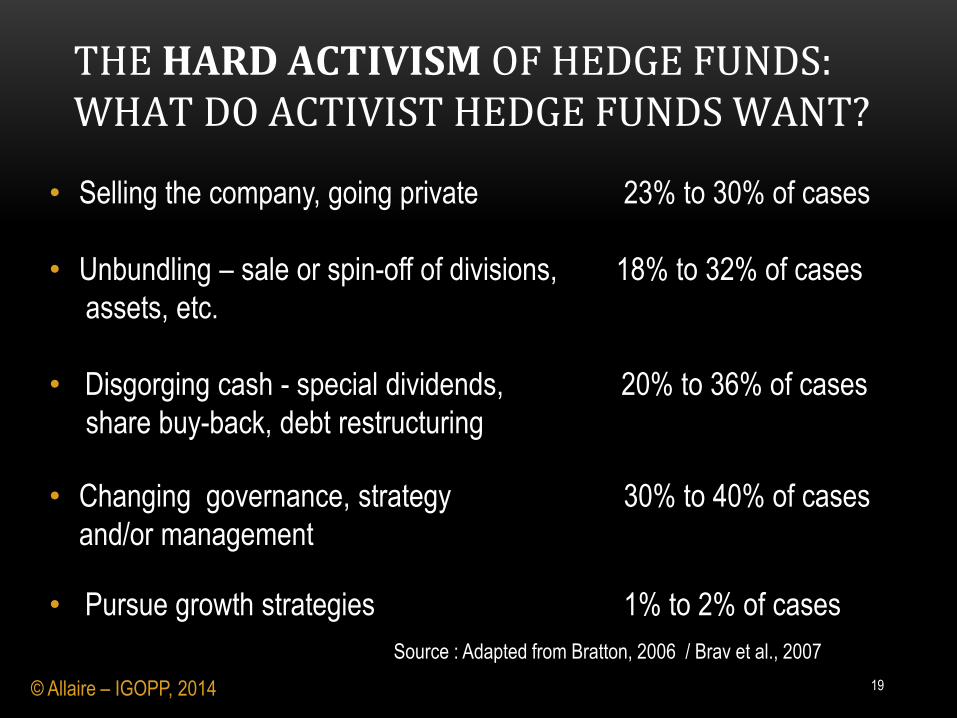
THE HARD ACTIVISM OF HEDGE FUNDS: WHAT DO ACTIVIST HEDGE FUNDS WANT?
19
• Selling the company, going private 23% to 30% of cases
• Unbundling – sale or spin-off of divisions, 18% to 32% of cases
assets, etc.
• Disgorging cash - special dividends, 20% to 36% of cases
share buy-back, debt restructuring
• Changing governance, strategy 30% to 40% of cases
and/or management
• Pursue growth strategies 1% to 2% of cases
© Allaire – IGOPP, 2014
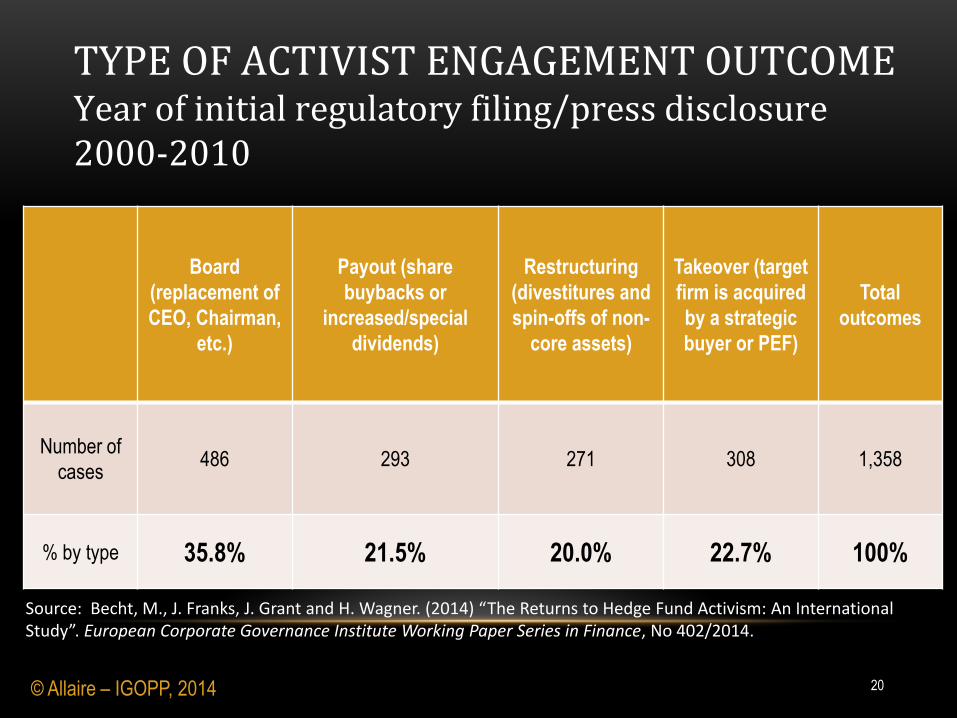
Board
(replacement of
CEO, Chairman,
etc.)
Payout (share
buybacks or
increased/special
dividends)
Restructuring
(divestitures and
spin-offs of non-
core assets)
Takeover (target
firm is acquired
by a strategic
buyer or PEF)
Total
outcomes
Number of
cases 486 293 271 308 1,358
% by type 35.8% 21.5% 20.0% 22.7% 100%
Source: Becht, M., J. Franks, J. Grant and H. Wagner. (2014) “The Returns to Hedge Fund Activism: An International Study”. European Corporate Governance Institute Working Paper Series in Finance, No 402/2014.
TYPE OF ACTIVIST ENGAGEMENT OUTCOME Year of initial regulatory filing/press disclosure 2000-2010
20 © Allaire – IGOPP, 2014
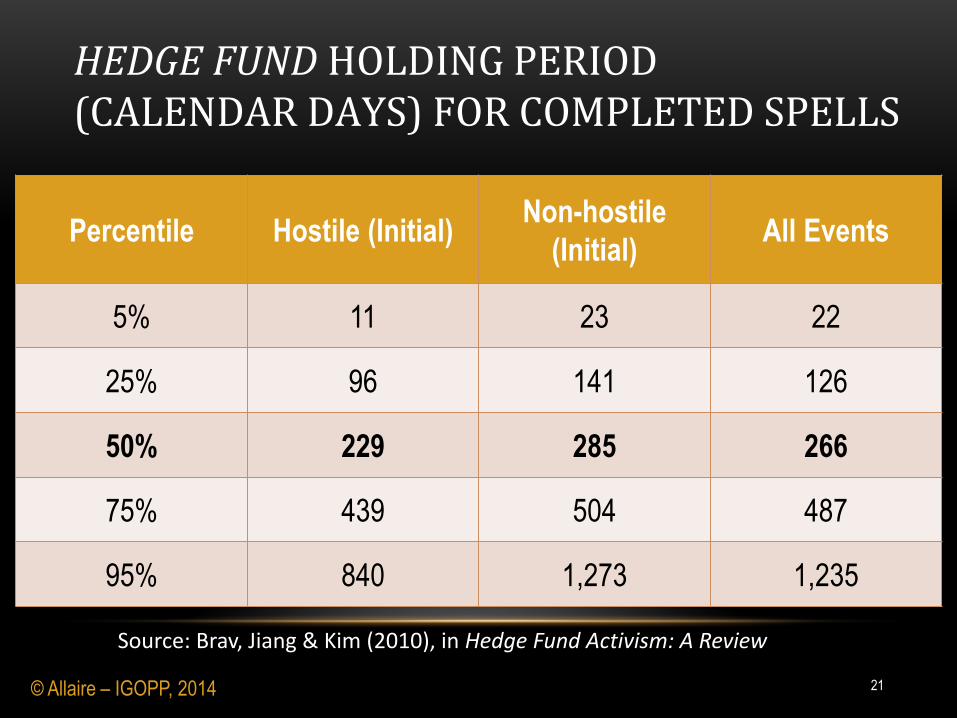
Percentile Hostile (Initial) Non-hostile
(Initial) All Events
5% 11 23 22
25% 96 141 126
50% 229 285 266
75% 439 504 487
95% 840 1,273 1,235
Source: Brav, Jiang & Kim (2010), in Hedge Fund Activism: A Review
HEDGE FUND HOLDING PERIOD (CALENDAR DAYS) FOR COMPLETED SPELLS
21 © Allaire – IGOPP, 2014
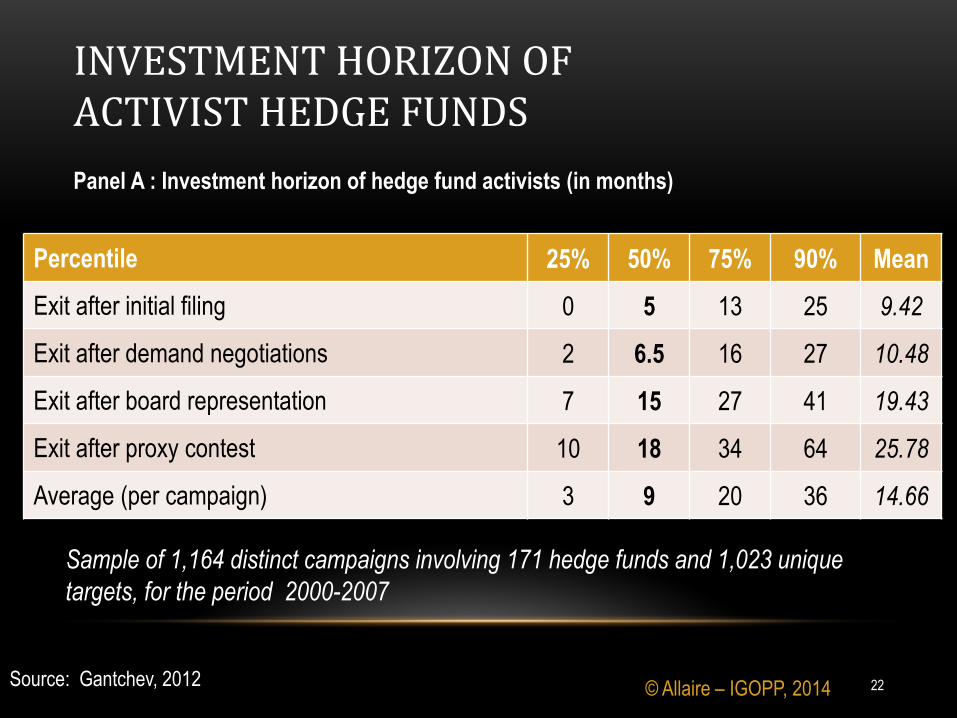
Source: Gantchev, 2012
Sample of 1,164 distinct campaigns involving 171 hedge funds and 1,023 unique
targets, for the period 2000-2007
Panel A : Investment horizon of hedge fund activists (in months)
Percentile 25% 50% 75% 90% Mean
Exit after initial filing 0 5 13 25 9.42
Exit after demand negotiations 2 6.5 16 27 10.48
Exit after board representation 7 15 27 41 19.43
Exit after proxy contest 10 18 34 64 25.78
Average (per campaign) 3 9 20 36 14.66
INVESTMENT HORIZON OF ACTIVIST HEDGE FUNDS
22 © Allaire – IGOPP, 2014
© Allaire – IGOPP, 2014
ACTIVIST HEDGE FUNDS
Short-term impact
23
24
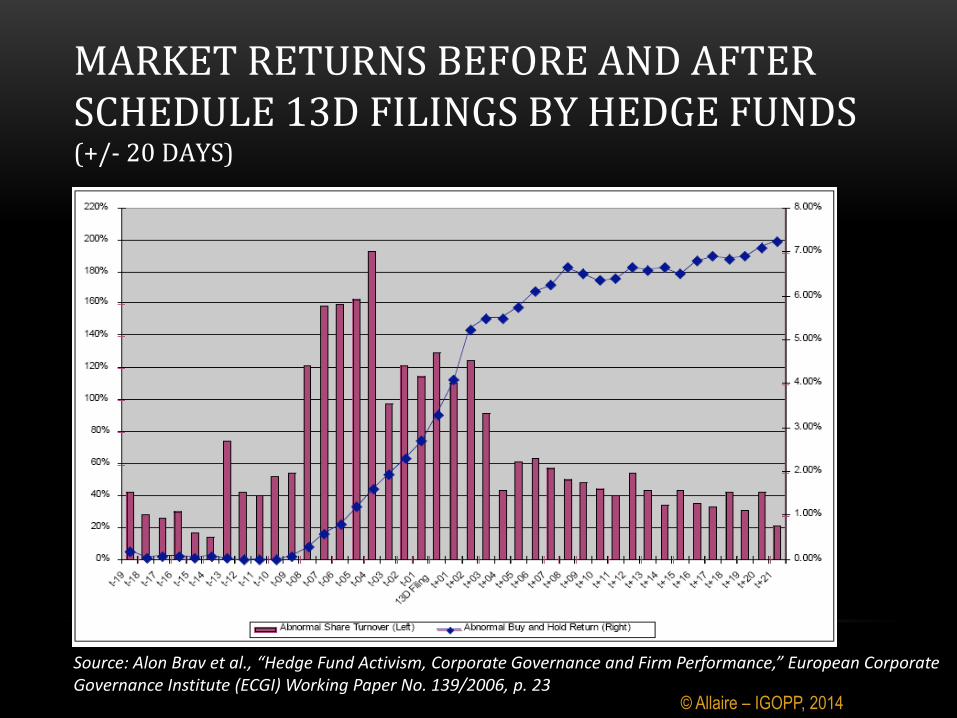
Source: Alon Brav et al., “Hedge Fund Activism, Corporate Governance and Firm Performance,” European Corporate Governance Institute (ECGI) Working Paper No. 139/2006, p. 23
MARKET RETURNS BEFORE AND AFTER SCHEDULE 13D FILINGS BY HEDGE FUNDS (+/- 20 DAYS)
© Allaire – IGOPP, 2014
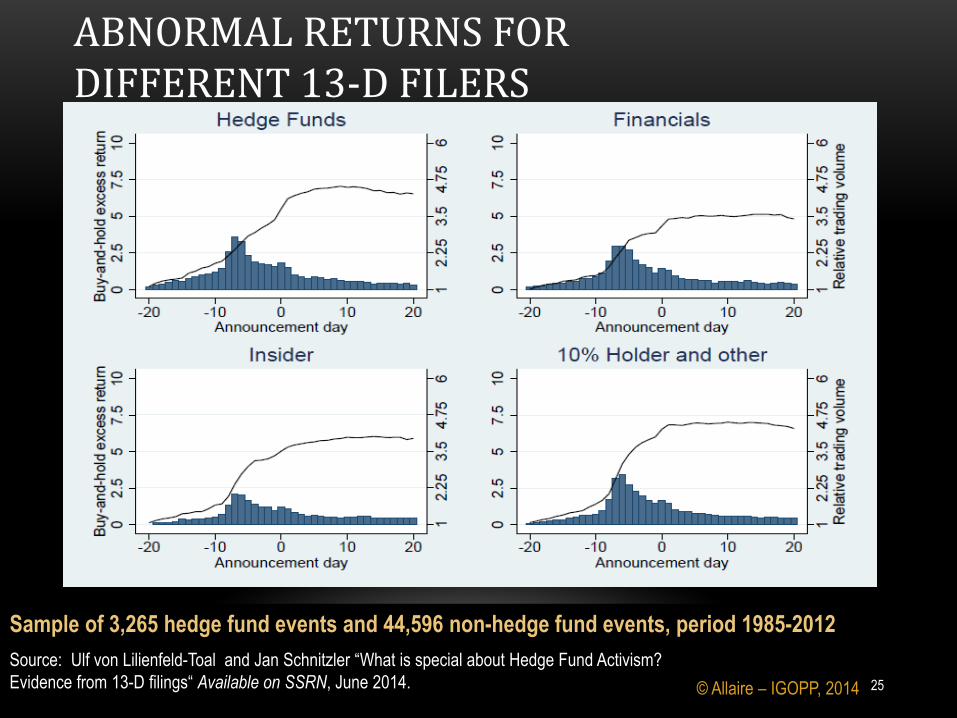
Source: Ulf von Lilienfeld-Toal and Jan Schnitzler “What is special about Hedge Fund Activism?
Evidence from 13-D filings“ Available on SSRN, June 2014.
ABNORMAL RETURNS FOR DIFFERENT 13-D FILERS
25
Sample of 3,265 hedge fund events and 44,596 non-hedge fund events, period 1985-2012
© Allaire – IGOPP, 2014
Long-term impact
• Several studies on the topic
• The best known and most quoted
(op-ed in WSJ, etc.):
Bebchuk, Brav and Jiang, 2013
© Allaire – IGOPP, 2014
ACTIVIST HEDGE FUNDS
26
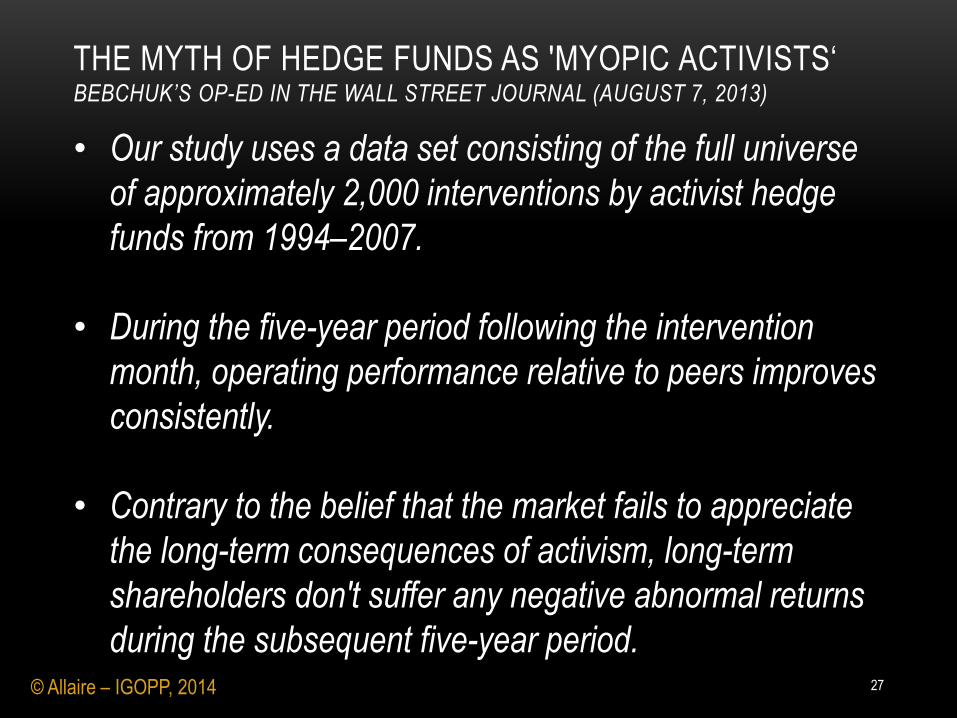
THE MYTH OF HEDGE FUNDS AS 'MYOPIC ACTIVISTS‘ BEBCHUK’S OP-ED IN THE WALL STREET JOURNAL (AUGUST 7, 2013)
• Our study uses a data set consisting of the full universe
of approximately 2,000 interventions by activist hedge
funds from 1994–2007.
• During the five-year period following the intervention
month, operating performance relative to peers improves
consistently.
• Contrary to the belief that the market fails to appreciate
the long-term consequences of activism, long-term
shareholders don't suffer any negative abnormal returns
during the subsequent five-year period. 27 © Allaire – IGOPP, 2014
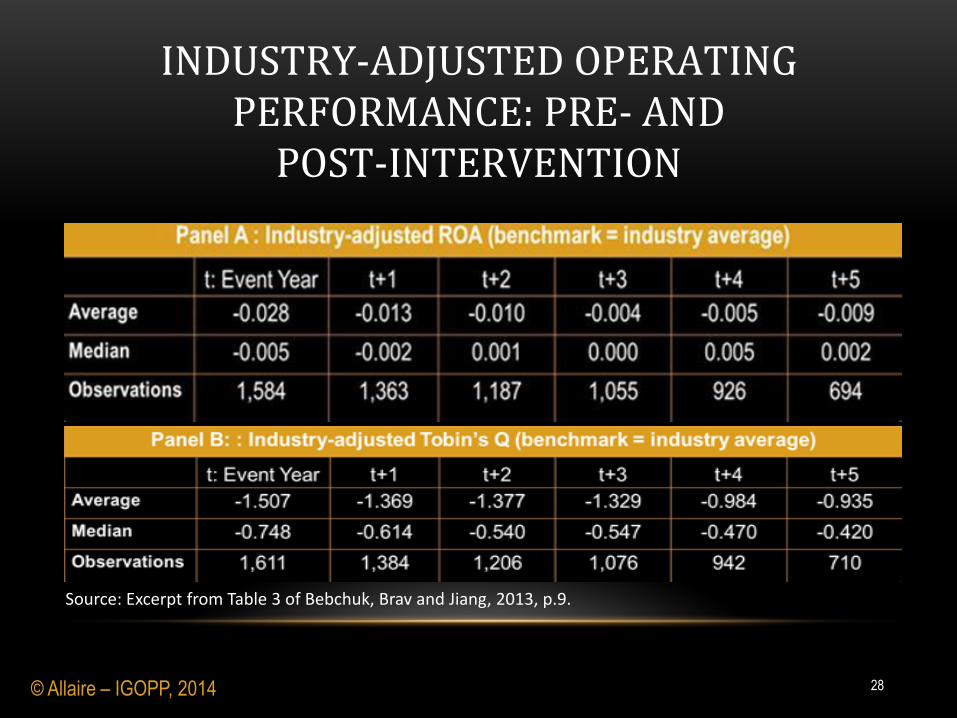
Source: Excerpt from Table 3 of Bebchuk, Brav and Jiang, 2013, p.9.
INDUSTRY-ADJUSTED OPERATING PERFORMANCE: PRE- AND
POST-INTERVENTION
28 © Allaire – IGOPP, 2014
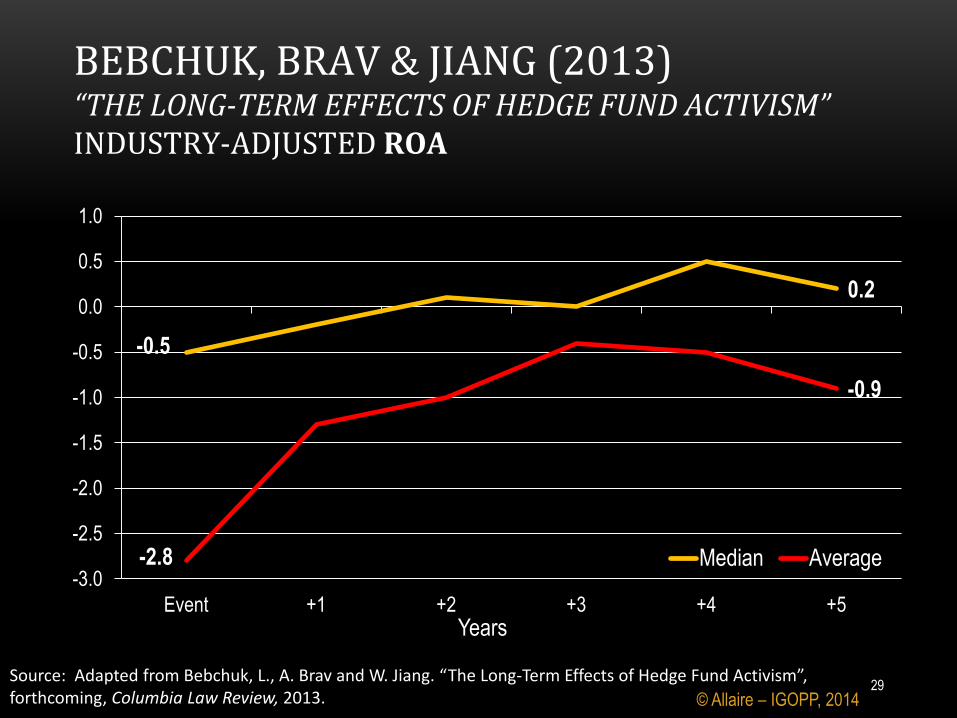
-0.5
0.2
-2.8
-0.9
-3.0
-2.5
-2.0
-1.5
-1.0
-0.5
0.0
0.5
1.0
Event +1 +2 +3 +4 +5
Median Average
Years
Source: Adapted from Bebchuk, L., A. Brav and W. Jiang. “The Long-Term Effects of Hedge Fund Activism”, forthcoming, Columbia Law Review, 2013.
BEBCHUK, BRAV & JIANG (2013) “THE LONG-TERM EFFECTS OF HEDGE FUND ACTIVISM” INDUSTRY-ADJUSTED ROA
29 © Allaire – IGOPP, 2014
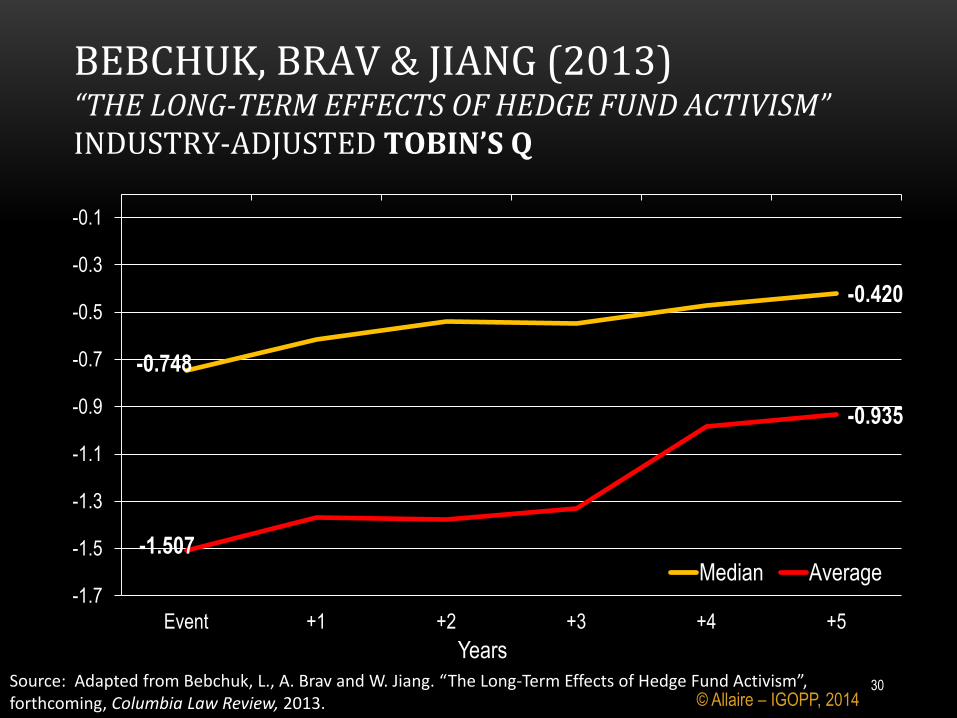
-0.748
-0.420
-1.507
-0.935
-1.7
-1.5
-1.3
-1.1
-0.9
-0.7
-0.5
-0.3
-0.1
Event +1 +2 +3 +4 +5
Median Average
Years
Source: Adapted from Bebchuk, L., A. Brav and W. Jiang. “The Long-Term Effects of Hedge Fund Activism”, forthcoming, Columbia Law Review, 2013.
BEBCHUK, BRAV & JIANG (2013) “THE LONG-TERM EFFECTS OF HEDGE FUND ACTIVISM” INDUSTRY-ADJUSTED TOBIN’S Q
30 © Allaire – IGOPP, 2014
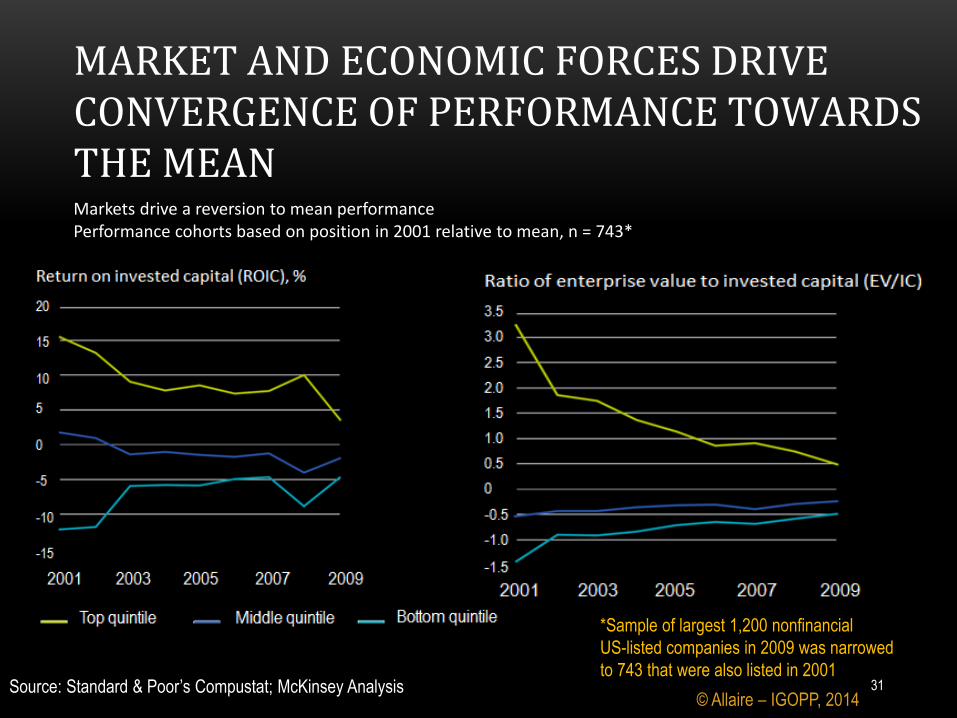
Source: Standard & Poor’s Compustat; McKinsey Analysis
*Sample of largest 1,200 nonfinancial
US-listed companies in 2009 was narrowed
to 743 that were also listed in 2001
Markets drive a reversion to mean performance Performance cohorts based on position in 2001 relative to mean, n = 743*
MARKET AND ECONOMIC FORCES DRIVE CONVERGENCE OF PERFORMANCE TOWARDS THE MEAN
31 © Allaire – IGOPP, 2014
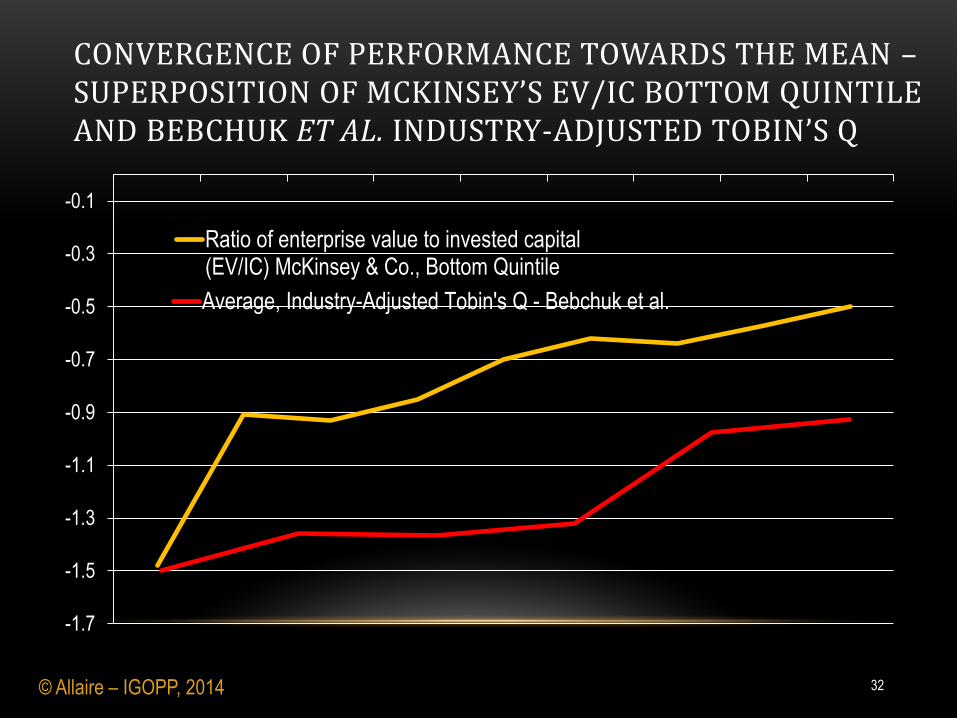
-1.7
-1.5
-1.3
-1.1
-0.9
-0.7
-0.5
-0.3
-0.1
Ratio of enterprise value to invested capital(EV/IC) McKinsey & Co., Bottom Quintile
Average, Industry-Adjusted Tobin's Q - Bebchuk et al.
© Allaire – IGOPP, 2014
CONVERGENCE OF PERFORMANCE TOWARDS THE MEAN – SUPERPOSITION OF MCKINSEY’S EV/IC BOTTOM QUINTILE AND BEBCHUK ET AL. INDUSTRY-ADJUSTED TOBIN’S Q
32
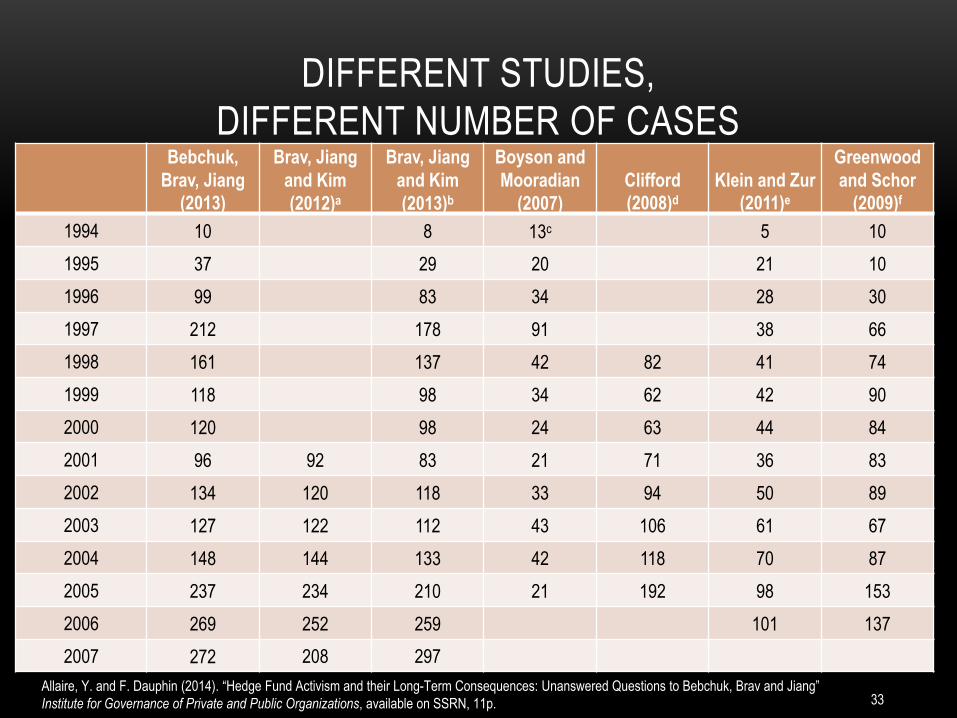
DIFFERENT STUDIES,
DIFFERENT NUMBER OF CASES
Bebchuk,
Brav, Jiang
(2013)
Brav, Jiang
and Kim
(2012)a
Brav, Jiang
and Kim
(2013)b
Boyson and
Mooradian
(2007)
Clifford
(2008)d Klein and Zur
(2011)e
Greenwood
and Schor
(2009)f
1994 10 8 13c 5 10
1995 37 29 20 21 10
1996 99 83 34 28 30
1997 212 178 91 38 66
1998 161 137 42 82 41 74
1999 118 98 34 62 42 90
2000 120 98 24 63 44 84
2001 96 92 83 21 71 36 83
2002 134 120 118 33 94 50 89
2003 127 122 112 43 106 61 67
2004 148 144 133 42 118 70 87
2005 237 234 210 21 192 98 153
2006 269 252 259 101 137
2007 272 208 297
33 Allaire, Y. and F. Dauphin (2014). “Hedge Fund Activism and their Long-Term Consequences: Unanswered Questions to Bebchuk, Brav and Jiang”
Institute for Governance of Private and Public Organizations, available on SSRN, 11p.
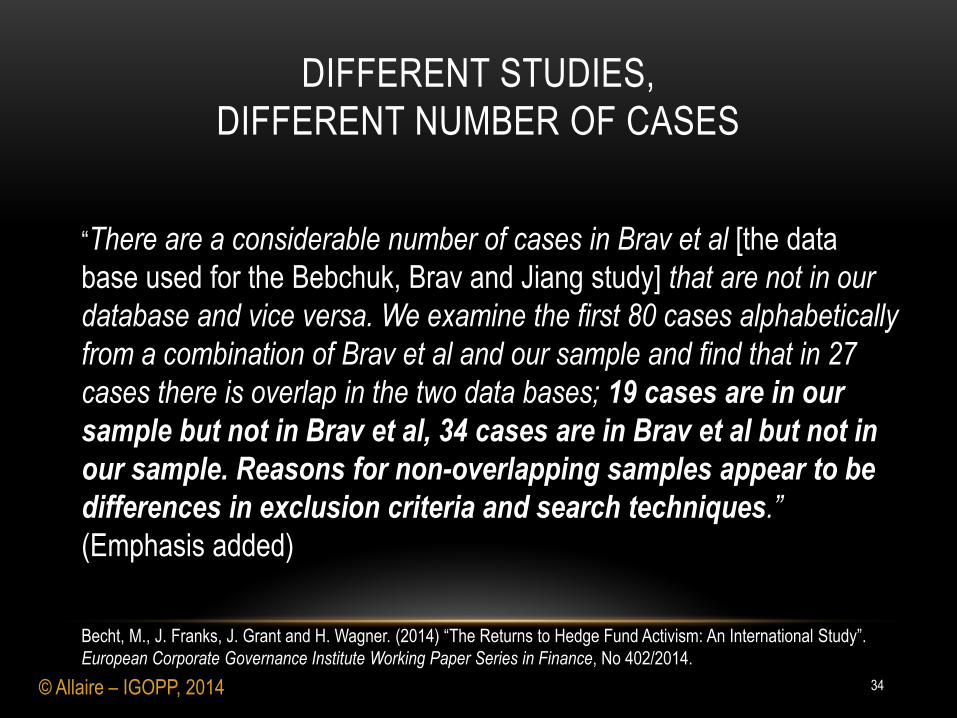
“There are a considerable number of cases in Brav et al [the data
base used for the Bebchuk, Brav and Jiang study] that are not in our
database and vice versa. We examine the first 80 cases alphabetically
from a combination of Brav et al and our sample and find that in 27
cases there is overlap in the two data bases; 19 cases are in our
sample but not in Brav et al, 34 cases are in Brav et al but not in
our sample. Reasons for non-overlapping samples appear to be
differences in exclusion criteria and search techniques.”
(Emphasis added)
Becht, M., J. Franks, J. Grant and H. Wagner. (2014) “The Returns to Hedge Fund Activism: An International Study”.
European Corporate Governance Institute Working Paper Series in Finance, No 402/2014.
DIFFERENT STUDIES,
DIFFERENT NUMBER OF CASES
34 © Allaire – IGOPP, 2014
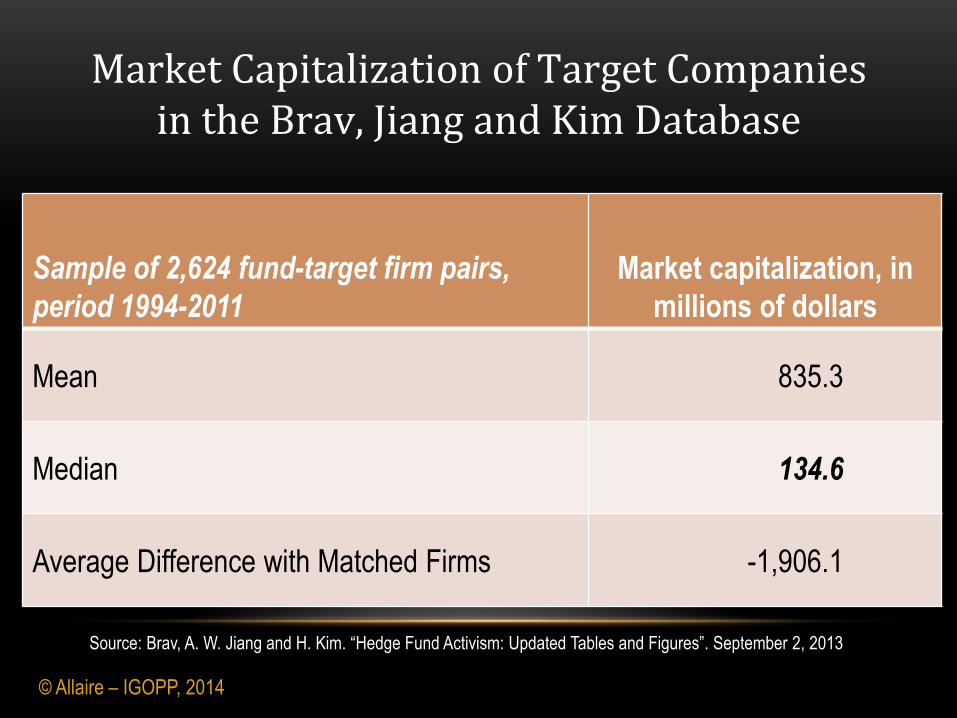
Market Capitalization of Target Companies in the Brav, Jiang and Kim Database
Sample of 2,624 fund-target firm pairs,
period 1994-2011
Market capitalization, in
millions of dollars
Mean 835.3
Median 134.6
Average Difference with Matched Firms -1,906.1
Source: Brav, A. W. Jiang and H. Kim. “Hedge Fund Activism: Updated Tables and Figures”. September 2, 2013
© Allaire – IGOPP, 2014
• The authors have not demonstrated that activist hedge funds, per se,
create lasting, long term value. Their sample data, with all its
limitations, show no longer-term reversal of performance.
• They show that “activist” hedge funds produce short-term «abnormal»
return; but the same result is observed for most 13D filers.
• When activist hedge funds bring some lasting value for shareholders, it
often takes the form of wealth transfer from employees and debt
holders rather than wealth creation.
© Allaire – IGOPP, 2014
SOME OBSERVATIONS ON
THE BEBCHUK ET AL. STUDY
36
“Overall, results in this section suggest that target firm workers do
not share in the improvements associated with hedge fund activism.
They experience a decrease in work hours and stagnation in
wages, while their productivity improves significantly.
Moreover, the relative decrease in productivity-adjusted wages from
above-par levels suggests that hedge fund activism facilitates a
transfer of “labor rents” to shareholders which may account for
part of the positive abnormal return at the announcement of
hedge fund interventions.”
(Brav, Jiang et al, 2013, p.22, emphasis added)
© Allaire – IGOPP, 2014
HEDGE FUNDS: VALUE CREATION OR VALUE TRANSFER?
• …we find that hedge fund activism significantly
reduces bondholders' wealth… Confrontational
campaigns and the acquisition of at least one seat
on the target's board elicit more negative bond
returns. We also find an expropriation of wealth
from the bondholder to the shareholder.
HEDGE FUNDS AND VALUE TRANSFER FROM BOND HOLDERS
Source: “The Impact of Hedge Fund Activism on the Target Firm's Existing Bondholders”, Klein and Zur (2010)
38 © Allaire – IGOPP, 2014
“Our finding that its [shareholder activism] effects
on the creditworthiness of Moody’s-rated issuers
is almost universally negative, even if only
moderately.”
“As short-term shareholder activists have
become more influential, we have observed
numerous examples of concessions to activists
that have eroded credit quality contributing to
downgrades.”
Source: Byrd, F., D. Hambly & M. Watson. Short-Term Shareholder Activists Degrade Creditworthiness of Rated Companies,
Moody’s Investors Services Special Comment, June 2007.
MOODY’S ABOUT SHAREHOLDER ACTIVISM
39 © Allaire – IGOPP, 2014
“Since Aug. 1, 2013, Standard & Poor's has lowered or
placed on CreditWatch with negative implications one-third
of its ratings on companies that initiated spin-off
transactions.”
“Longer-term credit quality for companies that execute a
spin-off has deteriorated as well, since about 40% of
these issuers now have lower ratings.”
Source: Standard & Poor’s press release of the report titled “Spin-Offs, On The Rise Again In The U.S., Can Signal Weaker Credit Quality For Parent Companies”, October 10, 2014
STANDARD & POOR’S – SPIN-OFFS OFTEN COME AT A PRICE TO CREDITORS
40 © Allaire – IGOPP, 2014
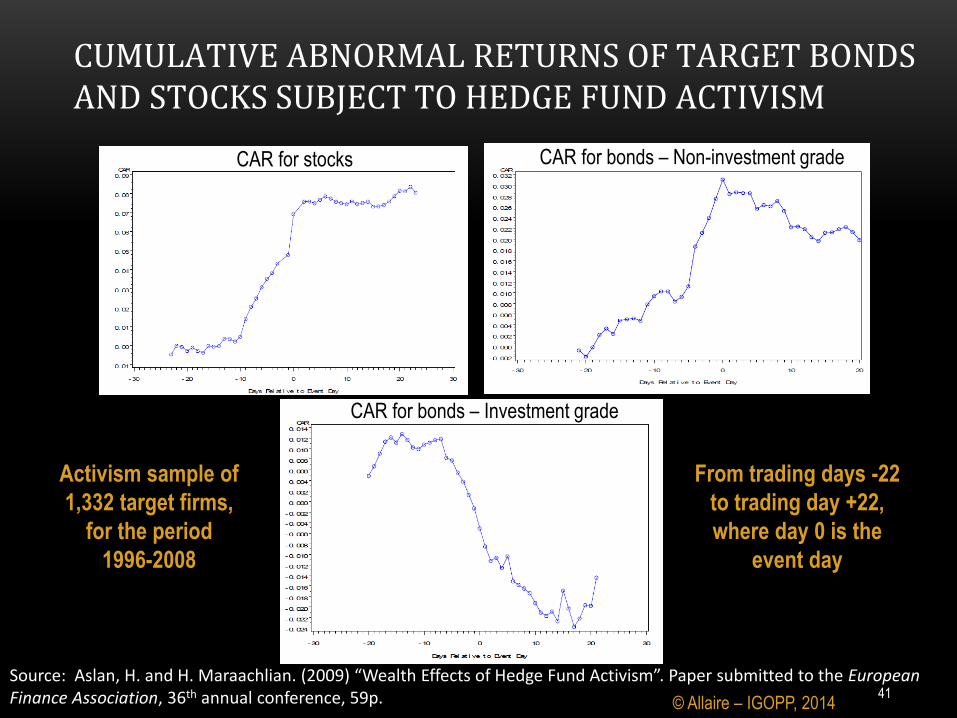
CAR for stocks CAR for bonds – Non-investment grade
CAR for bonds – Investment grade
Source: Aslan, H. and H. Maraachlian. (2009) “Wealth Effects of Hedge Fund Activism”. Paper submitted to the European Finance Association, 36th annual conference, 59p.
From trading days -22
to trading day +22,
where day 0 is the
event day
Activism sample of
1,332 target firms,
for the period
1996-2008
CUMULATIVE ABNORMAL RETURNS OF TARGET BONDS AND STOCKS SUBJECT TO HEDGE FUND ACTIVISM
41 © Allaire – IGOPP, 2014
• “Activist” hedge funds operate in a world without any other
stakeholder than shareholders. That is indeed a myopic concept of
the corporation bound to create social and economic problems,
were that to become the norm for publicly listed corporations.
• The Bebchuk et al. paper illustrates the limits of the econometric
tool kit, its weak ability to cope with complex phenomena; and
when it does try to cope, it sinks quickly into opaque
computations, remote from the observations on which these
computations are supposedly based.
© Allaire – IGOPP, 2014
SOME FURTHER OBSERVATIONS ON BEBCHUK ET AL.
42
• Gow, I. D., S-P. S. Shin and S. Srinivasan. “Activist Directors:
Determinants and Consequences”. Harvard Business School
Working Papers, #14-120, June 2014.
• Goodwin, S. “Myopic Investor Myth Debunked: The Long-Term
Efficacy of Shareholder Advocacy in the Boardroom”.
Available at SSRN, October 2014.
© Allaire – IGOPP, 2014
TWO OTHER RECENT STUDIES PURPORTING TO SHOW POSITIVE LONG-TERM EFFECTS OF HEDGE FUND ACTIVISM
43
“Activist directors appear to be associated with significant strategic and
operational changes in target firms…
We find evidence of increased divestiture, decreased acquisition
activity, higher probability of being acquired, lower cash balances,
higher payout, greater leverage, higher CEO turnover, lower CEO
compensation, and reduced investment.”
• These authors view all of these as positive long-term results from
hedge fund activism!!! Yet, what about return to shareholders?
Source: Gow et al., sample of 1,969 activism events, for the period 2004-2012
GOW, I. D., S-P. S. SHIN AND S. SRINIVASAN STUDY (2014)
44 © Allaire – IGOPP, 2014
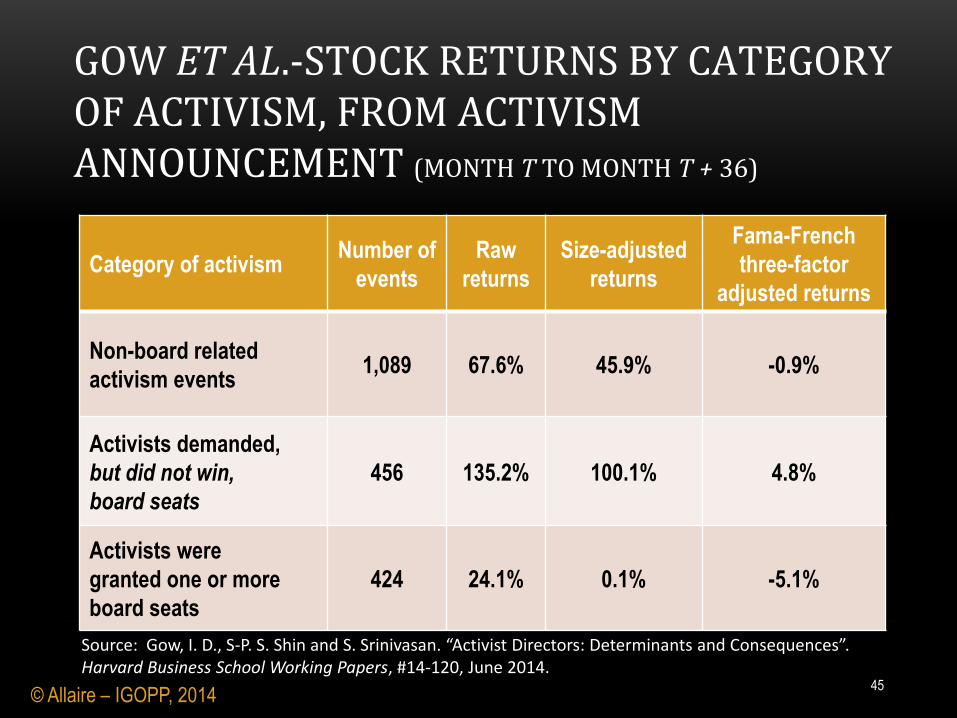
Category of activism Number of
events
Raw
returns
Size-adjusted
returns
Fama-French
three-factor
adjusted returns
Non-board related
activism events 1,089 67.6% 45.9% -0.9%
Activists demanded,
but did not win,
board seats
456 135.2% 100.1% 4.8%
Activists were
granted one or more
board seats
424 24.1% 0.1% -5.1%
Source: Gow, I. D., S-P. S. Shin and S. Srinivasan. “Activist Directors: Determinants and Consequences”. Harvard Business School Working Papers, #14-120, June 2014.
GOW ET AL.-STOCK RETURNS BY CATEGORY OF ACTIVISM, FROM ACTIVISM ANNOUNCEMENT (MONTH T TO MONTH T + 36)
45 © Allaire – IGOPP, 2014
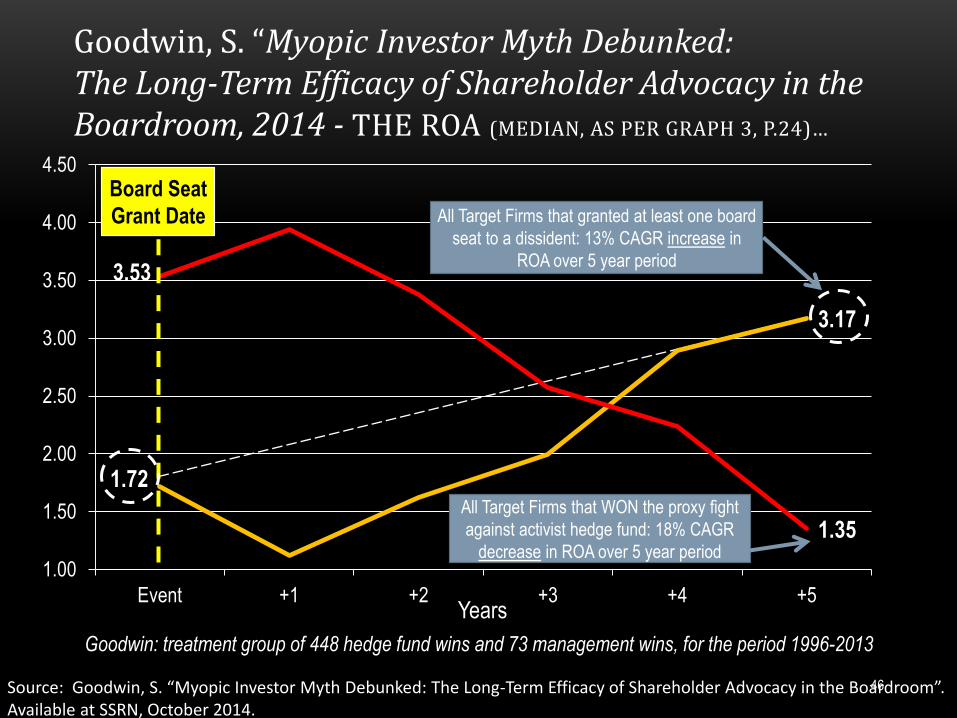
Goodwin, S. “Myopic Investor Myth Debunked: The Long-Term Efficacy of Shareholder Advocacy in the Boardroom, 2014 - THE ROA (MEDIAN, AS PER GRAPH 3, P.24)…
1.72
3.17
3.53
1.35
1.00
1.50
2.00
2.50
3.00
3.50
4.00
4.50
Event +1 +2 +3 +4 +5
Board Seat
Grant Date
All Target Firms that WON the proxy fight
against activist hedge fund: 18% CAGR
decrease in ROA over 5 year period
All Target Firms that granted at least one board
seat to a dissident: 13% CAGR increase in
ROA over 5 year period
Years
Source: Goodwin, S. “Myopic Investor Myth Debunked: The Long-Term Efficacy of Shareholder Advocacy in the Boardroom”. Available at SSRN, October 2014.
Goodwin: treatment group of 448 hedge fund wins and 73 management wins, for the period 1996-2013
46
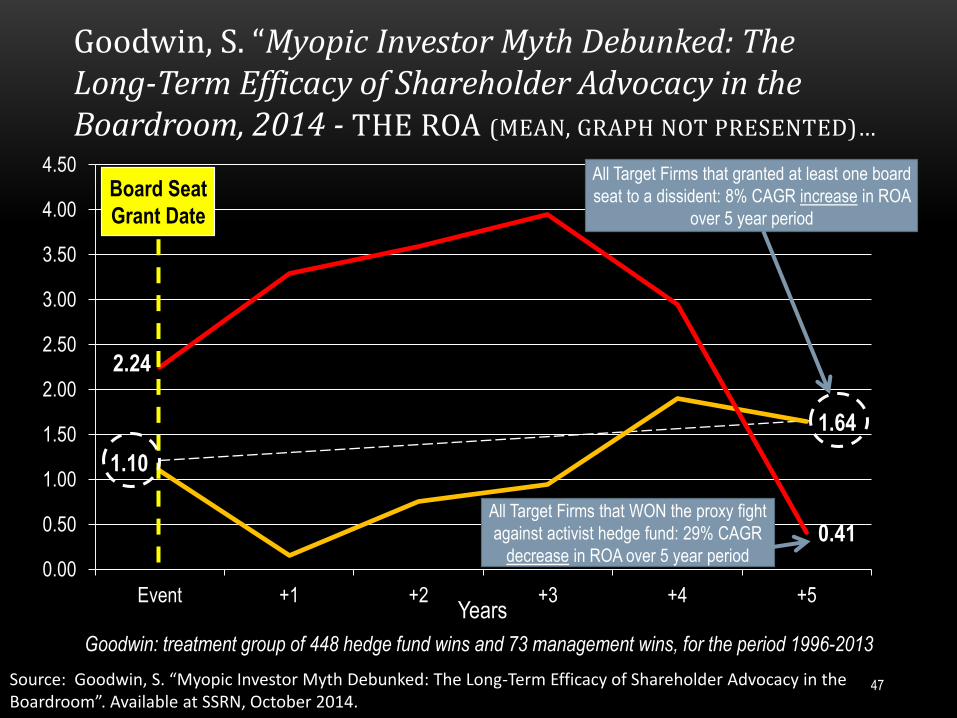
Goodwin, S. “Myopic Investor Myth Debunked: The Long-Term Efficacy of Shareholder Advocacy in the Boardroom, 2014 - THE ROA (MEAN, GRAPH NOT PRESENTED)…
1.10
1.64
2.24
0.41
0.00
0.50
1.00
1.50
2.00
2.50
3.00
3.50
4.00
4.50
Event +1 +2 +3 +4 +5
Board Seat
Grant Date
All Target Firms that WON the proxy fight
against activist hedge fund: 29% CAGR
decrease in ROA over 5 year period
All Target Firms that granted at least one board
seat to a dissident: 8% CAGR increase in ROA
over 5 year period
Years
Source: Goodwin, S. “Myopic Investor Myth Debunked: The Long-Term Efficacy of Shareholder Advocacy in the Boardroom”. Available at SSRN, October 2014.
Goodwin: treatment group of 448 hedge fund wins and 73 management wins, for the period 1996-2013
47
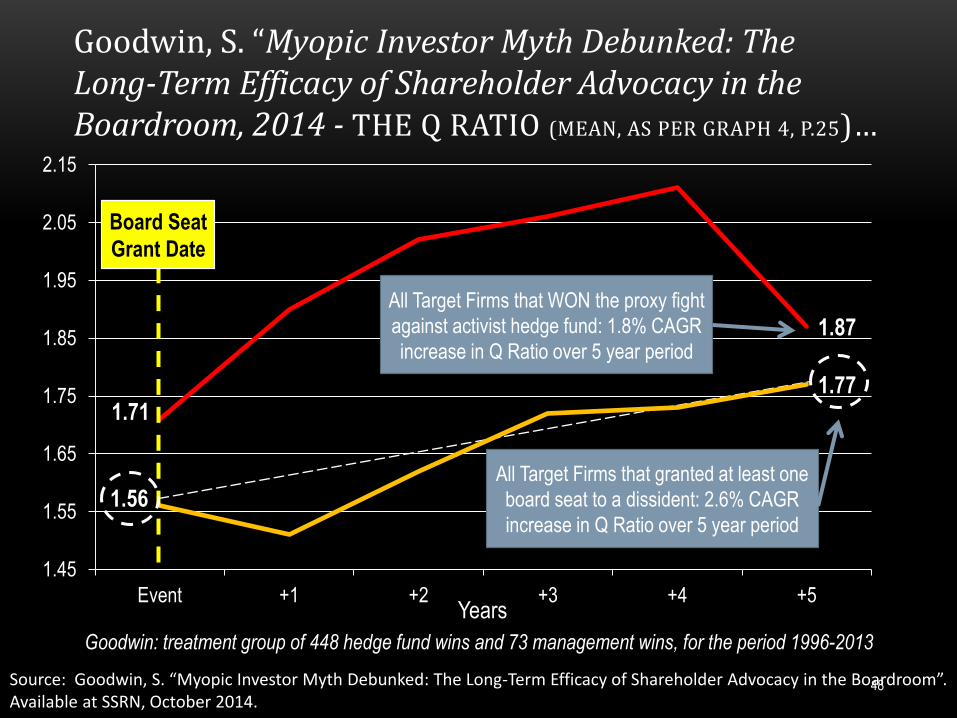
Goodwin, S. “Myopic Investor Myth Debunked: The Long-Term Efficacy of Shareholder Advocacy in the Boardroom, 2014 - THE Q RATIO (MEAN, AS PER GRAPH 4, P.25)…
1.56
1.77 1.71
1.87
1.45
1.55
1.65
1.75
1.85
1.95
2.05
2.15
Event +1 +2 +3 +4 +5
Board Seat
Grant Date
All Target Firms that WON the proxy fight
against activist hedge fund: 1.8% CAGR
increase in Q Ratio over 5 year period
All Target Firms that granted at least one
board seat to a dissident: 2.6% CAGR
increase in Q Ratio over 5 year period
Years
Source: Goodwin, S. “Myopic Investor Myth Debunked: The Long-Term Efficacy of Shareholder Advocacy in the Boardroom”. Available at SSRN, October 2014.
Goodwin: treatment group of 448 hedge fund wins and 73 management wins, for the period 1996-2013
48
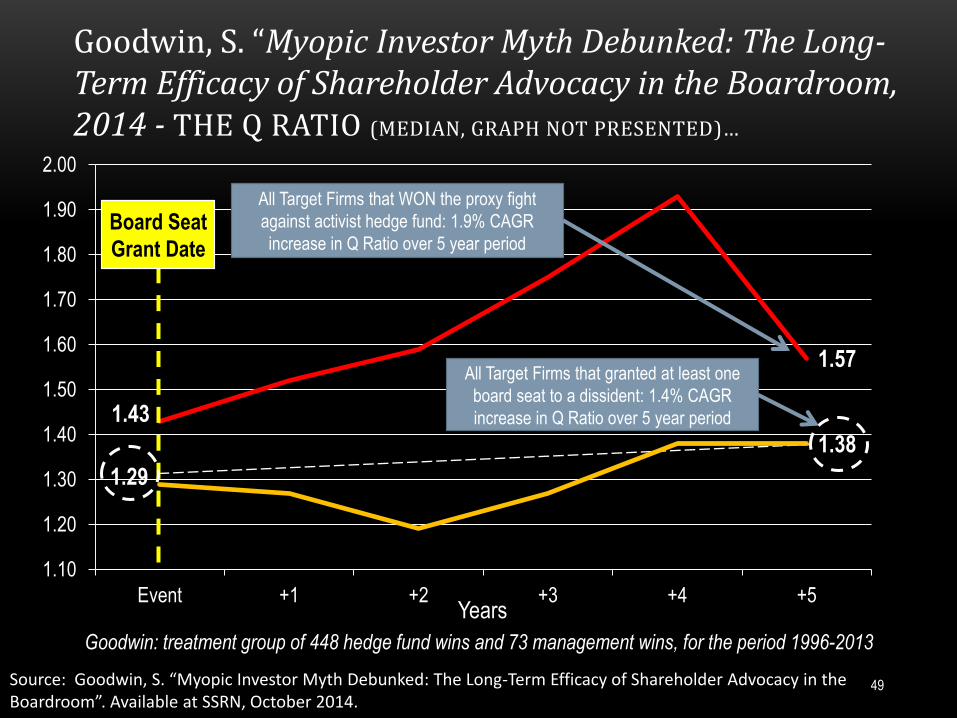
Goodwin, S. “Myopic Investor Myth Debunked: The Long-Term Efficacy of Shareholder Advocacy in the Boardroom, 2014 - THE Q RATIO (MEDIAN, GRAPH NOT PRESENTED)…
1.29
1.38
1.43
1.57
1.10
1.20
1.30
1.40
1.50
1.60
1.70
1.80
1.90
2.00
Event +1 +2 +3 +4 +5
Board Seat
Grant Date
All Target Firms that WON the proxy fight
against activist hedge fund: 1.9% CAGR
increase in Q Ratio over 5 year period
All Target Firms that granted at least one
board seat to a dissident: 1.4% CAGR
increase in Q Ratio over 5 year period
Years
Source: Goodwin, S. “Myopic Investor Myth Debunked: The Long-Term Efficacy of Shareholder Advocacy in the Boardroom”. Available at SSRN, October 2014.
Goodwin: treatment group of 448 hedge fund wins and 73 management wins, for the period 1996-2013
49
“We document strong industry persistence of activism, which is
seen as a threat to yet-to-be-targeted firms in the industry.
[O]ur results demonstrate positive real externalities of hedge fund
activism, establishing that the impact of activism reaches beyond
the firms being targeted and may have been underestimated in
previous studies. […] We show that managers rationally respond to
the threat of activism in the way suggested by the anecdotal
evidence.”
Source: Gantchev, N., O. Gredil and C. Jotikasthira. “Governance under the Gun: Spillover Effects of Hedge Fund Activism”, available on SSRN, March 2014, pp.3-4.
SPILLOVER EFFECTS OF ACTIVISM
50 © Allaire – IGOPP, 2014

“[T]his study shows that hedge fund activism has a preventive effect. […]
[I]n proactive response to an increase in the likelihood of hedge fund
intervention, firms cut CEO pay, reduce cash holdings and leverage, limit
capital investment and R&D expenses, and raise shareholder
distributions and CEO turnover. As a result of these policy improvements,
return on assets increases significantly.
[B]y showing that hedge fund activism is an effective and viable
mechanism for corporate governance, the study allows policymakers to
make more informed decisions as they face heightened pressure to
increase hedge fund regulations."
Source: Zhu, H. “The Preventive Effect of Hedge Fund Activism”, available on SSRN, November 2013, pp.36-37. 51
SPILLOVER EFFECTS OF ACTIVISM
© Allaire – IGOPP, 2014
• …whether from actual attacks by an increasing number of hedge funds or from
pro-active, preventive moves by corporations…
We would witness the following on a massive scale (if we believe the academic
advocates of hedge funds):
increased divestiture, decreased acquisition activity, higher probability of being
acquired, lower cash balances, higher payout, greater leverage, higher CEO
turnover, lower CEO compensation, and reduced investment (Gow, et al., 2014)
Firms cut CEO pay, reduce cash holdings and leverage, limit capital investment and
R&D expenses, and raise shareholder distributions and CEO turnover (Zhu, 2013)
© Allaire – IGOPP, 2014
LET’S IMAGINE THE INDUSTRIAL STRUCTURE RESULTING FROM GENERALIZED
HEDGE FUND MINISTRATIONS
52
That is a fairly dismal world, shorn of long-term investments, of concern for any stakeholder
other than shareholders. Corporate management, already pushed to short-termism, would
be driven to implement hedge funds’ favorite initiatives…
© Allaire – IGOPP, 2014 53
• Public pension funds supplying money to activists and
supporting, more or less tacitly, their initiatives;
• Institutional investors and their soft activism targeting any
and all defenses of boards against unwanted takeovers and
pushing for a shareholder-centric form of governance;
• Proxy advisory firms as cheer-leaders of activist hedge
funds...
THE ESSENTIAL FACILITATORS
OF ACTIVIST HEDGE FUNDS
© Allaire – IGOPP, 2014
• Institutional investors could adopt a longer term
perspective for their holding, refusing to support the
“hard” activism of hedge funds and recognizing the
responsibility of public corporations to multiple
stakeholders; they could, as per Calpers, divest of
hedge funds;
© Allaire – IGOPP, 2014
THERE ARE SEVERAL POTENTIAL COUNTERMEASURES TO THE HEDGE FUND BRAND OF ACTIVISM
55
© Allaire – IGOPP, 2014
• Valeant cum Pershing Square v. Allergan
• PepsiCo v. Trian Fund
A COUPLE OF ACID TESTS COMING UP FOR INSTITUTIONAL INVESTORS
56
See for an analysis of a successful case: Allaire, Y.
and F. Dauphin (2014). “Why was Pershing Square so
successful at Canadian Pacific Railway?”, IGOPP.
“Companies have to think of themselves as serving
stakeholders, they have to worry a lot about their cost to
society. How do you make sure that as a company everything
you do serves the next generation, serves communities,
serves you employees better?”
Source: The Telegraph, PepsiCo chief executive Nooyi brings in healthy profits in lean times, February 1st 2010
INDRA NOOYI, CEO OF PEPSICO (2010): “COMPANIES CANNOT SIMPLY BE DRIVEN BY THE NEEDS OF SHAREHOLDERS”
57 © Allaire – IGOPP, 2014
Source: Allaire, Y. and M. Firsirotu (2011). A Capitalism of Owners, IGOPP, 184p.
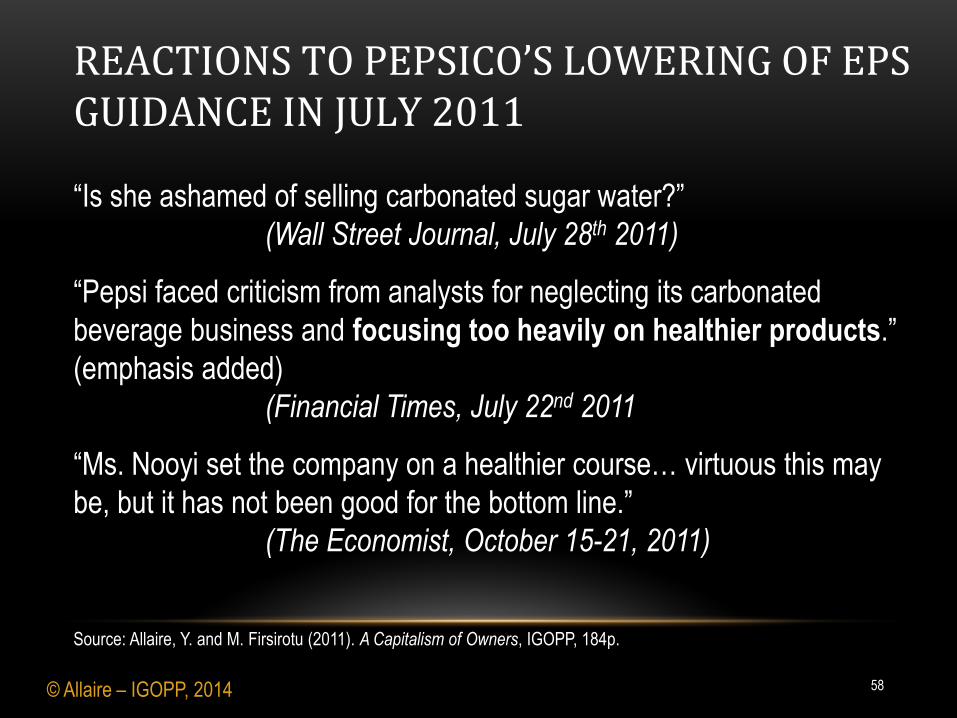
“Is she ashamed of selling carbonated sugar water?”
(Wall Street Journal, July 28th 2011)
“Pepsi faced criticism from analysts for neglecting its carbonated
beverage business and focusing too heavily on healthier products.”
(emphasis added)
(Financial Times, July 22nd 2011
“Ms. Nooyi set the company on a healthier course… virtuous this may
be, but it has not been good for the bottom line.”
(The Economist, October 15-21, 2011)
© Allaire – IGOPP, 2014
REACTIONS TO PEPSICO’S LOWERING OF EPS GUIDANCE IN JULY 2011
58
Source: Allaire, Y. and M. Firsirotu (2011). A Capitalism of Owners, IGOPP, 184p.
• In July 2013, Nelson Peltz, the activist hedge fund manager,
announced that his Fund “Trian” beneficially owned in excess of
$1.3bn of PepsiCo shares.
• Peltz then issued a 59-page white paper making the point that
“the status quo is unsustainable”.
• Peltz proposes that PepsiCo be split in two stock-traded
companies: BeveragesCo and SnacksCo.
• In his estimation, such a strategic move would produce a 25%
return for investors over 2.5 years.
© Allaire – IGOPP, 2014
NELSON PELTZ AND PEPSICO
59
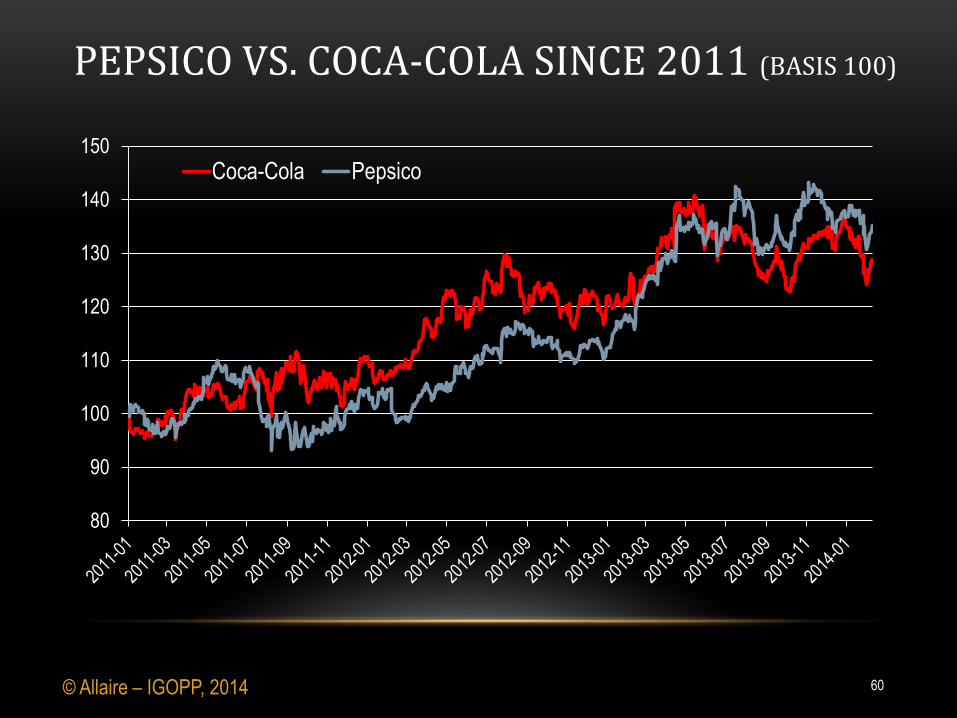
80
90
100
110
120
130
140
150
Coca-Cola Pepsico
© Allaire – IGOPP, 2014
PEPSICO VS. COCA-COLA SINCE 2011 (BASIS 100)
60
Performance with Purpose is PepsiCo’s recognition that the company’s
success is inextricably linked to society’s success. In order to do well by
our shareholders, we also have to take into account the needs and
concerns of a wide range of stakeholders. If our financial success
comes at the expense of the environment, our consumers or our
communities, we will not be viable in the long run.
Indra K. Nooyi, Letter to shareholders,
PepsiCo’s 2013 Annual Report
INDRA NOOYI REITERATES HER MESSAGE
61 © Allaire – IGOPP, 2014
Is she right or is she the forlorn defender of a bygone epoch?
Will institutional investors support
her strategy or will they side with the hedge fund?
© Allaire – IGOPP, 2014 62
• Institutional investors could adopt a longer term perspective for
their holding, refusing to support the “hard” activism of hedge
funds and recognizing the responsibility of public corporations
to multiple stakeholders;
• Different forms of ownership and control: dual
class, time-phased voting, etc.; imitate what
private equity funds and hedge funds do when
they go public!
© Allaire – IGOPP, 2014
THERE ARE SEVERAL POTENTIAL COUNTERMEASURES TO THE HEDGE FUND BRAND OF ACTIVISM
63
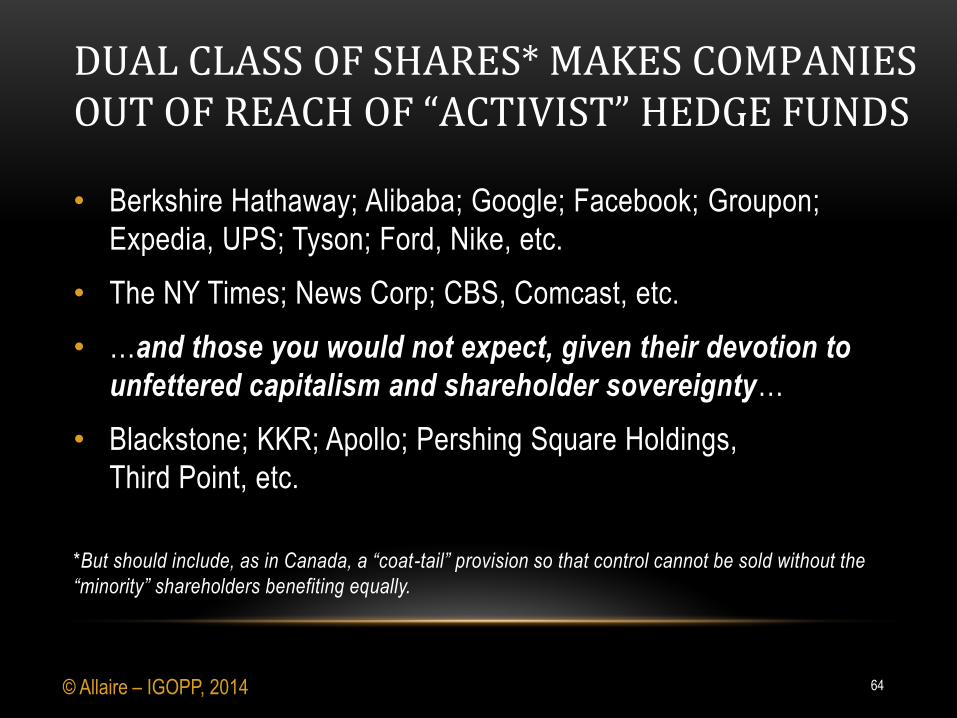
• Berkshire Hathaway; Alibaba; Google; Facebook; Groupon;
Expedia, UPS; Tyson; Ford, Nike, etc.
• The NY Times; News Corp; CBS, Comcast, etc.
• …and those you would not expect, given their devotion to
unfettered capitalism and shareholder sovereignty…
• Blackstone; KKR; Apollo; Pershing Square Holdings,
Third Point, etc.
*But should include, as in Canada, a “coat-tail” provision so that control cannot be sold without the
“minority” shareholders benefiting equally.
© Allaire – IGOPP, 2014
DUAL CLASS OF SHARES* MAKES COMPANIES OUT OF REACH OF “ACTIVIST” HEDGE FUNDS
64
• Institutional investors adopting a longer term perspective for their holding and refusing to support the “hard” activism of hedge funds
• Different forms of ownership and control: dual class, time-phased voting; imitate what private equity funds and hedge funds do when they go public!
• Transformed governance: respond to hedge fund activism with board activism; less independence, more credibility on boards to do what’s right for the long-term welfare of the company.
© Allaire – IGOPP, 2014
THERE ARE SEVERAL POTENTIAL COUNTERMEASURES TO THE HEDGE FUND BRAND OF ACTIVISM
65
(See Allaire, Y. and M. Firsirotu (2013). “On Becoming an Activist
Board! Sketch of a Corporate Governance that Creates Value”,
Working Paper available on SSRN, 23p.
Yvan Allaire, Ph.D. (MIT), FRSC
Executive Chair,
Institute for governance of private and public organizations (IGOPP)
November 14th 2014
DOES HEDGE FUND «ACTIVISM» CREATE LONG
TERM SHAREHOLDER VALUE?
PRESENTATION AT THE ANNUAL MEETING OF
THE CENTER FOR CORPORATE GOVERNANCE
CONFERENCE BOARD OF NEW YORK

![THE TENSION BETWEEN HEDGE FUND ACTIVISM AND CORPORATE … · 2018. 4. 12. · 2016] HEDGE FUND ACTIVISM AND CORPORATE LAW developing their own statutory and case law.6 Therefore,](https://static.fdocuments.net/doc/165x107/6047ae787673463ca9070291/the-tension-between-hedge-fund-activism-and-corporate-2018-4-12-2016-hedge.jpg)