Detection of Disease Gradually Changing Outbreaks Seasonal ...

Does Disease Cause Vaccination? Disease Outbreaks and
Vaccination Response∗
Emily Oster
Brown University and NBER
September 19, 2017
Abstract
Parental fear of vaccines has limited vaccination rates in the United States. I test whether diseaseoutbreaks increase vaccination using a new dataset of county-level disease and vaccination data.I find that pertussis (whooping cough) outbreaks in a county decrease the share of unvaccinatedchildren entering kindergarten. These responses do not reflect changes in the future disease risk.I argue that these facts are best fit by a model in which individuals are both myopic andirrational. This suggests that better promotion of outbreaks could enhance the response.
1 Introduction
Childhood vaccinations are a crucial input to disease prevention. In the period from 1920
through 1940, prior to vaccination, the incidence of pertussis (whooping cough) in the US was
150 cases and 6 deaths per 100,000 people (Kutty et al, 2013). By the early 1990s, case counts
had dropped to just 1 per 100,000 with typically fewer than 10 deaths per year across the
country (Davis et al, 1992). These long run trends in disease reflect trends in vaccination.
The current vaccination rate in the US for pertussis among schoolchildren is around 94%.1
Vaccination rates in the US are not 100%, however, and under-vaccination is
geographically concentrated, leaving some areas with quite low vaccination rates (Omer et al,
2006). Low vaccination rates has contribute to incidence of disease. Pertussis rates in the US
∗Min Kim, Motaz Al-Chanati and Kim Sarnoff provided outstanding research assistance. I thank KateBaicker, Amitabh Chandra, Matt Notowidigdo, Brendan Nyhan, Ben Olken, Jesse Shapiro, Andrei Shleifer andHeidi Williams for helpful comments. All mistakes remain my own.
1https://www.cdc.gov/vaccines/imz-managers/coverage/schoolvaxview/data-reports/coverage-reports/2015-16.html
1

have roughly doubled since 2000, with a corresponding increase in deaths, primarily among
infants.2 Maintaining and increasing vaccination rates in the face of these issues is a goal for
both policy-makers and for many practitioners (Yang and Silverman, 2015; Orenstein and
Seib, 2014).
Undervaccination largely reflect parental choice and fear about vaccine safety and
efficacy (Healy and Paulson, 2015; Glassser et al, 2016; Omer et al, 2012;Omer et al, 2009;
Salmon et al, 2005).3
US vaccine policy has focused on either (a) educating parents about vaccines or (b)
changing school vaccination policies to make it more difficult to enroll unvaccinated children
in school. Both policies have limitations. Changing school vaccination rules is effective (Sadaf
et al, 2013), but faces significant resistance from both politicians and parents (Constable,
Blank and Caplan, 2014; Hoberock, 2017; Associated Press, 2015; Mello et al, 2015; Siepel,
2016). Education campaigns are more palatable in the sense that they preserve parental
choice, but they are largely ineffective (Nyhan et al, 2014; Sadaf et al, 2013; Nyhan and
Reifler, 2015; Williams et al, 2013).
Recently, there has been anecdotal evidence that suggests that disease outbreaks may
increase vaccination rates. In the wake of the 2015 Disneyland measles outbreak, for example,
local news in a variety of locations reported more demand for vaccination (Aleccia, 2015;
Turkewitz, 2015). However, there is little systematic evidence on whether this is true and, if
so, why. Even if the anecdotes do reflect detectable effects, it is difficult to know if they reflect
a rational response to increased disease risk (as in Philipson, 1996), or something more
behavioral. Differentiating between these may be helpful in identifying policies to encourage
vaccination.
This paper brings new data to bear on the relationship between disease outbreaks and
vaccination. I combine county-year data on vaccination among kindergarten children with
county-year data on outbreaks of disease. The data is an unbalanced panel of roughly 1,000
counties in 12 states over 15 years. I also obtain data on Google searches for terms related to
vaccination and disease, local news coverage of disease outbreaks, and information from states
on their policy approach to disease reports.
I estimate the response of pertussis vaccination to pertussis outbreaks. I find that
vaccination does respond to outbreaks: within a county over time, higher disease rates in the
years between birth and kindergarten entry lead to higher vaccination rates at entry.
2See evidence from the CDC: http://www.cdc.gov/pertussis/images/incidence-graph-age.jpg3In the late 1990s a now-discredited study was published in the Lancet suggesting a link between vaccines and
autism. Although the paper was shown to be fraudulent, its effects on vaccination rates have been long-lasting(Mnookin, 2011). More recently, many parental concerns have focused on worries about toxins and metals beingpresent in vaccines.
2

Outbreaks in the year of birth and the year before kindergarten seem to be the most
significant.
These vaccination responses seem to reflect a pattern of increased information and
information seeking. I show that outbreaks also increase Google searches for terms related to
pertussis (“pertussis”, “whooping cough”, “pertussis vaccination”). They also increase the
frequency of news coverage of pertussis in local newspapers.
I consider the possible role of local policy in mediating this result. I exploit a survey of
health departments to estimate whether the response differs across areas depending on their
policy for dealing with outbreaks. In particular, I differentiate between states in which the
state health department coordinates outbreak response and those in which each county
autonomously deals with outbreaks. I find that the vaccination increase appears only in the
states in which the state health department coordinates the outbreak response. These states
also show a more substantial response in Google searches.
In summary, the first part of the paper demonstrates that childhood vaccinations do
respond to disease outbreaks. In the second part of the paper I explore why this occurs. I first
evaluate the extent to which outbreaks provide information about future risks. I show that
the pertussis series is stationary within a county, meaning that current year outbreaks are not
informative about the future, conditional on the past. There is a correlation across years,
however, so someone uninformed about the past could learn from current levels.
I then outline an extremely simple theory of the vaccination decision in which
households choose to vaccinate if the perceived benefits of vaccination, in terms of disease
avoidance, exceed the perceived costs in terms of vaccine risks, inconvenience or other costs.
I consider three versions of this model. I show first that a benchmark version of this
model - in which people are fully informed and fully rational - does not seem consistent with
the data. I then allow for the possibility that people are rational but not fully informed.
Finally, I consider the general case in which people are not rational.
I argue that distinguishing between the latter two cases empirically is valuable in
considering what type of information might be used to change behavior. To do this, I use a
simple machine learning approach with a lasso algorithm to evaluate whether variables other
than disease rate influence behavior. I find that there are some other features of the disease
that matter. This suggests there may be non-rational aspects of the response which policy
could be built around.
This paper contributes to the general literature on interventions to increase vaccination
rates, well summarized by Sadaf et al (2013). Perhaps the most closely related paper on this
topic, Wolf et al (2014), found that a single large outbreak in Washington State did not
impact vaccination of young children. This differs markedly from my findings, which may be
3

because I am able to look at a large number of outbreaks, or because my data focuses on
school-age children and not younger children. More supportive of my findings, Cacciatore,
Nowak and Evans (2016) find that the 2014-2015 Disneyland measles outbreak did increase
confidence in vaccines, although they are not able to look at actual vaccination behavior.
The paper also contributes to the literature on economic epidemiology (e.g. Philipson,
1996; Geoffard and Philipson, 1996; Geoffard and Philipson, 1997; Philipson, 2000; Kremer,
1996; Adda, 2016; Aguero and Beleche, 2016). Philipson (1996) finds that states with more
measles in the late 1980s also had higher vaccination rates in that period. The direction of the
effect is consistent with my findings, although the argument in Philipson (1996) is that the
response is a rational one, given that measles was more common in this period.
The rest of the paper is organized as follows. Section 2 discusses background. Section 3
presents the data and empirical strategy. Section 4 presents the primary results on the
changes in vaccination behavior in response to outbreaks. Section 5 discusses mechanisms for
this effect and Section 6 concludes.
2 Background on Pertussis
This paper focuses on pertussis, commonly called whooping cough.4 Pertussis is a very
contagious bacterial disease. It begins with symptoms similar to a cold, but then evolves into
a severe cough which can last for months. Coughing fits are often followed by a characteristic
“whoop” sound while gasping for air, hence the name. Pertussis can be treated with a course
of antibiotics, and even without this most older children and adults make a full recovery.
Pertussis can be much more serious for children under a year old, who are more likely to
develop complications like pneumonia. Pertussis can be fatal, and in a typical year it is
responsible for 10 to 20 deaths, most among very young babies. Prior to the introduction of
vaccination for pertussis in the 1940s there were approximately 10,000 deaths a year in the US
due to the disease.
Pertussis rates have declined dramatically in the US in the wake of vaccination, but the
disease continues to be endemic. Vaccination protection wanes 3 to 5 years after vaccination
and is typically completely gone after 12 years. In addition, the disease is extremely
contagious. As a result, outbreaks continue at a low level despite high rates of vaccination
overall in the US.
The standard vaccine schedule for pertussis is 2 months, 4 months, 6 months and 15 to
18 months. A fifth dose is typical for children between ages 4 and 6. Depending on the school
system and timing a child with either four or five doses is considered fully vaccinated. Recent
4Details about pertussis here are drawn from Kliegman et al (2011) unless otherwise specified.
4

recommendations also suggest pregnant women should get a pertussis booster, as this
enhances immunity among children younger than two months.
Pertussis is a notifiable disease, which means doctors and county health department are
required to report identified cases to the CDC. In 2014 (the most recent year with available
data), 32,971 cases were reported; this is up 15% from 2013.5
Isolated cases of pertussis are treated individually, but a cluster of cases - typically
defined as two or three cases together, depending on the county - are considered an outbreak.
The CDC, along with individual counties, issues guidelines about behavior during outbreaks.
These guidelines include suggested interventions by school and day care centers, information
provision by doctors and, in some cases, county-led vaccination campaigns.6 During an
outbreak, older children and adults that have not been vaccinated in some time are typically
recommended to receive booster vaccination.
Pertussis vaccination rates in the US are high but not 100%. Based on National
Immunization Survey data from the CDC, approximately 84% of children have 4 or more
doses of the pertussis vaccine, as recommended by the CDC (Hill et al, 2016).
3 Data
3.1 Data
This paper uses a number of data sets. I discuss each in turn.
The data on vaccination rates comes from individual states. The goal was to collect
county-level vaccination data from as many states as possible. Some states do not collect their
own data on vaccinations, relying instead on the National Immunization Survey. For states
which do have their own data collection, data is from one of two sources. In some cases data
comes from annual school surveys, aggregated to the county level. In others, states use
immunization registries. In the latter, only a subset of the registries are mandatory and
optional registries tend to have quite poor coverage.
For data quality reasons, I use data from states that either have a mandatory registry or
provide data from school reports.7 I use the vaccination data at kindergarten entry because it
provides consistent data for the largest number of locations. I focus on pertussis since this is
the only illness with a significant number of outbreaks. In an appendix I will show results for
older children and for measles vaccinations. Summary statistics for the states used in the
5https://www.cdc.gov/pertussis/outbreaks/trends.html6https://www.cdc.gov/pertussis/outbreaks/about.html7The school reports will include private schools but will not include students who are home schooled. Home
schooling accounts for only about 3% of children so any bias from this is likely to be small.
5

analysis appear in Panel A of Table 1. The years of coverage for states varies. I have the
longest time series for California, from 1991 to 2011. The shortest time series is for Missouri,
with coverage only in 2011. Vaccination rates are generally high, although they are below 95%
(a typical herd immunity level) in many states.
The vaccination data measures the share of children with complete vaccination uptake,
as measured by the standards of the state. In some state-years this is four vaccines, and in
others it is five. In some states it would be possible to differentiate between completed
vaccinations and any vaccinations, although for much of the sample the only reporting is on
the share of children with completed vaccinations.
Vaccination rates have declined over the period covered by the data, going down
approximately 4 percentage points from a high in the late 1990s.8 There is also substantial
variation across space. This is illustrated in Figure 1, which shows the distribution of county
vaccination rates in the most recent year of data. Although many counties have vaccination
rates at or close to 100, there is a long tail of low vaccination rates. 7.8% of county-years have
pertussis vaccination rates below 80%, and 12% have rates below 90%. These areas of very
low vaccination are especially at risk for disease outbreaks (Phadke et al, 2016).
The second data set covers disease outbreaks by county over time. These data are
available from the Center for Disease Control (CDC) through the National Notifiable Diseases
Surveillance System (NNDSS). The NNDSS is a nation-wide collaboration, run by the CDC,
for public health departments at various levels (state, local) to share information about a set
of notifiable diseases, of which pertussis is one. Reporting of these diseases is judicially
mandated. The data provides counts, by county-year, of disease cases. It is likely that these
figures are an understatement of total cases, especially for pertussis, but I expect them to be
correlated with the true counts.
Merging disease counts with county-level population data produces disease rates. Panel
B of Table 1 summarizes the rates of pertussis by state. Pertussis cases per 100,000 people
range from 2 to almost 10 per year. The median county-year has zero cases of pertussis; even
at the 75th percentile of county-years, there are only 4 cases.
The third data set is from Google trends. These data report the volume of Google
searches for various terms within a location over time. I focus on three categories of searches.
The first are searches for terms related to pertussis (“pertussis” or “whooping cough”), the
second are searches related to the vaccines (“pertussis vaccination”), and the third are searches
related to vaccine risks (either “vaccine injury” and related terms or “autism and vaccines”).
The full list of search terms in each category appears in Table B.1 in the Appendix.
An issue in constructing the Google trends data is that the data are subject to privacy
8This figure is based off of estimated time dummies in a regression including county fixed effects.
6

thresholds. It is not possible to generate data from rare search terms. To get around this, I
use a technique from Stephens-Davidowitz (2014). In broad terms, this involves searching for
the term of interest along with another common word (for example, “joke” or “sponge”) and
then searching for the common word alone and subtracting the two. Details of the
implementation appear in Appendix B.
I use two sets of Google data. First, I use DMA-level measures which I average over the
entire period from 2004 to 2015. These data indicate which areas have the overall highest
interest in a particular term over this period. They do not adjust for domain-specific search
volume so I also collect data on searches for non-vaccination-related health terms (cancer,
diabetes) and generate area-level residuals with respect to these terms.
Second, I use Google trend data at the state-month level to estimate search response to
disease outbreaks. The Google trends data are merged with disease outbreak data at the
state-month level from the NNDSS system.9
The fourth dataset is on news reports. I scrape news coverage of pertussis at the
county-year level from InfoWeb, a source which includes online and offline newspapers, blogs
and other news sources. I generate counts of articles by county-year. These data are used to
evaluate whether news coverage responds to outbreaks. I do not restrict the articles to those
which cover outbreaks, so there will certainly be a variety of topics covered in the articles
captured, but as we will see they do correlate with disease incidence.
Finally, I use a survey of state and county health departments to understand their
policies for dealing with outbreaks. The primary finding from this survey exercise was that
states differ in their coordination of outbreak response. In four of the states, any outbreaks
are centrally coordinated by the state health department; while in the other eight, counties
have their own control. The analysis will separate these groups to learn whether variations in
policy alter the patterns of results.
Data Validation
The vaccination data used in this paper – from school vaccination reports – comes from the
same source that the CDC uses in their summary of school vaccination rates.10 The CDC
typically summarizes the data at the state level, and does not limit to states with
comprehensive reporting, but this provides some confidence in the validity of this data source.
A second CDC source for vaccination data is the National Immunization Survey, which
9In the period prior to 2011, there is an excess mass of reported cases in December, seemingly due to a policyof listing all cases with unknown timing as occurring in the last week of the year. I will therefore drop Decemberfrom this monthly analysis.
10See, for example, the CDC discussion at this site: https://www.cdc.gov/vaccines/imz-managers/coverage/schoolvaxview/index.html
7

surveys parents of children 19 to 35 months about their children’s vaccination status. These
data cover a different age group and the data collection method is different. Nevertheless,
there is a significant correlation between the two series at the state-year level. A regression of
our measure of vaccination on the NIS measure of coverage of the pertussis vaccine yields a
coefficient of 0.48, significant at the 5% level.
4 Estimation Strategy
I use a simple empirical model. There is a birth cohort b in county c and we observe the
vaccination rate for this cohort at age 5. Denote this vaccination rate as vbc.
At each age leading up to 5, there is a realization of disease state. Denote a vector of
disease measures over this period as rbc where the subscripts indicate the relevance to birth
cohort b in county c. The elements included in this vector could include various measures of
disease, such as disease rate, or counts, or other metrics. Note importantly that this is not the
disease rate among cohort b. Rather, it is the disease profile experienced by this cohort up to
age 5. The disease rate is a function of the entire population.
We model household i as vaccinating their child (who is in birth cohort b in county c) if
the perceived benefits Bbci exceed the perceived costs Cbci. The benefits of vaccination come in
the form of disease avoidance. I assume these benefits may be a function of rbc, either due to
changes in the perceived risk of contracting the disease or changes in the perceived dangers of
the disease. Vaccination occurs if Bbci(rbc) > Cbci. In this case, vaccination rate vbc will be a
function of rbc. It will also be a function of other variables, assuming (for example) that the
perceived vaccination cost is a function of county or time characteristics.
I model vaccination rate as a function of disease measures and other variables. Denote
the elements of rbc as rkbc for k = 1, ..., n . In addition, consider that there is a set of variables
Xb which capture (possibly unobserved) birth cohort characteristics and Xc which capture
(possibly unobserved) county characteristics. These factors could contribute, for example, to
differences in perceived cost of vaccination or differences in perceived benefits, either of which
could impact vaccination rates in this simple framework. In general, we can then write
vbc = f(Xc,Xb, rbc).
A first question in moving to estimation is the appropriate functional form for f(.). I
note that vbc is bounded between 0 and 1 and, in practice, most values are close to 1. Given
this, a linear function for f(.) may not fit the data well. As is common with this type of
variable, I assume f(.) is an inverse logit function. I can then model the logit transform of vbc
(namely, log(
vbc1−vbc
)) as a linear function of Xc,Xb, rbc . Denote the transformed variable vbc.
The linear regression of interest is then:
8

vbc = α + ΨXc + ΦXb+∑k
βkrkbc + εbc (1)
Here note that we can in principle include a rich set of functions of disease in the vector rbc so
this doesn’t restrict us, for example, to assuming that vaccination is a linear function of
disease rates.
For the standard reasons - namely, that we do not necessarily observe the elements of
Xb and Xc, I cannot run this regression directly and generate unbiased estimates of βk. It
seems likely that disease outbreaks are correlated with other county characteristics, including
the whole history of vaccination, so a regression which excludes Xb and Xc will be subject to
omitted variable bias.
We solve this issue with the inclusion of county and cohort fixed effects. These fixed
effects will fully control for the vectors Xb and Xc and will then identify the impact of disease
on vaccination by looking for variation in vaccination rates which lines up with variations in
disease risk. Formally, Equation (2) below specifies the fixed effect regression we run in a
standard form:
vbc = α + γc + δb + ηpct +∑k
βkrkbc + εbc (2)
where γc is a county fixed effect and δb is a birth cohort fixed effect. The variable pct measures
the population in county c in year t. This is not captured fully by county fixed effects since it
may vary over time. The coefficients of interest are still the βk values.
In the primary regressions I consider several sets of variables in rkbc. These include
averages of the disease rate or counts over the previous five years (i.e. during the life of the
child), the maximum rate or count over this period, and rates or counts by year for this
period. In Section 6, I explore a larger set of variables and try to infer more about the
functional form of this relationship.
Reverse Causality The fixed effect framework addresses concerns about omitted variables
at the county level. However, here is still the potential for an issue of reverse causality. In
particular, we may worry that deviations in vaccination rate for cohort b will drive deviations
in disease rate.
This is possible because some of the vaccination of cohort b occurs at earlier ages. If
higher disease rates at (say) the age of 1 increase vaccination rates, then this may impact
disease rates when the child is (say) 3 and also will (mechanically) impact the observed
vaccination rate. This will bias the estimated coefficients downward, making it more difficult
to pick up our hypothesized positive impacts.
9

Any bias from this source is likely to be small in the fixed effect model. In particular,
the disease rate is the rate among the whole population, and we are considering vaccination
rates in a single cohort. Movement in one cohort’s vaccination rates have only a small impact
on total vaccination rates and, therefore, are likely to have, at most, a very tiny impact on
disease outbreak. Moreover, given the average level of vaccination in this data, most of the
variation in disease rate here is simply random.
We can, however, test this directly by regressing disease outbreaks in a given period on
vaccination rates for a single cohort in that period using fixed effects. In particular, take the
disease rate which is realized at the age of 5 - in the year after our measure of vaccination -
and regress it on the vaccination rate among the entering kindergarten class. This relationship
is subject to omitted variable bias, which we can address using the fixed effects. Note that it
is not, however, subject to the same reverse causality concerns since this cohort vaccination
rate is by definition determined before the disease outbreak.
This regression simply asks whether there is any evidence that deviations from the
average vaccination rate in a single cohort seem to be reflected in future deviations from the
average in disease. To the extent this relationship is close to zero, it suggests a limited scope
for bias.
Appendix Table A.1 shows this analysis. The relevant estimate is small and
insignificant, suggesting this bias is not quantitatively important. If concerns about this bias
remain, the results should be seen as a lower bound on the impacts.
Google and News Estimation
In addition to vaccination rates, I also analyze the reaction of news coverage and Google
trends to outbreaks. In the case of news, the observations are at the county-year level. Denote
news coverage in county c in year t as nct. I regress nct on outbreaks in county c in year t.
County and year fixed effects are included to address omitted variable bias concerns and a
control for county-year population is included. The regression is specified in Equation (3).
nct = α + γc + δt + ηpct + Φrct + εct (3)
The coefficient of interest is Φ.
In the case of Google, the data is observed at the state-month level. The geographic
scope is therefore larger, but we have finer timing. This is merged with data on outbreaks at
the state-month level. Denote the volume of Google searches in state s in month m as gsm and
the outbreaks in that state-month as rsm. The fixed effect equation is specified in Equation (4).
10

gsm = α + γs + δm + Ψrsm + εsm (4)
5 Results: Vaccination Behavior and Disease
Outbreaks
This section presents the baseline results for the response of pertussis vaccination to disease
outbreaks. The first subsection describes vaccination response. The second subsection
describes the Google trend results. The third subsection analyzes variation in the vaccination
response across space.
5.1 Vaccination Response to Outbreaks
Primary Results
Table 2 shows the primary results in the paper. The outcome in each column is the
transformed vaccination rate measure. Each column includes a different pertussis measure.
Columns (1) - (3) show impacts of pertussis measured in the disease rate. Column (1) shows
the impact of the average pertussis rate over the preceding five years and Column (2) shows
the impact of the maximum outbreak over the period. Column (3) shows the impact of the
rate in each year.
Columns (4) through (6) show the same results but with counts of cases rather than
with the rate.
The message in all of the columns is similar. More pertussis outbreaks in early
childhood lead to higher vaccination rates in kindergarten. These effects are significant in all
columns. Columns (3) and (6) reveal that these effects are driven by outbreaks in the year
before kindergarten entry and outbreaks in the first year of life. This is not surprising given
that these are the times at which parents are most likely to be consider whether to vaccinate.
Vaccination for pertussis starts in the first year of life and in the year before kindergarten
parents must either vaccinate or obtain an exemption.
Figures 2a and 2b show a graphical interpretation of the relationship, designed to be
more interpretable in terms of magnitudes. To create these graphs, I divide outbreaks
(measured either by the average rate or the average counts) into seven groups and regress
vaccination on dummies for each group. In addition, to facilitate interpretation I use the
vaccination rate (rather than the transformation) as the outcome. I divide the sample into
high and low vaccination counties..
11

Both graphs show a positive relationship between outbreaks and vaccination rate. These
figures also give some sense magnitudes. Based on Figure 2b, being in the highest pertussis
group during early childhood will prompt an increase in vaccination rate of about 1.5
percentage points among low vaccination counties. On average, 92 percent of children in this
group are vaccinated, so this increase accounts for 20 percent of unvaccinated children
becoming vaccinated.
Tables 3 and 4 show four robustness checks, replicating Table 2. First, in Panel A of
Table 3, I limit the data to county-years with 10 or fewer pertussis cases. This represents 88%
of the data and 75% of positive outbreaks, although it eliminates many of the large outbreaks.
The effects remain significant. This helps avoid the concern that these impacts are driven by
the few very large outbreaks which would be widely noticed and publicized.
Second, in Panel B of Table 3 I include a control for future pertussis cases.11 Disease in
the year following the vaccination measurement does not impact vaccination rates. The loss in
sample size (due to having to look forward for future years) also affects some of the main
coefficients, but in the case of counts these remain significant and can be statistically
distinguished from the future impacts.
Third, in Panel A of Table 4, I include county-specific trends in the analysis. The
coefficients are still positive, but lose their significance, perhaps due to the very large set of
controls. As has been pointed out elsewhere (Wolfers, 2006) these controls may be too
conservative in this type of setup.
Finally, in Panel B of Table 4, I weight the data by population counts. This change to
the analysis may be appropriate if we think that each person should have the same weight; on
the other hand, this changes the composition of the population, increasing the weight on large
cities and relatively poorer places. Empirically, these locations are less likely to harbor vaccine
resistance, which impacts the identification in the data. The changes in composition alone are
likely to change the results. Nevertheless, the patterns are similar, if slightly less significant.
Overall these results provide some comfort, although the issues of precision do illustrate
the limitations of the data in this setting.
Secondary Results
The primary results focus on the response of pertussis vaccination to pertussis outbreaks
within a small geographic area. Here, we present a few auxiliary results. Tables for this
section are included in the Appendix.
11This panel excludes the estimation for the maximum rate and count as these did not seem comparable tothe future measure.
12

Geographic Reach of Outbreaks Appendix Table A.2 shows the impact of state-level
pertussis rate on county vaccinations. The regressions suggest that outbreaks elsewhere in the
state also significantly impact vaccination rates. In the case of the pertussis rate, the impacts
are much larger for the state, likely reflecting the fact that a larger number of cases translates
to a smaller rate change. When we turn to counts, in Column 2, we find that counts of cases
in the individual county are more important in magnitude terms than those in the state.
Older Children, Measles I focus on pertussis for kindergarten students because this is the
age group with the best data coverage and this is the disease with the most frequent
outbreaks. However, to the extent possible we would like to confirm that these effects are not
limited to this setting. Appendix Table A.3 shows two additional tests. First, Column (1)
shows the same regressions - pertussis vaccination on pertussis rate - but for 11-year-olds.
Due to data limitations, I look back only five years - as done for the five year olds - and in
general there is less data for this age group. However, we do see a large positive response in
this group, as well.
Column (2) shows the impact of measles outbreaks on measles vaccination for
kindergartners. Measles outbreaks are rare even relative to the pertussis outbreaks, so the
effects here are identified off of a very small number of outbreaks. Despite this, we do see
evidence that a higher measles rate prompts increases in vaccination. Both of these provide
some helpful confirmation that the results are not limited to a single specification.
Other Vaccinations Do pertussis cases also impact vaccination for other diseases?
Appendix Table A.4 shows the impact of pertussis outbreaks on measles vaccinations (all
measles vaccine and MMR vaccines). There is some evidence of cross-vaccine response,
although the effects are smaller than the own-vaccine response and less significant. Still, this
suggests that there is some more general re-evaluation of vaccination.
5.2 Google and News Response to Outbreaks
The above results show that vaccinations respond to disease outbreaks. We turn now to
whether we see a response in either Google searches or news mentions.
Figure 3a and 3b show the impact of outbreaks in a state-month on Google searches for
information about the disease, information about vaccination and searches for terms related
to vaccine dangers. Figure 3a estimates the impact of the number of cases. Figure 3b
estimates the impact of cases measured in standard deviations from the mean in the county.
The results in either case are the same. Outbreaks prompt a significant increase in
searches for information on the disease and for information on the vaccine. Both of these
13

effects are short lived - they last a month or two before dissipating. The effects are reasonably
large. In the case of searches for pertussis, a one standard deviation increase in cases increases
searches by 0.2 standard deviations. These results show that information about outbreaks is
reaching the population.
In contrast there is no evidence that outbreaks increase searches for vaccine injury terms
or for terms that link vaccines to autism. This is despite the fact that, in general, these
searches move together. In other words, although it is generally the case that increases in
searches for pertussis vaccination also increase searches for terms related to vaccine dangers,
the increase in vaccine searches that is prompted by outbreaks does not seem to be
accompanied by an increase in interest in vaccine risks.
Table 5 estimates the impact of pertussis on news reporting about the disease. The
outcome measured here is a count of articles in newspapers in the county that mention
pertussis or whooping cough. The results show consistent evidence that outbreaks increase
news coverage of pertussis. As with the Google evidence, this suggests that information about
outbreaks does get disseminated.
5.3 Variation in Vaccination Response across Local Areas
From a policy standpoint, the key follow-on question to the results above is what - if anything
- magnifies the impact of pertussis cases. Identifying the size of the largest effects may give a
better sense of whether this is a productive avenue for policy.
I focus in this analysis on variation in response across local areas.
Based on a survey of county and state health departments, I identified an important
cross-state difference in the approach to outbreaks. Specifically, a subset of states centrally
coordinates responses, while the remainder coordinate at a county level. The full sample in
the paper includes 12 states: Alabama, Arizona, California, Kansas, Kentucky, Michigan,
Missouri, New York, North Carolina, North Dakota, Oregon and Texas. In four of these states
- Alabama, North Dakota, Oregon and Michigan - the response to disease outbreaks is
coordinated directly by either the state or, in the case of Michigan, regional health offices. In
these states the counties may play a role in disseminating information about disease outbreaks
but they do so at the direction of the state or regional office. In the other eight states counties
have autonomy with respect to their response to disease outbreaks. The counties may notify
the state and ask for help, and the state may provide some guidelines, but the counties
ultimately decide their own policies.
In principle, both structures have advantages. State-coordinated response could
dominate since those dealing with outbreaks will have more experience in this sphere (a state
14

overall experiences many more outbreaks than individual counties) and the state may have a
better ability to see the whole picture, including cross-county spread, etc. On the other hand,
locally-sourced responses may allow for better targeting of the response to the individual
county circumstances.
Columns (1) through (4) of Table 6 show the primary regressions in the paper
(replicating Columns (1), (2), (4) and (5) of Table 2), separating the effect by areas with
central coordination versus those with county autonomy. All four columns make clear that the
effects are driven by states with centralized responses. The effect in this group is much larger,
and is statistically distinguishable from the effect in the other group.
Columns (5) of Table 6 shows the evidence on the response of Google searches for
“pertussis” (and related terms) in the two groups of states. This is the search term which was
most responsive to outbreaks. Consistent with the evidence on vaccination response, the
Google search response on both terms is substantially higher for the centrally coordinated
states.
An important caveat to these results is that they rely on cross-state variation, and it is
difficult to know whether differences across states should be attributed to the particular issue
of county autonomy. There may well be other state-level differences which are driving the
results. To the extent that we can attribute these differences to the structure of outbreak
management, there is an open question of what these states are doing well. The increase in
Google interest suggests states must be driving consumer behavior in some way. More
evidence on the specifics of this behavior could drive policy responses. At a minimum, these
results suggest fairly sizable vaccination responses are possible.
6 Mechanisms Behind Response
The previous section shows that vaccination rates respond to disease outbreaks. In this
section I try to understand the mechanisms behind this response. This section assumes that
vaccination decisions are ultimately made by the household. This seems to be a reasonable
assumption, but it is worth saying that when I discuss mechanisms here I am not taking a
stand on how the information is conveyed to people. It may be that information on disease is
spread around by individual schools, by state governments, by doctors office or others. These
are all consistent with the idea that households get information from a variety of sources and
make decisions based on this information.
The most straightforward explanation for increased vaccination rates is that they are a
rational response to an increase in disease risk; this would be consistent with the explanation
in (for example) Philipson (1996) who studies measles in an earlier period. The first section
15

below evaluates the information content in the outbreak, asking whether an outbreak
indicates an increase in future disease risk.
Section 6.2 then discusses a decision framework for the problem and suggests that we
may learn about the mechanisms through the functional form of the relationship between
disease outbreaks and vaccinations. In Section 6.3 I use a simple machine learning approach
to identify functional form.
6.1 Information in Outbreak
To begin, I evaluate the extent to which current outbreaks are informative about future
disease risk.
I do this in two ways. First, I ask simply whether outbreaks in the current year are
correlated with outbreaks in future years. I find that they are: The correlation between the
current year and the previous year is close to 0.20, and regressing current year rate on
previous year rate (with no other controls) leads to a significant coefficient of 0.15. This
suggests that if you knew nothing about the overall risk of disease in the area, then observing
a higher rate in the current year would be informative. It is notable that the correlation is
short lived: outbreaks two years ago do not predict current outbreaks.
A more rigorous question is whether observing a high pertussis rate in a given county in
a given year should lead one to think that this will result in a permanent increase in pertussis.
Effectively, this asks whether there is a unit root in the rate series. I test for this using a
Dickey-Fuller test. The test strongly rejects the null of a unit root, suggesting the rate series
within a county is stationary.
In terms of speaking to the question of information, this suggests two things. First, for
someone who sees the complete past time path of rates, there is no information conveyed by
the current year’s pertussis cases; if anything, current cases predict fewer cases in the slightly
more distant future. Second, and in contrast to the first, for someone who is uninformed -
who does not know about the general pertussis situation in the county - observing cases in the
current year is somewhat predictive of the future.This predictive power is fairly limited.
One interpretation of the lack of a unit root is that when there are outbreaks, the
vaccination rate goes up, and this prevents future outbreaks. Given the scope of the responses
estimated here, that force is probably not sufficiently large to actually drive this result.
Regardless, from the standpoint of any individual household what matters for their decision -
given that they are a small part of the vaccination rate - is the realized stationarity of the
series, not why it is stationary.
I turn now to incorporating these facts into a decision framework.
16

6.2 Decision Framework
I return to the basic framework in which parents choose to vaccinate their children if the
perceived benefits exceed the perceived costs. As above, denote the perceived costs of
vaccination for household i in location c as Cci.12 These costs could include the true monetary
costs of vaccination, any inconvenience costs, and any perceived or actual vaccine risks. The
benefits of vaccination come in the form of disease avoidance, either due to changes in disease
risk or changes in perceived loss from contracting the disease. I denote the benefits Bci and
indicate their dependence on disease measures rc by writing Bci(rc).
A household will choose to vaccinate if Bci(rc) > Cci. Note that as written, rc can
contain various measures of disease, including the number of cases, the disease rate, deviations
from normal and so on. For ease of notation, however, denote r1c as the actual disease risk in
the county.
Fully Informed Model Consider first the model of a fully informed and fully rational
individual. For this person, the decision problem simplifies to
r1cBci > Cci
That is, they vaccinate if the disease risk multiplied by the loss from the disease exceeds the
cost.
For someone fully informed, the loss to the disease is known, as is the cost of
vaccination. In Section 6.1 we observe, again, that if you are fully informed, r1c - the true
future disease risk - is not informed by the current disease level. As a result, for this type,
there should be no response to disease outbreak, and these events will not increase the degree
of vaccination. This stylized model - which would be in the spirit of Philipson (1996) - does
not, therefore, seem consistent with the data.
Partially Informed Rational Model Consider now a second version of the above model
in which the household is still fully rational with the same decision problem but they are not
fully informed about the probability of disease in their area. Instead, these households
perceive disease risk as equal to some other rmc element of the vector. In this model, we
restrict that this element is also some observed measure of disease risk, although it may not
be the true risk. A simple version of this is one in which rmc is just the risk of disease in the
previous year. In this model, vaccination occurs if rmc Bci > Cci.
12Since we are now discussing individual households in a decision framework, I drop the b subscript for birthcohort; obviously it would be straightforward to include that.
17

This captures someone who knows the costs of vaccination (or their perceived costs) and
knows the downsides of pertussis but is not informed about the disease risk in their area. This
may be a practical model, since this is a sufficiently rare event that people may not know
disease details. For an uninformed person, the evidence in Section 6.1 on correlations shows
that observing disease outbreaks in the current year does predict future outbreaks. Effectively,
people are learning something about the overall area disease risk. The model is rational in the
sense that people are thinking specifically about disease risk, with a known benefit and cost,
but they are simply not using the fully informed risk estimate.
To the extent that people observe a rmc which is higher than they anticipated, they may
react by vaccinating their children. In particular, although r1c is not dependent on outbreaks,
rmc may depend on recent observed risks. This would be trivially the case if rmc was the
previous year disease risk.
In this case, increases in the disease risk in a given year will increase vaccination rates.
Note importantly that this model puts restrictions on this dependence. Households in this
model may respond to changes in disease rate, but they should not respond to other features
of disease, controlling for the rate. This is the sense in which they are rational.
Non-Rational Model We can contrast the above with the general case in which we do
not restrict the functional form. That is, we simply model behavior as households vaccinate
when Bci(rc) > Cci. In this model the benefits can depend on arbitrary function of disease - if
we think that rc has k elements, the models above restrict the dependence of behavior to a
subset of these elements, and this model does not. It allows for the possibility that perceived
risk of disease depends on various aspects of outbreaks, and also for the possibility that the
loss associated with the disease depends on outbreaks. This could occur if people hear about
the consequences of pertussis as a result of local cases.
Distinguishing Models Distinguishing between these models may be important for
creating policy to change vaccination rates. Under the fully informed model, efforts to inform
individuals about disease risk would have no impact on vaccination rates. In this case, other
polices (for example, changes in school exemption policy) would be a better option. Under the
partially informed model there may be scope for informing people about the pertussis rate.
From a policy standpoint, however, this is limited in the sense that the response is constrained
by the rate. To the extent that the data is best described by the non-rational model, there is
the greatest scope for policy intervention. If, for example, there is some vaccination response
to having any cases of pertussis, policy could take advantage of this more frequently.
As noted above, the data seem less consistent with the fully informed model, given the
18

assumptions stated.
Thus far, however, what we observe would be consistent with either of the other models
articulated. What distinguishes between these models is the functional form of the relationship
between pertussis outbreaks and vaccination behavior. In the rational case, the disease rate
should be sufficient to predict vaccination response. In the non-rational case, it will not be. In
the next section I use a simple application of machine learning methods to estimate this.
It is important to note that this model does not take into account heterogeneity across
individuals in types. That is: I allow households to vary in Cci – their vaccination costs – so
this model can accommodate the fact that some people believe vaccines are more costly than
others. But I do not allow that there may be some people who are fully rational and others
who are not. In practice, however, the test suggested here boils down to a test of whether
some non-trivial fraction of the population falls in to the non-rational group. If there are some
rational people and some non-rational people, then we could still see some responses to
disease outbreaks.
6.3 Estimation
The discussion above suggests that we consider distinguishing between models by modeling
the functional form of the relationship between vaccination and disease. We recall Equation
(1) above. In that equation, I specify that the vaccination rate may depend on any of the k
elements of rbc. In the estimation above I focus on simple measures - the disease rate by year
or disease counts - but do not include them together.
The goal here is to include in the rbc a rich set of measures of pertussis, and observe the
functional form of the relationship.
An issue with estimation in practice is that if rbc includes many variables, this
estimation is subject to concerns about over-fitting. To address this, I use a lasso algorithm.
The lasso selects a subset of variables that are above a threshold level of predictive power for
predicting the outcome from a large set of possible factors.
I feed into the lasso a large number of measures of disease – rates, counts, smaller
measures of counts, etc.
The lasso selects four variables as significant determinants of vaccination rate. They are:
(1) the maximum rate over the five year period, (2) an indicator for any cases two years before
entry (this enters negatively), (3) an indicator for more than 1 case in the year of birth and
(4) an indicator for more than 5 cases in the year of birth. Table 7 shows the primary
regression in the paper using only these measures. They are individually significant. The final
row of the table gives the p-value for the joint test of all of the non-rate measures being
19

significant; they are jointly significant.
These results provide some suggestive evidence that characteristics of the disease other
than the disease rate may influence behavior. If true, this suggests progress may be made by
promoting any disease outbreak, even if it is small. For example, the data indicates that there
is some response to even a single case of pertussis in the year of birth, which is a sufficiently
common occurrence that there would be many instances in which this might be used to
influence behavior.
7 Conclusion
Anecdotal evidence suggests that vaccine-resistant parents can be swayed toward vaccination
by disease outbreaks. This paper provides evidence suggesting those anecdotes are borne out
in the data. Using a data set of county-year vaccination rates and outbreaks, I show that
vaccination rates among entering kindergartners are increased by outbreaks of disease. For
large outbreaks, these effects are sizable.
It is difficult to fit these facts with a fully informed model in which households react to
disease risk. Instead, I suggest the data may be better fit by a model in which households are
both myopic and have some behavioral biases in processing information. For these households,
recent disease cases have an out-sized effect and disease matters beyond the disease rate.
The key policy issue motivating this paper is how to increase childhood vaccination
rates. The paper shows that disease outbreaks may be a powerful motivator and, in particular,
that outbreaks may be a useful motivation even if they are not actually informative. I show
that the structure of outbreak response across counties and states can importantly influence
the size of this response. In particular, states which coordinate their response through state
health departments are much more effective at promoting vaccination response than those
which coordinate at the county level. This may reflect better general management.
It is important to note that this paper is not able to identify the specific policies which
are effective. It is possible that the effects are driven by changes in how doctors approach the
conversation with patients in light of an outbreak. It is possible the effects are driven by
pressure applied within schools against children who are not vaccinated. Future work could
elucidate these mechanisms in an effort to more fully take advantage of them.
20

References
Adda, Jerome, “Economic Activity and the Spread of Viral Diseases: Evidence fromHigh Frequency Data,” The Quarterly Journal of Economics, 2016, p. qjw005.
Aguero, Jorge M. and Trinidad Beleche, “Health Shocks and the Long-LastingChange in Health Behaviors: Evidence from Mexico,” Working papers 2016-26,University of Connecticut, Department of Economics October 2016.
Aleccia, JoNel, “Measles vaccinations jump after scare, public dialogue,” SeattleTimes, March 31, 2015.
Associated.Press, “Mandatory vaccine bill sparks protests in California,” CBS News,April 9, 2015.
Cacciatore, Michael A, Glen Nowak, and Nathaniel J Evans, “Exploring TheImpact Of The US Measles Outbreak On Parental Awareness Of And Support ForVaccination,” Health Affairs, 2016, 35 (2), 334–340.
Constable, Catherine, Nina R Blank, and Arthur L Caplan, “Rising rates ofvaccine exemptions: problems with current policy and more promising remedies,”Vaccine, 2014, 32 (16), 1793–1797.
Davis, S. F., P. M. Strebel, S. L. Cochi, E. R. Zell, and S. C. Hadler,“Pertussis surveillance–United States, 1989-1991,” MMWR CDC Surveill Summ,Dec 1992, 41 (8), 11–19.
Geoffard, Pierre-Yves and Tomas Philipson, “Rational epidemics and their publiccontrol,” International economic review, 1996, pp. 603–624.
and , “Disease eradication: private versus public vaccination,” The AmericanEconomic Review, 1997, 87 (1), 222–230.
Glasser, John W, Zhilan Feng, Saad B. Omer, Philip J. Smith, and Lance E.Rodewald, “The effect of heterogeneity in uptake of the measles, mumps, andrubella vaccine on the potential for outbreaks of measles: a modelling study,” TheLancet Infectious Diseases, 2016, pp. –.
Healy, Jack and Michael Paulson, “Vaccine Critics Turn Defensive Over Measles,”The New York Times, 2015.
Hill, HA, LD Elam-Evans, JA Singleton, and V Dietz, “Vaccination CoverageAmong Children Aged 19a35 Months a United States, 2015,” Mortality andMorbidity Weekly Reports, 2016, 65, 1065–1071.
Hoberock, Barbara, “Mandatory vaccination critics rally against legislation removingexemptions,” Tulsa World, February 9, 2017.
Kliegman, Robert M, Richard E Behrman, Hal B Jenson, and Bonita MDStanton, Nelson Textbook of Pediatrics, Elsevier Health Sciences, 2007.
Kremer, Michael, “INTEGRATING BEHAVIORAL CHOICE INTOEPIDEMIOLOGICAL MODELS OF AIDS.,” Quarterly Journal of Economics,1996, 111 (2).
21

Kutty, Preeta, Jennifer Rota, William Bellini, Susan B. Redd, AlbertBarskey, and Gregory Wallace, Manual for the Surveillance ofVaccine-Preventable Diseases, Chapter 7: Measles Centers for Disease Control andPrevention, 6 ed. 2013.
Mello, Michelle M, David M Studdert, and Wendy E Parmet, “Shiftingvaccination politicsathe end of personal-belief exemptions in California,” NewEngland Journal of Medicine, 2015, 373 (9), 785–787.
Mnookin, Seth, The panic virus: a true story of medicine, science, and fear, Simonand Schuster, 2011.
Nyhan, B. and J. Reifler, “Does correcting myths about the flu vaccine work? Anexperimental evaluation of the effects of corrective information,” Vaccine, Jan 2015,33 (3), 459–464.
Nyhan, Brendan, Jason Reifler, Sean Richey, and Gary L Freed, “Effectivemessages in vaccine promotion: a randomized trial,” Pediatrics, 2014, 133 (4),e835–e842.
Omer, Saad B., Daniel A. Salmon, Walter A. Orenstein, M. Patricia deHart,and Neal Halsey, “Vaccine Refusal, Mandatory Immunization, and the Risks ofVaccine-Preventable Diseases,” New England Journal of Medicine, 2009, 360 (19),1981–1988.
, Jennifer L. Richards, Michelle Ward, and Robert A. Bednarczyk,“Vaccination Policies and Rates of Exemption from Immunization, 2005-2011,” NewEngland Journal of Medicine, 2012, 367 (12), 1170–1171.
, William K. Y. Pan, Neal A. Halsey, Shannon Stokley, Lawrence H.Moulton, Ann Marie Navar, and Daniel A. Pierce Mathew annd Salmon,“Nonmedical exemptions to school immunization requirements: Secular trends andassociation of state policies with pertussis incidence,” The Journal of the AmericanMedical Association, 2006, 296 (14), 1757–1763.
Orenstein, Walter and Katherine Seib, “Mounting a good offense against measles,”New England Journal of Medicine, 2014, 371 (18), 1661–1663.
Phadke, Varun, Robert A. Bednarczyk, Daniel A. Salmon, and Saad B.Omer, “Association between vaccine refusal and vaccine-preventable diseases in theunited states: A review of measles and pertussis,” The Journal of the AmericanMedical Association, 2016, 315 (11), 1149–1158.
Philipson, Tomas, “Private vaccination and public health: An empirical examinationfor US measles,” Journal of Human Resources, 1996, pp. 611–630.
, “Economic epidemiology and infectious diseases,” Handbook of health economics,2000, 1, 1761–1799.
Sadaf, A., J. L. Richards, J. Glanz, D. A. Salmon, and S. B. Omer, “Asystematic review of interventions for reducing parental vaccine refusal and vaccinehesitancy,” Vaccine, Sep 2013, 31 (40), 4293–4304.
Salmon, Daniel A., Lawrence H. Moulton, Saad B. Omer, Patricia deHart,Shannon Stokley, and Neal A. Halsey, “Factors associated with refusal ofchildhood vaccines among parents of school-aged children: A case-control study,”Archives of Pediatrics and Adolescent Medicine, 2005, 159 (5), 470–476.
22
Siepel, Tracy, “California’s vaccine law: Opponents moving, home schooling to avoidcontroversial mandate,” The Mercury News, June 2016.
Stephens-Davidowitz, Seth, “The cost of racial animus on a black candidate:Evidence using Google search data,” Journal of Public Economics, 2014, 118, 26–40.
Turkewitz, Julie, “More than 1000 in Arizona are Watched for Measles,” New YorkTimes, Jan 29,2015.
Williams, S. E., R. L. Rothman, P. A. Offit, W. Schaffner, M. Sullivan, andK. M. Edwards, “A randomized trial to increase acceptance of childhood vaccinesby vaccine-hesitant parents: a pilot study,” Acad Pediatr, 2013, 13 (5), 475–480.
Wolf, Elizabeth R., Douglas Opel, M. Patricia DeHart, Jodi Warren, and AliRowhani-Rahbar, “Impact of a pertussis epidemic on infant vaccination inWashington state,” Pediatrics, 2014, 134 (3), 456–464.
Wolfers, Justin, “Did unilateral divorce laws raise divorce rates? A reconciliation andnew results,” The American Economic Review, 2006, 96 (5), 1802–1820.
Yang, Tony Y. and Ross D. Silverman, “Legislative Prescriptions for ControllingNonmedical Vaccine Exemptions,” The Journal of the American MedicalAssociation, 2015, 313 (3), 247–248.
23

Figure 1: Pertussis Vaccination Rate Variation Across Space
05
1015
Den
sity
.75 .8 .85 .9 .95 1Pertussis Vaccination Rate
kernel = epanechnikov, bandwidth = 0.0099
Variation in Pertussis Vaccination Across Counties
Notes: These figures show the density of vaccination rates across counties in the 2010-2011 period. I average vaccination rates for
2010 and 2011 and drop the bottom 1% of counties.
24

Figure 2: Impact of Pertussis on Vaccination
(a) Groups Based on Disease Rate
−.0
2−
.01
0.0
1.0
2E
ffect
on
Vac
cina
tion
0 2 4 6 8
Disease Rate Group
High VaccinationLow Vaccination
Effect of Previous Year Disease on Vaccination
(b) Groups Based on Counts
−.0
10
.01
.02
.03
Effe
ct o
n V
acci
natio
n
0 2 4 6 8
Disease Count Group
High VaccinationLow Vaccination
Effect of Previous Year Disease on Vaccination
Notes: This figure shows the relationship between pertussis outbreaks in year t− 1 and vaccination in year t. All points shown are
regression coefficients from regressions with county and year fixed effects and population controls. Sub-figure (a) groups cases based
on the average disease rate over the previous five years. Sub-figure (b) groups cases based on average case counts. 90% confidence
intervals are shown.
25

Figure 3: Impact of Pertussis Cases on Google Searches
(a) Count of Cases
**
**** **
**
−.0
20
.02
.04
.06
Effe
ct o
f Cas
es o
n G
oogl
e T
rend
s
0 5 10
Months from Cases
Pertussis Pertussis VaccineVaccine Risks Autism and Vaccine
Effect of Pertussis Cases on Google Searches
(b) Std. Dev of Cases Relative to Mean
**
**** **
**
−.0
20
.02
.04
.06
Effe
ct o
f SD
Cas
es o
n G
oogl
e T
rend
s
0 5 10
Months from Cases
Pertussis Pertussis VaccineVaccine Risks Autism and Vaccine
Effect of Pertussis Cases in Counts on Google Searches
Notes: These figures show the impact of outbreaks on Google searches for four groups of terms: terms related to the disease,
“pertussis vaccine” and related, “vaccine risks” and related and “vaccine and autism”. The graph maps out the impact in the month
in which the cases occur, the following month, the month after and so on up to a year after the outbreak. All coefficients are from
regressions which include state and month fixed effects. Sub-figure (a) shows the impact of a linear control for number of cases.
Sub-figure (b) shows the impact of cases measured in standard deviations from the local mean.
26

Table 1: Summary Statistics
Vaccination Rates Pertussis
StateYears of Sample
Mean (SD)Pertussis Rate Per 100,000 Pertussis Cases
Coverage Size Mean (SD) Mean (SD)
Alabama 2007-2011 304 .977 (.042) 3.50 (6.13) 2.61 (4.78)
Arizona 2009-2011 45 .944 (.033) 4.75 (5.55) 37.55 (122.18)
California 1991-2011 1218 .934 (.041) 4.88 (12.1) 22.39 (64.29)
Kansas 2009-2011 314 .869 (.087) 6.90 (25.3) 1.81 (5.49)
Kentucky 2004-2011 886 .965 (.051) 3.07 (8.84) 1.33 (5.07)
Michigan 2004-2011 662 .906 (.034) 8.71 (30.8) 7.48 (21.74)
Missouri 2011-2011 115 .966 (.027) 2.95 (9.86) 3.80 (22.75)
New York 2002-2011 682 .991 (.013) 2.07 (10.47) 1.73 (5.28)
North Carolina 1999-2011 1293 .937 (.085) 6.51 (20.45) 1.11 (4.06)
North Dakota 2005-2011 352 .976 (.057) 9.73 (22.48) 16.62 (31.35)
Oregon 1992-2011 660 .958 (.032) 4.52 (18.75) 5.10 (15.54)
Texas 2007-2011 1260 .973 (.041) 5.04 (18.42) 8.14 (54.28)
Notes: This table shows summary statistics on pertussis vaccination and disease rates by state. Disease rates are quoted in ratesper 100,000 people. As throughout the paper, vaccination rates are the share of children entering kindergarten with a completedpertussis series.
27

Table 2: Impacts of Pertussis Outbreaks on Vaccination
Outcome: Pertussis Vaccination Rate Measure, 5-year-olds, year t
Disease Measure: Pertussis Rate Pertussis Counts
(1) (2) (3) (4) (5) (6)
Previous 5 Year Average 908.0 ∗∗∗ 0.0049∗∗∗
(328.3) (0.002)
Previous 5 Year Max 223.5∗∗∗ 0.0012∗∗∗
(78.3) (0.0004)
Year t− 1 266.3∗ 0.0008∗∗
(147.6) (0.0004)
Year t− 2 25.6 0.0008∗∗
(117.8) (0.0004)
Year t− 3 127.4 0.0007
(118.1) (0.0005)
Year t− 4 192.1 0.0007
(145.9) (0.0005)
Year t− 5 248.8∗∗ 0.0023∗∗∗
(104.7) (0.0005)
County FE, Year FE YES YES YES YES YES YES
Population Control YES YES YES YES YES YES
R-squared 0.61 0.61 0.61 0.61 0.61 0.61
Number of Observations 7135 7135 7135 7135 7135 7135
Notes: This table shows the impact of pertussis outbreaks on vaccination rates. Denoting vaccination rate in county c for birthcohort b as vbc; the outcome variable is the logit transformation of this variable which we denote vbc. The estimating equation isvbc = α+γc + δb +ηpct +
∑k βkrkbc + εbc. The measures included in the vector rbc vary by column as indicated. Robust standard
errors in parentheses, clustered at the county level. * significant at 10% level; ** significant at 5% level; *** significant at 1% level.
28

Table 3: Impacts of Pertussis Outbreaks on Vaccination, Robustness
Outcome: Pertussis Vaccination Rate Measure, 5-year-olds, year t
Disease Measure: Pertussis Rate Pertussis Counts
Panel A: Limited Number of Cases
Previous 5 Year Average 1307.7 ∗ 0.116∗∗∗
(784.1) (0.046)
Previous 5 Year Max 347.7∗ 0.029∗
(192.6) (0.017)
Year t− 1 435.7 0.033∗∗
(309.7) (0.015)
Year t− 2 -38.8 -0.0008
(269.8) (0.015)
Year t− 3 320.3 0.018
(202.8) (0.016)
Year t− 4 344.7 0.025
(245.7) (0.016)
Year t− 5 243.5 0.039∗∗∗
(241.3) (0.015)
Number of Obs. 5611 5611 5611 5611 5611 5611
Panel B: Including Future Cases
Previous 5 Year Average 365.1 0.006∗∗∗
(410.1) (0.002)
Year t− 1 227.5 0.0005
(183.2) (0.0004)
Year t− 2 -69.9 0.0018∗∗∗
(130.6) (0.0004)
Year t− 3 51.9 0.0008
(129.1) (0.0005)
Year t− 4 107.8 0.001∗
(163.9) (0.0005)
Year t− 5 64.2 0.002∗∗∗
(104.5) (0.0005)
Year t+ 1 -198.4 -187.1 0.0003 0.0002
(190.0) (189.6) (0.0002) (0.0003)
p-value, Previous vs. Fut 0.15 0.0005
p-value, t− 1 vs t+ 1 0.08 0.57
p-value, t− 5 vs t+ 1 0.20 0.01
Number of Obs. 6085 6085 6085 6085
Notes: This table shows some robustness checks. Denoting vaccination rate in county c for birth cohort b as vbc; the outcomevariable is the logit transformation of this variable which we denote vbc. The estimating equation in both panels is vbc = α+ γc +δb + +ηpct +
∑k βkrkbc + εbc. In Panel (A) the data is limited to county-years with 10 or fewer cases. In Panel (B) I include
future cases in the regression. Both panels include county and year fixed effects, and population controls. Robust standard errorsin parentheses, clustered at the county level. * significant at 10% level; ** significant at 5% level; *** significant at 1% level.
29

Table 4: Impacts of Pertussis Outbreaks on Vaccination, Robustness
Outcome: Pertussis Vaccination Rate Measure, 5-year-olds, year t
Disease Measure: Pertussis Rate Pertussis Counts
Panel A: County-Specific Trends
Previous 5 Year Average 256.2 0.002
(472.3) (0.0014)
Previous 5 Year Max 87.2 0.0004
(120.1) (0.0003)
Year t− 1 129.8 0.0003
(175.5) (0.0002)
Year t− 2 -103.9 0.0006
(157.5) (0.0004)
Year t− 3 -78.2 -0.0004
(163.8) (0.0005)
Year t− 4 -16.2 -0.0009
(174.5) (0.0005)
Year t− 5 156.8 0.0006
(130.2) (0.0006)
Number of Obs. 7135 7135 7135 7135 7135 7135
Panel B: Weighted by Population
Previous 5 Year Average 457.4 0.002∗
(343.3) (0.0009)
Previous 5 Year Max 117.9∗ 0.0004∗∗
(73.8) (0.0002)
Year t− 1 23.1 0.0001
(81.7) (0.0001)
Year t− 2 50.8 0.0003
(89.9) (0.0002)
Year t− 3 -10.3 0.0002
(103.2) (0.0004)
Year t− 4 91.7 0.0004
(104.0) (0.0003)
Year t− 5 331.6∗∗∗ 0.0014∗∗∗
(138.9) (0.0004)
Number of Obs. 7135 7135 7135 7135 7135 7135
Notes: This table shows some robustness checks. Denoting vaccination rate in county c for birth cohort b as vbc; the outcomevariable is the logit transformation of this variable which we denote vbc. The estimating equation in Panel A is vbc = α + γc +δb + τc + ηpct +
∑k βkrkbc + εbc, where τc is a county-specific trend. In Panel (B) I weight by the population in the county-year.
Both panels include county and year fixed effects, and population controls. Robust standard errors in parentheses, clustered at thecounty level. * significant at 10% level; ** significant at 5% level; *** significant at 1% level.
30

Table 5: Impacts of Pertussis Outbreaks on News Stories
Outcome: Count of News Stories about Pertussis in County
Pertussis Rate 317.5∗∗∗
(90.8)
Count of Cases 0.014∗∗∗
(.0048)
County FE, Year FE YES YES
Population Control YES YES
R-squared 0.19 0.40
Number of Observations 7792 7792
Notes: This table shows the impact of pertussis outbreaks on local news stories about pertussis. The outcome is the count of localnews stories mentioning “pertussis” or “whooping cough” in the headline.We denote this count in county c in year t as nct. Theestimating equation is nct = α+γc + δt +ηpct +Φrct +εct where γc and δt are county and year fixed effects, and pct is a control forpopulation in county c in year t. Robust standard errors in parentheses, clustered at the county level. Note that these regressionsare contemporaneous: we estimate the impact of current cases on current news coverage. * significant at 10% level; ** significantat 5% level; *** significant at 1% level.
31

Table 6: Impacts of Outbreaks by Local Response Coordination
Outcome Pertussis Vacc. Rate Measure Searches:Pertussis
Disease Measure: Pertussis Rate Pertussis Counts
(1) (2) (3) (4) (5)
Previous 5 Year Average, Autonomy 607.2 0.001∗∗∗
(523.8) (0.0004)
Previous 5 Year Average, Centralized 933.5∗∗ 0.002∗∗
(438.7) (0.0009)
Previous 5 Year Max, Autonomy 150.8 0.0046∗∗∗
(119.5) (0.002)
Previous 5 Year Max, Centralized 255.6∗∗ 0.0098∗∗∗
(114.4) (0.004)
Pertussis Cases, Current Month, Autonomy 0.050∗∗∗
(0.003)
Pertussis Cases, Current Month, Centralized 0.267∗∗∗
(0.014)
p-value, autonomy vs. centralized 0.03 0.03 0.03 0.005 0.0000
County, Year FE, Population Controls YES YES YES YES NO
State, Month FE NO NO NO NO YES
R-squared 0.61 0.61 0.61 0.61 0.76
Number of Observations 7135 7135 7135 7135 1508
Notes: This table shows the impact of outbreaks on vaccination rates and Google searches depending on the government coordinationof outbreak response. Columns (1) through (4) look at outbreak impacts. Column (5) looks at Google search responses. Robuststandard errors in parentheses, clustered at the county level. States with state or region coordinated responses are Alabama, NorthDakota, Michigan and Oregon. * significant at 10% level; ** significant at 5% level; *** significant at 1% level.
32
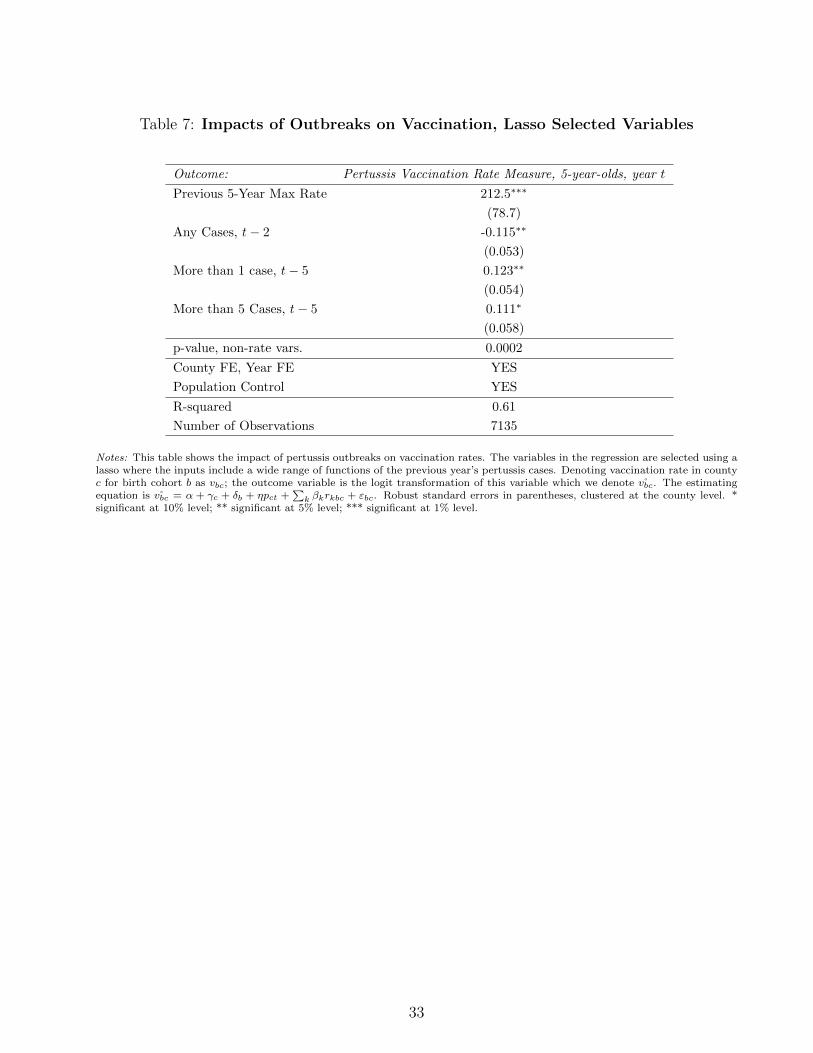
Table 7: Impacts of Outbreaks on Vaccination, Lasso Selected Variables
Outcome: Pertussis Vaccination Rate Measure, 5-year-olds, year t
Previous 5-Year Max Rate 212.5∗∗∗
(78.7)
Any Cases, t− 2 -0.115∗∗
(0.053)
More than 1 case, t− 5 0.123∗∗
(0.054)
More than 5 Cases, t− 5 0.111∗
(0.058)
p-value, non-rate vars. 0.0002
County FE, Year FE YES
Population Control YES
R-squared 0.61
Number of Observations 7135
Notes: This table shows the impact of pertussis outbreaks on vaccination rates. The variables in the regression are selected using alasso where the inputs include a wide range of functions of the previous year’s pertussis cases. Denoting vaccination rate in countyc for birth cohort b as vbc; the outcome variable is the logit transformation of this variable which we denote vbc. The estimatingequation is vbc = α + γc + δb + ηpct +
∑k βkrkbc + εbc. Robust standard errors in parentheses, clustered at the county level. *
significant at 10% level; ** significant at 5% level; *** significant at 1% level.
33

Appendix: Online Publication Only
Appendix A: Figures and Tables
Table A.1: Impact of Vaccination Rates on Outbreaks
Pertussis Rate, t Pertussis Count, t
Vaccine Rate in 5-year old Cohort, t -0.000047 -1.76
(0.00005) (4.42)
County, Year FE YES YES
Population Control YES YES
R-Squared 0.27 0.53
Number of Observations 7472 7472
Notes: This table shows the relationship between contemporaneous vaccine rates in the entering kindergarten class and populationdisease rates. This regression is intended to test for the possibility of reverse causality bias significantly affecting our results. *significant at 10% level; ** significant at 5% level; *** significant at 1% level.
Table A.2: Geographic Reach: Effects Outside of County
Outcome: Pertussis Vaccination Rate Measure, 5-year-olds
(1) (2)
State (excl. County) Pertussis Rate, Five Year Average 5003.6∗∗∗
(1185.8)
County Pertussis Rate, Five Year Average 324.4
(372.9)
State (excl. County) Pertussis Count, Five Year Average 0.0009∗∗∗
(0.0001)
County Pertussis Count, Five Year Average 0.002∗
(.001)
County, Year FE YES YES
Population Control YES YES
R-squared 0.54 0.58
Number of Observations 7135 7472
Notes: This table shows the impact of pertussis cases outside of the county - else where in the state - on vaccination rates. Robuststandard errors in parentheses, clustered at the county level. * significant at 10% level; ** significant at 5% level; *** significant at1% level.
34

Table A.3: Auxiliary Effects: Older Children, Measles Vaccination
Outcome: Pertussis Vacc, 11-year-olds Measles Vacc: 5-year-Olds
(1) (2)
Pertussis Rate, Five Year Average 1177.5∗∗
(552.1)
Measles Rate, Five Year Average 2596.9∗∗
(1282.2)
County, Year FE YES YES
Population Control YES YES
R-squared 0.71 0.66
Number of Observations 1249 7451
Notes: This table shows the impact of pertussis outbreaks on vaccination among 11-year-olds (Column (1)) and the impact ofmeasles cases on vaccination rate of entering kindergartners. Robust standard errors in parentheses, clustered at the county level.* significant at 10% level; ** significant at 5% level; *** significant at 1% level.
Table A.4: Impacts of Pertussis Outbreaks on Other Vaccination Rates
Outcome: All Measles Vacc. MMR. Vacc.
(1) (2)
Pertussis Rate, Five Year Average 619.0∗∗ 561.7∗
(268.5) (325.1)
County, Year FE YES YES
Population Control YES YES
R-squared 0.66 0.69
Number of Observations 7451 6267
Notes: This table shows the impact of pertussis outbreaks on vaccination for measles (either any measles vaccine or the MMRvaccine in particular). In both cases the outcomes is measured as the logit transform of the outcome variable. * significant at 10%level; ** significant at 5% level; *** significant at 1% level.
35

Appendix B: Google Trends Data Production
Google Trends reports data in two ways. First, they report changes in search interest overtime within an area. This is reported relative to the time in that area with the highest searchinterest. Second, they report differences in search interest across space within a given timeperiod. This is relative to the area with the highest search interest. Our estimation isidentified off of changes within a location over time so we focus on the first type of data.These data are generated in the following way:
First define the search rate for a query ([query]) in a given area z at time y:
θy,z =Number of searches for [query] at time y in area z
Total number of searches at time y in area z
Then trend data (τ) for a given area z over a time period Y = {y1, ..., yn} can beexpressed as:
τy,z =θy,z
maxyεY
(θy,z)× 100
Note that Google Trends only calculates these values on a random sample of searches,and so the values may change depending on the time the website was accessed.
The trends data ranges from 0 to 100. A score of 0 however does not usually indicate nosearches for the query; instead, it usually indicates that the volume of searches for the querydid not meet Google’s privacy threshold. While I do not know the exact cut-off for thethreshold, in general data is easier to produce for more common queries, larger time periods(i.e. months versus weeks) and larger areas. The data also improves over time.
Many of the terms I am searching do not meet the privacy restrictions. I take two stepsto overcome this. First, Google Trends allows me to use an ‘or’ connector so I can combinemany queries (up to 30 words) related to a common topic, which then reports the sum of theirtrend scores. This still does not fully solve the problem so the second step uses elements ofthe method described in Stephens-Davidowitz (2014).
The methodology is straightforward. I take a common word that is unrelated to ourterms of interest (this common word should meet the privacy threshold by itself). I thensearch for two terms in the same query: the common word ([word]), and the common word orthe term of interest ([word+ term]). For example, if our term was “pertussis” and thecommon word was “joke”, I would search for “joke” and “joke or pertussis” at the same time.The difference between the two trends gives the trends for “pertussis”. Note that the scoresare still given from 0-100, but the data-point with the 100 score is now given to the relativehighest search rate across both terms.
There are trade-offs with how to select the common word. As the common wordbecomes more popular it is more likely to consistently pass the privacy threshold, even insmaller areas and shorter time periods. However, this also increases the probability of havinga small (or zero) difference between [word] and [word+ term]. This is because Google Trendsare reported on a relative scale, so the term of interest’s score becomes smaller relative to thecommon word’s score as the popularity of the common word increases.
With this as the general background, I follow the detailed steps below.
36

1. Scrape the data for [word] and [word+ term] together at the area-month level
2. Collapse both queries to the year level (mean monthly trend)
3. Recode both queries in a given year as missing if:
(a) One of them has a mean monthly trend equal to zero (i.e. every month in that yearwas below the privacy threshold)
(b) [word] trend is greater than [word+ term] trend (i.e. a negative difference, whichcan occur due to the random sampling and is more likely if the term of interesttrend score is relatively small)
4. Eliminate any area with less than two non-missing year observations
5. Re-scale the trends relative to the highest area-year score within each area and acrossboth queries
6. Take the difference between the scaled [word+ term] and [word] - this generates thetrends for [term]
7. Re-scale again relative to the highest area-year score within each area
To balance the popularity trade off, I repeat these steps using five common words withvarying levels of popularity (sponge, joke, fax, chair, rainbow). I then repeat this process overthree different days and average the results of the 15 scrapes. I do this at the state-monthlevel for the time period 2004-2015 (Y = {2004, ..., 2015}). The search queries I scraped arelisted in Table B.1.
37

Tab
leB
.1:
Tre
nd
Searc
hQ
ueri
es
Top
icSearch
Qu
erie
sE
xam
ple
Captu
red
Search
es
Wh
oop
ing
Cou
gh
“p
ertu
ssis
”,“w
hoop
ing
cou
gh
”“w
hat
isp
ertu
ssis
”,“w
hoopin
gco
ugh
sym
pto
ms”
Wh
oop
ing
Cou
gh
Vacc
ine
“p
ertu
ssis
vacc
ine”
,“p
ertu
ssis
vacc
ines
”,“w
hoop
ing
cough
vacc
ine”
,“p
ertu
ssis
vacc
ine
age”
,
“w
hoop
ing
cough
vacc
ines
”,“p
ertu
ssis
vacc
inati
on
”,“w
hoop
ing
cough
imm
uniz
ati
on
side
effec
ts”
“w
hoop
ing
cough
vacc
inati
on
”,“p
ertu
ssis
imm
un
izati
on”,
“w
hoop
ing
cough
imm
uniz
ati
on
”,“d
tap
”,“td
ap
”,“d
pt
vacc
ine”
,“dtp
vacc
ine”
Vacc
ine
Ris
k
“vacc
ine
inju
ry”,
“vacc
ine
danger
”,“vacc
ine
dan
ger
s”,“vacc
ines
risk
”,“m
mr
vacc
ine
sid
eeff
ects
”,
“vacc
ines
risk
s”,“vacc
ine
sid
eeff
ects
”,“vacc
ine
side
effec
ts”,
“vacc
ines
mer
cury
conte
nt”
“m
ercu
ryvacc
ine”
,“m
ercu
ryvacc
ines
”,“th
imer
osa
lvacc
ine”
,
“th
imer
osa
lvacc
ines
”,“vacc
ine
ingre
die
nt”
,“vacc
ine
ingre
die
nts
”
Au
tism
-Vacc
ine
Lin
k
“au
tism
vacc
ine”
,“au
tism
vacc
ines
”,“auti
smim
mun
izati
on”,
“vacc
ines
au
tism
stud
y”,
“d
ovacc
ines
cau
seau
tism
”,
“au
tism
imm
un
izati
on
s”,“au
tism
mm
r”,“au
tism
mea
sles
”,“im
mun
izati
on
lin
ked
toau
tism
”
“m
ercu
ryau
tism
”,“th
imer
osa
lau
tism
”
Notes:
This
table
show
sth
eco
llec
tion
of
searc
hquer
ies
run
for
each
top
ic,
wh
ere
each
quer
yis
wri
tten
wit
hin
qu
ota
tion
mark
s.G
oogle
Tre
nd
sse
arc
hes
for
the
exact
word
wri
tten
(e.g
.“vacc
ine”
isd
iffer
ent
to“vacc
ines
”),
but
searc
hes
are
not
case
sensi
tive.
Aco
mm
ain
the
tab
leab
ove
ind
icate
san
‘or’
con
nec
tor
(e.g
.“T
erm
1”,
“T
erm
2”’
mea
ns
“T
erm
1”
or
“T
erm
2”,
whic
hgiv
esu
s“T
erm
1”
tren
ds
plu
s“T
erm
2”
tren
ds)
.G
oogle
Tre
nd
sca
ptu
res
all
searc
hes
that
incl
ude
all
the
word
sw
ith
ina
qu
ery,
inany
ord
er,
and
wit
hany
word
sb
efore
,aft
er,
or
bet
wee
nth
em.
38