Accounting and Financial Reporting for Derivative Instruments.

Does Derivative Accounting Affect Risk Management? International Survey Evidence
Karl V. Lins University of Utah
Henri Servaes
London Business School, CEPR and ECGI
Ane Tamayo London Business School
March 7, 2008
Abstract
This paper uses worldwide survey evidence to study the effect of derivative accounting standards on firms’ risk management activities. More than 40% of the companies indicate that their risk management policies have been affected by the new standards. Their ability to hedge from an economic perspective has been compromised, but so have their speculative activities. Firms are more affected by the new standards if they operate in an environment where they are more likely to write contracts based on accounting numbers, if they attach a lot of importance to the reduction in the volatility of earnings as a benefit of risk management, and if they are more inclined to take active positions. We also document a substantial decrease in foreign exchange hedging and in the use of non-linear hedging instruments, which are less likely to qualify for hedge accounting. This evidence indicates that the impact of the new standards has been mixed, and has not affected all firms equally.
___________________________________ * Email addresses for the authors are [email protected], [email protected], and [email protected]. We thank James Ballingall, Greg Brown, Adrian Crockett, Fred Harbus, Roger Heine, Peter Tufano, and seminar participants at London Business School, the 2007 Global Issues in Accounting Conference at UNC-Chapel Hill, and the University of Arkansas for helpful discussions.

Does Derivative Accounting Affect Risk Management? International Survey Evidence
1. Introduction
One of the most important changes in worldwide accounting regulation over recent
years has been the introduction of new standards for financial reporting of derivative
securities, known in the U.S. as SFAS 133 and internationally as IAS 39. These standards
require firms to report all derivatives at fair values in the financial statements, with any
changes in value recorded in either the income statement or an equity account (other
comprehensive income). As a result, these standards have the potential to increase the
volatility of both reported earnings and stockholders’ equity.
The implementation of these derivative accounting standards has been met with
protest and controversy, centered around two issues. First, the standards are complicated to
implement. In fact, SFAS 133 is the only standard for which the FASB created an
implementation group, the Derivatives Implementation Group (DIG), to address
implementation questions raised by companies. Second, many companies argued against the
standards because their implementation would lead to increased earnings and/or balance
sheet volatility. Revsine, Collins and Johnson (2002) suggest that “…this may force
managers to choose between achieving sound economic results – meaning hedges that
effectively address real financial risks – or minimizing accounting volatility using risk
management approaches that are less efficient or simply not prudent (p 545).” 1,2
1 As an example, Revsine, Collins, and Johnson (2002) quote a Wall Street Journal article by McKay and Niedzielski (2000): “In a letter to the FASB, Al Wargo of Eastman Chemical said that hedge accounting could cause his company’s quarterly earnings per share (EPS) to fluctuate roughly 100% in either direction … The only way Eastman can eliminate this EPS volatility is to change how it hedges financial risk. But this means replacing sound economic hedging transactions with a less effective hedge. EPS would then be less volatile, but the company may be more exposed to financial risk.”
1

While a large number of firms registered their concerns through comment letters and
other means, what we do not know is the extent to which firms have actually changed their
hedging policies as a result of the new standards. It is quite possible that firms complained
about the standards, but eventually learned to live with them, and did not materially change
their policies. Alternatively, it is possible that legitimate economic hedging strategies, or
speculative activities, or both, have been affected.
The objective of our study is to gain a better understanding of the real effects of these
new derivative accounting standards. In particular, we explore whether the new standards
have affected the hedging policies of companies, and, if so, which types of companies and
activities have been affected the most. To address these questions, we analyse the responses
to a worldwide CFO survey on corporate financial and risk management policies conducted
by Deutsche Bank Securities, Inc, in 2005. Three hundred and thirty four companies from 39
countries participated in the survey. Several items in the survey addressed elements of risk
management and, in particular, the effect of the new accounting standards on risk
management policies. We focus on the responses to these questions.
There are several advantages to using survey data rather than archival data in the
context of this paper. First, for publicly traded companies around the world, we may be able
to observe whether or not firms have derivative positions, but it is much more difficult to
determine whether a firm’s hedging policies have actually changed as a result of new
accounting standards. For private companies, accounting data are not available in many
countries. Second, it is hard to infer from financial statement data whether firms’ employ
derivatives for hedging purposes (rather than speculation). The survey used in this paper
2 A similar concern was raised by the former Chairman of the Federal Reserve Board, Alan Greenspan, who wrote a comment letter to the FASB indicating: “The proposal may discourage prudent risk management activities and in some cases could present misleading financial information.”
2
directly asks firms about their active (speculative) positions. Hence, we are able to separate
“hedgers” from “speculators” (as in Geczy, Minton, and Schrand (2007)).3
Many interesting results emerge from our analyses. First, 40% of the companies that
actively engage in some form of risk management report that at least some of their risk
management policies have been materially affected by the introduction of the new accounting
standards. Second, a large fraction of the affected firms feel that their ability to hedge from
an economic perspective has been compromised. However, we also find that firms are more
likely to be affected if they take active (speculative) positions. Third, firms have
substantially reduced the use of non-linear instruments in risk management, while the use of
linear instruments has been less affected. Fourth, the extent to which firms indicate that their
policies are affected by the new standards depends on country and firm characteristics.
Firms are more likely to be affected: (a) if the intensity of disclosure of financial information
is higher in the country in which they are incorporated, (b) if it is easier to prove wrongdoing
on the part of accountants, (c) if they are listed on a stock exchange; and (d) if they consider
the reduction of earnings volatility to be an important benefit of risk management. These
firms are more likely to use accounting numbers for contracting purposes. There is also
some evidence that more affected firms have less sophisticated shareholders. Fifth, firms
that are materially affected by the new standards believe that qualifying for hedge accounting
is very important, and this is especially the case for large firms, publicly traded firms, and
3 An alternative approach would be to study the firms that sent comment letters to the FASB and IASB, but this approach is not without shortcomings. First, it would lead to a biased sample. Firms are more likely to voice concerns about new standards if they believe they will be adversely affected by them (even if this turns out not to be the case). Second, firms may criticize proposed standards simply because they have to change their accounting procedures and not because they lead to policy changes. Third, based on comment letters, it is not possible to differentiate between speculators and hedgers. Finally, comment letters are based on what firms expect to happen, not on actual outcomes.
3

firms that believe that the reduction of earnings volatility is an important benefit of risk
management.
Overall, our findings indicate that the new standards curtailed speculative activities,
which was one of the aims. An unfortunate side effect is that sound economic hedging
practices have also been adversely affected. If firms were hedging optimally to begin with,
the fact that the new standards affected their risk management policies implies a perceived
reduction in value. Whether this reduces overall welfare depends on the trade-off between
the loss in economic benefits of hedging and the gains from curtailing speculation.4
This paper contributes to the literature on derivative accounting by assessing the
economic consequences of the new standards. Unlike other studies [e.g., Zhang (2008)], we
provide direct measures of the impact of the new standards on firms’ risk management
activities and show that, in addition to speculative activities, legitimate hedging strategies
have also been compromised. We therefore believe that Zhang’s conclusion that SFAS133
has encouraged firms to engage in more prudent risk management activities and has not
affected firms that employ derivatives to hedge is premature.
Our paper also contributes to the literature on the effect of changes in accounting
standards on firms’ economic behavior. The empirical evidence on this area is scarce (see
Beatty (2007) for an overview) but is generally consistent with accounting changes leading to
changes in firms’ operating and financing decisions. Our study documents another setting in
which accounting standards affect firms’ policies and shows that the effect of regulation
varies with the demand for accounting, and the level of accounting transparency and
enforcement. Beatty (2007) argues that our understanding of the economic incentives that
4 Articles on the economic benefits of hedging include Smith and Stulz (1985), DeMarzo and Duffie (1991), Froot, Scharfstein, and Stein (1993), Graham and Smith (1999), Brown (2001), and Graham and Rogers (2002).
4

give rise to changes in firms’ economic behavior is limited. The cross-sectional analyses in
this paper provide a starting to point for understanding these economic incentives (e.g.,
contracting, investor sophistication, enforcement).
The remainder of this paper is organized as follows. The next section provides a brief
background on the new standards. Section 3 reviews the related literature and develops the
hypotheses. Section 4 introduces the survey and provides summary statistics. Section 5
contains the empirical results and Section 6 concludes.
2. Background on Derivative Accounting
Developing consistent and complete accounting standards for derivative instruments
has been an important and long-awaited item on the agenda of regulators and standard
setters. Their main concern was that under historical cost accounting many derivatives
remained unrecorded in the financial statements until maturity because they have negligible
or zero historical costs. Both SFAS 133 “Accounting for Derivative Instruments and
Hedging Activities” issued in 1998, and IAS 39 “Financial Instruments: Recognition and
Measurement” issued in 1998 and thoroughly revised in 2003, prescribe fair value
accounting for derivatives.5 As such, derivatives must be reported at fair values in the
financial statements, with any changes in value recorded in either the income statement or an
equity account (other comprehensive income).
5 The main provisions, common to both SFAS 133 and IAS 39, are: (i) All derivatives must be reported at fair values in the financial statements; (ii) Changes in the market value of derivatives not designated as hedging instruments (speculative or trading hedges) must be recognized in net income; (iii) Changes in the market value of derivatives used to hedge risk exposures (i.e., designated hedges) are recorded in net income or an equity account (other comprehensive income); (iv) Changes in the market values of the hedged item must also be recognized in net income; and (v) When a derivative is not fully effective as a hedge, the inefficient portion of changes in the derivative’s market value must be included in net income.
5

These new accounting standards therefore have the potential to increase the volatility
of reported earnings and stockholders’ equity. The extent to which this happens depends on
whether the derivative position qualifies for so-called “hedge accounting”. Under hedge
accounting, if the derivative is fully effective as a hedge there is no effect on net income;
changes in the value of the derivative either (i) bypass the income statement and are reported
in other comprehensive income (for cash flow hedges) or (ii) are reported in net income but
are perfectly offset by the changes in the value of the underlying exposure (for fair value
hedges).6 If the hedge is not fully effective, however, net income is affected because the
ineffective portion of the derivative gain or loss must be included in net income.
To achieve hedge accounting status, firms have to show that the derivative is
designed to offset an underlying economic exposure, and that the hedge is highly effective,
which implies that the value of the hedging instrument and the underlying exposure move
closely together. Many firms, however, employ economically effective hedging strategies
which are designed such that the derivative instrument’s value and the underlying exposure
do not always move closely together. For example, many strategies involve the use of
options, and these strategies will often not qualify for hedge accounting treatment.
Additionally, even a derivative usage strategy designed to do so will have some uncertainty
as to whether an auditor will deem that it qualifies for hedge accounting. Absent hedge
accounting status, the entire change in the value of the derivative flows through the income
statement.
The academic literature assessing the economic effect of derivative accounting
standards on firms’ risk management and speculative activities is inconclusive. While
6 Cash flow hedges are intended to mitigate the volatility of future cash flows while fair value hedges are intended to mitigate changes in the fair value of recognized assets or liabilities.
6

Melumad, Weyns, and Ziv (1999) argue that fair value recognition of derivatives makes the
use of derivatives more transparent and encourages prudent risk management, Sapra (2002)
and Sapra and Shin (2007) show theoretically that more transparency may actually increase
speculation.
Only a few papers study the economic effect of the standards empirically. Singh
(2004) finds no changes in earnings or cash flow volatilities or the notional amount of
derivatives after the adoption of SFAS 133. In contrast, Zhang (2008) finds that the volatility
of cash flows for speculators (defined as a new derivative user whose risk exposures do not
decrease after the initiation of a derivatives program) decreases after the introduction of
SFAS 133.
The evidence in Zhang (2008), however, is indirect because it is not possible using
archival data to determine with much confidence whether a firm uses derivatives to hedge or
to speculate. In fact, it is quite possible that firms experience an increase in their risk
exposures after the initiation of a derivatives program even if they are using derivatives to
hedge. This will be the case if firms start a program to hedge anticipated exposures (which
they did not face previously). If the hedging program does not perfectly remove underlying
risk, the resulting risk profile will increase, but it will be lower than it would have been had
the firm not hedged at all. For example, a firm that starts selling its products abroad for the
first time may start hedging its foreign exchange exposure, but because it is impossible to
fully anticipate all foreign sales, it is likely that the exposure to foreign exchange risk
increases (from zero). Labelling firms with an increased exposure after initiating derivatives
7

as speculators or ineffective hedgers is therefore imprecise.7 Hence, conclusions drawn from
studies that employ this approach should be interpreted cautiously.8
3. Development of Hypotheses
3.1. Which firms are affected by the new standards?
As mentioned previously, the introduction of the new standards has been met with
protest and controversy, mainly due to two issues. First, the standards impose direct costs
because they are complicated to implement.9 Second, many companies argue that there are
indirect costs as well. This latter argument focuses almost exclusively on the economic
consequences of increased earnings and/or balance sheet volatility. While the direct costs are
clearly important, the potential impact of indirect costs is more nuanced and is likely to vary
widely across firms. Our first hypothesis focuses on these indirect costs. We refer to firms
whose risk management policies are affected as “affected firms”, and hypothesize that the
following categories of firms are more likely to be affected:
Firms that are more likely to write contracts on accounting numbers / Firms with
more demand for better financial reporting:
Increased earnings volatility may have an economic cost to shareholders if earnings
numbers are employed in contracting and/or as inputs in other models. For example, in
credit ratings models, earnings volatility is often considered to be an important risk factor
7 Another concern is that these conclusions only apply to companies that initiate a derivatives program. This approach removes most large established companies that have had hedging programs in place for a long time. 8 Adjusting exposure for the median exposure level in the industry does not address this shortcoming because changes in anticipated exposures (such as increased exports or the issuance of floating rate debt) are likely to be firm-specific. 9 Some indication of the complexity of implementing the standard is provided by the number of restatements due to improper use of hedge accounting. In 2005, a total of 57 US firms restated their accounts because some aspects of hedge accounting had not been properly applied. Among them is General Electric, which claims to have 40 people working full-time to ensure the adequacy of its hedge accounting [CFO Magazine (2006)].
8

from a creditor’s perspective.10 If managers have compensation contracts based on earnings,
less volatility may be beneficial to them [Gaver, Gaver, and Austin (1995)]; these managers
may rationally choose policies that reduce volatility of reported earnings but which also
reduce legitimate hedging of risk, thereby hurting shareholders.
Prior studies have identified several factors that affect the extent to which accounting
numbers are used for contracting purposes. Generally, accounting numbers are used in
contracts when information asymmetry between managers and other parties (e.g., lenders,
shareholders, suppliers, customers) cannot be reduced efficiently through private
communication. For example, in private companies shareholders take a more active role in
management than in public companies, which reduces their reliance on accounting numbers
for monitoring managers. In contrast, in public companies accounting information is often
used to monitor managers [Ke, Petroni, and Safieddine (1999); Beatty, Ke, and Petroni
(2002); Ball and Shivakumar (2005)]. This demand for accounting numbers increases the
financial reporting quality of firms.11
We expect similar factors to determine whether a company is affected by the new
standards for derivatives (i.e., firms that rely more on accounting numbers are likely to be
more affected). Some of these factors are firm-specific while others are country-specific.
The most relevant firm-specific factors are their public vs. private status and their
size. Ball and Shivakumar (2005) and Burgstahler, Hail, and Leuz (2006) argue that the
demand for public financial information is greater for public firms than private firms. They
10 For instance, Beatty, Ramesh, and Weber (2002) show that firms will modify accounting practices so that reported numbers comply with covenants. Smoother earnings that avoid negative shocks may also lead to a lower cost of debt capital for loans that contain performance-pricing features which reward improved borrower creditworthiness [Asquith, Beatty, and Weber (2005)]. 11 Better financial reporting quality is likely to also increase the extent to which firms use accounting numbers in contracts. In other words, the causality goes both ways.
9

show that this demand results in better reporting quality for public firms. Similar arguments
apply to firm size. Lang and Lundholm (1993), for example, argue that larger firms have a
greater demand for information about them and thus produce greater information compared
to smaller firms. Bushman, Piotroski, and Smith (2004) take this premise to international
data and find that firm size is an important variable for financial transparency across a wide
range of countries. Thus, we expect larger and public firms to be more affected by the new
standards.
As mentioned above, country specific factors are also likely to affect the extent to
which a firm is affected by the new derivative accounting standards. Leuz, Nanda, and
Wysocki (2003), Bushman, Piotroski, and Smith (2004), Bushman and Piotroski (2006), and
DeFond, Hung, and Trezevant (2007) collectively find that higher quality financial reporting
is associated with country-level institutional parameters such as disclosure levels, the
enforcement of securities laws, and overall investor protection. Further, across countries,
Ball, Robin, and Wu (2003) argue that even if companies have similar accounting standards
(such as IAS), financial reporting quality will still be affected by incentives of managers and
auditors, and these are likely to be determined by the institutions present in a country. Thus,
we expect the effect of the new derivative accounting standards to be larger for firms
operating in countries with better reporting quality and better enforcement.
Firms for which stabilizing earnings is an important benefit of risk management.
Firms that indicate that earnings stabilization is important are firms that fall in three
non-mutually exclusive groups: (a) firms that have written contracts based on earnings (as
discussed previously); (b) firms whose investors rely on earnings measures to assess
10

economic performance; (c) firms that care about earnings volatility for other reasons. We
now elaborate on groups (b) and (c).
Increased earnings volatility may impact the way investors form opinions about a
firm’s value in a setting with less than perfect information. Barry and Brown (1985) suggest
that the cost of capital is a function of “estimation risk” and the better investors are able to
assess the prospects of a company, the lower is its expected cost of capital. This argument
suggests that disclosing more information by marking hedges to market is actually a good
thing, because it would reduce estimation risk. However, if investors are not sophisticated
and rely on reported earnings to estimate underlying economic performance, then their
assessments of performance could be impaired when derivatives are marked to market and
the change in value is recorded in the income statement.
The lack of investor sophistication is not a necessary ingredient to make investors
worse off when derivatives positions are disclosed. DeMarzo and Duffie (1995) show
theoretically that even among shareholders who would typically demand full information, if
hedges are not disclosed in detail, earnings are less noisy and managers will often hedge to
achieve greater risk reduction, which benefits shareholders. Taken together, these arguments
imply that greater earnings volatility makes assessments of value more difficult and may also
reduce shareholder value.
Research also shows that the stock market rewards firms with a pattern of increasing
earnings [Barth, Elliott, and Finn (1999)], which provides an incentive for managers to shy
away from volatile earnings paths [DeFond and Park (1997)]. Graham, Harvey, and
Rajgopal (2005) survey US and Canadian firms and report that 96.9% of CFOs surveyed
prefer a smooth earnings path and that 78% of CFOs would sacrifice a small, moderate, or
11

large amount of value to achieve a smoother earnings path. Given this aggregate body of
work regarding smooth earnings, it is not surprising that managers who may not be opposed
to disclosing their derivative positions per se will be opposed to standards under which such
disclosure causes increased earnings volatility.
Firms that take active positions.
Managers (but not necessarily shareholders) may also be opposed to the new
standards if they are using derivatives to express a view on future price movements instead of
hedging underlying exposures. It is possible that mark-to-market hedge accounting standards
will shed more light on these activities, and, indeed, that was one of the driving principles
behind their adoption. Geczy, Minton, and Schrand (2007) use survey evidence to show that
forty percent of US firms that use derivatives took an active position based on their market
view of interest or exchange rates at least once, and seven percent did so frequently. They
conclude that managers are not taking extreme bets with such active positions, however. We
ask a similar question in our paper and, as we document later, close to 50% of our global
survey respondents report using derivatives so that they can actively take a market view on
underlying economic variables at least some of the time.12 We hypothesize that such firms
are more likely to be affected by the new standards.
3.2. Which types of hedges and instruments have been affected?
As discussed previously, derivative positions only qualify for hedge accounting if the
hedges are deemed to be highly effective. This requirement may exclude some common
hedging strategies. Brown and Toft (2002) show that it is often optimal for a firm to hedge
12 Using archival data and indirect methods to determine whether a firm hedges/speculates with derivatives, Henstchel and Kothari (2001) and Guay (1999) show that most firms use derivatives to hedge.
12
using derivative strategies that feature non-linear payoffs. Such strategies usually involve
basic or more exotic option contracts. Non-linear contracts give rise to price changes that
can be very large for a move in the underlying asset in one direction while small for a move
in the other direction. Such contracts are useful to guard against exposures that cause big
losses in one direction but only marginal gains in the other direction. Because of their non-
linear nature, option contracts are less likely to qualify for hedge accounting compared to
linear contracts such as forwards or futures. Thus, if firms are concerned about qualifying
for hedge accounting, we expect a reduction in the use of non-linear contracts after the
adoption of the new accounting standards.
In terms of types of hedges, option contracts are much more suitable to hedge
anticipated transactions, because they allow the owner of the option to walk away if the
transaction does not happen. We therefore expect hedges of anticipated transactions to
decline. Linear contracts are also less likely to qualify for hedge accounting if there is
uncertainty about the quantity being hedged (for example, it is difficult to predict the level of
foreign profits before the fiscal year-end). We also expect such hedges to decline.
3.3. Which firms are more concerned about achieving hedge accounting?
Finally, we study whether qualifying for hedge accounting is important for firms
when they consider risk management alternatives. We believe that the factors that determine
whether a firm is affected by the new standards also determine whether firms are concerned
about achieving hedge accounting, except for a firm’s tendency to take active positions.
Hence, we expect firms that are more likely to write earnings-based contracts, firms that care
13

about earnings volatility per se, and firms with relatively unsophisticated investors to be
more interested in getting hedge accounting treatment for derivatives.
4. Survey Design and Sample
4.1. Survey design
Our data come from a CFO survey conducted in the summer of 2005 covering
publicly traded and privately owned firms from all over the world [see Servaes and Tufano
(2006)]. This survey was conducted in collaboration with Deutsche Bank Securities, Inc.
The survey designers constructed a very extensive survey, with the goal of better
understanding the many interconnected facets of accounting and financial policy (see the
Appendix for further details). However, in order to maximize the response rate, firms were
not required to respond to every single question. Instead, they could choose which questions
to respond to and which not. Further, the need to respond to certain questions was sometimes
made conditional on previous responses – thus, not all questions were asked of all firms.
The survey data employed in this paper contain two types of questions on accounting
and financial policies, (i) benchmarking questions, and (ii) attitudinal questions.
Benchmarking questions focus on the decisions firms make, whether these decisions are
typically observable by others or not. For example, respondents are asked to indicate
whether they manage exchange rate risk, and whether their risk management policies have
been materially affected by the new derivative accounting standards. Attitudinal questions,
on the other hand, ask respondents to indicate their agreement or disagreement with certain
statements, or ask them to select items from a list to help explain why their firms take certain
14

decisions. We analyze answers to these survey questions in both a univariate and
multivariate framework.
4.2. Description of the Survey Data, Sample Construction, and Summary Statistics
The survey instrument was sent to approximately 4,000 firms in 48 countries and 354
firms answered at least part of the survey. In terms of the response rate and overall number
of respondents, the survey panel is similar in size to that in other studies. For example, in the
US and Canadian firm CFO survey conducted by Graham and Harvey (2001) the final
sample is 392 respondents, with a response rate of about 9%. Graham, Harvey, and Rajgopal
(2005) obtain a similar response rate of around 8% for the portion of their survey of US and
Canadian firm CFOs that was conducted via email.13 The findings of the survey were also
presented and discussed at various practitioner conferences around the world aimed at CFOs
and other top finance professionals. The feedback received during these conferences is
consistent with the findings and interpretations presented in the results section.
Our initial sample consists of a subset of the 354 responding firms because not all the
companies were asked and/or answered all the questions relevant for this study. The first
step we take in the sample selection process is to identify how many of the respondents
engage in risk management activities. The survey instrument asks firms basic questions
regarding their risk management/exposure to three basic areas of risk that are frequently
hedged using derivative instruments. It asks a) whether a firm engages in foreign exchange
risk management activities, b) whether it engages in interest rate risk management activities,
and c) whether, in the absence of risk management activities, the firm would have any
material commodity exposures. 13 Their final sample, which includes surveys conducted in person at a conference gathering, is 358 firms.
15

The number and fraction of firms that answered “yes” to each of these questions are
reported in the first three rows of Table 1. The number of respondents varies with the area of
risk from 248 to 253 but, in total, 263 firms answered at least one of these questions. Table 1
also reports (in the fourth row) the fraction of firms that managed at least one type of risk
based on the answers given above. As shown in the table, three-fourths or more of the
respondent firms engaged in management of foreign exchange and/or interest rate risk.
About one half of the firms would face material commodity exposures in the absence of risk
management activities. When responses are aggregated across all respondent firms (fourth
row in the table), over 90% of the firms manage at least one type of exposure among the
three basic areas of risk covered in the survey. Thus, risk management is an important
function for the vast majority of firms that were surveyed.
The survey instrument also asks a set of questions that directly assess the importance
of hedge accounting standards. Specifically, firms were asked “Has your Foreign Exchange
Risk Management policy been materially affected by the introduction or impending
introduction of new derivative accounting standards (e.g., IAS 39, FAS 133, or local
equivalent) under which your company currently reports or will report?” The identical
question was asked twice more, substituting the words “Interest Rate” or “Commodity” for
the words “Foreign Exchange.” Firms were not asked this question if they did not engage
in any risk management activities (as their policies would not be affected). In addition,
because we ask about their risk management policies, firms that only change the accounting
for derivatives without making changes to what they actually do would not be affected.14
14 As with any survey, the exact interpretation of the wording of a question is of primary importance. We believe that respondents properly interpreted the above question to refer to changes in hedging policies, and not the way they account for derivatives because: (a) a beta version of the survey was discussed with several CFOs to make sure there were no misunderstandings; (b) the survey findings were presented at several practitioner
16

Firms that indicated that they are affected by the new standards were also asked “How
important is achieving ‘hedge accounting’ for accounting purposes when examining Risk
Management execution alternatives?” As before, this question was asked separately for Risk
Management relating to Foreign Exchange, Interest Rate and Commodity Risk.
Responses to these questions are presented in Table 2. In total, of the 239 firms that
reported management of or exposure to at least one type of risk (Table 1), 229 firms
answered at least one of the questions regarding whether their risk management policies have
been affected by the new derivative accounting standards. Thus, the vast majority of
respondents that engage in risk management activities also indicated whether or not they
were affected by the new standards. This alleviates any concern that affected firms might be
more likely to respond to this question.
As reported in Panel A of the table, close to 50% of the firms managing foreign
exchange risk and 38% of the firms managing interest rate risk are affected by the new
standards. The fraction is much lower for commodity risk at 18%. The fourth row of Panel
A of Table 2 shows that 42% of the 229 sample firms indicate that at least one of their risk
management activities is affected by the new standards. We next compute a measure called
Affected, which is based on the fraction of risk management policies affected by the new
standards. It captures how much a firm is affected by the new standards relative to the risks
it actually manages. For example, if a firm manages two areas of risk and one of them is
affected by the new standards and the other is not, then the value would be 0.5. As illustrated
in row 5, 32% of the average respondent’s risk management policies are affected.
seminars, where participants confirmed their understanding of the survey questions; and (c) if the respondents had assumed that the question was about changes in accounting and not policies, the vast majority would have responded that they were affected, and the cross-sectional results discussed subsequently would not hold.
17

Going forward, the paper focuses on the 229 firms that indicate whether or not their
risk management policies have been affected by the new accounting standards, as this
question relates to our main hypotheses. These firms therefore constitute our final sample.
Panel B of Table 2 contains the distribution of the responses regarding the importance
of qualifying for hedge accounting. Only affected firms were asked this question. The vast
majority of companies consider it very important to qualify for hedge accounting: about 80%
of the firms fall in the highest two categories for all three areas of risk management.
Table 3 contains data on the country of origin for the firms in our sample. About
56% of the respondents come from Europe, and just over one-fourth of our sample firms
come from Asia and Australia/New Zealand. The countries with the largest representation
are Germany, the US, and Japan. Finally, 4 firms did not disclose their country (these firms
will obviously be eliminated from any analyses that involve country-level parameters).
In Table 4, we report summary statistics for a variety of characteristics of the sample
firms. They have mean revenues of about $7.7 billion and median revenues of $2 billion.
Thus, they are larger than the US and Canadian firms studied by Graham, Harvey, and
Rajgopal (2005) which had median revenues of about $1 billion. A unique feature of our
sample, as shown in the second row of Table 4, is that one-third of the firms are not listed on
a stock market. The third row reports the extent to which “reduce the volatility of earnings
(without affecting cash flows)” was rated as an important benefit of a successful risk
management program. The sample firms consider the pure reduction of earnings volatility to
be relatively important, with an average score of 2.6 on a scale from 0 (not important) to 5
(very important). The next row shows that firms are not likely to take active positions
(speculate). Firms were asked whether their view on Foreign Exchange Rates, Interest Rates,
18

or Commodity Prices causes them to actively take positions in a given market. This question
was asked for each area of risk management separately and the response is first averaged
across all risk management areas within the firm and then averaged across all firms. On a
scale from 0 to 5, where 0 is never and 5 is frequently, the average response is only 0.74.
Nevertheless, close to 50% of the respondents indicate that they take active positions at least
some of the time (not reported in the table).
The next row in Table 4 shows that sample firms have average institutional
ownership of approximately 32%, with a median of 17.5%. Note, however, that firms were
not asked to provide an exact measure of institutional ownership. Instead, they were given
categories (0%, 1-5%, 6-10%, 11-25%, 26-50%, and over 50%) and the figures reported in
the table are computed based on the assumption that each firm has ownership at the category
mean. Firms were also asked to report the extent to which “difficulty in explaining to
investors” is a substantial drawback of a Risk Management program. The second-to-last row
of Table 4 shows that sample firms consider the difficulty of explaining their risk
management program to investors to be a moderately important drawback, with an average
score of 1.44 on a scale from 0 (not important) to 5 (very important).
Eighty seven percent of the sample firms already use fair value derivatives
accounting, as shown in the final row of Table 4, while most remaining firms plan to adopt it
in the very near future (not reported in the table).
19

5. Results
5.1. Differences between affected and unaffected firms
We start by dividing the sample into two groups of firms: firms whose risk
management policies are not affected by the new accounting standards and firms whose
policies are affected for at least one of the three risks. We then compare means and median
across the subsample along various characteristics. The findings are reported in Table 5.
There are substantial differences between affected and unaffected firms, consistent with the
hypotheses proposed in Section 3. First, we find that affected firms are much larger than
unaffected firms: median revenues for affected firms are $2.57 billion versus $1.58 billion
for unaffected firms. Unaffected firms are also more likely to be private (38%) than affected
firms (23%).
To study the quality of the accounting standards at the country level, we rely on the
CIFAR score reported in Bushman, Piotroski, and Smith (2004). This score is an index
based on the inclusion or omission of 90 data items. We divide firms into two groups
depending on whether the CIFAR score for their country of domicile is above or below the
sample median of 71. As illustrated in Table 5, affected firms are much more likely to be
domiciled in countries with high quality accounting standards. The second country-level
variable focuses on the legal liabilities of accountants in case of misrepresentation. We
employ the burden of proof for accountants variable developed by La Porta, Lopez-de-
Silanes, and Shleifer (2006). This variable captures how difficult it is to prove liability due
to misleading statements by accountants. We split the sample into two groups depending on
whether the burden of proof in a firm’s country of domicile is low (≤ 0.5) or high (> 0.5).
20

Table 5 shows that the burden of proof is much more likely to be low for affected firms
(73%) than for unaffected firms (59%).15
We do not find any differences between affected and unaffected firms in the level of
institutional ownership, which provides no evidence for the investor sophistication argument.
We also employ another proxy for sophistication: the extent to which difficulty in explaining
risk management policies to investors is a substantial drawback of a risk management
program. Table 5 illustrates that affected firms state that the difficulty in explaining their risk
management policies to investors is a more substantial drawback compared to unaffected
firms. While the mean difficulty score is low for both sets of firms, the mean score is 1.68
for affected firms and 1.28 for unaffected firms; the difference between the two is significant
at the 2% level. Taken together, the univariate analyses provide mixed support for the
investor sophistication argument.
Next we study the importance of reducing earnings volatility (without necessarily
affecting cash flows) as a perceived benefit of risk management. While this question does
not allow us to identify why firms want to reduce earnings volatility through hedging, it does
allow us to study whether firms who rely on hedging to reduce earnings volatility are more
affected by the new standards. This is indeed the case: affected firms find that reducing
earnings volatility is a more important benefit (score = 3.36) than unaffected firms (score =
2.78).
Finally, we investigate whether affected firms are more likely to take active positions,
and find that this is the case, albeit that both sets of firms have a low score. While this
15 We also study whether affected firms are domiciled in countries with better investor protection than unaffected firms, but do not find a significant difference. We believe that this is the case because the measures we employ relate more directly to the quality of accounting numbers than investor protection.
21

suggests that affected firms are more likely to take active positions, they generally do not do
so frequently.
Overall, the univariate analyses provide substantial support for the hypotheses
proposed in this paper: affected firms are more likely to operate in countries with high
accounting standards, and a low burden of proof for accounting misdeeds. They are larger
and are more likely to be listed on the stock market. They also consider earnings volatility
reduction to be an important benefit of risk management and they are more likely to take
active positions. Only the investor sophistication argument receives mixed support.
5.2. Which factors determine whether firms are affected by the new standards?
We now turn to a multivariate analysis to study the factors that determine whether
firms are affected by the new standards. Two different methods are employed to investigate
this issue.
In the first approach we treat each firm’s response to each risk management area as a
separate observation. Thus, a firm that responded to all three areas is included three times in
our analysis. We then estimate various probit models to explain whether or not a firm’s
specific policy is affected or not. While most explanatory variables are measured at the firm
or country level, the survey asks whether firms would ever take active positions for each risk
management area separately, and we employ this information in these models. Because
firms potentially enter the models multiple times, we adjust the standard errors to reflect the
lack of independence of the observations. In addition, all standard errors are adjusted for
heteroscedasticity.
22

Panel A of Table 6 contains the findings. We do not have responses on institutional
ownership and the importance of reducing earnings volatility for all firms. Instead of
discarding firms from models in which these characteristics are employed as explanatory
variables, we set them equal to zero when missing, but also include a dummy variable set
equal to one if the observation is missing, and zero otherwise.
We present several models. In model (i) of Table 6, we include only size and
accounting quality. Both significantly increase the likelihood of being affected by the new
standards. We replace accounting quality with the burden of proof variable in model (ii).
While accounting quality only speaks to the level of disclosure, the burden of proof captures
an element of enforcement. Unfortunately, the disclosure and enforcement variables are
highly correlated (ρ=0.58, p-value=0.00), and we therefore do not combine them in one
model. The regression indicates that firms from countries with a low burden of proof are
more likely to be affected. Model (iii) illustrates that private firms are less likely to be
affected by the new standards. All the proxies employed in these models indicate that firms
are more affected when there is a higher likelihood that accounting figures are used for
contracting. We combine two of these proxies in model (iv) and also control for institutional
ownership to proxy for investor sophistication. We find that firms with more sophisticated
investors (more institutional ownership) are less affected by the new rules. Finally, in model
(v), we add the importance of reducing earnings volatility as a benefit of risk management
and the willingness of the firm to take active positions. The positive coefficients on both
variables indicate that these features increase the likelihood of being affected.
We construct Panel B of Table 6 to study the economic significance of these findings.
They are based on model (v) of Panel A. The goal of Panel B is to show how the likelihood
23

of being affected by the new standards changes as firm characteristics change. We start by
considering several base case probabilities for combinations of public and private firms with
high and low burdens of proof. For these base cases, we report the probabilities of being
affected, given that all other explanatory variables are set at their means. For example, the
likelihood of a private (public) firm with a high burden of proof being affected is 13.8%
(25.1%), while the same likelihood is 23.8% (38.5%) for a private (public) firm with a low
burden of proof. These differences illustrate that the effects of burden of proof and listing
status are also economically large. Subsequent columns highlight the economic significance
of the other variables. They show what happens to the base case probabilities when the
continuous explanatory variables increase by one standard deviation, while the other
explanatory variables remain at the means. For example, when log(revenues) increases by
one standard deviation, the likelihood that a public firm with a low burden of proof is
affected increases by 7.65% from its base case of 38.5%. The changes in probabilities are
large for all explanatory variables. This indicates that our findings are not only statistically
significant, but also economically significant.
We also employ a second estimation approach to examine the types of firms that are
more affected by the new standards. This approach treats each firm as an individual
observation. The dependent variable in these models is the affected variable as described in
Table 2. Affected is the proportion of the three areas of risk management affected by the
new standards. It takes on the values of 0, 0.333, 0.5, 0.666, or 116. While firms with a score
of 0.5 are more affected than those with score of 0.333, it is not clear that we should interpret
a score of 0.5 to imply that the effect is truly 50% larger than for firms with a score of 0.333.
16 Note that this variable can take on a value of 0.5 if the firm only manages two of the three areas of risk and indicates its policies are affected in 1 of the 2 areas.
24

We therefore estimate ordered probit models, in which the exact magnitude of the variables
is ignored, but higher numbers imply that the firm is more affected.
Table 7 contains our findings. Panel A contains the regression models, while Panel B
sheds light on the economic significance of the findings. The models reported in Panel A
contain the same sets of explanatory variables as the probit models displayed in Panel A of
Table 6. The findings are also very similar: more firm policies are affected when the
companies operate in countries with high accounting standards and a low burden of proof for
accountant misdeeds. Private firms are less affected, while firms that consider earnings
volatility reduction to be an important benefit of risk management and firms that more often
take active positions are more affected. All of these effects remain statistically significant.
Only institutional ownership is no longer statistically significant.
The analysis of economic significance reported in Panel B of Table 7 is based on
model (v) of Panel A. We follow the same general approach as in Panel B of Table 6. We
start by considering two sets of firms: (a) private firms that operate in countries with a high
burden of proof and (b) public firms that operate in countries with a low burden of proof.
For each set, we compute the probability that all of their risk management policies are
affected and the probability that none of their policies are affected, after setting all the other
explanatory variables equal to their means. We call these the base case probabilities (column
(iii)). They vary dramatically across these two sets of characteristics. For example, the
probability that a private firm operating in a country with a high burden of proof reports that
all its risk management policies are affected is only 7.7%; this probability more than triples
to 26.8% for public firms in low burden of proof countries. In the next two columns, we
report the change in probabilities when we switch the burden of proof and the public/private
25

status. Switching these variables has a very large effect on the base case probabilities.
Consider, for example, private firms from high burden of proof countries. The base case
probability that none of its risk management activities are affected is 78.5%. The same firms
in low burden of proof countries are 12.4% less likely to be unaffected. If these firms were
also publicly traded, the probability of not being affected would decline by another 14.6%.
In columns (vi) through (ix), we report the change in probability when we increase
the continuous variables by one standard deviation. For example, increasing the importance
of reducing earnings volatility variable by one standard deviation increases the probability
that all risk policies are affected by 9.9% for public firms in low burden of proof countries.
This effect is very large relative to the base case of 26.9%. The economic importance of the
other explanatory variables is also substantial, and this is particularly the case for the active
positions variable.
Overall, the evidence presented in this section provides strong support for our
hypotheses. The effect of the new standards on risk management varies cross-sectionally
with proxies for firms’ demand for accounting information, accounting transparency and
enforcement, and the extent to which managers undertake speculative activities.
5.3. The effect of the new standards on policies and instrument use
In this section we analyze the affected firms in more detail to find out how their risk
management policies have been changed. Firms that indicated that they were affected by the
new standards were asked a series of additional questions to better understand how these
standards changed their behavior.
26

The first element we focus on is whether firms feel the new standards have reduced
(or increased) their ability to hedge from an economic perspective. This question goes to the
heart of the concern expressed by many that the potential increase in earnings volatility will
lead firms to hedge less, even though such hedging has economic benefits. Firms were given
a 5 point scale and could indicate that the new standards had reduced their ability (1), not
affected their ability (3), or improved their ability (5) to hedge from an economic perspective.
The survey clarified that a reduction in the ability to hedge from an economic perspective
implies that it leads to a reduction in expected future cash flows. In column (ii) of Table 8,
we tabulate the responses. Firms were asked this question for each of their risk management
policies (foreign exchange, interest rate, commodity), but only if they indicated that this
specific policy was affected. We average the response for all affected policies across each
firm, before computing statistics for the sample. The results are striking: out of 93 firms, 51
indicated a reduced ability (score of 1 or 2), 27 mention their ability has remained unchanged
(score of 3), and 15 firms report an increase (score of 4 or 5). The average score is 2.5, the
median is 2, and both are significantly different from 3 (the score for unaffected firms). Of
course, these statistics are only computed for firms that indicate that their policies have been
affected. In column (iii) we repeat this exercise, but assume that unaffected firms would
have responded with a 3 to this question. Even after including these firms, we continue to
find that the average and the median are both significantly below 3.
We next study specific foreign exchange hedging activities. For different types of
foreign exchange hedges, firms were asked to indicate whether those activities will be
increased, unaffected or reduced as a result of the new accounting standards. This question
was only asked of the 96 firms that indicated that their foreign exchange risk management
27

policies were affected. The results are displayed in Table 9. Note that the sample size is
smaller than 96 because firms could also indicate that they did not engage in a specific
activity to begin with (this response is not tabulated). We assign ‘decreased activity’ a score
of -1, ‘unaffected’ a score of 0, and ‘increased activity’ a score of 1, and perform a t-test to
determine whether the average response is significantly different from zero. The p-value of
that test is reported in the final column. The conclusion from this analysis is that firms
substantially reduce their foreign exchange hedging as a result of the new standards; virtually
every activity is significantly reduced. The only exceptions are on balance sheet assets and
liabilities (hedges of accounts receivable and payable) and balance sheet book values. These
types of hedges are the most likely to qualify for hedge accounting because there is little
uncertainty about the amounts involved.
The finding that firms reduce much of their foreign exchange hedging is probably not
what standard setters had in mind when the new standards were introduced. There are also
positive consequences, however. The last three lines contain activities that are all related to
taking a view on future exchange rates17. While not many firms undertake these activities to
begin with, about one third of the respondents indicate that they have decreased them as a
result of the new standards. Thus, reducing speculative activities appears to be a positive
outcome of the new standards. This reinforces our earlier findings that firms that take active
positions are more affected.
17 Undertake directional trading is taking a position in an exchange rate, without taking any offsetting positions in another one. For example, a firm may feel that the Yen will appreciate and purchase Yen futures. Arbitrage involves taking two offsetting positions which yield a guaranteed positive return without risk. It is unlikely that such opportunities truly exist in foreign exchange markets, but firms were given the option to provide this response because they may feel such opportunities do exist or because this is an easier way to characterize speculative trades. Relative value opportunities are trades similar to arbitrage trades, but the expected payoffs are not deemed to be riskless. We verified through discussions with CFOs and treasurers that this terminology is well understood by risk management practitioners.
28

Table 10 focuses on the use of instruments. Affected firms were asked to describe
whether they would increase or decrease their reliance on specific instruments as a result of
the new standards. This question was asked three times, once for each area of risk
management; the list of instruments was always the same, except that debt in a foreign
currency was offered only as an option in the foreign exchange section, and forward rate
agreements was an option only in the interest rate section. In our analysis, we treat each
response as a separate observation. Thus, if a firm provides a response in each area of risk
management, it would be counted three times. However, when computing the t-statistics to
assess whether the use of a particular instrument has been reduced, we take into account the
lack of independence of the observations. We also report statistics after combining all linear
(forward contracts, forward rate agreements, futures contracts, swaps, and foreign currency
debt) and all non-linear contracts (options on futures, OTC options, and exchange traded
options).
Table 10 shows that there is a clear difference across instruments in the effect of the
new standards. Linear instruments are generally unaffected, except for a decline in the use of
futures contracts. This lack of an effect is not surprising because it much easier to qualify for
hedge accounting with linear instruments. The decline in the use of options is quite dramatic,
however. For example, almost 45% of the firms decrease their reliance on OTC options as a
result of the standards. Hedges with option contracts are much less likely to qualify for
hedge accounting and these findings suggest that their use declined substantially. Given that
hedging strategies with non-linear payoffs are often optimal [see Brown and Toft (2002)],
this outcome appears undesirable.
29

5.4. The importance of qualifying for hedge accounting
As mentioned in Section 3 and documented in Panel B of Table 2, the survey also
asks affected firms their opinion about how important it is to qualify for hedge accounting
when considering risk management alternatives (on a scale from 0=not important to 5=very
important). In this section, we study what determines the cross-sectional variability in the
response to this question.
We expect the factors determining the importance of qualifying for hedge accounting
to be the same as the factors explaining whether firms are affected by the new standards, with
one exception: we do not expect firms that take active positions to be more concerned with
achieving hedge accounting when evaluating risk management solutions. Taking a view has
nothing to do with risk management as such.
Because the responses are categorical, we estimate ordered probit models. We treat
each firm response to each risk management area as an individual observation, so the same
firm may enter the regression multiple times, but we adjust the standard errors for the lack of
independence of the observations. Table 11 contains the findings. The regression models are
displayed in Panel A, while Panel B analyzes the economic significance. As these answers
are only available for firms whose risk management policies have been affected by the new
standards, the findings should be interpreted with caution given the smaller sample size.
In model (i), we study size and accounting quality. Both variables are insignificant.
In model (ii) we replace accounting quality with the low burden of proof dummy; this
variable is significantly positive, suggesting that firms in countries where it easier to prove
accountant wrongdoings care more about achieving hedge accounting. In model (iii), we
find evidence that private firms are less concerned with hedge accounting. We combine
30

several explanatory variables in model (iv). We continue to find a positive effect for low
burden of proof and a negative effect for private firms. Institutional ownership is not
significant, however, which suggests that investor sophistication is not an important driver of
the desire to qualify for hedge accounting. Finally, model (v) shows that firms that consider
earnings volatility reduction to be important care more about achieving hedge accounting. In
this model, size, the burden of proof, and the private company dummy are all significant at
the 10% level or better. These findings broadly support our predictions, with the exception
of the role of investor sophistication.
Panel B of Table 11 contains an analysis of the economic significance of these
findings, based on model (v). We again start by identifying two base cases: private firms
with high burden of proof and public firms with low burden of proof. We then compute the
probability of various responses to the question: how important is it to qualify for hedge
accounting. Recall that six categories were possible, ranging from 0 (not important) to 5
(very important). We pick three of these categories – the two extremes and one in the middle
– and compute the probability that firms from the two base cases we have identified fall into
each of these categories, assuming that the other explanatory variables are set equal to the
mean. As illustrated in column (ii), the base case probabilities differ substantially between
the two sets of firms. For example, only 17% of private firms with a high burden of proof
fall in category 5, while 55.5% of public firms with a low burden of proof fall in that
category. In columns (iv) and (v), we illustrate what happens to these probabilities when we
switch the indicator variables. The changes in probabilities are quite substantial. For
example, the 55.5% probability we just discussed declines by 20.2% when we move the firm
from public to private status.
31

Finally, in columns (vi) to (viii), we report the change in probability when one of the
continuous variables increases by one standard deviation. For instance, the 55.5%
probability increases by 20.7% if the importance of reducing earnings volatility increases by
one standard deviation.
The computations in Panel B of Table 11 illustrate that the results that are statistically
significant also have a very large economic impact.
5.5. Robustness tests
We conduct three sets of tests to verify whether the findings reported previously are
robust. First, we include dummy variables for all countries with more than 5 respondent
firms in our sample to make sure the explanatory variables employed in our analyses are not
proxying for country characteristics. When estimating models with the inclusion of these
dummies, we remove the country level variables from the regressions. Inclusion of these
dummies does not affect our findings. Second, we include dummies for 18 broad industry
classifications from which respondents could choose when completing the survey. None of
these dummies are significant at conventional levels. Moreover, their inclusion does not
affect the other findings reported previously. Third, as reported in Table 4, 87% of the
respondents already employ fair value accounting for derivates in preparing their financial
statements. The majority of the remaining firms indicate that they plan to adopt the new
standards in the near future, but some firms are uncertain about the timing. We verify that
our results persist when we remove firms that are undecided as to when or whether they will
adopt the new standards.
32

6. Conclusion
This paper employs survey evidence to study the impact of new fair value derivatives
accounting standards on the risk management policies of companies worldwide. We
document that more than 40% of all companies have been affected by the new standards in at
least one area of risk management. The vast majority of those that have been affected
indicate that their ability to hedge from an economic perspective has been compromised.
However, we also find that the new standards have reduced the use of derivatives for
speculative purposes: firms that are more likely to take active positions are more likely to be
affected by the standards. In terms of instruments, we observe that firms are less likely to
employ strategies that involve securities with non-linear payoffs (which are less likely to
qualify for hedge accounting), while there is little or no decline in the use of linear
instruments.
We also document cross-sectional differences in the extent to which companies have
been affected by the standards, and care about qualifying for hedge accounting. Firms that
operate in an environment where contracts are more likely to be written on accounting data,
and firms that attach more importance to the reduction of earnings volatility as a benefit of
risk management are more affected and care more about obtaining hedge accounting.
Affected firms also have less sophisticated investors. Accounting quality at the country-
level, and particularly the ability to take accountants to court, also has a dramatic impact on
the effect of the new standards on corporate risk management activities.
While our analysis of the survey evidence sheds light on the types of firms being
affected and their changes in risk management policies, we are not in a position to evaluate
the overall welfare impact of the standards. This depends on whether the cost of the decline
33

in economic hedging is outweighed by the benefit of the reduction in speculation. Studying
this trade-off in more detail is a fruitful area for future work.
34

Appendix: Survey Design and Delivery
The survey instrument contains questions organized in nine sections (Company
Information, CFO Views, Capital Structure, Liability Management, Liquidity Management,
General Risk Management, Interest Rate Risk Management, Foreign Exchange Risk
Management and Commodity Risk Management). The survey makes use of conditional
branching (i.e., certain responses lead to detailed additional questions, while others do not).
Because of the size of this survey, the survey administrators encouraged CFOs to complete
the “CFO Views” section, but allowed them to delegate responding to some parts of the
survey to those people within their organizations more knowledgeable about specific areas
within the finance function.
The survey was completely anonymous via the internet and the survey team went to
great lengths to ensure the confidentiality of the companies involved. It is therefore not
possible to tie the survey responses to company information not disclosed in the survey.
The firms targeted for the survey include all firms worldwide that have a coverage
officer assigned to them by the investment banking division of Deutsche Bank. This sample
comprises 4000 firms, generally the largest companies in their respective countries and
industries. Note that this sample does not include smaller firms in the bank’s home market,
because those are covered by local branches, and that a large fraction of the targeted firms
are not currently Deutsche Bank clients.
While CFOs received a request from the academic researchers involved in the survey,
investment bank officers covering the companies were requested to encourage firms to
complete the survey. Because the survey was completely anonymous, the bank was unable
35

to use the information in the survey for direct marketing purposes. However, in return for
completion of the survey, firms were promised access to detailed benchmarking reports.
36

References
Asquith, Paul, Anne Beatty, and Joseph Weber, 2004, Performance Pricing in Bank Debt Contracts, Journal of Accounting and Economics 40, 101-128
Ball, Ray, Ashok Robin, Joanna Shuang Wu, 2003, Incentives Versus Standards: Properties
of Accounting Income in Four East Asian Countries, Journal of Accounting and Economics 36, 235-270.
Ball, Ray, and Lakshmanan Shivakumar, 2005, Earnings Quality in UK Private Firms,
Journal of Accounting Research 39, 83-128. Barry, Christopher, and Stephen Brown, 1985, Differential Information And Security Market
Equilibrium, Journal of Financial and Quantitative Analysis 20, 407-422. Barth, Mary, John Elliott, and Mark Finn, 1999, Market Rewards Associated With Patterns
Of Increasing Earnings, Journal of Accounting Research 37, 387-415. Beatty, Anne, 2007, How Does Changing Measurement Change Management Behavior? A
Review of the Evidence, Working paper, Ohio State University. Beatty, Anne, Bin Ke, and Kathy Petroni, 2002, Earnings Management to Avoid Earnings
Declines Across Publicly and Privately Held Banks, The Accounting Review 77, 547-570 Beatty, Anne, K. Ramesh, and Joseph Weber, 2002, The Importance Of Accounting Changes
In Debt Contracts: The Cost Of Flexibility In Covenant Calculations, Journal of Accounting and Economics 33, 205-227.
Brown, Greg W., 2001, Managing Foreign Exchange Risk with Derivatives, Journal of
Financial Economics 60, 401-448. Brown, Greg W., and Klaus B. Toft, 2002, How Firms Should Hedge, Review of Financial
Studies 15, 1283-1324. Burgstahler, David C., Luzi Hail, and Christian Leuz, 2006, The Importance of Reporting
Incentives: Earnings Management in European Private and Public Firms, The Accounting Review 5, 983-1016.
Bushman, Robert, Joseph Piotroski, and Abbie Smith, 2004, What Determines Corporate
Transparency?, Journal of Accounting Research 42, 207-252. Bushman, Robert, and Joseph Piotroski, 2006, Financial Reporting Incentives for
Conservative Accounting: The Influence of Legal and Political Institutions, Journal of Accounting and Economics 42, 107-148.
CFO Magazine, 2006, Lost in the Maze, May 8.
37

DeFond, Mark, and Chul Park, 1997, Smoothing Income In Anticipation Of Future Earnings, Journal of Accounting and Economics 23, 115-139.
DeFond, Mark, Mingyi Hung, and Robert Trezevant, 2007, Investor Protection and the
Information Content of Annual Earnings Announcements: International Evidence, Journal of Accounting and Economics 43, 37-67.
DeMarzo, Peter, and Darrell Duffie, 1991, Corporate Financial Hedging With Proprietary
Information, Journal of Economic Theory 53, 261-286. DeMarzo, Peter, and Darrell Duffie, 1995, Corporate Incentives for Hedging and Hedge
Accounting, Review of Financial Studies 8, 743-771. Froot, Kenneth, David Scharfstein, and Jeremy Stein, 1993, Risk Management: Coordinating
Corporate Investment and Financing Policies, Journal of Finance, 1629-1658. Gaver, Jennifer, Kenneth Gaver, and Jeffrey Austin, 1995, Additional Evidence on Bonus
Plans and Income Management, Journal of Accounting and Economics 18, 3-28. Geczy, Christopher, Bernadette Minton, and Catherine Schrand, 2007, Taking A View:
Corporate Speculation, Governance, And Compensation, The Journal of Finance 62, 2405-2443.
Graham, John R., and Daniel A. Rogers, 2002, Do Firms Hedge In Response To Tax
Incentives?, Journal of Finance 57, 815-839. Graham, John R., and Clifford Smith, 1999, Tax Incentives To Hedge, Journal of Finance
54, 2241-2262. Graham, John R., and Campbell R. Harvey, 2001, The Theory and Practice of Corporate
Finance: Evidence from the Field, Journal of Financial Economics 60, 187-243. Graham, John R., Campbell R. Harvey, and Shiva Rajgopal, 2005, The Economic
Implications Of Corporate Financial Reporting, Journal of Accounting and Economics 40, 3-73.
Guay, Wayne, 1999, The Impact of Derivatives on Firm Risk: an Empirical Examination of
New Derivative Users, Journal of Accounting and Economics 26, 319-351. Hentschel, Ludger and S.P. Kothari, 2001, Are Corporations Reducing or Taking Risk with
Derivatives?, Journal of Financial and Quantitative Analysis 36, 93-118. Ke, Bin, Kathy Petroni and Assem Safieddine, 1999, Ownership Concentration and
Sensitivity of Executive Pay to Accounting Performance Measures: Evidence from Publicly and Privately Held Insurance Companies, Journal of Accounting and Economics 28, 185-209.
38

La Porta, Rafael, Lopez-de-Silanes, Florencio, and Andrei Shleifer, 2006, What Works in Securities Law, Journal of Finance 61, 1-32.
Lang, Mark, and Russ Lundholm, 1993, Cross-Sectional Determinants of Analyst Ratings of
Corporate Disclosures, Journal of Accounting Research, 246-271. Leuz, Christian, D. Nanda, and Peter Wysocki, 2003, Earnings Management and Investor
Protection: An International Comparison, Journal of Financial Economics 69, 505-527. McKay, Peter A. and Joe Niedzielski, New Accounting Standard Receives Mixed Reviews,
Wall Street Journal, October 23, 2000. Melumad, Nahum D., Guy Weyns and Amir Ziv, 1999, Comparing Alternative Hedge
Accounting Standards: Shareholders Perspective, Review of Accounting Studies 5, 265-292.
Revsine, Lawrence, Daniel W. Collins, and W. Bruce Johnson, 2002, Financial Reporting & Analysis, Second Edition, Upper Saddle River, NJ: Prentice Hall.
Sapra, Haresh, 2002, Do Mandatory Hedge disclosures Discourage or Encourage Excessive Speculation?, Journal of Accounting Research 40, 933-964.
Sapra, Haresh and Hyun Song Shin, 2007, Do Derivatives Disclosures Impede Sound Risk Management, Working paper, University of Chicago and Princeton University.
Servaes, Henri and Peter Tufano, 2006, Corporate Risk Management: The Theory and Practice of Corporate Risk Management Policy, Working paper, Deutsche Bank Liability Strategies Group.
Singh, Amrik, 2004, The Effects of SFAS 133 on Corporate Use of Derivatives, Volatility
and Earnings Management, Pennsylvania State University dissertation. Smith, Clifford W., and René M. Stulz, 1985, The Determinants Of Firms' Hedging Policies,
Journal of Financial and Quantitative Analysis 28, 391-405. Zhang, Haiwen, 2008, Effect of Derivative Accounting Rules on Corporate Risk-
Management Behavior, Working Paper, Ohio State University.
39

Table 1 Number of firms that answered questions regarding risk management/exposure
This table lists the number of firms who indicate whether they manage foreign exchange and interest rate risk and whether, in the absence of risk management, they have commodity exposure. We list the number of firms responding to the question and the number of firms managing the risk or exposed to commodities. The fourth row lists the number of firms with at least one exposure. Variable Number of
respondents Number of firms managing risk/with exposure
Fraction
Foreign exchange risk 253 210 0.83 Interest rate risk 248 184 0.74 Commodity exposure 248 122 0.49 Managing/exposed to at least 1 risk 263 239 0.91
40

Table 2 Number of firms affected by the new derivative accounting standards and statistics on
importance of hedge accounting Panel A of this table lists the fraction of firms who indicated whether they are affected by the new derivative accounting standards. For each area of risk management, the survey asked: “Has your Risk Management policy been materially affected by the introduction or impending introduction of new derivative accounting standards (e.g., IAS 39, FAS 133, or local equivalent) under which your company currently reports or will report?” To compute the average in the fifth row (Affected), we first average the response by firm, before averaging across firms. Panel B contains the distribution of responses regarding the importance of hedge accounting. Firms that indicate whether they were affected by the new standards were asked: “How important is achieving ‘hedge accounting’ for accounting purposes when examining Risk Management execution alternatives?” The numbers in parentheses are fraction of the total. Panel A: Firms affected by the new accounting standards Variable Number of
respondents Number of firms affected
Fraction
Foreign exchange risk management 200 96 0.48 Interest rate risk management 168 64 0.38 Commodity risk management 109 20 0.18 Affected in at least 1 risk management area 229 116 0.42 Average of foreign exchange, interest, commodity (Affected)
229 0.32
Panel B: Importance of achieving hedge accounting
Response Foreign exchange Interest rate Commodity 0 2 (3%) 0 (0%) 1 (5%) 1 0 (0%) 0 (0%) 0 (0%) 2 7 (10%) 2 (3%) 1 (5%) 3 7 (10%) 11 (18%) 2 (10%) 4 25 (37%) 17 (27%) 6 (30%) 5 26 (39%) 32 (52%) 10 (50%)
Total 67 62 20
41

Table 3 Distribution of sample firms by country of origin
The sample consists of 229 firms that answered whether their risk management policies are affected by the new standards in at least one area of risk management.
Country Number of Firms Algeria 1 Argentina 3 Australia 1 Austria 5 Belgium 7 Canada 1 Cayman Islands 1 Chile 7 Denmark 2 Finland 1 France 3 Germany 46 India 5 Indonesia 3 Italy 9 Japan 20 Korea (South) 7 Liechtenstein 1 Luxembourg 4 Malaysia 2 Netherlands 4 New Zealand 5 Norway 1 Philippines 5 Poland 1 Portugal 2 Singapore 2 South Africa 3 Spain 11 Sri Lanka 2 Sweden 3 Switzerland 14 Taiwan 5 Thailand 1 Undisclosed 4 United Kingdom 15 United States 22 Total 229
42

Table 4 Summary statistics on sample firms
Only firms who respond whether at least one of their risk management policies has been or will be affected by the new accounting standards are included in the sample. Firms are asked to indicate in which category institutional ownership falls: 0%, 1-5%, 6-10%, 11%-25% 26-50%, 51% or more. The average and medians in this table are computed based on the assumption that each firm in a category has institutional ownership equal to the category average. Variable Mean Median N Revenues ($ millions) 7,749 1,998 210 Private (Not listed) 0.32 0 223 Importance of reducing earnings volatility (scale 0 -5) 2.60 3 229 Do you take active positions (0=never 5=frequently) averaged across 3 areas of risk management
0.74 0.33 229
Institutional ownership 0.3226 0.1750 145 Difficulty in explaining to investors is a drawback (0-5) 1.44 1 195 Already using fair value accounting for derivatives 0.87 1 229
43

Table 5 Characteristics of firms affected and unaffected by the new standards
High accounting standards is an indicator variable equal to one if the firm is domiciled in a country with an index of disclosure quality (CIFAR score) equal to 71 and above and zero otherwise. Low burden of proof is a dummy variable set equal to one if the burden of proof for accountants index developed by La Porta, Lopez-de-Silanes, and Shleifer (2006) is bigger than 0.5 and zero otherwise. Survey respondents indicate whether institutional ownership falls in one of the following categories: 0%, 1%-5%, 6%-10%, 11%-25%, 26%-50%, 51% or more. We assume that ownership in each category is equal to the category average before computing sample means and medians. P-value means is the p-value of a t-test of equality of means of the two groups. P-value medians is the p-value of a rank sum test of equality of medians of the two groups. Unaffected AffectedVariable Mean Median MeanN NMedian P-value
means P-value medians
Revenues (in $ millions) 4,701 1,579 122 11,974 2,570 88 0.00 0.01 Private firm 0.3846 0 130 0.2258 0 93 0.01 0.01 High accounting standards 0.5020 0.5 128 0.6395 1 86 0.04 0.04 Low burden of proof 0.5859 1 128 0.7303 1 89 0.03 0.03 Institutional ownership 0.3336 0.1750 84 0.3074 0.3750 61 0.57 0.90 Difficulty in explaining to investors 1.275 1 120 1.6933 1 75 0.02 0.03 Importance of reducing earnings volatility 2.78 3 120 3.36 3 78 0.00 0.00 Take active positions
0.60 0 133 0.93 0.67 96 0.01 0.03
44

45
Table 6 Probit regressions explaining determinants of whether firms are affected by the new standards
In Panel A, the dependent variable is equal to 1 if a specific risk management area for a firm has been affected by the new standards and zero otherwise. Each firm response for each risk management area is considered to be a separate observation. Three areas of risk management are considered: foreign exchange, interest rate, and commodities. Standard errors are adjusted to reflect the lack of independence of the observations. High accounting standards is an indicator variable equal to one if the firm is domiciled in a country with an index of disclosure quality (CIFAR score) equal to 71 and above and zero otherwise. Low burden of proof is a dummy variable set equal to one if the burden of proof for accountants index developed by La Porta, Lopez-de-Silanes, and Shleifer (2006) is bigger than 0.5 and zero otherwise. Survey respondents indicate whether institutional ownership falls in one of the following categories: 0%, 1%-5%, 6%-10%, 11%-25%, 26%-50%, 51% or more. We assume that ownership in each category is equal to the category average before computing sample means and medians. Revenues, institutional ownership, and the importance of reducing earnings volatility are measured at the firm level. High accounting quality and low burden of proof are measured at the country level. Active positions is measured for each firm and for each area of risk management separately. When institutional ownership and the importance of reducing earnings volatility are missing, we set these variables equal to zero. Dummy variables are set equal to one of these variables are missing and zero otherwise. The coefficients on the dummy variables are not reported in the table. P-values are in parentheses. Panel B presents the marginal effects of changing the independent variables. The base case probabilities are calculated using the coefficients of model (v) in Panel A, and setting the continuous independent variables equal to their mean values. In the base case scenario, the dummy variables are set equal to 0 or 1 depending on the base case (first two columns). We re-calculate the effect on each of these probabilities of an increase of one standard deviation in each of the continuous independent variables. Column (ii) reports the base case probabilities while columns (iii) to (vi) report the change in probabilities.

46
Table 6 (continued)
Panel A: Regression models Variable
(i) (ii) (iii) (iv) (v)
Intercept -1.413(0.000)
-1.648 (0.000)
-0.793 (0.048)
-1.133 (0.015)
-2.146 (0.000)
Log (revenues) 0.096 (0.058)
0.107 (0.027)
0.056 (0.243)
0.082 (0.116)
0.109 (0.057)
High accounting quality 0.282 (0.058)
Low burden of proof 0.491 (0.004)
0.417(0.026)
0.378 (0.051)
Private company -0.455(0.018)
-0.400 (0.073)
-0.420 (0.067)
Institutional ownership -0.661 (0.072)
-0.630 (0.088)
Importance of reducing earnings volatility 0.181 (0.021)
Active positions 0.145 (0.008)
Pseudo R-squared 0.025 0.035 0.029
0.049
0.112 N 418 424 438 422 422

47
Table 6 (continued)
Panel B: Analysis of economic significance based on model (v) of Panel A
Change in probability Case
Base Case Probability of
Being Affected Log (revenues) Institutional
ownership
Importance of reducing earnings volatility
Active positions
(i)
(ii) (iii) (iv) (v) (vi)
High Burden 13.78% 4.77% -3.35% 7.26% 5.05% Private Firm Low Burden
23.82% 6.46% -4.85% 9.65% 6.82%
High Burden 25.14% 6.62% -5.01% 9.88% 6.99% Public Firm Low Burden
38.51% 7.65%
-6.20%
11.21% 8.06%

48
Table 7 Ordered probit regressions explaining the fraction of firm policies affected by the new standards
In Panel A, the dependent variable is Affected, which is the fraction of each firm’s risk management policies affected by the new standards. Three areas of risk management are considered: foreign exchange, interest rate, and commodities. High accounting standards is an indicator variable equal to one if the firm is domiciled in a country with an index of disclosure quality (CIFAR score) equal to 71 and above and zero otherwise. Low burden of proof is a dummy variable set equal to one if the burden of proof for accountants index developed by La Porta, Lopez-de-Silanes, and Shleifer (2006) is bigger than 0.5 and zero otherwise. Survey respondents indicate whether institutional ownership falls in one of the following categories: 0%, 1%-5%, 6%-10%, 11%-25%, 26%-50%, 51% or more. We assume that ownership in each category is equal to the category average before computing sample means and medians. Revenues, institutional ownership, and the importance of reducing earnings volatility are measured at the firm level. High accounting quality and low burden of proof are measured at the country level. Active positions is measured for each firm by averaging the response for each area of risk management separately. When institutional ownership and the importance of reducing earnings volatility are missing, we set these variables equal to zero. Dummy variables are set equal to one of these variables are missing and zero otherwise. P-values are in parentheses. Panel B presents the marginal effects of changing the independent variables. The base case probabilities are calculated using the coefficients of model (v) in Panel A, and setting the continuous independent variables equal to their mean values. In the base case scenario, the dummy variables are set equal to 0 or 1 depending on the base case (first two columns). We re-calculate these probabilities changing one independent variable at a time. Continuous independent variables are increased by one standard deviation and the dummy variables are changed from 0 to 1, or from 1 to 0, depending on the case. Column (iii) reports the base case probabilities while columns (iv) to (ix) report the change in probabilities.

49
Table 7 (continued)
Panel A: Regression models
Variable (i) (ii) (iii)
(iv) (v)
Log (revenues) 0.084 (0.104)
0.091 (0.049)
0.045 (0.360)
0.068 (0.204)
0.082 (0.151)
High accounting quality 0.328 (0.065)
Low burden of proof 0.455 (0.012)
0.390(0.052)
0.375 (0.067)
Private company -0.431 (0.031)
-0.391 (0.101)
-0.434 (0.080)
Institutional ownership -0.618 (0.124)
-0.550 (0.163)
Importance of reducing earnings volatility 0.171 (0.029)
Active positions 0.189 (0.022)
Pseudo R-squared 0.017 0.019 0.016 0.027 0.077
N 199 202 209 201 201

50
Table 7 (continued)
Panel B: Analysis of economic significance based on model (v) of Panel A
Change in probability
Case
Risk Mgmt
Policies Affected
Base Case Probability
Switch between low
and high burden of
proof
Switch between
private and public status
Log (revenues)
Institutional ownership
Importance of reducing
earnings volatility
Active positions
(i)
(ii)
(iii)
(iv) (v) (vi)
(vii)
(viii)
(ix)
None 78.52% -12.43%
-14.62% -4.64% 4.04% -8.94% -5.85%Private with high burden of proof
All 7.69%
6.97% 8.36% 2.41% -1.91%
4.84%
3.07%
None 49.23% 14.67% 16.85% -5.96% 5.85% -10.90% -7.41%Public with low
burden of proof All 26.85% -10.89% -12.20% 5.17% -4.61% 9.85% 6.50%

51
Table 8 Effect of new standards on ability to hedge from an economic perspective
This table shows the response rate to the question: has the introduction of IAS 39, FAS 133, or local equivalent affected your ability to hedge from an economic perspective: scale 1 (reduced ability) to 5 (improved ability), where 3 = not affected, averaged across 3 areas of risk management. Column (ii) contains the distribution of responses. Column (iii) is constructed based on the assumptions that firms that are not affected by the new standards and were not asked this question would have responded with a 3 (not affected).
(i) Effect
(ii) # firms
(iii) # firms:
assuming not affected firms respond 3
1.00 13 7 1.33 2 2 1.50 2 1 1.67 2 4 2.00 28 17 2.33 2 4 2.50 1 9 3.00 27 161 3.33 0 1 3.50 0 2 3.67 0 3 4.00 12 8 5.00 3 2
Number of firms 93 227 Average P-value t-test mean=3
2.50 0.00
2.85 0.00
Median P-value signed-rank test median=3
2.00 0.00
3.00 0.00

Table 9 Impact of new accounting standards on foreign exchange hedging
This table presents summary statistics on the impact of the new standards on different types of FX hedging. To compute p-values, we set decrease activity equal to -1, not affected equal to 0, and increase activity equal to +1, and perform a t-test of equality of the average to zero.
Type of hedging Decrease Activity
Activity not Affected
Increase Activity p-value
Transaction Hedging Foreign repatriations 7 34 2 0.10 On balance sheet assets and liabilities 8 38 4 0.25 Off balance sheet contractual commitments 7 22 0 0.01 Anticipated transactions < 1 year 16 29 3 0.00 Anticipated transactions > 1 year 13 25 4 0.03 Committed M&A 8 25 1 0.02 Anticipated M&A 10 11 1 0.00 Translation Hedging
P&L translation 8 23 2 0.06 Balance sheet book values 6 21 2 0.16 Economic/Market value balance sheet 5 8 1 0.10 Competitive Economic/Competitive exposures 8 17 0 0.00 Other Undertake directional trading 6 14 0 0.01 Arbitrage 5 12 0 0.02 Exploit relative value opportunities 6 12 0 0.01
52

53
Table 10 The impact of new accounting standards on the instruments being used
This table presents summary statistics on the impact of new accounting standards on the instruments being used. Responses for all three areas of hedging have been combined. To compute p-values, we set decrease reliance equal to -1, no change equal to 0, and increase reliance equal to +1, and perform a t-test of equality of the average to zero, taking into account the lack of independence of the observations. Debt in foreign currency only applies to foreign exchange risk management and forward rate agreements only applies to interest rate risk management. The other instruments apply to all areas of risk management.
Type of instrument Decrease Reliance No change Increase
Reliance p-value
Forward contracts 12 78 16 0.47 Forward rate agreements 9 29 4 0.17 Futures contracts 9 39 3 0.09 Swaps
23 85 16 0.32Debt in foreign currency 4 36 4 1.00 Linear contracts 57 267 43 0.39 Options on futures 12 25 3 0.03 OTC options 36 38 7 0.00 Exchange traded options 9 24 1 0.01 Non-linear contracts 57 87 11 0.00

54
Table 11
Ordered probit regressions explaining the importance of qualifying for hedge accounting when considering risk management alternatives
In Panel A, the dependent variable is equal to 1 if a specific risk management area for a firm has been affected by the new standards and zero otherwise. Each firm response for each risk management area is considered to be a separate observation. Three areas of risk management are considered: foreign exchange, interest rate, and commodities. Standard errors are adjusted to reflect the lack of independence of the observations. High accounting standards is an indicator variable equal to one if the firm is domiciled in a country with an index of disclosure quality (CIFAR score) equal to 71 and above and zero otherwise. Low burden of proof is a dummy variable set equal to one if the burden of proof for accountants index developed by La Porta, Lopez-de-Silanes, and Shleifer (2006) is bigger than 0.5 and zero otherwise. Survey respondents indicate whether institutional ownership falls in one of the following categories: 0%, 1%-5%, 6%-10%, 11%-25%, 26%-50%, 51% or more. We assume that ownership in each category is equal to the category average before computing sample means and medians. Revenues, institutional ownership, and the importance of reducing earnings volatility are measured at the firm level. High accounting quality and low burden of proof are measured at the country level. Active positions is measured for each firm and for each area of risk management separately. When institutional ownership and the importance of reducing earnings volatility are missing, we set these variables equal to zero. Dummy variables are set equal to one of these variables are missing and zero otherwise. The coefficients on the dummy variables are not reported in the table. P-values are in parentheses. Panel B presents the marginal effects of changing the independent variables. The base case probabilities are calculated using the coefficients of model (v) in Panel A, and setting the continuous independent variables equal to their mean values. In the base case scenario, the dummy variables are set equal to 0 or 1 depending on the base case (first column). We re-calculate these probabilities changing one independent variable at a time. Continuous independent variables are increased by one standard deviation and the dummy variables are changed from 0 to 1, or from 1 to 0, depending on the case. Column (iii) reports the base case probabilities while columns (iv) to (ix) report the change in probabilities.
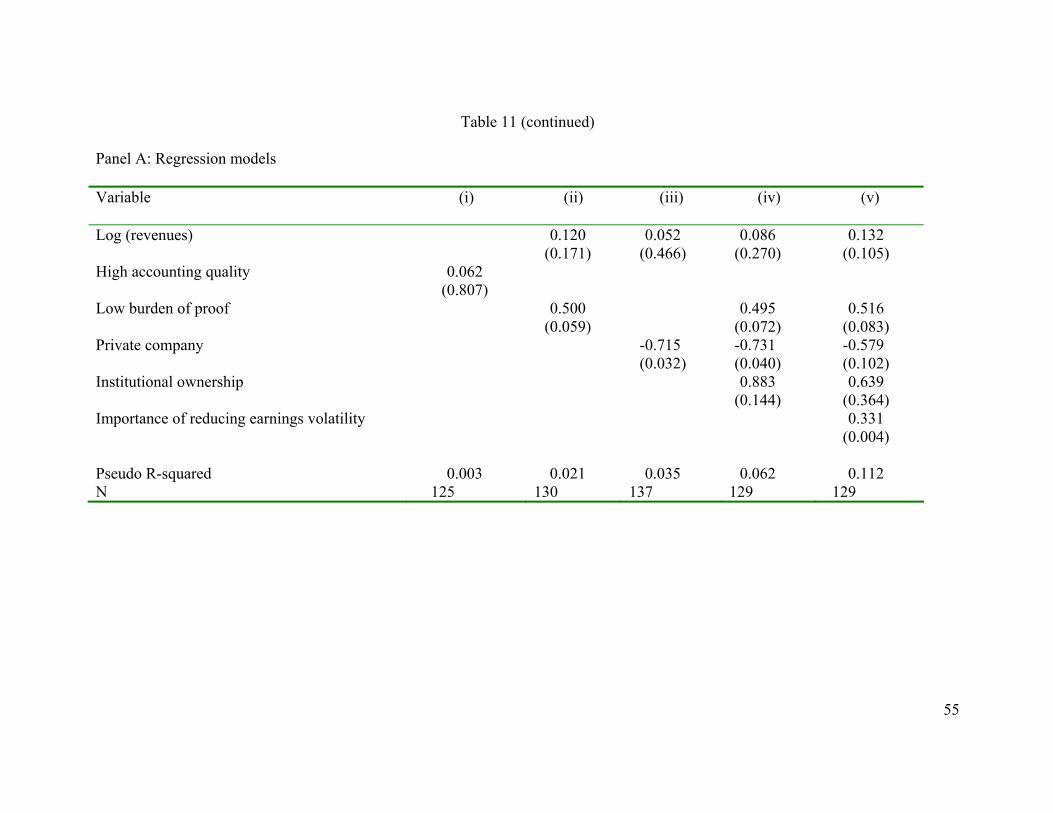
55
Table 11 (continued) Panel A: Regression models Variable (i)
(ii) (iii) (iv) (v)
Log (revenues) 0.120 (0.171)
0.052 (0.466)
0.086 (0.270)
0.132 (0.105)
High accounting quality 0.062 (0.807)
Low burden of proof 0.500 (0.059)
0.495(0.072)
0.516 (0.083)
Private company -0.715 (0.032)
-0.731 (0.040)
-0.579 (0.102)
Institutional ownership 0.883 (0.144)
0.639 (0.364)
Importance of reducing earnings volatility 0.331 (0.004)
Pseudo R-squared 0.003 0.021 0.035 0.062 0.112 N 125 130 137 129 129

56
Table 11 (continued) Panel B: Analysis of economic significance based on model (v) of Panel A
Change in probability
Case
Importance of
qualifying for hedge
accounting
Base Case Probability
Switch between low
and high burden of
proof
Switch between
private and public status
Log (revenues)
Institutional ownership
Importance of reducing earn
volatility
(i)
(ii) (iii) (iv) (v) (vi) (vii)
(viii)
0
3.99% -1.82% -2.82% -3.00% -1.13% -2.99%3 27.92% 3.87% -8.19% 9.33% -2.00% -9.25%Private with high
burden of proof 5 16.95%
7.63% 16.05% 18.35% 4.04%
18.18%
0 0.22% -0.13% 0.77% 0.95% -0.08% -0.19%3 9.89% -3.45% 8.70% 9.84% -2.03% -6.25%Public with low
burden of proof 5 55.52% 10.29% -20.23% -22.53% 5.82% 20.70%