
DOE –Design of Experiments - נסיכת המדעיםנסיכת המדעים ... chart for base...
23
© Yossi Levy 2011 DOE –Design of Experiments Yossi Levy 2 Why use DOE? Decisions should be based on information Data is not information We need collect data that can be transformed into information We also need to know how to do the transformation DOE has the two capabilities: Decide what data to collect Analyze the data to extract useful information
Transcript of DOE –Design of Experiments - נסיכת המדעיםנסיכת המדעים ... chart for base...

© Yossi Levy 2011
DOE –Design of Experiments
Yossi Levy
2
Why use DOE?
� Decisions should be based on information
� Data is not information
� We need collect data that can be transformed into information
� We also need to know how to do the transformation
� DOE has the two capabilities:
� Decide what data to collect
� Analyze the data to extract useful information

© Yossi Levy 2011
3
DOE and QbD
� Design Of Experiments is an essential component in QbD.
� It leads to detailed verification of how product and process definition affect key quality characteristics.
� It establishes a basis for defining the design space.
� Experiments enable us to map the process.
� A reliable map lets us drive safely.
� A reliable process map permits changes without adverse effects on product performance.
4
Basic principles
� Randomization
� Blocking
� Replication
� Factorial Structure
© Yossi Levy 2011
5
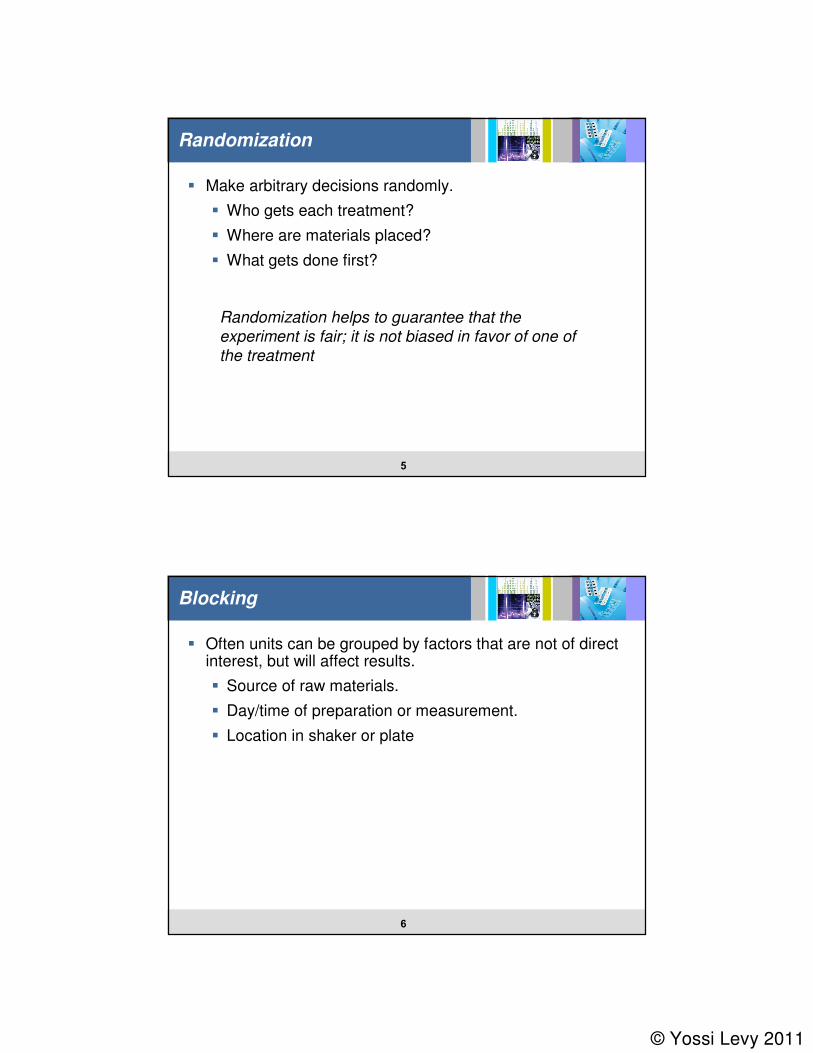
Randomization
� Make arbitrary decisions randomly.
� Who gets each treatment?
� Where are materials placed?
� What gets done first?
Randomization helps to guarantee that the
experiment is fair; it is not biased in favor of one of
the treatment
6
Blocking
� Often units can be grouped by factors that are not of direct interest, but will affect results.
� Source of raw materials.
� Day/time of preparation or measurement.
� Location in shaker or plate
© Yossi Levy 2011
7
Replication
� We need to know something about the variability of outcomes when conditions are not changed.
� That gives a basis to know if differences between conditions are “just noise”.
8
Factorial Structure
� Most processes are affected by many factors
� An experiment can:
� Modify factors systematically.
� Hold factors constant.
� Ignore factors.

© Yossi Levy 2011
9
The standard solution
� One-Factor-at-a-Time Experiments – OFAT
� Modify one factor; hold all other factors constant
10
Example: optimizing yield
� Two factors affect the yield of a process:
� Time of reaction
� Temperature of reaction
� Feasibility experiments showed that the ranges for these factors are:
� 60-180 minutes
� 21-25oC

© Yossi Levy 2011
11
OFAT
One Factor at a Time
Experiment #1: Study effects of reaction time on yield(reaction temperature held fixed at 22.5o C)
12
One Factor at a Time
Experiment #2: Study effects of reaction temperature on yield(reaction time held fixed at 130 minutes)

© Yossi Levy 2011
13
One Factor at a Time
Experiment #1: Study effects of reaction time on yield
(reaction temperature held fixed at 22.5o C)
Experiment #2: Study effects of reaction temperature on yield
(reaction time held fixed at 130 minutes)
Conclusions
� Optimal conditions are 130 minutes, 22.5o C.
� Optimal yield is about 75 grams
14
What really happened
© Yossi Levy 2011
15
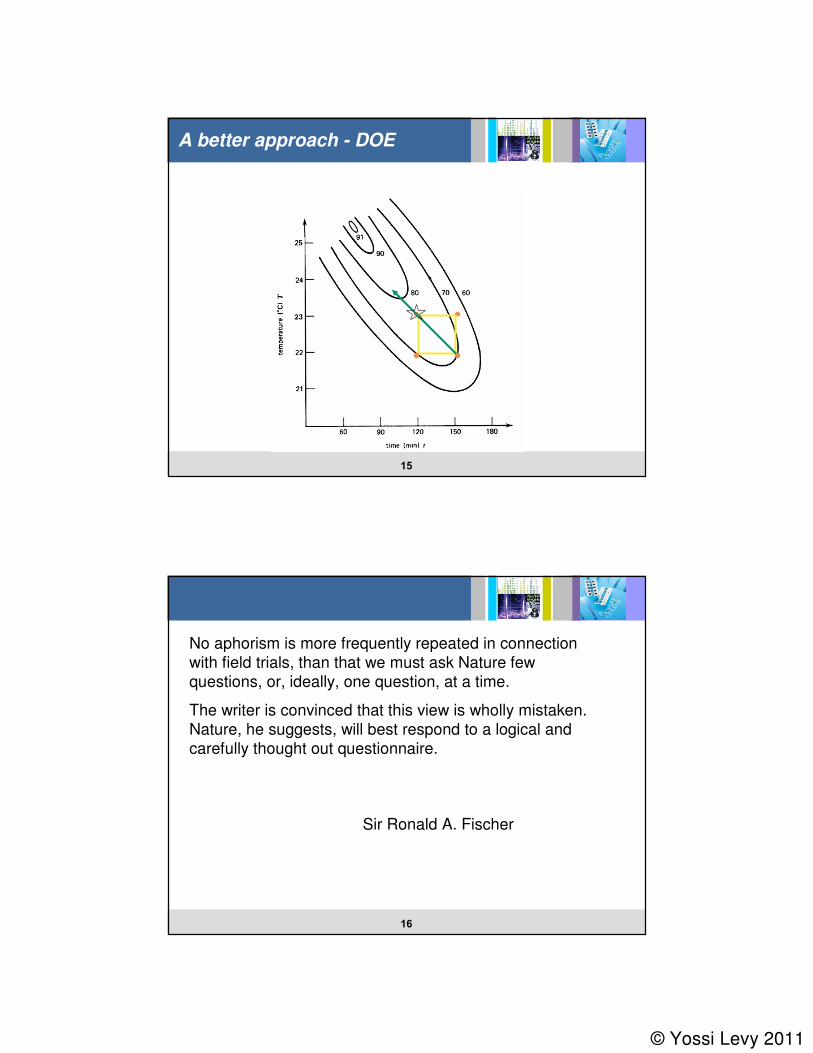
A better approach - DOE
16
No aphorism is more frequently repeated in connection with field trials, than that we must ask Nature few questions, or, ideally, one question, at a time.
The writer is convinced that this view is wholly mistaken.
Nature, he suggests, will best respond to a logical and carefully thought out questionnaire.
Sir Ronald A. Fischer

© Yossi Levy 2011
17
Strategy for Factorial Experiments
18
DOE terminology
Time
Tem
p
22
23
Main effects
Levels of Temp
120 150
Levels of Time

© Yossi Levy 2011
19
Adding another main effect
Time
Tem
p
22
23
120 150Time
Tem
p
22
23
120 150
pH=6.5 pH=7.5
20
Three-way full design (23)
Time
Tem
p
22
23
120 150
pH
6.5
7.5

© Yossi Levy 2011
21
The data
22
The data
7.5
6.5
23
22
150120
pH
Temp
Time
55
6060
67
65
7070
77
Cube Plot (data means) for Yield

© Yossi Levy 2011
23
Main effect - Time
24
Main Effect - Temp
© Yossi Levy 2011
25
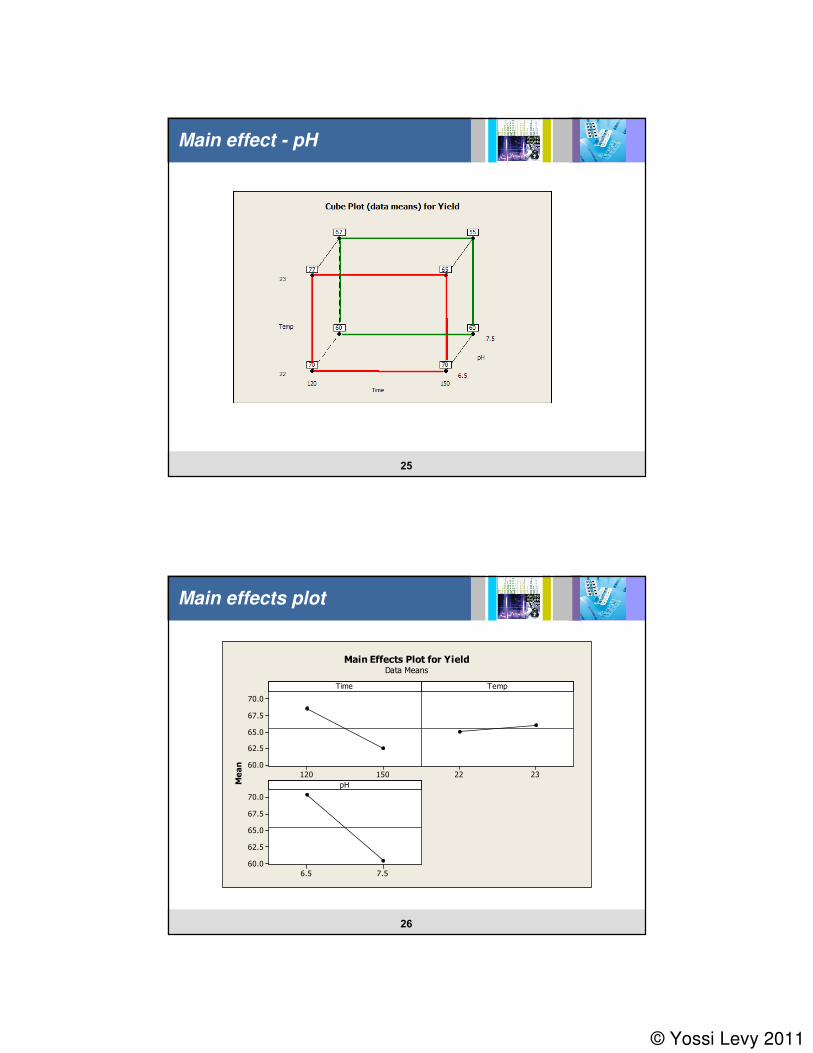
Main effect - pH
26
Main effects plot
150120
70.0
67.5
65.0
62.5
60.0
2322
7.56.5
70.0
67.5
65.0
62.5
60.0
Time
Mean
Temp
pH
Main Effects Plot for YieldData Means

© Yossi Levy 2011
27
Analysis
� Regression model:
ujkkji pHTempTimeYield εββββ +⋅+⋅+⋅+= 3210ijk
28
Time and pH interaction

© Yossi Levy 2011
29
Time and Temp interaction
30
Temp and pH interaction
© Yossi Levy 2011
31
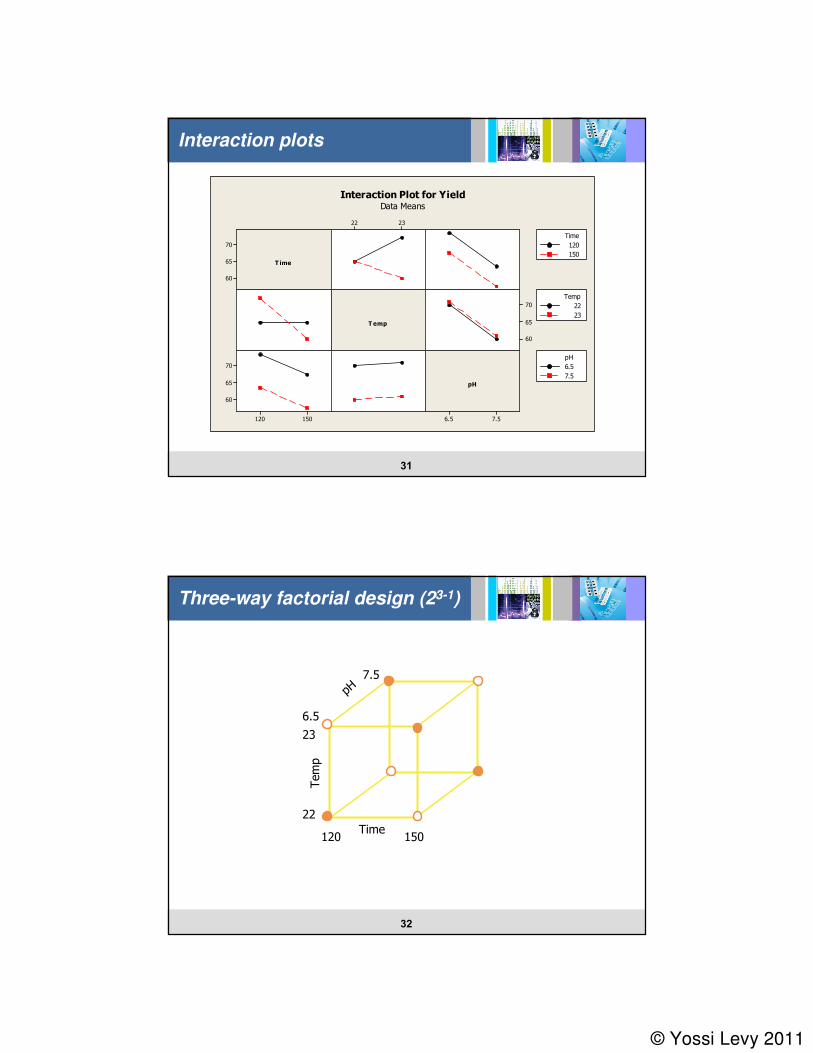
Interaction plots
70
65
60
7.56.5
2322
70
65
60
150120
70
65
60
T ime
T emp
pH
120
150
Time
22
23
Temp
6.5
7.5
pH
Interaction Plot for YieldData Means
32
Three-way factorial design (23-1)
120 150Time
Tem
p
22
23
pH
6.5
7.5

© Yossi Levy 2011
33
Development of cell culture
� Experiment done in a bioreactor
� Only one experiment can be set up in a day
� Response: cell density
� Factors:
� Solution pH: low=3.25 high=4.75
� Add carbohydrates: low=0, high=20 g/L
� Bioreactor type – two types
� Reaction time: low=4 hours, high=8 hours
� Solution temperature: low=30oC, high=50oC
A total of 25=32 factor combinations
34
The data
36504B203.2511237
8304A203.2511223
28.25504A204.7511214
28.5304B204.7511208
33308A03.2511199
106508B03.25111713
36.5308A204.75111612
85508A04.75111410
84.5406B104101320
126.5308B04.75111214
45508A203.25111111
45308B203.25111015
45406A10410917
99406B10410818
126.5508B204.7511716
84504B04.751166
33.5304B03.251155
37.5406A10410319
28504A03.251121
35304A04.751112
DensityTempTimeTypeCarbopHBlocksCenterPtRunOrderStdOrder

© Yossi Levy 2011
35
Look at cell density distribution
150100500-50
100
80
60
40
20
0
Density
Percent
Mean 57.54
StDev 35.73
N 20
Empirical CDF of DensityNormal
200150100500-50
99
95
90
80
70
60
50
40
30
20
10
5
1
Density
Percent
Mean 57.54
StDev 35.73
N 20
AD 1.348
P-Value <0.005
Probability Plot of DensityNormal - 95% CI
120967248240-24
6
5
4
3
2
1
0
Density
Frequency
Mean 57.54
StDev 35.73
N 20
Histogram of DensityNormal
140
120
100
80
60
40
20
0
Density
Boxplot of Density
36
Main effects
4.754.003.25
100
80
60
40
20100 BA
864
100
80
60
40
504030
pH
Mean
C arbo Ty pe
Time Temp
Corner
Center
Point Type
Main Effects Plot for DensityData Means

© Yossi Levy 2011
37
Interactions
20100 BA 864 504030
90
60
30
90
60
30
90
60
30
90
60
30
pH
Carbo
Type
Time
Temp
3.25 Corner
4.00 Center
4.75 Corner
pH Point Type
0 Corner
10 Center
20 Corner
Carbo Point Type
A Corner
A Center
B Corner
B Center
Type Point Type
4 Corner
6 Center
8 Corner
Time Point Type
Interaction Plot for DensityData Means
38
Factorial Fit for base model
© Yossi Levy 2011
39
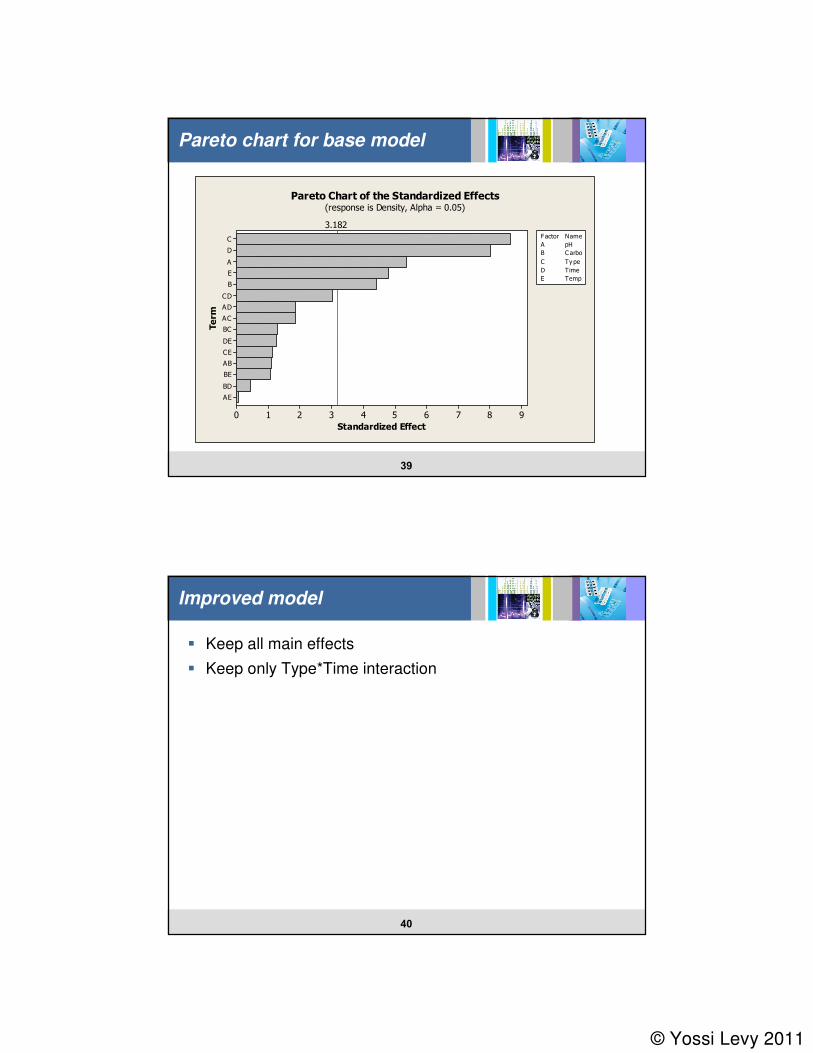
Pareto chart for base model
AE
BD
BE
AB
CE
DE
BC
AC
AD
CD
B
E
A
D
C
9876543210
Term
Standardized Effect
3.182
A pH
B Carbo
C Ty pe
D Time
E Temp
Factor Name
Pareto Chart of the Standardized Effects(response is Density, Alpha = 0.05)
40
Improved model
� Keep all main effects
� Keep only Type*Time interaction

© Yossi Levy 2011
41
Factorial Fit for new model
42
Pareto chart for new model
CD
B
E
A
D
C
876543210
Term
Standardized Effect
2.179
A pH
B Carbo
C Ty pe
D Time
E Temp
Factor Name
Pareto Chart of the Standardized Effects(response is Density, Alpha = 0.05)
© Yossi Levy 2011
43
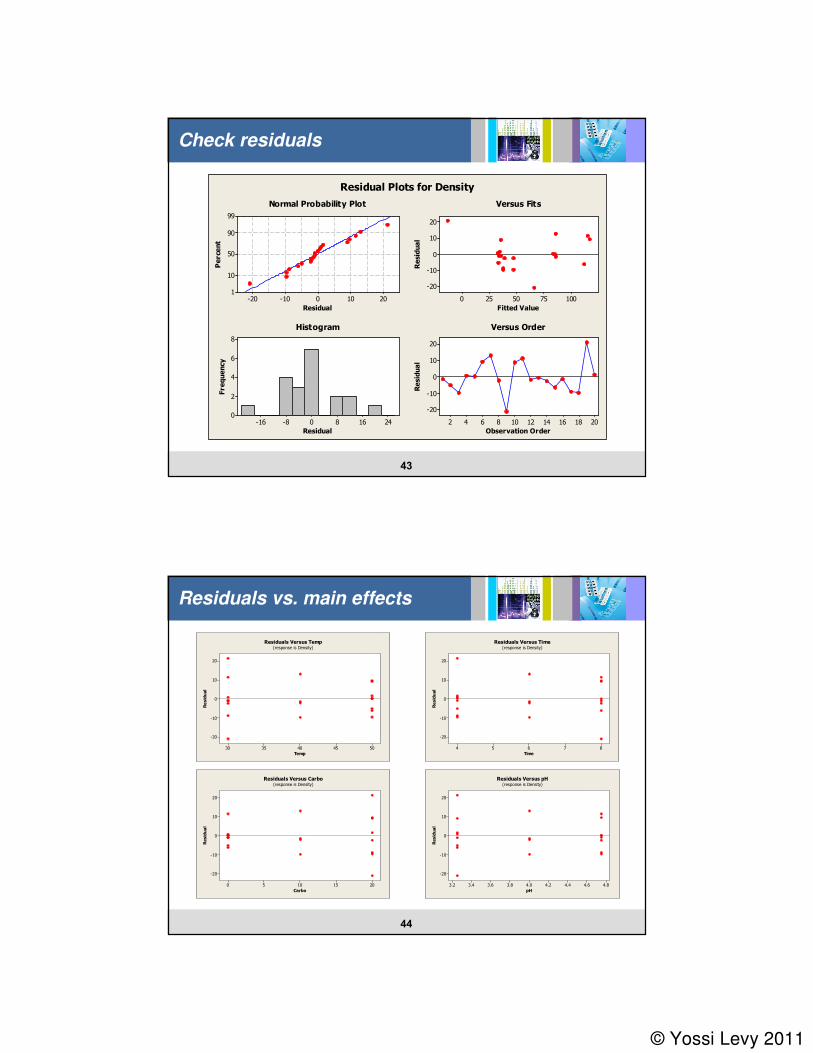
Check residuals
20100-10-20
99
90
50
10
1
Residual
Percent
1007550250
20
10
0
-10
-20
Fitted Value
Residual
241680-8-16
8
6
4
2
0
Residual
Frequency
2018161412108642
20
10
0
-10
-20
Observation Order
Residual
Normal Probability Plot Versus Fits
Histogram Versus Order
Residual Plots for Density
44
Residuals vs. main effects
5045403530
20
10
0
-10
-20
Temp
Residual
Residuals Versus Temp(response is Density)
87654
20
10
0
-10
-20
Time
Residual
Residuals Versus Time(response is Density)
20151050
20
10
0
-10
-20
Carbo
Residual
Residuals Versus Carbo(response is Density)
4.84.64.44.24.03.83.63.43.2
20
10
0
-10
-20
pH
Residual
Residuals Versus pH(response is Density)
© Yossi Levy 2011
45
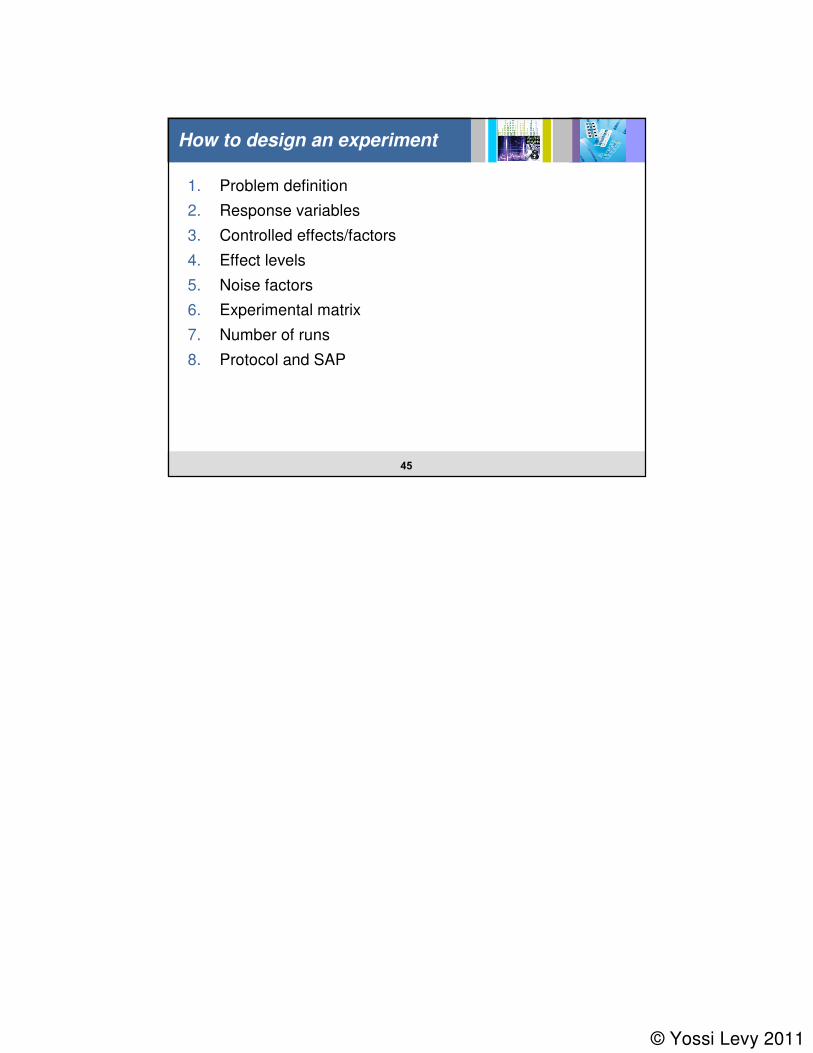
How to design an experiment
1. Problem definition
2. Response variables
3. Controlled effects/factors
4. Effect levels
5. Noise factors
6. Experimental matrix
7. Number of runs
8. Protocol and SAP