Dodson and Sluss Racial Profiling NC
18
Law Enforcement Executive Forum • 2010 • 10(3) 55 Police Practices of the North Carolina Highway Patrol: Do Police Target Minorities? Kimberly D. Dodson, PhD, School of Law Enforcement and Justice Administration, Western Illinois University, Moline, Illinois Randal Sluss, MA, Department of Criminal Justice and Criminology, East Tennessee State University, Johnson City, Tennessee Introduction According to the 2001 Gallup Poll, 55% of whites and 83% of blacks believe racial profiling in the United States is widespread (as cited in the American Civil Liberties Union [ACLU], 2009). Some estimates indicate that nearly 32 million people have been the target of racial profiling (Amnesty International USA, 2006). Racial profiling is the inclusion of race as a primary determinant in the characterization of a person considered likely to commit a particular type of crime. Currently, 33 states have no or only partial bans on racial profiling (see Appendix A, Figure 1). Racial profiling may take many forms. For example, minorities report that they have been the victims of racial profiling while walking, shopping, and driving (see Fifield, 2001; Gelman, Fagan, & Kiss, 2005; Lundman & Kaufman, 2003). Although there has been a significant amount of discussion about racial profiling in the last two decades, its extent and distribution remain uncertain. The purpose of this study is to investigate the police practices in North Carolina to deepen our understanding of its existence and form in a southern state. The goal is to ascertain if the practice of racial profiling is in fact occurring, and what police practices are most vulnerable to abuse toward this end. Literature Review The majority of studies on racial profiling have investigated a phenomenon known as “Driving While Black or Brown” (DWB). In other words, most researchers have examined whether race or ethnicity plays a role in police officers’ decisions to stop motorists. To date, the research has focused on two primary questions: Do police officers disproportionately stop and detain blacks and other minorities and do police officers consider the race of the individual in making decisions to formally process them through the criminal justice system? Lundman and Kaufman (2003) conducted a study to determine if African Americans and other minorities were more likely to be pulled over by the police for alleged traffic violations. Critical of the majority of data collection conducted by law enforcement departments, they used driver self-report data from a nationally representative sample (N = 7,054) gathered by the National Crime Victimization Survey (NCVS). Subjects at least 16 years old were asked a series of questions about whether they had been victimized by crime and had come into contact with police during the previous 12 months. Only respondents who reported at least one traffic stop in which they were the driver (7,034 observations) were chosen for the study. Lundman and Kaufman were trying to discover what types of socioeconomic variables were used
-
Upload
kimberly-dodson -
Category
Documents
-
view
18 -
download
1
description
A study of racial profiling by the North Carolina Highway Patrol using national stop data.
Transcript of Dodson and Sluss Racial Profiling NC

Law Enforcement Executive Forum • 2010 • 10(3) 55
Police Practices of the North Carolina Highway Patrol: Do Police Target Minorities?Kimberly D. Dodson, PhD, School of Law Enforcement and Justice
Administration, Western Illinois University, Moline, IllinoisRandal Sluss, MA, Department of Criminal Justice and Criminology,
East Tennessee State University, Johnson City, Tennessee
Introduction
According to the 2001 Gallup Poll, 55% of whites and 83% of blacks believe racial profiling in the United States is widespread (as cited in the American Civil Liberties Union [ACLU], 2009). Some estimates indicate that nearly 32 million people have been the target of racial profiling (Amnesty International USA, 2006). Racial profiling is the inclusion of race as a primary determinant in the characterization of a person considered likely to commit a particular type of crime. Currently, 33 states have no or only partial bans on racial profiling (see Appendix A, Figure 1).
Racial profiling may take many forms. For example, minorities report that they have been the victims of racial profiling while walking, shopping, and driving (see Fifield, 2001; Gelman, Fagan, & Kiss, 2005; Lundman & Kaufman, 2003). Although there has been a significant amount of discussion about racial profiling in the last two decades, its extent and distribution remain uncertain. The purpose of this study is to investigate the police practices in North Carolina to deepen our understanding of its existence and form in a southern state. The goal is to ascertain if the practice of racial profiling is in fact occurring, and what police practices are most vulnerable to abuse toward this end.
Literature Review
The majority of studies on racial profiling have investigated a phenomenon known as “Driving While Black or Brown” (DWB). In other words, most researchers have examined whether race or ethnicity plays a role in police officers’ decisions to stop motorists. To date, the research has focused on two primary questions: Do police officers disproportionately stop and detain blacks and other minorities and do police officers consider the race of the individual in making decisions to formally process them through the criminal justice system?
Lundman and Kaufman (2003) conducted a study to determine if African Americans and other minorities were more likely to be pulled over by the police for alleged traffic violations. Critical of the majority of data collection conducted by law enforcement departments, they used driver self-report data from a nationally representative sample (N = 7,054) gathered by the National Crime Victimization Survey (NCVS). Subjects at least 16 years old were asked a series of questions about whether they had been victimized by crime and had come into contact with police during the previous 12 months. Only respondents who reported at least one traffic stop in which they were the driver (7,034 observations) were chosen for the study. Lundman and Kaufman were trying to discover what types of socioeconomic variables were used
56 Law Enforcement Executive Forum • 2010 • 10(3)
by police as pretextual reasons for the stop. The variables they were most interested in were age of respondent, gender, race, social class, and jurisdiction population. The respondent’s “perception of the legitimacy of the stop” and “whether the police acted properly” were included to demonstrate the driver’s viewpoint. In all models, Lundman and Kaufman found that men generally, and African American men in particular, were more likely to be stopped than either whites or women. African Americans and Hispanics were more likely to feel the traffic stop was unwarranted; giving the impression there is an erosion of citizen confidence in law enforcement among minorities. The findings suggest that police may be making traffic stops for DWB. Additionally, African-American and Hispanic drivers are more likely to report that police used some type of pretext for the stop and were more likely to report that police acted inappropriately during the stop.
Weitzer and Tuch (2002) conducted a national level study on citizens’ opinions of racial profiling by police officers. The researchers concluded that African Americans disapprove of racial profiling, believe that the practice is widespread, feel they are treated less fairly by the police, and have a lower opinion of police officers. Also, social class affects the views of the acceptance and prevalence of racial profiling among the black community. However, their findings showed that “the effects of perceived personal experience on attitudes toward the police were not more pronounced for blacks than for whites, an indication of the power of this kind of unpleasant personal experience whatever one’s race” (p. 449). They found with all races and ethnic minorities, unpleasant personal contact with the police tend to lessen their opinion of police officers. Surveys demonstrate that African Americans are more likely than whites to believe that the police treat minorities different from whites. Even those who believe that minorities are treated differently may explain or justify this disparity by invoking the notion of “rational discrimination” (MacDonald, 2003, p. 119).
Similar studies have found that African-American drivers are subjected to more traffic stops in certain parts of the country. For instance, Lamberth, Clayton, Lamberth, Farrell, and McDevitt (2005) conducted a study on the New Jersey Turnpike on randomly selected days during 1988 and 1991 and discovered that African-American motorists made up 35% of all traffic stops and 73% of all arrests, even though they represented only an estimated 13% of drivers. Police officers not only excessively stopped African-American drivers, but they also targeted this racial group to conduct searches. Also, a study conducted in Ohio found evidence that African Americans were twice as likely as whites to be given tickets in the cities of Akron, Dayton, and Toledo between 1967 and 1997 (cited in Harris, 1999).
Novak (2004) also examined whether the race of the driver played a role in police officers’ decisions to make a traffic stop and whether race affected police officers’ decisions to give the alleged traffic violator a warning or issue a ticket or arrest. A data collection instrument was created to gather information on all traffic stops conducted by the Overland Park Police Department (OPPD), Kansas, from July 1 to November 30, 2000. The data collection instrument was created by a diverse number of government and citizen representatives, including high-ranking officials in the OPPD, a chief of police from a neighboring city, representatives from both the ACLU and the National Association for the Advancement of Color People (NAACP), and local criminal justice academicians. Police officers were required to report information associated with all traffic stops to the dispatcher, which was recorded by the dispatcher. Demographic information (e.g., age, race, gender) as well

Law Enforcement Executive Forum • 2010 • 10(3) 57
as the disposition of all stops were recorded. The sample (N = 10,473) consisted of drivers stopped in Overland Park, of which 12% or 1,271 were minorities. The results indicated minorities were more likely to be stopped by police. In addition, minorities were significantly less likely to receive formal sanctions than majorities. Although at first glance these findings may appear to be a more favorable outcome for minorities in comparison to majorities, in reality, the data suggest officers are using alleged traffic violations for pretextual stops.
Ikner, Ahmad, and del Carmen (2005) conducted a study to determine whether police officers used vehicle symbols and cues to determine the race or ethnicity of drivers. A sample (N = 120) of full-time officers from the Arlington Police Department, Texas, were included in the study. Officers were shown a videotape of ten vehicles being operated on the roads of Arlington. The videotaped vehicles were accompanied by brief driving scenarios that were professionally edited. In seven of the scenarios, the drivers were perceived by the officers to be white. However, drivers of three other vehicles were perceived to be a minority at a higher rate than expected given their presence in the population. Ikner et al. concluded this behavior may be another example of discriminatory behavior among police officers that is more subtle.
Knowles, Persico, and Todd (2001) downplayed and attempted to compensate for previous comparisons “that the proportion of African Americans among the drivers searched by police far exceeds the proportion in the general population of drivers” (p. 204). In their model, drivers differ in their characteristics, including race and other factors not readily observable by officers but which may or may not be available to researchers. A mathematical model is used to separate the fundamental reasons for racial profiling by making a distinction between “statistical discrimination” and ordinary racial prejudice. Statistical profiling happens whenever police officers rely on race as one factor among others to increase successful search rates. Ordinary racial profiling is when police officers target minorities based solely on race.
In Knowles et al.’s (2001) study, they allowed drivers of different races to have different distributions of characteristics as long as those characteristics are observable by the police. Motorists with different characteristics may have different costs and benefits from carrying an illegal substance, but these differences imply that the police officer will stop and search drivers with different characteristics at different rates. The data used in the study consisted of 1,590 vehicle searches conducted on Interstate Highway 95 in Maryland from January 1995 to January 1999. Variables in the study included the motorist’s sex, race, make and model of vehicle, time, date, and year of stop, probable cause, consent search, and whether anything was found. The dependent variable used in the study was the search itself, not the stop. The authors discovered that African-American motorists were searched more often than white drivers, but the probability of finding an illegal substance varying by race was not statistically significant, implying that racial profiling was occurring. However, they also found that the inequality in the “search” dependent variable was due to “statistical discrimination,” not racial profiling.
Research conducted by Engel and Calnon (2004) examined whether minorities were more likely to receive some type of formal sanction, such as traffic citations or arrests, and whether they were more likely to be subjected to searches and use of force by the police. They used driver self-report data from a nationally representative sample (N = 7,054) gathered by the NCVS. Engel and Calnon

58 Law Enforcement Executive Forum • 2010 • 10(3)
found that the likelihood of citations, searches, arrests, and use of force increased significantly if the motorists were males from a minority group, especially if they were African American or Hispanic. However, they found that minority drivers were not more likely to be in possession of contraband than white drivers.
Similarly, Zingraff, Smith, and Tomaskovic-Devey (2000) analyzed 1998 traffic stop data from the North Carolina Highway Patrol using the race distribution of licensed drivers at risk of being stopped. Using citations, written warnings, and searches, the study found some significant findings concerning racial profiling. Of the licensed motorists in North Carolina in 1998, 74.0% were white, 19.6% were black, and 6.4% were other. The total percentage of citations or written warnings for whites was 71.1% compared to 22.8% for African Americans, indicating that whites were underrepresented by 2.9%, while African-American drivers were over-represented by 3.2%. Additionally, blacks were significantly more likely than whites to be searched even though they were slightly less likely to be in possession of contraband (i.e., weapons, drugs, etc.).
The research reviewed overwhelmingly indicates that blacks and other minorities are disproportionately stopped by the police. In addition, the research suggests that blacks and other minorities are more likely to be subjected to searches of their vehicles, issued citations, and to experience use of force by police. The purpose of this study is to determine if racial profiling is occurring and whether and what police practices might lend themselves to racial profiling.
Methodology
Sample
This study will examine the racial distribution of citations produced in a six-month period between January 1, 2000, and July 31, 2000, by the North Carolina Highway Patrol in an attempt to better understand what factors may be related to that distribution. The data used in this study include information obtained from the North Carolina State Highway Patrol citation database and data from the North Carolina Division of Motor Vehicles. The dataset was downloaded from the Inter-University Consortium for Political and Social Research (ICPSR Study No. 4078).
The North Carolina Highway Patrol provided data on all vehicular stops, citations, and written warnings its patrol officers issued in 2000. Information in the data included the purpose for the stop, race, sex, age of the driver, and the make and model of vehicle. The gathering of this information was the result of the North Carolina State Legislature mandating that the highway patrol department collect data on the racial distribution of all vehicular stops.
This agency may provide important insight into police practices occurring at the state level. To be sure, the North Carolina State Highway Patrol differs from local police agencies in terms of professionalism; it is a state-level agency that is highly bureaucratic in structure and operation. State agencies are usually described as having broader recruitment, higher standards of education requirements, and longer inservice training than most police agencies (North Carolina Department of Crime Control and Public Safety, 2006). According to the professional model of policing, these standards should help to reduce racial disparity in traffic stops.
Law Enforcement Executive Forum • 2010 • 10(3) 59
The North Carolina Highway Patrol mainly deals with traffic enforcement and accident investigation, rarely engaging in crime control. Therefore, racial disparity should be modest compared to agencies that primarily engage in crime control. To determine whether there is racial disparity in traffic stops in a particular area, the racial distribution of the general population is used for comparison. The sample includes Part 1 of the dataset consisting of North Carolina motorists stopped by the police between January 1, 2000, and July 31, 2000 (N = 332,861). Variables in Part I include stop date; time; purpose; county; interstate number or road name; state of vehicle registration; year, make, and model of vehicle; driver race, age, and gender; and the action of the officer. Because law enforcement officers self-report, there is always a possibility they may misreport to avoid implicating themselves in the practice of DWB.
Sample Characteristics
There were 332,861 traffic stops in North Carolina between January 1, 2000, and July 31, 2000. The sample was 70% white, 23% black, and 7% percent other.
Census
To determine whether there is racial disparity in traffic stops in a particular area, the racial distribution of the general population was acquired from U.S. Census Bureau data for 2000. In this year, the total population of North Carolina was 8,049,313, with a white population of 5,804,656 (72.1%), a black population of 1,737,545 (21.6%), and other races having a combined total population of 507,112 (6.3%).
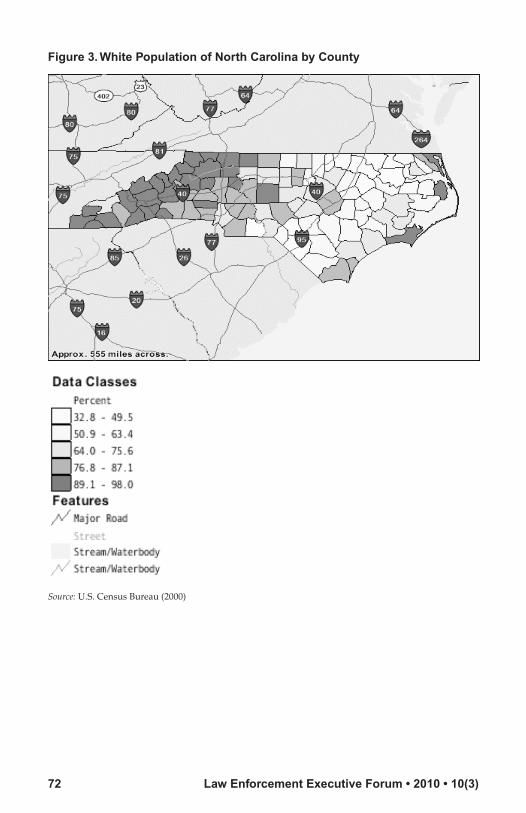
In Appendix B, Figure 2 indicates a larger black population in eastern North Carolina, and Figure 3 indicates a larger white population in western North Carolina. According to U.S. Census Bureau (2000) data, six counties in North Carolina contain 32% of the state’s population: Cumberland, Durham, Forsyth, Guilford, Mecklenburg, and Wake. These counties have a higher than average black population and are all sites of interstate roadways in North Carolina.
Dependent Variable
Traffic Stop Outcome
The dependent variable for the analysis is the “outcome of the traffic stop.” This includes warning citations, traffic citations, and verbal warnings issued to drivers in the State of North Carolina in the year 2000. Citation categories include speeding violations, nonspeeding moving violations, investigatory stops, seatbelt violations, equipment violations, and regulatory violations.
Purpose of the Stop
The variable “purpose of the stop” included driving under the influence (DUI), investigation (INV), other moving violation (OMV), safe movement violation (SAFE), speeding (SPD), seatbelt violation (STBLT), stoplight or sign violation (STPLT), vehicle equipment violation (VEHQP), and vehicle regulatory violation (VEHRG). This variable was recoded into two categories: (1) [DUI, INV] and (2) [OTHER]. This variable was recoded in this fashion to better understand pretext stops by the police.

60 Law Enforcement Executive Forum • 2010 • 10(3)
Because of negative racial stereotypes, police officers may be more likely to believe that black and other minority motorists are more likely to be under the influence of alcohol or drugs or to be in possession of alcohol or drugs. As a result, blacks and other minorities may be subjected to more traffic stops than whites.
Independent Variables
Race
The measure of racial composition of motorists at risk for traffic stops is included in the analysis in order to better understand the ratio of citations given to black and other minority drivers compared to white drivers. The race variable was coded as 0 = White, 1 = Black, and 3 = Other.
Geographic Region
For the present study, North Carolina was divided into two regions, East and West, by counties—50 counties in the Western half and 50 counties in the Eastern half. This was done to explore the proportions of traffic stops in these two regions. The state consists of a larger population of whites in the Western region, and a larger population of blacks in the Eastern region. In the West, whites comprised 76.0% of the population; blacks, 15.4%; and other minorities, 8.6%. In the East, it was 60.5% white, 27.6% black, and 11.9% other. Other researchers have not examined whether geographical region is related to instances of racial profiling (see, e.g., Zingraff et al., 2000).
Analysis
Confidence Intervals
The analysis for these data consists of a two prong test: (1) confidence intervals and (2) crosstabulation. Computing confidence intervals for proportions is an important inferential method in the analysis of data. The purpose of confidence intervals is to give us a range of values for our estimated population parameter rather than a single value or a point estimate (Bachman & Paternoster, 1997). The estimated confidence interval gives us a range of values within which we believe, with varying degrees of confidence, that the true population value falls. A confidence interval is determined using sample data and a chosen level of confidence. The most commonly used confidence levels are 95% and 99%, just as common levels of significance are 0.05 and 0.01.
This procedure gives an estimated range of values that is likely to include the statistic of interest and is calculated from a particular set of data. A confidence interval has an upper and lower limit with the difference between these limits referred to as the width of a confidence interval. When using confidence intervals, the researcher usually wants a high confidence and a narrow width. If the confidence interval is overly wide, the conclusions drawn from the data are not as noteworthy. Because confidence intervals provide a range of plausible values for the population, they may be more informative than other types of significance testing.
For the current analysis, confidence intervals are computed around point estimates that are subsequently compared to census data, which includes information on the

Law Enforcement Executive Forum • 2010 • 10(3) 61
racial composition of the population of North Carolina. We would expect the census data to fall within the obtained confidence interval if racial profiling is not occurring.
Crosstabulation
For this study, multilayer crosstabulation is used to analyze the data. Multilayered crosstabulation allows for a more detailed analysis of the data by controlling for a third variable.
The Chi-Square test of statistical significance is used to determine the likelihood that the variables are unrelated at the population level (Bohrnstedt & Knoke, 1994)—that is, it tests the null hypothesis of no relation. The alternative hypothesis is that the variables are related in the population. The Chi-Square test compares the observed cell frequency with the expected cell frequency. For this study, Cramer’s V is an appropriate measure of association for nominal data that are arranged in larger than 2 × 2 tables. Cramer’s V is a measure of association of the strength of relationship between two variables. It ranges in value from zero to one, where zero indicates the complete absence of a relationship and one indicates a perfect relationship.
Findings
The U.S. Census Bureau (2000) data for North Carolina is used for comparison to see whether race is related to the outcome of the stop after controlling for region. The findings for the Eastern region of North Carolina are presented first followed by the presentation of the findings for the Western region.
For the Eastern region, 60.5% of the total population is white, while 27.6% is black and 11.8% is other minority. Using a 99% confidence interval, the proportion of whites who should be receiving citations ranges from 65.2 to 68.2% after controlling for purpose of the stop and region (East), while the proportion of whites is 60.5% according to the census. Blacks represent 27.6% of the population, but the proportion of blacks receiving citations ranges from 16.8 to 19.2%. These findings indicate that blacks are receiving fewer citations than would be expected. However, after looking at the “other” minority category, the pattern of racial profiling reemerges. That is, the proportion of other minorities receiving citations ranges from 14.1 to 16.5%, but other minorities only make up approximately 11.8% of the population in the East.
The findings on the proportion of whites and blacks receiving warnings differ from those reported for the proportion of whites and blacks receiving citations. The proportion of whites who should be receiving warnings ranges from 75.3 to 77.9%, which is much higher than the proportion of whites (60.5%) reported in the census. In comparison, whites are being issued fewer citations and more warnings. The proportion of blacks receiving a warning ranges from 17.0 to 19.4%, which is much lower than the proportion of blacks (27.6%) reported in the census. After examining the proportion of citations and warnings issued to black motorists, it appears that blacks are receiving fewer citations and warnings than would be expected. The proportion of other minorities receiving warnings ranges from 5.0 to 7.4%, which is much lower than the proportion of other minorities (11.9%) reported by the census.
Table 1 shows the percentage of motorists who received citations or warnings within and across race for the Eastern region. Out of the total number of white

62 Law Enforcement Executive Forum • 2010 • 10(3)
motorists, 64.5% were issued citations. Of all the black motorists stopped, 68.6% received citations. Black motorists were slightly more likely than white motorists to receive citations. Out of the total number of other minority motorists stopped, 83.8% received citations. This latter finding indicates that other minority motorists were more likely to receive citations than black and white motorists. Out of the total number of white motorists stopped, 35.5% received warnings, while 31.4% of black motorists received warnings. Out of the total number of other minority motorists, 16.2% received warnings. White motorists were more likely to receive warnings than black or other minority motorists.
The Chi-Square of 120.6 falls in the critical region; therefore, we reject the null hypothesis and conclude that there likely exists a relationship between race and outcome of stop while controlling for purpose of the stop and region. It should be noted that Chi-Square is adversely affected by sample size. That is, in large samples the c2 is likely to be inflated. This means that we are more likely to reject the null hypothesis when it is true. Therefore, we should inspect the Cramer’s V for substantive significance. Cramer’s V is 0.134, which indicates a moderate association between race and outcome of the stop while controlling for type of stop and region (East).
Table 1. Layered Crosstabulation Race by Outcome of the Stop Controlling for Type of Stop and Region (East)
Race
Eastern Stop Outcomes White Black Other Total
Citation count 3,015 816 692 4,523% within stop outcome 66.7% 18.0% 15.3% 100.0%% within race 64.5% 68.6% 83.8% 67.6%Warning count 1,662 374 134 2,170% within stop outcome 76.6% 17.2% 6.2% 100.0%% within race 35.5% 31.4% 16.2% 32.4%Total count 4,677 1,190 826 6,693% within stop outcome 69.9% 17.8% 12.3% 100.0%% within race 100.0% 100.0% 100.0% 100.0%
Chi-Square = 120.6; p < 0.001; Cramer’s V = 0.134
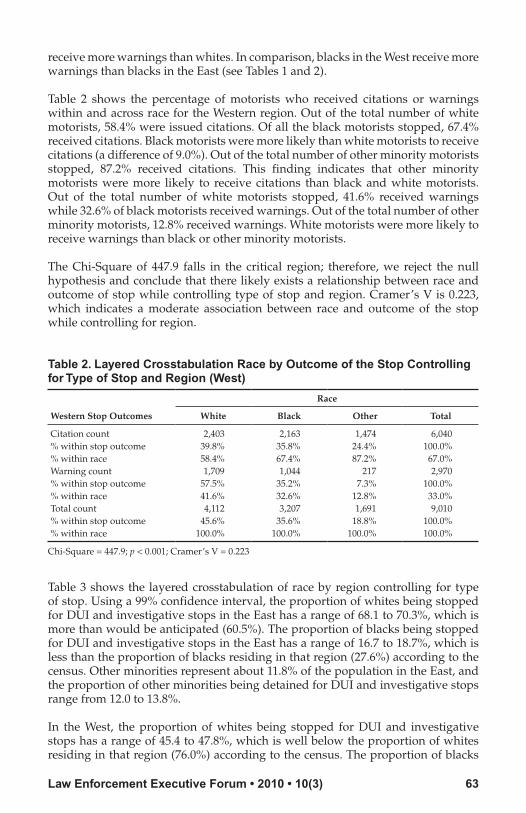
Table 2 shows the results of the layered crosstabulation of race by outcome of the stop controlling for type of stop and region (West). The findings reported in Table 2 are dramatically different from those reported in Table 1. Using a 99% confidence interval, the proportion of whites receiving citations range from 38.5 to 41.1%, which is much lower than the proportion of whites (76.0%) reported in the census. The proportion of blacks receiving citations range from 34.5 to 37.1%, which is much higher than the proportion of blacks (15.4%) reported in the census. The results suggest that blacks disproportionately receive more citations than whites. In comparison, blacks in the West receive more citations than blacks in the East (see Tables 1 and 2).
Findings also indicate that the proportion of whites who should be receiving warnings ranges from 56.2 to 58.8%, which is much lower than the proportion of whites (76.0%) reported in the census. The proportion of blacks who should be receiving warnings ranges from 33.9 to 36.5%, which is much higher than the proportion of blacks (15.4%) reported in the census. Thus, blacks disproportionately
Law Enforcement Executive Forum • 2010 • 10(3) 63
receive more warnings than whites. In comparison, blacks in the West receive more warnings than blacks in the East (see Tables 1 and 2).
Table 2 shows the percentage of motorists who received citations or warnings within and across race for the Western region. Out of the total number of white motorists, 58.4% were issued citations. Of all the black motorists stopped, 67.4% received citations. Black motorists were more likely than white motorists to receive citations (a difference of 9.0%). Out of the total number of other minority motorists stopped, 87.2% received citations. This finding indicates that other minority motorists were more likely to receive citations than black and white motorists. Out of the total number of white motorists stopped, 41.6% received warnings while 32.6% of black motorists received warnings. Out of the total number of other minority motorists, 12.8% received warnings. White motorists were more likely to receive warnings than black or other minority motorists.
The Chi-Square of 447.9 falls in the critical region; therefore, we reject the null hypothesis and conclude that there likely exists a relationship between race and outcome of stop while controlling type of stop and region. Cramer’s V is 0.223, which indicates a moderate association between race and outcome of the stop while controlling for region.
Table 2. Layered Crosstabulation Race by Outcome of the Stop Controlling for Type of Stop and Region (West)
Race
Western Stop Outcomes White Black Other Total
Citation count 2,403 2,163 1,474 6,040% within stop outcome 39.8% 35.8% 24.4% 100.0%% within race 58.4% 67.4% 87.2% 67.0%Warning count 1,709 1,044 217 2,970% within stop outcome 57.5% 35.2% 7.3% 100.0%% within race 41.6% 32.6% 12.8% 33.0%Total count 4,112 3,207 1,691 9,010% within stop outcome 45.6% 35.6% 18.8% 100.0%% within race 100.0% 100.0% 100.0% 100.0%
Chi-Square = 447.9; p < 0.001; Cramer’s V = 0.223
Table 3 shows the layered crosstabulation of race by region controlling for type of stop. Using a 99% confidence interval, the proportion of whites being stopped for DUI and investigative stops in the East has a range of 68.1 to 70.3%, which is more than would be anticipated (60.5%). The proportion of blacks being stopped for DUI and investigative stops in the East has a range of 16.7 to 18.7%, which is less than the proportion of blacks residing in that region (27.6%) according to the census. Other minorities represent about 11.8% of the population in the East, and the proportion of other minorities being detained for DUI and investigative stops range from 12.0 to 13.8%.
In the West, the proportion of whites being stopped for DUI and investigative stops has a range of 45.4 to 47.8%, which is well below the proportion of whites residing in that region (76.0%) according to the census. The proportion of blacks

64 Law Enforcement Executive Forum • 2010 • 10(3)
being stopped for DUI and investigative stops has a range of 33.8 to 36.0%, which is well above the proportion of blacks residing in that region (15.4%) according to the U.S. Census Bureau. Likewise, the proportion of other minorities in the West being stopped for DUI and investigative stops has a range of 17.6 to 19.4%, which constitutes about 8.6% of the population. These findings suggest that racial profiling is occurring, particularly in the West.
Table 3 shows the percentage of motorists stopped for DUI and investigative stops in the Eastern and Western regions. Of the total number of white motorists stopped in North Carolina, 53.1% were stopped for DUI and investigative stops in the East, and 46.9% were stopped for these types of stops in the West. Out of the total number of black motorists stopped in North Carolina, 27.8% were stopped for DUI and investigative stops in the East, while 72.2% were stopped in the West. This finding indicates that black motorists in North Carolina are much more likely to be stopped for DUI and investigative type stops in the West than in the East. Of the total number of other minority motorists stopped for DUI and investigative stops in North Carolina, 34.6% were stopped in the East while 65.4% were stopped in the West. In other words, other minority motorists were much more likely to be stopped for DUI and investigative type stops in the West than in the East.
The Chi-Square of 1,093.4 falls in the critical region. We reject the null hypothesis and conclude that there likely exists a relationship between race and outcome of stop while controlling for region. Cramer’s V is 0.232, which indicates a moderate association between race and DUI and investigative stops.
Table 3. Layered Crosstabulation Race by Region Controlling for Type of Stop
Race
DUI, INV White Black Other Total
Eastern count 6,076 1,552 1,129 8,757% within region 69.4% 17.7% 12.9% 100.0%% within race 53.1% 27.8% 34.6% 43.2%Western count 5,359 4,023 2,130 11,512% within region 46.6% 34.9% 18.5% 100.0%% within race 46.9% 72.2% 65.4% 56.8% Total count 11,435 5,575 3,259 20,269% within region 56.4% 27.5% 16.1% 100.0%% within race 100.0% 100.0% 100.0% 100.0%
Chi-Square = 1,093.4, p < 0.001, Cramer’s V = 0.232
Tables 4 and 5 show the layered crosstabulation of race by type of stop controlling for region (Eastern and Western, respectively) for individuals driving luxury vehicles.1 This hypothesis was not examined by Zingraff et al. (2000), who performed the original analysis of the North Carolina Highway Patrol data, but we feel it is important. This hypothesis tests whether negative stereotypes about minorities are related to racial profiling. Namely, we are interested in determining whether black and minority motorists are more likely to be stopped for DUI or investigative purposes (pretextual stops) if they are driving luxury vehicles because this negative stereotype of minority motorists is erroneously believed by many police officers to fit a “drug courier profile” (see, e.g., ACLU, 2007; Ikner et al., 2005; Lundman & Kaufman, 2003).

Law Enforcement Executive Forum • 2010 • 10(3) 65
In the Eastern region of North Carolina, 3.7% of the motorists driving luxury cars who were stopped for DUI and investigative stops were white. The percentage of black motorists driving luxury cars who were being stopped for DUI and investigative stops was 6.7%. The data indicate that black motorists are being stopped more often than white motorists for these types of stops. Other minority motorists are being stopped more frequently (5.1%) than white motorists but less frequently than black motorists. The results indicate that police are more likely to stop black and minority drivers of luxury vehicles than whites who drive luxury vehicles.
The Chi-Square (Eastern region) of 24.9 falls in the critical region. Thus, we reject the null hypothesis and conclude that there is a relationship between race and type of stop controlling for region (East). However, Cramer’s V is 0.062, which indicates little substantive significance.
Table 4. Crosstabulation of Race by Type of Stop Controlling for Eastern Region (Luxury Cars Only)
Race
Eastern Region White Black Other Total
DUI, INV count 173 108 14 295% within stop purpose 58.6% 36.6% 4.7% 100.0%% within race 3.7% 6.7% 5.1% 4.5%Other count 4,498 1,511 258 6,267% within stop purpose 71.8% 24.1% 4.1% 100.0%% within race 96.3% 93.3% 94.9% 95.5%Total count 4,671 1,619 272 6,562% within stop purpose 71.2% 24.7% 4.1% 100.0%% within race 100.0% 100.0% 100.0% 100.0%
Eastern Chi-Square = 24.9; p < 0.001; Cramer’s V = 0.062
In the Western region of North Carolina, 3.8% of the motorists driving luxury cars who were stopped for DUI and investigative stops were white (see Table 5). The percentage of black motorists driving luxury cars who were being stopped for DUI and investigative stops was 8.3%. The data indicate that black motorists are more than twice as likely as white motorists to be stopped while driving a luxury vehicle for a pretextual stop (DUI or investigative). In addition, black motorists who drive luxury vehicles in the Western region are being stopped more frequently than blacks motorists who drive luxury vehicles in the Eastern region for DUI and investigative stops. Other minority motorists are being stopped more frequently than either white motorists or black motorists. Specifically, 12.8% of DUI and investigative stops are other minority motorists. This means that other minority motorists are more than three times as likely as whites to be stopped for DUI or investigative stops while driving a luxury car.

66 Law Enforcement Executive Forum • 2010 • 10(3)
Table 5. Crosstabulation of Race by Type of Stop Controlling for Western Region (Luxury Cars Only) (Continued)
Race
Western Region White Black Other Total
DUI, INV count 138 205 38 381% within stop purpose 36.2% 53.8% 10.0% 100.0%% within race 3.8% 8.3% 12.8% 5.9%Other count 3,495 2,277 260 6,032% within stop purpose 57.9% 37.7% 4.3% 100.0%% within race 96.2% 91.7% 87.2% 94.1%Total count 3,633 2,482 298 6,413% within stop purpose 56.7% 38.7% 4.6% 100.0%% within race 100.0% 100.0% 100.0% 100.0%
Western Chi-Square = 78.4; p < 0.001; Cramer’s V = 0.111
The Chi-Square (Western region) of 78.4 falls in the critical region. Thus, we reject the null hypothesis and conclude that there is a relationship between race and type of stop controlling for region (West). Cramer’s V is 0.111, which suggests a small significant relationship between race and type of stop controlling for region (West). Looking at the findings reported in Tables 4 and 5, it appears that blacks and minorities were more likely than whites to be subjected to pretextual stops in both the East and West, but at a much higher rate in the West.
Conclusions
There are a number of noteworthy findings from this study. In examining race and outcome of the stop while controlling for type of stop and region (East), we found that race was moderately and positively related to the outcome of the stop. The proportion of whites residing in the East is approximately 60.5%, but they were issued about 66.7% of the citations, which is higher than would be expected. Whites also received a greater number of warnings as well (76.6%). Blacks in the East make up about 27.6% of the population but are receiving both citations (18.0%) and warnings (17.2%) at a lower rate than would be expected. These results indicate that black motorists were actually issued fewer citations and warnings than white motorists. These findings were unexpected. According to the U.S. Census Bureau (2000) data, more blacks live in the Eastern region than in the Western region of North Carolina. Therefore, it might be expected that more black drivers on the road might translate into more traffic stops of black drivers. We think because there are more blacks living in the East than in the West, the community as a whole may harbor fewer negative stereotypes about minorities, and this would include the police who live in the community.
We found a radically different picture of traffic stops being conducted in the Western region of the state. In the West, whites make up approximately 76% of the population but were only receiving about 39.8% of the citations and 57.5% of the warnings. This means that whites in the West were less likely than those in the East to receive citations or warnings. Conversely, blacks make up approximately 15.4% of the population in the West but were receiving about 35.8% of the citations and 35.2% of the warnings. In other words, blacks in the West were more likely than those in the East to be issued both citations and warnings. The latter finding suggests that racial profiling was occurring in the West and that black motorists

Law Enforcement Executive Forum • 2010 • 10(3) 67
were more likely than whites to be subjected to pretextual stops. The finding that blacks are more likely than whites to receive citations and warnings is consistent with the findings of other studies (Engel & Calnon, 2004; Lundman & Kaufman, 2003; Novak, 2004; Zingraff et al., 2000).
Another noteworthy finding is that other minorities in both the East and West are more likely to receive citations but less likely to receive warnings. The findings reported in the current analysis were consistent with racial profiling because the police were more likely to formally process (issue a citation) to other minorities than whites.
In examining this issue by region, and controlling for DUI and investigative (pretextual) stops, the results showed that race was moderately and positively related to region of the state. In the East, the proportion of white motorists being stopped for DUI and investigative stops was slightly higher than what was expected, while the proportion of black motorists being stopped was somewhat lower than expected. The proportion of other minority motorists being stopped for DUI and investigative stops approximated the census data. Therefore, it appears that in the East, motorists, regardless of race, were less likely to be subjected to pretextual stops by the police.
In the West, the proportion of whites being detained for DUI and investigative stops was well below that reported in the census, while the proportion of blacks being stopped for DUI and investigative stops was well above that reported in the census. Likewise, the proportion of other minorities being stopped for DUI and investigative stops was more than what was reported in the census. These findings suggest that blacks and other minorities were more likely to be subjected to pretextual stops in the West than in the East.
Taken together, the findings of this study suggest that race is likely a factor in pretextual stops. That is, generally speaking, blacks and other minorities were more likely than whites to be subjected to pretextual type stops. The results also indicate that racial profiling was occurring more in the Western region than in the Eastern region of North Carolina. The reason for this latter finding may be related to the populations living in these areas. To be more precise, because there are more blacks living in the East than in the West, police officers working in the East may be more accustomed to interacting with blacks; therefore, they are less likely to hold negative and inaccurate stereotypical views about blacks. Research suggests that police officers’ demographic characteristics as well as their own childhood socialization may play key roles in understanding why racial profiling occurs (Carter & Katz-Bannister, 2000).
Our study was primarily concerned with determining whether racial profiling was occurring in North Carolina. Future research should seek to examine why blacks and other minorities are subjected to racial profiling by the police. One suggestion might be for researchers to interview police officers and administrators in an attempt to understand why racial profiling happens and what policies might be implemented to prevent or reduce its occurrence. We know that racial profiling leads blacks and other minorities to mistrust the police and, as a result, blacks and other minorities may be less likely to call the police for assistance. Police officers should enforce the law without prejudice or bias, and all citizens should feel that the police equally enforce the law regardless of race.

68 Law Enforcement Executive Forum • 2010 • 10(3)
Endnote1 Confidence intervals were not calculated for the data presented in Tables 4 and 5.
References
American Civil Liberties Union (ACLU). (2007). Racial profiling: Old and new. American Civil Liberties Union website. Retrieved July 6, 2010, from www.aclu.org/racialjustice/racialprofiling/index.html.
Amnesty International USA. (2006). The truth about racial profiling: Seven facts. Amnesty International USA website. Retrieved July 6, 2010, from www.amnestyusa.org/racial_profiling/sevenfacts.html.
Amnesty International USA. (2009). Racial profiling laws in your state. Amnesty International USA website. Retrieved July 6, 2010, from www.amnestyusa.org/us-human-rights/otherracial-profiling---laws-in-your-state/page.do?id=1106665.
Bachman, R., & Paternoster, R. (1997). Statistical methods for criminology and criminal justice. New York: McGraw-Hill.
Bohrnstedt, G. W., & Knoke, D. (1994). Statistics for social data analysis. Itasca, IL: F. E. Peacock.
Carter, D. L., & Katz-Bannister, A. J. (2000). Racial profiling: Issues, and responses, for the Lansing, Michigan Police Department. Lansing, Michigan, Police Department website. Retrieved July 23, 2010, from www.lansingmi.gov/Lansing/police/docs/traffic_stop/policy_paper.pdf.
Engel, R. S., & Calnon, J. M. (2004). Examining the influence of driver’s characteristics during traffic stops with police: Results from a national survey. Justice Quarterly, 21(1), 49-90.
Fifield, A. (2001). Shopping while black. Good Housekeeping, 233, 128-138.
Gelman, A., Fagan, J., & Kiss, A. (2005). An analysis of the NYPD’s stop-and-frisk policy in the context of claims of racial bias. Columbia University’s Department of Statistics and Department of Political Science website. Retrieved July 6, 2010, from www.stat.columbia.edu/~gelman/research/unpublished/frisk7.pdf.
Harris, D. A. (1999). The stories, the statistics, and the law: Why driving while black matters. 84 Minnesota Law Review, 265-326.
Ikner, M. A., Ahmad, J., & del Carmen, A. (2005). Vehicle cues and racial profiling: Police officer’s perceptions of vehicles and drivers. Southwest Journal of Criminal Justice, 2, 82-100.
Knowles, J., Persico, N., & Todd, P. (2001). Racial bias in motor vehicle searches: Theory and evidence. Journal of Political Economy, 109, 203-229.

Law Enforcement Executive Forum • 2010 • 10(3) 69
Lamberth, K., Clayton, J., Lamberth, J., Farrell, A., & McDevitt, J. (2005). Practitioners guide for addressing racial profiling. Boston: Northeastern University, Institute on Race and Justice. Retrieved June 28, 2010, from www.lamberthconsulting.com/about-racial-profiling/documents/Report_PractitionersGuide.pdf.
Lundman, R. J., & Kaufman, R. L. (2003). Driving while black: Effects of race, ethnicity, and gender on citizen self-reports of traffic stops and police actions. Criminology, 41(1), 195-219.
MacDonald, R. S. (2003). Rational profiling in America’s airports. B.Y.U. Journal of Public Law, 17, 113-139.
North Carolina Department of Crime Control and Public Safety. (2006). Accreditation. Retrieved July 6, 2010, from www.nccrimecontrol.org.
Novak, K. J. (2004). Disparity and racial profiling in traffic enforcement. Police Quarterly, 7(1), 65-96.
U.S. Census Bureau. (2000). State and county quick facts. Retrieved July 6, 2010, from http://quickfacts.census.gov/qfd/states/37000.html.
Weitzer, R., & Tuch, S. (2002). Perceptions of racial profiling: Race, class, and personal experience. Criminology, 40(2), 435-457.
Zingraff, M., Smith, W., & Tomaskovic-Devey, D. (2000). North Carolina highway traffic and patrol study: “Driving while black.” The Criminologist, 25(3), 1-4.
Kimberly D. Dodson earned her PhD in Criminology from Indiana University of Pennsylvania. She is an assistant professor in the School of Law Enforcement and Justice Administration at Western Illinois University. Dr. Dodson has almost twenty years of experience working in the criminal justice field serving in a variety of capacities, including probation, corrections, and law enforcement. Her research interests include criminological theory, race and gender issues, and special populations in prison.
Randal Sluss earned his Master of Arts in Criminal Justice and Criminology from East Tennessee State University. Mr. Sluss served as a law enforcement officer for over ten years with the Washington County Sheriff’s Department in Johnson City, Tennessee. His research interests include law enforcement policy and the treatment of racial minorities.

70 Law Enforcement Executive Forum • 2010 • 10(3)
Appendix A. State-by-State Racial Profiling Laws
Figure 1. State-by-State Racial Profiling Laws
Source: Amnesty International USA (2009)

Law Enforcement Executive Forum • 2010 • 10(3) 71
Appendix B. Population of North Carolina by County
Figure 2. Black Population of North Carolina by County
Source: U.S. Census Bureau (2000)
72 Law Enforcement Executive Forum • 2010 • 10(3)
Figure 3. White Population of North Carolina by County
Source: U.S. Census Bureau (2000)


![[Dr. Peter Dodson] an Alphabet of Dinosaurs(BookZZ.org)](https://static.fdocuments.net/doc/165x107/577cb16a1a28aba7118baca5/dr-peter-dodson-an-alphabet-of-dinosaursbookzzorg.jpg)