Documentation to the NCES Common Core of Data Public ... · In the 2004–05 CCD Public...
166
U.S. Department of Education Institute of Education Sciences NCES 2006-339rev Documentation to the NCES Common Core of Data Public Elementary/ Secondary School Universe Survey: School Year 2004–05 Revised File Version 1b
Transcript of Documentation to the NCES Common Core of Data Public ... · In the 2004–05 CCD Public...

U.S. Department of Education Institute of Education Sciences NCES 2006-339rev
Documentation to the NCES Common Core of Data Public Elementary/ Secondary School Universe Survey: School Year 2004–05
Revised File Version 1b


U.S. Department of Education Institute of Education Sciences NCES 2006-339rev
Documentation to the NCES Common Core of Data Public Elementary/ Secondary School Universe Survey: School Year 2004–05
Revised File Version 1b
July 2007 Jennifer Sable American Institutes for Research Jane Moy Thomas U.S. Census Bureau John Sietsema National Center for Education Statistics
U.S. Department of Education Margaret Spellings Secretary Institute of Education Sciences Grover J. Whitehurst Director National Center for Education Statistics Mark Schneider Commissioner The National Center for Education Statistics (NCES) is the primary federal entity for collecting, analyzing, and reporting data related to education in the United States and other nations. It fulfills a congressional mandate to collect, collate, analyze, and report full and complete statistics on the condition of education in the United States; conduct and publish reports and specialized analyses of the meaning and significance of such statistics; assist state and local education agencies in improving their statistical systems; and review and report on education activities in foreign countries. NCES activities are designed to address high-priority education data needs; provide consistent, reliable, complete, and accurate indicators of education status and trends; and report timely, useful, and high-quality data to the U.S. Department of Education, the Congress, the states, other education policymakers, practitioners, data users, and the general public. Unless specifically noted, all information contained herein is in the public domain. We strive to make our products available in a variety of formats and in language that is appropriate to a variety of audiences. You, as our customer, are the best judge of our success in communicating information effectively. If you have any comments or suggestions about this or any other NCES product or report, we would like to hear from you. Please direct your comments to National Center for Education Statistics Institute of Education Sciences U.S. Department of Education 1990 K Street NW Washington, DC 20006-5651 July 2007 The NCES World Wide Web Home Page address is http://nces.ed.gov The NCES World Wide Web Electronic Catalog address is http://nces.ed.gov/pubsearch This publication is only available online. To download, view, and print the report as a PDF file, go to the NCES World Wide Web Electronic Catalog address shown above. Suggested Citation Sable, J., Thomas, J.M., and Sietsema, J. (2007). Documentation to the NCES Common Core of Data Public Elementary/Secondary School Universe Survey: School Year 2004–05 (NCES 2006-339rev). National Center for Education Statistics, Institute of Education Sciences, U.S. Department of Education. Washington, DC.
Content Contact John Sietsema (202) 502-7425 [email protected]

iii
Contents
Page
List of Tables ................................................................................................................................. iv
I. Introduction to the NCES Common Core of Data Public Elementary/Secondary School Universe Survey: School Year 2004–05, Version 1b ................................................................1
II. User’s Guide ..............................................................................................................................4
A. Methodology .........................................................................................................................4
B. User Guidelines for Processing the Public Elementary/Secondary School Universe Data Files.....................................................................................................................................17
Appendixes
Appendix A—Record Layout for the Common Core of Data Public Elementary/Secondary School Universe Survey: School Year 2004–05................................................. A-1
Appendix B—Value Distribution and Field Frequencies for the Common Core of Data Public Elementary/Secondary School Universe Survey: School Year 2004–05................................................................................................................B-1
Appendix C—Glossary for the Common Core of Data: School Year 2004–05..........................C-1
Appendix D— State Notes for the Common Core of Data: School Year 2004–05 .................... D-1
Appendix E— Shuttle for the Common Core of Data Public Elementary/Secondary School Universe Survey: School Year 2004–05..............................................................E-1

iv
List of Tables
Table
1. State and other jurisdiction FIPS codes and abbreviations used in CCD datasets...................15
2. Schools with mailing address in another state, by administration state and NCES school ID: 2004–05 .............................................................................................................................16

1
I. Introduction to the NCES Common Core of Data Public Elementary/Secondary School Universe Survey: School Year 2004–05, Version 1b The Common Core of Data (CCD) nonfiscal surveys consist of data submitted annually to NCES by state education agencies (SEAs) in the 50 states, the District of Columbia, Puerto Rico, the four outlying areas (American Samoa, Guam, the Commonwealth of the Northern Mariana Islands, and the U.S. Virgin Islands), the Department of Defense (DoD) dependents schools (overseas and domestic), and the Bureau of Indian Affairs (BIA). In order to provide data comparable across states to the maximum extent feasible, NCES and representatives of the SEAs have worked since the 1950s to develop and accept common data items and definitions. School, agency, and state education data for the CCD are sent to NCES by SEA personnel who are designated CCD coordinators. The data are edited and maintained in machine-readable datasets by NCES and are used to produce general-purpose publications and specialized reports. The principal users of CCD nonfiscal data are the federal government; the education research community; state and local government officials, including school boards and local education agency (LEA) administrators; and the general public. The purpose of the CCD nonfiscal surveys is to provide a listing of all open schools and agencies providing free public elementary and secondary education, along with basic descriptive statistical information on each school and agency listed. The CCD includes all settings in which free public education is provided to children. However, some SEAs do not provide information on education outside of the traditional public school system—such as schools in correctional facilities or hospitals—while others do provide this information. In the 2004–05 CCD Public Elementary/Secondary School Universe Survey, there are 102,104 records—one for each public elementary and secondary school in the 50 states, the District of Columbia, Puerto Rico, the four outlying areas, the DoD schools (overseas and domestic), and the BIA. Schools coded as being open in the 2003–04 file, but coded as closed in the 2004–05 file (1,928 schools), will be kept on the file for one year, and then removed (i.e., not kept on the file after that). Their status is indicated by a value of 2 for the variable STATUS04. Once these closed schools were removed from the total count, 100,176 open schools remained in the 2004–05 file—including new, added, changed agency, inactive, and future schools. Of these 100,176 open schools, 90,388 are regular elementary and secondary, 2,019 are special education, 1,215 are vocational/technical, and 6,554 are other/alternative schools.1 The CCD system is designed to be inclusive rather than exclusive. Thus, CCD files contain a substantial number of records representing administrative and operating units that are unlike typical public schools and school districts—for example, schools or districts without students and special education schools. In 2004–05, 9.8 percent of all open schools were unlike typical schools (non-
1There were also 17,846 open school districts listed in the 2004–05 CCD. Detailed information on school districts is collected in the CCD Local Education Agency Universe Survey.

2
typical schools are types 2, 3, or 4)2 and 20.2 percent of all open school districts were unlike typical districts (non-typical districts areas type 3, 4, 5, 6, or 7).3 The CCD system provides features that enable the data provider and the data user to identify and select records according to the categories of interest to them. Definitions and categories used in the CCD are deliberately generic so that they may accommodate the many and varied organizational structures used in the provision of public elementary and secondary education across the nation. The Public Elementary/Secondary School Universe file includes data for the following variables: NCES school ID number, state school ID number, name of the school, name of the agency that operates the school, mailing address, physical location address, phone number, school type, operational status, locale code, in/out flag, latitude, longitude, county number, county name, full-time-equivalent (FTE) classroom teacher count, low/high grade span offered, school level, Title I eligible, schoolwide Title I, magnet school, charter school, shared school, free lunch eligible students, reduced-price lunch eligible students, total free and reduced-price lunch eligible, migrant students enrolled in the previous year, student totals and detail (by grade, by race/ethnicity, and by gender), and pupil/teacher ratio. This revised file replaces version 1a of the 2004–05 file. See Part II, section B, “User Guidelines for Processing the Public Elementary/Secondary School Universe Data Files” below for details on what data fields changed between the two files. The remainder of this document contains a user’s guide and five appendixes. The user’s guide contains information on CCD methodology, including certain conditions that are unique to this data file.
• Appendix A—Record Layout gives the variable names and labels of the data elements discussed throughout the documentation, as well as their location in the data file.
• Appendix B—Value Distribution and Field Frequencies indicates the minimum,
maximum, and mean values for each continuous variable as well as the frequency, percentage, cumulative frequency, and cumulative percent of all categorical variables.
• Appendix C—Glossary defines all of the CCD data items.
• Appendix D—State Notes provides comments for data users on individual states, including
information on when and how the data files were submitted by each state. 2 Type codes for schools are as follows: 1—regular school; 2—special education school; 3—vocational school; and 4—other/alternative school. 3 Type codes for school districts are as follows: 1—local school district that is not a component of a supervisory union; 2—local school district component of a supervisory union sharing a superintendent and administrative services with other local school districts; 3—supervisory union administrative center, or a county superintendent serving the same purpose; 4—regional education services agency, or a county superintendent serving the same purpose; 5—state-operated institution charged, at least in part, with providing elementary and/or secondary instruction or services to a special-needs population; 6—federally operated institution charged, at least in part, with providing elementary and/or secondary instruction or services to a special-needs population; and 7—other education agencies, including charter school agencies, that do not fit into the first six categories.

3
• Appendix E—Shuttle is the paper copy of the school survey form.

4
II. User’s Guide A. Methodology Data collected at different levels of aggregation (school, agency, and state) are provided by officials in each SEA. Since it is understood that local education staff have already provided information to SEA officials in conjunction with established administrative records systems, CCD survey staff do not contact local personnel to verify data except in unusual circumstances. Edits are performed by survey staff and referred to SEA respondents for resolution. It is CCD policy to accept the judgment of the respondent unless there is a clear conflict or unacceptable inconsistency. In the context of the CCD, a school is an organization composed of students and staff.4 The CCD definition recognizes that this organization may encompass several locations, but must have a single contact point, which is the mailing address entered on the CCD school record. There may be situations in which students are attending two schools at the same time (e.g., a regular school and a vocational school). In these situations, a judgment must be made as to where the student should be counted. Typically, such judgment is left to the SEA official who reports the data. In most cases, CCD files contain enough data so that NCES may make decision rules that can be applied to the file without the need for manual review of every case. Comments About the Public Elementary/Secondary School Universe Survey Data File Users of the data file need to be aware of certain conditions that are unique to the file. Coverage, response, and nonsampling error. The Public Elementary/Secondary School Universe Survey includes all public schools providing education services to prekindergarten, kindergarten, grade 1–12, and ungraded students. There are 59 responding units: the 50 states, the District of Columbia, Puerto Rico, the Department of Defense dependents schools (overseas and domestic), the Bureau of Indian Affairs, and the four outlying areas. Appendix B—Value Distribution and Field Frequencies lists the minimum, maximum, and mean value of each numeric variable as well as the total number of units and the number of units for which data were missing. Appendix B also lists the frequency of responses by option for each of the categorical values. Note that the “missing” value is appropriate for the variable INOUT04 if the state did not choose to identify whether a school was inside or outside the city or town limits. This item was optional. Nonsampling error is the error in an estimate arising at any stage in a survey from such sources as varying interpretation of questions by respondents, unwillingness/inability of respondents to give correct answers, nonresponse, improper coverage, and other sources exclusive of sampling error. Nonsampling error may occur if the reporting state did not follow the item definitions correctly. This can arise when states follow different 4 Schools in the CCD may have no reported enrollment but still serve students because students can only be reported among the membership of one school. For example, a vocational school may serve students who are dually enrolled in a regular school and the regular school reports their membership. This vocational school serves students, but would have no reported enrollment in the CCD because the students are included in the membership of the regular school.
5
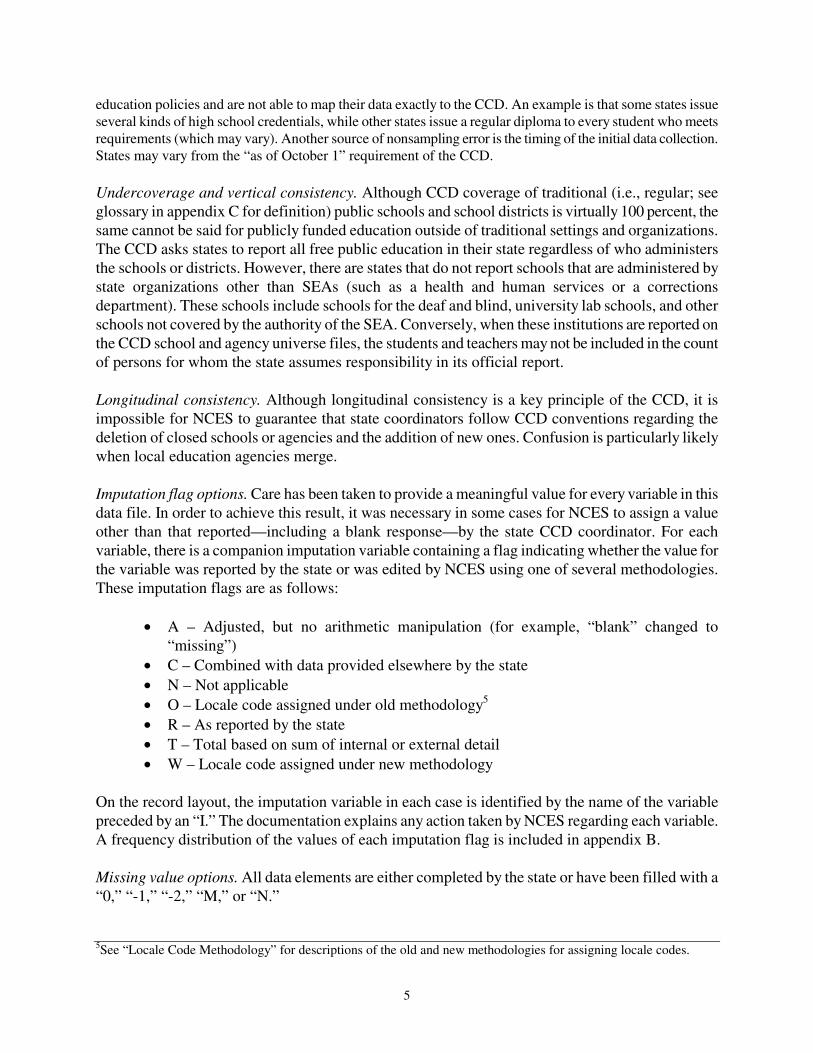
education policies and are not able to map their data exactly to the CCD. An example is that some states issue several kinds of high school credentials, while other states issue a regular diploma to every student who meets requirements (which may vary). Another source of nonsampling error is the timing of the initial data collection. States may vary from the “as of October 1” requirement of the CCD. Undercoverage and vertical consistency. Although CCD coverage of traditional (i.e., regular; see glossary in appendix C for definition) public schools and school districts is virtually 100 percent, the same cannot be said for publicly funded education outside of traditional settings and organizations. The CCD asks states to report all free public education in their state regardless of who administers the schools or districts. However, there are states that do not report schools that are administered by state organizations other than SEAs (such as a health and human services or a corrections department). These schools include schools for the deaf and blind, university lab schools, and other schools not covered by the authority of the SEA. Conversely, when these institutions are reported on the CCD school and agency universe files, the students and teachers may not be included in the count of persons for whom the state assumes responsibility in its official report. Longitudinal consistency. Although longitudinal consistency is a key principle of the CCD, it is impossible for NCES to guarantee that state coordinators follow CCD conventions regarding the deletion of closed schools or agencies and the addition of new ones. Confusion is particularly likely when local education agencies merge. Imputation flag options. Care has been taken to provide a meaningful value for every variable in this data file. In order to achieve this result, it was necessary in some cases for NCES to assign a value other than that reported—including a blank response—by the state CCD coordinator. For each variable, there is a companion imputation variable containing a flag indicating whether the value for the variable was reported by the state or was edited by NCES using one of several methodologies. These imputation flags are as follows:
• A – Adjusted, but no arithmetic manipulation (for example, “blank” changed to “missing”)
• C – Combined with data provided elsewhere by the state • N – Not applicable • O – Locale code assigned under old methodology5 • R – As reported by the state • T – Total based on sum of internal or external detail • W – Locale code assigned under new methodology
On the record layout, the imputation variable in each case is identified by the name of the variable preceded by an “I.” The documentation explains any action taken by NCES regarding each variable. A frequency distribution of the values of each imputation flag is included in appendix B. Missing value options. All data elements are either completed by the state or have been filled with a “0,” “-1,” “-2,” “M,” or “N.”
5See “Locale Code Methodology” for descriptions of the old and new methodologies for assigning locale codes.

6
• 0 – There are no occurrences of this data element. A value was expected and measured, but
there were no cases in the category. (For example, a high school having no 12th-graders would report 0.)
• M (or -1 for numeric values) – Data are missing. A value was expected and none was
measured. (For example, a school that has at least one 12th-grader but cannot measure the number of 12th-graders would report -1.)
• N (or -2 for numeric values) – Data are not applicable. A value was neither expected nor
measured. (For example, an elementary school would report -2 for 12th-graders.) Note that starting with the 2002–03 CCD, all numeric fields contain a -1 to indicate “missing” and a -2 to indicate “not applicable.” Previously, numeric fields contained an “M” for missing and an “N” for not applicable. Character fields continue to use “M” for missing and “N” for not applicable. Comments About the Variables Data users should also take note of certain conditions regarding each variable in the file. The code in parentheses before the variable description indicates the variable name, which is also referenced in appendix A. Counts are based on open (STATUS = 1, 3, 4, 5, 6, or 7) schools only. (Operational status codes are defined below.) (FIPST) FIPS Codes. A list of the Federal Information Processing Standards (FIPS) codes for each state and outlying area is attached (see table 1). (LEAID) NCES Local Education Agency ID. Each record contains a unique NCES-assigned identification number for the agency that operates the school. The first two characters of this number are the FIPS code. (SCHNO) NCES School ID. Each record contains a unique NCES school identification number. Combining the NCES Local Education Agency ID with the NCES School ID allows the user to uniquely identify each school on the file. (STID04) State Local Education Agency ID. Each record contains a State Local Education Agency ID. State Local Education Agency ID numbers are assigned by SEAs and may not be unique across states. (SEASCH04) State School ID. Each record contains a State School ID. State School ID numbers are assigned by SEAs and may not be unique across states. (LEANM04) Name of Education Agency. Each record includes the name of the agency that operates the school. NCES reviewed any record filling the 60 characters assigned, and may have adjusted the agency name to improve readability (i.e., applied standard abbreviations).

7
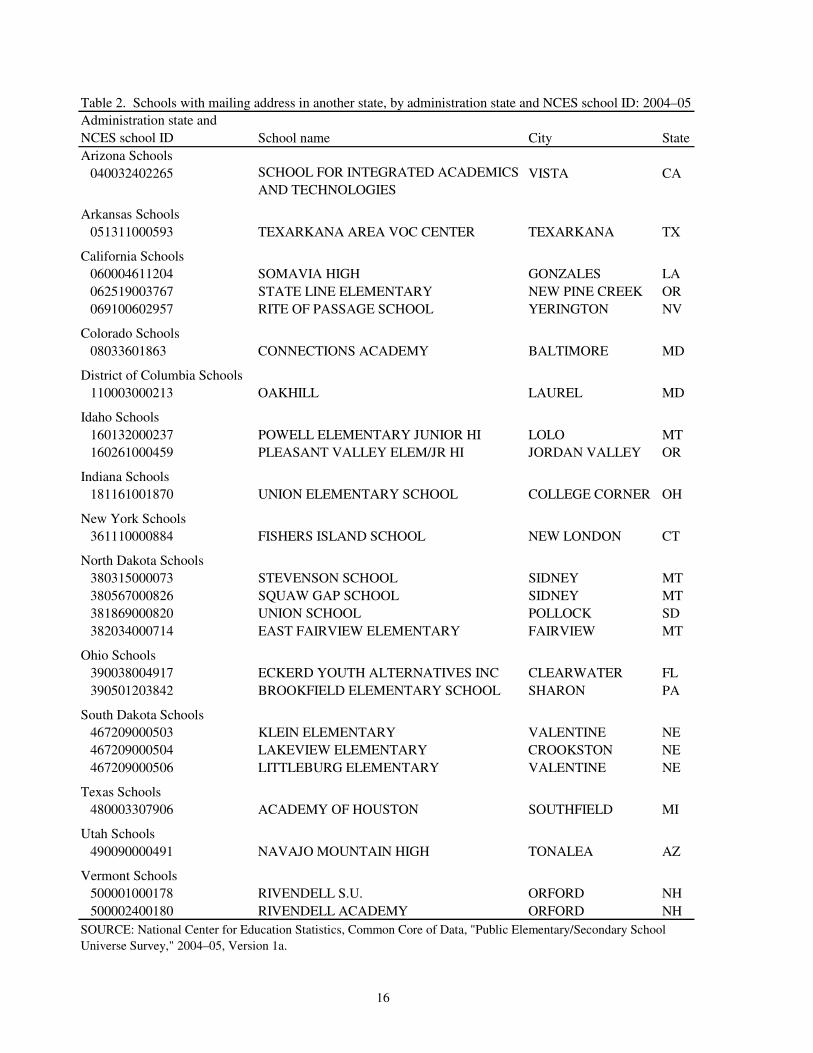
(SCHNAM04) Name of School. Each record has a school name. NCES reviewed any record filling the 50 characters assigned, and may have adjusted the school name to improve readability (i.e., applied standard abbreviations). (MSTREE04) Mailing Street. This field may contain a street address or a P.O. Box number. Also, some mailing addresses consist solely of a city and state, indicated by an “N” in the street address field. This field contains an “N” for 25 records in the data file. If mailing street, city, state, and ZIP Code fields were left blank or missing, data from the corresponding location address fields were inserted. (MCITY04) Mailing City. There may be some valid cases in which a school may be located in one city and have a mailing address in another city. (MSTATE04) Mailing State (PO Abbreviation). Each record contains a mailing state. There are instances where a school that is part of one state’s education system reports a mailing address in another state; these situations have been confirmed by the reporting state. A list of the 24 schools that have a mailing state code different from their FIPS state code is included at the end of this document (see table 2). (MZIP04, MZIP404) Mailing ZIP Code +4. Each record displays a mailing ZIP Code in this field. The +4 may be left blank if it is unknown. (PHONE04) Area Code + Telephone Number. This field contains an “M” for 1,155 records and an “N” for one record in the data file. (LSTREE04) Location Street. This field contains an “M” for 16 records in the data file. If the location street, city, state, and ZIP Code fields were left blank, data from the corresponding mailing address fields were inserted. In some instances, SEAs did not report physical locations for the location street field, but rather reported Post Office boxes and other addresses that did not represent the location of a school. NCES sponsored research to determine the physical location (and latitude and longitude coordinates) for these types of location street reports. Missing or non-location addresses (e.g., Post Office box numbers) were resolved through several means, including telephone calls to individual schools. A new, verified address file was created, and this verified address file replaced all location addresses reported by the SEAs. Mailing addresses were not changed. (LCITY04) Location City. Each record displays a location city in this field. (LSTATE04) Location State (PO Abbreviation). Each record displays a location state in this field. (LZIP04, LZIP404) Location ZIP Code + 4. Each record displays a location ZIP Code in this field. The +4 may be left blank if it is unknown. This field contains an “M” for one record.

8
(TYPE04) School Type Code. Each record contains a school type code. 1 = Regular school 2 = Special education school 3 = Vocational education school 4 = Alternative/other school (STATUS04) Operational Status Code. Each record contains a status code to reflect the school’s operational status for the 2004–05 school year. Valid responses include the following:
1 = School was operational at the time of the last report and is currently operational. 2 = School has closed since the time of the last report. 3 = School has been opened since the time of the last report. 4 = School was operational at the time of the last report but was not on the CCD list at that
time. 5 = School was listed in previous year’s CCD school universe as being affiliated with a
different education agency. 6 = School is temporarily closed and may reopen within 3 years.
7 = School is scheduled to be operational within 2 years.
Schools with an operational status code of “2” remain on the file for one year for historical purposes. Code “6” and “7” response options for the STATUS field were added to the CCD starting with the 2002–03 file. (LOCALE04) Locale Code. None of the outlying areas was assigned a locale code (they contain the value “N” in this field) because their geographic and governmental structures do not fit the definitional scheme used to derive the code. Also, this field contains an “N” for all closed schools (1,819 records). All other records contain a code ranging from 1 to 8 indicating the location of the school relative to populous areas. The methodology used to assign locale codes was updated to incorporate the location address fields added to the CCD collection starting with the 1998–99 file. Starting with the 2002–03 CCD file, the methodology was updated to incorporate 2000 Census population and geography information. The methodology used to assign locale codes is provided at the end of this section. The locale codes are as follows:
1 = Large city: A principal city of a metropolitan core based statistical area (CBSA), with the city having a population greater than or equal to 250,000.
2 = Midsize city: A principal city of a metropolitan CBSA, with the city having a population
less than 250,000. 3 = Urban fringe of a large city: Any incorporated place, Census-designated place, or non-
place territory within a metropolitan CBSA of a large city and defined as urban by the Census Bureau.

9
4 = Urban fringe of a midsize city: Any incorporated place, Census-designated place, or non-place territory within a metropolitan CBSA of a midsize city and defined as urban by the Census Bureau.
5 = Large town: An incorporated place or Census-designated place with a population greater
than or equal to 25,000 and located outside a metropolitan CBSA or inside a micropolitan CBSA.
6 = Small town: An incorporated place or Census-designated place with a population less
than 25,000 and greater than or equal to 2,500 and located outside a metropolitan CBSA or inside a micropolitan CBSA.
7 = Rural, outside CBSA: Any incorporated place, Census-designated place, or non-place
territory not within a metropolitan CBSA or within a micropolitan CBSA and defined as rural by the Census Bureau.
8 = Rural, inside CBSA: Any incorporated place, Census-designated place, or non-place
territory within a metropolitan CBSA and defined as rural by the Census Bureau. (INOUT04) In/Out flag. Starting with the 2001–02 CCD, state coordinators were given the opportunity to provide a flag indicating whether a school is located inside or outside the city or town limits. These flags were used to improve the accuracy of the locale code assignment for schools assigned locale codes with the old methodology. The flags are provided in the data file in the field INOUT and contain the following codes:
1 = Inside the city or town limits. 2 = Outside the city or town limits.
Schools not sent with an INOUT flag by the state coordinator contain the value “M.” (LATCOD04) Latitude. Latitude and longitude values were added to the school file starting in 2000–01. Addresses that could not be found at the Census block level were assigned an “N.” Latitude is the north or south angular distance from the equator that, when combined with longitude, reflects an estimation of where the school is physically situated on the street segment to which it was coded. Coordinate degrees, minutes, and seconds have been converted to, and are displayed in terms of, their decimal equivalent. The first three digits of the code represent the number of degrees from the equator; the last six digits represent the fraction of the next degree carried out to six decimal places, with an implied decimal. For example, if a school’s latitude is 30 degrees, 30 minutes north, then it is shown as 030500000. (LONCOD04) Longitude. Latitude and longitude values were added to the school file starting in 2000–01. Addresses that could not be found at the Census block level were assigned an “N.” Longitude is the east or west angular distance from the prime meridian that, when combined with latitude, reflects an estimation of where the school is physically situated on the street segment to which it was coded. Coordinate degrees, minutes, and seconds have been converted to, and are

10
displayed in terms of, their decimal equivalent. The first three digits of the code represent the number of degrees from the prime meridian; the last six digits represent the fraction of the next degree carried out to six decimal places, with an implied decimal. For example, if a school’s longitude is 90 degrees, 15 minutes west, then it is shown as -090250000.
(CONAME04) County Name. This field was added to the school file starting in 2002–03. The values for this field are determined by the Census Bureau based on the reported location address. Each record, except for the Department of Defense schools (overseas), has a county name in the file. (CONUM04) FIPS County Code. This field was added to the school file starting in 2002–03. The values for this field are determined by the Census Bureau based on the reported location address. A small number of supervisory unions in New England states have a FIPS county code that differs from the county in which the school is physically located. Each record, except for the Department of Defense schools (overseas), has a county code in the file. (FTE04) FTE Teachers. Full-time-equivalent teachers are collected to the nearest tenth. Some schools may report teachers, but no pupils, while other schools may report pupils in membership but no teacher FTE. These are valid records indicating situations in which more than one school provides services to pupils, but the pupils are attributed to a single school to avoid double counting, or where a teacher provides services to pupils at multiple schools. An example of the former situation might be a vocational school whose pupil membership is attributed to the high school that sends its pupils to obtain vocational services. (GSLO04, GSHI04) Low/High Grade Span Offered. Grade span information that was not reported was calculated using the reported student information. Reported grade spans were adjusted when student counts were found in corresponding grade fields outside of the span that was reported. Grade spans that were calculated or adjusted are indicated by the code “A” in the corresponding IGSLO04 and IGSHI04 imputation flags. (LEVEL04) Level. A school-level code was added to the school file starting in 2000–01. This code indicates the instructional level of the school. The following codes were calculated from the school’s corresponding low/high grade span (GSLO/GSHI) values:
1 = Primary (low grade: PK through 03; high grade: PK through 08) 2 = Middle (low grade: 04 through 07; high grade: 04 through 09) 3 = High (low grade: 07 through 12; high grade: 12 only) 4 = Other (any other configuration not falling within the above three categories, including
ungraded) (TITLEI04) Title I Eligible School.
1 = Yes 2 = No

11
(STITLI04) Schoolwide Title I. 1 = Yes 2 = No
(MAGNET04) Magnet School. If a state reports MAGNET = 2 for all its schools, then MAGNET is set to “N” (not applicable). This occurred in Hawaii, Idaho, Iowa, Montana, New Hampshire, North Dakota, Ohio, Oklahoma, South Dakota, Vermont, Washington, West Virginia, Wyoming, the Bureau of Indian Affairs, the Department of Defense schools (overseas), the Department of Defense schools (domestic), American Samoa, Guam, and the Northern Marianas.
1 = Yes 2 = No
(CHARTR04) Charter School. If a state reports CHARTER = 2 for all its schools and does not have charter school legislation, then CHARTER is set to “N” (not applicable). This occurred in Alabama, Kentucky, Maine, Montana, Nebraska, North Dakota, South Dakota, Vermont, Washington, West Virginia, the Bureau of Indian Affairs, the Department of Defense schools (overseas), the Department of Defense schools (domestic), American Samoa, Guam, and the U.S. Virgin Islands.
1 = Yes 2 = No
(SHARED04) Shared Time School.
1 = Yes 2 = No
(FRELCH04) Free Lunch Eligible Students. This student count may be taken by a school at a different time than the membership count; therefore, free lunch and membership counts may not be comparable in a given school. In some states, a single school may provide the free lunch program for a cluster of schools; thus, the free lunch eligible count for the school providing services may overrepresent the school’s total membership. To avoid identifying specific students as eligible for free lunch, the number reported may have been adjusted. Prior to 1999–2000, schools with a free and reduced-price count greater than 95 percent of the total student membership of the school had the lunch count reduced to 95 percent of the total. For 2004–05, the free and reduced-price lunch count was reduced to the membership minus 3 if the reported free and reduced-price lunch total was larger than this. Free and reduced-price lunch counts in schools with a total student membership of 3 or lower are adjusted to -2 (not applicable). (REDLCH04) Reduced-Price Lunch Eligible Students. See preceding paragraph. (TOTFRL04) Total Free and Reduced-Price Lunch Eligible Students. If not reported, this total field was calculated using reported free and reduced-price lunch detail.

12
(MIGRNT04) Migrant Students Served in the Prior Year. Collected for the previous (2003–04) school year. Students by Grade (PK–12), by Race/Ethnicity, and by Gender. Race/ethnicity counts may be taken by schools at a different time than membership counts; thus, race/ethnicity and membership totals may not be the same. Cases where student by grade and student by race/ethnicity were not reported were calculated using reported student membership by grade and race/ethnicity. If totals were reported for students by grade, those totals were used; if not, students by grade, race/ethnicity, and gender were aggregated up to student grade totals. Ungraded Students by Race/Ethnicity and by Gender. The classification of “ungraded” is not used for students in Alabama, Alaska, Colorado, Connecticut, Delaware, Florida, Georgia, Idaho, Indiana, Iowa, Louisiana, Maine, Maryland, Massachusetts, Minnesota, Nebraska, New Mexico, North Carolina, North Dakota, Ohio, Rhode Island, South Carolina, South Dakota, Texas, Utah, Virginia, Washington, Wisconsin, Wyoming, the Bureau of Indian Affairs, Department of Defense dependents schools (domestic and overseas), and Guam. Ungraded student fields not reported were calculated using reported ungraded student detail. Locale Code Methodology Locale code is a variable that NCES has created for general description, sampling, and other statistical purposes. It is based upon the location of school buildings and, in some cases, may not reflect the entire attendance area or residences of enrolled students. The designation of each school’s locale is based on its geographic location and population attributes such as density. School locale codes are coded by the Census Bureau from school addresses in the CCD files. Definitions of locale codes are contained in “Comments About the Data Fields” earlier in this document. Starting with the 2002–03 CCD file, the methodology was updated to incorporate 2000 Census population and geography information (e.g., using combined statistical area (CSA)/CBSA geographic entities instead of metropolitan statistical areas (MSA) entities). These changes in the methodology affected the locale code assignments. For example, a school may now be assigned to a micropolitan CBSA whereas in the 2001–02 file it was in an MSA. Starting with the 2003–04 file, ZIP Code Tabulation Areas (ZCTAs) were used to further refine the locale code assignment process for schools with addresses that could not be matched to a Census block and tract. ZCTAs are generalized area representations of U.S. Postal Service (USPS) ZIP Code service areas. Each one is built by aggregating the Census 2000 blocks, whose addresses use a given ZIP Code, into a ZCTA that gets that ZIP Code assigned as its ZCTA code. They represent the majority USPS five-digit ZIP Code found in a given area. Locale codes were assigned based on the classification of the place in which each school is located. First, the CCD file was checked for the existence of location addresses. Records missing the location address were coded based upon the mailing address. The addresses were then extracted and run through a program to match them to Census TIGER® files. This match process produced geographic information that was used in the two methodologies that determines the locale code.

13
Some state coordinators may have also provided an INOUT flag to indicate whether a school is located inside or outside the city or town (incorporated place) limits. These flags were provided for schools that could not be matched to the block level to improve the accuracy of the geographic information that resulted from the Census TIGER® file match program. The complete methodology for schools not matched to the block level is considered the “old” methodology and is described in more detail following the “new” methodology description below. Addresses that could be matched to a Census block could be coded with 100 percent accuracy. These cases are marked with the new imputation flag of “W.” The remaining addresses could not be assigned Census block information, and, thus, their associated locale codes had to be calculated using the old methodology. Those cases are marked with the old imputation flag of “O.” The new methodology works as follows:
1. Each address was checked for level of coding. Addresses that could not be coded to the block level were separated out for application of the old methodology.
2. The remaining addresses were checked for an incorporated place code.
3. If the address had an incorporated place code, the unit was matched to a list of principal cities
of metropolitan areas. Addresses that matched this list were assumed to primarily serve a principal city of a metropolitan area. The 2000 Census population size of the city was used to determine whether the unit was assigned a locale of “1” or “2.”
4. At this point, the remaining addresses were evaluated for characteristics that would justify
their assignment to a metropolitan area. The units in a metropolitan area were checked for urban/rural character. Units that were determined to be rural were assigned a locale code of “8.” The remaining units were then assigned a locale code of “3” or “4” based on the population size of the principal city of the metropolitan area in which they were situated.
5. All remaining units—i.e., those in an incorporated place that were not in a metropolitan
area—were then matched according to the population size of that place. Units located in cities with a population of 25,000 or greater were assigned a code of “5.” Units located in cities whose populations fell between 2,500 and 24,999 were assigned a code of “6.”
6. The remaining units were coded as “7.”
The units that could not be matched to the Census block level were coded using the old methodology. The old methodology works as follows:
1. Units were checked for an incorporated place code. Those that matched the principal city code of a metropolitan area were coded as “1” or “2” based on the population size of the city.
2. Units were then checked for metropolitan area status. Those units that were determined to be
inside of a metropolitan area (MA) with an urban status were coded as “3” or “4” based on

14
the population size of the MA. Units coded as “3” or “4” using the old methodology were then examined by ZCTA. Units residing in ZCTAs that were 25 percent or less urban were recoded as “8,” and units in places deemed mixed urban/rural areas within rural ZCTAs were recorded as “8.” Units within an MA with a rural status were also coded as “8.”
3. The remaining units situated in an incorporated place were then matched to the population
size of those places. If their populations were 25,000 or greater, the units were assigned a code of “5.” Units with a population between 2,500 and 24,999 were assigned a code of “6.” Units within an MSA having a rural characteristic were coded as “8.”
4. The remaining units that had sufficient addresses were assigned a code of “7.”
5. Units that had critical missing address information had their locale codes pulled forward
from the previous survey (where they existed).
6. Finally, units that could not be assigned a code under either method, or if they had no city, were assigned a code of “N.”
Department of Defense dependents schools (overseas) were assigned a code of “N.” Units located in outlying areas were assigned a code of “N” because the geographic and governmental structure of the areas do not fit into the definitional scheme used to derive the codes.

15
Table 1.—State and other jurisdiction FIPS codes and abbreviations used in CCD datasetsState name/jurisdiction FIPS1 Abbreviation2 State name/jurisdiction FIPS1 Abbreviation2
Alabama 01 AL Ohio 39 OHAlaska 02 AK Oklahoma 40 OKArizona 04 AZ Oregon 41 ORArkansas 05 AR Pennsylvania 42 PACalifornia 06 CA Rhode Island 44 RIColorado 08 CO South Carolina 45 SCConnecticut 09 CT South Dakota 46 SDDelaware 10 DE Tennessee 47 TNDistrict of Columbia 11 DC Texas 48 TXFlorida 12 FL Utah 49 UTGeorgia 13 GA Vermont 50 VTHawaii 15 HI Virginia 51 VAIdaho 16 ID Washington 53 WAIllinois 17 IL West Virginia 54 WVIndiana 18 IN Wisconsin 55 WIIowa 19 IA Wyoming 56 WYKansas 20 KSKentucky 21 KY Department of DefenseLouisiana 22 LA Dependents SchoolsMaine 23 ME (overseas) 583 DOMaryland 24 MDMassachusetts 25 MA Department of DefenseMichigan 26 MI Dependents SchoolsMinnesota 27 MN (domestic) 613 DDMississippi 28 MSMissouri 29 MO Bureau ofMontana 30 MT Indian Affairs 593 BINebraska 31 NENevada 32 NV American Samoa 60 ASNew Hampshire 33 NH Guam 66 GUNew Jersey 34 NJ Northern Marianas 69 MPNew Mexico 35 NM Puerto Rico 72 PRNew York 36 NY Virgin Islands 78 VINorth Carolina 37 NCNorth Dakota 38 ND1 Federal Information Processing Standards Codes (01–78).2 Postal state abbreviation codes.3 Not official U.S. FIPS code. The state abbreviations for Department of Defense (overseas) schools are AA, AE, and AP to indicate schools located in Asia, Europe, and the Pacific, respectively. For Department of Defense (domestic) schools and Bureau of Indian Affairs schools, state abbreviations correspond to the state in which the school is located.
16
Table 2. Schools with mailing address in another state, by administration state and NCES school ID: 2004–05Administration state and NCES school ID School name City StateArizona Schools
040032402265 SCHOOL FOR INTEGRATED ACADEMICS AND TECHNOLOGIES
VISTA CA
Arkansas Schools051311000593 TEXARKANA AREA VOC CENTER TEXARKANA TX
California Schools060004611204 SOMAVIA HIGH GONZALES LA062519003767 STATE LINE ELEMENTARY NEW PINE CREEK OR069100602957 RITE OF PASSAGE SCHOOL YERINGTON NV
Colorado Schools08033601863 CONNECTIONS ACADEMY BALTIMORE MD
District of Columbia Schools110003000213 OAKHILL LAUREL MD
Idaho Schools160132000237 POWELL ELEMENTARY JUNIOR HI LOLO MT160261000459 PLEASANT VALLEY ELEM/JR HI JORDAN VALLEY OR
Indiana Schools181161001870 UNION ELEMENTARY SCHOOL COLLEGE CORNER OH
New York Schools361110000884 FISHERS ISLAND SCHOOL NEW LONDON CT
North Dakota Schools380315000073 STEVENSON SCHOOL SIDNEY MT380567000826 SQUAW GAP SCHOOL SIDNEY MT381869000820 UNION SCHOOL POLLOCK SD382034000714 EAST FAIRVIEW ELEMENTARY FAIRVIEW MT
Ohio Schools390038004917 ECKERD YOUTH ALTERNATIVES INC CLEARWATER FL390501203842 BROOKFIELD ELEMENTARY SCHOOL SHARON PA
South Dakota Schools467209000503 KLEIN ELEMENTARY VALENTINE NE467209000504 LAKEVIEW ELEMENTARY CROOKSTON NE467209000506 LITTLEBURG ELEMENTARY VALENTINE NE
Texas Schools480003307906 ACADEMY OF HOUSTON SOUTHFIELD MI
Utah Schools490090000491 NAVAJO MOUNTAIN HIGH TONALEA AZ
Vermont Schools500001000178 RIVENDELL S.U. ORFORD NH500002400180 RIVENDELL ACADEMY ORFORD NH
SOURCE: National Center for Education Statistics, Common Core of Data, "Public Elementary/Secondary School Universe Survey," 2004–05, Version 1a.

17
B. User Guidelines for Processing the Public Elementary/Secondary School Universe Data Files Starting in 1999–2000, CCD data file names were changed to include a two-digit version number. The 2004–05 Public Elementary/Secondary School Universe Survey SAS files are called SC041AAI.SD2, SC041AKN.SD2, and SC041AOW.SD2. The flat ASCII files are called SC041AAI.DAT, SC041AKN.DAT, and SC041AOW.DAT. The first two characters of the file name indicate the type of file (SC = School Universe, AG = Agency Universe, ST = State), the third and fourth characters indicate the file year (04 = 2004–05 CCD collection), the fifth and sixth characters indicate the version number (1 = final file; A = first version), and the seventh and eighth characters indicate the set of states included in the file (AI = Alabama through Iowa; KN = Kansas through North Dakota; OW = Ohio through Wyoming, followed by the other jurisdictions). The record layout for the file is contained in appendix A. Approximately one year after the release of the 1a files (final file, first version), NCES releases a revised data file. The purpose of the revised data file is to allow SEAs to submit any corrections to their data. The revised file is labeled 1b, unless another revision of the original file has occurred sometime in that year due to an NCES error found in the file. The only changes between version 1a and 1b of the 2004-05 Public Elementary/Secondary School Universe Survey were changes to enrollment counts by grade and by race/ethnicity, gender and grade reported by schools in Oregon.


A-1
Appendix A—Record Layout for the Common Core of Data Public Elementary/Secondary School Universe Survey:
School Year 2004–05

Appendix A—Record Layout for the Common Core of Data Public Elementary/Secondary School Universe Survey: School year 2004–05
A-3
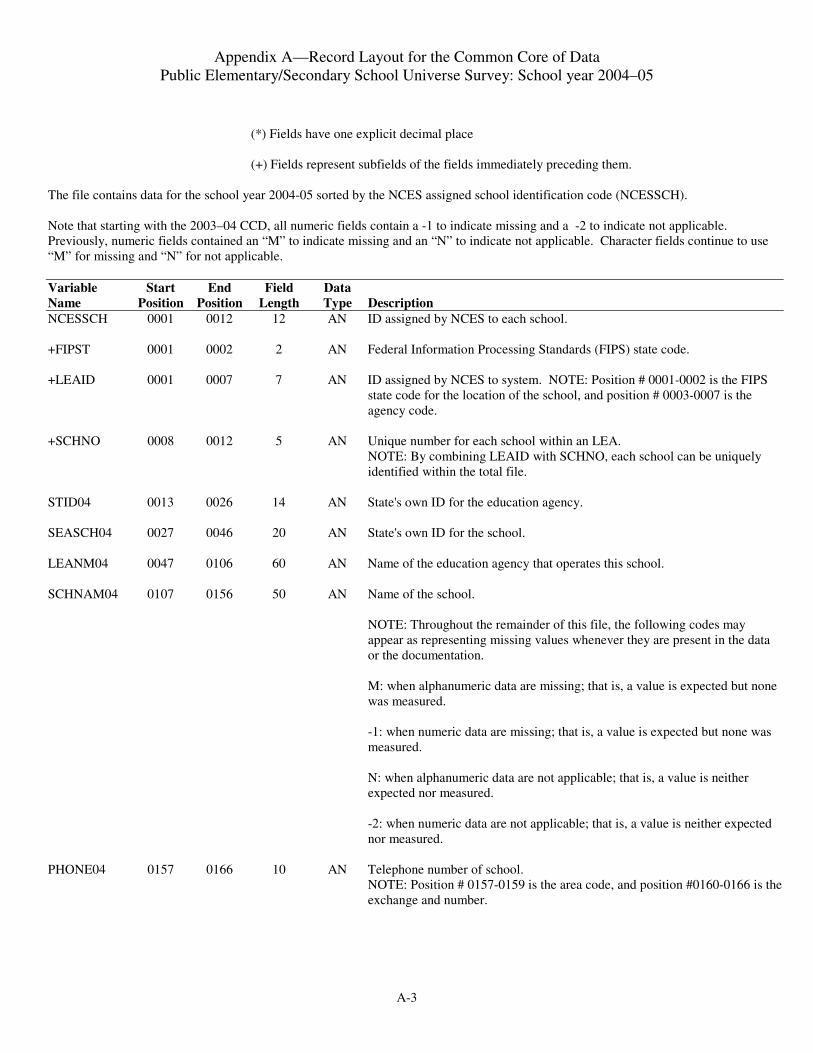
(*) Fields have one explicit decimal place (+) Fields represent subfields of the fields immediately preceding them. The file contains data for the school year 2004-05 sorted by the NCES assigned school identification code (NCESSCH). Note that starting with the 2003–04 CCD, all numeric fields contain a -1 to indicate missing and a -2 to indicate not applicable. Previously, numeric fields contained an “M” to indicate missing and an “N” to indicate not applicable. Character fields continue to use “M” for missing and “N” for not applicable. Variable Start End Field Data Name Position Position Length Type Description NCESSCH 0001 0012 12 AN ID assigned by NCES to each school.
+FIPST 0001 0002 2 AN Federal Information Processing Standards (FIPS) state code.
+LEAID 0001 0007 7 AN ID assigned by NCES to system. NOTE: Position # 0001-0002 is the FIPS
state code for the location of the school, and position # 0003-0007 is the agency code.
+SCHNO 0008 0012 5 AN Unique number for each school within an LEA. NOTE: By combining LEAID with SCHNO, each school can be uniquely identified within the total file.
STID04 0013 0026 14 AN State's own ID for the education agency.
SEASCH04 0027 0046 20 AN State's own ID for the school.
LEANM04 0047 0106 60 AN Name of the education agency that operates this school.
SCHNAM04 0107 0156 50 AN Name of the school. NOTE: Throughout the remainder of this file, the following codes may appear as representing missing values whenever they are present in the data or the documentation. M: when alphanumeric data are missing; that is, a value is expected but none was measured. -1: when numeric data are missing; that is, a value is expected but none was measured. N: when alphanumeric data are not applicable; that is, a value is neither expected nor measured. -2: when numeric data are not applicable; that is, a value is neither expected nor measured.
PHONE04 0157 0166 10 AN Telephone number of school. NOTE: Position # 0157-0159 is the area code, and position #0160-0166 is the exchange and number.

Appendix A—Record Layout for the Common Core of Data Public Elementary/Secondary School Universe Survey: School year 2004–05
A-4
Variable Start End Field Data Name Position Position Length Type Description MSTREE04 0167 0196 30 AN The mailing address of the school— may be a street address, a P.O. Box
number, or, if verified that there is no address beyond CITY, STATE, and ZIP, the character “N.”
MCITY04 0197 0226 30 AN City name of the mailing address.
MSTATE04 0227 0228 2 AN Two-letter U.S. Postal Service abbreviation of the state where the mailing address is located (see FIPS state codes and abbreviations used in CCD dataset).
MZIP04 0229 0233 5 AN Five-digit U.S. Postal Service ZIP code for the mailing address.
MZIP404 0234 0237 4 AN If the mailing address has been assigned the additional four-digit +4 ZIP, this field contains that number; otherwise, this field is blank.
LSTREE04 0238 0267 30 AN Location address.
LCITY04 0268 0297 30 AN Location city.
LSTATE04 0298 0299 2 AN Location state (P.O. abbreviation).
LZIP04 0300 0304 5 AN Location 5-digit ZIP Code.
LZIP404 0305 0308 4 AN Location +4 ZIP code.
TYPE04 0309 0309 1 AN NCES code for type of school:
1 = Regular school 2 = Special education school 3 = Vocational school 4 = Other/alternative school
STATUS04 0310 0310 1 AN NCES code for the school status:
1 = School was operational at the time of the last report and is currently
operational. 2 = School has closed since the time of the last report. 3 = School has been opened since the time of the last report. 4 = School was operational at the time of the last report but was not on the
CCD list at that time. 5 = School was listed in previous year’s CCD school universe as being
affiliated with a different education agency. 6 = School is temporarily closed and may reopen within 3 years. 7 = School is scheduled to be operational within 2 years.
LOCALE04 0311 0311 1 AN NCES code for location of the school relative to populous areas :
1 = Large city: A principal city of a metropolitan core based statistical
area (CBSA), with the city having a population greater than or equal to 250,000.
2 = Midsize city: A principal city of a metropolitan CBSA, with the city
having a population less than 250,000.

Appendix A—Record Layout for the Common Core of Data Public Elementary/Secondary School Universe Survey: School year 2004–05
A-5
Variable Start End Field Data Name Position Position Length Type Description
3 = Urban fringe of a large city: Any incorporated place, Census-designated place, or non-place territory within a metropolitan CBSA of a large city and defined as urban by the Census Bureau.
4 = Urban fringe of a midsize city: Any incorporated place, Census-
designated place, or non-place territory within a CBSA of a midsize city and defined as urban by the Census Bureau.
5 = Large town: An incorporated place or Census-designated place with a
population greater than or equal to 25,000 and located outside a metropolitan CBSA or inside a micropolitan CBSA.
6 = Small town: An incorporated place or Census-designated place with a
population less than 25,000 and greater than or equal to 2,500 and located outside a metropolitan CBSA or inside a micropolitan CBSA.
7 = Rural, outside CBSA: Any incorporated place, Census-designated
place, or non-place territory not within a metropolitan CBSA or within a micropolitan CBSA and defined as rural by the Census Bureau.
8 = Rural, inside CBSA: Any incorporated place, Census-designated
place, or non-place territory within a metropolitan CBSA and defined as rural by the Census Bureau.
INOUT04 0312 0312 1 AN A flag indicating whether the school's physical location is located inside or
outside the city or town limits. The following codes are used:
1 = Inside the city or town limits. 2 = Outside the city or town limits.
LATCOD04 0313 0322 10 AN Latitude: The first three digits of the code represent the number of degrees
from the equator; the last six digits represent the fraction of the next degree carried out to six decimal places, with an implied decimal.
LONCOD04 0323 0332 10 AN Longitude: The first three digits of the code represent the number of degrees from the prime meridian; the last six digits represent the fraction of the next degree carried out to six decimal places, with an implied decimal.
CONUM04 0333 0337 5 AN FIPS county number. NOTE: Position #0333-0334 is the FIPS state number, and position #0335-0337 is the FIPS number for county within state.
CONAME04 0338 0367 30 AN Name of county.
FTE04 0368 0372 5* N Total full-time-equivalent classroom teachers. Full-time equivalency reported to the nearest tenth; field includes one explicit decimal.
GSLO04 0373 0374 2 AN School low grade offered. The following codes are used: UG = Ungraded PK = Prekindergarten KG = Kindergarten 01–12 = 1st through 12th grade 00 = School had no students reported

Appendix A—Record Layout for the Common Core of Data Public Elementary/Secondary School Universe Survey: School year 2004–05
A-6
Variable Start End Field Data Name Position Position Length Type Description
UG and 00 each occurs only in isolation from other codes. When one of these does occur, it is both the lowest and the highest grade.
GSHI04 0375 0376 2 AN School high grade offered. The following codes are used: UG = Ungraded PK = Prekindergarten KG = Kindergarten 01–12 = 1st through 12th grade 00 = School had no students reported UG and 00 each occurs only in isolation from other codes. When one of these does occur, it is both the lowest and the highest grade. GSLO04 and GSHI04 add up to the grade span of the school.
LEVEL04 0377 0377 1 AN School level. The following codes were calculated from the school's corresponding GSLO and GSHI values:
1 = Primary (low grade = PK through 03; high grade = PK through 08) 2 = Middle (low grade = 04 through 07; high grade = 04 through 09) 3 = High (low grade = 07 through 12; high grade = 12 only) 4 = Other (any other configuration not falling within the above three
categories, including ungraded)
TITLEI04 0378 0378 1 AN Title I Eligible School. A Title I school designated under appropriate state and federal regulations as being eligible for participation in programs authorized by Title I of Public Law 103-382.
1 = Yes 2 = No
STITLI04 0379 0379 1 AN Schoolwide Title I. A program in which all the pupils in a school are
designated under appropriate state and federal regulations as being eligible for participation in programs authorized by Title I of Public Law 103-382. 1 = Yes 2 = No
MAGNET04 0380 0380 1 AN Magnet school. Regardless of the source of funding, a magnet school or program is a special school or program designed to attract students of different racial/ethnic backgrounds for the purpose of reducing, preventing, or eliminating racial isolation and/or to provide an academic or social focus on a particular theme. 1 = Yes 2 = No
CHARTR04 0381 0381 1 AN Charter school. A school that provides free elementary and/or secondary education to eligible students under a specific charter granted by the state legislature or other appropriate authority. 1 = Yes 2 = No

Appendix A—Record Layout for the Common Core of Data Public Elementary/Secondary School Universe Survey: School year 2004–05
A-7
Variable Start End Field Data Name Position Position Length Type Description SHARED04 0382
0382 1 AN Shared-time school. A school offering vocational/technical education or
other education services, in which some or all students are enrolled at a separate “home” school and attend the shared-time school on a part-day basis. 1 = Yes 2 = No
FRELCH04 0383 0386 4 N Count of students eligible to participate in the Free Lunch Program under the National School Lunch Act.
REDLCH04 0387 0390 4 N Count of students eligible to participate in the Reduced-Price Lunch Program under the National School Lunch Act.
TOTFRL04 0391 0394 4 N Total of free lunch eligible and reduced-price lunch eligible. The total is only available if both of the details (or the total) were reported.
MIGRNT04 0395 0398 4 N Migrant students enrolled in previous year. Cumulative unduplicated (within school) number of migrant students, as defined under 34 CFR 200.40, enrolled anytime during the previous regular school year.
PK04 0399 0402 4 N Total prekindergarten students.
AMPKM04 0403 0406 4 N Prekindergarten students - American Indian/Alaska Native - male.
AMPKF04 0407 0410 4 N Prekindergarten students - American Indian/Alaska Native - female.
AMPKU04 0411 0414 4 N Prekindergarten students - American Indian/Alaska Native - gender unknown.
ASPKM04 0415 0418 4 N Prekindergarten students - Asian/Pacific Islander - male.
ASPKF04 0419 0422 4 N Prekindergarten students - Asian/Pacific Islander - female.
ASPKU04 0423 0426 4 N Prekindergarten students - Asian/Pacific Islander - gender unknown.
HIPKM04 0427 0430 4 N Prekindergarten students - Hispanic - male.
HIPKF04 0431 0434 4 N Prekindergarten students - Hispanic - female.
HIPKU04 0435 0438 4 N Prekindergarten students - Hispanic - gender unknown.
BLPKM04 0439 0442 4 N Prekindergarten students - Black, non-Hispanic - male.
BLPKF04 0443 0446 4 N Prekindergarten students - Black, non-Hispanic - female.
BLPKU04
0447
0450
4
N
Prekindergarten students - Black, non-Hispanic - gender unknown.
WHPKM04 0451 0454 4 N Prekindergarten students - White, non-Hispanic - male.
WHPKF04 0455 0458 4 N Prekindergarten students - White, non-Hispanic - female.
WHPKU04 0459 0462 4 N Prekindergarten students - White, non-Hispanic - gender unknown.
Appendix A—Record Layout for the Common Core of Data Public Elementary/Secondary School Universe Survey: School year 2004–05
A-8
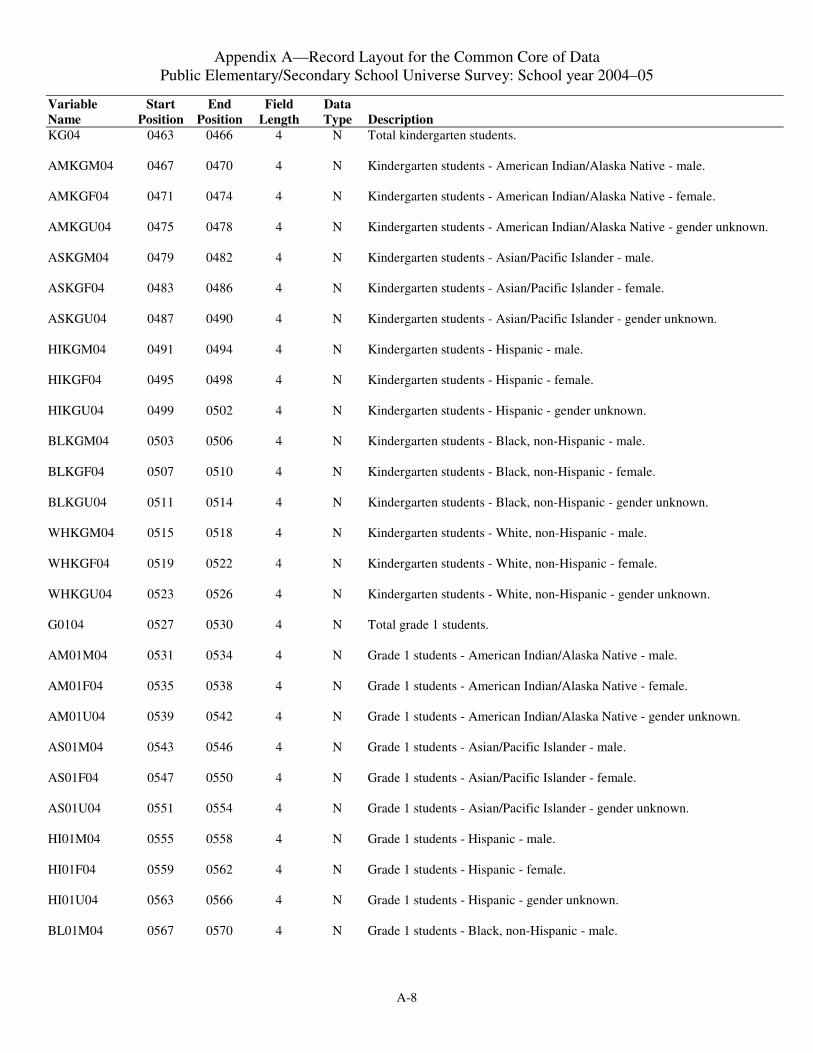
Variable Start End Field Data Name Position Position Length Type Description KG04 0463 0466 4 N Total kindergarten students.
AMKGM04 0467 0470 4 N Kindergarten students - American Indian/Alaska Native - male.
AMKGF04 0471 0474 4 N Kindergarten students - American Indian/Alaska Native - female.
AMKGU04 0475 0478 4 N Kindergarten students - American Indian/Alaska Native - gender unknown.
ASKGM04 0479 0482 4 N Kindergarten students - Asian/Pacific Islander - male.
ASKGF04 0483 0486 4 N Kindergarten students - Asian/Pacific Islander - female.
ASKGU04 0487 0490 4 N Kindergarten students - Asian/Pacific Islander - gender unknown.
HIKGM04 0491 0494 4 N Kindergarten students - Hispanic - male.
HIKGF04 0495 0498 4 N Kindergarten students - Hispanic - female.
HIKGU04 0499 0502 4 N Kindergarten students - Hispanic - gender unknown.
BLKGM04 0503 0506 4 N Kindergarten students - Black, non-Hispanic - male.
BLKGF04 0507 0510 4 N Kindergarten students - Black, non-Hispanic - female.
BLKGU04 0511 0514 4 N Kindergarten students - Black, non-Hispanic - gender unknown.
WHKGM04 0515 0518 4 N Kindergarten students - White, non-Hispanic - male.
WHKGF04 0519 0522 4 N Kindergarten students - White, non-Hispanic - female.
WHKGU04 0523 0526 4 N Kindergarten students - White, non-Hispanic - gender unknown.
G0104 0527 0530 4 N Total grade 1 students.
AM01M04 0531 0534 4 N Grade 1 students - American Indian/Alaska Native - male.
AM01F04 0535 0538 4 N Grade 1 students - American Indian/Alaska Native - female.
AM01U04 0539 0542 4 N Grade 1 students - American Indian/Alaska Native - gender unknown.
AS01M04 0543 0546 4 N Grade 1 students - Asian/Pacific Islander - male.
AS01F04 0547 0550 4 N Grade 1 students - Asian/Pacific Islander - female.
AS01U04 0551 0554 4 N Grade 1 students - Asian/Pacific Islander - gender unknown.
HI01M04 0555 0558 4 N Grade 1 students - Hispanic - male.
HI01F04 0559 0562 4 N Grade 1 students - Hispanic - female.
HI01U04 0563 0566 4 N Grade 1 students - Hispanic - gender unknown.
BL01M04 0567 0570 4 N Grade 1 students - Black, non-Hispanic - male.

Appendix A—Record Layout for the Common Core of Data Public Elementary/Secondary School Universe Survey: School year 2004–05
A-9
Variable Start End Field Data Name Position Position Length Type Description BL01F04 0571 0574 4 N Grade 1 students - Black, non-Hispanic - female.
BL01U04 0575 0578 4 N Grade 1 students - Black, non-Hispanic - gender unknown.
WH01M04 0579 0582 4 N Grade 1 students - White, non-Hispanic - male.
WH01F04 0583 0586 4 N Grade 1 students - White, non-Hispanic - female.
WH01U04 0587 0590 4 N Grade 1 students - White, non-Hispanic - gender unknown.
G0204 0591 0594 4 N Total grade 2 students.
AM02M04 0595 0598 4 N Grade 2 students - American Indian/Alaska Native - male.
AM02F04 0599 0602 4 N Grade 2 students - American Indian/Alaska Native - female.
AM02U04 0603 0606 4 N Grade 2 students - American Indian/Alaska Native - gender unknown.
AS02M04 0607 0610 4 N Grade 2 students - Asian/Pacific Islander - male.
AS02F04 0611 0614 4 N Grade 2 students - Asian/Pacific Islander - female.
AS02U04 0615 0618 4 N Grade 2 students - Asian/Pacific Islander - gender unknown.
HI02M04 0619 0622 4 N Grade 2 students - Hispanic - male.
HI02F04 0623 0626 4 N Grade 2 students - Hispanic - female.
HI02U04 0627 0630 4 N Grade 2 students - Hispanic - gender unknown.
BL02M04 0631 0634 4 N Grade 2 students - Black, non-Hispanic - male.
BL02F04 0635 0638 4 N Grade 2 students - Black, non-Hispanic - female.
BL02U04 0639 0642 4 N Grade 2 students - Black, non-Hispanic - gender unknown.
WH02M04 0643 0646 4 N Grade 2 students - White, non-Hispanic - male.
WH02F04 0647 0650 4 N Grade 2 students - White, non-Hispanic - female.
WH02U04 0651 0654 4 N Grade 2 students - White, non-Hispanic - gender unknown.
G0304 0655 0658 4 N Total grade 3 students.
AM03M04 0659 0662 4 N Grade 3 students - American Indian/Alaska Native - male.
AM03F04 0663 0666 4 N Grade 3 students - American Indian/Alaska Native - female.
AM03U04 0667 0670 4 N Grade 3 students - American Indian/Alaska Native - gender unknown.
AS03M04 0671 0674 4 N Grade 3 students - Asian/Pacific Islander - male.
AS03F04 0675 0678 4 N Grade 3 students - Asian/Pacific Islander - female.
Appendix A—Record Layout for the Common Core of Data Public Elementary/Secondary School Universe Survey: School year 2004–05
A-10
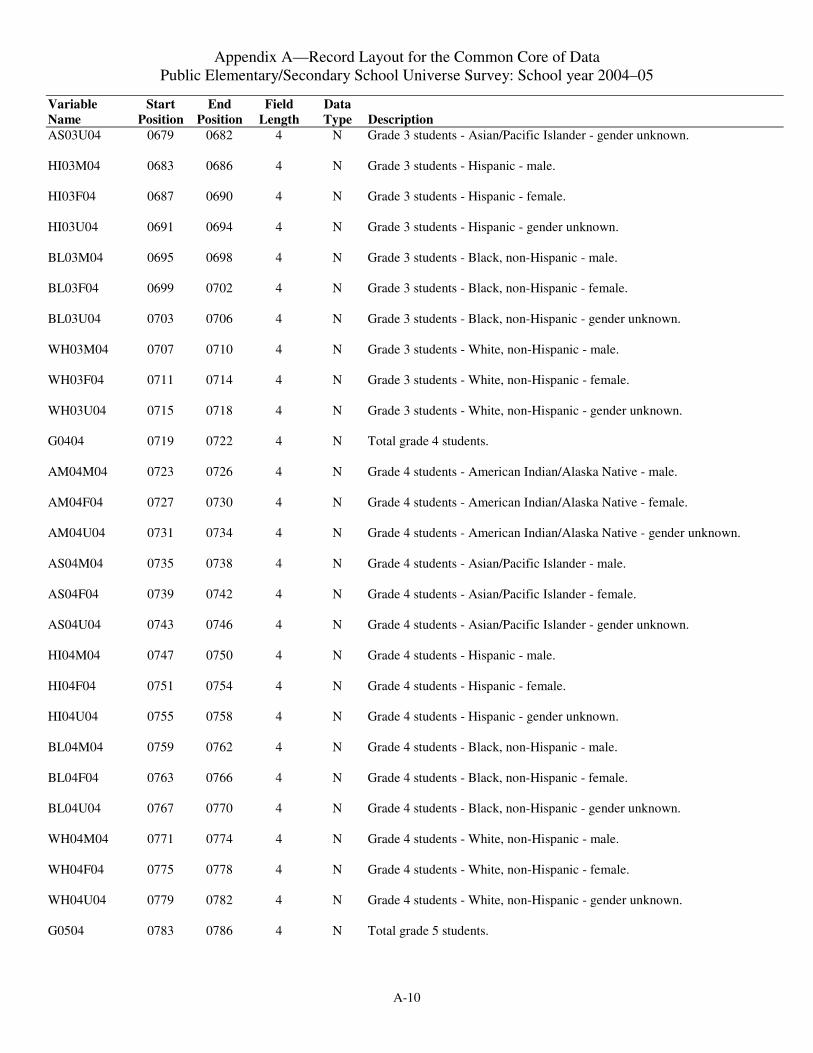
Variable Start End Field Data Name Position Position Length Type Description AS03U04 0679 0682 4 N Grade 3 students - Asian/Pacific Islander - gender unknown.
HI03M04 0683 0686 4 N Grade 3 students - Hispanic - male.
HI03F04 0687 0690 4 N Grade 3 students - Hispanic - female.
HI03U04 0691 0694 4 N Grade 3 students - Hispanic - gender unknown.
BL03M04 0695 0698 4 N Grade 3 students - Black, non-Hispanic - male.
BL03F04 0699 0702 4 N Grade 3 students - Black, non-Hispanic - female.
BL03U04 0703 0706 4 N Grade 3 students - Black, non-Hispanic - gender unknown.
WH03M04 0707 0710 4 N Grade 3 students - White, non-Hispanic - male.
WH03F04 0711 0714 4 N Grade 3 students - White, non-Hispanic - female.
WH03U04 0715 0718 4 N Grade 3 students - White, non-Hispanic - gender unknown.
G0404 0719 0722 4 N Total grade 4 students.
AM04M04 0723 0726 4 N Grade 4 students - American Indian/Alaska Native - male.
AM04F04 0727 0730 4 N Grade 4 students - American Indian/Alaska Native - female.
AM04U04 0731 0734 4 N Grade 4 students - American Indian/Alaska Native - gender unknown.
AS04M04 0735 0738 4 N Grade 4 students - Asian/Pacific Islander - male.
AS04F04 0739 0742 4 N Grade 4 students - Asian/Pacific Islander - female.
AS04U04 0743 0746 4 N Grade 4 students - Asian/Pacific Islander - gender unknown.
HI04M04 0747 0750 4 N Grade 4 students - Hispanic - male.
HI04F04 0751 0754 4 N Grade 4 students - Hispanic - female.
HI04U04 0755 0758 4 N Grade 4 students - Hispanic - gender unknown.
BL04M04 0759 0762 4 N Grade 4 students - Black, non-Hispanic - male.
BL04F04 0763 0766 4 N Grade 4 students - Black, non-Hispanic - female.
BL04U04 0767 0770 4 N Grade 4 students - Black, non-Hispanic - gender unknown.
WH04M04 0771 0774 4 N Grade 4 students - White, non-Hispanic - male.
WH04F04 0775 0778 4 N Grade 4 students - White, non-Hispanic - female.
WH04U04 0779 0782 4 N Grade 4 students - White, non-Hispanic - gender unknown.
G0504 0783 0786 4 N Total grade 5 students.

Appendix A—Record Layout for the Common Core of Data Public Elementary/Secondary School Universe Survey: School year 2004–05
A-11
Variable Start End Field Data Name Position Position Length Type Description AM05M04 0787 0790 4 N Grade 5 students - American Indian/Alaska Native - male.
AM05F04 0791 0794 4 N Grade 5 students - American Indian/Alaska Native - female.
AM05U04 0795 0798 4 N Grade 5 students - American Indian/Alaska Native - gender unknown.
AS05M04 0799 0802 4 N Grade 5 students - Asian/Pacific Islander - male.
AS05F04 0803 0806 4 N Grade 5 students - Asian/Pacific Islander - female.
AS05U04 0807 0810 4 N Grade 5 students - Asian/Pacific Islander - gender unknown.
HI05M04 0811 0814 4 N Grade 5 students - Hispanic - male.
HI05F04 0815 0818 4 N Grade 5 students - Hispanic - female.
HI05U04 0819 0822 4 N Grade 5 students - Hispanic - gender unknown.
BL05M04 0823 0826 4 N Grade 5 students - Black, non-Hispanic - male.
BL05F04 0827 0830 4 N Grade 5 students - Black, non-Hispanic - female.
BL05U04 0831 0834 4 N Grade 5 students - Black, non-Hispanic - gender unknown.
WH05M04 0835 0838 4 N Grade 5 students - White, non-Hispanic - male.
WH05F04 0839 0842 4 N Grade 5 students - White, non-Hispanic - female.
WH05U04 0843 0846 4 N Grade 5 students - White, non-Hispanic - gender unknown.
G0604 0847 0850 4 N Total grade 6 students.
AM06M04 0851 0854 4 N Grade 6 students - American Indian/Alaska Native - male.
AM06F04 0855 0858 4 N Grade 6 students - American Indian/Alaska Native - female.
AM06U04 0859 0862 4 N Grade 6 students - American Indian/Alaska Native - gender unknown.
AS06M04 0863 0866 4 N Grade 6 students - Asian/Pacific Islander - male.
AS06F04 0867 0870 4 N Grade 6 students - Asian/Pacific Islander - female.
AS06U04 0871 0874 4 N Grade 6 students - Asian/Pacific Islander - gender unknown.
HI06M04 0875 0877 4 N Grade 6 students - Hispanic - male.
HI06F04 0879 0882 4 N Grade 6 students - Hispanic - female.
HI06U04 0883 0886 4 N Grade 6 students - Hispanic - gender unknown.
BL06M04 0887 0890 4 N Grade 6 students - Black, non-Hispanic - male.
BL06F04 0891 0894 4 N Grade 6 students - Black, non-Hispanic - female.

Appendix A—Record Layout for the Common Core of Data Public Elementary/Secondary School Universe Survey: School year 2004–05
A-12
Variable Start End Field Data Name Position Position Length Type Description BL06U04 0895 0898 4 N Grade 6 students - Black, non-Hispanic - gender unknown.
WH06M04 0899 0902 4 N Grade 6 students - White, non-Hispanic - male.
WH06F04 0903 0906 4 N Grade 6 students - White, non-Hispanic - female.
WH06U04 0907 0910 4 N Grade 6 students - White, non-Hispanic - gender unknown.
G0704 0911 0914 4 N Total grade 7 students.
AM07M04 0915 0918 4 N Grade 7 students - American Indian/Alaska Native - male.
AM07F04 0919 0922 4 N Grade 7 students - American Indian/Alaska Native - female.
AM07U04 0923 0926 4 N Grade 7 students - American Indian/Alaska Native - gender unknown.
AS07M04 0927 0930 4 N Grade 7 students - Asian/Pacific Islander - male.
AS07F04 0931 0934 4 N Grade 7 students - Asian/Pacific Islander - female.
AS07U04 0935 0938 4 N Grade 7 students - Asian/Pacific Islander - gender unknown.
HI07M04 0939 0942 4 N Grade 7 students - Hispanic - male.
HI07F04 0943 0946 4 N Grade 7 students - Hispanic - female.
HI07U04 0947 0950 4 N Grade 7 students - Hispanic - gender unknown.
BL07M04 0951 0954 4 N Grade 7 students - Black, non-Hispanic - male.
BL07F04 0955 0958 4 N Grade 7 students - Black, non-Hispanic - female.
BL07U04 0959 0962 4 N Grade 7 students - Black, non-Hispanic - gender unknown.
WH07M04 0963 0966 4 N Grade 7 students - White, non-Hispanic - male.
WH07F04 0967 0970 4 N Grade 7 students - White, non-Hispanic - female.
WH07U04 0971 0974 4 N Grade 7 students - White, non-Hispanic - gender unknown.
G0804 0975 0978 4 N Total grade 8 students.
AM08M04 0979 0982 4 N Grade 8 students - American Indian/Alaska Native - male.
AM08F04 0983 0986 4 N Grade 8 students - American Indian/Alaska Native - female.
AM08U04 0987 0990 4 N Grade 8 students - American Indian/Alaska Native - gender unknown.
AS08M04 0991 0994 4 N Grade 8 students - Asian/Pacific Islander - male.
AS08F04 0995 0998 4 N Grade 8 students - Asian/Pacific Islander - female.
AS08U04 0999 1002 4 N Grade 8 students - Asian/Pacific Islander - gender unknown.

Appendix A—Record Layout for the Common Core of Data Public Elementary/Secondary School Universe Survey: School year 2004–05
A-13
Variable Start End Field Data Name Position Position Length Type Description HI08M04 1003 1006 4 N Grade 8 students - Hispanic - male.
HI08F04 1007 1010 4 N Grade 8 students - Hispanic - female.
HI08U04 1011 1014 4 N Grade 8 students - Hispanic - gender unknown.
BL08M04 1015 1018 4 N Grade 8 students - Black, non-Hispanic - male.
BL08F04 1019 1022 4 N Grade 8 students - Black, non-Hispanic - female.
BL08U04 1023 1026 4 N Grade 8 students - Black, non-Hispanic - gender unknown.
WH08M04 1027 1030 4 N Grade 8 students - White, non-Hispanic - male.
WH08F04 1031 1034 4 N Grade 8 students - White, non-Hispanic - female.
WH08U04 1035 1038 4 N Grade 8 students - White, non-Hispanic - gender unknown.
G0904 1039 1042 4 N Total grade 9 students.
AM09M04 1043 1046 4 N Grade 9 students - American Indian/Alaska Native - male.
AM09F04 1047 1050 4 N Grade 9 students - American Indian/Alaska Native - female.
AM09U04 1051 1054 4 N Grade 9 students - American Indian/Alaska Native - gender unknown.
AS09M04 1055 1058 4 N Grade 9 students - Asian/Pacific Islander - male.
AS09F04 1059 1062 4 N Grade 9 students - Asian/Pacific Islander - female.
AS09U04 1063 1066 4 N Grade 9 students - Asian/Pacific Islander - gender unknown.
HI09M04 1067 1070 4 N Grade 9 students - Hispanic - male.
HI09F04 1071 1074 4 N Grade 9 students - Hispanic - female.
HI09U04 1075 1078 4 N Grade 9 students - Hispanic - gender unknown.
BL09M04 1079 1082 4 N Grade 9 students - Black, non-Hispanic - male.
BL09F04 1083 1086 4 N Grade 9 students - Black, non-Hispanic - female.
BL09U04 1087 1090 4 N Grade 9 students - Black, non-Hispanic - gender unknown.
WH09M04 1091 1094 4 N Grade 9 students - White, non-Hispanic - male.
WH09F04 1095 1098 4 N Grade 9 students - White, non-Hispanic - female.
WH09U04 1099 1102 4 N Grade 9 students - White, non-Hispanic - gender unknown.
G1004 1103 1106 4 N Total grade 10 students.
AM10M04 1107 1110 4 N Grade 10 students - American Indian/Alaska Native - male.

Appendix A—Record Layout for the Common Core of Data Public Elementary/Secondary School Universe Survey: School year 2004–05
A-14
Variable Start End Field Data Name Position Position Length Type Description AM10F04 1111 1114 4 N Grade 10 students - American Indian/Alaska Native - female.
AM10U04 1115 1118 4 N Grade 10 students - American Indian/Alaska Native - gender unknown.
AS10M04 1119 1122 4 N Grade 10 students - Asian/Pacific Islander - male.
AS10F04 1123 1126 4 N Grade 10 students - Asian/Pacific Islander - female.
AS10U04 1127 1130 4 N Grade 10 students - Asian/Pacific Islander - gender unknown.
HI10M04 1131 1134 4 N Grade 10 students - Hispanic - male.
HI10F04 1135 1138 4 N Grade 10 students - Hispanic - female.
HI10U04 1139 1142 4 N Grade 10 students - Hispanic - gender unknown.
BL10M04 1143 1146 4 N Grade 10 students - Black, non-Hispanic - male.
BL10F04 1147 1150 4 N Grade 10 students - Black, non-Hispanic - female.
BL10U04 1151 1154 4 N Grade 10 students - Black, non-Hispanic - gender unknown.
WH10M04 1155 1158 4 N Grade 10 students - White, non-Hispanic - male.
WH10F04 1159 1162 4 N Grade 10 students - White, non-Hispanic - female.
WH10U04 1163 1166 4 N Grade 10 students - White, non-Hispanic - gender unknown.
G1104 1167 1170 4 N Total grade 11 students.
AM11M04 1171 1174 4 N Grade 11 students - American Indian/Alaska Native - male.
AM11F04 1175 1178 4 N Grade 11 students - American Indian/Alaska Native - female.
AM11U04 1179 1182 4 N Grade 11 students - American Indian/Alaska Native - gender unknown.
AS11M04 1183 1186 4 N Grade 11 students - Asian/Pacific Islander - male.
AS11F04 1187 1190 4 N Grade 11 students - Asian/Pacific Islander - female.
AS11U04 1191 1194 4 N Grade 11 students - Asian/Pacific Islander - gender unknown.
HI11M04 1195 1198 4 N Grade 11 students - Hispanic - male.
HI11F04 1199 1202 4 N Grade 11 students - Hispanic - female.
HI11U04 1203 1206 4 N Grade 11 students - Hispanic - gender unknown.
BL11M04 1207 1210 4 N Grade 11 students - Black, non-Hispanic - male.
BL11F04 1211 1214 4 N Grade 11 students - Black, non-Hispanic - female.
BL11U04 1215 1218 4 N Grade 11 students - Black, non-Hispanic - gender unknown.

Appendix A—Record Layout for the Common Core of Data Public Elementary/Secondary School Universe Survey: School year 2004–05
A-15
Variable Start End Field Data Name Position Position Length Type Description WH11M04 1219 1222 4 N Grade 11 students - White, non-Hispanic - male.
WH11F04 1223 1226 4 N Grade 11 students - White, non-Hispanic - female.
WH11U04 1227 1230 4 N Grade 11 students - White, non-Hispanic - gender unknown.
G1204 1231 1234 4 N Total grade 12 students.
AM12M04 1235 1238 4 N Grade 12 students - American Indian/Alaska Native - male.
AM12F04 1239 1242 4 N Grade 12 students - American Indian/Alaska Native - female.
AM12U04 1243 1245 4 N Grade 12 students - American Indian/Alaska Native - gender unknown.
AS12M04 1247 1250 4 N Grade 12 students - Asian/Pacific Islander - male.
AS12F04 1251 1254 4 N Grade 12 students - Asian/Pacific Islander - female.
AS12U04 1255 1258 4 N Grade 12 students - Asian/Pacific Islander - gender unknown.
HI12M04 1259 1262 4 N Grade 12 students - Hispanic - male.
HI12F04 1263 1266 4 N Grade 12 students - Hispanic - female.
HI12U04 1267 1270 4 N Grade 12 students - Hispanic - gender unknown.
BL12M04 1271 1274 4 N Grade 12 students - Black, non-Hispanic - male.
BL12F04 1275 1278 4 N Grade 12 students - Black, non-Hispanic - female.
BL12U04 1279 1282 4 N Grade 12 students - Black, non-Hispanic - gender unknown.
WH12M04 1283 1286 4 N Grade 12 students - White, non-Hispanic - male.
WH12F04 1287 1290 4 N Grade 12 students - White, non-Hispanic - female.
WH12U04 1291 1294 4 N Grade 12 students - White, non-Hispanic - gender unknown.
UG04 1295 1298 4 N Total ungraded students.
AMUGM04 1299 1302 4 N Ungraded students - American Indian/Alaska Native - male.
AMUGF04 1303 1306 4 N Ungraded students - American Indian/Alaska Native - female.
AMUGU04 1307 1310 4 N Ungraded students - American Indian/Alaska Native - gender unknown.
ASUGM04 1311 1314 4 N Ungraded students - Asian/Pacific Islander - male.
ASUGF04 1315 1318 4 N Ungraded students - Asian/Pacific Islander - female.
ASUGU04 1319 1322 4 N Ungraded students - Asian/Pacific Islander - gender unknown.
HIUGM04 1323 1326 4 N Ungraded students - Hispanic - male.

Appendix A—Record Layout for the Common Core of Data Public Elementary/Secondary School Universe Survey: School year 2004–05
A-16
Variable Start End Field Data Name Position Position Length Type Description HIUGF04 1327 1330 4 N Ungraded students - Hispanic - female.
HIUGU04 1331 1334 4 N Ungraded students - Hispanic - gender unknown.
BLUGM04 1335 1338 4 N Ungraded students - Black, non-Hispanic - male.
BLUGF04 1339 1342 4 N Ungraded students - Black, non-Hispanic - female.
BLUGU04 1343 1346 4 N Ungraded students - Black, non-Hispanic - gender unknown.
WHUGM04 1347 1350 4 N Ungraded students - White, non-Hispanic - male.
WHUGF04 1351 1354 4 N Ungraded students - White, non-Hispanic - female.
WHUGU04 1355 1358 4 N Ungraded students - White, non-Hispanic - gender unknown.
MEMBER04 1359 1362 4 N Total students, all grades: The reported total membership of the school.
AM04 1363 1366 4 N American Indian/Alaska Native students. If not reported, this field was
calculated by summing the AMALM04, AMALF04, and AMALU04 fields.
AMALM04 1367 1370 4 N Total students, all grades - American Indian/Alaska Native - male.
AMALF04 1371 1374 4 N Total students, all grades - American Indian/Alaska Native - female.
AMALU04 1375 1378 4 N Total students, all grades - American Indian/Alaska Native - gender unknown.
ASIAN04 1379 1382 4 N Asian/Pacific Islander students. If not reported, this field was calculated by summing the ASALM04, ASALF04, and ASALU04 fields.
ASALM04 1383 1386 4 N Total students, all grades - Asian/Pacific Islander - male.
ASALF04 1387 1390 4 N Total students, all grades - Asian/Pacific Islander - female.
ASALU04 1391 1394 4 N Total students, all grades - Asian/Pacific Islander - gender unknown.
HISP04 1395 1398 4 N Hispanic students. If not reported, this field was calculated by summing the HIALM04, HIALF04, and HIALU04 fields.
HIALM04 1399 1402 4 N Total students, all grades - Hispanic - male.
HIALF04 1403 1406 4 N Total students, all grades - Hispanic - female.
HIALU04 1407 1410 4 N Total students, all grades - Hispanic - gender unknown.
BLACK04 1411 1414 4 N Black, non-Hispanic students. If not reported, this field was calculated by summing the BLALM04, BLALF04, and BLALU04 fields.
BLALM04 1415 1418 4 N Total students, all grades - Black, non-Hispanic - male.
BLALF04 1419 1422 4 N Total students, all grades - Black, non-Hispanic - female.
BLALU04 1423 1426 4 N Total students, all grades - Black, non-Hispanic - gender unknown.

Appendix A—Record Layout for the Common Core of Data Public Elementary/Secondary School Universe Survey: School year 2004–05
A-17
Variable Start End Field Data Name Position Position Length Type Description WHITE04 1427 1430 4 N White, non-Hispanic students. If not reported, this field was calculated by
summing the WHALM04, WHALF04, and WHALU04 fields.
WHALM04 1431 1434 4 N Total students, all grades - White, non-Hispanic - male.
WHALF04 1435 1438 4 N Total students, all grades - White, non-Hispanic - female.
WHALU04 1439 1442 4 N Total students, all grades - White, non-Hispanic - gender unknown.
TOTETH04 1443 1446 4 N Calculated school race/ethnicity membership: The sum of the fields AM04, ASIAN04, HISP04, BLACK04, and WHITE04. Students belonging to an unknown or non-CCD race category are not captured in this field.
PUPTCH04 1447 1452 6* N Calculated pupil/teacher ratio: Total reported students (MEMBER04) divided by FTE classroom teachers (FTE04). Reported to the nearest tenth; field includes one explicit decimal.
TOTGRD04 1453 1456 4 N Calculated school membership: The sum of reported grade totals. If one of the grade totals is missing, then TOTGRD04 is missing.
ILOCAL04 1457 1457 1 AN If the field contains an “O,” the old methodology was used to determine locale code. If the field contains a “W,” the new methodology was used to determine locale code.
IFTE04 1458 1458 1 AN If the field contains anything other than “R,” the total classroom teachers count originally submitted was adjusted.
IGSLO04 1459 1459 1 AN If this field contains anything other than “R,” the GSLO value originally submitted was adjusted.
IGSHI04 1460 1460 1 AN If this field contains anything other than “R,” the GSHI value originally submitted was adjusted.
ITITLI04 1461 1461 1 AN If the field contains anything other than “R,” the Title I eligible value originally submitted was adjusted.
ISTITL04 1462 1462 1 AN If the field contains anything other than “R,” the schoolwide Title I value originally submitted was adjusted.
IMAGNE04 1463 1463 1 AN If the field contains anything other than “R,” the magnet school value originally submitted was adjusted.
ICHART04 1464 1464 1 AN If the field contains anything other than “R,” the charter school value originally submitted was adjusted.
ISHARE04 1465 1465 1 AN If the field contains anything other than “R,” the shared-time school value originally submitted was adjusted.
IFRELC04 1466 1466 1 AN If the field contains anything other than “R,” the students eligible for free lunch count originally submitted was adjusted.
IREDLC04 1467 1467 1 AN If the field contains anything other than “R,” the students eligible for reduced-price lunch count originally submitted was adjusted.

Appendix A—Record Layout for the Common Core of Data Public Elementary/Secondary School Universe Survey: School year 2004–05
A-18
Variable Start End Field Data Name Position Position Length Type Description ITOTFR04 1468 1468 1 AN If the field contains anything other than “R,” the total of free lunch eligible
and reduced-price lunch eligible count originally submitted was adjusted.
IMIGRN04 1469 1469 1 AN If the field contains anything other than “R,” the migrant students enrolled in previous year count originally submitted was adjusted.
IPK04 1470 1470 1 AN If the field contains anything other than “R,” the total prekindergarten students count originally submitted was adjusted.
IAMPKM04 1471 1471 1 AN If the field contains anything other than “R,” the prekindergarten students - American Indian/Alaska Native - male count originally submitted was adjusted.
IAMPKF04 1472 1472 1 AN If the field contains anything other than “R,” the prekindergarten students - American Indian/Alaska Native - female count originally submitted was adjusted.
IAMPKU04 1473 1473 1 AN If the field contains anything other than “R,” the prekindergarten students - American Indian/Alaska Native - gender unknown count originally submitted was adjusted.
IASPKM04 1474 1474 1 AN If the field contains anything other than “R,” the prekindergarten students - Asian/Pacific Islander - male count originally submitted was adjusted.
IASPKF04 1475 1475 1 AN If the field contains anything other than “R,” the prekindergarten students - Asian/Pacific Islander - female count originally submitted was adjusted.
IASPKU04 1476 1476 1 AN If the field contains anything other than “R,” the prekindergarten students - Asian/Pacific Islander - gender unknown count originally submitted was adjusted.
IHIPKM04 1477 1477 1 AN If the field contains anything other than “R,” the prekindergarten students - Hispanic - male count originally submitted was adjusted.
IHIPKF04 1478 1478 1 AN If the field contains anything other than “R,” the prekindergarten students - Hispanic - female count originally submitted was adjusted.
IHIPKU04 1479 1479 1 AN If the field contains anything other than “R,” the prekindergarten students - Hispanic - gender unknown count originally submitted was adjusted.
IBLPKM04 1480 1480 1 AN If the field contains anything other than “R,” the prekindergarten students - Black, non-Hispanic - male count originally submitted was adjusted.
IBLPKF04 1481 1481 1 AN If the field contains anything other than “R,” the prekindergarten students - Black, non-Hispanic - female count originally submitted was adjusted.
IBLPKU04 1482 1482 1 AN If the field contains anything other than “R,” the prekindergarten students - Black, non-Hispanic - gender unknown count originally submitted was adjusted.
IWHPKM04 1483 1483 1 AN If the field contains anything other than “R,” the prekindergarten students - White, non-Hispanic - male count originally submitted was adjusted.

Appendix A—Record Layout for the Common Core of Data Public Elementary/Secondary School Universe Survey: School year 2004–05
A-19
Variable Start End Field Data Name Position Position Length Type Description IWHPKF04 1484 1484 1 AN If the field contains anything other than “R,” the prekindergarten students -
White, non-Hispanic - female count originally submitted was adjusted.
IWHPKU04 1485 1485 1 AN If the field contains anything other than “R,” the prekindergarten students - White, non-Hispanic - gender unknown count originally submitted was adjusted.
IKG04 1486 1486 1 AN If the field contains anything other than “R,” the total kindergarten students count originally submitted was adjusted.
IAMKGM04 1487 1487 1 AN If the field contains anything other than “R,” the kindergarten students - American Indian/Alaska Native - male count originally submitted was adjusted.
IAMKGF04 1488 1488 1 AN If the field contains anything other than “R,” the kindergarten students - American Indian/Alaska Native - female count originally submitted was adjusted.
IAMKGU04 1489 1489 1 AN If the field contains anything other than “R,” the kindergarten students - American Indian/Alaska Native - gender unknown count originally submitted was adjusted.
IASKGM04 1490 1490 1 AN If the field contains anything other than “R,” the kindergarten students - Asian/Pacific Islander - male count originally submitted was adjusted.
IASKGF04 1491 1491 1 AN If the field contains anything other than “R,” the kindergarten students - Asian/Pacific Islander - female count originally submitted was adjusted.
IASKGU04 1492 1492 1 AN If the field contains anything other than “R,” the kindergarten students - Asian/Pacific Islander - gender unknown count originally submitted was adjusted.
IHIKGM04 1493 1493 1 AN If the field contains anything other than “R,” the kindergarten students - Hispanic - male count originally submitted was adjusted.
IHIKGF04 1494 1494 1 AN If the field contains anything other than “R,” the kindergarten students - Hispanic - female count originally submitted was adjusted.
IHIKGU04 1495 1495 1 AN If the field contains anything other than “R,” the kindergarten students - Hispanic - gender unknown count originally submitted was adjusted.
IBLKGM04 1496 1496 1 AN If the field contains anything other than “R,” the kindergarten students - Black, non-Hispanic - male count originally submitted was adjusted.
IBLKGF04 1497 1497 1 AN If the field contains anything other than “R,” the kindergarten students - Black, non-Hispanic - female count originally submitted was adjusted.
IBLKGU04 1498 1498 1 AN If the field contains anything other than “R,” the kindergarten students - Black, non-Hispanic - gender unknown count originally submitted was adjusted.
IWHKGM04 1499 1499 1 AN If the field contains anything other than “R,” the kindergarten students - White, non-Hispanic - male count originally submitted was adjusted.

Appendix A—Record Layout for the Common Core of Data Public Elementary/Secondary School Universe Survey: School year 2004–05
A-20
Variable Start End Field Data Name Position Position Length Type Description IWHKGF04 1500 1500 1 AN If the field contains anything other than “R,” the kindergarten students -
White, non-Hispanic - female count originally submitted was adjusted.
IWHKGU04 1501 1501 1 AN If the field contains anything other than “R,” the kindergarten students - White, non-Hispanic - gender unknown count originally submitted was adjusted.
IG0104 1502 1502 1 AN If the field contains anything other than “R,” the total grade 1 students count originally submitted was adjusted.
IAM01M04 1503 1503 1 AN If the field contains anything other than “R,” the grade 1 students - American Indian/Alaska Native - male count originally submitted was adjusted.
IAM01F04 1504 1504 1 AN If the field contains anything other than “R,” the grade 1 students - American Indian/Alaska Native - female count originally submitted was adjusted.
IAM01U04 1505 1505 1 AN If the field contains anything other than “R,” the grade 1 students - American Indian/Alaska Native - gender unknown count originally submitted was adjusted.
IAS01M04 1506 1506 1 AN If the field contains anything other than “R,” the grade 1 students - Asian/Pacific Islander - male count originally submitted was adjusted.
IAS01F04 1507 1507 1 AN If the field contains anything other than “R,” the grade 1 students - Asian/Pacific Islander - female count originally submitted was adjusted.
IAS01U04 1508 1508 1 AN If the field contains anything other than “R,” the grade 1 students - Asian/Pacific Islander - gender unknown count originally submitted was adjusted.
IHI01M04 1509 1509 1 AN If the field contains anything other than “R,” the grade 1 students - Hispanic -male count originally submitted was adjusted.
IHI01F04 1510 1510 1 AN If the field contains anything other than “R,” the grade 1 students - Hispanic -female count originally submitted was adjusted.
IHI01U04 1511 1511 1 AN If the field contains anything other than “R,” the grade 1 students - Hispanic -gender unknown count originally submitted was adjusted.
IBL01M04 1512 1512 1 AN If the field contains anything other than “R,” the grade 1 students - Black, non-Hispanic - male count originally submitted was adjusted.
IBL01F04 1513 1513 1 AN If the field contains anything other than “R,” the grade 1 students - Black, non-Hispanic - female count originally submitted was adjusted.
IBL01U04 1514 1514 1 AN If the field contains anything other than “R,” the grade 1 students - Black, non-Hispanic - gender unknown count originally submitted was adjusted.
IWH01M04 1515 1515 1 AN If the field contains anything other than “R,” the grade 1 students - White, non-Hispanic - male count originally submitted was adjusted.
IWH01F04 1516 1516 1 AN If the field contains anything other than “R,” the grade 1 students - White, non-Hispanic - female count originally submitted was adjusted.

Appendix A—Record Layout for the Common Core of Data Public Elementary/Secondary School Universe Survey: School year 2004–05
A-21
Variable Start End Field Data Name Position Position Length Type Description IWH01U04 1517 1517 1 AN If the field contains anything other than “R,” the grade 1 students - White,
non-Hispanic - gender unknown count originally submitted was adjusted.
IG0204 1518 1518 1 AN If the field contains anything other than “R,” the total grade 2 students count originally submitted was adjusted.
IAM02M04 1519 1519 1 AN If the field contains anything other than “R,” the grade 2 students - American Indian/Alaska Native - male count originally submitted was adjusted.
IAM02F04 1520 1520 1 AN If the field contains anything other than “R,” the grade 2 students - American Indian/Alaska Native - female count originally submitted was adjusted.
IAM02U04 1521 1521 1 AN If the field contains anything other than “R,” the grade 2 students - American Indian/Alaska Native - gender unknown count originally submitted was adjusted.
IAS02M04 1522 1522 1 AN If the field contains anything other than “R,” the grade 2 students - Asian/Pacific Islander - male count originally submitted was adjusted.
IAS02F04 1523 1523 1 AN If the field contains anything other than “R,” the grade 2 students - Asian/Pacific Islander - female count originally submitted was adjusted.
IAS02U04 1524 1524 1 AN If the field contains anything other than “R,” the grade 2 students - Asian/Pacific Islander - gender unknown count originally submitted was adjusted.
IHI02M04 1525 1525 1 AN If the field contains anything other than “R,” the grade 2 students - Hispanic -male count originally submitted was adjusted.
IHI02F04 1526 1526 1 AN If the field contains anything other than “R,” the grade 2 students - Hispanic -female count originally submitted was adjusted.
IHI02U04 1527 1527 1 AN If the field contains anything other than “R,” the grade 2 students - Hispanic -gender unknown count originally submitted was adjusted.
IBL02M04 1528 1528 1 AN If the field contains anything other than “R,” the grade 2 students - Black, non-Hispanic - male count originally submitted was adjusted.
IBL02F04 1529 1529 1 AN If the field contains anything other than “R,” the grade 2 students - Black, non-Hispanic - female count originally submitted was adjusted.
IBL02U04 1530 1530 1 AN If the field contains anything other than “R,” the grade 2 students - Black, non-Hispanic - gender unknown count originally submitted was adjusted.
IWH02M04 1531 1531 1 AN If the field contains anything other than “R,” the grade 2 students - White, non-Hispanic - male count originally submitted was adjusted.
IWH02F04 1532 1532 1 AN If the field contains anything other than “R,” the grade 2 students - White, non-Hispanic - female count originally submitted was adjusted.
IWH02U04 1533 1533 1 AN If the field contains anything other than “R,” the grade 2 students - White, non-Hispanic - gender unknown count originally submitted was adjusted.

Appendix A—Record Layout for the Common Core of Data Public Elementary/Secondary School Universe Survey: School year 2004–05
A-22
Variable Start End Field Data Name Position Position Length Type Description IG0304 1534 1534 1 AN If the field contains anything other than “R,” the total grade 3 students count
originally submitted was adjusted.
IAM03M04 1535 1535 1 AN If the field contains anything other than “R,” the grade 3 students - American Indian/Alaska Native - male count originally submitted was adjusted.
IAM03F04 1536 1536 1 AN If the field contains anything other than “R,” the grade 3 students - American Indian/Alaska Native - female count originally submitted was adjusted.
IAM03U04 1537 1537 1 AN If the field contains anything other than “R,” the grade 3 students - American Indian/Alaska Native - gender unknown count originally submitted was adjusted.
IAS03M04 1538 1538 1 AN If the field contains anything other than “R,” the grade 3 students - Asian/Pacific Islander - male count originally submitted was adjusted.
IAS03F04 1539 1539 1 AN If the field contains anything other than “R,” the grade 3 students - Asian/Pacific Islander - female count originally submitted was adjusted.
IAS03U04 1540 1540 1 AN If the field contains anything other than “R,” the grade 3 students - Asian/Pacific Islander - gender unknown count originally submitted was adjusted.
IHI03M04 1541 1541 1 AN If the field contains anything other than “R,” the grade 3 students - Hispanic -male count originally submitted was adjusted.
IHI03F04 1542 1542 1 AN If the field contains anything other than “R,” the grade 3 students - Hispanic -female count originally submitted was adjusted.
IHI03U04 1543 1543 1 AN If the field contains anything other than “R,” the grade 3 students - Hispanic -gender unknown count originally submitted was adjusted.
IBL03M04 1544 1544 1 AN If the field contains anything other than “R,” the grade 3 students - Black, non-Hispanic - male count originally submitted was adjusted.
IBL03F04 1545 1545 1 AN If the field contains anything other than “R,” the grade 3 students - Black, non-Hispanic - female count originally submitted was adjusted.
IBL03U04 1546 1546 1 AN If the field contains anything other than “R,” the grade 3 students - Black, non-Hispanic - gender unknown count originally submitted was adjusted.
IWH03M04 1547 1547 1 AN If the field contains anything other than “R,” the grade 3 students - White, non-Hispanic - male count originally submitted was adjusted.
IWH03F04 1548 1548 1 AN If the field contains anything other than “R,” the grade 3 students - White, non-Hispanic - female count originally submitted was adjusted.
IWH03U04 1549 1549 1 AN If the field contains anything other than “R,” the grade 3 students - White, non-Hispanic - gender unknown count originally submitted was adjusted.
IG0404 1550 1550 1 AN If the field contains anything other than “R,” the total grade 4 students count originally submitted was adjusted.
IAM04M04 1551 1551 1 AN If the field contains anything other than “R,” the grade 4 students - American Indian/Alaska Native - male count originally submitted was adjusted.

Appendix A—Record Layout for the Common Core of Data Public Elementary/Secondary School Universe Survey: School year 2004–05
A-23
Variable Start End Field Data Name Position Position Length Type Description IAM04F04 1552 1552 1 AN If the field contains anything other than “R,” the grade 4 students - American
Indian/Alaska Native - female count originally submitted was adjusted.
IAM04U04 1553 1553 1 AN If the field contains anything other than “R,” the grade 4 students - American Indian/Alaska Native - gender unknown count originally submitted was adjusted.
IAS04M04 1554 1554 1 AN If the field contains anything other than “R,” the grade 4 students - Asian/Pacific Islander - male count originally submitted was adjusted.
IAS04F04 1555 1555 1 AN If the field contains anything other than “R,” the grade 4 students - Asian/Pacific Islander - female count originally submitted was adjusted.
IAS04U04 1556 1556 1 AN If the field contains anything other than “R,” the grade 4 students - Asian/Pacific Islander - gender unknown count originally submitted was adjusted.
IHI04M04 1557 1557 1 AN If the field contains anything other than “R,” the grade 4 students - Hispanic -male count originally submitted was adjusted.
IHI04F04 1558 1558 1 AN If the field contains anything other than “R,” the grade 4 students - Hispanic -female count originally submitted was adjusted.
IHI04U04 1559 1559 1 AN If the field contains anything other than “R,” the grade 4 students - Hispanic -gender unknown count originally submitted was adjusted.
IBL04M04 1560 1560 1 AN If the field contains anything other than “R,” the grade 4 students - Black, non-Hispanic - male count originally submitted was adjusted.
IBL04F04 1561 1561 1 AN If the field contains anything other than “R,” the grade 4 students - Black, non-Hispanic - female count originally submitted was adjusted.
IBL04U04 1562 1562 1 AN If the field contains anything other than “R,” the grade 4 students - Black, non-Hispanic - gender unknown count originally submitted was adjusted.
IWH04M04 1563 1563 1 AN If the field contains anything other than “R,” the grade 4 students - White, non-Hispanic - male count originally submitted was adjusted.
IWH04F04 1564 1564 1 AN If the field contains anything other than “R,” the grade 4 students - White, non-Hispanic - female count originally submitted was adjusted.
IWH04U04 1565 1565 1 AN If the field contains anything other than “R,” the grade 4 students - White, non-Hispanic - gender unknown count originally submitted was adjusted.
IG0504 1566 1566 1 AN If the field contains anything other than “R,” the total grade 5 students count originally submitted was adjusted.
IAM05M04 1567 1567 1 AN If the field contains anything other than “R,” the grade 5 students - American Indian/Alaska Native - male count originally submitted was adjusted.
IAM05F04 1568 1568 1 AN If the field contains anything other than “R,” the grade 5 students - American Indian/Alaska Native - female count originally submitted was adjusted.

Appendix A—Record Layout for the Common Core of Data Public Elementary/Secondary School Universe Survey: School year 2004–05
A-24
Variable Start End Field Data Name Position Position Length Type Description IAM05U04 1569 1569 1 AN If the field contains anything other than “R,” the grade 5 students - American
Indian/Alaska Native - gender unknown count originally submitted was adjusted.
IAS05M04 1570 1570 1 AN If the field contains anything other than “R,” the grade 5 students - Asian/Pacific Islander - male count originally submitted was adjusted.
IAS05F04 1571 1571 1 AN If the field contains anything other than “R,” the grade 5 students - Asian/Pacific Islander - female count originally submitted was adjusted.
IAS05U04 1572 1572 1 AN If the field contains anything other than “R,” the grade 5 students - Asian/Pacific Islander - gender unknown count originally submitted was adjusted.
IHI05M04 1573 1573 1 AN If the field contains anything other than “R,” the grade 5 students - Hispanic -male count originally submitted was adjusted.
IHI05F04 1574 1574 1 AN If the field contains anything other than “R,” the grade 5 students - Hispanic -female count originally submitted was adjusted.
IHI05U04 1575 1575 1 AN If the field contains anything other than “R,” the grade 5 students - Hispanic -gender unknown count originally submitted was adjusted.
IBL05M04 1576 1576 1 AN If the field contains anything other than “R,” the grade 5 students - Black, non-Hispanic - male count originally submitted was adjusted.
IBL05F04 1577 1577 1 AN If the field contains anything other than “R,” the grade 5 students - Black, non-Hispanic - female count originally submitted was adjusted.
IBL05U04 1578 1578 1 AN If the field contains anything other than “R,” the grade 5 students - Black, non-Hispanic - gender unknown count originally submitted was adjusted.
IWH05M04 1579 1579 1 AN If the field contains anything other than “R,” the grade 5 students - White, non-Hispanic - male count originally submitted was adjusted.
IWH05F04 1580 1580 1 AN If the field contains anything other than “R,” the grade 5 students - White, non-Hispanic - female count originally submitted was adjusted.
IWH05U04 1581 1581 1 AN If the field contains anything other than “R,” the grade 5 students - White, non-Hispanic - gender unknown count originally submitted was adjusted.
IG0604 1582 1582 1 AN If the field contains anything other than “R,” the total grade 6 students count originally submitted was adjusted.
IAM06M04 1583 1583 1 AN If the field contains anything other than “R,” the grade 6 students - American Indian/Alaska Native - male count originally submitted was adjusted.
IAM06F04 1584 1584 1 AN If the field contains anything other than “R,” the grade 6 students - American Indian/Alaska Native - female count originally submitted was adjusted.
IAM06U04 1585 1585 1 AN If the field contains anything other than “R,” the grade 6 students - American Indian/Alaska Native - gender unknown count originally submitted was adjusted.

Appendix A—Record Layout for the Common Core of Data Public Elementary/Secondary School Universe Survey: School year 2004–05
A-25
Variable Start End Field Data Name Position Position Length Type Description IAS06M04 1586 1586 1 AN If the field contains anything other than “R,” the grade 6 students -
Asian/Pacific Islander - male count originally submitted was adjusted.
IAS06F04 1587 1587 1 AN If the field contains anything other than “R,” the grade 6 students - Asian/Pacific Islander - female count originally submitted was adjusted.
IAS06U04 1588 1588 1 AN If the field contains anything other than “R,” the grade 6 students - Asian/Pacific Islander - gender unknown count originally submitted was adjusted.
IHI06M04 1589 1589 1 AN If the field contains anything other than “R,” the grade 6 students - Hispanic -male count originally submitted was adjusted.
IHI06F04 1590 1590 1 AN If the field contains anything other than “R,” the grade 6 students - Hispanic -female count originally submitted was adjusted.
IHI06U04 1591 1591 1 AN If the field contains anything other than “R,” the grade 6 students - Hispanic -gender unknown count originally submitted was adjusted.
IBL06M04 1592 1592 1 AN If the field contains anything other than “R,” the grade 6 students - Black, non-Hispanic - male count originally submitted was adjusted.
IBL06F04 1593 1593 1 AN If the field contains anything other than “R,” the grade 6 students - Black, non-Hispanic - female count originally submitted was adjusted.
IBL06U04 1594 1594 1 AN If the field contains anything other than “R,” the grade 6 students - Black, non-Hispanic - gender unknown count originally submitted was adjusted.
IWH06M04 1595 1595 1 AN If the field contains anything other than “R,” the grade 6 students - White, non-Hispanic - male count originally submitted was adjusted.
IWH06F04 1596 1596 1 AN If the field contains anything other than “R,” the grade 6 students - White, non-Hispanic - female count originally submitted was adjusted.
IWH06U04 1597 1597 1 AN If the field contains anything other than “R,” the grade 6 students - White, non-Hispanic - gender unknown count originally submitted was adjusted.
IG0704 1598 1598 1 AN If the field contains anything other than “R,” the total grade 7 students count originally submitted was adjusted.
IAM07M04 1599 1599 1 AN If the field contains anything other than “R,” the grade 7 students - American Indian/Alaska Native - male count originally submitted was adjusted.
IAM07F04 1600 1600 1 AN If the field contains anything other than “R,” the grade 7 students - American Indian/Alaska Native - female count originally submitted was adjusted.
IAM07U04 1601 1601 1 AN If the field contains anything other than “R,” the grade 7 students - American Indian/Alaska Native - gender unknown count originally submitted was adjusted.
IAS07M04 1602 1602 1 AN If the field contains anything other than “R,” the grade 7 students - Asian/Pacific Islander - male count originally submitted was adjusted.

Appendix A—Record Layout for the Common Core of Data Public Elementary/Secondary School Universe Survey: School year 2004–05
A-26
Variable Start End Field Data Name Position Position Length Type Description IAS07F04 1603 1603 1 AN If the field contains anything other than “R,” the grade 7 students -
Asian/Pacific Islander - female count originally submitted was adjusted.
IAS07U04 1604 1604 1 AN If the field contains anything other than “R,” the grade 7 students - Asian/Pacific Islander - gender unknown count originally submitted was adjusted.
IHI07M04 1605 1605 1 AN If the field contains anything other than “R,” the grade 7 students - Hispanic -male count originally submitted was adjusted.
IHI07F04 1606 1606 1 AN If the field contains anything other than “R,” the grade 7 students - Hispanic -female count originally submitted was adjusted.
IHI07U04 1607 1607 1 AN If the field contains anything other than “R,” the grade 7 students - Hispanic -gender unknown count originally submitted was adjusted.
IBL07M04 1608 1608 1 AN If the field contains anything other than “R,” the grade 7 students - Black, non-Hispanic - male count originally submitted was adjusted.
IBL07F04 1609 1609 1 AN If the field contains anything other than “R,” the grade 7 students - Black, non-Hispanic - female count originally submitted was adjusted.
IBL07U04 1610 1610 1 AN If the field contains anything other than “R,” the grade 7 students - Black, non-Hispanic - gender unknown count originally submitted was adjusted.
IWH07M04 1611 1611 1 AN If the field contains anything other than “R,” the grade 7 students - White, non-Hispanic - male count originally submitted was adjusted.
IWH07F04 1612 1612 1 AN If the field contains anything other than “R,” the grade 7 students - White, non-Hispanic - female count originally submitted was adjusted.
IWH07U04 1613 1613 1 AN If the field contains anything other than “R,” the grade 7 students - White, non-Hispanic - gender unknown count originally submitted was adjusted.
IG0804 1614 1614 1 AN If the field contains anything other than “R,” the total grade 8 students count originally submitted was adjusted.
IAM08M04 1615 1615 1 AN If the field contains anything other than “R,” the grade 8 students - American Indian/Alaska Native - male count originally submitted was adjusted.
IAM08F04 1616 1616 1 AN If the field contains anything other than “R,” the grade 8 students - American Indian/Alaska Native - female count originally submitted was adjusted.
IAM08U04 1617 1617 1 AN If the field contains anything other than “R,” the grade 8 students - American Indian/Alaska Native - gender unknown count originally submitted was adjusted.
IAS08M04 1618 1618 1 AN If the field contains anything other than “R,” the grade 8 students - Asian/Pacific Islander - male count originally submitted was adjusted.
IAS08F04 1619 1619 1 AN If the field contains anything other than “R,” the grade 8 students - Asian/Pacific Islander - female count originally submitted was adjusted.

Appendix A—Record Layout for the Common Core of Data Public Elementary/Secondary School Universe Survey: School year 2004–05
A-27
Variable Start End Field Data Name Position Position Length Type Description IAS08U04 1620 1620 1 AN If the field contains anything other than “R,” the grade 8 students -
Asian/Pacific Islander - gender unknown count originally submitted was adjusted.
IHI08M04 1621 1621 1 AN If the field contains anything other than “R,” the grade 8 students - Hispanic -male count originally submitted was adjusted.
IHI08F04 1622 1622 1 AN If the field contains anything other than “R,” the grade 8 students - Hispanic -female count originally submitted was adjusted.
IHI08U04 1623 1623 1 AN If the field contains anything other than “R,” the grade 8 students - Hispanic -gender unknown count originally submitted was adjusted.
IBL08M04 1624 1624 1 AN If the field contains anything other than “R,” the grade 8 students - Black, non-Hispanic - male count originally submitted was adjusted.
IBL08F04 1625 1625 1 AN If the field contains anything other than “R,” the grade 8 students - Black, non-Hispanic - female count originally submitted was adjusted.
IBL08U04 1626 1626 1 AN If the field contains anything other than “R,” the grade 8 students - Black, non-Hispanic - gender unknown count originally submitted was adjusted.
IWH08M04 1627 1627 1 AN If the field contains anything other than “R,” the grade 8 students - White, non-Hispanic - male count originally submitted was adjusted.
IWH08F04 1628 1628 1 AN If the field contains anything other than “R,” the grade 8 students - White, non-Hispanic - female count originally submitted was adjusted.
IWH08U04 1629 1629 1 AN If the field contains anything other than “R,” the grade 8 students - White, non-Hispanic - gender unknown count originally submitted was adjusted.
IG0904 1630 1630 1 AN If the field contains anything other than “R,” the total grade 9 students count originally submitted was adjusted.
IAM09M04 1631 1631 1 AN If the field contains anything other than “R,” the grade 9 students - American Indian/Alaska Native - male count originally submitted was adjusted.
IAM09F04 1632 1632 1 AN If the field contains anything other than “R,” the grade 9 students - American Indian/Alaska Native - female count originally submitted was adjusted.
IAM09U04 1633 1633 1 AN If the field contains anything other than “R,” the grade 9 students - American Indian/Alaska Native - gender unknown count originally submitted was adjusted.
IAS09M04 1634 1634 1 AN If the field contains anything other than “R,” the grade 9 students - Asian/Pacific Islander - male count originally submitted was adjusted.
IAS09F04 1635 1635 1 AN If the field contains anything other than “R,” the grade 9 students - Asian/Pacific Islander - female count originally submitted was adjusted.
IAS09U04 1636 1636 1 AN If the field contains anything other than “R,” the grade 9 students - Asian/Pacific Islander - gender unknown count originally submitted was adjusted.

Appendix A—Record Layout for the Common Core of Data Public Elementary/Secondary School Universe Survey: School year 2004–05
A-28
Variable Start End Field Data Name Position Position Length Type Description IHI09M04 1637 1637 1 AN If the field contains anything other than “R,” the grade 9 students - Hispanic -
male count originally submitted was adjusted.
IHI09F04 1638 1638 1 AN If the field contains anything other than “R,” the grade 9 students - Hispanic -female count originally submitted was adjusted.
IHI09U04 1639 1639 1 AN If the field contains anything other than “R,” the grade 9 students - Hispanic -gender unknown count originally submitted was adjusted.
IBL09M04 1640 1640 1 AN If the field contains anything other than “R,” the grade 9 students - Black, non-Hispanic - male count originally submitted was adjusted.
IBL09F04 1641 1641 1 AN If the field contains anything other than “R,” the grade 9 students - Black, non-Hispanic - female count originally submitted was adjusted.
IBL09U04 1642 1642 1 AN If the field contains anything other than “R,” the grade 9 students - Black, non-Hispanic - gender unknown count originally submitted was adjusted.
IWH09M04 1643 1643 1 AN If the field contains anything other than “R,” the grade 9 students - White, non-Hispanic - male count originally submitted was adjusted.
IWH09F04 1644 1644 1 AN If the field contains anything other than “R,” the grade 9 students - White, non-Hispanic - female count originally submitted was adjusted.
IWH09U04 1645 1645 1 AN If the field contains anything other than “R,” the grade 9 students - White, non-Hispanic - gender unknown count originally submitted was adjusted.
IG1004 1646 1646 1 AN If the field contains anything other than “R,” the total grade 10 students count originally submitted was adjusted.
IAM10M04 1647 1647 1 AN If the field contains anything other than “R,” the grade 10 students - American Indian/Alaska Native - male count originally submitted was adjusted.
IAM10F04 1648 1648 1 AN If the field contains anything other than “R,” the grade 10 students - American Indian/Alaska Native - female count originally submitted was adjusted.
IAM10U04 1649 1649 1 AN If the field contains anything other than “R,” the grade 10 students - American Indian/Alaska Native - gender unknown count originally submitted was adjusted.
IAS10M04 1650 1650 1 AN If the field contains anything other than “R,” the grade 10 students - Asian/Pacific Islander - male count originally submitted was adjusted.
IAS10F04 1651 1651 1 AN If the field contains anything other than “R,” the grade 10 students - Asian/Pacific Islander - female count originally submitted was adjusted.
IAS10U04 1652 1652 1 AN If the field contains anything other than “R,” the grade 10 students - Asian/Pacific Islander - gender unknown count originally submitted was adjusted.
IHI10M04 1653 1653 1 AN If the field contains anything other than “R,” the grade 10 students - Hispanic - male count originally submitted was adjusted.

Appendix A—Record Layout for the Common Core of Data Public Elementary/Secondary School Universe Survey: School year 2004–05
A-29
Variable Start End Field Data Name Position Position Length Type Description IHI10F04 1654 1654 1 AN If the field contains anything other than “R,” the grade 10 students - Hispanic
- female count originally submitted was adjusted.
IHI10U04 1655 1655 1 AN If the field contains anything other than “R,” the grade 10 students - Hispanic - gender unknown count originally submitted was adjusted.
IBL10M04 1656 1656 1 AN If the field contains anything other than “R,” the grade 10 students - Black, non-Hispanic - male count originally submitted was adjusted.
IBL10F04 1657 1657 1 AN If the field contains anything other than “R,” the grade 10 students - Black, non-Hispanic - female count originally submitted was adjusted.
IBL10U04 1658 1658 1 AN If the field contains anything other than “R,” the grade 10 students - Black, non-Hispanic - gender unknown count originally submitted was adjusted.
IWH10M04 1659 1659 1 AN If the field contains anything other than “R,” the grade 10 students - White, non-Hispanic - male count originally submitted was adjusted.
IWH10F04 1660 1660 1 AN If the field contains anything other than “R,” the grade 10 students - White, non-Hispanic - female count originally submitted was adjusted.
IWH10U04 1661 1661 1 AN If the field contains anything other than “R,” the grade 10 students - White, non-Hispanic - gender unknown count originally submitted was adjusted.
IG1104 1662 1662 1 AN If the field contains anything other than “R,” the total grade 11 students count originally submitted was adjusted.
IAM11M04 1663 1663 1 AN If the field contains anything other than “R,” the grade 11 students - American Indian/Alaska Native - male count originally submitted was adjusted.
IAM11F04 1664 1664 1 AN If the field contains anything other than “R,” the grade 11 students - American Indian/Alaska Native - female count originally submitted was adjusted.
IAM11U04 1665 1665 1 AN If the field contains anything other than “R,” the grade 11 students - American Indian/Alaska Native - gender unknown count originally submitted was adjusted.
IAS11M04 1666 1666 1 AN If the field contains anything other than “R,” the grade 11 students - Asian/Pacific Islander - male count originally submitted was adjusted.
IAS11F04 1667 1667 1 AN If the field contains anything other than “R,” the grade 11 students - Asian/Pacific Islander - female count originally submitted was adjusted.
IAS11U04 1668 1668 1 AN If the field contains anything other than “R,” the grade 11 students - Asian/Pacific Islander - gender unknown count originally submitted was adjusted.
IHI11M04 1669 1669 1 AN If the field contains anything other than “R,” the grade 11 students - Hispanic - male count originally submitted was adjusted.
IHI11F04 1670 1670 1 AN If the field contains anything other than “R,” the grade 11 students - Hispanic - female count originally submitted was adjusted.

Appendix A—Record Layout for the Common Core of Data Public Elementary/Secondary School Universe Survey: School year 2004–05
A-30
Variable Start End Field Data Name Position Position Length Type Description IHI11U04 1671 1671 1 AN If the field contains anything other than “R,” the grade 11 students - Hispanic
- gender unknown count originally submitted was adjusted.
IBL11M04 1672 1672 1 AN If the field contains anything other than “R,” the grade 11 students - Black, non-Hispanic - male count originally submitted was adjusted.
IBL11F04 1673 1673 1 AN If the field contains anything other than “R,” the grade 11 students - Black, non-Hispanic - female count originally submitted was adjusted.
IBL11U04 1674 1674 1 AN If the field contains anything other than “R,” the grade 11 students - Black, non-Hispanic - gender unknown count originally submitted was adjusted.
IWH11M04 1675 1675 1 AN If the field contains anything other than “R,” the grade 11 students - White, non-Hispanic - male count originally submitted was adjusted.
IWH11F04 1676 1676 1 AN If the field contains anything other than “R,” the grade 11 students - White, non-Hispanic - female count originally submitted was adjusted.
IWH11U04 1677 1677 1 AN If the field contains anything other than “R,” the grade 11 students - White, non-Hispanic - gender unknown count originally submitted was adjusted.
IG1204 1678 1678 1 AN If the field contains anything other than “R,” the total grade 12 students count originally submitted was adjusted.
IAM12M04 1679 1679 1 AN If the field contains anything other than “R,” the grade 12 students - American Indian/Alaska Native - male count originally submitted was adjusted.
IAM12F04 1680 1680 1 AN If the field contains anything other than “R,” the grade 12 students - American Indian/Alaska Native - female count originally submitted was adjusted.
IAM12U04 1681 1681 1 AN If the field contains anything other than “R,” the grade 12 students - American Indian/Alaska Native - gender unknown count originally submitted was adjusted.
IAS12M04 1682 1682 1 AN If the field contains anything other than “R,” the grade 12 students - Asian/Pacific Islander - male count originally submitted was adjusted.
IAS12F04 1683 1683 1 AN If the field contains anything other than “R,” the grade 12 students - Asian/Pacific Islander - female count originally submitted was adjusted.
IAS12U04 1684 1684 1 AN If the field contains anything other than “R,” the grade 12 students - Asian/Pacific Islander - gender unknown count originally submitted was adjusted.
IHI12M04 1685 1685 1 AN If the field contains anything other than “R,” the grade 12 students - Hispanic - male count originally submitted was adjusted.
IHI12F04 1686 1686 1 AN If the field contains anything other than “R,” the grade 12 students - Hispanic - female count originally submitted was adjusted.
IHI12U04 1687 1687 1 AN If the field contains anything other than “R,” the grade 12 students - Hispanic - gender unknown count originally submitted was adjusted.

Appendix A—Record Layout for the Common Core of Data Public Elementary/Secondary School Universe Survey: School year 2004–05
A-31
Variable Start End Field Data Name Position Position Length Type Description IBL12M04 1688 1688 1 AN If the field contains anything other than “R,” the grade 12 students - Black,
non-Hispanic - male count originally submitted was adjusted.
IBL12F04 1689 1689 1 AN If the field contains anything other than “R,” the grade 12 students - Black, non-Hispanic - female count originally submitted was adjusted.
IBL12U04 1690 1690 1 AN If the field contains anything other than “R,” the grade 12 students - Black, non-Hispanic - gender unknown count originally submitted was adjusted.
IWH12M04 1691 1691 1 AN If the field contains anything other than “R,” the grade 12 students - White, non-Hispanic - male count originally submitted was adjusted.
IWH12F04 1692 1692 1 AN If the field contains anything other than “R,” the grade 12 students - White, non-Hispanic - female count originally submitted was adjusted.
IWH12U04 1693 1693 1 AN If the field contains anything other than “R,” the grade 12 students - White, non-Hispanic - gender unknown count originally submitted was adjusted.
IUG04 1694 1694 1 AN If the field contains anything other than “R,” the total ungraded students count originally submitted was adjusted.
IAMUGM04 1695 1695 1 AN If the field contains anything other than “R,” the ungraded students - American Indian/Alaska Native - male count originally submitted was adjusted.
IAMUGF04 1696 1696 1 AN If the field contains anything other than “R,” the ungraded students - American Indian/Alaska Native - female count originally submitted was adjusted.
IAMUGU04 1697 1697 1 AN If the field contains anything other than “R,” the ungraded students - American Indian/Alaska Native - gender unknown count originally submitted was adjusted.
IASUGM04 1698 1698 1 AN If the field contains anything other than “R,” the ungraded students - Asian/Pacific Islander - male count originally submitted was adjusted.
IASUGF04 1699 1699 1 AN If the field contains anything other than “R,” the ungraded students - Asian/Pacific Islander - female count originally submitted was adjusted.
IASUGU04 1700 1700 1 AN If the field contains anything other than “R,” the ungraded students - Asian/Pacific Islander - gender unknown count originally submitted was adjusted.
IHIUGM04 1701 1701 1 AN If the field contains anything other than “R,” the ungraded students - Hispanic - male count originally submitted was adjusted.
IHIUGF04 1702 1702 1 AN If the field contains anything other than “R,” the ungraded students - Hispanic - female count originally submitted was adjusted.
IHIUGU04 1703 1703 1 AN If the field contains anything other than “R,” the ungraded students - Hispanic - gender unknown count originally submitted was adjusted.
IBLUGM04 1704 1704 1 AN If the field contains anything other than “R,” the ungraded students - Black, non-Hispanic - male count originally submitted was adjusted.

Appendix A—Record Layout for the Common Core of Data Public Elementary/Secondary School Universe Survey: School year 2004–05
A-32
Variable Start End Field Data Name Position Position Length Type Description IBLUGF04 1705 1705 1 AN If the field contains anything other than “R,” the ungraded students - Black,
non-Hispanic - female count originally submitted was adjusted.
IBLUGU04 1706 1706 1 AN If the field contains anything other than “R,” the ungraded students - Black, non-Hispanic - gender unknown count originally submitted was adjusted.
IWHUGM04 1707 1707 1 AN If the field contains anything other than “R,” the ungraded students - White, non-Hispanic - male count originally submitted was adjusted.
IWHUGF04 1708 1708 1 AN If the field contains anything other than “R,” the ungraded students - White, non-Hispanic - female count originally submitted was adjusted.
IWHUGU04 1709 1709 1 AN If the field contains anything other than “R,” the ungraded students - White, non-Hispanic - gender unknown count originally submitted was adjusted.
IMEMB04 1710 1710 1 AN If the field contains anything other than “R,” the total students, all grades count originally submitted was adjusted.
IAM04 1711 1711 1 AN If the field contains anything other than “R,” one or more of the American Indian/Alaska Native student counts originally submitted was adjusted.
IAMALM04 1712 1712 1 AN If the field contains anything other than “R,” the total students, all grades - American Indian/Alaska Native - male count originally submitted was adjusted.
IAMALF04 1713 1713 1 AN If the field contains anything other than “R,” the total students, all grades - American Indian/Alaska Native - female count originally submitted was adjusted.
IAMALU04 1714 1714 1 AN If the field contains anything other than “R,” the total students, all grades - American Indian/Alaska Native - gender unknown count originally submitted was adjusted.
IASIAN04 1715 1715 1 AN If the field contains anything other than “R,” one or more of the Asian/Pacific Islander student counts originally submitted was adjusted.
IASALM04 1716 1716 1 AN If the field contains anything other than “R,” the total students, all grades - Asian/Pacific Islander - male count originally submitted was adjusted.
IASALF04 1717 1717 1 AN If the field contains anything other than “R,” the total students, all grades - Asian/Pacific Islander - female count originally submitted was adjusted.
IASALU04 1718 1718 1 AN If the field contains anything other than “R,” the total students, all grades - Asian/Pacific Islander - gender unknown count originally submitted was adjusted.
IHISP04 1719 1719 1 AN If the field contains anything other than “R,” one or more of the Hispanic student counts originally submitted was adjusted.
IHIALM04 1720 1720 1 AN If the field contains anything other than “R,” the total students, all grades - Hispanic - male count originally submitted was adjusted.
IHIALF04 1721 1721 1 AN If the field contains anything other than “R,” the total students, all grades - Hispanic - female count originally submitted was adjusted.

Appendix A—Record Layout for the Common Core of Data Public Elementary/Secondary School Universe Survey: School year 2004–05
A-33
Variable Start End Field Data Name Position Position Length Type Description IHIALU04 1722 1722 1 AN If the field contains anything other than “R,” the total students, all grades -
Hispanic - gender unknown count originally submitted was adjusted.
IBLACK04 1723 1723 1 AN If the field contains anything other than “R,” one or more of the Black, non-Hispanic student counts originally submitted was adjusted.
IBLALM04 1724 1724 1 AN If the field contains anything other than “R,” the total students, all grades - Black, non-Hispanic - male count originally submitted was adjusted.
IBLALF04 1725 1725 1 AN If the field contains anything other than “R,” the total students, all grades - Black, non-Hispanic - female count originally submitted was adjusted.
IBLALU04 1726 1726 1 AN If the field contains anything other than “R,” the total students, all grades - Black, non-Hispanic - gender unknown count originally submitted was adjusted.
IWHITE04 1727 1727 1 AN If the field contains anything other than “R,” one or more of the White, non-Hispanic student counts originally submitted was adjusted.
IWHALM04 1728 1728 1 AN If the field contains anything other than “R,” the total students, all grades - White, non-Hispanic - male count originally submitted was adjusted.
IWHALF04 1729 1729 1 AN If the field contains anything other than “R,” the total students, all grades - White, non-Hispanic - female count originally submitted was adjusted.
IWHALU04 1730 1730 1 AN If the field contains anything other than “R,” the total students, all grades - White, non-Hispanic - gender unknown count originally submitted was adjusted.
IETH04 1731 1731 1 AN If the field contains anything other than “T,” one or more of the race/ethnicity student counts originally submitted was adjusted.
IPUTCH04 1732 1732 1 AN If the field contains anything other than “T,” one or more of the pupil/teacher counts originally submitted was adjusted.
ITOTGR04 1733 1733 1 AN If the field contains anything other than “T,” one or more of the grade totals originally submitted was adjusted.

B-1
Appendix B—Value Distribution and Field Frequencies for the Common Core of Data Public Elementary/Secondary School Universe Survey:
School Year 2004–05


Appendix B—Value Distribution and Field Frequencies for the Common Core of Data Public Elementary/Secondary School Universe Survey: School year 2004–05
# Rounds to zero. NOTE: M or -1 indicates that the data are missing; a value was expected, but no value was measured. An N or -2 indicates that the data are not applicable; a value was neither expected nor measured.
B-3
Variable Label M N Other --------------------------------------------------------------------------
NCESSCH Unique School ID (NCES Assigned) 0 0 102,104 FIPST FIPS State Number 0 0 102,104 LEAID Unique Agency ID (NCES Assigned) 0 0 102,104 SCHNO School ID within State (NCES Assigned) 0 0 102,104 STID04 State Agency ID 0 0 102,104 SEASCH04 State School ID 0 0 102,104 LEANM04 Name of Operating Agency 0 0 102,104 SCHNAM04 School Name 0 0 102,104 PHONE04 Telephone Number of School 1,187 0 100,917 MSTREE04 Mailing Address 0 26 102,078 MCITY04 Mailing City Name 0 0 102,104 MSTATE04 Mailing USPS State Abbreviation 0 0 102,104 MZIP04 Mailing 5-Digit ZIP Code 1 0 102,103 MZIP404 Mailing ZIP+4 (if assigned) 0 0 102,104 LSTREE04 Location Address 16 0 102,088 LCITY04 Location City Name 0 0 102,104 LSTATE04 Location USPS State Abbreviation 0 0 102,104 LZIP04 Location 5-Digit ZIP Code 1 0 102,103 LZIP404 Location ZIP+4 (if assigned) 0 0 102,104 LATCOD04 Latitude 8 2,115 99,981 LONCOD04 Longitude 8 2,115 99,981 CONUM04 FIPS County Number (FIPS St+County) 8 2,085 100,011 CONAME04 County Name 8 2,081 100,015 --------------------------------------------------------------------------
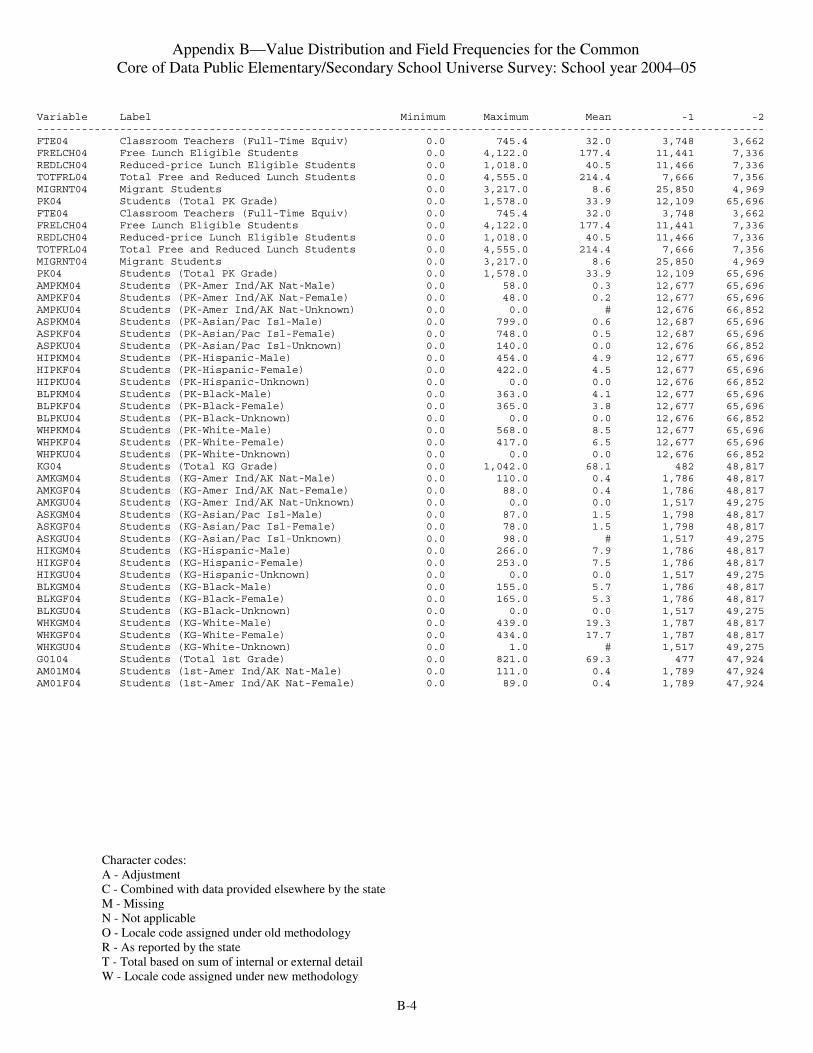
Appendix B—Value Distribution and Field Frequencies for the Common Core of Data Public Elementary/Secondary School Universe Survey: School year 2004–05
Character codes: A - Adjustment C - Combined with data provided elsewhere by the state M - Missing N - Not applicable O - Locale code assigned under old methodology R - As reported by the state T - Total based on sum of internal or external detail W - Locale code assigned under new methodology
B-4
Variable Label Minimum Maximum Mean -1 -2 ------------------------------------------------------------------------------------------------------------------ FTE04 Classroom Teachers (Full-Time Equiv) 0.0 745.4 32.0 3,748 3,662 FRELCH04 Free Lunch Eligible Students 0.0 4,122.0 177.4 11,441 7,336 REDLCH04 Reduced-price Lunch Eligible Students 0.0 1,018.0 40.5 11,466 7,336 TOTFRL04 Total Free and Reduced Lunch Students 0.0 4,555.0 214.4 7,666 7,356 MIGRNT04 Migrant Students 0.0 3,217.0 8.6 25,850 4,969 PK04 Students (Total PK Grade) 0.0 1,578.0 33.9 12,109 65,696 FTE04 Classroom Teachers (Full-Time Equiv) 0.0 745.4 32.0 3,748 3,662 FRELCH04 Free Lunch Eligible Students 0.0 4,122.0 177.4 11,441 7,336 REDLCH04 Reduced-price Lunch Eligible Students 0.0 1,018.0 40.5 11,466 7,336 TOTFRL04 Total Free and Reduced Lunch Students 0.0 4,555.0 214.4 7,666 7,356 MIGRNT04 Migrant Students 0.0 3,217.0 8.6 25,850 4,969 PK04 Students (Total PK Grade) 0.0 1,578.0 33.9 12,109 65,696 AMPKM04 Students (PK-Amer Ind/AK Nat-Male) 0.0 58.0 0.3 12,677 65,696 AMPKF04 Students (PK-Amer Ind/AK Nat-Female) 0.0 48.0 0.2 12,677 65,696 AMPKU04 Students (PK-Amer Ind/AK Nat-Unknown) 0.0 0.0 # 12,676 66,852 ASPKM04 Students (PK-Asian/Pac Isl-Male) 0.0 799.0 0.6 12,687 65,696 ASPKF04 Students (PK-Asian/Pac Isl-Female) 0.0 748.0 0.5 12,687 65,696 ASPKU04 Students (PK-Asian/Pac Isl-Unknown) 0.0 140.0 0.0 12,676 66,852 HIPKM04 Students (PK-Hispanic-Male) 0.0 454.0 4.9 12,677 65,696 HIPKF04 Students (PK-Hispanic-Female) 0.0 422.0 4.5 12,677 65,696 HIPKU04 Students (PK-Hispanic-Unknown) 0.0 0.0 0.0 12,676 66,852 BLPKM04 Students (PK-Black-Male) 0.0 363.0 4.1 12,677 65,696 BLPKF04 Students (PK-Black-Female) 0.0 365.0 3.8 12,677 65,696 BLPKU04 Students (PK-Black-Unknown) 0.0 0.0 0.0 12,676 66,852 WHPKM04 Students (PK-White-Male) 0.0 568.0 8.5 12,677 65,696 WHPKF04 Students (PK-White-Female) 0.0 417.0 6.5 12,677 65,696 WHPKU04 Students (PK-White-Unknown) 0.0 0.0 0.0 12,676 66,852 KG04 Students (Total KG Grade) 0.0 1,042.0 68.1 482 48,817 AMKGM04 Students (KG-Amer Ind/AK Nat-Male) 0.0 110.0 0.4 1,786 48,817 AMKGF04 Students (KG-Amer Ind/AK Nat-Female) 0.0 88.0 0.4 1,786 48,817 AMKGU04 Students (KG-Amer Ind/AK Nat-Unknown) 0.0 0.0 0.0 1,517 49,275 ASKGM04 Students (KG-Asian/Pac Isl-Male) 0.0 87.0 1.5 1,798 48,817 ASKGF04 Students (KG-Asian/Pac Isl-Female) 0.0 78.0 1.5 1,798 48,817 ASKGU04 Students (KG-Asian/Pac Isl-Unknown) 0.0 98.0 # 1,517 49,275 HIKGM04 Students (KG-Hispanic-Male) 0.0 266.0 7.9 1,786 48,817 HIKGF04 Students (KG-Hispanic-Female) 0.0 253.0 7.5 1,786 48,817 HIKGU04 Students (KG-Hispanic-Unknown) 0.0 0.0 0.0 1,517 49,275 BLKGM04 Students (KG-Black-Male) 0.0 155.0 5.7 1,786 48,817 BLKGF04 Students (KG-Black-Female) 0.0 165.0 5.3 1,786 48,817 BLKGU04 Students (KG-Black-Unknown) 0.0 0.0 0.0 1,517 49,275 WHKGM04 Students (KG-White-Male) 0.0 439.0 19.3 1,787 48,817 WHKGF04 Students (KG-White-Female) 0.0 434.0 17.7 1,787 48,817 WHKGU04 Students (KG-White-Unknown) 0.0 1.0 # 1,517 49,275 G0104 Students (Total 1st Grade) 0.0 821.0 69.3 477 47,924 AM01M04 Students (1st-Amer Ind/AK Nat-Male) 0.0 111.0 0.4 1,789 47,924 AM01F04 Students (1st-Amer Ind/AK Nat-Female) 0.0 89.0 0.4 1,789 47,924

Appendix B—Value Distribution and Field Frequencies for the Common Core of Data Public Elementary/Secondary School Universe Survey: School year 2004–05
Character codes: A - Adjustment C - Combined with data provided elsewhere by the state M - Missing N - Not applicable O - Locale code assigned under old methodology R - As reported by the state T - Total based on sum of internal or external detail W - Locale code assigned under new methodology
B-5
Variable Label Minimum Maximum Mean -1 -2 ----------------------------------------------------------------------------------------------------------------- AM01U04 Students (1st-Amer Ind/AK Nat-Unknown) 0.0 0.0 0.0 1,544 48,345 AS01M04 Students (1st-Asian/Pac Isl-Male) 0.0 97.0 1.6 1,801 47,924 AS01F04 Students (1st-Asian/Pac Isl-Female) 0.0 90.0 1.5 1,801 47,924 AS01U04 Students (1st-Asian/Pac Isl-Unknown) 0.0 128.0 # 1,544 48,345 HI01M04 Students (1st-Hispanic-Male) 0.0 237.0 8.1 1,789 47,924 HI01F04 Students (1st-Hispanic-Female) 0.0 218.0 7.6 1,789 47,924 HI01U04 Students (1st-Hispanic-Unknown) 0.0 0.0 0.0 1,544 48,345 BL01M04 Students (1st-Black-Male) 0.0 149.0 6.0 1,789 47,924 BL01F04 Students (1st-Black-Female) 0.0 178.0 5.6 1,789 47,924 BL01U04 Students (1st-Black-Unknown) 0.0 0.0 0.0 1,544 48,345 WH01M04 Students (1st-White-Male) 0.0 345.0 19.3 1,792 47,924 WH01F04 Students (1st-White-Female) 0.0 318.0 17.9 1,792 47,924 WH01U04 Students (1st-White-Unknown) 0.0 4.0 # 1,544 48,345 G0204 Students (Total 2nd Grade) 0.0 769.0 67.2 473 47,808 AM02M04 Students (2nd-Amer Ind/AK Nat-Male) 0.0 91.0 0.4 1,786 47,808 AM02F04 Students (2nd-Amer Ind/AK Nat-Female) 0.0 88.0 0.4 1,786 47,808 AM02U04 Students (2nd-Amer Ind/AK Nat-Unk) 0.0 0.0 0.0 1,545 48,255 AS02M04 Students (2nd-Asian/Pac Isl-Male) 0.0 101.0 1.6 1,798 47,808 AS02F04 Students (2nd-Asian/Pac Isl-Female) 0.0 94.0 1.5 1,798 47,808 AS02U04 Students (2nd-Asian/Pac Isl-Unknown) 0.0 151.0 0.0 1,545 48,255 HI02M04 Students (2nd-Hispanic-Male) 0.0 214.0 7.6 1,786 47,808 HI02F04 Students (2nd-Hispanic-Female) 0.0 222.0 7.3 1,786 47,808 HI02U04 Students (2nd-Hispanic-Unknown) 0.0 0.0 0.0 1,545 48,255 BL02M04 Students (2nd-Black-Male) 0.0 149.0 5.7 1,786 47,808 BL02F04 Students (2nd-Black-Female) 0.0 158.0 5.4 1,786 47,808 BL02U04 Students (2nd-Black-Unknown) 0.0 0.0 0.0 1,545 48,255 WH02M04 Students (2nd-White-Male) 0.0 272.0 18.8 1,790 47,808 WH02F04 Students (2nd-White-Female) 0.0 257.0 17.7 1,790 47,808 WH02U04 Students (2nd-White-Unknown) 0.0 6.0 # 1,545 48,255 G0304 Students (Total 3rd Grade) 0.0 785.0 67.5 462 47,730 AM03M04 Students (3rd-Amer Ind/AK Nat-Male) 0.0 86.0 0.4 1,774 47,730 AM03F04 Students (3rd-Amer Ind/AK Nat-Female) 0.0 79.0 0.4 1,774 47,730 AM03U04 Students (3rd-Amer Ind/AK Nat-Unk) 0.0 0.0 0.0 1,546 48,126 AS03M04 Students (3rd-Asian/Pac Isl-Male) 0.0 116.0 1.6 1,786 47,730 AS03F04 Students (3rd-Asian/Pac Isl-Female) 0.0 85.0 1.6 1,786 47,730 AS03U04 Students (3rd-Asian/Pac Isl-Unknown) 0.0 133.0 # 1,546 48,126 HI03M04 Students (3rd-Hispanic-Male) 0.0 210.0 7.5 1,774 47,730 HI03F04 Students (3rd-Hispanic-Female) 0.0 237.0 7.2 1,774 47,730 HI03U04 Students (3rd-Hispanic-Unknown) 0.0 0.0 0.0 1,546 48,126 BL03M04 Students (3rd-Black-Male) 0.0 155.0 5.7 1,774 47,730 BL03F04 Students (3rd-Black-Female) 0.0 178.0 5.5 1,774 47,730 BL03U04 Students (3rd-Black-Unknown) 0.0 0.0 0.0 1,546 48,126 WH03M04 Students (3rd-White-Male) 0.0 325.0 19.0 1,779 47,730 WH03F04 Students (3rd-White-Female) 0.0 326.0 17.9 1,779 47,730 WH03U04 Students (3rd-White-Unknown) 0.0 3.0 # 1,546 48,126 G0404 Students (Total 4th Grade) 0.0 802.0 68.4 462 47,994

Appendix B—Value Distribution and Field Frequencies for the Common Core of Data Public Elementary/Secondary School Universe Survey: School year 2004–05
Character codes: A - Adjustment C - Combined with data provided elsewhere by the state M - Missing N - Not applicable O - Locale code assigned under old methodology R - As reported by the state T - Total based on sum of internal or external detail W - Locale code assigned under new methodology
B-6
Variable Label Minimum Maximum Mean -1 -2 ------------------------------------------------------------------------------------------------------------------ AM04M04 Students (4th-Amer Ind/AK Nat-Male) 0.0 111.0 0.4 1,770 47,994 AM04F04 Students (4th-Amer Ind/AK Nat-Female) 0.0 96.0 0.4 1,770 47,994 AM04U04 Students (4th-Amer Ind/AK Nat-Unk) 0.0 0.0 0.0 1,544 48,410 AS04M04 Students (4th-Asian/Pac Isl-Male) 0.0 108.0 1.6 1,782 47,994 AS04F04 Students (4th-Asian/Pac Isl-Female) 0.0 95.0 1.5 1,782 47,994 AS04U04 Students (4th-Asian/Pac Isl-Unknown) 0.0 133.0 # 1,544 48,410 HI04M04 Students (4th-Hispanic-Male) 0.0 240.0 7.4 1,770 47,994 HI04F04 Students (4th-Hispanic-Female) 0.0 225.0 7.1 1,770 47,994 HI04U04 Students (4th-Hispanic-Unknown) 0.0 0.0 0.0 1,544 48,410 BL04M04 Students (4th-Black-Male) 0.0 139.0 5.9 1,771 47,994 BL04F04 Students (4th-Black-Female) 0.0 161.0 5.7 1,771 47,994 BL04U04 Students (4th-Black-Unknown) 0.0 1.0 # 1,544 48,410 WH04M04 Students (4th-White-Male) 0.0 344.0 19.4 1,774 47,994 WH04F04 Students (4th-White-Female) 0.0 338.0 18.3 1,774 47,994 WH04U04 Students (4th-White-Unknown) 0.0 2.0 # 1,544 48,410 G0504 Students (Total 5th Grade) 0.0 840.0 70.3 461 49,151 AM05M04 Students (5th-Amer Ind/AK Nat-Male) 0.0 98.0 0.4 1,714 49,151 AM05F04 Students (5th-Amer Ind/AK Nat-Female) 0.0 97.0 0.4 1,714 49,151 AM05U04 Students (5th-Amer Ind/AK Nat-Unknown) 0.0 0.0 0.0 999 50,109 AS05M04 Students (5th-Asian/Pac Isl-Male) 0.0 104.0 1.6 1,726 49,151 AS05F04 Students (5th-Asian/Pac Isl-Female) 0.0 104.0 1.6 1,726 49,151 AS05U04 Students (5th-Asian/Pac Isl-Unknown) 0.0 138.0 # 999 50,109 HI05M04 Students (5th-Hispanic-Male) 0.0 328.0 7.4 1,714 49,151 HI05F04 Students (5th-Hispanic-Female) 0.0 298.0 7.1 1,714 49,151 HI05U04 Students (5th-Hispanic-Unknown) 0.0 0.0 0.0 999 50,109 BL05M04 Students (5th-Black-Male) 0.0 168.0 6.1 1,714 49,151 BL05F04 Students (5th-Black-Female) 0.0 177.0 5.9 1,714 49,151 BL05U04 Students (5th-Black-Unknown) 0.0 0.0 0.0 999 50,109 WH05M04 Students (5th-White-Male) 0.0 338.0 20.1 1,718 49,151 WH05F04 Students (5th-White-Female) 0.0 325.0 18.9 1,718 49,151 WH05U04 Students (5th-White-Unknown) 0.0 3.0 # 999 50,109 G0604 Students (Total 6th Grade) 0.0 1,320.0 98.6 661 62,985 AM06M04 Students (6th-Amer Ind/AK Nat-Male) 0.0 128.0 0.6 1,494 62,985 AM06F04 Students (6th-Amer Ind/AK Nat-Female) 0.0 130.0 0.6 1,494 62,985 AM06U04 Students (6th-Amer Ind/AK Nat-Unknown) 0.0 0.0 0.0 1,103 63,662 AS06M04 Students (6th-Asian/Pac Isl-Male) 0.0 322.0 2.2 1,506 62,985 AS06F04 Students (6th-Asian/Pac Isl-Female) 0.0 263.0 2.1 1,506 62,985 AS06U04 Students (6th-Asian/Pac Isl-Unknown) 0.0 174.0 # 1,103 63,662 HI06M04 Students (6th-Hispanic-Male) 0.0 660.0 10.1 1,494 62,985 HI06F04 Students (6th-Hispanic-Female) 0.0 656.0 9.7 1,494 62,985 HI06U04 Students (6th-Hispanic-Unknown) 0.0 0.0 0.0 1,103 63,662 BL06M04 Students (6th-Black-Male) 0.0 268.0 8.8 1,495 62,985 BL06F04 Students (6th-Black-Female) 0.0 303.0 8.4 1,495 62,985 BL06U04 Students (6th-Black-Unknown) 0.0 1.0 # 1,103 63,662 WH06M04 Students (6th-White-Male) 0.0 354.0 28.4 1,495 62,985 WH06F04 Students (6th-White-Female) 0.0 323.0 26.6 1,495 62,985

Appendix B—Value Distribution and Field Frequencies for the Common Core of Data Public Elementary/Secondary School Universe Survey: School year 2004–05
Character codes: A - Adjustment C - Combined with data provided elsewhere by the state M - Missing N - Not applicable O - Locale code assigned under old methodology R - As reported by the state T - Total based on sum of internal or external detail W - Locale code assigned under new methodology
B-7
Variable Label Minimum Maximum Mean -1 -2 ------------------------------------------------------------------------------------------------------------------ WH06U04 Students (6th-White-Unknown) 0.0 1.0 # 1,103 63,662 G0704 Students (Total 7th Grade) 0.0 1,535.0 128.3 568 71,319 AM07M04 Students (7th-Amer Ind/AK Nat-Male) 0.0 152.0 0.8 1,265 71,318 AM07F04 Students (7th-Amer Ind/AK Nat-Female) 0.0 143.0 0.8 1,265 71,318 AM07U04 Students (7th-Amer Ind/AK Nat-Unknown) 0.0 0.0 0.0 974 71,845 AS07M04 Students (7th-Asian/Pac Isl-Male) 0.0 307.0 2.9 1,269 71,318 AS07F04 Students (7th-Asian/Pac Isl-Female) 0.0 288.0 2.7 1,269 71,318 AS07U04 Students (7th-Asian/Pac Isl-Unknown) 0.0 529.0 # 974 71,845 HI07M04 Students (7th-Hispanic-Male) 0.0 685.0 12.7 1,265 71,318 HI07F04 Students (7th-Hispanic-Female) 0.0 692.0 12.1 1,265 71,318 HI07U04 Students (7th-Hispanic-Unknown) 0.0 0.0 0.0 974 71,845 BL07M04 Students (7th-Black-Male) 0.0 346.0 11.4 1,266 71,318 BL07F04 Students (7th-Black-Female) 0.0 346.0 10.9 1,266 71,318 BL07U04 Students (7th-Black-Unknown) 0.0 1.0 # 974 71,845 WH07M04 Students (7th-White-Male) 0.0 387.0 37.6 1,267 71,318 WH07F04 Students (7th-White-Female) 0.0 373.0 35.2 1,267 71,318 WH07U04 Students (7th-White-Unknown) 0.0 3.0 # 974 71,845 G0804 Students (Total 8th Grade) 0.0 1,423.0 129.2 514 71,576 AM08M04 Students (8th-Amer Ind/AK Nat-Male) 0.0 284.0 0.8 1,218 71,576 AM08F04 Students (8th-Amer Ind/AK Nat-Female) 0.0 282.0 0.8 1,218 71,576 AM08U04 Students (8th-Amer Ind/AK Nat-Unk) 0.0 0.0 0.0 998 72,095 AS08M04 Students (8th-Asian/Pac Isl-Male) 0.0 321.0 2.9 1,222 71,576 AS08F04 Students (8th-Asian/Pac Isl-Female) 0.0 307.0 2.7 1,222 71,576 AS08U04 Students (8th-Asian/Pac Isl-Unknown) 0.0 461.0 # 998 72,095 HI08M04 Students (8th-Hispanic-Male) 0.0 680.0 12.4 1,218 71,576 HI08F04 Students (8th-Hispanic-Female) 0.0 634.0 11.9 1,218 71,576 HI08U04 Students (8th-Hispanic-Unknown) 0.0 0.0 0.0 998 72,095 BL08M04 Students (8th-Black-Male) 0.0 326.0 11.1 1,219 71,576 BL08F04 Students (8th-Black-Female) 0.0 344.0 10.9 1,219 71,576 BL08U04 Students (8th-Black-Unknown) 0.0 29.0 # 998 72,095 WH08M04 Students (8th-White-Male) 0.0 408.0 38.4 1,222 71,576 WH08F04 Students (8th-White-Female) 0.0 414.0 36.2 1,222 71,576 WH08U04 Students (8th-White-Unknown) 0.0 8.0 # 998 72,095 G0904 Students (Total 9th Grade) 0.0 2,127.0 173.6 578 76,564 AM09M04 Students (9th-Amer Ind/AK Nat-Male) 0.0 253.0 1.1 1,068 76,564 AM09F04 Students (9th-Amer Ind/AK Nat-Female) 0.0 307.0 1.1 1,068 76,564 AM09U04 Students (9th-Amer Ind/AK Nat-Unk) 0.0 0.0 0.0 771 76,823 AS09M04 Students (9th-Asian/Pac Isl-Male) 0.0 453.0 3.9 1,073 76,564 AS09F04 Students (9th-Asian/Pac Isl-Female) 0.0 399.0 3.5 1,073 76,564 AS09U04 Students (9th-Asian/Pac Isl-Unknown) 0.0 391.0 # 771 76,823 HI09M04 Students (9th-Hispanic-Male) 0.0 1,054.0 17.3 1,068 76,564 HI09F04 Students (9th-Hispanic-Female) 0.0 898.0 16.0 1,068 76,564 HI09U04 Students (9th-Hispanic-Unknown) 0.0 0.0 0.0 771 76,823 BL09M04 Students (9th-Black-Male) 0.0 610.0 16.3 1,069 76,564 BL09F04 Students (9th-Black-Female) 0.0 546.0 15.1 1,069 76,564 BL09U04 Students (9th-Black-Unknown) 0.0 66.0 # 771 76,823

Appendix B—Value Distribution and Field Frequencies for the Common Core of Data Public Elementary/Secondary School Universe Survey: School year 2004–05
Character codes: A - Adjustment C - Combined with data provided elsewhere by the state M - Missing N - Not applicable O - Locale code assigned under old methodology R - As reported by the state T - Total based on sum of internal or external detail W - Locale code assigned under new methodology
B-8
Variable Label Minimum Maximum Mean -1 -2 ------------------------------------------------------------------------------------------------------------------ WH09M04 Students (9th-White-Male) 0.0 587.0 50.3 1,072 76,564 WH09F04 Students (9th-White-Female) 0.0 581.0 46.9 1,072 76,564 WH09U04 Students (9th-White-Unknown) 0.0 18.0 # 771 76,823 G1004 Students (Total 10th Grade) 0.0 1,689.0 156.3 459 77,316 AM10M04 Students (10th-Amer Ind/AK Nat-Male) 0.0 203.0 1.0 943 77,316 AM10F04 Students (10th-Amer Ind/AK Nat-Female) 0.0 257.0 1.0 943 77,316 AM10U04 Students (10th-Amer Ind/AK Nat-Unk) 0.0 0.0 0.0 753 77,539 AS10M04 Students (10th-Asian/Pac Isl-Male) 0.0 388.0 3.8 948 77,316 AS10F04 Students (10th-Asian/Pac Isl-Female) 0.0 336.0 3.5 948 77,316 AS10U04 Students (10th-Asian/Pac Isl-Unknown) 0.0 306.0 # 753 77,539 HI10M04 Students (10th-Hispanic-Male) 0.0 733.0 14.1 943 77,316 HI10F04 Students (10th-Hispanic-Female) 0.0 705.0 13.6 943 77,316 HI10U04 Students (10th-Hispanic-Unknown) 0.0 0.0 0.0 753 77,539 BL10M04 Students (10th-Black-Male) 0.0 788.0 12.5 944 77,316 BL10F04 Students (10th-Black-Female) 0.0 771.0 12.7 944 77,316 BL10U04 Students (10th-Black-Unknown) 0.0 1.0 # 753 77,539 WH10M04 Students (10th-White-Male) 0.0 522.0 47.3 945 77,316 WH10F04 Students (10th-White-Female) 0.0 526.0 45.0 945 77,316 WH10U04 Students (10th-White-Unknown) 0.0 6.0 # 753 77,539 G1104 Students (Total 11th Grade) 0.0 1,366.0 145.8 466 78,232 AM11M04 Students (11th-Amer Ind/AK Nat-Male) 0.0 148.0 0.9 953 78,232 AM11F04 Students (11th-Amer Ind/AK Nat-Female) 0.0 191.0 0.8 953 78,232 AM11U04 Students (11th-Amer Ind/AK Nat-Unk) 0.0 0.0 0.0 750 78,466 AS11M04 Students (11th-Asian/Pac Isl-Male) 0.0 322.0 3.8 958 78,232 AS11F04 Students (11th-Asian/Pac Isl-Female) 0.0 322.0 3.6 958 78,232 AS11U04 Students (11th-Asian/Pac Isl-Unknown) 0.0 241.0 # 750 78,466 HI11M04 Students (11th-Hispanic-Male) 0.0 593.0 12.1 953 78,232 HI11F04 Students (11th-Hispanic-Female) 0.0 553.0 12.0 953 78,232 HI11U04 Students (11th-Hispanic-Unknown) 0.0 0.0 0.0 750 78,466 BL11M04 Students (11th-Black-Male) 0.0 291.0 10.3 954 78,232 BL11F04 Students (11th-Black-Female) 0.0 382.0 11.1 954 78,232 BL11U04 Students (11th-Black-Unknown) 0.0 1.0 # 750 78,466 WH11M04 Students (11th-White-Male) 0.0 506.0 45.8 955 78,232 WH11F04 Students (11th-White-Female) 0.0 593.0 44.1 955 78,232 WH11U04 Students (11th-White-Unknown) 0.0 1.0 # 750 78,466 G1204 Students (Total 12th Grade) 0.0 1,720.0 136.2 506 78,608 AM12M04 Students (12th-Amer Ind/AK Nat-Male) 0.0 183.0 0.8 988 78,607 AM12F04 Students (12th-Amer Ind/AK Nat-Female) 0.0 163.0 0.8 988 78,607 AM12U04 Students (12th-Amer Ind/AK Nat-Unk) 0.0 0.0 0.0 734 78,832 AS12M04 Students (12th-Asian/Pac Isl-Male) 0.0 298.0 3.5 993 78,607 AS12F04 Students (12th-Asian/Pac Isl-Female) 0.0 287.0 3.4 993 78,607 AS12U04 Students (12th-Asian/Pac Isl-Unknown) 0.0 264.0 # 734 78,832 HI12M04 Students (12th-Hispanic-Male) 0.0 869.0 10.4 988 78,607 HI12F04 Students (12th-Hispanic-Female) 0.0 463.0 10.6 988 78,607 HI12U04 Students (12th-Hispanic-Unknown) 0.0 0.0 0.0 734 78,832 BL12M04 Students (12th-Black-Male) 0.0 475.0 9.0 988 78,607
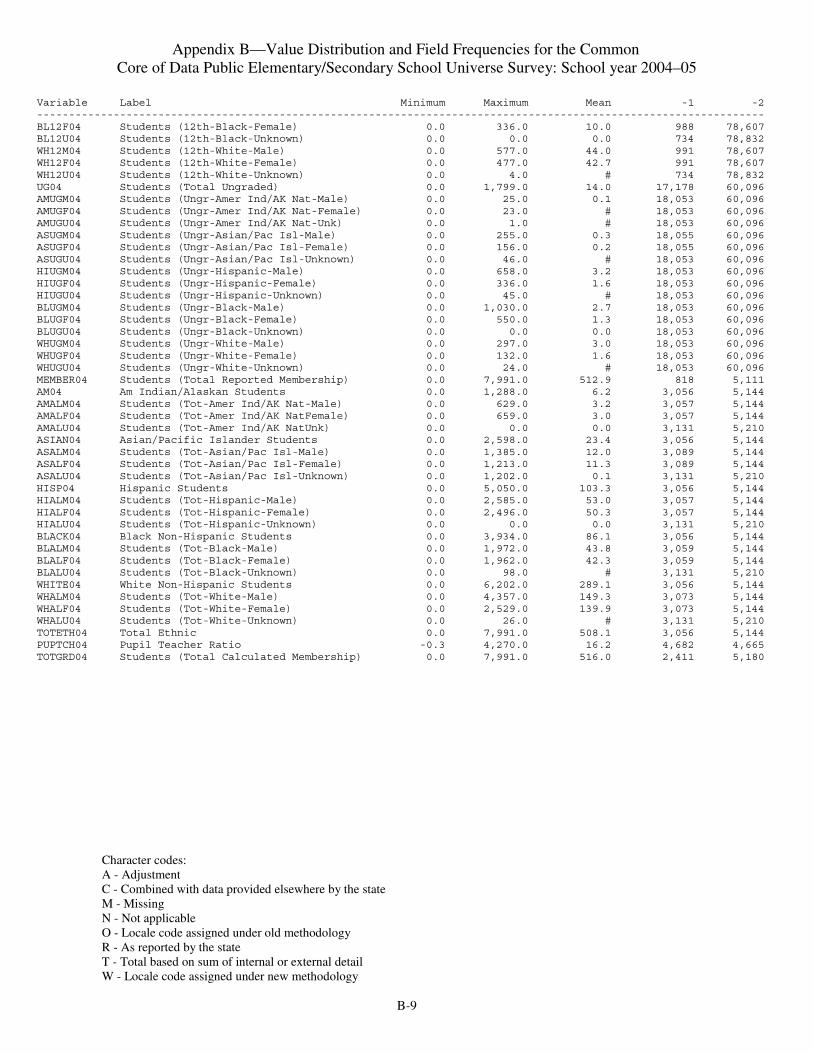
Appendix B—Value Distribution and Field Frequencies for the Common Core of Data Public Elementary/Secondary School Universe Survey: School year 2004–05
Character codes: A - Adjustment C - Combined with data provided elsewhere by the state M - Missing N - Not applicable O - Locale code assigned under old methodology R - As reported by the state T - Total based on sum of internal or external detail W - Locale code assigned under new methodology
B-9
Variable Label Minimum Maximum Mean -1 -2 ------------------------------------------------------------------------------------------------------------------ BL12F04 Students (12th-Black-Female) 0.0 336.0 10.0 988 78,607 BL12U04 Students (12th-Black-Unknown) 0.0 0.0 0.0 734 78,832 WH12M04 Students (12th-White-Male) 0.0 577.0 44.0 991 78,607 WH12F04 Students (12th-White-Female) 0.0 477.0 42.7 991 78,607 WH12U04 Students (12th-White-Unknown) 0.0 4.0 # 734 78,832 UG04 Students (Total Ungraded) 0.0 1,799.0 14.0 17,178 60,096 AMUGM04 Students (Ungr-Amer Ind/AK Nat-Male) 0.0 25.0 0.1 18,053 60,096 AMUGF04 Students (Ungr-Amer Ind/AK Nat-Female) 0.0 23.0 # 18,053 60,096 AMUGU04 Students (Ungr-Amer Ind/AK Nat-Unk) 0.0 1.0 # 18,053 60,096 ASUGM04 Students (Ungr-Asian/Pac Isl-Male) 0.0 255.0 0.3 18,055 60,096 ASUGF04 Students (Ungr-Asian/Pac Isl-Female) 0.0 156.0 0.2 18,055 60,096 ASUGU04 Students (Ungr-Asian/Pac Isl-Unknown) 0.0 46.0 # 18,053 60,096 HIUGM04 Students (Ungr-Hispanic-Male) 0.0 658.0 3.2 18,053 60,096 HIUGF04 Students (Ungr-Hispanic-Female) 0.0 336.0 1.6 18,053 60,096 HIUGU04 Students (Ungr-Hispanic-Unknown) 0.0 45.0 # 18,053 60,096 BLUGM04 Students (Ungr-Black-Male) 0.0 1,030.0 2.7 18,053 60,096 BLUGF04 Students (Ungr-Black-Female) 0.0 550.0 1.3 18,053 60,096 BLUGU04 Students (Ungr-Black-Unknown) 0.0 0.0 0.0 18,053 60,096 WHUGM04 Students (Ungr-White-Male) 0.0 297.0 3.0 18,053 60,096 WHUGF04 Students (Ungr-White-Female) 0.0 132.0 1.6 18,053 60,096 WHUGU04 Students (Ungr-White-Unknown) 0.0 24.0 # 18,053 60,096 MEMBER04 Students (Total Reported Membership) 0.0 7,991.0 512.9 818 5,111 AM04 Am Indian/Alaskan Students 0.0 1,288.0 6.2 3,056 5,144 AMALM04 Students (Tot-Amer Ind/AK Nat-Male) 0.0 629.0 3.2 3,057 5,144 AMALF04 Students (Tot-Amer Ind/AK NatFemale) 0.0 659.0 3.0 3,057 5,144 AMALU04 Students (Tot-Amer Ind/AK NatUnk) 0.0 0.0 0.0 3,131 5,210 ASIAN04 Asian/Pacific Islander Students 0.0 2,598.0 23.4 3,056 5,144 ASALM04 Students (Tot-Asian/Pac Isl-Male) 0.0 1,385.0 12.0 3,089 5,144 ASALF04 Students (Tot-Asian/Pac Isl-Female) 0.0 1,213.0 11.3 3,089 5,144 ASALU04 Students (Tot-Asian/Pac Isl-Unknown) 0.0 1,202.0 0.1 3,131 5,210 HISP04 Hispanic Students 0.0 5,050.0 103.3 3,056 5,144 HIALM04 Students (Tot-Hispanic-Male) 0.0 2,585.0 53.0 3,057 5,144 HIALF04 Students (Tot-Hispanic-Female) 0.0 2,496.0 50.3 3,057 5,144 HIALU04 Students (Tot-Hispanic-Unknown) 0.0 0.0 0.0 3,131 5,210 BLACK04 Black Non-Hispanic Students 0.0 3,934.0 86.1 3,056 5,144 BLALM04 Students (Tot-Black-Male) 0.0 1,972.0 43.8 3,059 5,144 BLALF04 Students (Tot-Black-Female) 0.0 1,962.0 42.3 3,059 5,144 BLALU04 Students (Tot-Black-Unknown) 0.0 98.0 # 3,131 5,210 WHITE04 White Non-Hispanic Students 0.0 6,202.0 289.1 3,056 5,144 WHALM04 Students (Tot-White-Male) 0.0 4,357.0 149.3 3,073 5,144 WHALF04 Students (Tot-White-Female) 0.0 2,529.0 139.9 3,073 5,144 WHALU04 Students (Tot-White-Unknown) 0.0 26.0 # 3,131 5,210 TOTETH04 Total Ethnic 0.0 7,991.0 508.1 3,056 5,144 PUPTCH04 Pupil Teacher Ratio -0.3 4,270.0 16.2 4,682 4,665 TOTGRD04 Students (Total Calculated Membership) 0.0 7,991.0 516.0 2,411 5,180

Appendix B—Value Distribution and Field Frequencies for the Common Core of Data Public Elementary/Secondary School Universe Survey: School year 2004–05
Character codes: A - Adjustment C - Combined with data provided elsewhere by the state M - Missing N - Not applicable O - Locale code assigned under old methodology R - As reported by the state T - Total based on sum of internal or external detail W - Locale code assigned under new methodology
B-10
School Type Code Cumulative Cumulative TYPE04 Frequency Percent Frequency Percent ----------------------------------------------------------- 1 91593 89.71 91593 89.71 2 2290 2.24 93883 91.95 3 1233 1.21 95116 93.16 4 6988 6.84 102104 100.00 Operational Status Code Cumulative Cumulative STATUS04 Frequency Percent Frequency Percent ------------------------------------------------------------- 1 95737 93.76 95737 93.76 2 1928 1.89 97665 95.65 3 2302 2.25 99967 97.91 4 365 0.36 100332 98.26 5 175 0.17 100507 98.44 6 289 0.28 100796 98.72 7 1308 1.28 102104 100.00 Locale Code Cumulative Cumulative LOCALE04 Frequency Percent Frequency Percent ------------------------------------------------------------- 1 12595 12.34 12595 12.34 2 13241 12.97 25836 25.30 3 21637 21.19 47473 46.49 4 10551 10.33 58024 56.83 5 1048 1.03 59072 57.85 6 8801 8.62 67873 66.47 7 17250 16.89 85123 83.37 8 13226 12.95 98349 96.32 M 8 0.01 98357 96.33 N 3747 3.67 102104 100.00

Appendix B—Value Distribution and Field Frequencies for the Common Core of Data Public Elementary/Secondary School Universe Survey: School year 2004–05
Character codes: A - Adjustment C - Combined with data provided elsewhere by the state M - Missing N - Not applicable O - Locale code assigned under old methodology R - As reported by the state T - Total based on sum of internal or external detail W - Locale code assigned under new methodology
B-11
Location Relative to Town Limits Cumulative Cumulative INOUT04 Frequency Percent Frequency Percent ------------------------------------------------------------ 1 4447 4.36 4447 4.36 2 2311 2.26 6758 6.62 M 93418 91.49 100176 98.11 N 1928 1.89 102104 100.00 School Low Grade Offered Cumulative Cumulative GSLO04 Frequency Percent Frequency Percent ----------------------------------------------------------- 00 1214 1.19 1214 1.19 01 1372 1.34 2586 2.53 02 578 0.57 3164 3.10 03 1452 1.42 4616 4.52 04 1373 1.34 5989 5.87 05 2456 2.41 8445 8.27 06 11285 11.05 19730 19.32 07 6910 6.77 26640 26.09 08 985 0.96 27625 27.06 09 14565 14.26 42190 41.32 10 946 0.93 43136 42.25 11 213 0.21 43349 42.46 12 158 0.15 43507 42.61 KG 29262 28.66 72769 71.27 N 3525 3.45 76294 74.72 PK 25250 24.73 101544 99.45 UG 560 0.55 102104 100.00
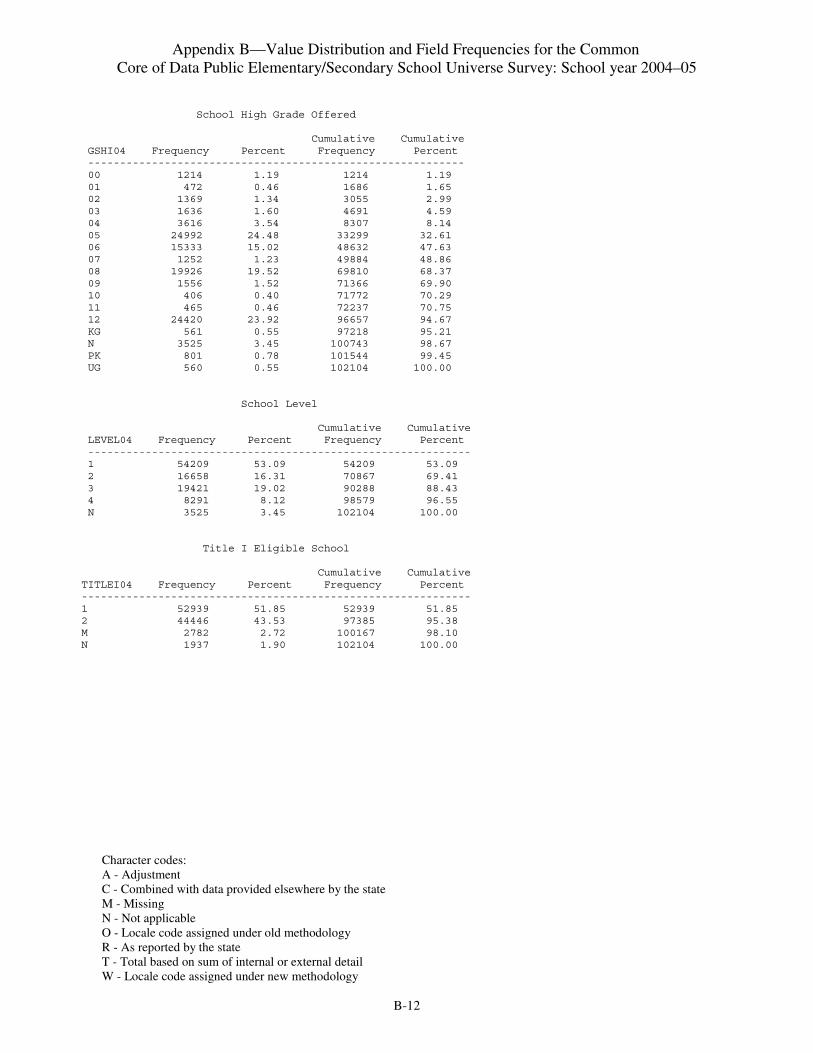
Appendix B—Value Distribution and Field Frequencies for the Common Core of Data Public Elementary/Secondary School Universe Survey: School year 2004–05
Character codes: A - Adjustment C - Combined with data provided elsewhere by the state M - Missing N - Not applicable O - Locale code assigned under old methodology R - As reported by the state T - Total based on sum of internal or external detail W - Locale code assigned under new methodology
B-12
School High Grade Offered Cumulative Cumulative GSHI04 Frequency Percent Frequency Percent ----------------------------------------------------------- 00 1214 1.19 1214 1.19 01 472 0.46 1686 1.65 02 1369 1.34 3055 2.99 03 1636 1.60 4691 4.59 04 3616 3.54 8307 8.14 05 24992 24.48 33299 32.61 06 15333 15.02 48632 47.63 07 1252 1.23 49884 48.86 08 19926 19.52 69810 68.37 09 1556 1.52 71366 69.90 10 406 0.40 71772 70.29 11 465 0.46 72237 70.75 12 24420 23.92 96657 94.67 KG 561 0.55 97218 95.21 N 3525 3.45 100743 98.67 PK 801 0.78 101544 99.45 UG 560 0.55 102104 100.00 School Level Cumulative Cumulative LEVEL04 Frequency Percent Frequency Percent ------------------------------------------------------------ 1 54209 53.09 54209 53.09 2 16658 16.31 70867 69.41 3 19421 19.02 90288 88.43 4 8291 8.12 98579 96.55 N 3525 3.45 102104 100.00 Title I Eligible School Cumulative Cumulative TITLEI04 Frequency Percent Frequency Percent ------------------------------------------------------------- 1 52939 51.85 52939 51.85 2 44446 43.53 97385 95.38 M 2782 2.72 100167 98.10 N 1937 1.90 102104 100.00

Appendix B—Value Distribution and Field Frequencies for the Common Core of Data Public Elementary/Secondary School Universe Survey: School year 2004–05
Character codes: A - Adjustment C - Combined with data provided elsewhere by the state M - Missing N - Not applicable O - Locale code assigned under old methodology R - As reported by the state T - Total based on sum of internal or external detail W - Locale code assigned under new methodology
B-13
School-wide Title I Cumulative Cumulative STITLI04 Frequency Percent Frequency Percent ------------------------------------------------------------- 1 30788 30.15 30788 30.15 2 22151 21.69 52939 51.85 M 2782 2.72 55721 54.57 N 46383 45.43 102104 100.00 Magnet School Cumulative Cumulative MAGNET04 Frequency Percent Frequency Percent ------------------------------------------------------------- 1 2210 2.16 2210 2.16 2 60516 59.27 62726 61.43 M 26161 25.62 88887 87.06 N 13217 12.94 102104 100.00 Charter School Cumulative Cumulative CHARTR04 Frequency Percent Frequency Percent ------------------------------------------------------------- 1 3796 3.72 3796 3.72 2 85285 83.53 89081 87.25 N 13023 12.75 102104 100.00 Shared Students Cumulative Cumulative SHARED04 Frequency Percent Frequency Percent ------------------------------------------------------------- 1 2736 2.68 2736 2.68 2 77864 76.26 80600 78.94 M 19567 19.16 100167 98.10 N 1937 1.90 102104 100.00

Appendix B—Value Distribution and Field Frequencies for the Common Core of Data Public Elementary/Secondary School Universe Survey: School year 2004–05
Character codes: A - Adjustment C - Combined with data provided elsewhere by the state M - Missing N - Not applicable O - Locale code assigned under old methodology R - As reported by the state T - Total based on sum of internal or external detail W - Locale code assigned under new methodology
B-14
Locale Code Adj Flag Cumulative Cumulative ILOCAL04 Frequency Percent Frequency Percent ------------------------------------------------------------- M 8 0.01 8 0.01 N 1928 1.89 1936 1.90 O 16249 15.91 18185 17.81 W 83919 82.19 102104 100.00 Teachers Adj Flag Cumulative Cumulative IFTE04 Frequency Percent Frequency Percent ----------------------------------------------------------- A 83 0.08 83 0.08 N 3540 3.47 3623 3.55 R 98481 96.45 102104 100.00 School Low Grade Offered Adj Flag Cumulative Cumulative IGSLO04 Frequency Percent Frequency Percent ------------------------------------------------------------ A 4506 4.41 4506 4.41 N 3540 3.47 8046 7.88 R 94058 92.12 102104 100.00 School High Grade Offered Adj Flag Cumulative Cumulative IGSHI04 Frequency Percent Frequency Percent ------------------------------------------------------------ A 2583 2.53 2583 2.53 N 3540 3.47 6123 6.00 R 95981 94.00 102104 100.00

Appendix B—Value Distribution and Field Frequencies for the Common Core of Data Public Elementary/Secondary School Universe Survey: School year 2004–05
Character codes: A - Adjustment C - Combined with data provided elsewhere by the state M - Missing N - Not applicable O - Locale code assigned under old methodology R - As reported by the state T - Total based on sum of internal or external detail W - Locale code assigned under new methodology
B-15
Title I Eligible School Adj Flag Cumulative Cumulative ITITLI04 Frequency Percent Frequency Percent ------------------------------------------------------------- A 296 0.29 296 0.29 N 1937 1.90 2233 2.19 R 99871 97.81 102104 100.00 School-wide Title I Adj Flag Cumulative Cumulative ISTITL04 Frequency Percent Frequency Percent ------------------------------------------------------------- A 1016 1.00 1016 1.00 N 1937 1.90 2953 2.89 R 99151 97.11 102104 100.00 Magnet School Adj Flag Cumulative Cumulative IMAGNE04 Frequency Percent Frequency Percent ------------------------------------------------------------- A 15018 14.71 15018 14.71 N 1937 1.90 16955 16.61 R 85149 83.39 102104 100.00 Charter School Adj Flag Cumulative Cumulative ICHART04 Frequency Percent Frequency Percent ------------------------------------------------------------- A 11123 10.89 11123 10.89 N 1937 1.90 13060 12.79 R 89044 87.21 102104 100.00 Shared Students Adj Flag Cumulative Cumulative ISHARE04 Frequency Percent Frequency Percent ------------------------------------------------------------- N 1937 1.90 1937 1.90 R 100167 98.10 102104 100.00 Free Lunch Eligible Adj Flag Cumulative Cumulative IFRELC04 Frequency Percent Frequency Percent ------------------------------------------------------------- A 6895 6.75 6895 6.75 N 3540 3.47 10435 10.22 R 91669 89.78 102104 100.00

Appendix B—Value Distribution and Field Frequencies for the Common Core of Data Public Elementary/Secondary School Universe Survey: School year 2004–05
Character codes: A - Adjustment C - Combined with data provided elsewhere by the state M - Missing N - Not applicable O - Locale code assigned under old methodology R - As reported by the state T - Total based on sum of internal or external detail W - Locale code assigned under new methodology
B-16
Red-price Lunch El. Adj Flag Cumulative Cumulative IREDLC04 Frequency Percent Frequency Percent ------------------------------------------------------------- A 4628 4.53 4628 4.53 N 3540 3.47 8168 8.00 R 93936 92.00 102104 100.00 Total Free and Red Adj Flag Cumulative Cumulative ITOTFR04 Frequency Percent Frequency Percent ------------------------------------------------------------- A 6617 6.48 6617 6.48 N 3540 3.47 10157 9.95 R 91939 90.04 102096 99.99 T 8 0.01 102104 100.00 Migrant Students Adj Flag Cumulative Cumulative IMIGRN04 Frequency Percent Frequency Percent ------------------------------------------------------------- A 6694 6.56 6694 6.56 N 3540 3.47 10234 10.02 R 91870 89.98 102104 100.00

Appendix B—Value Distribution and Field Frequencies for the Common Core of Data Public Elementary/Secondary School Universe Survey: School year 2004–05
Character codes: A - Adjustment C - Combined with data provided elsewhere by the state M - Missing N - Not applicable O - Locale code assigned under old methodology R - As reported by the state T - Total based on sum of internal or external detail W - Locale code assigned under new methodology
B-17
Total PK Students Adj Flag Cumulative Cumulative IPK04 Frequency Percent Frequency Percent ---------------------------------------------------------- A 55107 53.97 55107 53.97 N 3524 3.45 58631 57.42 R 43473 42.58 102104 100.00 PK-Amer Ind/AK Nat-Male Adj Flag Cumulative Cumulative IAMPKM04 Frequency Percent Frequency Percent ------------------------------------------------------------- A 54851 53.72 54851 53.72 N 3524 3.45 58375 57.17 R 43729 42.83 102104 100.00 PK-Amer Ind/AK Nat-Fem Adj Flag Cumulative Cumulative IAMPKF04 Frequency Percent Frequency Percent ------------------------------------------------------------- A 54851 53.72 54851 53.72 N 3524 3.45 58375 57.17 R 43729 42.83 102104 100.00 PK-Amer Ind/AK Nat-Unkn Adj Flag Cumulative Cumulative IAMPKU04 Frequency Percent Frequency Percent ------------------------------------------------------------- A 60278 59.04 60278 59.04 N 3525 3.45 63803 62.49 R 38301 37.51 102104 100.00

Appendix B—Value Distribution and Field Frequencies for the Common Core of Data Public Elementary/Secondary School Universe Survey: School year 2004–05
Character codes: A - Adjustment C - Combined with data provided elsewhere by the state M - Missing N - Not applicable O - Locale code assigned under old methodology R - As reported by the state T - Total based on sum of internal or external detail W - Locale code assigned under new methodology
B-18
PK-Asian/Pac Isl-Male Adj Flag Cumulative Cumulative IASPKM04 Frequency Percent Frequency Percent ------------------------------------------------------------- A 54859 53.73 54859 53.73 N 3524 3.45 58383 57.18 R 43721 42.82 102104 100.00 PK-Asian/Pac Isl-Fem Adj Flag Cumulative Cumulative IASPKF04 Frequency Percent Frequency Percent ------------------------------------------------------------- A 54859 53.73 54859 53.73 N 3524 3.45 58383 57.18 R 43721 42.82 102104 100.00 PK-Asian/Pac Isl-Unkn Adj Flag Cumulative Cumulative IASPKU04 Frequency Percent Frequency Percent ------------------------------------------------------------- A 60278 59.04 60278 59.04 N 3525 3.45 63803 62.49 R 38301 37.51 102104 100.00 PK-Hispanic-Male Adj Flag Cumulative Cumulative IHIPKM04 Frequency Percent Frequency Percent ------------------------------------------------------------- A 54846 53.72 54846 53.72 N 3524 3.45 58370 57.17 R 43734 42.83 102104 100.00 PK-Hispanic-Fem Adj Flag Cumulative Cumulative IHIPKF04 Frequency Percent Frequency Percent ------------------------------------------------------------- A 54846 53.72 54846 53.72 N 3524 3.45 58370 57.17 R 43734 42.83 102104 100.00 PK-Hispanic-Unkn Adj Flag Cumulative Cumulative IHIPKU04 Frequency Percent Frequency Percent ------------------------------------------------------------- A 60278 59.04 60278 59.04 N 3525 3.45 63803 62.49 R 38301 37.51 102104 100.00

Appendix B—Value Distribution and Field Frequencies for the Common Core of Data Public Elementary/Secondary School Universe Survey: School year 2004–05
Character codes: A - Adjustment C - Combined with data provided elsewhere by the state M - Missing N - Not applicable O - Locale code assigned under old methodology R - As reported by the state T - Total based on sum of internal or external detail W - Locale code assigned under new methodology
B-19
PK-Black-Male Adj Flag Cumulative Cumulative IBLPKM04 Frequency Percent Frequency Percent ------------------------------------------------------------- A 54840 53.71 54840 53.71 N 3524 3.45 58364 57.16 R 43740 42.84 102104 100.00 PK-Black-Fem Adj Flag Cumulative Cumulative IBLPKF04 Frequency Percent Frequency Percent ------------------------------------------------------------- A 54840 53.71 54840 53.71 N 3524 3.45 58364 57.16 R 43740 42.84 102104 100.00 PK-Black-Unkn Adj Flag Cumulative Cumulative IBLPKU04 Frequency Percent Frequency Percent ------------------------------------------------------------- A 60278 59.04 60278 59.04 N 3525 3.45 63803 62.49 R 38301 37.51 102104 100.00

Appendix B—Value Distribution and Field Frequencies for the Common Core of Data Public Elementary/Secondary School Universe Survey: School year 2004–05
Character codes: A - Adjustment C - Combined with data provided elsewhere by the state M - Missing N - Not applicable O - Locale code assigned under old methodology R - As reported by the state T - Total based on sum of internal or external detail W - Locale code assigned under new methodology
B-20
PK-White-Male Adj Flag Cumulative Cumulative IWHPKM04 Frequency Percent Frequency Percent ------------------------------------------------------------- A 54846 53.72 54846 53.72 N 3524 3.45 58370 57.17 R 43734 42.83 102104 100.00 PK-White-Fem Adj Flag Cumulative Cumulative IWHPKF04 Frequency Percent Frequency Percent ------------------------------------------------------------- A 54849 53.72 54849 53.72 N 3524 3.45 58373 57.17 R 43731 42.83 102104 100.00 PK-White-Unkn Adj Flag Cumulative Cumulative IWHPKU04 Frequency Percent Frequency Percent ------------------------------------------------------------- A 60278 59.04 60278 59.04 N 3525 3.45 63803 62.49 R 38301 37.51 102104 100.00 Total KG Students Adj Flag Cumulative Cumulative IKG04 Frequency Percent Frequency Percent ---------------------------------------------------------- A 33601 32.91 33601 32.91 N 3524 3.45 37125 36.36 R 64979 63.64 102104 100.00 KG-Amer Ind/AK Nat-Male Adj Flag Cumulative Cumulative IAMKGM04 Frequency Percent Frequency Percent ------------------------------------------------------------- A 34009 33.31 34009 33.31 N 3525 3.45 37534 36.76 R 64570 63.24 102104 100.00 KG-Amer Ind/AK Nat-Fem Adj Flag Cumulative Cumulative IAMKGF04 Frequency Percent Frequency Percent ------------------------------------------------------------- A 34010 33.31 34010 33.31 N 3525 3.45 37535 36.76 R 64569 63.24 102104 100.00

Appendix B—Value Distribution and Field Frequencies for the Common Core of Data Public Elementary/Secondary School Universe Survey: School year 2004–05
Character codes: A - Adjustment C - Combined with data provided elsewhere by the state M - Missing N - Not applicable O - Locale code assigned under old methodology R - As reported by the state T - Total based on sum of internal or external detail W - Locale code assigned under new methodology
B-21
KG-Amer Ind/AK Nat-Unkn Adj Flag Cumulative Cumulative IAMKGU04 Frequency Percent Frequency Percent ------------------------------------------------------------- A 45730 44.79 45730 44.79 N 3525 3.45 49255 48.24 R 52849 51.76 102104 100.00 KG-Asian/Pac Isl-Male Adj Flag Cumulative Cumulative IASKGM04 Frequency Percent Frequency Percent ------------------------------------------------------------- A 34021 33.32 34021 33.32 N 3525 3.45 37546 36.77 R 64558 63.23 102104 100.00 KG-Asian/Pac Isl-Fem Adj Flag Cumulative Cumulative IASKGF04 Frequency Percent Frequency Percent ------------------------------------------------------------- A 34021 33.32 34021 33.32 N 3525 3.45 37546 36.77 R 64558 63.23 102104 100.00

Appendix B—Value Distribution and Field Frequencies for the Common Core of Data Public Elementary/Secondary School Universe Survey: School year 2004–05
Character codes: A - Adjustment C - Combined with data provided elsewhere by the state M - Missing N - Not applicable O - Locale code assigned under old methodology R - As reported by the state T - Total based on sum of internal or external detail W - Locale code assigned under new methodology
B-22
KG-Asian/Pac Isl-Unkn Adj Flag Cumulative Cumulative IASKGU04 Frequency Percent Frequency Percent ------------------------------------------------------------- A 45730 44.79 45730 44.79 N 3525 3.45 49255 48.24 R 52849 51.76 102104 100.00 KG-Hispanic-Male Adj Flag Cumulative Cumulative IHIKGM04 Frequency Percent Frequency Percent ------------------------------------------------------------- A 34010 33.31 34010 33.31 N 3525 3.45 37535 36.76 R 64569 63.24 102104 100.00 KG-Hispanic-Fem Adj Flag Cumulative Cumulative IHIKGF04 Frequency Percent Frequency Percent ------------------------------------------------------------- A 34010 33.31 34010 33.31 N 3525 3.45 37535 36.76 R 64569 63.24 102104 100.00 KG-Hispanic-Unkn Adj Flag Cumulative Cumulative IHIKGU04 Frequency Percent Frequency Percent ------------------------------------------------------------- A 45730 44.79 45730 44.79 N 3525 3.45 49255 48.24 R 52849 51.76 102104 100.00

Appendix B—Value Distribution and Field Frequencies for the Common Core of Data Public Elementary/Secondary School Universe Survey: School year 2004–05
Character codes: A - Adjustment C - Combined with data provided elsewhere by the state M - Missing N - Not applicable O - Locale code assigned under old methodology R - As reported by the state T - Total based on sum of internal or external detail W - Locale code assigned under new methodology
B-23
KG-Black-Male Adj Flag Cumulative Cumulative IBLKGM04 Frequency Percent Frequency Percent ------------------------------------------------------------- A 34008 33.31 34008 33.31 N 3525 3.45 37533 36.76 R 64571 63.24 102104 100.00 KG-Black-Fem Adj Flag Cumulative Cumulative IBLKGF04 Frequency Percent Frequency Percent ------------------------------------------------------------- A 34009 33.31 34009 33.31 N 3525 3.45 37534 36.76 R 64570 63.24 102104 100.00 KG-Black-Unkn Adj Flag Cumulative Cumulative IBLKGU04 Frequency Percent Frequency Percent ------------------------------------------------------------- A 45730 44.79 45730 44.79 N 3525 3.45 49255 48.24 R 52849 51.76 102104 100.00 KG-White-Male Adj Flag Cumulative Cumulative IWHKGM04 Frequency Percent Frequency Percent ------------------------------------------------------------- A 33481 32.79 33481 32.79 N 3524 3.45 37005 36.24 R 65099 63.76 102104 100.00 KG-White-Fem Adj Flag Cumulative Cumulative IWHKGF04 Frequency Percent Frequency Percent ------------------------------------------------------------- A 33481 32.79 33481 32.79 N 3524 3.45 37005 36.24 R 65099 63.76 102104 100.00 KG-White-Unkn Adj Flag Cumulative Cumulative IWHKGU04 Frequency Percent Frequency Percent ------------------------------------------------------------- A 45730 44.79 45730 44.79 N 3525 3.45 49255 48.24 R 52849 51.76 102104 100.00

Appendix B—Value Distribution and Field Frequencies for the Common Core of Data Public Elementary/Secondary School Universe Survey: School year 2004–05
Character codes: A - Adjustment C - Combined with data provided elsewhere by the state M - Missing N - Not applicable O - Locale code assigned under old methodology R - As reported by the state T - Total based on sum of internal or external detail W - Locale code assigned under new methodology
B-24
Total 1st Grade Students Adj Flag Cumulative Cumulative IG0104 Frequency Percent Frequency Percent ----------------------------------------------------------- A 32960 32.28 32960 32.28 N 3524 3.45 36484 35.73 R 65620 64.27 102104 100.00 1st-Amer Ind/AK Nat-Male Adj Flag Cumulative Cumulative IAM01M04 Frequency Percent Frequency Percent ------------------------------------------------------------- A 33347 32.66 33347 32.66 N 3525 3.45 36872 36.11 R 65232 63.89 102104 100.00 1st-Amer Ind/AK Nat-Fem Adj Flag Cumulative Cumulative IAM01F04 Frequency Percent Frequency Percent ------------------------------------------------------------- A 33347 32.66 33347 32.66 N 3525 3.45 36872 36.11 R 65232 63.89 102104 100.00
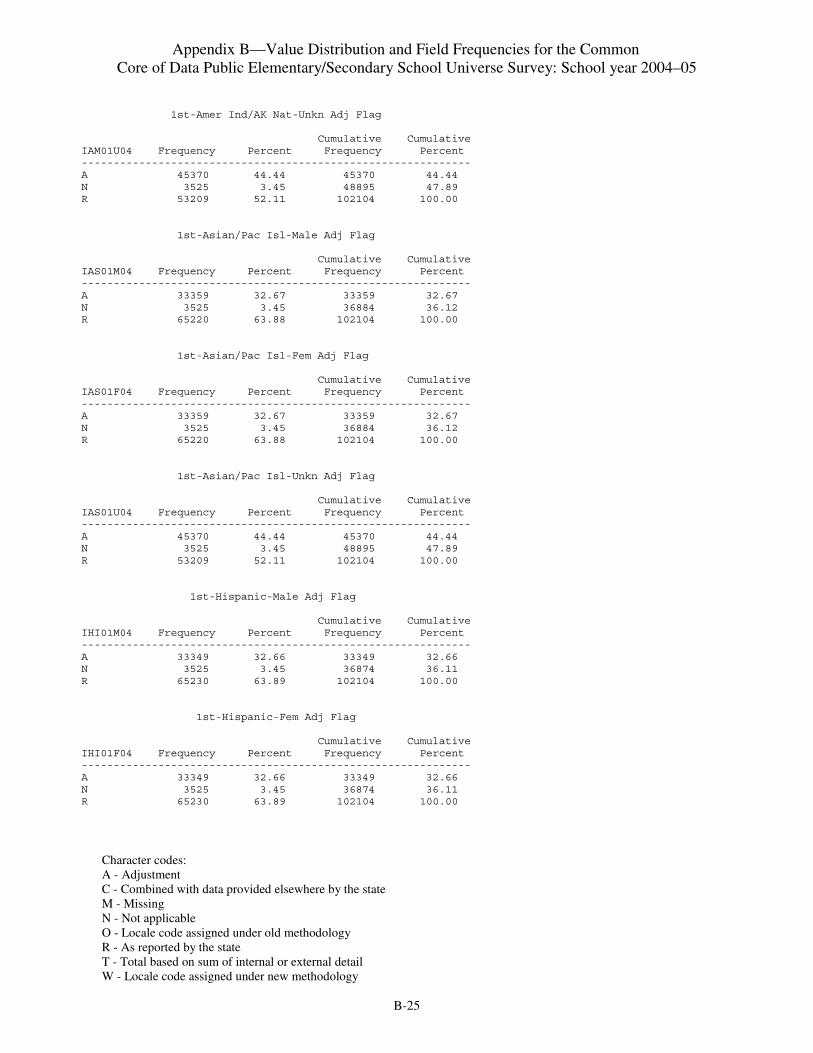
Appendix B—Value Distribution and Field Frequencies for the Common Core of Data Public Elementary/Secondary School Universe Survey: School year 2004–05
Character codes: A - Adjustment C - Combined with data provided elsewhere by the state M - Missing N - Not applicable O - Locale code assigned under old methodology R - As reported by the state T - Total based on sum of internal or external detail W - Locale code assigned under new methodology
B-25
1st-Amer Ind/AK Nat-Unkn Adj Flag Cumulative Cumulative IAM01U04 Frequency Percent Frequency Percent ------------------------------------------------------------- A 45370 44.44 45370 44.44 N 3525 3.45 48895 47.89 R 53209 52.11 102104 100.00 1st-Asian/Pac Isl-Male Adj Flag Cumulative Cumulative IAS01M04 Frequency Percent Frequency Percent ------------------------------------------------------------- A 33359 32.67 33359 32.67 N 3525 3.45 36884 36.12 R 65220 63.88 102104 100.00 1st-Asian/Pac Isl-Fem Adj Flag Cumulative Cumulative IAS01F04 Frequency Percent Frequency Percent ------------------------------------------------------------- A 33359 32.67 33359 32.67 N 3525 3.45 36884 36.12 R 65220 63.88 102104 100.00 1st-Asian/Pac Isl-Unkn Adj Flag Cumulative Cumulative IAS01U04 Frequency Percent Frequency Percent ------------------------------------------------------------- A 45370 44.44 45370 44.44 N 3525 3.45 48895 47.89 R 53209 52.11 102104 100.00 1st-Hispanic-Male Adj Flag Cumulative Cumulative IHI01M04 Frequency Percent Frequency Percent ------------------------------------------------------------- A 33349 32.66 33349 32.66 N 3525 3.45 36874 36.11 R 65230 63.89 102104 100.00 1st-Hispanic-Fem Adj Flag Cumulative Cumulative IHI01F04 Frequency Percent Frequency Percent ------------------------------------------------------------- A 33349 32.66 33349 32.66 N 3525 3.45 36874 36.11 R 65230 63.89 102104 100.00

Appendix B—Value Distribution and Field Frequencies for the Common Core of Data Public Elementary/Secondary School Universe Survey: School year 2004–05
Character codes: A - Adjustment C - Combined with data provided elsewhere by the state M - Missing N - Not applicable O - Locale code assigned under old methodology R - As reported by the state T - Total based on sum of internal or external detail W - Locale code assigned under new methodology
B-26
1st-Hispanic-Unkn Adj Flag Cumulative Cumulative IHI01U04 Frequency Percent Frequency Percent ------------------------------------------------------------- A 45370 44.44 45370 44.44 N 3525 3.45 48895 47.89 R 53209 52.11 102104 100.00 1st-Black-Male Adj Flag Cumulative Cumulative IBL01M04 Frequency Percent Frequency Percent ------------------------------------------------------------- A 33349 32.66 33349 32.66 N 3525 3.45 36874 36.11 R 65230 63.89 102104 100.00 1st-Black-Fem Adj Flag Cumulative Cumulative IBL01F04 Frequency Percent Frequency Percent ------------------------------------------------------------- A 33347 32.66 33347 32.66 N 3525 3.45 36872 36.11 R 65232 63.89 102104 100.00

Appendix B—Value Distribution and Field Frequencies for the Common Core of Data Public Elementary/Secondary School Universe Survey: School year 2004–05
Character codes: A - Adjustment C - Combined with data provided elsewhere by the state M - Missing N - Not applicable O - Locale code assigned under old methodology R - As reported by the state T - Total based on sum of internal or external detail W - Locale code assigned under new methodology
B-27
1st-Black-Unkn Adj Flag Cumulative Cumulative IBL01U04 Frequency Percent Frequency Percent ------------------------------------------------------------- A 45370 44.44 45370 44.44 N 3525 3.45 48895 47.89 R 53209 52.11 102104 100.00 1st-White-Male Adj Flag Cumulative Cumulative IWH01M04 Frequency Percent Frequency Percent ------------------------------------------------------------- A 33351 32.66 33351 32.66 N 3525 3.45 36876 36.12 R 65228 63.88 102104 100.00 1st-White-Fem Adj Flag Cumulative Cumulative IWH01F04 Frequency Percent Frequency Percent ------------------------------------------------------------- A 33352 32.66 33352 32.66 N 3525 3.45 36877 36.12 R 65227 63.88 102104 100.00 1st-White-Unkn Adj Flag Cumulative Cumulative IWH01U04 Frequency Percent Frequency Percent ------------------------------------------------------------- A 45370 44.44 45370 44.44 N 3525 3.45 48895 47.89 R 53209 52.11 102104 100.00

Appendix B—Value Distribution and Field Frequencies for the Common Core of Data Public Elementary/Secondary School Universe Survey: School year 2004–05
Character codes: A - Adjustment C - Combined with data provided elsewhere by the state M - Missing N - Not applicable O - Locale code assigned under old methodology R - As reported by the state T - Total based on sum of internal or external detail W - Locale code assigned under new methodology
B-28
Total 2nd Grade Students Adj Flag Cumulative Cumulative IG0204 Frequency Percent Frequency Percent ----------------------------------------------------------- A 33391 32.70 33391 32.70 N 3525 3.45 36916 36.16 R 65188 63.84 102104 100.00 2nd-Amer Ind/AK Nat-Male Adj Flag Cumulative Cumulative IAM02M04 Frequency Percent Frequency Percent ------------------------------------------------------------- A 33271 32.59 33271 32.59 N 3525 3.45 36796 36.04 R 65308 63.96 102104 100.00 2nd-Amer Ind/AK Nat-Fem Adj Flag Cumulative Cumulative IAM02F04 Frequency Percent Frequency Percent ------------------------------------------------------------- A 33271 32.59 33271 32.59 N 3525 3.45 36796 36.04 R 65308 63.96 102104 100.00 2nd-Amer Ind/AK Nat-Unkn Adj Flag Cumulative Cumulative IAM02U04 Frequency Percent Frequency Percent ------------------------------------------------------------- A 45278 44.34 45278 44.34 N 3525 3.45 48803 47.80 R 53301 52.20 102104 100.00 2nd-Asian/Pac Isl-Male Adj Flag Cumulative Cumulative IAS02M04 Frequency Percent Frequency Percent ------------------------------------------------------------- A 33283 32.60 33283 32.60 N 3525 3.45 36808 36.05 R 65296 63.95 102104 100.00 2nd-Asian/Pac Isl-Fem Adj Flag Cumulative Cumulative IAS02F04 Frequency Percent Frequency Percent ------------------------------------------------------------- A 33283 32.60 33283 32.60 N 3525 3.45 36808 36.05 R 65296 63.95 102104 100.00

Appendix B—Value Distribution and Field Frequencies for the Common Core of Data Public Elementary/Secondary School Universe Survey: School year 2004–05
Character codes: A - Adjustment C - Combined with data provided elsewhere by the state M - Missing N - Not applicable O - Locale code assigned under old methodology R - As reported by the state T - Total based on sum of internal or external detail W - Locale code assigned under new methodology
B-29
2nd-Asian/Pac Isl-Unkn Adj Flag Cumulative Cumulative IAS02U04 Frequency Percent Frequency Percent ------------------------------------------------------------- A 45278 44.34 45278 44.34 N 3525 3.45 48803 47.80 R 53301 52.20 102104 100.00 2nd-Hispanic-Male Adj Flag Cumulative Cumulative IHI02M04 Frequency Percent Frequency Percent ------------------------------------------------------------- A 33271 32.59 33271 32.59 N 3525 3.45 36796 36.04 R 65308 63.96 102104 100.00 2nd-Hispanic-Fem Adj Flag Cumulative Cumulative IHI02F04 Frequency Percent Frequency Percent ------------------------------------------------------------- A 33271 32.59 33271 32.59 N 3525 3.45 36796 36.04 R 65308 63.96 102104 100.00

Appendix B—Value Distribution and Field Frequencies for the Common Core of Data Public Elementary/Secondary School Universe Survey: School year 2004–05
Character codes: A - Adjustment C - Combined with data provided elsewhere by the state M - Missing N - Not applicable O - Locale code assigned under old methodology R - As reported by the state T - Total based on sum of internal or external detail W - Locale code assigned under new methodology
B-30
2nd-Hispanic-Unkn Adj Flag Cumulative Cumulative IHI02U04 Frequency Percent Frequency Percent ------------------------------------------------------------- A 45278 44.34 45278 44.34 N 3525 3.45 48803 47.80 R 53301 52.20 102104 100.00 2nd-Black-Male Adj Flag Cumulative Cumulative IBL02M04 Frequency Percent Frequency Percent ------------------------------------------------------------- A 33271 32.59 33271 32.59 N 3525 3.45 36796 36.04 R 65308 63.96 102104 100.00 2nd-Black-Fem Adj Flag Cumulative Cumulative IBL02F04 Frequency Percent Frequency Percent ------------------------------------------------------------- A 33271 32.59 33271 32.59 N 3525 3.45 36796 36.04 R 65308 63.96 102104 100.00 2nd-Black-Unkn Adj Flag Cumulative Cumulative IBL02U04 Frequency Percent Frequency Percent ------------------------------------------------------------- A 45278 44.34 45278 44.34 N 3525 3.45 48803 47.80 R 53301 52.20 102104 100.00

Appendix B—Value Distribution and Field Frequencies for the Common Core of Data Public Elementary/Secondary School Universe Survey: School year 2004–05
Character codes: A - Adjustment C - Combined with data provided elsewhere by the state M - Missing N - Not applicable O - Locale code assigned under old methodology R - As reported by the state T - Total based on sum of internal or external detail W - Locale code assigned under new methodology
B-31
2nd-White-Male Adj Flag Cumulative Cumulative IWH02M04 Frequency Percent Frequency Percent ------------------------------------------------------------- A 33275 32.59 33275 32.59 N 3525 3.45 36800 36.04 R 65304 63.96 102104 100.00 2nd-White-Fem Adj Flag Cumulative Cumulative IWH02F04 Frequency Percent Frequency Percent ------------------------------------------------------------- A 33275 32.59 33275 32.59 N 3525 3.45 36800 36.04 R 65304 63.96 102104 100.00 2nd-White-Unkn Adj Flag Cumulative Cumulative IWH02U04 Frequency Percent Frequency Percent ------------------------------------------------------------- A 45278 44.34 45278 44.34 N 3525 3.45 48803 47.80 R 53301 52.20 102104 100.00 Total 3rd Grade Students Adj Flag Cumulative Cumulative IG0304 Frequency Percent Frequency Percent ----------------------------------------------------------- A 33300 32.61 33300 32.61 N 3525 3.45 36825 36.07 R 65279 63.93 102104 100.00

Appendix B—Value Distribution and Field Frequencies for the Common Core of Data Public Elementary/Secondary School Universe Survey: School year 2004–05
Character codes: A - Adjustment C - Combined with data provided elsewhere by the state M - Missing N - Not applicable O - Locale code assigned under old methodology R - As reported by the state T - Total based on sum of internal or external detail W - Locale code assigned under new methodology
B-32
3rd-Amer Ind/AK Nat-Male Adj Flag Cumulative Cumulative IAM03M04 Frequency Percent Frequency Percent ------------------------------------------------------------- A 33300 32.61 33300 32.61 N 3525 3.45 36825 36.07 R 65279 63.93 102104 100.00 3rd-Amer Ind/AK Nat-Fem Adj Flag Cumulative Cumulative IAM03F04 Frequency Percent Frequency Percent ------------------------------------------------------------- A 33300 32.61 33300 32.61 N 3525 3.45 36825 36.07 R 65279 63.93 102104 100.00 3rd-Amer Ind/AK Nat-Unkn Adj Flag Cumulative Cumulative IAM03U04 Frequency Percent Frequency Percent ------------------------------------------------------------- A 45359 44.42 45359 44.42 N 3525 3.45 48884 47.88 R 53220 52.12 102104 100.00 3rd-Asian/Pac Isl-Male Adj Flag Cumulative Cumulative IAS03M04 Frequency Percent Frequency Percent ------------------------------------------------------------- A 33312 32.63 33312 32.63 N 3525 3.45 36837 36.08 R 65267 63.92 102104 100.00

Appendix B—Value Distribution and Field Frequencies for the Common Core of Data Public Elementary/Secondary School Universe Survey: School year 2004–05
Character codes: A - Adjustment C - Combined with data provided elsewhere by the state M - Missing N - Not applicable O - Locale code assigned under old methodology R - As reported by the state T - Total based on sum of internal or external detail W - Locale code assigned under new methodology
B-33
3rd-Asian/Pac Isl-Fem Adj Flag Cumulative Cumulative IAS03F04 Frequency Percent Frequency Percent ------------------------------------------------------------- A 33312 32.63 33312 32.63 N 3525 3.45 36837 36.08 R 65267 63.92 102104 100.00 3rd-Asian/Pac Isl-Unkn Adj Flag Cumulative Cumulative IAS03U04 Frequency Percent Frequency Percent ------------------------------------------------------------- A 45359 44.42 45359 44.42 N 3525 3.45 48884 47.88 R 53220 52.12 102104 100.00 3rd-Hispanic-Male Adj Flag Cumulative Cumulative IHI03M04 Frequency Percent Frequency Percent ------------------------------------------------------------- A 33300 32.61 33300 32.61 N 3525 3.45 36825 36.07 R 65279 63.93 102104 100.00 3rd-Hispanic-Fem Adj Flag Cumulative Cumulative IHI03F04 Frequency Percent Frequency Percent ------------------------------------------------------------- A 33300 32.61 33300 32.61 N 3525 3.45 36825 36.07 R 65279 63.93 102104 100.00 3rd-Hispanic-Unkn Adj Flag Cumulative Cumulative IHI03U04 Frequency Percent Frequency Percent ------------------------------------------------------------- A 45359 44.42 45359 44.42 N 3525 3.45 48884 47.88 R 53220 52.12 102104 100.00 3rd-Black-Male Adj Flag Cumulative Cumulative IBL03M04 Frequency Percent Frequency Percent ------------------------------------------------------------- A 33300 32.61 33300 32.61 N 3525 3.45 36825 36.07 R 65279 63.93 102104 100.00
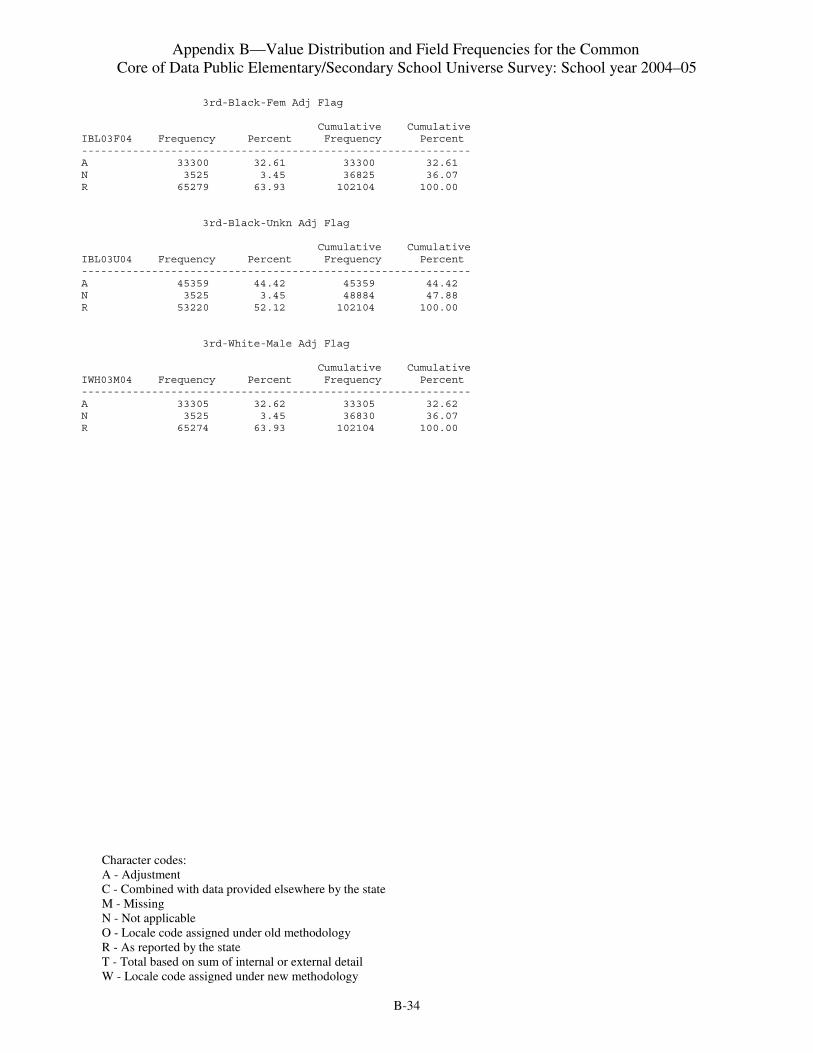
Appendix B—Value Distribution and Field Frequencies for the Common Core of Data Public Elementary/Secondary School Universe Survey: School year 2004–05
Character codes: A - Adjustment C - Combined with data provided elsewhere by the state M - Missing N - Not applicable O - Locale code assigned under old methodology R - As reported by the state T - Total based on sum of internal or external detail W - Locale code assigned under new methodology
B-34
3rd-Black-Fem Adj Flag Cumulative Cumulative IBL03F04 Frequency Percent Frequency Percent ------------------------------------------------------------- A 33300 32.61 33300 32.61 N 3525 3.45 36825 36.07 R 65279 63.93 102104 100.00 3rd-Black-Unkn Adj Flag Cumulative Cumulative IBL03U04 Frequency Percent Frequency Percent ------------------------------------------------------------- A 45359 44.42 45359 44.42 N 3525 3.45 48884 47.88 R 53220 52.12 102104 100.00 3rd-White-Male Adj Flag Cumulative Cumulative IWH03M04 Frequency Percent Frequency Percent ------------------------------------------------------------- A 33305 32.62 33305 32.62 N 3525 3.45 36830 36.07 R 65274 63.93 102104 100.00

Appendix B—Value Distribution and Field Frequencies for the Common Core of Data Public Elementary/Secondary School Universe Survey: School year 2004–05
Character codes: A - Adjustment C - Combined with data provided elsewhere by the state M - Missing N - Not applicable O - Locale code assigned under old methodology R - As reported by the state T - Total based on sum of internal or external detail W - Locale code assigned under new methodology
B-35
3rd-White-Fem Adj Flag Cumulative Cumulative IWH03F04 Frequency Percent Frequency Percent ------------------------------------------------------------- A 33306 32.62 33306 32.62 N 3525 3.45 36831 36.07 R 65273 63.93 102104 100.00 3rd-White-Unkn Adj Flag Cumulative Cumulative IWH03U04 Frequency Percent Frequency Percent ------------------------------------------------------------- A 45359 44.42 45359 44.42 N 3525 3.45 48884 47.88 R 53220 52.12 102104 100.00 Total 4th Grade Students Adj Flag Cumulative Cumulative IG0404 Frequency Percent Frequency Percent ----------------------------------------------------------- A 33792 33.10 33792 33.10 N 3525 3.45 37317 36.55 R 64787 63.45 102104 100.00 4th-Amer Ind/AK Nat-Male Adj Flag Cumulative Cumulative IAM04M04 Frequency Percent Frequency Percent ------------------------------------------------------------- A 33670 32.98 33670 32.98 N 3525 3.45 37195 36.43 R 64909 63.57 102104 100.00 4th-Amer Ind/AK Nat-Fem Adj Flag Cumulative Cumulative IAM04F04 Frequency Percent Frequency Percent ------------------------------------------------------------- A 33670 32.98 33670 32.98 N 3525 3.45 37195 36.43 R 64909 63.57 102104 100.00 4th-Amer Ind/AK Nat-Unkn Adj Flag Cumulative Cumulative IAM04U04 Frequency Percent Frequency Percent ------------------------------------------------------------- A 45511 44.57 45511 44.57 N 3525 3.45 49036 48.03 R 53068 51.97 102104 100.00

Appendix B—Value Distribution and Field Frequencies for the Common Core of Data Public Elementary/Secondary School Universe Survey: School year 2004–05
Character codes: A - Adjustment C - Combined with data provided elsewhere by the state M - Missing N - Not applicable O - Locale code assigned under old methodology R - As reported by the state T - Total based on sum of internal or external detail W - Locale code assigned under new methodology
B-36
4th-Asian/Pac Isl-Male Adj Flag Cumulative Cumulative IAS04M04 Frequency Percent Frequency Percent ------------------------------------------------------------- A 33682 32.99 33682 32.99 N 3525 3.45 37207 36.44 R 64897 63.56 102104 100.00 4th-Asian/Pac Isl-Fem Adj Flag Cumulative Cumulative IAS04F04 Frequency Percent Frequency Percent ------------------------------------------------------------- A 33682 32.99 33682 32.99 N 3525 3.45 37207 36.44 R 64897 63.56 102104 100.00 4th-Asian/Pac Isl-Unkn Adj Flag Cumulative Cumulative IAS04U04 Frequency Percent Frequency Percent ------------------------------------------------------------- A 45511 44.57 45511 44.57 N 3525 3.45 49036 48.03 R 53068 51.97 102104 100.00

Appendix B—Value Distribution and Field Frequencies for the Common Core of Data Public Elementary/Secondary School Universe Survey: School year 2004–05
Character codes: A - Adjustment C - Combined with data provided elsewhere by the state M - Missing N - Not applicable O - Locale code assigned under old methodology R - As reported by the state T - Total based on sum of internal or external detail W - Locale code assigned under new methodology
B-37
4th-Hispanic-Male Adj Flag Cumulative Cumulative IHI04M04 Frequency Percent Frequency Percent ------------------------------------------------------------- A 33670 32.98 33670 32.98 N 3525 3.45 37195 36.43 R 64909 63.57 102104 100.00 4th-Hispanic-Fem Adj Flag Cumulative Cumulative IHI04F04 Frequency Percent Frequency Percent ------------------------------------------------------------- A 33670 32.98 33670 32.98 N 3525 3.45 37195 36.43 R 64909 63.57 102104 100.00 4th-Hispanic-Unkn Adj Flag Cumulative Cumulative IHI04U04 Frequency Percent Frequency Percent ------------------------------------------------------------- A 45511 44.57 45511 44.57 N 3525 3.45 49036 48.03 R 53068 51.97 102104 100.00 4th-Black-Male Adj Flag Cumulative Cumulative IBL04M04 Frequency Percent Frequency Percent ------------------------------------------------------------- A 33671 32.98 33671 32.98 N 3525 3.45 37196 36.43 R 64908 63.57 102104 100.00 4th-Black-Fem Adj Flag Cumulative Cumulative IBL04F04 Frequency Percent Frequency Percent ------------------------------------------------------------- A 33671 32.98 33671 32.98 N 3525 3.45 37196 36.43 R 64908 63.57 102104 100.00 4th-Black-Unkn Adj Flag Cumulative Cumulative IBL04U04 Frequency Percent Frequency Percent ------------------------------------------------------------- A 45511 44.57 45511 44.57 N 3525 3.45 49036 48.03 R 53068 51.97 102104 100.00

Appendix B—Value Distribution and Field Frequencies for the Common Core of Data Public Elementary/Secondary School Universe Survey: School year 2004–05
Character codes: A - Adjustment C - Combined with data provided elsewhere by the state M - Missing N - Not applicable O - Locale code assigned under old methodology R - As reported by the state T - Total based on sum of internal or external detail W - Locale code assigned under new methodology
B-38
4th-White-Male Adj Flag Cumulative Cumulative IWH04M04 Frequency Percent Frequency Percent ------------------------------------------------------------- A 33674 32.98 33674 32.98 N 3525 3.45 37199 36.43 R 64905 63.57 102104 100.00 4th-White-Fem Adj Flag Cumulative Cumulative IWH04F04 Frequency Percent Frequency Percent ------------------------------------------------------------- A 33674 32.98 33674 32.98 N 3525 3.45 37199 36.43 R 64905 63.57 102104 100.00 4th-White-Unkn Adj Flag Cumulative Cumulative IWH04U04 Frequency Percent Frequency Percent ------------------------------------------------------------- A 45511 44.57 45511 44.57 N 3525 3.45 49036 48.03 R 53068 51.97 102104 100.00

Appendix B—Value Distribution and Field Frequencies for the Common Core of Data Public Elementary/Secondary School Universe Survey: School year 2004–05
Character codes: A - Adjustment C - Combined with data provided elsewhere by the state M - Missing N - Not applicable O - Locale code assigned under old methodology R - As reported by the state T - Total based on sum of internal or external detail W - Locale code assigned under new methodology
B-39
Total 5th Grade Students Adj Flag Cumulative Cumulative IG0504 Frequency Percent Frequency Percent ----------------------------------------------------------- A 34787 34.07 34787 34.07 N 3525 3.45 38312 37.52 R 63792 62.48 102104 100.00 5th-Amer Ind/AK Nat-Male Adj Flag Cumulative Cumulative IAM05M04 Frequency Percent Frequency Percent ------------------------------------------------------------- A 35370 34.64 35370 34.64 N 3525 3.45 38895 38.09 R 63209 61.91 102104 100.00 5th-Amer Ind/AK Nat-Fem Adj Flag Cumulative Cumulative IAM05F04 Frequency Percent Frequency Percent ------------------------------------------------------------- A 35370 34.64 35370 34.64 N 3525 3.45 38895 38.09 R 63209 61.91 102104 100.00 5th-Amer Ind/AK Nat-Unkn Adj Flag Cumulative Cumulative IAM05U04 Frequency Percent Frequency Percent ------------------------------------------------------------- A 46347 45.39 46347 45.39 N 3525 3.45 49872 48.84 R 52232 51.16 102104 100.00

Appendix B—Value Distribution and Field Frequencies for the Common Core of Data Public Elementary/Secondary School Universe Survey: School year 2004–05
Character codes: A - Adjustment C - Combined with data provided elsewhere by the state M - Missing N - Not applicable O - Locale code assigned under old methodology R - As reported by the state T - Total based on sum of internal or external detail W - Locale code assigned under new methodology
B-40
5th-Asian/Pac Isl-Male Adj Flag Cumulative Cumulative IAS05M04 Frequency Percent Frequency Percent ------------------------------------------------------------- A 35382 34.65 35382 34.65 N 3525 3.45 38907 38.11 R 63197 61.89 102104 100.00 5th-Asian/Pac Isl-Fem Adj Flag Cumulative Cumulative IAS05F04 Frequency Percent Frequency Percent ------------------------------------------------------------- A 35382 34.65 35382 34.65 N 3525 3.45 38907 38.11 R 63197 61.89 102104 100.00 5th-Asian/Pac Isl-Unkn Adj Flag Cumulative Cumulative IAS05U04 Frequency Percent Frequency Percent ------------------------------------------------------------- A 46347 45.39 46347 45.39 N 3525 3.45 49872 48.84 R 52232 51.16 102104 100.00 5th-Hispanic-Male Adj Flag Cumulative Cumulative IHI05M04 Frequency Percent Frequency Percent ------------------------------------------------------------- A 35370 34.64 35370 34.64 N 3525 3.45 38895 38.09 R 63209 61.91 102104 100.00 5th-Hispanic-Fem Adj Flag Cumulative Cumulative IHI05F04 Frequency Percent Frequency Percent ------------------------------------------------------------- A 35370 34.64 35370 34.64 N 3525 3.45 38895 38.09 R 63209 61.91 102104 100.00 5th-Hispanic-Unkn Adj Flag Cumulative Cumulative IHI05U04 Frequency Percent Frequency Percent ------------------------------------------------------------- A 46347 45.39 46347 45.39 N 3525 3.45 49872 48.84 R 52232 51.16 102104 100.00

Appendix B—Value Distribution and Field Frequencies for the Common Core of Data Public Elementary/Secondary School Universe Survey: School year 2004–05
Character codes: A - Adjustment C - Combined with data provided elsewhere by the state M - Missing N - Not applicable O - Locale code assigned under old methodology R - As reported by the state T - Total based on sum of internal or external detail W - Locale code assigned under new methodology
B-41
5th-Black-Male Adj Flag Cumulative Cumulative IBL05M04 Frequency Percent Frequency Percent ------------------------------------------------------------- A 35370 34.64 35370 34.64 N 3525 3.45 38895 38.09 R 63209 61.91 102104 100.00 5th-Black-Fem Adj Flag Cumulative Cumulative IBL05F04 Frequency Percent Frequency Percent ------------------------------------------------------------- A 35370 34.64 35370 34.64 N 3525 3.45 38895 38.09 R 63209 61.91 102104 100.00 5th-Black-Unkn Adj Flag Cumulative Cumulative IBL05U04 Frequency Percent Frequency Percent ------------------------------------------------------------- A 46347 45.39 46347 45.39 N 3525 3.45 49872 48.84 R 52232 51.16 102104 100.00

Appendix B—Value Distribution and Field Frequencies for the Common Core of Data Public Elementary/Secondary School Universe Survey: School year 2004–05
Character codes: A - Adjustment C - Combined with data provided elsewhere by the state M - Missing N - Not applicable O - Locale code assigned under old methodology R - As reported by the state T - Total based on sum of internal or external detail W - Locale code assigned under new methodology
B-42
5th-White-Male Adj Flag Cumulative Cumulative IWH05M04 Frequency Percent Frequency Percent ------------------------------------------------------------- A 35374 34.65 35374 34.65 N 3525 3.45 38899 38.10 R 63205 61.90 102104 100.00 5th-White-Fem Adj Flag Cumulative Cumulative IWH05F04 Frequency Percent Frequency Percent ------------------------------------------------------------- A 35374 34.65 35374 34.65 N 3525 3.45 38899 38.10 R 63205 61.90 102104 100.00 5th-White-Unkn Adj Flag Cumulative Cumulative IWH05U04 Frequency Percent Frequency Percent ------------------------------------------------------------- A 46347 45.39 46347 45.39 N 3525 3.45 49872 48.84 R 52232 51.16 102104 100.00 Total 6th Grade Students Adj Flag Cumulative Cumulative IG0604 Frequency Percent Frequency Percent ----------------------------------------------------------- A 46022 45.07 46022 45.07 N 3525 3.45 49547 48.53 R 52557 51.47 102104 100.00 6th-Amer Ind/AK Nat-Male Adj Flag Cumulative Cumulative IAM06M04 Frequency Percent Frequency Percent ------------------------------------------------------------- A 45906 44.96 45906 44.96 N 3525 3.45 49431 48.41 R 52673 51.59 102104 100.00 6th-Amer Ind/AK Nat-Fem Adj Flag Cumulative Cumulative IAM06F04 Frequency Percent Frequency Percent ------------------------------------------------------------- A 45906 44.96 45906 44.96 N 3525 3.45 49431 48.41 R 52673 51.59 102104 100.00

Appendix B—Value Distribution and Field Frequencies for the Common Core of Data Public Elementary/Secondary School Universe Survey: School year 2004–05
Character codes: A - Adjustment C - Combined with data provided elsewhere by the state M - Missing N - Not applicable O - Locale code assigned under old methodology R - As reported by the state T - Total based on sum of internal or external detail W - Locale code assigned under new methodology
B-43
6th-Amer Ind/AK Nat-Unkn Adj Flag Cumulative Cumulative IAM06U04 Frequency Percent Frequency Percent ------------------------------------------------------------- A 53351 52.25 53351 52.25 N 3525 3.45 56876 55.70 R 45228 44.30 102104 100.00 6th-Asian/Pac Isl-Male Adj Flag Cumulative Cumulative IAS06M04 Frequency Percent Frequency Percent ------------------------------------------------------------- A 45918 44.97 45918 44.97 N 3525 3.45 49443 48.42 R 52661 51.58 102104 100.00 6th-Asian/Pac Isl-Fem Adj Flag Cumulative Cumulative IAS06F04 Frequency Percent Frequency Percent ------------------------------------------------------------- A 45918 44.97 45918 44.97 N 3525 3.45 49443 48.42 R 52661 51.58 102104 100.00

Appendix B—Value Distribution and Field Frequencies for the Common Core of Data Public Elementary/Secondary School Universe Survey: School year 2004–05
Character codes: A - Adjustment C - Combined with data provided elsewhere by the state M - Missing N - Not applicable O - Locale code assigned under old methodology R - As reported by the state T - Total based on sum of internal or external detail W - Locale code assigned under new methodology
B-44
6th-Asian/Pac Isl-Unkn Adj Flag Cumulative Cumulative IAS06U04 Frequency Percent Frequency Percent ------------------------------------------------------------- A 53351 52.25 53351 52.25 N 3525 3.45 56876 55.70 R 45228 44.30 102104 100.00 6th-Hispanic-Male Adj Flag Cumulative Cumulative IHI06M04 Frequency Percent Frequency Percent ------------------------------------------------------------- A 45906 44.96 45906 44.96 N 3525 3.45 49431 48.41 R 52673 51.59 102104 100.00 6th-Hispanic-Fem Adj Flag Cumulative Cumulative IHI06F04 Frequency Percent Frequency Percent ------------------------------------------------------------- A 45906 44.96 45906 44.96 N 3525 3.45 49431 48.41 R 52673 51.59 102104 100.00 6th-Hispanic-Unkn Adj Flag Cumulative Cumulative IHI06U04 Frequency Percent Frequency Percent ------------------------------------------------------------- A 53351 52.25 53351 52.25 N 3525 3.45 56876 55.70 R 45228 44.30 102104 100.00 6th-Black-Male Adj Flag Cumulative Cumulative IBL06M04 Frequency Percent Frequency Percent ------------------------------------------------------------- A 45907 44.96 45907 44.96 N 3525 3.45 49432 48.41 R 52672 51.59 102104 100.00 6th-Black-Fem Adj Flag Cumulative Cumulative IBL06F04 Frequency Percent Frequency Percent ------------------------------------------------------------- A 45907 44.96 45907 44.96 N 3525 3.45 49432 48.41 R 52672 51.59 102104 100.00

Appendix B—Value Distribution and Field Frequencies for the Common Core of Data Public Elementary/Secondary School Universe Survey: School year 2004–05
Character codes: A - Adjustment C - Combined with data provided elsewhere by the state M - Missing N - Not applicable O - Locale code assigned under old methodology R - As reported by the state T - Total based on sum of internal or external detail W - Locale code assigned under new methodology
B-45
6th-Black-Unkn Adj Flag Cumulative Cumulative IBL06U04 Frequency Percent Frequency Percent ------------------------------------------------------------- A 53351 52.25 53351 52.25 N 3525 3.45 56876 55.70 R 45228 44.30 102104 100.00 6th-White-Male Adj Flag Cumulative Cumulative IWH06M04 Frequency Percent Frequency Percent ------------------------------------------------------------- A 45907 44.96 45907 44.96 N 3525 3.45 49432 48.41 R 52672 51.59 102104 100.00 6th-White-Fem Adj Flag Cumulative Cumulative IWH06F04 Frequency Percent Frequency Percent ------------------------------------------------------------- A 45907 44.96 45907 44.96 N 3525 3.45 49432 48.41 R 52672 51.59 102104 100.00

Appendix B—Value Distribution and Field Frequencies for the Common Core of Data Public Elementary/Secondary School Universe Survey: School year 2004–05
Character codes: A - Adjustment C - Combined with data provided elsewhere by the state M - Missing N - Not applicable O - Locale code assigned under old methodology R - As reported by the state T - Total based on sum of internal or external detail W - Locale code assigned under new methodology
B-46
6th-White-Unkn Adj Flag Cumulative Cumulative IWH06U04 Frequency Percent Frequency Percent ------------------------------------------------------------- A 53351 52.25 53351 52.25 N 3525 3.45 56876 55.70 R 45228 44.30 102104 100.00 Total 7th Grade Students Adj Flag Cumulative Cumulative IG0704 Frequency Percent Frequency Percent ----------------------------------------------------------- A 51593 50.53 51593 50.53 N 3525 3.45 55118 53.98 R 46986 46.02 102104 100.00 7th-Amer Ind/AK Nat-Male Adj Flag Cumulative Cumulative IAM07M04 Frequency Percent Frequency Percent ------------------------------------------------------------- A 51406 50.35 51406 50.35 N 3525 3.45 54931 53.80 R 47173 46.20 102104 100.00 7th-Amer Ind/AK Nat-Fem Adj Flag Cumulative Cumulative IAM07F04 Frequency Percent Frequency Percent ------------------------------------------------------------- A 51406 50.35 51406 50.35 N 3525 3.45 54931 53.80 R 47173 46.20 102104 100.00 7th-Amer Ind/AK Nat-Unkn Adj Flag Cumulative Cumulative IAM07U04 Frequency Percent Frequency Percent ------------------------------------------------------------- A 57028 55.85 57028 55.85 N 3525 3.45 60553 59.31 R 41551 40.69 102104 100.00 7th-Asian/Pac Isl-Male Adj Flag Cumulative Cumulative IAS07M04 Frequency Percent Frequency Percent ------------------------------------------------------------- A 51410 50.35 51410 50.35 N 3525 3.45 54935 53.80 R 47169 46.20 102104 100.00

Appendix B—Value Distribution and Field Frequencies for the Common Core of Data Public Elementary/Secondary School Universe Survey: School year 2004–05
Character codes: A - Adjustment C - Combined with data provided elsewhere by the state M - Missing N - Not applicable O - Locale code assigned under old methodology R - As reported by the state T - Total based on sum of internal or external detail W - Locale code assigned under new methodology
B-47
7th-Asian/Pac Isl-Fem Adj Flag Cumulative Cumulative IAS07F04 Frequency Percent Frequency Percent ------------------------------------------------------------- A 51410 50.35 51410 50.35 N 3525 3.45 54935 53.80 R 47169 46.20 102104 100.00 7th-Asian/Pac Isl-Unkn Adj Flag Cumulative Cumulative IAS07U04 Frequency Percent Frequency Percent ------------------------------------------------------------- A 57028 55.85 57028 55.85 N 3525 3.45 60553 59.31 R 41551 40.69 102104 100.00 7th-Hispanic-Male Adj Flag Cumulative Cumulative IHI07M04 Frequency Percent Frequency Percent ------------------------------------------------------------- A 51406 50.35 51406 50.35 N 3525 3.45 54931 53.80 R 47173 46.20 102104 100.00

Appendix B—Value Distribution and Field Frequencies for the Common Core of Data Public Elementary/Secondary School Universe Survey: School year 2004–05
Character codes: A - Adjustment C - Combined with data provided elsewhere by the state M - Missing N - Not applicable O - Locale code assigned under old methodology R - As reported by the state T - Total based on sum of internal or external detail W - Locale code assigned under new methodology
B-48
7th-Hispanic-Fem Adj Flag Cumulative Cumulative IHI07F04 Frequency Percent Frequency Percent ------------------------------------------------------------- A 51406 50.35 51406 50.35 N 3525 3.45 54931 53.80 R 47173 46.20 102104 100.00 7th-Hispanic-Unkn Adj Flag Cumulative Cumulative IHI07U04 Frequency Percent Frequency Percent ------------------------------------------------------------- A 57028 55.85 57028 55.85 N 3525 3.45 60553 59.31 R 41551 40.69 102104 100.00 7th-Black-Male Adj Flag Cumulative Cumulative IBL07M04 Frequency Percent Frequency Percent ------------------------------------------------------------- A 51407 50.35 51407 50.35 N 3525 3.45 54932 53.80 R 47172 46.20 102104 100.00 7th-Black-Fem Adj Flag Cumulative Cumulative IBL07F04 Frequency Percent Frequency Percent ------------------------------------------------------------- A 51407 50.35 51407 50.35 N 3525 3.45 54932 53.80 R 47172 46.20 102104 100.00

Appendix B—Value Distribution and Field Frequencies for the Common Core of Data Public Elementary/Secondary School Universe Survey: School year 2004–05
Character codes: A - Adjustment C - Combined with data provided elsewhere by the state M - Missing N - Not applicable O - Locale code assigned under old methodology R - As reported by the state T - Total based on sum of internal or external detail W - Locale code assigned under new methodology
B-49
7th-Black-Unkn Adj Flag Cumulative Cumulative IBL07U04 Frequency Percent Frequency Percent ------------------------------------------------------------- A 57028 55.85 57028 55.85 N 3525 3.45 60553 59.31 R 41551 40.69 102104 100.00 7th-White-Male Adj Flag Cumulative Cumulative IWH07M04 Frequency Percent Frequency Percent ------------------------------------------------------------- A 51408 50.35 51408 50.35 N 3525 3.45 54933 53.80 R 47171 46.20 102104 100.00 7th-White-Fem Adj Flag Cumulative Cumulative IWH07F04 Frequency Percent Frequency Percent ------------------------------------------------------------- A 51408 50.35 51408 50.35 N 3525 3.45 54933 53.80 R 47171 46.20 102104 100.00 7th-White-Unkn Adj Flag Cumulative Cumulative IWH07U04 Frequency Percent Frequency Percent ------------------------------------------------------------- A 57028 55.85 57028 55.85 N 3525 3.45 60553 59.31 R 41551 40.69 102104 100.00

Appendix B—Value Distribution and Field Frequencies for the Common Core of Data Public Elementary/Secondary School Universe Survey: School year 2004–05
Character codes: A - Adjustment C - Combined with data provided elsewhere by the state M - Missing N - Not applicable O - Locale code assigned under old methodology R - As reported by the state T - Total based on sum of internal or external detail W - Locale code assigned under new methodology
B-50
Total 8th Grade Students Adj Flag Cumulative Cumulative IG0804 Frequency Percent Frequency Percent ----------------------------------------------------------- A 51438 50.38 51438 50.38 N 3525 3.45 54963 53.83 R 47141 46.17 102104 100.00 8th-Amer Ind/AK Nat-Male Adj Flag Cumulative Cumulative IAM08M04 Frequency Percent Frequency Percent ------------------------------------------------------------- A 51243 50.19 51243 50.19 N 3525 3.45 54768 53.64 R 47336 46.36 102104 100.00 8th-Amer Ind/AK Nat-Fem Adj Flag Cumulative Cumulative IAM08F04 Frequency Percent Frequency Percent ------------------------------------------------------------- A 51243 50.19 51243 50.19 N 3525 3.45 54768 53.64 R 47336 46.36 102104 100.00 8th-Amer Ind/AK Nat-Unkn Adj Flag Cumulative Cumulative IAM08U04 Frequency Percent Frequency Percent ------------------------------------------------------------- A 56860 55.69 56860 55.69 N 3525 3.45 60385 59.14 R 41719 40.86 102104 100.00
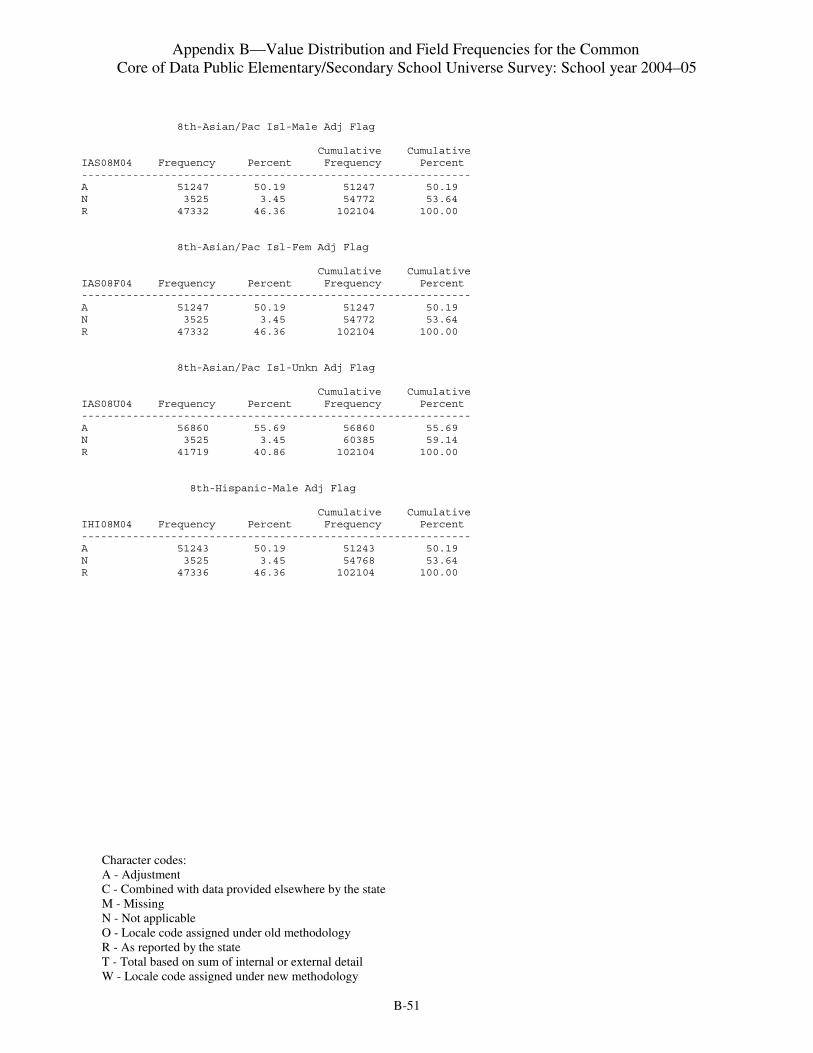
Appendix B—Value Distribution and Field Frequencies for the Common Core of Data Public Elementary/Secondary School Universe Survey: School year 2004–05
Character codes: A - Adjustment C - Combined with data provided elsewhere by the state M - Missing N - Not applicable O - Locale code assigned under old methodology R - As reported by the state T - Total based on sum of internal or external detail W - Locale code assigned under new methodology
B-51
8th-Asian/Pac Isl-Male Adj Flag Cumulative Cumulative IAS08M04 Frequency Percent Frequency Percent ------------------------------------------------------------- A 51247 50.19 51247 50.19 N 3525 3.45 54772 53.64 R 47332 46.36 102104 100.00 8th-Asian/Pac Isl-Fem Adj Flag Cumulative Cumulative IAS08F04 Frequency Percent Frequency Percent ------------------------------------------------------------- A 51247 50.19 51247 50.19 N 3525 3.45 54772 53.64 R 47332 46.36 102104 100.00 8th-Asian/Pac Isl-Unkn Adj Flag Cumulative Cumulative IAS08U04 Frequency Percent Frequency Percent ------------------------------------------------------------- A 56860 55.69 56860 55.69 N 3525 3.45 60385 59.14 R 41719 40.86 102104 100.00 8th-Hispanic-Male Adj Flag Cumulative Cumulative IHI08M04 Frequency Percent Frequency Percent ------------------------------------------------------------- A 51243 50.19 51243 50.19 N 3525 3.45 54768 53.64 R 47336 46.36 102104 100.00

Appendix B—Value Distribution and Field Frequencies for the Common Core of Data Public Elementary/Secondary School Universe Survey: School year 2004–05
Character codes: A - Adjustment C - Combined with data provided elsewhere by the state M - Missing N - Not applicable O - Locale code assigned under old methodology R - As reported by the state T - Total based on sum of internal or external detail W - Locale code assigned under new methodology
B-52
8th-Hispanic-Fem Adj Flag Cumulative Cumulative IHI08F04 Frequency Percent Frequency Percent ------------------------------------------------------------- A 51243 50.19 51243 50.19 N 3525 3.45 54768 53.64 R 47336 46.36 102104 100.00 8th-Hispanic-Unkn Adj Flag Cumulative Cumulative IHI08U04 Frequency Percent Frequency Percent ------------------------------------------------------------- A 56860 55.69 56860 55.69 N 3525 3.45 60385 59.14 R 41719 40.86 102104 100.00 8th-Black-Male Adj Flag Cumulative Cumulative IBL08M04 Frequency Percent Frequency Percent ------------------------------------------------------------- A 51244 50.19 51244 50.19 N 3525 3.45 54769 53.64 R 47335 46.36 102104 100.00 8th-Black-Fem Adj Flag Cumulative Cumulative IBL08F04 Frequency Percent Frequency Percent ------------------------------------------------------------- A 51244 50.19 51244 50.19 N 3525 3.45 54769 53.64 R 47335 46.36 102104 100.00 8th-Black-Unkn Adj Flag Cumulative Cumulative IBL08U04 Frequency Percent Frequency Percent ------------------------------------------------------------- A 56860 55.69 56860 55.69 N 3525 3.45 60385 59.14 R 41719 40.86 102104 100.00 8th-White-Male Adj Flag Cumulative Cumulative IWH08M04 Frequency Percent Frequency Percent ------------------------------------------------------------- A 51247 50.19 51247 50.19 N 3525 3.45 54772 53.64 R 47332 46.36 102104 100.00

Appendix B—Value Distribution and Field Frequencies for the Common Core of Data Public Elementary/Secondary School Universe Survey: School year 2004–05
Character codes: A - Adjustment C - Combined with data provided elsewhere by the state M - Missing N - Not applicable O - Locale code assigned under old methodology R - As reported by the state T - Total based on sum of internal or external detail W - Locale code assigned under new methodology
B-53
8th-White-Fem Adj Flag Cumulative Cumulative IWH08F04 Frequency Percent Frequency Percent ------------------------------------------------------------- A 51247 50.19 51247 50.19 N 3525 3.45 54772 53.64 R 47332 46.36 102104 100.00 8th-White-Unkn Adj Flag Cumulative Cumulative IWH08U04 Frequency Percent Frequency Percent ------------------------------------------------------------- A 56860 55.69 56860 55.69 N 3525 3.45 60385 59.14 R 41719 40.86 102104 100.00 Total 9th Grade Students Adj Flag Cumulative Cumulative IG0904 Frequency Percent Frequency Percent ----------------------------------------------------------- A 54965 53.83 54965 53.83 N 3525 3.45 58490 57.28 R 43614 42.72 102104 100.00

Appendix B—Value Distribution and Field Frequencies for the Common Core of Data Public Elementary/Secondary School Universe Survey: School year 2004–05
Character codes: A - Adjustment C - Combined with data provided elsewhere by the state M - Missing N - Not applicable O - Locale code assigned under old methodology R - As reported by the state T - Total based on sum of internal or external detail W - Locale code assigned under new methodology
B-54
9th-Amer Ind/AK Nat-Male Adj Flag Cumulative Cumulative IAM09M04 Frequency Percent Frequency Percent ------------------------------------------------------------- A 54762 53.63 54762 53.63 N 3525 3.45 58287 57.09 R 43817 42.91 102104 100.00 9th-Amer Ind/AK Nat-Fem Adj Flag Cumulative Cumulative IAM09F04 Frequency Percent Frequency Percent ------------------------------------------------------------- A 54762 53.63 54762 53.63 N 3525 3.45 58287 57.09 R 43817 42.91 102104 100.00 9th-Amer Ind/AK Nat-Unkn Adj Flag Cumulative Cumulative IAM09U04 Frequency Percent Frequency Percent ------------------------------------------------------------- A 58050 56.85 58050 56.85 N 3525 3.45 61575 60.31 R 40529 39.69 102104 100.00 9th-Asian/Pac Isl-Male Adj Flag Cumulative Cumulative IAS09M04 Frequency Percent Frequency Percent ------------------------------------------------------------- A 54767 53.64 54767 53.64 N 3525 3.45 58292 57.09 R 43812 42.91 102104 100.00 9th-Asian/Pac Isl-Fem Adj Flag Cumulative Cumulative IAS09F04 Frequency Percent Frequency Percent ------------------------------------------------------------- A 54767 53.64 54767 53.64 N 3525 3.45 58292 57.09 R 43812 42.91 102104 100.00 9th-Asian/Pac Isl-Unkn Adj Flag Cumulative Cumulative IAS09U04 Frequency Percent Frequency Percent ------------------------------------------------------------- A 58050 56.85 58050 56.85 N 3525 3.45 61575 60.31 R 40529 39.69 102104 100.00

Appendix B—Value Distribution and Field Frequencies for the Common Core of Data Public Elementary/Secondary School Universe Survey: School year 2004–05
Character codes: A - Adjustment C - Combined with data provided elsewhere by the state M - Missing N - Not applicable O - Locale code assigned under old methodology R - As reported by the state T - Total based on sum of internal or external detail W - Locale code assigned under new methodology
B-55
9th-Hispanic-Male Adj Flag Cumulative Cumulative IHI09M04 Frequency Percent Frequency Percent ------------------------------------------------------------- A 54762 53.63 54762 53.63 N 3525 3.45 58287 57.09 R 43817 42.91 102104 100.00 9th-Hispanic-Fem Adj Flag Cumulative Cumulative IHI09F04 Frequency Percent Frequency Percent ------------------------------------------------------------- A 54762 53.63 54762 53.63 N 3525 3.45 58287 57.09 R 43817 42.91 102104 100.00 9th-Hispanic-Unkn Adj Flag Cumulative Cumulative IHI09U04 Frequency Percent Frequency Percent ------------------------------------------------------------- A 58050 56.85 58050 56.85 N 3525 3.45 61575 60.31 R 40529 39.69 102104 100.00

Appendix B—Value Distribution and Field Frequencies for the Common Core of Data Public Elementary/Secondary School Universe Survey: School year 2004–05
Character codes: A - Adjustment C - Combined with data provided elsewhere by the state M - Missing N - Not applicable O - Locale code assigned under old methodology R - As reported by the state T - Total based on sum of internal or external detail W - Locale code assigned under new methodology
B-56
9th-Black-Male Adj Flag Cumulative Cumulative IBL09M04 Frequency Percent Frequency Percent ------------------------------------------------------------- A 54763 53.63 54763 53.63 N 3525 3.45 58288 57.09 R 43816 42.91 102104 100.00 9th-Black-Fem Adj Flag Cumulative Cumulative IBL09F04 Frequency Percent Frequency Percent ------------------------------------------------------------- A 54763 53.63 54763 53.63 N 3525 3.45 58288 57.09 R 43816 42.91 102104 100.00 9th-Black-Unkn Adj Flag Cumulative Cumulative IBL09U04 Frequency Percent Frequency Percent ------------------------------------------------------------- A 58050 56.85 58050 56.85 N 3525 3.45 61575 60.31 R 40529 39.69 102104 100.00 9th-White-Male Adj Flag Cumulative Cumulative IWH09M04 Frequency Percent Frequency Percent ------------------------------------------------------------- A 54766 53.64 54766 53.64 N 3525 3.45 58291 57.09 R 43813 42.91 102104 100.00 9th-White-Fem Adj Flag Cumulative Cumulative IWH09F04 Frequency Percent Frequency Percent ------------------------------------------------------------- A 54766 53.64 54766 53.64 N 3525 3.45 58291 57.09 R 43813 42.91 102104 100.00 9th-White-Unkn Adj Flag Cumulative Cumulative IWH09U04 Frequency Percent Frequency Percent ------------------------------------------------------------- A 58050 56.85 58050 56.85 N 3525 3.45 61575 60.31 R 40529 39.69 102104 100.00

Appendix B—Value Distribution and Field Frequencies for the Common Core of Data Public Elementary/Secondary School Universe Survey: School year 2004–05
Character codes: A - Adjustment C - Combined with data provided elsewhere by the state M - Missing N - Not applicable O - Locale code assigned under old methodology R - As reported by the state T - Total based on sum of internal or external detail W - Locale code assigned under new methodology
B-57
Total 10th Grade Students Adj Flag Cumulative Cumulative IG1004 Frequency Percent Frequency Percent ----------------------------------------------------------- A 55549 54.40 55549 54.40 N 3525 3.45 59074 57.86 R 43030 42.14 102104 100.00 10th-Amer Ind/AK Nat-Male Adj Flag Cumulative Cumulative IAM10M04 Frequency Percent Frequency Percent ------------------------------------------------------------- A 55343 54.20 55343 54.20 N 3525 3.45 58868 57.65 R 43236 42.35 102104 100.00 10th-Amer Ind/AK Nat-Fem Adj Flag Cumulative Cumulative IAM10F04 Frequency Percent Frequency Percent ------------------------------------------------------------- A 55343 54.20 55343 54.20 N 3525 3.45 58868 57.65 R 43236 42.35 102104 100.00

Appendix B—Value Distribution and Field Frequencies for the Common Core of Data Public Elementary/Secondary School Universe Survey: School year 2004–05
Character codes: A - Adjustment C - Combined with data provided elsewhere by the state M - Missing N - Not applicable O - Locale code assigned under old methodology R - As reported by the state T - Total based on sum of internal or external detail W - Locale code assigned under new methodology
B-58
10th-Amer Ind/AK Nat-Unkn Adj Flag Cumulative Cumulative IAM10U04 Frequency Percent Frequency Percent ------------------------------------------------------------- A 58564 57.36 58564 57.36 N 3525 3.45 62089 60.81 R 40015 39.19 102104 100.00 10th-Asian/Pac Isl-Male Adj Flag Cumulative Cumulative IAS10M04 Frequency Percent Frequency Percent ------------------------------------------------------------- A 55348 54.21 55348 54.21 N 3525 3.45 58873 57.66 R 43231 42.34 102104 100.00 10th-Asian/Pac Isl-Fem Adj Flag Cumulative Cumulative IAS10F04 Frequency Percent Frequency Percent ------------------------------------------------------------- A 55348 54.21 55348 54.21 N 3525 3.45 58873 57.66 R 43231 42.34 102104 100.00 10th-Asian/Pac Isl-Unkn Adj Flag Cumulative Cumulative IAS10U04 Frequency Percent Frequency Percent ------------------------------------------------------------- A 58564 57.36 58564 57.36 N 3525 3.45 62089 60.81 R 40015 39.19 102104 100.00

Appendix B—Value Distribution and Field Frequencies for the Common Core of Data Public Elementary/Secondary School Universe Survey: School year 2004–05
Character codes: A - Adjustment C - Combined with data provided elsewhere by the state M - Missing N - Not applicable O - Locale code assigned under old methodology R - As reported by the state T - Total based on sum of internal or external detail W - Locale code assigned under new methodology
B-59
10th-Hispanic-Male Adj Flag Cumulative Cumulative IHI10M04 Frequency Percent Frequency Percent ------------------------------------------------------------- A 55343 54.20 55343 54.20 N 3525 3.45 58868 57.65 R 43236 42.35 102104 100.00 10th-Hispanic-Fem Adj Flag Cumulative Cumulative IHI10F04 Frequency Percent Frequency Percent ------------------------------------------------------------- A 55343 54.20 55343 54.20 N 3525 3.45 58868 57.65 R 43236 42.35 102104 100.00 10th-Hispanic-Unkn Adj Flag Cumulative Cumulative IHI10U04 Frequency Percent Frequency Percent ------------------------------------------------------------- A 58564 57.36 58564 57.36 N 3525 3.45 62089 60.81 R 40015 39.19 102104 100.00 10th-Black-Male Adj Flag Cumulative Cumulative IBL10M04 Frequency Percent Frequency Percent ------------------------------------------------------------- A 55344 54.20 55344 54.20 N 3525 3.45 58869 57.66 R 43235 42.34 102104 100.00 10th-Black-Fem Adj Flag Cumulative Cumulative IBL10F04 Frequency Percent Frequency Percent ------------------------------------------------------------- A 55344 54.20 55344 54.20 N 3525 3.45 58869 57.66 R 43235 42.34 102104 100.00 10th-Black-Unkn Adj Flag Cumulative Cumulative IBL10U04 Frequency Percent Frequency Percent ------------------------------------------------------------- A 58564 57.36 58564 57.36 N 3525 3.45 62089 60.81 R 40015 39.19 102104 100.00

Appendix B—Value Distribution and Field Frequencies for the Common Core of Data Public Elementary/Secondary School Universe Survey: School year 2004–05
Character codes: A - Adjustment C - Combined with data provided elsewhere by the state M - Missing N - Not applicable O - Locale code assigned under old methodology R - As reported by the state T - Total based on sum of internal or external detail W - Locale code assigned under new methodology
B-60
10th-White-Male Adj Flag Cumulative Cumulative IWH10M04 Frequency Percent Frequency Percent ------------------------------------------------------------- A 55345 54.20 55345 54.20 N 3525 3.45 58870 57.66 R 43234 42.34 102104 100.00 10th-White-Fem Adj Flag Cumulative Cumulative IWH10F04 Frequency Percent Frequency Percent ------------------------------------------------------------- A 55345 54.20 55345 54.20 N 3525 3.45 58870 57.66 R 43234 42.34 102104 100.00 10th-White-Unkn Adj Flag Cumulative Cumulative IWH10U04 Frequency Percent Frequency Percent ------------------------------------------------------------- A 58564 57.36 58564 57.36 N 3525 3.45 62089 60.81 R 40015 39.19 102104 100.00
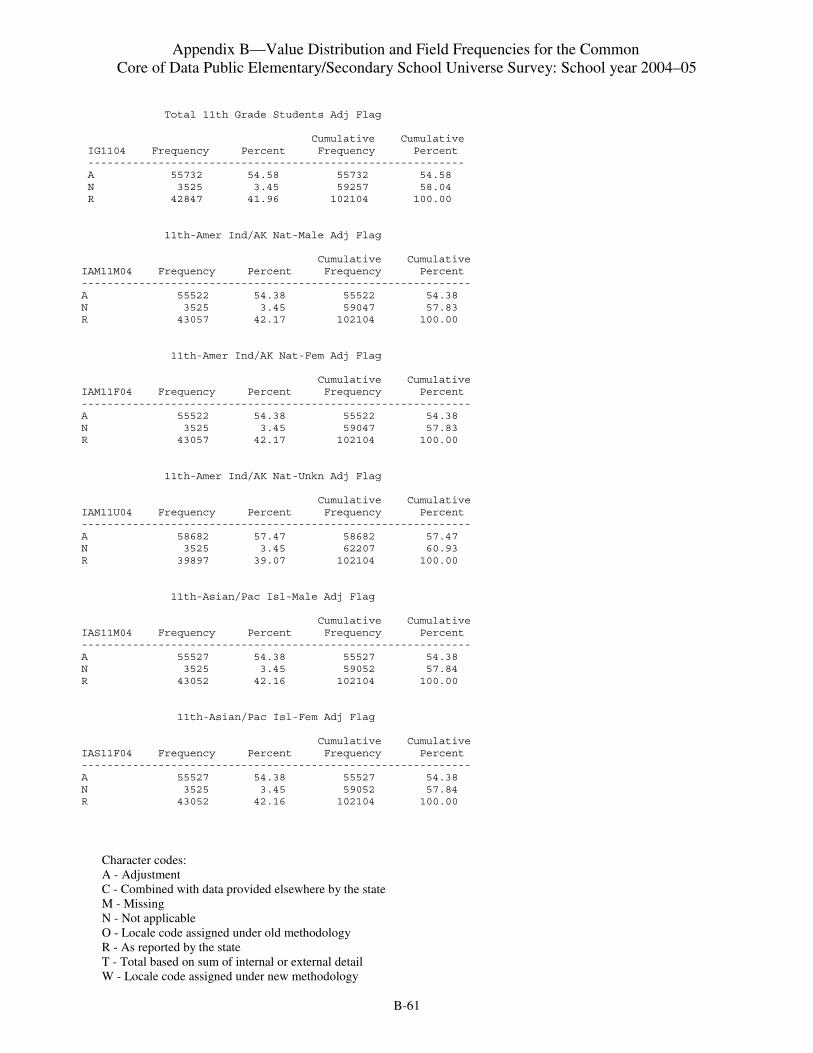
Appendix B—Value Distribution and Field Frequencies for the Common Core of Data Public Elementary/Secondary School Universe Survey: School year 2004–05
Character codes: A - Adjustment C - Combined with data provided elsewhere by the state M - Missing N - Not applicable O - Locale code assigned under old methodology R - As reported by the state T - Total based on sum of internal or external detail W - Locale code assigned under new methodology
B-61
Total 11th Grade Students Adj Flag Cumulative Cumulative IG1104 Frequency Percent Frequency Percent ----------------------------------------------------------- A 55732 54.58 55732 54.58 N 3525 3.45 59257 58.04 R 42847 41.96 102104 100.00 11th-Amer Ind/AK Nat-Male Adj Flag Cumulative Cumulative IAM11M04 Frequency Percent Frequency Percent ------------------------------------------------------------- A 55522 54.38 55522 54.38 N 3525 3.45 59047 57.83 R 43057 42.17 102104 100.00 11th-Amer Ind/AK Nat-Fem Adj Flag Cumulative Cumulative IAM11F04 Frequency Percent Frequency Percent ------------------------------------------------------------- A 55522 54.38 55522 54.38 N 3525 3.45 59047 57.83 R 43057 42.17 102104 100.00 11th-Amer Ind/AK Nat-Unkn Adj Flag Cumulative Cumulative IAM11U04 Frequency Percent Frequency Percent ------------------------------------------------------------- A 58682 57.47 58682 57.47 N 3525 3.45 62207 60.93 R 39897 39.07 102104 100.00 11th-Asian/Pac Isl-Male Adj Flag Cumulative Cumulative IAS11M04 Frequency Percent Frequency Percent ------------------------------------------------------------- A 55527 54.38 55527 54.38 N 3525 3.45 59052 57.84 R 43052 42.16 102104 100.00 11th-Asian/Pac Isl-Fem Adj Flag Cumulative Cumulative IAS11F04 Frequency Percent Frequency Percent ------------------------------------------------------------- A 55527 54.38 55527 54.38 N 3525 3.45 59052 57.84 R 43052 42.16 102104 100.00

Appendix B—Value Distribution and Field Frequencies for the Common Core of Data Public Elementary/Secondary School Universe Survey: School year 2004–05
Character codes: A - Adjustment C - Combined with data provided elsewhere by the state M - Missing N - Not applicable O - Locale code assigned under old methodology R - As reported by the state T - Total based on sum of internal or external detail W - Locale code assigned under new methodology
B-62
11th-Asian/Pac Isl-Unkn Adj Flag Cumulative Cumulative IAS11U04 Frequency Percent Frequency Percent ------------------------------------------------------------- A 58682 57.47 58682 57.47 N 3525 3.45 62207 60.93 R 39897 39.07 102104 100.00 11th-Hispanic-Male Adj Flag Cumulative Cumulative IHI11M04 Frequency Percent Frequency Percent ------------------------------------------------------------- A 55522 54.38 55522 54.38 N 3525 3.45 59047 57.83 R 43057 42.17 102104 100.00 11th-Hispanic-Fem Adj Flag Cumulative Cumulative IHI11F04 Frequency Percent Frequency Percent ------------------------------------------------------------- A 55522 54.38 55522 54.38 N 3525 3.45 59047 57.83 R 43057 42.17 102104 100.00

Appendix B—Value Distribution and Field Frequencies for the Common Core of Data Public Elementary/Secondary School Universe Survey: School year 2004–05
Character codes: A - Adjustment C - Combined with data provided elsewhere by the state M - Missing N - Not applicable O - Locale code assigned under old methodology R - As reported by the state T - Total based on sum of internal or external detail W - Locale code assigned under new methodology
B-63
11th-Hispanic-Unkn Adj Flag Cumulative Cumulative IHI11U04 Frequency Percent Frequency Percent ------------------------------------------------------------- A 58682 57.47 58682 57.47 N 3525 3.45 62207 60.93 R 39897 39.07 102104 100.00 11th-Black-Male Adj Flag Cumulative Cumulative IBL11M04 Frequency Percent Frequency Percent ------------------------------------------------------------- A 55523 54.38 55523 54.38 N 3525 3.45 59048 57.83 R 43056 42.17 102104 100.00 11th-Black-Fem Adj Flag Cumulative Cumulative IBL11F04 Frequency Percent Frequency Percent ------------------------------------------------------------- A 55523 54.38 55523 54.38 N 3525 3.45 59048 57.83 R 43056 42.17 102104 100.00 11th-Black-Unkn Adj Flag Cumulative Cumulative IBL11U04 Frequency Percent Frequency Percent ------------------------------------------------------------- A 58682 57.47 58682 57.47 N 3525 3.45 62207 60.93 R 39897 39.07 102104 100.00

Appendix B—Value Distribution and Field Frequencies for the Common Core of Data Public Elementary/Secondary School Universe Survey: School year 2004–05
Character codes: A - Adjustment C - Combined with data provided elsewhere by the state M - Missing N - Not applicable O - Locale code assigned under old methodology R - As reported by the state T - Total based on sum of internal or external detail W - Locale code assigned under new methodology
B-64
11th-White-Male Adj Flag Cumulative Cumulative IWH11M04 Frequency Percent Frequency Percent ------------------------------------------------------------- A 55524 54.38 55524 54.38 N 3525 3.45 59049 57.83 R 43055 42.17 102104 100.00 11th-White-Fem Adj Flag Cumulative Cumulative IWH11F04 Frequency Percent Frequency Percent ------------------------------------------------------------- A 55524 54.38 55524 54.38 N 3525 3.45 59049 57.83 R 43055 42.17 102104 100.00 11th-White-Unkn Adj Flag Cumulative Cumulative IWH11U04 Frequency Percent Frequency Percent ------------------------------------------------------------- A 58682 57.47 58682 57.47 N 3525 3.45 62207 60.93 R 39897 39.07 102104 100.00 Total 12th Grade Students Adj Flag Cumulative Cumulative IG1204 Frequency Percent Frequency Percent ----------------------------------------------------------- A 55950 54.80 55950 54.80 N 3525 3.45 59475 58.25 R 42629 41.75 102104 100.00 12th-Amer Ind/AK Nat-Male Adj Flag Cumulative Cumulative IAM12M04 Frequency Percent Frequency Percent ------------------------------------------------------------- A 55739 54.59 55739 54.59 N 3525 3.45 59264 58.04 R 42840 41.96 102104 100.00 12th-Amer Ind/AK Nat-Fem Adj Flag Cumulative Cumulative IAM12F04 Frequency Percent Frequency Percent ------------------------------------------------------------- A 55739 54.59 55739 54.59 N 3525 3.45 59264 58.04 R 42840 41.96 102104 100.00

Appendix B—Value Distribution and Field Frequencies for the Common Core of Data Public Elementary/Secondary School Universe Survey: School year 2004–05
Character codes: A - Adjustment C - Combined with data provided elsewhere by the state M - Missing N - Not applicable O - Locale code assigned under old methodology R - As reported by the state T - Total based on sum of internal or external detail W - Locale code assigned under new methodology
B-65
12th-Amer Ind/AK Nat-Unkn Adj Flag Cumulative Cumulative IAM12U04 Frequency Percent Frequency Percent ------------------------------------------------------------- A 58799 57.59 58799 57.59 N 3525 3.45 62324 61.04 R 39780 38.96 102104 100.00 12th-Asian/Pac Isl-Male Adj Flag Cumulative Cumulative IAS12M04 Frequency Percent Frequency Percent ------------------------------------------------------------- A 55744 54.60 55744 54.60 N 3525 3.45 59269 58.05 R 42835 41.95 102104 100.00 12th-Asian/Pac Isl-Fem Adj Flag Cumulative Cumulative IAS12F04 Frequency Percent Frequency Percent ------------------------------------------------------------- A 55744 54.60 55744 54.60 N 3525 3.45 59269 58.05 R 42835 41.95 102104 100.00

Appendix B—Value Distribution and Field Frequencies for the Common Core of Data Public Elementary/Secondary School Universe Survey: School year 2004–05
Character codes: A - Adjustment C - Combined with data provided elsewhere by the state M - Missing N - Not applicable O - Locale code assigned under old methodology R - As reported by the state T - Total based on sum of internal or external detail W - Locale code assigned under new methodology
B-66
12th-Asian/Pac Isl-Unkn Adj Flag Cumulative Cumulative IAS12U04 Frequency Percent Frequency Percent ------------------------------------------------------------- A 58799 57.59 58799 57.59 N 3525 3.45 62324 61.04 R 39780 38.96 102104 100.00 12th-Hispanic-Male Adj Flag Cumulative Cumulative IHI12M04 Frequency Percent Frequency Percent ------------------------------------------------------------- A 55739 54.59 55739 54.59 N 3525 3.45 59264 58.04 R 42840 41.96 102104 100.00 12th-Hispanic-Fem Adj Flag Cumulative Cumulative IHI12F04 Frequency Percent Frequency Percent ------------------------------------------------------------- A 55739 54.59 55739 54.59 N 3525 3.45 59264 58.04 R 42840 41.96 102104 100.00 12th-Hispanic-Unkn Adj Flag Cumulative Cumulative IHI12U04 Frequency Percent Frequency Percent ------------------------------------------------------------- A 58799 57.59 58799 57.59 N 3525 3.45 62324 61.04 R 39780 38.96 102104 100.00 12th-Black-Male Adj Flag Cumulative Cumulative IBL12M04 Frequency Percent Frequency Percent ------------------------------------------------------------- A 55739 54.59 55739 54.59 N 3525 3.45 59264 58.04 R 42840 41.96 102104 100.00 12th-Black-Fem Adj Flag Cumulative Cumulative IBL12F04 Frequency Percent Frequency Percent ------------------------------------------------------------- A 55739 54.59 55739 54.59 N 3525 3.45 59264 58.04 R 42840 41.96 102104 100.00

Appendix B—Value Distribution and Field Frequencies for the Common Core of Data Public Elementary/Secondary School Universe Survey: School year 2004–05
Character codes: A - Adjustment C - Combined with data provided elsewhere by the state M - Missing N - Not applicable O - Locale code assigned under old methodology R - As reported by the state T - Total based on sum of internal or external detail W - Locale code assigned under new methodology
B-67
12th-Black-Unkn Adj Flag Cumulative Cumulative IBL12U04 Frequency Percent Frequency Percent ------------------------------------------------------------- A 58799 57.59 58799 57.59 N 3525 3.45 62324 61.04 R 39780 38.96 102104 100.00 12th-White-Male Adj Flag Cumulative Cumulative IWH12M04 Frequency Percent Frequency Percent ------------------------------------------------------------- A 55742 54.59 55742 54.59 N 3525 3.45 59267 58.05 R 42837 41.95 102104 100.00 12th-White-Fem Adj Flag Cumulative Cumulative IWH12F04 Frequency Percent Frequency Percent ------------------------------------------------------------- A 55742 54.59 55742 54.59 N 3525 3.45 59267 58.05 R 42837 41.95 102104 100.00

Appendix B—Value Distribution and Field Frequencies for the Common Core of Data Public Elementary/Secondary School Universe Survey: School year 2004–05
Character codes: A - Adjustment C - Combined with data provided elsewhere by the state M - Missing N - Not applicable O - Locale code assigned under old methodology R - As reported by the state T - Total based on sum of internal or external detail W - Locale code assigned under new methodology
B-68
12th-White-Unkn Adj Flag Cumulative Cumulative IWH12U04 Frequency Percent Frequency Percent ------------------------------------------------------------- A 58799 57.59 58799 57.59 N 3525 3.45 62324 61.04 R 39780 38.96 102104 100.00 Total Ungraded Students Adj Flag Cumulative Cumulative IUG04 Frequency Percent Frequency Percent ---------------------------------------------------------- A 42862 41.98 42862 41.98 N 3525 3.45 46387 45.43 R 55717 54.57 102104 100.00 Ungr-Amer Ind/AK Nat-Male Adj Flag Cumulative Cumulative IAMUGM04 Frequency Percent Frequency Percent ------------------------------------------------------------- A 42359 41.49 42359 41.49 N 3525 3.45 45884 44.94 R 56220 55.06 102104 100.00 Ungr-Amer Ind/AK Nat-Fem Adj Flag Cumulative Cumulative IAMUGF04 Frequency Percent Frequency Percent ------------------------------------------------------------- A 42359 41.49 42359 41.49 N 3525 3.45 45884 44.94 R 56220 55.06 102104 100.00 Ungr-Amer Ind/AK Nat-Unkn Adj Flag Cumulative Cumulative IAMUGU04 Frequency Percent Frequency Percent ------------------------------------------------------------- A 46490 45.53 46490 45.53 N 3525 3.45 50015 48.98 R 52089 51.02 102104 100.00 Ungr-Asian/Pac Isl-Male Adj Flag Cumulative Cumulative IASUGM04 Frequency Percent Frequency Percent ------------------------------------------------------------- A 42361 41.49 42361 41.49 N 3525 3.45 45886 44.94 R 56218 55.06 102104 100.00

Appendix B—Value Distribution and Field Frequencies for the Common Core of Data Public Elementary/Secondary School Universe Survey: School year 2004–05
Character codes: A - Adjustment C - Combined with data provided elsewhere by the state M - Missing N - Not applicable O - Locale code assigned under old methodology R - As reported by the state T - Total based on sum of internal or external detail W - Locale code assigned under new methodology
B-69
Ungr-Asian/Pac Isl-Fem Adj Flag Cumulative Cumulative IASUGF04 Frequency Percent Frequency Percent ------------------------------------------------------------- A 42361 41.49 42361 41.49 N 3525 3.45 45886 44.94 R 56218 55.06 102104 100.00 Ungr-Asian/Pac Isl-Unkn Adj Flag Cumulative Cumulative IASUGU04 Frequency Percent Frequency Percent ------------------------------------------------------------- A 46490 45.53 46490 45.53 N 3525 3.45 50015 48.98 R 52089 51.02 102104 100.00 Ungr-Hispanic-Male Adj Flag Cumulative Cumulative IHIUGM04 Frequency Percent Frequency Percent ------------------------------------------------------------- A 42359 41.49 42359 41.49 N 3525 3.45 45884 44.94 R 56220 55.06 102104 100.00

Appendix B—Value Distribution and Field Frequencies for the Common Core of Data Public Elementary/Secondary School Universe Survey: School year 2004–05
Character codes: A - Adjustment C - Combined with data provided elsewhere by the state M - Missing N - Not applicable O - Locale code assigned under old methodology R - As reported by the state T - Total based on sum of internal or external detail W - Locale code assigned under new methodology
B-70
Ungr-Hispanic-Fem Adj Flag Cumulative Cumulative IHIUGF04 Frequency Percent Frequency Percent ------------------------------------------------------------- A 42359 41.49 42359 41.49 N 3525 3.45 45884 44.94 R 56220 55.06 102104 100.00 Ungr-Hispanic-Unkn Adj Flag Cumulative Cumulative IHIUGU04 Frequency Percent Frequency Percent ------------------------------------------------------------- A 46490 45.53 46490 45.53 N 3525 3.45 50015 48.98 R 52089 51.02 102104 100.00 Ungr-Black-Male Adj Flag Cumulative Cumulative IBLUGM04 Frequency Percent Frequency Percent ------------------------------------------------------------- A 42359 41.49 42359 41.49 N 3525 3.45 45884 44.94 R 56220 55.06 102104 100.00 Ungr-Black-Fem Adj Flag Cumulative Cumulative IBLUGF04 Frequency Percent Frequency Percent ------------------------------------------------------------- A 42359 41.49 42359 41.49 N 3525 3.45 45884 44.94 R 56220 55.06 102104 100.00 Ungr-Black-Unkn Adj Flag Cumulative Cumulative IBLUGU04 Frequency Percent Frequency Percent ------------------------------------------------------------- A 46490 45.53 46490 45.53 N 3525 3.45 50015 48.98 R 52089 51.02 102104 100.00 Ungr-White-Male Adj Flag Cumulative Cumulative IWHUGM04 Frequency Percent Frequency Percent ------------------------------------------------------------- A 42359 41.49 42359 41.49 N 3525 3.45 45884 44.94 R 56220 55.06 102104 100.00

Appendix B—Value Distribution and Field Frequencies for the Common Core of Data Public Elementary/Secondary School Universe Survey: School year 2004–05
Character codes: A - Adjustment C - Combined with data provided elsewhere by the state M - Missing N - Not applicable O - Locale code assigned under old methodology R - As reported by the state T - Total based on sum of internal or external detail W - Locale code assigned under new methodology
B-71
Ungr-White-Fem Adj Flag Cumulative Cumulative IWHUGF04 Frequency Percent Frequency Percent ------------------------------------------------------------- A 42359 41.49 42359 41.49 N 3525 3.45 45884 44.94 R 56220 55.06 102104 100.00 Ungr-White-Unkn Adj Flag Cumulative Cumulative IWHUGU04 Frequency Percent Frequency Percent ------------------------------------------------------------- A 46490 45.53 46490 45.53 N 3525 3.45 50015 48.98 R 52089 51.02 102104 100.00 Total Reported Membership Adj Flag Cumulative Cumulative IMEMB04 Frequency Percent Frequency Percent ------------------------------------------------------------ A 3120 3.06 3120 3.06 N 3525 3.45 6645 6.51 R 95458 93.49 102103 100.00 T 1 0.00 102104 100.00

Appendix B—Value Distribution and Field Frequencies for the Common Core of Data Public Elementary/Secondary School Universe Survey: School year 2004–05
Character codes: A - Adjustment C - Combined with data provided elsewhere by the state M - Missing N - Not applicable O - Locale code assigned under old methodology R - As reported by the state T - Total based on sum of internal or external detail W - Locale code assigned under new methodology
B-72
Am Indian/Alaskan Stu Adj Flag Cumulative Cumulative IAM04 Frequency Percent Frequency Percent ---------------------------------------------------------- A 561 0.55 561 0.55 N 3525 3.45 4086 4.00 T 98018 96.00 102104 100.00 Tot-Amer Ind/AK Nat-Male Adj Flag Cumulative Cumulative IAMALM04 Frequency Percent Frequency Percent ------------------------------------------------------------- A 2569 2.52 2569 2.52 N 3525 3.45 6094 5.97 R 96010 94.03 102104 100.00 Tot-Amer Ind/AK Nat-Fem Adj Flag Cumulative Cumulative IAMALF04 Frequency Percent Frequency Percent ------------------------------------------------------------- A 2566 2.51 2566 2.51 N 3525 3.45 6091 5.97 R 96013 94.03 102104 100.00 Tot-Amer Ind/AK Nat-Unkn Adj Flag Cumulative Cumulative IAMALU04 Frequency Percent Frequency Percent ------------------------------------------------------------- A 26994 26.44 26994 26.44 N 3525 3.45 30519 29.89 R 71585 70.11 102104 100.00

Appendix B—Value Distribution and Field Frequencies for the Common Core of Data Public Elementary/Secondary School Universe Survey: School year 2004–05
Character codes: A - Adjustment C - Combined with data provided elsewhere by the state M - Missing N - Not applicable O - Locale code assigned under old methodology R - As reported by the state T - Total based on sum of internal or external detail W - Locale code assigned under new methodology
B-73
Asian/Pac Islander Stu Adj Flag Cumulative Cumulative IASIAN04 Frequency Percent Frequency Percent ------------------------------------------------------------- A 561 0.55 561 0.55 N 3525 3.45 4086 4.00 T 98018 96.00 102104 100.00 Tot-Asian/Pac Isl-Male Adj Flag Cumulative Cumulative IASALM04 Frequency Percent Frequency Percent ------------------------------------------------------------- A 2662 2.61 2662 2.61 N 3525 3.45 6187 6.06 R 95917 93.94 102104 100.00 Tot-Asian/Pac Isl-Fem Adj Flag Cumulative Cumulative IASALF04 Frequency Percent Frequency Percent ------------------------------------------------------------- A 2656 2.60 2656 2.60 N 3525 3.45 6181 6.05 R 95923 93.95 102104 100.00 Tot-Asian/Pac Isl-Unkn Adj Flag Cumulative Cumulative IASALU04 Frequency Percent Frequency Percent ------------------------------------------------------------- A 26994 26.44 26994 26.44 N 3525 3.45 30519 29.89 R 71585 70.11 102104 100.00

Appendix B—Value Distribution and Field Frequencies for the Common Core of Data Public Elementary/Secondary School Universe Survey: School year 2004–05
Character codes: A - Adjustment C - Combined with data provided elsewhere by the state M - Missing N - Not applicable O - Locale code assigned under old methodology R - As reported by the state T - Total based on sum of internal or external detail W - Locale code assigned under new methodology
B-74
Hispanic Stu Adj Flag Cumulative Cumulative IHISP04 Frequency Percent Frequency Percent ------------------------------------------------------------ A 561 0.55 561 0.55 N 3525 3.45 4086 4.00 T 98018 96.00 102104 100.00 Tot-Hispanic-Male Adj Flag Cumulative Cumulative IHIALM04 Frequency Percent Frequency Percent ------------------------------------------------------------- A 2722 2.67 2722 2.67 N 3525 3.45 6247 6.12 R 95857 93.88 102104 100.00 Tot-Hispanic-Fem Adj Flag Cumulative Cumulative IHIALF04 Frequency Percent Frequency Percent ------------------------------------------------------------- A 2695 2.64 2695 2.64 N 3525 3.45 6220 6.09 R 95884 93.91 102104 100.00 Tot-Hispanic-Unkn Adj Flag Cumulative Cumulative IHIALU04 Frequency Percent Frequency Percent ------------------------------------------------------------- A 26994 26.44 26994 26.44 N 3525 3.45 30519 29.89 R 71585 70.11 102104 100.00 Black Non-Hispanic Stu Adj Flag Cumulative Cumulative IBLACK04 Frequency Percent Frequency Percent ------------------------------------------------------------- A 561 0.55 561 0.55 N 3525 3.45 4086 4.00 T 98018 96.00 102104 100.00 Tot-Black-Male Adj Flag Cumulative Cumulative IBLALM04 Frequency Percent Frequency Percent ------------------------------------------------------------- A 2756 2.70 2756 2.70 N 3525 3.45 6281 6.15 R 95823 93.85 102104 100.00

Appendix B—Value Distribution and Field Frequencies for the Common Core of Data Public Elementary/Secondary School Universe Survey: School year 2004–05
Character codes: A - Adjustment C - Combined with data provided elsewhere by the state M - Missing N - Not applicable O - Locale code assigned under old methodology R - As reported by the state T - Total based on sum of internal or external detail W - Locale code assigned under new methodology
B-75
Tot-Black-Fem Adj Flag Cumulative Cumulative IBLALF04 Frequency Percent Frequency Percent ------------------------------------------------------------- A 2741 2.68 2741 2.68 N 3525 3.45 6266 6.14 R 95838 93.86 102104 100.00 Tot-Black-Unkn Adj Flag Cumulative Cumulative IBLALU04 Frequency Percent Frequency Percent ------------------------------------------------------------- A 26994 26.44 26994 26.44 N 3525 3.45 30519 29.89 R 71585 70.11 102104 100.00 White Non-Hispanic Stu Adj Flag Cumulative Cumulative IWHITE04 Frequency Percent Frequency Percent ------------------------------------------------------------- A 561 0.55 561 0.55 N 3525 3.45 4086 4.00 T 98018 96.00 102104 100.00

Appendix B—Value Distribution and Field Frequencies for the Common Core of Data Public Elementary/Secondary School Universe Survey: School year 2004–05
Character codes: A - Adjustment C - Combined with data provided elsewhere by the state M - Missing N - Not applicable O - Locale code assigned under old methodology R - As reported by the state T - Total based on sum of internal or external detail W - Locale code assigned under new methodology
B-76
Tot-White-Male Adj Flag Cumulative Cumulative IWHALM04 Frequency Percent Frequency Percent ------------------------------------------------------------- A 2889 2.83 2889 2.83 N 3525 3.45 6414 6.28 R 95690 93.72 102104 100.00 Tot-White-Fem Adj Flag Cumulative Cumulative IWHALF04 Frequency Percent Frequency Percent ------------------------------------------------------------- A 2906 2.85 2906 2.85 N 3525 3.45 6431 6.30 R 95673 93.70 102104 100.00 Tot-White-Unkn Adj Flag Cumulative Cumulative IWHALU04 Frequency Percent Frequency Percent ------------------------------------------------------------- A 26994 26.44 26994 26.44 N 3525 3.45 30519 29.89 R 71585 70.11 102104 100.00 Total Ethnicity Adj Flag Cumulative Cumulative IETH04 Frequency Percent Frequency Percent ----------------------------------------------------------- A 561 0.55 561 0.55 N 3525 3.45 4086 4.00 T 98018 96.00 102104 100.00 Pupil Teacher Ratio Adj Flag Cumulative Cumulative IPUTCH04 Frequency Percent Frequency Percent ------------------------------------------------------------- N 3525 3.45 3525 3.45 T 98579 96.55 102104 100.00 Total Calculated Membership Adj Flag Cumulative Cumulative ITOTGR04 Frequency Percent Frequency Percent ------------------------------------------------------------- N 3525 3.45 3525 3.45 T 98579 96.55 102104 100.00

C-1
Appendix C—Glossary for the Common Core of Data: School Year 2004–05


APPENDIX C—Glossary for the Common Core of Data: School Year 2004–05
C-3
For the CCD to have comparable data across states, all states must abide by the same standard definitions when reporting on schools, students, and staff. To ensure a common understanding, definitions for critical terms are presented below. The glossary contains definitions for all variables and terms found on the CCD school, agency, or state files.
Alternative Education School A public elementary/secondary school that addresses needs of students that typically cannot be met in a regular school; provides nontraditional education; serves as an adjunct to a regular school; and falls outside of the categories of regular, special education, or vocational education.
American Indian/Alaska Native A person having origins in any of the original peoples of North America and who maintains cultural identification through tribal affiliation or community recognition.
Asian/Pacific Islander A person having origins in any of the original peoples of the Far East, Southeast Asia, the Indian subcontinent, or the Pacific Islands. This includes, for example, China, India, Japan, Korea, the Philippine Islands, and Samoa.
Black A person having origins in any of the black racial groups of Africa.
Boundary Change See “Operational Status, Agency” for definition. Name of term was changed to “Operational Status, Agency,” after 1997–98.
Charter School A school providing free public elementary and/or secondary education to eligible students under a specific charter granted by the state legislature or other appropriate authority, and designated by such authority to be a charter school. Item was first collected in 1998–99.
Classroom Teacher See “Teacher.”
Combined Statistical Area (CSA) If an area that qualifies as a metropolitan area (MA) has more than one million people, two or more core-based statistical areas (CBSAs) may be defined within it. Each CBSA consists of a large urbanized county or cluster of counties (cities and towns in New England) that demonstrate very strong internal economic and social links, in addition to close ties to other portions of the larger area. When CBSAs are established, the larger MA of which they are component parts is designated a combined statistical area (CSA). CSAs and CBSAs are established only where local governments favor such designations for a large MA.
Core Based Statistical Area (CBSA) Each CBSA must contain at least one urban area of 10,000 or more people.

APPENDIX C—Glossary for the Common Core of Data: School Year 2004–05
C-4
Under the Census standards, the county (or counties) in which at least 50 percent of the population resides within urban areas of 10,000 or more people, or that contains at least 5,000 people residing within a single urban area of 10,000 or more people, is identified as a “central county” (or counties). Additional “outlying counties” are included in the CBSA if they meet specified requirements of commuting to or from the central counties. Counties or equivalent entities form the geographic “building blocks” for metropolitan and micropolitan statistical areas throughout the United States and Puerto Rico.
Diploma, High School A formal document certifying the successful completion of a secondary school program prescribed by the state education agency or other appropriate body.
Diploma Recipient A student who has received a diploma during the previous school year or subsequent summer school.
District Locale Code A code based upon the school locale codes to indicate the location of the district in relation to populous areas. (See also “Large City,” “Midsize City,” “Urban Fringe of a Large City,” “Urban Fringe of a Midsize City,” “Large Town,” “Small Town,” “Rural, Outside CBSA,” and “Rural, Inside CBSA.”)
Dropout A student who was enrolled in school at some time during the previous school year; was not enrolled at the beginning of the current school year; has not graduated from high school or completed a state- or district-approved educational program; and does not meet any of the following exclusionary conditions: has transferred to another public school district, private school, or state- or district-approved educational program; is temporarily absent due to suspension or school-approved illness; or has died. Item was first collected in 1992–93.
Education Agency A government agency administratively responsible for providing public elementary and/or secondary instruction or educational support services.
Elementary A general level of instruction classified by state and local practice as elementary, composed of any span of grades not above grade 8; preschool or kindergarten included only if it is an integral part of an elementary school or a regularly established school system.
English Language Learner (ELL) “English language learner (ELL)” was formerly referred to as “limited English proficient (LEP).” Refers to students being served in appropriate programs of language assistance (e.g., English as a Second Language, High Intensity Language Training, bilingual education). Does not include pupils enrolled in a class to learn a language other than English. Also, ELL students are individuals who were not born in the United States or whose native language is a language other than English; individuals who come from environments where a language other than English is dominant; or individuals who are American Indians or Alaskan Natives and who come from environments where a language other than English has had a significant impact on their level of English language proficiency; and who, by reason thereof, have sufficient difficulty speaking, reading, writing, or understanding the English language to deny such individuals the opportunity to learn successfully in classrooms where the language of instruction is English or to participate fully in our society. Item was first collected in 1998–99.

APPENDIX C—Glossary for the Common Core of Data: School Year 2004–05
C-5
Federally Operated Education Agency A federally operated agency that is charged, at least in part, with providing elementary and/or secondary instruction or support services.
Free Lunch Program A program under the National School Lunch Act that provides cash subsidies for free lunches to students based on family size and income criteria.
Full-time Equivalency (FTE) The amount of time required to perform an assignment stated as a proportion of a full-time position and computed by dividing the amount of time employed by the time normally required for a full-time position.
General Educational Development (GED) Test A comprehensive test used primarily to appraise the educational development of students who have not completed their formal high school education and who may earn a high school equivalency certificate through achievement of satisfactory scores.
Grade Span Offered The span of grades intended to be served by a school or agency, whether or not there are students currently enrolled in all grades. If a high school also has a prekindergarten program, the grade span of the high school is reported as a high school, not as a PK–12 school. For example, if a school has PK as well as grades 9, 10, 11, and 12, the grade span will be reported as grades 9 through 12 (0912). Also, the ungraded designation (UG) cannot be used in a grade span unless the whole school consists of ungraded students, and in this case the grade span is reported as UGUG. “Grade span” was calculated from school membership through 1997–98 and first collected as a separate item in 1998–99.
Graduate, High School A high school graduate is defined as an individual who received a diploma recognizing the completion of secondary school requirements during the previous school year and subsequent summer school. It excludes high school equivalency and other high school completers (e.g., those granted a certificate of attendance).
Guidance Counselor/Director Professional staff assigned specific duties and school time for any of the following activities in an elementary or secondary setting: counseling with students and parents; consulting with other staff members on learning problems; evaluating student abilities; assisting students in making educational and career choices; assisting students in personal and social development; providing referral assistance; and/or working with other staff members in planning and conducting guidance programs for students. The state applies its own standards in apportioning the aggregate of guidance counselors/directors into the elementary and secondary level components.
Head Start Program A federally funded program that provides comprehensive educational, social, health, and nutritional services to low-income preschool children and their families, and children from ages 3 to school entry age (i.e., the age of compulsory school attendance). Head Start students and teachers are reported on the CCD only when the program is administered by a local education agency.

APPENDIX C—Glossary for the Common Core of Data: School Year 2004–05
C-6
High School Completion Count A count of graduates and other high school completers including diploma recipients and other high school completers.
High School Equivalency Certificate A formal document certifying that an individual met the state requirements for high school graduation equivalency by obtaining satisfactory scores on an approved examination, and meeting other performance requirements (if any) set by a state education agency or other appropriate body.
High School Equivalency Recipient Individual age 19 years or younger who received a high school equivalency certificate during the previous school year or subsequent summer. Item was last reported on the Local Education Agency Survey in 1990–91, but was collected by the State Nonfiscal Survey through 2002–03. Beginning with the 2003–04 collection, the item was replaced by the number of individuals age 19 or younger who passed the GED examination, as reported by the GED Testing Service.
High School Graduate, Other Programs A student who received a high school diploma, equivalency diploma, or other completion credential during the previous school year or subsequent summer school; the credential is based upon completion of other than the standard high school requirements or is achieved through nontraditional means. Term was last used in 1986–87. See “Other Diploma Recipient,” “High School Equivalency Recipient,” and “Other High School Completer.”
High School Graduate, Regular Day School A student who received a high school diploma during the previous school year or subsequent summer school; the diploma is based upon completion of high school requirements through traditional means. Term was last used in 1986–87. See “Regular Diploma Recipient.”
Hispanic A person of Mexican, Puerto Rican, Cuban, Central or South American, or other Spanish culture or origin, regardless of race.
Individualized Educational Program (IEP) A written instructional plan for students with disabilities designated as special education students under the Individuals With Disabilities Education Improvement Act (IDEA), Part B. The written instructional plan includes a statement of the child’s present level of educational performance; a statement of annual goals, including short-term instructional objectives; a statement of specific educational services to be provided and the extent to which the child will be able to participate in regular educational programs; the projected date for initiation and anticipated duration of services; the appropriate objectives, criteria, and evaluation procedures; and the schedule for determining, on at least an annual basis, whether instructional objectives are being achieved.
Instructional Aide Staff member assigned to assist a teacher with routine activities associated with teaching, i.e., activities requiring minor decisions regarding students, such as monitoring, conducting rote exercises, operating equipment, and clerking. Includes only paid staff, and excludes volunteer aides.

APPENDIX C—Glossary for the Common Core of Data: School Year 2004–05
C-7
Instructional Coordinators and Supervisors Persons who supervise instructional programs at the school district or subdistrict level: category includes educational television staff; coordinators and supervisors of audiovisual services; curriculum coordinators and in-service training staff; Title I coordinators and home economics supervisors; and staff engaged in the development of computer-assisted instruction. School-based department chairpersons are excluded.
Kindergarten A group or class that is part of a public school program and is taught during the year preceding first grade.
Large City A principal city of a metropolitan CBSA, with the city having a population greater than or equal to 250,000. (See also “Locale Code.”) Prior to 1994–95, “Large City” was defined as a principal city of a metropolitan area with a population of 400,000 or more, or a population density of at least 6,000 people per square mile.
Large Town An incorporated place or Census-designated place with a population greater than or equal to 25,000 and located outside a metropolitan CBSA or inside a micropolitan CBSA.
Latitude Latitude is the north or south angular distance from the equator that, when combined with longitude, reflects an estimation of where the school is physically situated on the street segment to which it was coded. Coordinate degrees, minutes, and seconds have been converted to and are displayed in terms of their decimal equivalent. The first 3 digits of the code represent the number of degrees from the equator; the last 6 digits represent the fraction of the next degree carried out to six decimal places, with an implied decimal. For example, if a school’s latitude is 30 degrees, 30 minutes north, then it is shown as 030500000.
Local Education Agency (LEA) Administrative Support Staff All staff members who provide direct support to LEA administrators, business office support, and data processing.
LEA Administrator Chief executive officers of education agencies, including superintendents, deputies, and assistant superintendents; other persons with districtwide responsibilities, e.g., business managers, administrative assistants, and professional instructional support staff. Excludes supervisors of instructional or student support staff.
Librarian A professional staff member or supervisor assigned specific duties and school time for professional library services activities. These include selecting, acquiring, preparing, cataloging, and circulating books and other printed materials; planning the use of the library by students, teachers, and instructional staff; and guiding individuals in the use of library books and material maintained separately or as a part of an instructional materials center.
Library and Media Support Staff Staff member who renders other professional library and media services; also includes library aides and those involved in library/media support. Duties include selecting, preparing, caring for, and making available to instructional staff, equipment, films, filmstrips, transparencies, tapes, TV programs, and similar materials

APPENDIX C—Glossary for the Common Core of Data: School Year 2004–05
C-8
maintained separately or as part of an instructional materials center. Also included are activities in the audiovisual center, TV studio, related work-study areas, and services provided by audiovisual personnel.
Limited-English Proficient (LEP) See “English Language Learner (ELL).”
Locale Code Locale code is defined based on how the school is situated in a particular location relative to populous areas, based on the school’s address. (See also “Large City,” “Midsize City,” “Urban Fringe of a Large City,” “Urban Fringe of a Midsize City,” “Large Town,” “Small Town,” “Rural, Outside CBSA,” and “Rural, Inside CBSA.”)
Longitude Longitude is the east or west angular distance from the prime meridian that, when combined with latitude, reflects an estimation of where the school is physically situated on the street segment to which it was coded. Coordinate degrees, minutes, and seconds have been converted to and are displayed in terms of their decimal equivalent. The first 3 digits of the code represent the number of degrees from the prime meridian; the last 6 digits represent the fraction of the next degree carried out to six decimal places, with an implied decimal. For example, if a school’s longitude is 90 degrees, 15 minutes west, then it is shown as -090250000.
Magnet School or Program A special school or program designed to attract students of different racial/ethnic backgrounds for the purpose of reducing, preventing, or eliminating racial isolation (50 percent or more minority enrollment); and/or to provide an academic or social focus on a particular theme (e.g., science/math, performing arts, gifted/talented, or foreign language). Item was first collected in 1998–99.
Media Specialist Directors, coordinators, and supervisors of media centers. See “Library and Media Support Staff.”
Membership The count of students on the current roll taken on the school day closest to October 1, by using either the sum of original entries and re-entries minus total withdrawals or the sum of the total present and the total absent.
Metropolitan Statistical Area (MSA) An area consisting of one or more contiguous counties (cities and towns in New England) that contain a core area with a large population nucleus, as well as adjacent communities having a high degree of economic and social integration with that core.
Metropolitan Status (Metro Status) Metro status is defined as the classification of an education agency’s service area relative to a CBSA. (See also Metropolitan Statistical Area.)

APPENDIX C—Glossary for the Common Core of Data: School Year 2004–05
C-9
Micropolitan Statistical Area A core based statistical area associated with at least one urban cluster that has a population of at least 10,000 but less than 50,000. The micropolitan statistical area comprises the central county or counties that contain the core, plus adjacent outlying counties having a high degree of social and economic integration with the central county as measured through commuting.
Midsize City A principal city of a metropolitan CBSA, with the city having a population less than 250,000. (See also “Locale Code.”) Prior to 1994–95, term was defined as a central city of a metropolitan area with a population less than 400,000 and a population density less than 6,000 people per square mile.
Migrant Student Defined under 34 CFR (Code of Federal Regulations) 200.40: (1) (a) Is younger than 22 (and has not graduated from high school or does not hold a high school equivalency certificate), but (b) if the child is too young to attend school-sponsored educational programs, is old enough to benefit from an organized instructional program; and (2) A migrant agricultural worker or a migrant fisher or who has a parent, spouse, or guardian who is a migrant agricultural worker or a migrant fisher; and (3) Performs, or has a parent, spouse, or guardian who performs qualifying agricultural or fishing employment as a principal means of livelihood; and (4) Has moved within the preceding 36 months to obtain or to accompany or join a parent, spouse, or guardian to obtain, temporary or seasonal employment in agricultural or fishing work; and (5) Has moved from one school district to another; or in a state that is comprised of a single school district, has moved from one administrative area to another within such district; or resides in a school district of more than 15,000 square miles, and migrates a distance of 20 miles or more to a temporary residence to engage in a fishing activity. (Provision 5 currently applies only to Alaska.) Item was first collected in 1998–99.
Officials and Administrators Chief executive officers of education agencies, including superintendents, deputies, and assistant superintendents; and other persons with districtwide responsibilities, such as business managers, administrative assistants, etc.
Operational Status, Agency Classification of changes in an education agency’s boundaries or jurisdiction. Classifications include no change, currently in operation; closed with no effect on another agency’s boundaries; new agency with no effect on another agency’s boundaries; added; significant change in geographic boundaries or instructional responsibility; temporarily closed and may reopen within 3 years; scheduled to be operational within 2 years. Prior to 1998–99, the term “Boundary Change” was used.
Operational Status, School Classification of the operational condition of a school. Classifications include currently operational; closed; new; added; changed agency; temporarily closed and may reopen within 3 years; and scheduled to be operational within 2 years.
Other Diploma Recipient A student who received a diploma through other than a regular school program during the previous school year or subsequent summer. Last reported in 1997–98; combined with “Regular Diploma Recipient” in 1998–99, with both categories reported as “Diploma Recipient.”

APPENDIX C—Glossary for the Common Core of Data: School Year 2004–05
C-10
Other High School Completer Student who has received a certificate of attendance or other certificate of completion in lieu of a diploma during the previous school year and subsequent summer school.
Other Support Staff Staff who serve in a support capacity and who are not included in the categories of central office administrative support, library support, student support, or school administrative support: e.g., data processing staff; bus drivers; and health, building, equipment maintenance, security, and cafeteria workers.
Prekindergarten Student Student who is enrolled in a group or class that is part of a public school program taught during the year or years preceding kindergarten, excluding Head Start students unless part of an authorized public education program of a local education agency.
Prekindergarten Teacher Teacher of a group or class that is part of a public school program that is taught during the year or years preceding kindergarten; includes teachers of Head Start students if part of authorized public education program of a local education agency.
Principal City The largest city in each metropolitan or micropolitan statistical area is designated a “principal city.” Additional cities qualify if specified requirements are met concerning population size and employment. The title of each metropolitan or micropolitan statistical area consists of the names of up to three of its principal cities and the name of each state into which the metropolitan or micropolitan statistical area extends. Titles of metropolitan divisions also typically are based on principal city names but in certain cases consist of county names. (See also “Locale Code.”)
Public School An institution that provides educational services and has one or more grade groups (PK–12) or that is ungraded, has one or more teachers to give instruction, is located in one or more buildings, has an assigned administrator, receives public funds as primary support, and is operated by an education agency.
Reduced-Price-Lunch Student A student who is eligible to participate in the Reduced-Price Lunch Program under the National School Lunch Act. (See also “Free Lunch Program”)
Regional Education Service Agency Agency providing services to a variety of local education agencies, or a county superintendent serving the same purposes.
Regular Diploma Recipient See “High School Graduate, Regular Day School.” Last reported in 1997–98; combined with “Other Diploma Recipient” in 1998–99, with both categories reported as “Diploma Recipient.”

APPENDIX C—Glossary for the Common Core of Data: School Year 2004–05
C-11
Regular School A public elementary/secondary school that does not focus primarily on vocational, special, or alternative education.
Rural Any incorporated place, Census-designated place, or non-place territory not within a metropolitan CBSA or within a micropolitan CBSA and defined as rural by the Census Bureau. From 1998–99 onward, the category was separated into “Rural, Inside CBSA” and “Rural, Outside CBSA.”
Rural, Inside CBSA Any incorporated place, Census-designated place, or non-place territory within a metropolitan CBSA and defined as rural by the Census Bureau. Category represents a subset of “Rural,” and was introduced in 1998–99. (See also “Locale Code.”)
Rural, Outside CBSA Any incorporated place, Census-designated place, or non-place territory not within a metropolitan CBSA or within a micropolitan CBSA and defined as rural by the Census Bureau. Category represents a subset of “Rural,” and was introduced in 1998–99. (See also “Locale Code.”)
School Administrative Support Staff Staff whose activities are concerned with support of the teaching and administrative duties of the office of the principal or department chairpersons; this includes clerical staff and secretaries.
School Administrator Staff member whose activities are concerned with directing and managing the operation of a particular school, including principals, assistant principals, and other assistants; and those who supervise school operations, assign duties to staff members, supervise and maintain the records of the school, and coordinate school instructional activities with those of the education agency, including department chairpersons.
School District An education agency or administrative unit that operates under a public board of education.
Secondary The general level of instruction classified by state and local practice as secondary and composed of any span of grades beginning with the next grade following the elementary grades and ending with or below grade 12.
Shared Time School A school offering vocational/technical education or other education services, in which some or all of the students are enrolled at a different school of record and attend the shared time school on a part-day basis: for example, a regional vocational center attended by students from multiple high schools on a part-day basis.
Small Town An incorporated place or Census Designated Place (CDP) with a population less than 25,000 and greater than or equal to 2,500 and located outside a metropolitan CBSA or inside a micropolitan CBSA. (See also “Locale Code.”)

APPENDIX C—Glossary for the Common Core of Data: School Year 2004–05
C-12
Special Education School A public elementary/secondary school that focuses primarily on special education—including instruction for any of the following: autism, deaf-blindness, developmental delay, hearing impairment, mental retardation, multiple disabilities, orthopedic impairment, serious emotional disturbance, specific learning disability, speech or language impairment, traumatic brain injury, visual impairment, and other health impairments—and that adapts curriculum, materials, or instruction for students served.
State Education Agency (SEA) An agency of the state charged with primary responsibility for coordinating and supervising public instruction, including setting standards for elementary and secondary instructional programs.
State-Operated Agency Agency that is charged, at least in part, with providing elementary and/or secondary instruction or support services. Examples include elementary/secondary programs operated by the state for the deaf or blind; and programs operated by state correctional facilities.
Student An individual for whom instruction is provided in an elementary or secondary education program that is not an adult education program and is under the jurisdiction of a school, school system, or other education institution.
Student Support Services Staff Staff members whose activities are concerned with the direct support of students and who nurture, but do not instruct, students. Includes attendance officers; staff providing health, psychology, speech pathology, audiology, or social services; and supervisors of the preceding staff and of health, transportation, and food service workers.
Supervisory Union An education agency where administrative services are performed for more than one school district by a common superintendent.
Teacher An individual who provides instruction to prekindergarten, kindergarten, grade 1–12, or ungraded classes; or individuals who teach in an environment other than a classroom setting and who maintain daily student attendance records.
Title I Eligible School A school designated under appropriate state and federal regulations as being eligible for participation in programs authorized by Title I of Public Law 103-382. Item was first collected in 1998–99.
Title I Schoolwide Program A school in which all pupils are designated under appropriate state and federal regulations as being eligible for participation in programs authorized by Title I of Public Law 103-382. Item was first collected in 1998–99.
Ungraded Student Individual assigned to class or program that does not have standard grade designations.
APPENDIX C—Glossary for the Common Core of Data: School Year 2004–05
C-13
Urban Fringe A closely settled area, contiguous to a principal city, outside a principal city; with a minimum population of 2,500 inhabitants; with a population density of at least 1,000 per square mile; and with a Census Urbanized Area Code. (See also “Locale Code.”)
Urban Fringe of a Large City Any incorporated place, Census-designated place, or non-place territory within a metropolitan CBSA of a large city and defined as urban by the Census Bureau. Prior to 1994–95, defined as any incorporated place, Census-designated place, or non-place territory within a CBSA or CSA and defined as urban by the Census Bureau, with a principal city with a population of 400,000 or more, or a population density of at least 6,000 people per square mile. (See also “Locale Code.”)
Urban Fringe of a Midsize City Any incorporated place, Census-designated place, or non-place territory within a CBSA of a midsize city and defined as urban by the Census Bureau. Prior to 1994–95, defined as any incorporated place, Census-designated place, or non-place territory within a CBSA or CSA and defined as urban by the Census Bureau, with a principal city with a population less than 400,000, or a population density less than 6,000 people per square mile. (See also “Locale Code.”)
Urbanized Area An area with a population concentration of at least 50,000—generally consisting of a principal city and the surrounding, closely settled, contiguous territory—and with a population density of at least 1,000 inhabitants per square mile.
Vocational Education School A public elementary/secondary school that focuses primarily on providing formal preparation for semiskilled, skilled, technical, or professional occupations for high school-age students who have opted to develop or expand their employment opportunities, often in lieu of preparing for college entry.
White A person having origins in any of the original peoples of Europe, North Africa, or the Middle East.


D-1
Appendix D—State Notes for the Common Core of Data: School Year 2004–05


APPENDIX D—State Notes for the Common Core of Data: School Year 2004–05
D-3
This appendix provides information on known anomalies and comments for data users for individual states on the school and agency files including information on when the data files were submitted by each state. Counts are based on currently operational (status 1, 3, 4, 5) units only. Sch=School File, Agn=Agency File. Alabama
Date Received: 11/28/2005 Anomalies: Not Applicable Data: Sch – Charter School, Ungraded Students; Agn – Teachers of Ungraded Classes, Ungraded Students.
Alaska
Date Received: 9/19/2005 Anomalies: Missing Data: Agn – Instructional Coordinators/Supervisors. Not Applicable Data: Sch – Ungraded Students; Agn – Teachers of Ungraded Classes, Ungraded Students.
Arizona
Date Received: 10/6/2005 Anomalies: Not Applicable Data: Agn – Teachers of Ungraded Classes.
Arkansas
Date Received: 7/8/2005 Anomalies: None.
California
Date Received: 12/8/2005 Anomalies: Missing Data: Sch – Prekindergarten Students; Agn – Prekindergarten Teachers, Library Media Support Staff. Not Applicable Data: Agn – Other High School Completers.
Colorado
Date Received: 9/29/2005 Anomalies: Not Applicable Data: Sch – Ungraded Students; Agn – Ungraded Students, Teachers of Ungraded Classes.
Connecticut
Date Received: 8/31/2005

APPENDIX D—State Notes for the Common Core of Data: School Year 2004–05
D-4
Anomalies: Missing Data: Sch – Free Lunch Eligible Students, Reduced-price Lunch Eligible Students, Migrant Students; Agn – Migrant Students. Not Applicable Data: Sch – Ungraded Students; Agn – Ungraded Students.
Delaware
Date Received: 7/21/2005 Anomalies: Not Applicable Data: Sch – Ungraded Students; Agn –Ungraded Students, Teachers of Ungraded Classes.
District of Columbia
Date Received: 8/25/2005 Anomalies: None.
Florida
Date Received: 10/21/2005 Anomalies: Missing Data: Sch – Magnet School. Not Applicable Data: Sch – Ungraded Students; Agn – Ungraded Students.
Georgia
Date Received: 8/1/2005 Anomalies: Not Applicable Data: Sch – Ungraded Students; Agn –Ungraded Students, Teachers of Ungraded Classes.
Hawaii
Date Received: 6/07/2005 Anomalies: Missing Data: Agn – Kindergarten Teachers. Not Applicable Data: Sch – Magnet School.
Idaho
Date Received: 10/3/2005 Anomalies: Not Applicable Data: Sch – Magnet School, Ungraded Students; Agn – Teachers of Ungraded Classes, Ungraded Students.
Illinois
Date Received: 9/22/2005 Anomalies: Missing Data: Agn – English Language Learner Students, Instructional Aides, Library Media Support Staff, LEA Administrative Support Staff, School Administrative Support Staff, All Other Support Staff. Not Applicable Data: Agn – Other High School Completers.

APPENDIX D—State Notes for the Common Core of Data: School Year 2004–05
D-5
Indiana
Date Received: 8/3/2005 Anomalies: Missing Data: Sch – Migrant Students; Agn – Migrant Students. Not Applicable Data: Sch – Ungraded Students; Agn – Ungraded Students.
Iowa
Date Received: 6/29/2005 Anomalies: Not Applicable Data: Sch – Magnet School, Ungraded Students; Agn – Ungraded Students, Teachers of Ungraded Classes.
Kansas
Date Received: 7/22/2005 Anomalies: Not Applicable Data: Agn – Other High School Completers.
Kentucky
Date Received: 7/13/2005 Anomalies: Missing Data: Sch – Free Lunch Eligible Students, Reduced-price Lunch Eligible Students, Total Free and Reduced Lunch Students, Prekindergarten Students. Not Applicable Data: Sch – Charter School.
Louisiana
Date Received: 7/29/2005 Anomalies: Not Applicable Data: Sch – Ungraded Students. Agn – Ungraded Students, Teachers of Ungraded Classes.
Maine
Date Received: 8/4/2005 Anomalies: Missing Data: Sch – Migrant Students; Agn – Prekindergarten Teachers, Kindergarten Teachers, Migrant Students. Not Applicable Data: Sch – Charter School, Ungraded Students; Agn – Teachers of Ungraded Classes, Ungraded Students.
Maryland
Date Received: 7/8/2005 Anomalies: Missing Data: Sch – Magnet School. Not Applicable Data: Sch – Ungraded Students; Agn – Teachers of Ungraded Classes, Ungraded Students.

APPENDIX D—State Notes for the Common Core of Data: School Year 2004–05
D-6
Massachusetts
Date Received: 8/11/2005 Anomalies: Missing Data: Agn – Prekindergarten Teachers, Library Media Support Staff. Not Applicable Data: Sch – Ungraded Students; Agn – Ungraded Students.
Michigan
Date Received: 09/30/2005 Anomalies: Missing Data: Agn – Prekindergarten Teachers, Kindergarten Teachers, Elementary Teachers, Secondary Teachers, Elementary Guidance Counselors, Secondary Guidance Counselors, Teachers of Ungraded Classes.
Minnesota
Date Received: 7/22/2005 Anomalies: Not Applicable Data: Sch – Ungraded Students; Agn – Other High School Completers, Ungraded Students.
Mississippi
Date Received: 10/03/2005 Anomalies: Missing Data: Sch - Migrant Students; Agn – Migrant Students.
Missouri
Date Received: 09/26/2005 Anomalies: Missing Data: Sch – Ungraded Students; Agn –Ungraded Students, Teachers of Ungraded Classes, Library Media Support Staff, School Administrative Support Staff. Not Applicable Data: Agn – Other High School Completers. Comments: Missouri reported district-level ungraded students as missing. In order to provide district-level total student membership counts (MEMBER04), MEMBER04 was calculated based on reported district-level prekindergarten through grade 12 membership (PK1204).
Montana
Date Received: 7/11/2005 Anomalies: Missing Data: Sch - Migrant Students; Agn – Migrant Students, Prekindergarten Teachers, Kindergarten Teachers, Library Media Support Staff, LEA Administrative Support Staff, School Administrative Support Staff, All Other Support Staff. Not Applicable Data: Sch – Magnet School, Charter School; Agn – Other High School Completers, Teachers of Ungraded Classes.
Nebraska
Date Received: 9/28/2005

APPENDIX D—State Notes for the Common Core of Data: School Year 2004–05
D-7
Anomalies: Missing Data: Sch – Magnet School; Agn – Prekindergarten Teachers, Kindergarten Teachers, School Administrative Support Staff. Not Applicable Data: Sch – Charter School, Ungraded Students; Agn – Ungraded Students, Teachers of Ungraded Classes.
Nevada
Date Received: 10/24/2005 Anomalies: Missing Data: Agn – Migrant Students, Instructional Coordinators/Supervisors, LEA Administrators, LEA Administrative Support Staff, School Administrative Support Staff. Comments: Student membership data are from the Nevada Department of Education web site. School operational status codes, school and agency high and low grades, and pupil/teacher ratios have been adjusted to agree with these membership data. Geocoding information is missing for 8 schools that were reported as closed by the state but later determined to be open.
New Hampshire
Date Received: 8/31/2005 Anomalies: Missing Data: Agn – Migrant Students, Diploma Recipients by Race/Ethnicity and by Gender, Instructional Coordinators/Supervisors, Student Support Services Staff. Not Applicable Data: Sch – Magnet School; Agn – Teachers of Ungraded Classes. Comments: New Hampshire does not report gender information for Other High School Completers or Diploma recipients.
New Jersey
Date Received: 11/14/2005 Anomalies: Missing Data: Sch – Magnet School; Agn –Migrant Students, Special Ed (IEP) Students, English Language Learner Students, Elementary Guidance Counselors, Secondary Guidance Counselors, All Other Support Staff. Not Applicable Data: Agn – Other High School Completers, Teachers of Ungraded Classes. Comments: Sch –High Grade Offered (GSHI04) was lowered from a reported high of grade 10 to grade 8 for 655 schools in New Jersey based on student enrollment information (student enrollments in these 655 schools terminated at grade 8). Agn – New Jersey reported district-level Ungraded Students as “Missing.” The count of Ungraded Students by agency was calculated by summing the total students for each of the associated schools on the school file. High Grade Offered (GSHI04) was lowered from a reported high of grade 10 to grade 8 for 247 agencies in New Jersey based on student enrollment information of associated schools (student enrollments in the associated 655 schools terminated at grade 8). Total teachers (TOTTCH04) were adjusted downward for 396 agencies in New Jersey because the sum of reported teacher detail exceeded the reported number of total teachers.

APPENDIX D—State Notes for the Common Core of Data: School Year 2004–05
D-8
New Mexico
Date Received: 8/12/2005 Anomalies: Not Applicable Data: Sch – Ungraded Students; Agn – Ungraded Students.
New York
Date Received: 9/27/2005 Anomalies: Missing Data: Agn – Migrant Students, Special Ed (IEP) Students, English Language Learner Students, Prekindergarten Teachers, Kindergarten Teachers, Elementary Teachers, Secondary Teachers, Teachers of Ungraded Classes, Total Teachers, Instructional Aides, Instructional Coordinators/Supervisors, Elementary Guidance Counselors, Secondary Guidance Counselors, Total Guidance Counselors, Librarians/Media Specialists, Library Media Support Staff, LEA Administrators, LEA Administrative Support Staff, School Administrators, School Administrative Support Staff, Student Support Services Staff, All Other Support Staff, Diploma Recipients, Other High School Completers. Comments: New York reported school universe data only. Agency directory information was pulled forward from 2003–04 and the count of students by agency was calculated by summing the total students for each of the associated schools on the school file. All other fields on the agency file were set to “Missing.”
North Carolina
Date Received: 7/21/2005 Anomalies: Not Applicable Data: Sch – Ungraded Students; Agn – Ungraded Students.
North Dakota
Date Received: 7/21/2005 Anomalies: Not Applicable Data: Sch – Magnet School, Charter School, Ungraded Students; Agn – Ungraded Students, Teachers of Ungraded Classes, Other High School Completers.
Ohio
Date Received: 9/28/2005 Anomalies: Missing Data: Sch – Magnet School; Agn – Migrant Students. Not Applicable Data: Sch – Ungraded Students; Agn – Ungraded Students, Teachers of Ungraded Classes, Other High School Completers.

APPENDIX D—State Notes for the Common Core of Data: School Year 2004–05
D-9
Oklahoma
Date Received: 12/6/2005 Anomalies: Not Applicable Data: Sch – Magnet School; Agn – Other High School Completers.
Oregon
Date Received: 10/19/2005 Anomalies: Missing Data: Sch – Magnet School.
Pennsylvania
Date Received: 8/4/2005 Anomalies: Missing Data: Agn – English Language Learner Students. Not Applicable Data: Agn – Other High School Completers.
Rhode Island
Date Received: 9/9/2005 Anomalies: Missing Data: Agn – Prekindergarten Teachers, Kindergarten Teachers, Elementary Teachers, Secondary Teachers, Teachers of Ungraded Classes, Instructional Aides, Instructional Coordinators/Supervisors, Librarians/Media Specialists. Not Applicable Data: Sch –Ungraded Students; Agn – Ungraded Students.
South Carolina
Date Received: 12/2/2005 Anomalies: Missing Data: Agn – Other High School Completers by Race/Ethnicity and by Gender, Diploma Recipients by Race/Ethnicity and by Gender, LEA Administrative Support Staff, School Administrative Support Staff. Not Applicable Data: Sch – Ungraded Students; Agn – Ungraded Students.
South Dakota
Date Received: 9/28/2005 Anomalies: Missing Data: Agn – Migrant Students. Not Applicable Data: Sch – Magnet School, Charter School, Ungraded Students; Agn – Ungraded Students, Other High School Completers.
Tennessee
Date Received: 9/29/2005 Anomalies: Missing Data: Sch – Free Lunch Eligible Students, Reduced-Price Lunch Eligible Students, Total Free and Reduced Lunch Students, Migrant Students,

APPENDIX D—State Notes for the Common Core of Data: School Year 2004–05
D-10
Students Membership Counts by Race/Ethnicity and by Gender; Agn – Migrant Students, English Language Learner Students, Instructional Coordinators/Supervisors, Library Media Support Staff. Comments: Total student membership (MEMBER04) was adjusted downward for 1 school (NCESSCH = 470318000299) because the sum of associated grade detail exceeded total reported student membership.
Texas
Date Received: 9/15/2005 Anomalies: Missing Data: Sch – Magnet School; Agn – Migrant Students, Library Media Support Staff. Not Applicable Data: Sch – Ungraded Students; Agn – Ungraded Students, Other High School Completers.
Utah
Date Received: 9/30/2005 Anomalies: Missing Data: Sch – Prekindergarten Students; Agn – Migrant Students. Not Applicable Data: Sch – Ungraded Students; Agn – Ungraded Students.
Vermont
Date Received: 8/25/2005 Anomalies: Not Applicable Data: Sch – Magnet School, Charter School.
Virginia
Date Received: 9/9/2005 Anomalies: Not Applicable Data: Sch – Ungraded Students; Agn – Ungraded Students, Teachers of Ungraded Classes.
Washington
Date Received: 9/28/2005 Anomalies: Not Applicable Data: Sch – Magnet School, Charter School, Ungraded Students; Agn – Ungraded Students.
West Virginia
Date Received: 7/22/2005 Anomalies: Not Applicable Data: Sch – Magnet School, Charter School.
Wisconsin
Date Received: 12/23/2005

APPENDIX D—State Notes for the Common Core of Data: School Year 2004–05
D-11
Anomalies: Missing Data: Sch – Free Lunch Eligible Students, Reduced-price Lunch Eligible Students; Agn – PK-12 Students, Other High School Completers, Diploma Recipients. Not Applicable Data: Sch – Ungraded Students; Agn – Ungraded Students.
Wyoming
Date Received: 7/22/2005 Anomalies: Not Applicable Data: Sch – Magnet School, Ungraded Students; Agn – Ungraded Students.
Bureau of Indian Affairs
Date Received: Did Not Report Anomalies: Missing Data: Sch – Classroom Teachers, Free Lunch Eligible Students, Reduced-price Lunch Eligible Students, Total Free and Reduced Lunch Students, Migrant Students, Student Enrollment for Grades PK–12; Agn – PK–12 Students, Migrant Students, Special Ed (IEP) Students, English Language Learner Students, Prekindergarten Teachers, Kindergarten Teachers, Elementary Teachers, Secondary Teachers, Teachers Of Ungraded Classes, Total Teachers, Instructional Aides, Instructional Coordinators/Supervisors, Elementary Guidance Counselors, Secondary Guidance Counselors, Total Guidance Counselors, Librarians/Media Specialists, Library Media Support Staff, LEA Administrators, LEA Administrative Support Staff, School Administrators, School Administrative Support Staff, Student Support Services Staff, All Other Support Staff, Diploma Recipients. Not Applicable Data: Sch – Magnet School, Charter School, Ungraded Students; Agn – Other High School Completers, Teachers of Ungraded Classes, Ungraded Students. Comments: The Bureau of Indian Affairs did not report data to CCD in 2004–05. Universe and directory values were pulled forward from the prior year’s file (2003–04). Aside from fields that are known to be “Not Applicable” for Bureau of Indian Affairs (i.e., those listed above), values were set to “Missing.”
Department of Defense Dependents (overseas) Schools
Date Received: 11/16/2005 Anomalies: Missing Data: Sch – Free Lunch Eligible Students, Reduced-price Lunch Eligible Students, Total Free and Reduced Lunch Students; Agn – Library Media Support Staff. Not Applicable Data: Sch – Magnet School, Charter School, Migrant Students, Ungraded Students; Agn –Ungraded Students, Migrant Students, Other High School Completers. Comments: No schools in this jurisdiction are Title I or School-wide Title I eligible.
Department of Defense Dependents (domestic) Schools
Date Received: 11/16/2005

APPENDIX D—State Notes for the Common Core of Data: School Year 2004–05
D-12
Anomalies: Missing Data: Sch – Free Lunch Eligible Students, Reduced-price Lunch Eligible Students, Total Free and Reduced Lunch Students; Agn – Library Media Support Staff, LEA Administrative Support Staff, Student Support Services Staff. Not Applicable Data: Sch – School-wide Title I, Magnet School, Charter School, Migrant Students, Ungraded Students; Agn – Migrant Students, Ungraded Students, Other High School Completers. Comments: No schools in this jurisdiction are Title I or School-wide Title I eligible.
American Samoa
Date Received: 7/22/2005 Anomalies: Missing Data: Sch – Migrant Students; Agn – Migrant Students. Not Applicable Data: Sch – Magnet School, Charter School. Comments: No schools in this jurisdiction are Title I or School-wide Title I eligible.
Guam
Date Received: 9/30/2005 Anomalies: Missing Data: Sch – Migrant Students; Agn – Migrant Students, Teachers of Ungraded Classes. Not Applicable Data: Sch – Magnet School, Charter School, Ungraded Students; Agn –Ungraded Students, Other High School Completers. Comments: No schools in this jurisdiction are Title I or School-wide Title I eligible.
Northern Marianas
Date Received: 8/29/2005 Anomalies: Missing Data: Sch - Migrant Students; Agn – Migrant Students, English Language Learner Students, Other High School Completers. Not Applicable Data: Sch – Magnet School. Comments: Northern Marianas does not report gender data. No schools in this jurisdiction are Title I or School-wide Title I eligible.
Puerto Rico
Date Received: 10/20/2005 Anomalies: Missing Data: Agn – English Language Learner Students.
Virgin Islands
Date Received: 9/16/2005 Anomalies: Missing Data: Sch – Free Lunch Eligible Students, Reduced-price Lunch Eligible Students, Total Free and Reduced Lunch Students, Migrant Students, Prekindergarten Students; Agn – Migrant Students, Prekindergarten Teachers. Not Applicable Data: Sch – Charter School; Agn – Other High School Completers.

E-1
Appendix E—Shuttle for the Common Core of Data Public Elementary/Secondary School Universe Survey: School Year 2004–05


Appendix E—Shuttle for the Common Core of Data Public Elementary/Secondary School Universe Survey: School Year 2004–05
E-3
National Center for Education Statistics OMB No. 1850-0067
Expires 1/31/2007
Public Elementary/Secondary School Universe Survey
Description
Data Field
NCES Education Agency ID
LEAID
State Education Agency ID
STID
NCES School ID
SCHNO
State School ID
SEASCH
Name of Education Agency
LEANM
Name of School
SCHNAM
Telephone Number (Area Code and Phone Number)
PHONE
Mailing Address - Street
MSTREE
Mailing Address - City
MCITY
Mailing Address - State (P.O. Abbreviation)
MSTATE
Mailing Address - ZIP (digits 1 thru 5)
MZIP
Mailing Address - ZIP4 (digits 6 thru 9)
MZIP4
Physical Location Address - Street
LSTREE
Physical Location Address - City
LCITY
Physical Location Address - State (P.O. Abbreviation)
LSTATE
Physical Location Address - ZIP (digits 1 thru 5)
LZIP
Physical Location Address - ZIP4 (digits 6 thru 9)
LZIP4
Description
Data Field
School Type Code
SCHTYP
Operational Status Code
STATUS
Grade Span Offered - Lowest grade
GSLO
Grade Span Offered - Highest grade
GSHI
Title I School
TITLEI
If yes, School-wide Title I
STITLI
Magnet School
MAGNET
Charter School
CHARTR
Shared Time School
SHARED
Classroom Teacher Count (1 explicit decimal point)
FTE
Students Eligible for Free Lunch
FRELCH
Students Eligible for Reduced-Price Lunch
REDLCH
Total of Free Lunch and Reduced-Price Lunch Eligible
FLE
Migrant Students Enrolled in Previous Year
MIGRNT
Paperwork Burden Statement - According to the Paperwork Reduction Act of 1995, no persons are required to respond to a collection of information unless such collection displays a valid OMB control number. The valid OMB control number for this information collection is 1850-0067. The time required to complete this information collection is estimated to average 55.5 hours per response, including the time to review instructions, search existing data resources, gather the data needed, complete and review the information collection. If you have any comments concerning the accuracy of the time estimate or suggestions for improving this form, please write to: U.S. Department of Education, Washington, D.C. 20202-4651. If you have comments or concerns regarding the status of your individual submission of this form, write directly to: NCES, U.S. Department of Education, 1990 K Street NW, Room 9087, Washington D.C. 20006-5651
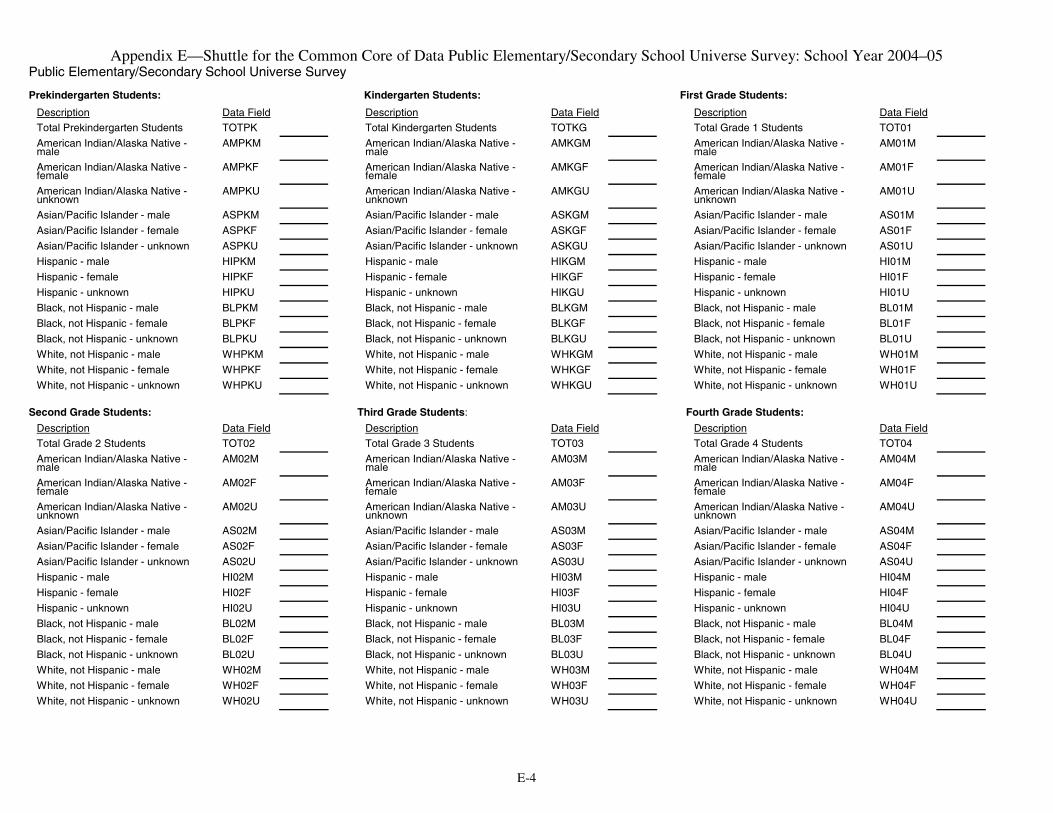
Appendix E—Shuttle for the Common Core of Data Public Elementary/Secondary School Universe Survey: School Year 2004–05
E-4
Public Elementary/Secondary School Universe Survey
Prekindergarten Students: Kindergarten Students: First Grade Students: Description
Data Field
Total Prekindergarten Students
TOTPK
American Indian/Alaska Native - male
AMPKM
American Indian/Alaska Native - female
AMPKF
American Indian/Alaska Native - unknown
AMPKU
Asian/Pacific Islander - male
ASPKM
Asian/Pacific Islander - female
ASPKF
Asian/Pacific Islander - unknown
ASPKU
Hispanic - male
HIPKM
Hispanic - female
HIPKF
Hispanic - unknown
HIPKU
Black, not Hispanic - male
BLPKM
Black, not Hispanic - female
BLPKF
Black, not Hispanic - unknown
BLPKU
White, not Hispanic - male
WHPKM
White, not Hispanic - female
WHPKF
White, not Hispanic - unknown
WHPKU
Second Grade Students: Description
Data Field
Total Grade 2 Students
TOT02
American Indian/Alaska Native - male
AM02M
American Indian/Alaska Native - female
AM02F
American Indian/Alaska Native - unknown
AM02U
Asian/Pacific Islander - male
AS02M
Asian/Pacific Islander - female
AS02F
Asian/Pacific Islander - unknown
AS02U
Hispanic - male
HI02M
Hispanic - female
HI02F
Hispanic - unknown
HI02U
Black, not Hispanic - male
BL02M
Black, not Hispanic - female
BL02F
Black, not Hispanic - unknown
BL02U
White, not Hispanic - male
WH02M
White, not Hispanic - female
WH02F
White, not Hispanic - unknown
WH02U
Description
Data Field
Total Kindergarten Students
TOTKG
American Indian/Alaska Native - male
AMKGM
American Indian/Alaska Native - female
AMKGF
American Indian/Alaska Native - unknown
AMKGU
Asian/Pacific Islander - male
ASKGM
Asian/Pacific Islander - female
ASKGF
Asian/Pacific Islander - unknown
ASKGU
Hispanic - male
HIKGM
Hispanic - female
HIKGF
Hispanic - unknown
HIKGU
Black, not Hispanic - male
BLKGM
Black, not Hispanic - female
BLKGF
Black, not Hispanic - unknown
BLKGU
White, not Hispanic - male
WHKGM
White, not Hispanic - female
WHKGF
White, not Hispanic - unknown
WHKGU
Third Grade Students: Description
Data Field
Total Grade 3 Students
TOT03
American Indian/Alaska Native - male
AM03M
American Indian/Alaska Native - female
AM03F
American Indian/Alaska Native - unknown
AM03U
Asian/Pacific Islander - male
AS03M
Asian/Pacific Islander - female
AS03F
Asian/Pacific Islander - unknown
AS03U
Hispanic - male
HI03M
Hispanic - female
HI03F
Hispanic - unknown
HI03U
Black, not Hispanic - male
BL03M
Black, not Hispanic - female
BL03F
Black, not Hispanic - unknown
BL03U
White, not Hispanic - male
WH03M
White, not Hispanic - female
WH03F
White, not Hispanic - unknown
WH03U
Description
Data Field
Total Grade 1 Students
TOT01
American Indian/Alaska Native - male
AM01M
American Indian/Alaska Native - female
AM01F
American Indian/Alaska Native - unknown
AM01U
Asian/Pacific Islander - male
AS01M
Asian/Pacific Islander - female
AS01F
Asian/Pacific Islander - unknown
AS01U
Hispanic - male
HI01M
Hispanic - female
HI01F
Hispanic - unknown
HI01U
Black, not Hispanic - male
BL01M
Black, not Hispanic - female
BL01F
Black, not Hispanic - unknown
BL01U
White, not Hispanic - male
WH01M
White, not Hispanic - female
WH01F
White, not Hispanic - unknown
WH01U
Fourth Grade Students: Description
Data Field
Total Grade 4 Students
TOT04
American Indian/Alaska Native - male
AM04M
American Indian/Alaska Native - female
AM04F
American Indian/Alaska Native - unknown
AM04U
Asian/Pacific Islander - male
AS04M
Asian/Pacific Islander - female
AS04F
Asian/Pacific Islander - unknown
AS04U
Hispanic - male
HI04M
Hispanic - female
HI04F
Hispanic - unknown
HI04U
Black, not Hispanic - male
BL04M
Black, not Hispanic - female
BL04F
Black, not Hispanic - unknown
BL04U
White, not Hispanic - male
WH04M
White, not Hispanic - female
WH04F
White, not Hispanic - unknown
WH04U

Appendix E—Shuttle for the Common Core of Data Public Elementary/Secondary School Universe Survey: School Year 2004–05
E-5
Public Elementary/Secondary School Universe Survey
Fifth Grade Students: Sixth Grade Students: Seventh Grade Students: Description
Data Field
Total Grade 5 Students
TOT05
American Indian/Alaska Native - male
AM05M
American Indian/Alaska Native - female
AM05F
American Indian/Alaska Native - unknown
AM05U
Asian/Pacific Islander - male
AS05M
Asian/Pacific Islander - female
AS05F
Asian/Pacific Islander - unknown
AS05U
Hispanic - male
HI05M
Hispanic - female
HI05F
Hispanic - unknown
HI05U
Black, not Hispanic - male
BL05M
Black, not Hispanic - female
BL05F
Black, not Hispanic - unknown
BL05U
White, not Hispanic - male
WH05M
White, not Hispanic - female
WH05F
White, not Hispanic - unknown
WH05U
Eighth Grade Students: Description
Data Field
Total Grade 8 Students
TOT08
American Indian/Alaska Native - male
AM08M
American Indian/Alaska Native - female
AM08F
American Indian/Alaska Native - unknown
AM08U
Asian/Pacific Islander - male
AS08M
Asian/Pacific Islander - female
AS08F
Asian/Pacific Islander - unknown
AS08U
Hispanic - male
HI08M
Hispanic - female
HI08F
Hispanic - unknown
HI08U
Black, not Hispanic - male
BL08M
Black, not Hispanic - female
BL08F
Black, not Hispanic - unknown
BL08U
White, not Hispanic - male
WH08M
White, not Hispanic - female
WH08F
White, not Hispanic - unknown
WH08U
Description
Data Field
Total Grade 6 Students
TOT06
American Indian/Alaska Native - male
AM06M
American Indian/Alaska Native - female
AM06F
American Indian/Alaska Native - unknown
AM06U
Asian/Pacific Islander - male
AS06M
Asian/Pacific Islander - female
AS06F
Asian/Pacific Islander - unknown
AS06U
Hispanic - male
HI06M
Hispanic - female
HI06F
Hispanic - unknown
HI06U
Black, not Hispanic - male
BL06M
Black, not Hispanic - female
BL06F
Black, not Hispanic - unknown
BL06U
White, not Hispanic - male
WH06M
White, not Hispanic - female
WH06F
White, not Hispanic - unknown
WH06U
Ninth Grade Students: Description
Data Field
Total Grade 9 Students
TOT09
American Indian/Alaska Native - male
AM09M
American Indian/Alaska Native - female
AM09F
American Indian/Alaska Native - unknown
AM09U
Asian/Pacific Islander - male
AS09M
Asian/Pacific Islander - female
AS09F
Asian/Pacific Islander - unknown
AS09U
Hispanic - male
HI09M
Hispanic - female
HI09F
Hispanic - unknown
HI09U
Black, not Hispanic - male
BL09M
Black, not Hispanic - female
BL09F
Black, not Hispanic - unknown
BL09U
White, not Hispanic - male
WH09M
White, not Hispanic - female
WH09F
White, not Hispanic - unknown
WH09U
Description
Data Field
Total Grade 7 Students
TOT07
American Indian/Alaska Native - male
AM07M
American Indian/Alaska Native - female
AM07F
American Indian/Alaska Native - unknown
AM07U
Asian/Pacific Islander - male
AS07M
Asian/Pacific Islander - female
AS07F
Asian/Pacific Islander - unknown
AS07U
Hispanic - male
HI07M
Hispanic - female
HI07F
Hispanic - unknown
HI07U
Black, not Hispanic - male
BL07M
Black, not Hispanic - female
BL07F
Black, not Hispanic - unknown
BL07U
White, not Hispanic - male
WH07M
White, not Hispanic - female
WH07F
White, not Hispanic - unknown
WH07U
Tenth Grade Students: Description
Data Field
Total Grade 10 Students
TOT10
American Indian/Alaska Native - male
AM10M
American Indian/Alaska Native - female
AM10F
American Indian/Alaska Native - unknown
AM10U
Asian/Pacific Islander - male
AS10M
Asian/Pacific Islander - female
AS10F
Asian/Pacific Islander - unknown
AS10U
Hispanic - male
HI10M
Hispanic - female
HI10F
Hispanic - unknown
HI10U
Black, not Hispanic - male
BL10M
Black, not Hispanic - female
BL10F
Black, not Hispanic - unknown
BL10U
White, not Hispanic - male
WH10M
White, not Hispanic - female
WH10F
White, not Hispanic - unknown
WH10U
Public Elementary/Secondary School Universe Survey

Appendix E—Shuttle for the Common Core of Data Public Elementary/Secondary School Universe Survey: School Year 2004–05
E-6
Public Elementary/Secondary School Universe Survey
Eleventh Grade Students: Twelfth Grade Students: Ungraded Students: Description
Data Field
Total Grade 11 Students
TOT11
American Indian/Alaska Native - male
AM11M
American Indian/Alaska Native - female
AM11F
American Indian/Alaska Native - unknown
AM11U
Asian/Pacific Islander - male
AS11M
Asian/Pacific Islander - female
AS11F
Asian/Pacific Islander - unknown
AS11U
Hispanic - male
HI11M
Hispanic - female
HI11F
Hispanic - unknown
HI11U
Black, not Hispanic - male
BL11M
Black, not Hi spanic - female
BL11F
Black, not Hispanic - unknown
BL11U
White, not Hispanic - male
WH11M
White, not Hispanic - female
WH11F
White, not Hispanic - unknown
WH11U
If ethnicity by grade is not available, but ethnicity for the entire school is, please complete Total Students, All Grades.
Description
Data Field
Total Grade 12 Students
TOT12
American Indian/Alaska Native - male
AM12M
American Indian/Alaska Native - female
AM12F
American Indian/Alaska Native - unknown
AM12U
Asian/Pacific Islander - male
AS12M
Asian/Pacific Islander - female
AS12F
Asian/Pacific Islander - unknown
AS12U
Hispanic - male
HI12M
Hispanic - female
HI12F
Hispanic - unknown
HI12U
Black, not Hispanic - male
BL12M
Black, not Hispanic - female
BL12F
Black, not Hispanic - unknown
BL12U
White, not Hispanic - male
WH12M
White, not Hispanic - female
WH12F
White, not Hispanic - unknown
WH12U
Total Students, All Grades: Description
Data Field
Total Students, All Grades
TOTAL
American Indian/Alaska Native - male
AMALM
American Indian/Alaska Native - female
AMALF
American Indian/Alaska Native - unknown
AMALU
Asian/Pacific Islander - male
ASALM
Asian/Pacific Islander - female
ASALF
Asian/Pacific Islander - unknown
ASALU
Hispanic - male
HIALM
Hispanic - female
HIALF
Hispanic - unknown
HIALU
Black, not Hispanic - male
BLALM
Black, not Hispanic - female
BLALF
Black, not Hispanic - unknown
BLALU
White, not Hispanic - male
WHALM
White, not Hispanic - female
WHALF
White, not Hispanic - unknown
WHALU
Description
Data Field
Total Ungraded Students
TOTUG
American Indian/Alaska Native - male
AMUGM
American Indian/Alaska Native - female
AMUGF
American Indian/Alaska Native - unknown
AMUGU
Asian/Pacific Islander - male
ASUGM
Asian/Pacific Islander - female
ASUGF
Asian/Pacific Islander - unknown
ASUGU
Hispanic - male
HIUGM
Hispanic - female
HIUGF
Hispanic - unknown
HIUGU
Black, not Hispanic - male
BLUGM
Black, not Hispanic - female
BLUGF
Black, not Hispanic - unknown
BLUGU
White, not Hispanic - male
WHUGM
White, not Hispanic - female
WHUGF
White, not Hispanic - unknown
WHUGU