Document · Web viewThis can cause programming problems where different contractors are responsible...
46
Shetland Islands Council Roads Asset Management Plan Version 2A December 2017
-
Upload
phungkhanh -
Category
Documents
-
view
214 -
download
0
Transcript of Document · Web viewThis can cause programming problems where different contractors are responsible...

Shetland Islands Council
Roads AssetManagement Plan
Version 2A
December 2017

Road Asset Management Plan
Foreword
This plan sets out the Council’s intentions for the management of its road asset for the next 5 years and
beyond. It has been produced in accordance with national guidance and recommended good practice.
In essence asset management sets out an approach to be used in acquiring, maintaining, improving and
disposal of an asset. In terms of roads Asset Management can be defined as:
“A structured, long-term approach to planning optimal maintenance and eventual renewal of infrastructure.”
It is widely recognised that the application of modern asset management practices can enable improved value
for money. In these challenging times is it essential that the Council embraces these methods and strives to
ensure that every penny spent is invested as wisely as possible. This plan forms an important part of the
Council’s commitment to apply good asset management to roads.
The plan has recognised the views of road users and residents and in particular the importance that is placed
upon our road assets. However, the opinion of residents needs to be updated so new opinion surveys will now
be undertaken on a bi-annual basis. Recent harsh winters have shown that our roads are susceptible to
damage when bad weather occurs. It is essential that an appropriate level of investment is put into the road
network to maintain and ultimately contribute to the main principles of the Council, that of the economic
wellbeing of the locality.
……………………………………………..
Executive Manager – Roads Service
Page 2

Road Asset Management Plan
Document Control & Council Approval
Version Number/Date Approved by Council
v1 Progress with this document’s development has been noted at various
meetings of the Environment and Transport Committee and the Roads –
Member Officer/Working Group.
v2
v2a
Approved by Environment & Transport Committee on 3 October 2016 and
Shetland Islands Council on 2 November 2016.
Annual update completed on 19 December 2017.
Next Update Due June 2021
Page 3

Road Asset Management Plan
Responsibility for the Plan
The persons responsible for the delivery of and updating of this plan are shown below
Position Name Responsible for
Shetland Islands Council To approve material changes to the RAMP, act as custodians of community assets and to set policy.
Environment & Transport Committee
Approval of the functional amendments to the RAMP.
Executive Director of Infrastructure Services
Maggie Sandison Approval of functional amendments to be proposed to Committee.
Executive Manager of Roads Service
Dave Coupe Champion of RAMP.
Team Leader-Asset and Network Management
Neil Hutcheson Monitoring improvement actions, informed decision making & ensuring updates to the documents. Identifying where improvements to the service can be made.
Programme Manager Bill Peterson Updating RAMP document as required. Producing integrated forward work programmes, both long and short term, and ensuring their availability to all interested parties. Identifying conflicts and opportunities for rationalisation of works.
Network Engineer Neil Robertson Ensuring data management procedures are followed and that all information is kept up to date. Providing requested information outputs to other parties.
Team Leaders Neil Hutcheson, George Leask, Barrie Scobie & Brian Wood
Monitoring and updating risk registers, ensuring control measures are put in place & identifying risks that need to be passed up the management tree.
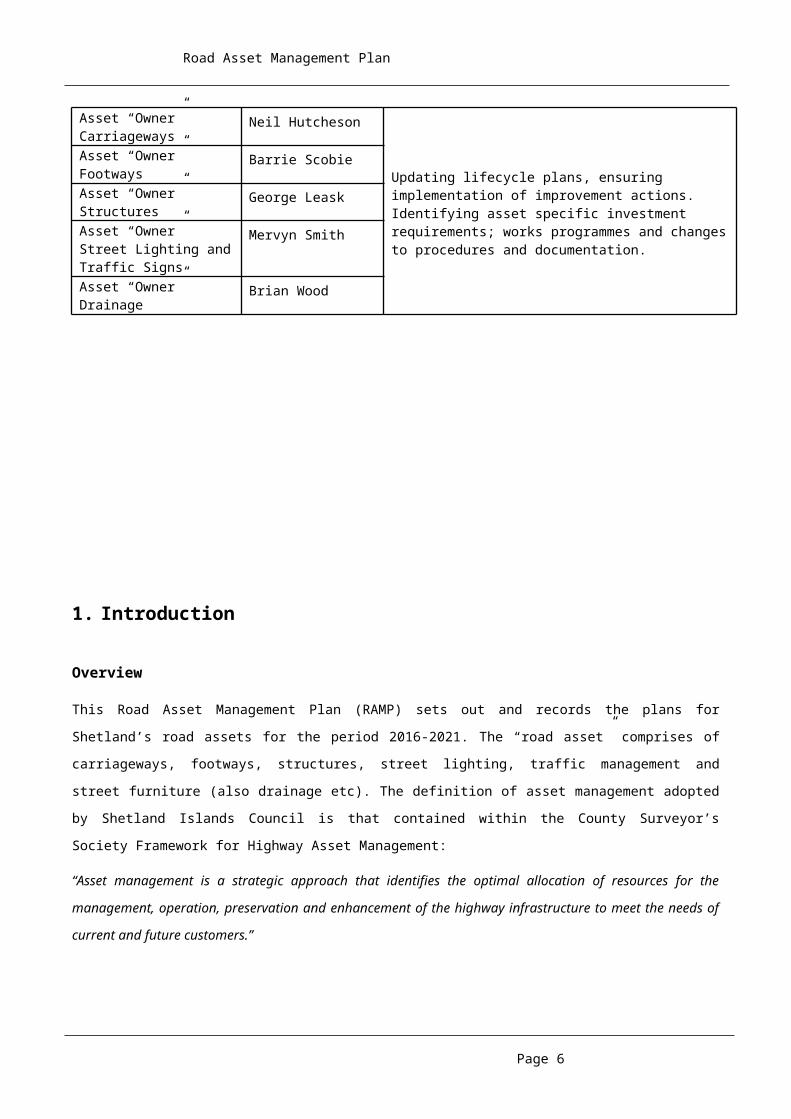
Asset “Owner” Carriageways
Neil Hutcheson
Updating lifecycle plans, ensuring implementation of improvement actions. Identifying asset specific investment requirements; works programmes and changes to procedures and documentation.
Asset “Owner” Footways
Barrie Scobie
Asset “Owner” Structures
George Leask
Asset “Owner” Street Lighting and Traffic Signs
Mervyn Smith
Asset “Owner” Drainage
Brian Wood
Page 4

Road Asset Management Plan
1. Introduction
Overview
This Road Asset Management Plan (RAMP) sets out and records the plans for Shetland’s road assets for the
period 2016-2021. The “road asset” comprises of carriageways, footways, structures, street lighting, traffic
management and street furniture (also drainage etc). The definition of asset management adopted by
Shetland Islands Council is that contained within the County Surveyor’s Society Framework for Highway Asset
Management:
“Asset management is a strategic approach that identifies the optimal allocation of resources for the
management, operation, preservation and enhancement of the highway infrastructure to meet the needs of
current and future customers.”
The Society of Chief Officers of Transportation for Scotland (SCOTS) guidance requires the RAMP to be
produced together with a road maintenance manual (RMM) and an annual status and options report (ASOR).
Purpose
There are many reasons for implementing a RAMP that include:
providing evidence of strategic thinking and long term planning with regard to maintenance and
management of the road infrastructure ;
to identify and take account of the needs of road users;
a satisfactory explanation to stakeholders of a fair and reasonable way of allocating limited
operational, maintenance and improvement resources;
the introduction of Whole of Government Accounts (WGA) and Resource Accounting and Budgeting
(RAB), whereby local authorities are to be required to provide financial forecasting and valuation
information to central government;
in order to meet both national and local outcomes as specified within the single outcome agreement;
formalising strategies for investment in road asset groups; and
defining service standards.
The plan aims to improve how the road asset is managed and to enable the delivery of a better value for
money roads service. Local authorities have a statutory duty to pursue best value. Expenditure must be
prioritised to ensure corporate objectives can be effectively delivered within budgetary constraints. Asset
management assists this process by enabling the allocation of resources based upon assessed need.
Page 5
Road Asset Management Plan
The use of lifecycle planning, the minimisation of whole life costs and decision making informed by an
appreciation of risk and benefit are key asset management components that will help the Roads Service
allocate resources to where they are likely to provide the best long-term benefits.
RAMP and Other Plans
The RAMP relates to the Council’s other strategic documents and plans as illustrated below:
The RAMP is informed directly by the Shetland Regional Transport Strategy, the Annual Status and Options
(Carriageway Condition) Report and the Road Maintenance Manual. Targets and strategies contained in the
RAMP are used to develop annual works programmes once the Council’s annual budget for roads has been
agreed.
Page 6
Single Outcome Agreement
Community Plan
Road Asset Valuation Report
Corporate Plan
Road Maintenance Manual
Shetland Regional Transport Strategy
Roads ServicePlan
Road Asset Management Plan
Roads Action Plan Annual Work Programme
Annual Options and Status Report
Capital Works(Asset Investment Plan)
RevenueWorks

Road Asset Management Plan
2. Road Assets
Road Assets
The Council’s road assets covered by this plan are:
Carriageways 1,054 km
Footways 114 km
Structures 308 Bridges, Culverts, Underpasses etc
Street Lighting 3,995 Lighting Columns
Traffic Management Systems 10 Pedestrian Crossings (7 Pelican and 3 Zebra)
Road Drainage Infrastructure (extent unknown)
The asset also includes traffic signs, roadside safety barriers, pedestrian barriers, gullies, ditches, traffic
calming features, road markings, car parks, verges and street furniture such as bollards.
Assets Not Covered
Some related assets that the Roads Services maintain are the responsibility of other Council departments.
The Council owned road assets not covered in this RAMP are:
footpaths managed by the Housing Service and Sport & Leisure Service;
bus shelters managed by Estate Operations;
amenity grassed areas which are maintained by Environmental Services;
private roads;
private bridges;
public rights of way and
water related infrastructure that does not form part of the road network.
Inventory Data
This plan is based upon currently available inventory data for road assets, i.e. carriageway, footway,
structures, street lighting, traffic signals and street furniture. For some minor road assets inventory data is not
currently held, however, an attempt has been made to incorporate these assets within this plan using local
estimates and sample surveys. The continual improvement of the asset data will form an important part of the
process of updating the road asset data management plan.
Page 7

Road Asset Management Plan
3. Customer Expectations
Customer Preferences
The expectations of road users need to be sought and understood as part of the asset management process.
The Council takes part in national performance reviews through APSE and SCOTS as well as seeking the
views of the local community by undertaking general "your voice" surveys regularly over a number of years.
Questions related to roads were included in the autumn 2005 survey, with exactly the same questions
repeated in autumn 2008. The survey allowed satisfaction to be rated at one of five levels, from very poor to
excellent. By repeating exactly the same questions, it was possible to monitor changes in satisfaction levels
over that three-year period. A new survey is overdue and will be undertaken this year, 2016/17. The format
used will be as provided by APSE so that it is consistent with surveys undertaken by other local authorities
enabling comparisons to be made for benchmarking purposes.
In addition project specific consultation is undertaken for all major works and traffic management schemes
where local residents, Councillors and appropriate user groups are consulted to gauge their opinion of the
scheme.
Performance and maintenance issues shall be consulted on bi-annually. A questionnaire is circulated to all
Community Councils asking them to record levels of satisfaction with, and the importance of all aspects of
road maintenance. The most recent survey model used was the ‘Highway Maintenance Services Customer
Satisfaction Survey’ as produced by APSE. The results of this consultation will feedback into the road
maintenance plan, determining the respective priorities within each Community Council area.
Additional consultation takes place with transport stakeholders on an as required basis, for example,
reviewing specific issues such as winter maintenance, or parking restrictions and traffic management.
Consultation Results
Full results of the latest “Your Voice” survey can be found in the survey report itself, however some of the
findings in relation to roads are:-
86% rated the general standard of the road surface as satisfactory or better.
79% rated the repair of potholes and road surface defects as satisfactory or better (70% in 2005).
76% rated the general standard of footway maintenance as satisfactory or better (78% in 2005)
60% rated the gritting and snow clearing of rural main roads as good or excellent with 93% rating it as
satisfactory or better (89% in 2005).
75% rated the gritting or snow clearing of footways in residential areas as satisfactory or better (72%
in 2005)
86% rated the speed of repairs of Street lights as satisfactory or better (93% in 2005).
Page 8

Road Asset Management Plan
The results of the surveys can be used by the Roads Service to identify areas of the service that may require
revised strategies to be implemented.
Customer Contacts
Customers or road users make contact with the Roads Service in the traditional way via letters, personally
visiting the office and through the local Community Council or their Council member. A more common method
in recent times has been to e-mail the Roads Service at our address which is available on the Council’s
website. The Council also has a Twitter address and the Roads Service has occasionally received messages
for our attention over this newer form of social media. In addition to these methods Roads also has a link from
its webpage to our Pavement Management System. A member of the public can “create” a defect on the
system if they wish to report a fault such as a damaged kerb or blocked gully. The Area Maintenance
Engineers can then access this defect and, when necessary, create a works order for the necessary repairs.
Page 9

Road Asset Management Plan
4. Demands
Asset Growth
The road asset has increased by approximately 0.8 kilometres per year over the last 5 years, mainly due to a
number of small housing developments complete with attendant footways and lighting columns. This low rate
of growth, equating to only 0.1 % p.a., was in part due to the Council’s Housing debt and a reduction in
funding to Housing Associations. However, this rate is expected to increase in the next 5 years with a number
of developments being planned by the Council, Hjaltland Housing Association and private developers. There
may be as many as 300 houses built requiring approximately 8 construction consents for the associated
roads. Currently the largest of these will be by Hjaltland at the Staney Hill on the north-west outskirts of central
Lerwick. This development will account for almost 200 of these houses with a considerable increase in our
road network required to service these properties.
Recent additions in the use of traffic calming features and high friction surfacing have increased the
maintenance budget requirements due to additional maintenance costs for their repair but again the increase
in their use is likely to recede in the near future as most problem areas have now been addressed.
New or additional assets create the need for maintenance, management and associated funding in future
years as these assets age. This is particularly relevant to street lighting as energy cost increases immediately
result in an increase in the budget required. However, as we are now in the process of replacing conventional
streetlighting lanterns with LED equivalents on existing public roads we now require developers to provide this
energy efficient form of lighting on any roads that they construct.
Traffic Growth and Composition
The SIC traffic section keeps records of traffic volumes from a number of permanent and temporary counter
sites throughout the Isles. As would be expected the majority of HGV traffic occurs on the principal roads.
However, largely due to the aquaculture industry, there are a number of unclassified routes where significant
volumes of HGV vehicles are present and this is undoubtedly causing significant damage to single track roads
which were never intended to be subjected to this level of traffic loading. This has created a growing need for
investment in the maintenance of these single track roads.
Environmental Conditions
Pressure has also been placed upon the asset as a result of environmental conditions, most notably the harsh
winters experienced in 2009/10 and 2010/11. These caused significant damage to carriageways with a
freeze/thaw action resulting in cracking of the road surface, throughout Shetland. There is also a notable
increase in the occurrence of landslips on hillsides where peat overlies a rock substrate. These are usually as
a result of high intensity rainfall events which now appear to be more common, possibly as a result of climate
change. These have the potential to damage roads and/or disrupt travel. The most notable incidents in the
past were the landslides across the A970 at Channerwick and the Maywick Road in the South Mainland.
Page 10

Road Asset Management Plan
Utility Activity (For Example:- Scottish Water, BT, SSEB, District Heating)
Utility activity can have a major effect on the maintenance and management of the road assets. There is
undoubtedly a significant increase in the number of defects found following the disturbance of the carriageway
or footway surface due to utilities. This is apparent even when the utility has reinstated the surface to the
required standard. In the recent past the renewals of water mains within Lerwick and the installation of district
heating scheme infrastructure has increased maintenance costs. Fortunately Scottish Water has recently
been making use of “pipe bursting” technology to replace or line existing pipework without the need for
excavations in the carriageway. We also understand that the district heating scheme is now operating at
capacity so there is unlikely to be any significant increase in new connections in the immediate future.
Statutory undertakers are responsible for carrying out their own reinstatements although these may be
contracted and/or sub-contracted to others. This can cause programming problems where different
contractors are responsible for different aspects of the reinstatement. The Roads Service enforces a 2-year
guarantee period on all re-instatements and 3 years for those entailing deep excavations.
Where statutory undertakers have caused damage to Council assets it is SIC practice to endeavour to reclaim
the costs of repair or replacement from the responsible party. This is not always possible but recently we have
had more success with the most notable repair being the inlay resurfacing of a half lane width of Commercial
road along a failed water main reinstatement.
It is difficult to predict the amount of utility activity in any one year although the recent rise in activity related to
a large capital investment by Scottish Water is likely to tail off over the next three years. Work is in progress
on upgrading broadband in Shetland with fibre optic cables being installed in existing ducts between
exchanges and newly installed service cabinets. This has required some work in the carriageway and
roadside verges. While this work may be ongoing over the next five years it is not expected to require a large
number of excavations in the carriageway.
Page 11
Road Asset Management Plan
5. Service Standards
This plan is based upon delivering the service standards listed below. The standards reflect the funding levels
in section 6. They are the standards that road users can expect from Shetland’s road assets during the plan
period. This plan targets delivery of service standards shown below. Details of how the specific measures
shown below are calculated are included in the road maintenance manual.
SCOTS CORE PERFORMANCE INDICATORS
Service Measured By Target Standard
2017 2021
Carriageways
Safety
Percentage of Cat 1 defects made safe within response
times. 100% 100%
Percentage of safety inspections completed on time 96.9% 96.9%
Condition
Percentage of all roads to be considered for maintenance
treatment 37.7% 38.9%
Percentage of “A” Class roads to be considered for
maintenance treatment 19.8% 20.7%
Percentage of “B” Class roads to be considered for
maintenance treatment 33.5% 34.4%
Percentage of “C” Class roads to be considered for
maintenance treatment 31.5% 35.0%
Percentage of unclassified, non-principal roads network
where maintenance should be considered 50.5% 51.1%
Percentage of carriageway length treated 6.68% 4.35%
Footways
Safety
Percentage of Cat 1 defects made safe within response
times.Not
applicable TBA
Percentage of safety inspections completed on time 100% 100%
ConditionPercentage of footway area to be considered for
maintenance treatmentNot
formally inspected
TBA
% of footway area treated 2.21% 1%
Page 12

Road Asset Management Plan
Street Lighting – Core Indicators
Safety
Percentage of repairs within 7 days not available 70%
Percentage of street lights not working as planned on any
one evening 6.4% 5%
EnvironmentAverage annual electricity consumption per street light
(kwHrs) 525.7 320
Structures
Condition
Percentage of primary inspections carried out on time Notavailable TBA
Percentage of general inspections carried out on time 100% 100%
Bridge Stock Condition Indicator - Average 98.38 TBA
Bridge Stock Condition Index - Critical 95.83 TBA
An action for the Engineers with responsibility for bridges, over the next two years, is to re-assess them and
update their entries in the data inventory. The above table will be populated at that time. It is likely that during
this plan, period inspections will identify additional structures that have deteriorated to the point of requiring
attention. Priorities may need to be adjusted to accommodate this.
Page 13

Road Asset Management Plan
6. Financial Summary
Sources of Funding and Budget Allocation
Revenue
Revenue funding within roads is based on historical precedence and identified need and is split
between a number of service headings which are broadly in line with Asset Management elements.
Currently within the service individual budget holders are encouraged to make a case for any additional
funds that are required to enable the ongoing maintenance and management of the assets such that the
funding split can be adjusted to reflect current priorities. Each of the budget holders is then responsible
for determining how the funding is used within their service area. Revenue funding for roads
maintenance has been reduced in recent years due to pressure on the funding of the Council’s overall
revenue budgets.
A large part of the budget is dictated by the cost of running the Council’s Roads Maintenance Section
which is predicated upon the labour required to deliver the winter service. All routine and reactive works
are carried out by the Maintenance Section. Therefore there is little scope to vary the total Roads
budget unless there is a corresponding reduction or increase to the extents of the road network
gritted/ploughed during the winter months. However there is scope for improving the use of the current
budget via the exploration of different ways of directing the resources to the most productive work and
that which has the greatest benefit to the asset. From 2017-18 the method of optimising this “direction of
resources” will be the “carriageway cost projection model” produced by SCOTS. This spreadsheet has
been developed and refined over the duration of the SCOTS RAMP project. Many authorities already
use it for this purpose and this will ensure that our budget method is consistent and can be compared to
other Scottish Councils.
It should be noted that the opportunity to vary budgets may also be constrained by resource
considerations. As the majority of the works is carried out by “in house” resources it may be that a need
to provide work that the resources are most able to do is, in some part, a stronger consideration than
doing the work that is most beneficial to the asset. This can be offset to a certain extent by reallocating a
proportion of, for example, the surface dressing budget to slurry sealing which requires a specialist
contractor. The same process can be applied with the budgets for our traffic signs, safety barriers and
cattle grids maintenance which is undertaken by a private contractor.
Capital
Roads capital projects are included as part of the Council’s Asset Investment Plan. The plan is co-
ordinated by the Capital Programme Service. Currently funding is allocated to Roads projects through a
Business Justification Case or “Gateway” process where each proposal is assessed and prioritised by
the Council’s Asset Investment Group. This ensures that only the proposals, which will yield the most
Page 14

Road Asset Management Plan
benefit for the Shetland public, are added to the Asset Investment Plan. The Council’s capital budget
allocation has been reduced in recent years and the allocation for Capital road schemes has followed
suit. The schemes “promoted” by Roads through the Business Justification Case process are generally
carriageways needing reconstruction, streetlighting that needs replacement and structures such as
bridges or retaining walls that need significant maintenance. These are issues that require immediate
investment to maintain the value of the asset.
Where a capital roads scheme is being undertaken largely for maintenance purposes the required
funding is to be related to an “asset investment plan” derived from a carriageway cost model. A capital
investment project was undertaken in 2014 using a model from the Highways Maintenance Efficiency
Programme (HMEP) project. In future the model used will, in common with the revenue funding, be the
“carriageway cost projection spreadsheet” produced by SCOTS.
Further sources of funding for works on the public road include the following:
IncomeThe Roads Service operated a trading account until 2014-15. Since then works have been done on an
“at cost” basis. However, the service shall still tender for external contracts when it has sufficient
available resources (labour and plant). These works, which vary from resurfacing to harbour works,
generate an income for the Council as well as ensuring resources are fully utilised thereby reducing
their unit cost. The income generated varies greatly from year to year but has increased recently due to
works associated with the construction of the TOTAL Gas Plant at Sullom Voe. This has mainly been
due to the supply of asphalt from the batching plant at the Scord Quarry.
GrantsIndividual grants may be available for specific types of improvement work from Government or specialist
interest groups. Budget holders produce applications for external grants which are used for the specific
projects identified. Recent examples of this are the new Clickimin Foot/Cyclepath, Lerwick and the
Millbrae Footway Improvements, Scalloway that were part funded by SUSTRANS and the Scottish
Government’s Cycling, Walking and Safer Streets funding.
Other
The Council seeks to obtain costs from developers, or works done by them, as contributions towards
improvements to the road infrastructure that are required in the local vicinity due to their development.
The most notable example of this was the contribution made towards the construction of the A970
South Road/South Lochside Roundabout by Safeway Ltd when they built their nearby supermarket.
Developers of housing estates are on occasion required to make smaller contributions such as meeting
the costs of a new footpath to link the development with a nearby settlement.
Page 15

Road Asset Management Plan
Asset Valuation
As at April 2017 the Road asset is valued as follows:
Asset Type
Gross Replacement Cost (GRC)
(£000k)
Depreciated Replacement Cost (DRC)
(£000k)
Annualised Depreciation Charge (ADC)
(£000k)
Comments
Carriageways 954,872 847,547 9,302
Footways &
Cycleways30,574 21,962 302
Structures 45,171 43,927 160
Street Lighting 30,184 17,398 747
Condition survey in
progress to facilitate
column replacement and
lantern upgrade to LED
Traffic
Management200 139 10
Only 10 Sets of Pedestrian
Crossing Lights
Street Furniture 21,015 10,457 992
Land 6,639 6,639 -
Total 1,088,655 948,069 11,514
The valuation figures above illustrate the very high financial value of the road asset which is calculated
on the basis of a depreciated replacement cost. This method of valuation provides the current cost of
replacing an asset with its modern equivalent less deductions for all physical deterioration and
obsolescence.
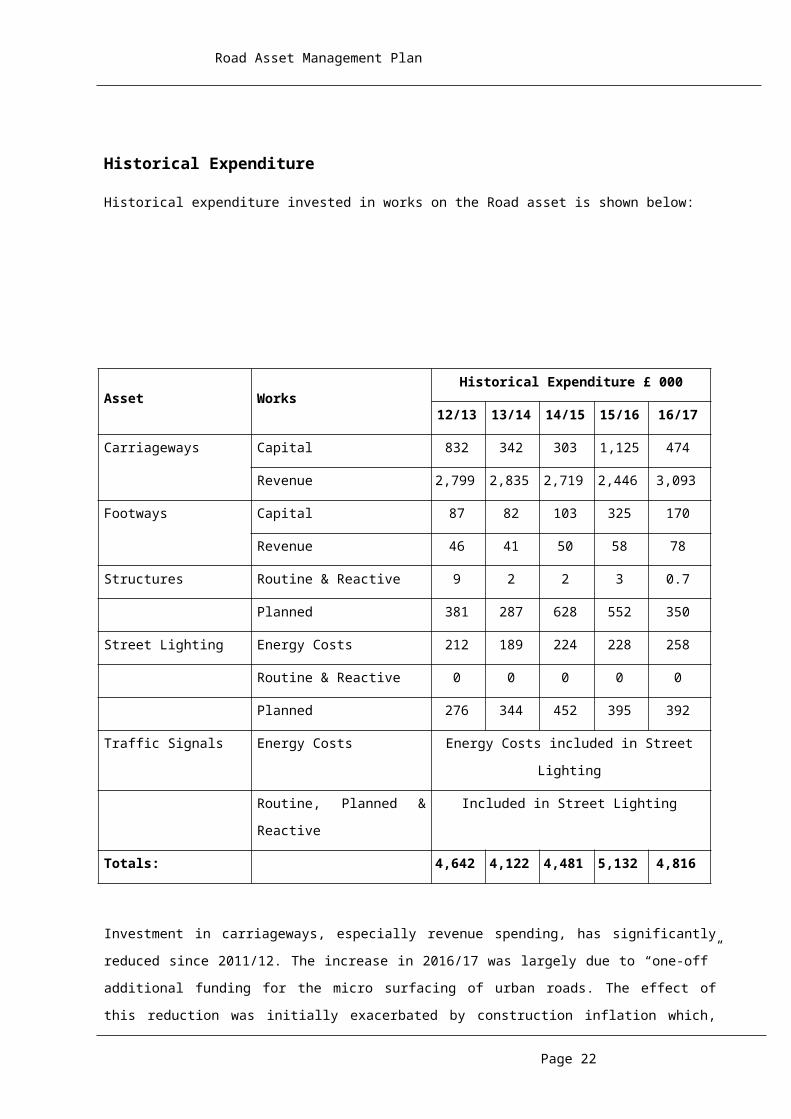
Historical Expenditure
Historical expenditure invested in works on the Road asset is shown below:
Page 16

Road Asset Management Plan
Asset WorksHistorical Expenditure £ 000
12/13 13/14 14/15 15/16 16/17
Carriageways Capital 832 342 303 1,125 474
Revenue 2,799 2,835 2,719 2,446 3,093
Footways Capital 87 82 103 325 170
Revenue 46 41 50 58 78
Structures Routine & Reactive 9 2 2 3 0.7
Planned 381 287 628 552 350
Street Lighting Energy Costs 212 189 224 228 258
Routine & Reactive 0 0 0 0 0
Planned 276 344 452 395 392
Traffic Signals Energy Costs Energy Costs included in Street Lighting
Routine, Planned &
Reactive
Included in Street Lighting
Totals: 4,642 4,122 4,481 5,132 4,816
Investment in carriageways, especially revenue spending, has significantly reduced since 2011/12. The
increase in 2016/17 was largely due to “one-off” additional funding for the micro surfacing of urban
roads. The effect of this reduction was initially exacerbated by construction inflation which, due to the
increased costs of bitumen and fuel, impacted on the area of carriageway that could be treated. This
was reflected in the data gathered during the annual condition survey and the resulting statutory
performance indicator. The Road Condition Indicator (RCI) for all of Shetland’s roads initially increased
from 40.7 to 43.7 in 2011/12 and then reduced slightly to 42.5 in 2012/13. This figure is the percentage
of “the road network that should be considered for maintenance treatment.” However, in the past 4
years the RCI has reduced to 37.7% as a result of better use of the SCANNER survey data to target the
most appropriate roads for preventative maintenance.
Footway spending has also had a significant reduction. The main impact being that no new footpaths
have been constructed recently until 2015/16 when the grant assisted Millbrae footpath began
construction. This situation is likely to continue for the immediate future. However, the slurry sealing of
footways has been increased to treat footway surfaces as this will prevent more costly repairs being
required in the long term.
There has also been a general reduction in planned spending on structures/bridges down from
£380,000 to approximately £150,000 if only the smaller schemes undertaken on an annual basis are
Page 17

Road Asset Management Plan
considered. This reduction has been met by undertaking repairs to existing bridges rather than replacing
them with culverts. While this work extends the life of the bridge there will inevitably come a time when
the only option is their replacement with a large diameter culvert. In recent years the spend on planned
works increased due to essential maintenance to the bearings of the Burra and Trondra bridges. This is
reflected in the increase in expenditure on planned structural maintenance in the financial years 14/15
and 15/16.
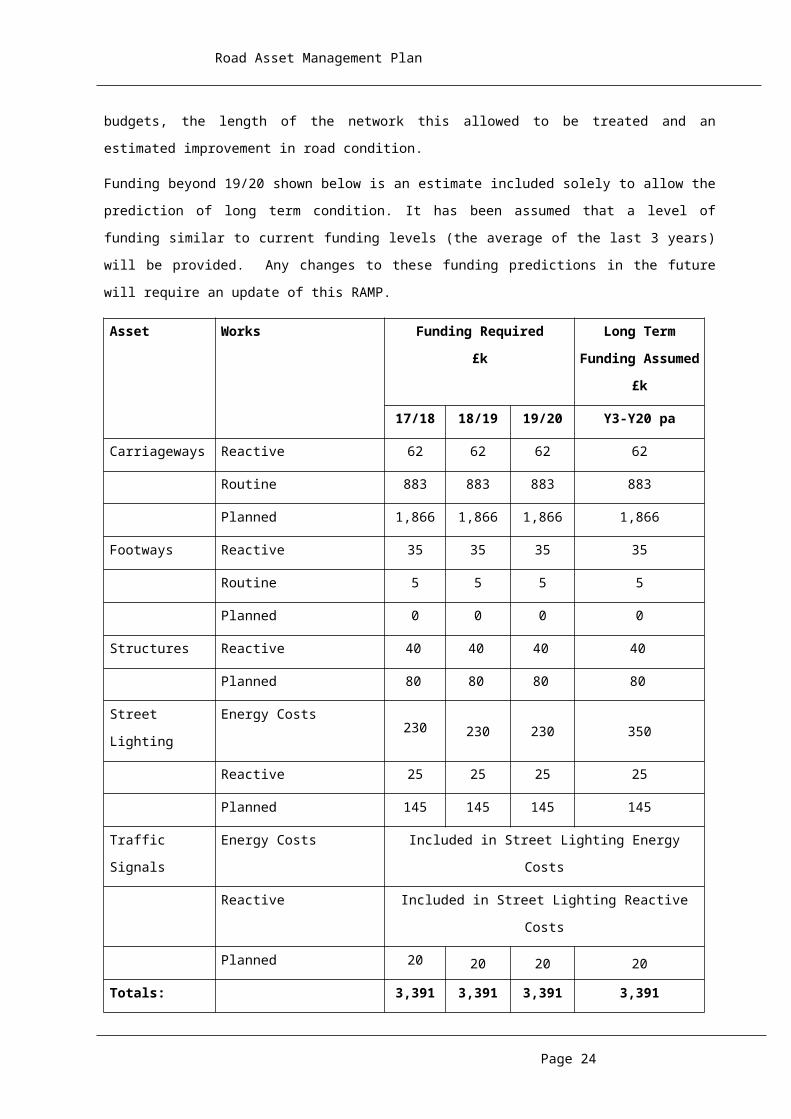
Planned Funding
The service standard targets shown in section 5 are based upon the following funding levels. The
funding for years 17/18 to 19/20 is based upon the budget for the 2016/17 financial year as confirmed
by the full Council at their meeting on 10 February 2016. This decision was based on previous budgets,
the length of the network this allowed to be treated and an estimated improvement in road condition.
Funding beyond 19/20 shown below is an estimate included solely to allow the prediction of long term
condition. It has been assumed that a level of funding similar to current funding levels (the average of
the last 3 years) will be provided. Any changes to these funding predictions in the future will require an
update of this RAMP.
Asset Works Funding Required£k
Long Term Funding Assumed
£k
17/18 18/19 19/20 Y3-Y20 pa
Carriageways Reactive 62 62 62 62
Routine 883 883 883 883
Planned 1,866 1,866 1,866 1,866
Footways Reactive 35 35 35 35
Routine 5 5 5 5
Planned 0 0 0 0
Structures Reactive 40 40 40 40
Planned 80 80 80 80
Street Lighting Energy Costs 230 230 230 350
Reactive 25 25 25 25
Planned 145 145 145 145
Traffic Signals Energy Costs Included in Street Lighting Energy Costs
Reactive Included in Street Lighting Reactive Costs
Page 18

Road Asset Management Plan
Asset Works Funding Required£k
Long Term Funding Assumed
£k
17/18 18/19 19/20 Y3-Y20 pa
Planned 20 20 20 20
Totals: 3,391 3,391 3,391 3,391
# Energy cost are shown at 2014/15 value although it is very likely that these will escalate significantly if recent trends in prices
continue as they are predicted (12.5% annual increase).
Page 19

Road Asset Management Plan
Asset Investment Strategies
The strategies in this section have been determined using predictions of future condition over a 3-year
period. In future the predictions will be made over a 20 year period by making use of the “carriageway
cost projection model” produced by SCOTS. This will enable strategies to be created to look at the
whole life cost of maintaining the asset. Using long term predictions means that decisions about
funding levels can be taken with due consideration of the future maintenance funding liabilities that are
being created.
Investment strategies for the major asset types are summarised below. These strategies are designed
to enable the service standards in section 5 to be delivered.
Investment between Asset TypesIn comparison to historical investment, future investment, for the main asset types, is planned to be:
− Carriageways: level of investment maintained at similar levels
− Footways: level of investment maintained at similar levels
− Structures: level of investment maintained at similar levels
− Street lighting; level of investment maintained at similar levels, but this is only made possible by
the approved “savings” policy that will see streetlights being removed in some areas. This
reduction in the asset will allow our rapidly deteriorating streetlighting to be maintained/replaced
providing the budget is not further reduced. The aim in the medium term is also to replace our
existing conventional lanterns with their LED equivalent. The cost of these replacements, and
the replacement of a substantial number of “failed” lighting columns, would be met from the
energy savings accrued by the use of these energy efficient lanterns. Therefore, until the lights
are replaced the investment will be maintained at similar levels. When this replacement scheme
is completed the streetlighting energy expenditure will be almost halved. The reactive
maintenance expenditure would also be reduced to approximately 60% of the current figure.
The completion of the replacement scheme could initially result in the planned maintenance
being reduced to less than 50% of the current figure. However, in time this would need an
increase to allow for planned replacements of columns in order to avoid the current situation
where a significant proportion of our columns have reached the end of their useful life at the
same time.
− Traffic signals; level of investment maintained at similar levels
Page 20

Road Asset Management Plan
CarriagewaysCategory Description Basis of Strategy
Routine and
Reactive Repair
Repair of defect to
current intervention
standards and
response times.
The strategy requires the deployment of roadworker
squads on seasonal repairs such as patching prior to
surface dressing. To a lesser extent they are also deployed
to undertake urgent and/or emergency repairs.
Planned
Maintenance
Preventative
A programme of
preventative treatment
or roads in the initial
stages of deterioration.
The strategy is predicted to require approximately
- A roads: Surface dressing 12.0 km pa on average
- B & C Roads: surface dressing 12.0 km pa
- U Roads: Surface dressing 11.0 km pa
This split reflects the respective area of each road
classification. Priority has been given to “A class” roads in
the past at the expense of other classifications. This is
shown by comparing the RCI for each classification. The
aim is that this split will result in a greater improvement in
the overall RCI for the given budget. This approach is
supported by the “Financial Reporting Tools for
Carriageways” produced by SCOTS. This totals 35 km so it
would take 30 years for the entire 1054 km carriageway
network to be surface dressed.
Planned
Maintenance
Corrective
Programme of
resurfacing where a
preventative treatment
cannot be applied due
to rutting or poor
longitudinal profile.
The strategy is predicted to require:
- A roads 3.4 km resurfacing pa
- B & C roads 3.1 km of resurfacing pa
- U roads 3.0 km of resurfacing pa.
This split reflects the respective area of each road
classification. Priority has been given to “A class” roads in
the past at the expense of other classifications. This is
shown by comparing the RCI for each classification. The
aim is that this split will result in a greater improvement in
the overall RCI for the given budget. This approach is
supported by the “Financial Reporting Tools for
Carriageways” produced by SCOTS. This totals 9.5 km so
it would take 166 years for the entire carriageway network
to be resurfaced. (Please note that there are significant
lengths of unclassified road in Shetland where the surface
construction consists of layers of surface dressing. They
have never been surfaced with bitmac/asphalt and are
unlikely to be in the future as their running surface is
adequate for roads of this nature with low traffic volumes).
Page 21
Road Asset Management Plan
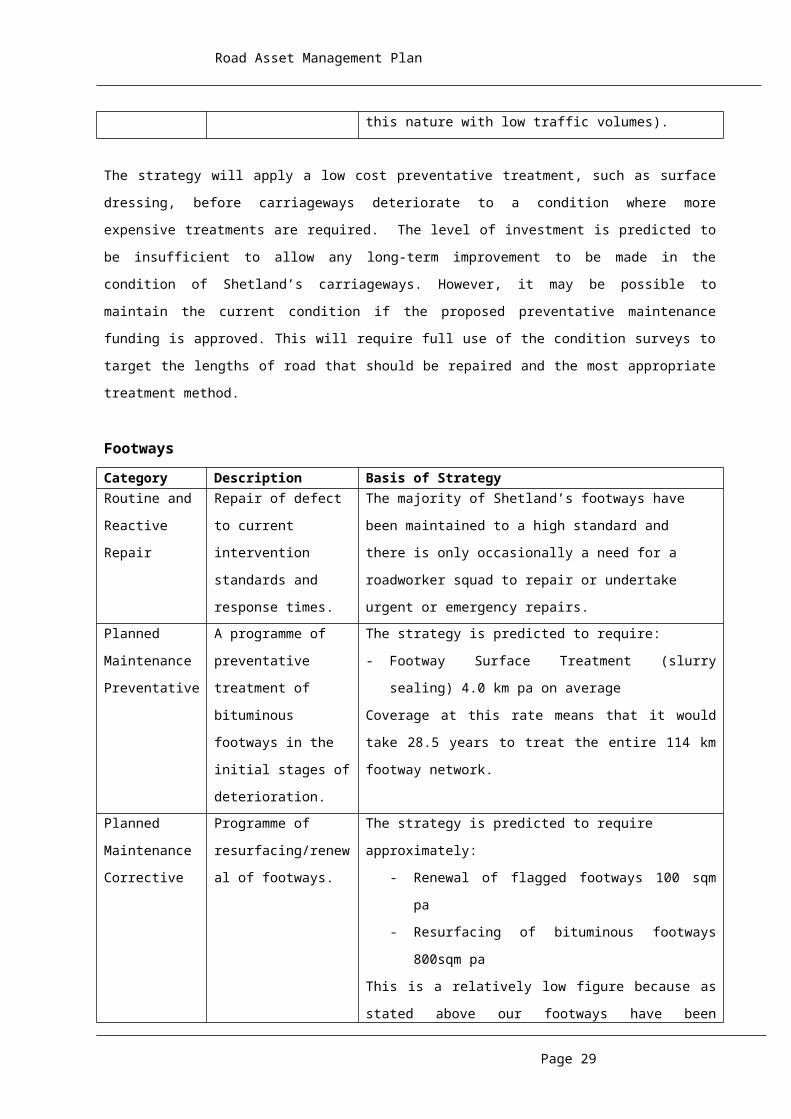
The strategy will apply a low cost preventative treatment, such as surface dressing, before carriageways
deteriorate to a condition where more expensive treatments are required. The level of investment is
predicted to be insufficient to allow any long-term improvement to be made in the condition of
Shetland’s carriageways. However, it may be possible to maintain the current condition if the proposed
preventative maintenance funding is approved. This will require full use of the condition surveys to
target the lengths of road that should be repaired and the most appropriate treatment method.
FootwaysCategory Description Basis of StrategyRoutine and
Reactive Repair
Repair of defect to
current intervention
standards and
response times.
The majority of Shetland’s footways have been maintained
to a high standard and there is only occasionally a need for
a roadworker squad to repair or undertake urgent or
emergency repairs.
Planned
Maintenance
Preventative
A programme of
preventative treatment
of bituminous footways
in the initial stages of
deterioration.
The strategy is predicted to require:
- Footway Surface Treatment (slurry sealing) 4.0 km pa
on average
Coverage at this rate means that it would take 28.5 years
to treat the entire 114 km footway network.
Planned
Maintenance
Corrective
Programme of
resurfacing/renewal of
footways.
The strategy is predicted to require approximately:
- Renewal of flagged footways 100 sqm pa
- Resurfacing of bituminous footways 800sqm pa
This is a relatively low figure because as stated above our
footways have been maintained to a high standard and
slurry sealing will be targeted to prevent further
deterioration.
The strategy will apply a low cost preventative treatment, such as slurry sealing, before the footways
deteriorate to a condition where more expensive treatments are required. The level of investment
should be sufficient to maintain the generally good condition of the footways. There are some footpaths
in adopted housing estates that are deteriorating and may need resurfacing in the near future. However,
they are not significant lengths and the proposed preventative maintenance funding should allow the
worst of these to be resurfaced.
Page 22

Road Asset Management Plan
StructuresCategory Description Basis of Strategy
Routine and
Reactive Repair
Repair of defect to
current intervention
standards and
response times.
The strategy requires the deployment of roadworker
squads on minor repairs to parapets, movement joints,
patching of the bridge deck surfacing and the pointing of
stonework walls or abutments.
Replacement Replacement of
deteriorated bridges or
those assessed as
being weak.
The strategy involves the replacement of “traditional” bridge
types with large diameter twinwall culverts. The older
bridges are generally short span reinforced concrete slabs
with concrete or stonework abutments. It is generally more
cost effective to replace these with culverts than to
strengthen the existing structure. Consideration to be given
to the use of pre-fabricated concrete headwalls.
Refurbishment Refurbishment of
structures that show
signs of deterioration
The strategy involves the annual inspection of Trondra,
Burra and Muckle Roe bridges with any defects being
rectified shortly thereafter. The bearings on both the Burra
and Trondra have recently been replaced by a private
contractor.
Parapet works Strengthening or
replacement of weak
parapets
Existing parapets on older bridges are generally of sub-
standard height so unsuitable for pedestrians. They are
usually constructed from in-situ concrete so are a hazard to
vehicles. They are replaced with galvanised pedestrian
barrier panels on bridge parapets for safety reasons.
Consultants inspect the parapets at Burra, Trondra and
Muckle Roe bridges regularly.
Scour
Protection
Scour protection works
on structures
susceptible to scour
As appropriate from surveys but this type of work is
reducing as large diameter twinwall culverts replace
“traditional” bridge types.
The structures strategy will see the inspection and reassessment of all of our bridges over a two-year
period. The proposed funding for replacements is £80,000 per year that would allow 2 to 3 new culverts
to be installed. The maintenance budget of £40,000 in addition to some minor repairs monies would
perhaps be sufficient to allow the repair or refurbishment of a further large diameter culvert. The Trondra
Bridge was painted last financial year (2016/17) and bolts on its parapet rail are to be replaced. The
Muckle Roe Bridge is to be painted this financial year (2017/18).
Page 23
Road Asset Management Plan
Street Lighting Category Description Basis of Strategy
Routine and
Reactive Repair
Repair of defect to
current intervention
standards and
response times.
The strategy requires the deployment of a single two-man
squad to undertake the routine inspections of the
streetlighting asset. The same squad will repair any defects
that are identified during the inspections.
Planned
Maintenance
Preventative
There are no plans to
undertake any
significant level of
preventative
maintenance.
A number of local authorities have a programme of re-
painting lighting columns to prevent corrosion. We have
shown that this is not cost effective in Shetland. The majority
of our columns are approaching 25 to 30 years old so are
nearing the end of their design life. It is more cost effective to
replace these with new hot dipped galvanised columns.
Planned
Maintenance
Corrective
Programme of
structural renewal
The strategy is predicted to require approximately 140
columns replaced pa.
Replacement at this rate means that it would take 28 years
to renew every streetlight.
Invest to save A savings review was undertaken in 2012/13 and its
recommendations approved by the Environment and
Transport Committee. This has seen part-night lighting
introduced in some areas and the complete removal of
columns where lighting is not considered necessary. Capital
money has been required to remove columns but the long-
term benefits are reduced spending on capital renewals,
energy and inspections.
The aim in the medium term is also to replace our existing
conventional lanterns with their LED equivalent. The cost of
these replacements, and the replacement of a substantial
number of “failed” lighting columns, would be met from the
energy savings accrued by the use of these energy efficient
lanterns. The necessary funds would be borrowed with the
repayments met from the resulting energy savings.
The level of investment may not be sufficient to maintain the streetlighting asset in its current condition.
This is mainly due to the age of the columns. The majority were installed more than 30 years ago in the
developments that were provided during the oil “boom”. Therefore, they are now all approaching the end
of their useful life, at the same time. The proposed investment would allow “failed” columns on main
roads to be replaced. However, individual columns on low speed/low traffic volume roads that have
become unsafe may have to be removed without any prospect of being replaced in the immediate
Page 24

Road Asset Management Plan
future. The reduction in the asset resulting from the streetlighting “savings” policy means that this can
be managed to some extent but it is likely that the removal of specific columns, without their immediate
replacement will remain an issue unless the budget is increased.
Traffic Signals (“Pelican” Controlled Pedestrian Crossings)
Category Description Basis of Strategy
Routine and
Reactive Repair
Repair of defect to
current intervention
standards and
response times.
The strategy requires the deployment of Electrician and
assistant from the Council’s Estate Operations on
emergency repairs and on other non-emergency repairs.
Occasionally assistance may be required from the supplier.
Refurbishment
of signalised
crossings
Refurbishment of
controlled crossings
that have deteriorated
or the equipment has
become
obsolete/unreliable
When possible pedestrian crossings are refurbished with
parts that are taken from crossings that are being replaced.
The type of crossing currently in place is now obsolete so
the supply of parts is limited and difficult to obtain.
Replacement of
signalised
crossings
Replacement of
controlled crossings
that have deteriorated
or the equipment has
become
obsolete/unreliable
The strategy involves the renewal of 2 pedestrian crossings
per year until all 10 are replaced. 5 had been replaced prior
to 2016/17. There is now only one Pelican, on the A970
South Road, that requires upgrading and this will be done
when the preferred route for pedestrians to the new AHS is
determined.
The ten Pelican crossings in Lerwick were in a poor condition due to their age. They were first
“generation” LED technology so it is difficult to source spare parts. This meant that when the lights were
faulty they often remained out of service for some time. Three of these have now been replaced with
Zebra crossings, with LED beacons, which should be more reliable and easier to maintain. Six of the
remaining seven have also been upgraded to the latest version so the expectation is that maintenance
requirements will be greatly reduced. A “spare” Pelican crossing signal head is to be purchased and
installed at the Gremista depot. This will be a source of spare parts should any of the signal heads on
the network fail due to a faulty part. This will significantly reduce the “downtime” of the signal head as
there will no longer be a delay while waiting for the part to be delivered from the mainland.
Page 25

Road Asset Management Plan
7. Risks to the Plan
Risk Management
Risk management is a systematic approach to identifying and dealing with the risks that threaten our
plans and projects and impact upon the continuation of service delivery.
The Shetland Islands Council has developed a risk management framework to define in a controlled
way how risks and opportunities will be handled within the Council. The framework provides information
on roles, responsibilities, processes and procedures. It sets the context in which risks are managed in
terms of how they will be identified, assessed, managed and reviewed.
The Council has a four-step framework for identifying, assessing, managing and controlling and
reviewing risk (See Figure 8.1). This is a continuous process and can easily be integrated with
performance management. The Council has agreed criteria by which to judge the likelihood and impact
of risks, effectiveness of control measures and required levels of management of residual risks.
Figure 8.1: Four-step risk management framework
Risk Identification
Risk to the Council’s business can take a variety of forms; for example, financial risk, risks to project
and service delivery, its reputation, partnerships, employees and Councillors and risks from missed
opportunities. Those risks could affect the council’s performance, its assets, stakeholders, customers or
members of the public. They can also affect the Council’s viability.
Page 26

Road Asset Management Plan
Risk Evaluation
The next step is to assess those risks in terms of the likelihood that they will occur and the impact if they
do. The criteria for the levels of likelihood and impact for risks are shown in tables 8.1 and 8.2 below.
Table 8.1: Description and definitions of LIKELIHOOD of the RISK occurring
Descriptor Description
Almost certain
I would not be at all surprised if this happened within the next few months
Likely I think this could occur sometime in the coming year or so
Possible I think this could maybe occur at some point, but not necessarily in the immediate future
Unlikely I would be mildly surprised if this occurred, but cannot entirely rule out the possibility
Rare I would be very surprised to see this happen, but cannot entirely rule out the possibility
Table 8.2: Description and definitions of IMPACT of the RISK should it occur
HAZARD Personal
SafetyProperty loss
or damage
Failure to provide
Statutory Service or breach of
legal requirement
s
Financial Loss or
Increased cost of
Working
Disruption in Service (Days)
Personal Privacy Infringement Environmental Community Embarrassm
entIMPACT
(This may vary with the
criticality of the service)
Insignificant
Minor injury or discomfort to an
individual
Negligible property damage
Litigation, claim or fine <£2k <£10k None Isolated personal detail
revealedMinor localised - damage to plants
Inconvenience to an individual or
small group
Contained within Service
Unit
Minor Minor injury or discomfort to
several people
Minor damage to one property
Litigation, claim or fine £2k to
£50k£10k to £100k 1 Isolated personal detail
comprised Death of invertebrates
Impact on an individual or small group
Contained within Service
Significant
Major injury to an individual
Significant damage to small building or minor damage to several properties from one source
Litigation, claim or fine £50k to
£250k£100k to £500k
2-3
Several persons details revealed Death of fish Impact on a local
community
Local public or press
interested
Major Major injury to several people or death of an
individual
Major damage to critical building or serious damage to several properties from one source
Litigation, claim or fine £250k to £1m or custodial
sentence imposed
£500k to £1m
4-14
Several persons details comprised Death of animals Impact on several
communities
National public or press interest
Catastrophic
Death of several people
Total loss of critical building
Multiple civil or criminal actions. Litigation, claim
or fine above £1m
>£1m >14 All personal details revealed/comprised
Permanent damage to site of special interest
Impact on the whole of Shetland
Officer(s) and/or
members forced to
resign
Page 27

Road Asset Management Plan
Multiplying the likelihood score by the impact score gives the uncontrolled risk score. The next stage
identifies controls (strategy, policies, practices that exist currently) and their efficacy (ineffective, partially
effective, effective, and very effective).
The risk is then re-assessed for likelihood and impact. The new score is the current risk score that
exists after controls have been applied and so the real level of risk. That information is then recorded in
the risk register. The risks are then prioritised to enable decisions to be made about the significance of
those risks to the Council, and how they will be managed.
Table 8.3: Residual Risk Rating Matrix
F R E Q U E N C Y
S
E
V
ERI
T
Y
Risk Control
When the risks and opportunities have been identified and assessed for likelihood and impact, there
needs to be agreement on who will “own” the risk and how it will be managed, controlled or exploited.
When the existing controls and action plans have been identified, the risks are re-assessed for
likelihood and impact. This gives a forecasted controlled score of the Risk Profile as a result of the
mitigation action plans. That information is then recorded in the risk register.
Risk Register
A risk register has been developed for the Roads Service (See Table 8.4 below). These are risks that
could prevent achievement of the standards specified in this plan (section 6). Further detail on the major
risks identified within the Road Asset Risk Register is given in Table 8.5 below.
Page 28
Rare Unlikely Possible Likely Almost Certain
Insignificant 1 2 3 4 5
Minor 2 4 6 8 10Significant 3 6 9 12 15
Major 4 8 12 16 20Catastrophi
c 5 10 15 20 25
Road Asset Management Plan
Table 8.4: Roads Service Risk Register
SIC Transportation Services Roads & Fleet Risk Register
No. Risk Gross Risk Profile
Uncontrolled Rating
Residual Risk Profile
Controlled Rating
FR0128 Staff number/skills shortage High 12 High 12
FR0126Plant/Equipment - breakdown/failure disruption Medium 6 Low 3
FR0059Contaminated land, air, water, structure Medium 9 Low 3
FR0053 Budget control failure Medium 9 Low 3FR0054 Bad debts Medium 9 Low 3FR0130 Fire, lightning, aircraft, explosion Medium 8 Low 3
FR0084Storm, Flood, other weather related, burst pipes etc Medium 8 Medium 8
FR0131 After Hours/ Lone working Medium 6 Low 4FR0135 Staff number/skills shortage High 12 Low 4
FR0113 Late delivery Medium 6 Low 4
FR0125
Records/Research data/systems/security/confidentiality/ back-up.
Medium 6 Low 3
FR0122 Failure of Key supplier Medium 6 Low 3
FR0104Public/products liabilities to third parties Medium 6 Low 3
FR0096Professional Errors and Omissions Medium 6 Low 2
FR0061Breach of Patent, copyright, trademark, Design Rights etc. Medium 6 Low 2
FR0069 Communications poor Medium 6 Low 2
FR0112 Noise Low 4 Low 2
FR0119Procurement policy - failure to observe Low 4 Low 2
FR0016 Labour relations/disgruntled staff Low 4 Low 2FR0015 Other bodies - relations with Low 4 Low 2FR0093 Denial of Access Low 4 Low 2FR0056 Industrial action Low 4 Low 2
Page 29

Road Asset Management Plan
Table 8.5: Road Asset Major Risks
Road Asset Major Risks
Risk
Likelihood
Score
Impact
Score
Uncontrolled Risk Score Current Controls In Place
Revised Likelihood Score
Revised Impact Score
Controlled Risk Score
StructuresInability to complete maintenance work due to lack of funding may lead to substantial failure of the structure causing injury and increased costs due to emergency works, or diversions due to bridge closure 3 3 12
Regular bridge inspections and allocating more of the
budget to preventative/early repairs
prior to the onset of structural damage. 1 3 3
Street Lighting
Lack of funding may lead to reduction in the condition of the asset, may be unable to replace columns that are taken up for safety reasons leaving dark areas
4 4 16
Scheme to upgrade lanterns to LEDs and replace
columns will be underway before the rate of column failures reaches a point
where safety critical repairs cannot be done. 2 4 8
Carriageways
Lack of funding for maintenance works may lead to a backlog of required works, the continued deterioration of the network and the need for higher cost remedial works in the future
4 4 16
Careful use of SCANNER survey data to target
surface dressing may delay the deterioration in the short to mid-term but
structural defects such as rutting will eventually
require more expensive repairs. 3 4 12
FootwaysLack of funding for maintenance works may lead to a backlog of required works, the continued deterioration of the network and the need for higher cost remedial works
3 3 9 2 3 6
Page 30

Road Asset Management Plan
Road Asset Major Risks
Risk
Likelihood
Score
Impact
Score
Uncontrolled Risk Score Current Controls In Place
Revised Likelihood Score
Revised Impact Score
Controlled Risk Score
in the futureDrainage
Standing water causing skid accidents due to reduced carriageway budgets 3 3 9 As per carriageways. 2 3 6
Page 31

Road Asset Management Plan
Further more general risks that could have a significant impact on the delivery of the service are
considered in Table 8.6 below.
Table 8.6: General Risks – Impact on Service Delivery
Plan Assumption Risk Action If Risk Occurs
The plan is based upon
winters with an average
number of frost days.
Adverse weather will create
higher levels of defects and
deterioration than have been
considered.
Budgets and predictions will be
revised and this plan updated if
abnormally harsh winters occur.
Available budgets have
been assumed as shown in
section 7.
Pressures on budgets mean
that the Council may reduce the
funding available for Roads.
Target service standards will be
revised to affordable levels.
Construction inflation will
remain at level similar to the
last 5 years.
Construction inflation will
increase the cost of works
(particularly oil costs as they
affect the cost of road surfacing
materials)
Target service standards will be
revised to affordable levels.
Levels of defect and
deterioration are based on
current data which is limited
for some assets (e.g.
footways)
Assets deteriorate more rapidly
than predicted and the
investment required to meet
targets is insufficient.
Split between planned and reactive
maintenance budgets will be revised.
Resources are available to
deliver the improvement
actions
Pressures on resources mean
that staff are not allocated to
service improvement tasks,
predicted benefits may not be
fully achieved
Target dates will be revised and
reported.
The risks have been evaluated in accordance with Council policy. The risks are reviewed regularly
throughout the year.
Page 33

Road Asset Management Plan
References
1) Shetland Transport Strategy
2) Asset Management Policy
3) Network Management Plan
4) Road Asset Management Manual
5) Annual Status and Options Report
6) Road Asset Data Management Plan
7) Service Improvement Action Plan
Version 1.0February 2013
1