DOCUMENT SWORE - ERIC - Education Resources … · 2014-02-03 · origin. of view or opinions...
251
ED 143 826 AUTHOR TITLE INS4ITUTION SPONS AGENCY nil DATE NOTE EDRS PRICE DESCRIPTORS ,IDENTIFIERS ABSTRACT DOCUMENT SWORE 95 CI 012 394 Copeland, Harlan G.. And Others A Study of the Feasibility of Two Data-Collection Techniques for Detersinin9 Present Activities and Perceived Program Needs in Continuing Education and Extension in Degree-Granting Post-Secondary Institutions in New Rork State. Syracuse Univ., N.Y. New York State Education Dept., Albany.; Office of Education (MM. Washington, D.C. Dec 74 1,291p.; Bent' copy available 8F-$0.33 HC-115.39 Plus Postage. *Adult Education; Colleges; *Data Collection; Educational Needs; Extens,on Education; Feasibility 'Studes; Hanagesent inforeation Systems; *Needs Policy Foraationi *Post Secondary Education; Progiaa Planning; *Research Methodology; Sampling; State Departments of Education; *State Sutveys; Statewide Planning; Universities Delphi Technique . I. . Objectives of a threephnse New Fork .Stativstady were (1) to test the feasibility of an institutional sampling surver for providing descriptive data about the nature and scope of continuing education in postsecondary` degree- granting institt'qns, (2) to test the applicability of the Focus Delphi research sethod for assessing the pricrity educational needs and goals for degree-granting postsecondary institutions, aul- 43) to:evapiate-ths feasibility' of integrating the information-gathering system for postsecondary education into ti4 State Education Departmentilanagesent information system. In the institutional survey descriptive information was sought concerning the kinds of continuing education opportunities available, the audiences served, the nuaber.of participants, and the subject matter areas studies. The methodology consisted of , constricting and_adeinisteriA% a questionnaire to a sample of university and college personnel, analyzing the WU, and_ reporting. the findings. The Delphi study sought-the responses of policy advisors, continuing education administrators, faculty .members, and clients to alternative &dal and continuing education goals and strategies..Theophase three! task involved'becoming familiar with the management information system of the state education department end ____evainating_its compatibility with the data collection erocedurea used in the two preceding phases'. (Results of each phase are reported separately and a final chapter synthesizes them into ten selected polity issues in continuing education, e.g., expansion,of specific types of course offerings and future research needs.) (M) Documents acquired by ERIC include many informal unpublished materials not available from other sources. ERIC makes every ,2ffort to obtain the best copy available. Nevertheless, items of marginal reprqducibility are often encountered and this affects the quality of the microfiche and hardcopy reproductions ERIC makes available vI the ERIC Document Reproduction Service (EDRS). EDRS is not responsible for the quality of the original document. Reproductions supplied by EDRS are the best that can be made from the original.
Transcript of DOCUMENT SWORE - ERIC - Education Resources … · 2014-02-03 · origin. of view or opinions...

ED 143 826
AUTHORTITLE
INS4ITUTIONSPONS AGENCY
nil DATENOTE
EDRS PRICEDESCRIPTORS
,IDENTIFIERS
ABSTRACT
DOCUMENT SWORE
95 CI 012 394
Copeland, Harlan G.. And OthersA Study of the Feasibility of Two Data-CollectionTechniques for Detersinin9 Present Activities andPerceived Program Needs in Continuing Education andExtension in Degree-Granting Post-SecondaryInstitutions in New Rork State.Syracuse Univ., N.Y.New York State Education Dept., Albany.; Office ofEducation (MM. Washington, D.C.Dec 741,291p.; Bent' copy available
8F-$0.33 HC-115.39 Plus Postage.*Adult Education; Colleges; *Data Collection;Educational Needs; Extens,on Education; Feasibility'Studes; Hanagesent inforeation Systems; *Needs
Policy Foraationi *Post SecondaryEducation; Progiaa Planning; *Research Methodology;Sampling; State Departments of Education; *StateSutveys; Statewide Planning; UniversitiesDelphi Technique .
I. .
Objectives of a threephnse New Fork .Stativstady were(1) to test the feasibility of an institutional sampling surver forproviding descriptive data about the nature and scope of continuingeducation in postsecondary` degree- granting institt'qns, (2) to testthe applicability of the Focus Delphi research sethod for assessingthe pricrity educational needs and goals for degree-grantingpostsecondary institutions, aul- 43) to:evapiate-ths feasibility' ofintegrating the information-gathering system for postsecondaryeducation into ti4 State Education Departmentilanagesent informationsystem. In the institutional survey descriptive information wassought concerning the kinds of continuing education opportunitiesavailable, the audiences served, the nuaber.of participants, and thesubject matter areas studies. The methodology consisted of ,constricting and_adeinisteriA% a questionnaire to a sample ofuniversity and college personnel, analyzing the WU, and_ reporting.the findings. The Delphi study sought-the responses of policyadvisors, continuing education administrators, faculty .members, andclients to alternative &dal and continuing education goals andstrategies..Theophase three! task involved'becoming familiar with themanagement information system of the state education department end
____evainating_its compatibility with the data collection erocedurea usedin the two preceding phases'. (Results of each phase are reportedseparately and a final chapter synthesizes them into ten selectedpolity issues in continuing education, e.g., expansion,of specifictypes of course offerings and future research needs.) (M)
Documents acquired by ERIC include many informal unpublished materials not available from other sources. ERIC makes every,2ffort to obtain the best copy available. Nevertheless, items of marginal reprqducibility are often encountered and this affects thequality of the microfiche and hardcopy reproductions ERIC makes available vI the ERIC Document Reproduction Service (EDRS).EDRS is not responsible for the quality of the original document. Reproductions supplied by EDRS are the best that can be made fromthe original.

A STUDY OF THE FEASIBILITY OF TWO
DATA- COLLECTION TECHNIQUES FOR DETERMINING
PRESENT ACTIVITIES AND'PERdEIVED PROGRAM
NEEDS IN CONTINUING EDUCATION ANT) EXTENSION
IN DEGREE -GRANTING -=POST'- SECONDARY
INSTITUTIONS tN NEW YORK STATE
by
U S OEPAITMENTDP HEALTH,EDUCATION I WELFARENATIONAL INSTITUTE OF
EDUCATION
THIS DOCUMENT HAS BEEN REPRO-DUCED EXACTLY AS RECEIVED PROMTHE PERSON OR ORGANIZATION
ORIGIN.ATiNG IT POINTS OF VIEW OR OPINIONSSTATED DO NOT NECESSARILY REPRE.SENT OFFICIAL NATIONAL
INSTITUTE OCEDUCATION POSITION OR POLICY
Harlan G. Copeland, Michael Folk and Stuart A. Sandow
December, 1974
Support for this project was provided by a grant of FederalfurKs under Program IMPACT of the Higher Education Act of1965, Title I: Community Service and Continuing Educationadmillistered by the, New York State Education Department.

0
ACKNO4LEDGMENT
02,, study 01 this time, Lht.IAA2 .it: innumerable pLople whgLave
helped and -rho deserve sincere i-han;,s for Cleir efforts. f'irst aret.huse-who
0
supplied the datum for wityout their cooperation, this study would Not have been
possible_ the 1iai,orLpeop16 at each institution provided names for the
sample ail] also helped with any problems that arose. The Advisory Committe
gave advice that clarified, some neeessary_Areas, while Robert Williams and,
particulatry Frank ..obson, of the State Education Department, spent -many hours
bdth meetifoi; with the project team and reviewing the rough draft of the
documeet. Finally, I wish to Wank the other members of the project team.
their support. A special debt of gratitude is 'owed to Fumiko Do aani and,
Mnrilyn BecLstrand who_ put the mar.uscript in final typewritten form.
r
.c.
II
,..

TABLE OF CONTENTS
'Chapter Page
I. INTRODUCTION 1
- Background of the Study 1
Origin of the Study 5,--
i Purposes of the Project ,.
.
6
' 1 MethodologyTask I -- The Institutional Survey
( 89Task II -- The Focus Delphi/Survey of Needs, Coals, .
. and Priorities I 10 _
Task III -- Evaluation of he Compatibility of the Data--C011ettion_System with` -t e 40riagement-Trffoftation'System,t,. . 11
g': Supplemental Tasks 11Organization -of the Report
r12
1
/I. A SURVEY O' CONTINUING EDU4ATION ALTIVITIES IN
..
DEGREE-GRANTING POST-SECONDARY INSTITUTIONS 14
.
Need for the Study/Purpose of the Study.
Design of the Study
14
18
'21
4Designation aid Selec!Ilon of. le Sample- . . . . ....... 21
Selection of.a, Data-Collectio7 Method 28
Instrumentation . - .._ ..... . 5 - ........ 29 _
rD4a Collection ' 35-
Response Rate - , _______38
Techniques Utilized for Examiq the Data 39
Extrapolation tb the Total POpulation 40Selected Example
!41
Desctirtive Statis ics 57,--.1?
Selected Example of Findings using Percentages 57
Cross Tabulatio Analysis f !,9,
. Use of Arternativ Definitions of Post-Secondary
i
Continuing Educiatiup 73i
Use of CatOgor9 I nstruction as an Example . . . .,.i. . . . 76
Use of the Data 'in/Pla ning Post-Secondary Continuing Edu6tion. 94
Query One: Who Is Presently Not Being Served ThroughPost-Secondary Continuing Education?
.96
Query Two: To What Extent Is Post-Secondary ContinuingEducation rime and Space-Free? 99
Query Three; To What Extent Should Post-Secondary: , 4 Institutions Engage in Continuing Education?, . . . . . . , 100
Conclusions 101
Is There a Need For More Data About Continuing Education? . . 102
Was the Data-CollectionsStrategy,Appropriate? 104
s=
a

,-
Chapter
Shou;t1 a Different Sampling Procedure Be Usedl
Pa
l&
How Can the Da.p. Be Analyzed? . . . . ... . 101
What 11,:e Oar,-., le Made of thu Finding! 1O
What Was Discovered About Finant_ing Continuing Edutation? . 11
*A Final Note 11-
III.- A SURVEY OF CONTINIIING EDUCATION GOALS FOR DEGREE- GRANTINGPOST-SECONDARY INSTITUTIONS IN NEW YORK STATE : . . . . . . 11,
Introduction- - . . . . . . . . . . . . . . . . . . . . . . I 1:
The Fouls Delpht-Proc,ss .... ...... _ . . ...... 1 -11
The InquirY() 11:
Notes on the Process 121
Inc SampleCoals 'Examined is .the Study
ExplorfilA the Data Displayed- . . . . i-14i
A_ DemonstratiOn of Polley Analysis With thq Focus Delphifists of Goals With .CorrespondiJig _Total Number of Res
-T -Who- Inc hided the Goal: -Unr anked: and -Rat-aced_ . 5-A
Numbe_ r-ef_ Times -Goal. Seen_ as Among -Tap-Teri:in _Pr iOrity -_
by Group_and A,ggregate.-. . -15
Ranking AeFording t o- Ntimber_ of-Miles- St erl, as Aging Top Ten=
in Priority, by _Group_ and Aggregate . .. . . __- 160
Percent .of,Gratips-Seeirpg Time Frame -as: Short-Term, -Me4um-
Lonii, -Term, Respectively, for Each Goal, Group !_
and --Aggievatt. e- . ..... S- -0- .?
`Top Ten Short-Term, Medium-Term, and Long-Term GoalsBaited -on Aggregate. Responses . ; .
Percent Apl -Crotips=-Seeing Time Frame=as= Short- T_erm,-
Term, dna'Long.7Term, AIL-Goals Aggregated
Goals That 141e-re Among the Top Fifteen in PriorityCompared tiri. Time-Frame -Responses 1. . .
Perceptions of Power:__ Group Seen as Most Powerful,:Percentage of Reeponding Group W1 .Saw- InAtopted
Group with Power, and ;Number_ Who R'espondedgite That Goal
The Assignment of PoWMr, _as Seen by Groups 1, 2, 3,OW4,
nnd Aggregate . . .1 .. . . . . _ . . . .
_Number of Times Each Group Is Seen as Having the Power,
_ as Seen by Each-of the Groups and Aggregate . . 17
ditifr
. 17.
IVt AN EVALUATION OF ALTERNATIVE DATA-COLLECTION: SYSTEMSFOR Pth-SECONDARY CONTINONG 'EDUCATICN . . . 17;
Existing Capabilities: f ....... . , . . .... 17;Assessing the Instructional Activity Survey and Focus"Delphi
as Alternative Bata- Collection Systei . ... . .
Feasibility of Integrating the Data-Collection Systems . . -,-LB
Approaches for Aleernative Data-Collection . . .... . . 18,
SELECTED POLICY ISSIla IN. c,CNT INC: EDUCATION .

*nn.a.,;.An.,..nen.4.nonnn
APPENDIXES
A. INDIVIDUALS S IS TING WITH THE PROJECT 200
B. PROC FOR SELECTION- OF THE FACULTY SAMPLE 202
C. = INSTRUMENTATION 213
D. . KATERIALS USED IN F °LLCM UP WITH NON RESPONDENTS 226-
E. NUMBER. OF RESPONSES TO THE INSTRUCTIONAL ACTIVITY SURVEY 230
F. PROCEDURES FOR ANALYZING THE DATA 233
G. DE140GRAPHIC CHARACTERISTICS OF PssITICIPANTS IN CATEGORY IIANT' CATEGORY III INSTRUCTIONAL ACTIVITIES 237
SELECTED B I BLI OGRA .... ..... ... 238
V
0
LIST OF TABLES
N
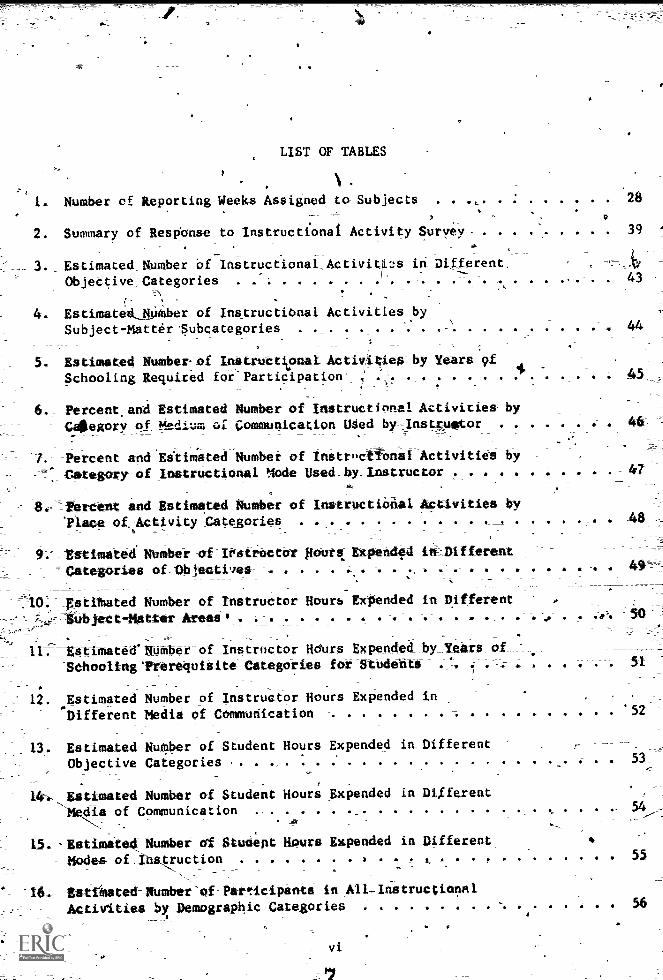
1. Number cf Reporting Weeks Assigned to Subjects , 28
. _
2. Summary of Response to Instructional. Activity Survey-- _-
- 3._ Estimated Number Of Instructional,Activitias in Different.
Objettive_Categories .. ...
39
4. Estimated_NUMber of Instructional Activities by
Subject - Matter Subcategories
Estimated Number- of Instructienal Activities- by Years 9f
Schooling Required for'Participation
6., Percent, and Estimated Number of Instructipnal Activities- byCategory of !tedium of Communication USed-by-Instruator
-Percent and_Estimated_Number of InstructiOnal Activities by
_Category of Instructional 'lode Used_by.Instructor 4
cent and Estimated Number of Instructional Activi
llswe of. Activity Categories_
ted Numbetiof IOstructor lours Expend0 ini_i_Different
les of_Oblectives- . . . , . . .. ....
ted Number of_Instructor Hours Expended in Different
ub ect-Matter kreail
mate( Number of Instructor_Hdurs Expended by_YearS__01_thooling'Prerequisite Categories for Students -. 5i
-
12. Estimated Number of Instructo Hours Expended in
Different Media of Communication
Estimated Number of Student Hours Expended in Different
Objective Categories
l4-. Estimated Number of Student Hours ExPended in Different
meo,-!A of Communication 54
15. -Estimated Number of Stuaept Hours Expended in Different
Modes of instruction . . t .
16, EatiMated-Number of Partacipants in All-Distructional
Activities by Demographic Categories 56
55
vi

Table
17. Demographic Characteristics of All Participants in AllPost-Secondary Instructional Activities 60
18. Percent of All Instructional Activities Classifiedby Subject-Matter Area and Objective Categories 62
19. Estimated Number of Instructional. Activities byObjective and Subject-Matter Categories 63
20. Percent of All Instructor Hours by Objective andSubject-Matter Categories
21. Percent of Instructional Activities Classified byObjective and Method 65
-22. Estimated Number of'Instructional Activities byObjective and Method of Communication Categories 66
23. Perceot of All Instructor Hours by Objective andMedium of Communication Categories 67
24. Percent of All Instructional Activity Classified byObjective and Place of Activity Categories 68
-
25. Estimated Number of Instructional Activities by Objectiveand Place of Activity Categories 69.
26. Percent of Instructional Act vity Classified by Objective
and Mode of Instruction Categories 70
27. Estimated Number of Instructional Activities bY---Objective and Instructional Mode 71
28. Percent of All Student Hours by Objective_ andInstructional, Mode Categories .1 72
29. Estimated Number of Student Hours for Al', InstructionalActivity by Objective and Instructional Mode Categories 72
30. Percent of All Instructional ActivitiesComprised ofCategory I Activity by.Subject-Matter and Objective Categories . 78-
Percent of Category I Initructional Activities Classified byObjective -and Medium of Communication 79
32. Percent of All Instructiono Activities Comprised of Category I
Activity by Objective and of Instruction Categories 81'
Percent of Category 1 Instructional Activities Classified by.Objective and Mode of Instruction 81
34. Percent of Category I Instructional Activities Classified by
Objective and Place of Actility Categories 82
vii

Table
35. Percent of All Instructional Activities Comprised of Category IActivity by Oojective and Place of Activity Categories 83
3E. Estimated Number of Category I Instructional Activities inPopulation by Objective and Subject-Matter Categories . . . . 84
,,37. Percent of All Jnstructor Hours Included intafegoryI byObjective and Subject-Matter Categories . 86
,38. PErcent of All Distructor Hours Included in CategOry Iby Objective and Mode of Inktrection Categories 88-
39. Percent of Category I In-try' -r,..._Hour6 by-40jectivea4 \
d. Instructional Mode Categories 88
40. Percent of Category I Instructor Hours b, Objective 'and-Medium of Communication Categories 89
41. Estimated Number of*Instructor Hours in Category I Instructional. Activities by Objective and Instructional Mode Categories 89
42. ,Pertent of All StuCHours Ifticuded in.Category I by
Objective and Instiuctional Mode Categories 91
43. Percent of Category I Student Hours by Objective and--,/nstructional Mode Categories 91 t
44. Percent of Category I Student Hours by Objective andMedium of Communication Categories , .
45. Estimated.Number of Student Hours in Category I Instructional'Activities by Objective and Mods of InstruAtion Categories .
92
46. Demographic Characteristics Of Participants:.-in Category IInstructional Activities .... . . ..... ....... 93
,
47. Estimated Number of Participants in Category IInstructional Activities
, ti
94
48. Comparison of Racial CompositiOn of Participants in-thstructioniI Activities in Sample with'New York State Population . . 97
A
49. Comparison of the Percentages of Persons by Age Categories for14w York State and for Participants in the Instructional .
Activities in Sample 98
50. Levels of Participation of Respondents . 4 147
51. Response Rate Differential by Group for All Rounds 148
52. Typical Reasons Given for Not Participating for All Rounds . 150
i
viii9
Table
. _
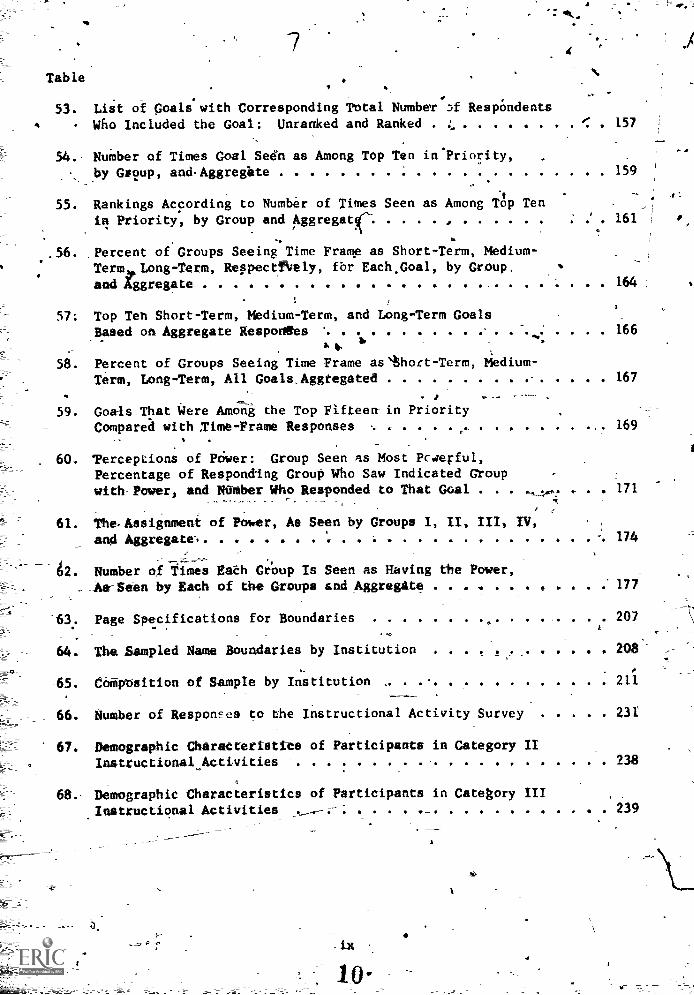
53. List of Goals with Corresponding Total Number :If RespOndents
Who Included the Goal: Unranked and Ranked
o.,... .
157
54.- NuMber of Times Goal Sedn as Among Top Ten in'Priority,
by Group, andAggreghte-
55. Rankings According to Number of Times Seen as Among Top Tenin Priority, by Group and Aggregate 161
.56. .Percent of Groups Seeing Time Frame as Short-Term, Medium-TermALong-Term, Reppectftely, for Each.Goal, by Group.
and Aggregate 164
57; Top Ten Short-Term, Medium - Term, and Long-Term GoalsBased on Aggregate Responses w 166
54L. Percent of Groups Seeing Time Frame asthort-Term, Medium-Term, Long-Term, All Goals,Aggregated 167
59. Goals That Were Among the Top Fifteen in PriorityCompared with Time - Frame Responses . . . .
60. 'Perceptions of Power: Group Seen as Most Pcaerful,Percentage of Responding Group Who Saw Indicated Groupwith- Power, and NUmber Who Responded to That Goal . . . . . 171
61. The.Assignment of Power, As Seen by Groups I, II, III, IV,
and Aggregate. 174
169
.
,
Number of Times Eath Group Is Seen as Having the Power,
. -AA-Seen by Each of the Groups and Aggregate . . . . . . . . . . .` 177
63. Page Specifications for Boundaries ........ .. . . . . . . 2071
.
64. The Sampled Name Boundaries by Institution 208
65. CoMposition of Sample by Institution 211
66. Number of Responses to the Instructional Activity Survey 231
67. Demographic Characteristics of Participants in Category II
Instructional Activities 238
68.- Demographic Characteristics of Participants in Category III
Instructional Activities
ix
ti
239
ta
V
t.
LIST- OF ILLUSTRATIOAke
Figure t
.1. Focus Delphi Round I Materials 116
2. FocuS Delp!..i. Round II Materiali . . t 12?
FO us Delphi -Round III Materials 132
7 .
r^

CHAPTER
/
rorRoDucnat--.
Background of the Study
n the divisioe cif Tedera diet- state functions in the United States
astitistion, -the- responsibility for providing education was one of those--
f digtiona to be assumed by the states. In New-York State, theiSoird- of kegen
the Unyersity of the State- of _New-York is charms with- the responitbil
for the development of the total educational syspesi in the State. _As part-.
this role, the Regents are in a unique
articulated of *education for all ro
CU to effect ati- integrated,
in 1964, the New-York State Legislature di
e ry fourth year-_a-- compr plan-- for -the ord
t the State.
et the gen to
eVelopment of
education in the State,
se.zondary.educ.: tient*
of th
wed because post-sec
is
nriiversit
cell
In order to
'plan on a cimprehenalvd
ally, much of the legislation which 1n mounted to 'solve---
anal problems has been framed in a crisis orientation._

It is imperative thairNew York State continue its planning in a
coMprebensivepmpy, taking cognizance of learning as a lifelong rocess which
is compertmeAl =1,p--new-a4roac11,,ma,nem,effoft=-i needed that focusei on
a e cation that facilitates lifelong learning. Stich a system
should delineate the Apure and relationships of the parts to the.whole in
__order that all segments of the system develop in concert with the others.
In establishing any system, the quality Of planning outputs'willvary
in direct proportion to the quality of informational inputs and the ality_ of
nakiment of those, inputs:. In order to answer the qiestion of where_i\giren
Tarystewought-to be at some time 'in the future, it is useful to find-but whatro .
=on -at present.- Such a strategy Of data-gathering, andgoal-definit op.
ia the nektricable nature of the two procesies. In other words,, _
-as-guides-to future action- -are based on an appraisal of where a
Program is. The- data are also useful fort formulating _alternative gbals and
strategies forachieving goals.
Higher and professicnsl education in the State can relate to this
dotal system of education by: (1) formulating objectives for ell 'post-
odary education--including continuing education- -and relati.a these
objectives -to those_of other components of the whole educational system:
- (2),developitg a syste6 for collecting information,-' 1}n a continuing bpsisi-on
11 aspects of post- secondary educatiOn;..ead() expanding and developing-
_comprehensive,leaster,Plarp for all post secondary iduCation in New York.State.
ommitypt to learning as-a lifelong process, and the growing,
11._
e of the.need fora system of education that facilitates -lifelong.
. .,1.
all citizens of the State presopted a new challenge to post- .'
.
education ipstitutions. Based on national studies, it can he
people ire involved IN:inv.-time educational'
=
activities for the purpose of continuing their education than are involved
in the undergraduate and graduate programs in colleges and universities.
More than one Pf five adults (approximately 25 million persons) was active
in some form of organized adult education, or independent study during the
twelve-month period from June, 1961 to June, 1962. An additional 2 percent
of American adults (2.5 million persons) were full-time students.1, An adult
was defined as all persons 21 years of age and older, and all persons under
21 who were married and/or heads of households.
These learning activities took many forms: courses, conferences,
seminars, lecture series, workshops, independent study, correspondence,
personal counseling, and mass media programs. Only P small percentage (1 to6
23 percent) of the iearning activities involved academic credit, whereas a
very large percentage (56 to 76 percent) appears to, be planned and directed
by the learner himself.2
Yet the coordination of post-secondary learning activities for adults
is non-existent and the needs of many go unattended. We can expect in the
near future that the many adults engaged in continuing learning activity will
rightfully expect the publicly-supported post-secondary educational institu-4
tions to meet their needs.
What kind of response to these requests.for adult learning oppor-
tunities can be expected_from the public post-secondary educational system?
Traditionally, public education has responded in two ways: (1) by prOviding.
0
programs for adults that can be self-financed by adult students, and (2) by
1John W. C. Johnstone and Ramon J. Rivera, Volunteers for Learning
(Chicago: )41dine :Publishing Company, 1965), p. I.
Allen M. Tough, The Adult's LearninEmitsts (Toronto, Ontario:he Ontario Institute for Studies in Education, 1971); PaWcia Mary Coolican,
"The Learning Style of Mothers of Young Children" (Ph.D. dissertation,
Syracuse Univerdity, 1913), p. 128.
14

rr
4
permitting adults to enroll in programs (at post-secondary institutions only)
that were designed for full-time, in-restdenes youth whose primary responsi-
bility was to attend college. T.b.rs 'approach has resulted in a program with
the following characteristics. Firit, education for adults is viewed as a
marketable commodity rather than as a public right. Second, the audience
for adult education is restricted to those who have the ability to pay.
Third, the subject matter for adult education is restricted to "that which
will sell." Fourth, the adult student interested in academic credit programs
has traditionally had to conform to inconvenient time and space restrictions.
Fifth, education for adults is considered outside the primary mission of the
educational institutions and thus expendable. Sixth, entrepreneurship is
rewarded, competition with other sub-systems is fostered, and cooperation
amorT sub-systems is discouraged.
It is becoming increasingly clear that the public education system in
New York State must provide leadetohip for--rather than merely respond to --
the adult's interests in learning. Within post - secondary continuing'educatiun,
the foll-mrc.._, tasks nee-dt b-Fe-a-ccbilpil;ied ir the figents and the State
Education Department choose to provide leadership at this level in New York
State as part of their total system responsibilities:
1. A long-range'master plan for post - secondary continuing education must
be developed and tied in closely to the developing extant plan for all
post-secondary education.
2 Information about the nature of ongoing continuing education activities
and the perceived continuing education needs and desires in degree-
granting post-secondary institutions is requisite for determining the
goals and objectives of a master plan for all post-secondary education.
This information,and the process by which lit is generated need to be
integrated within the management information system presently being
.15
developed ,by the Department.
In Vrder to develop acomprehenhivc, long- range-- master plan-for all
post-secondary continuing education, a study of 1:h post-secondary'
level continuin,Y, education activities in non-degree granting sites in
5
New York State is needed, This would provide information about present
contirming education activities and-!?
anticipated needs in continuing
education in institutions such as business, industry, voluntary
agencies, and labor organizations.
It is significant, therefore, that the Bureau,of Special.College
Programs (now the Bureau Df Post-Secondary Continuing Education) has been
involved in a systematic study of the' opportunities for, and needs in,
post - secondary continuing education in the State. Be-ginni6g in 1964, when
financial Support was requested from the State Legislature, the Bureau has
been committed to the concept of planning a comprehensive and cOordinated
system of educatiort for adults. In April, 197' the Bureau prepared a plan
dr.4 for providing leadership for developing a post-secondary continuing education
program in the State -One way thst the Bureau begain-to,implAmene-CC.F-,,,14a..,-1.11
-whreby providing financial support for some systalaiic study of the oppor-
tunities for, and needs in, post-secondary continuing education- iu the-State.
Otigin of the Study
Tn Federal Fiscal 1971 the State Advisory CoUncil on Continuing
Highpr Tducation (now the State Advisory Council cn Post-Secondary Continuing
Education) recommended that the BurEau of Special College Programs of.the
"t)
IRObert E. Williams, "A Plah to Provide Leadership for the FullDevelopment of Post-Secondary Continuing Education in New York State."Unpublished manuscript, Bureau oi Post-Secondary Continuing Education,New York State Education Department, April, 1971.
lb
a
p
6
State Education Department (SED) invite research proposals related to the
three above-mentioned tasks. The research findings would be used to assist
the Department in making decisions regarding policy for post secondary
ocontinuing -education,- for the educational needs of New York's adult citizens,
for the priority goals for continuing education for - past- secondary educational
institutioo, and for data-collection strategies.
In considering the magnitude of all post-secondary continuing
educational activity, it was recommended that a research project of two
phases,be conducted. In Phase I, the major purpose would be to describe the
.0' a
continuing education activities conducted by, and the perceived continuing'
education needs and goals of, degree-granting postsecondary educational
institutions in New York State. An ancillary purpose would be to integrate
this information and the proctss into the rhpartment information system. the
objective in Phase II of the project would be to extend the project objectives
of Phasel to incliide all other institutions conducting post-secondary con-s
timing education activities in the State.
The State,Advisory Council on Continuing Higher Education-teCOMERtde
to the Board ot Reg( of the Univeksity of State of New York that, Phase I
of the project be condticted by Syracuse Udiversity and the Educational Policy
.Research Center, Syracuse University Resear Corporation, Subsequently, the
Board of Regents of the University of the State of Nevi* York approval the
project entitled, "Survey of Present Activities and Perceived Program Needs in
Continuing Education and Extension in Degree-Granting Post-Secondary Insti-
tutions in New York State."
Purposes of the Project
As has been stated, the general purpose of the project wqs to '
17

facilitate the capacity of the SED and reprentatives of post-secondary
educational institutions to conduct sompreSensive planning-of continuing
education activities in the future. Specifically, the project was developed
to provide three kinds of information that was needed for the planning proceis:
(1) what is presently going ,on id continuing education in post-secondary
degree-granting educational institutions in New York State, (2) how to
Incorporcte descriptive information about-,continuing education into the
Department information storage and retrieval system, and () what are theq,
priority continuing education needs and goals that can be addressed by egree-
granting poit-secondary'institutions.
In the process of working out the procedures to obtain these data,
it,,became evident that,information was also needed about the efficacy of
existing procedures for 'collecting these data,. Thus, it became netegsary to
refine the original objectives into more modest ones because of the complexit
and diverse nature of the State's post-secondary education institutions, the
dearth of research on alternative continuing education needs-assessment
AU.strategies, and the-finite iinancial rb:sources.
The three modified 41jectives which evolved were:
1. To test the feasibility of an institutional- sampling survey for pro-
vidin descripeive data about the naturelind scope of continuing-
'education In post-secondary degtee-granting institutions.
2. To test the applicability c-f the Focus Delphi.research.methed for
:assessing thi'priority educational needs and goals for degree-granting-
post-secondaryinstitutions.
. To evaluate tine feasibility of integrating the information-gathering
system for post-secondary-education into the State Education Department
. Nknagenent rmation system.
1 Q

8
Because a serious effort was made to pursue the initial intentions,
the institutional survey and Focus Dei,0817gIfidies provided a a about
natura-and-sctrpe-o-f-continu ing
education in degree - granting post-secondary educationaL institutions. While
a definitive statement on the-needs for post - secondary education did not
emerge from the study, the reader can find -sue hypotheses and/or tentative
conclusions that were uncovered from the data that were Obtained.
MethodoloSy4
1? °
Three data collection tasks"-one for each of the three areas of
information identified on page7--were planned to obtain the needed information.
Each task is discussed in terms of its purpose, the methodology employed,
the activities involved, and the persons providing leadership. Two ad-
ditional tasks supplemented the data-collection activities. A listingiof_the-JR,
individuals involved in the project is provided in Appendix A.
Concepts or terms requiring an exOlanation of the-sense in which t
are used will be defined as they appear in the narrative. A list of the
definitions of basic terms used in this report is also provided below
Poet - secondary education--Any and all systematically-planned instructional
activities offered by colleges and universities, and by other institutions
where the purpose of the instruction ie to facilitate learning beyond the
secondary education experience. This would include both full -time, and part-
time students.
Post-secondary continuing education--Any and all activities of an educational
nature engaged In by other than full -time undergraduate and graduate students
who are enrolled in degree-credit, ,non- credit, certificate, or diploma
curricula 19
9
Goals--Targets, or ends,,,to be achieved that guide futme action.. They may
be-edusationa-l-nrnon,edueation41.gextersi_or_appLcifie.ind_inng-range or
ahort_range in nature, Goals, purposes, and objectives are treated as
synonyms in this report.
Focus Delphi--A survey technique that collects the - perceptions of several
interested populations about an array _of goal statements and holds the group
responses separate for comparison over several reiterations.
. s-AP
Task I - The Institutional Survey
The purpose of the survey of continuing education activities in
digree-grantingpost-secondary institutions was to d'termine the Value of a
survey questionnaire for providing descriptive data concerning the nature of
continuing education activity in these- institutions. Descriptive information
was sought concerning the kinds of continuing education-opportunities avail-.
able, the audiences served, the number of participants, aria-I-hi-subject
matter areas studienr.-Yhe pupulation-iucluded all persons-providing
--instruction in post-secondary educational degree-granting institutions in
New York State. The methodology consisted of constructing and administering
a survey questionnaire to a sample of university and college personnel over
a period of fifty-two weeks, analyzing the data, and reporting the findings.
, _ _The results of this phase of the project are reported in Chapter 2 -of the
report.
The leadership for this phase of the project was provided by
Harlan G. Copeland and Roger Sorochty, Syracuse University; and James Byrnes
and Michael Folk, Educational Policy Research Center.
20
7

10
Task II - The Focus Delphi Survey of Needs, Coals and iorities
The purposes of the field assessment of goals, priorities, and needs
for continuing education activities were to test the applicability of the
.Focus Delphi research method for assessing needs and goals in continuing
education, and to illustrate the range of perceptions of interested publics
concerning reform and imlovation in fast- secondary education programs and
institutions. The Focus Delphi is a newly-developed survey instrument that
was devised to collect the perceptions of several different populations about
an 1array of goal statements The responses of the different groups, -- while-
kept separate for comparison purposes--are inserted in the succeeding versions
of the instrument over three orjour reiterations.
'The-responsef of various interested publics to alternative adult and *
conti-nuing education-goals- and --to- t -strat-egle-s- for achieving them were
sought. Information was also collected about the respondents' estimates of
the value ofcontinuing education goals to self and to post-secondary=edu-
cati:on, and their perceptions of the groups who had the power to enhance or
retard the acrd 2vement of specific goals.
Four publics interested in adult and continuing education were
surveyed through three successive mailings of questionnaire. The publics
queried were policy advisors, continuing education administrators., faculty
members;-and clients. The results of each round were reported back to the
participants i the successive rounds. The findings from this phase the
project are reporte in Chapter 3 of this roport.
Stuart A. Sandowd*ational Policy Research Center, designed the
IStuart A-. Sandow, Educ Polio Fo ulation: Planning With
the_Focus Delphi and the Cross-Purpos Matrix (Syracuse, New York: Edu-cational Policy Research Center,Syrac University Research Corporation,1972) p: I.

instruments, analyied the data, and reported the findings assisted by
James Byrnes, Michael Folk, and David Mathieson,all with the Educational
Policy Research Center.
Task III - Evaluation of the Compatibility of the Data - Collection Systemwith the Management Information System
The need for a continuing data-gathering system provided the purpose
for this task-. The task involved becoming familiar with the management
information system of the State Education Department, and evaluating its_
compatibility with the dcta-collectift procedures used in the two preceding
tasks. ThCeindings from this evaluation will be reported in Chapter 4 of
this report.
Michael Folk, Education al Policy.Research Center, provided the
leadership_ for this phase of the project assisted by James Byrnes, Educational
Policy Research Center.
Supplemental Tasks
In,order to assist the State Education Department staff in future
comprehensive planning efforts, representatives of post-secondary educational_
institutions and public agencies were invited to participate OilTa steering
committee. The purposes'of the steering committee were to provide informs- .
tional and advisory inputs into-the general planning ind.decision-making
ocesiis Of the project, and to assist colleagues in other institutions to
become aware of the need for planning and for collecting data pertaining to the
instructional 0,:tivities of college and.university personnel.
Alexander N. Charters, Syracuse university, and Warren L. Ziegler,
Educational Policy Research center, provided the crganizational leadership

,
II
12
for convening the committee, and involving the committee members in providing
,advisory and informational inputs into the general planning of the project.
A fifth task -- management of the project--was shared by several persons
aisociated with the project. Those providing leadersh-rp-for--theotly.1-r-lout___
speci c tasks handled any management aspects associated with the task
including soliciting advice and consultation"from s, cialists in higher
education, continuing education and research. Harlan G. Copeland, Syracuse
University, served as overall project manager.
Organization of the Report
The background of the project and the general purposes and iliethodology
of the study have been reviewed in this first chapter. The findings pertaining
to the institutional survey are reported in Chapter 2. The Focus Delphi°
survey of needs, goals, and priorities is described and discussed 61 Chapter
.Chapter 4 is devoted to the issues associated with a management information
system for continuing education. The final chapter is devoted to the, -- impli-
cation of the findings from the three studies associated with the project.
Since both of the areas of post-secondary education and adult/
continuing education in the United States have been Undergoing extenarive
change since the middle 1960's, a note about the time'frame of this study is
appropriate. As indicated earlier, efforts direCted toward cOmprfhensive
7planning_of post-secondary continuing education had their genesis inO
New York State in 1964. The grant for this specific study was made in June,
1971. The data for the Focus Delphi phase of the project collected\_,
,between Jantigry_and May, 1972; the instructional survey data were_collected
between March, 1972 and March, 1973. A separate reporrof the Focus Delphi

13
A.
study was issued by the Syracuse University Research Corporation in July, 1972.
The inispl draft of the total study report was completed in December, 1973.
The subsequent period of time has been used to review, edit, and _re-i-seth-e"
manuscript and publish-the report:
Thus, the narrative describing the background and implementation of
the study reflects the context of the in which the study was con-
ducted..0teferences to certain developments releVant to the study that have
occurred-since the data collection period will be noted, but reserved for the VT
final chapter.
24,,

CHA PTER I I
A SURVEY OF CONTINUING EDUCATION ACTIVITIES IN DECREE- GRANTING
POST-SECONDARY I TITUTIONS
In order that adult and continuing education-planning personnel could
have information about the nature of continuing education in New York State,
and About useful techntques for determining the same, a survey of Lpitriictional
activities in degree-granting educational institutions was conducted. Tht
purposes of this chapter are (1) to describe the data-collection and the
data-analysis processes used, (2) to.presvt,selected'descriptive data
concerning the scope sand nature ofinstructionalactivities in post-secondary
degree-granting institutions, and (3) to illustrate ways that descriptive data
about current activities can be used for long-range planning for continuing
educatior in New York State.
t.
Need for the Study
In a 1971 paper, the continuing'edocation staff of the Bureau
of Special College Programs (now the Bureau of Post-Secondary Continuing
Educe emphasized the need for more information as a basis for realistic,
long -range planning for post-secondary continuing education in New York State.'
Various socio-cultural forces affecting modein society and-the service's needed
LRobert E. Williams, "A Planto Provide-Leadership for the FullDevelopment of Post-Secondary Continuing Education ice New York State." .
Unpublishec' manuscript, Bureau of Special College Programs, New York StateEducation Department, Albany, N.Y., 1971.
14

15
from educational institutions mandate new and addftionai kinds of necessary
i.
information for policy planners in continuing education. Among the -6onditicns
which; re a recurring assessment of continuing education are:
1% An'icreasingly_ispater number of people of post-high school age who
desire or need some form of higher continuing education. This is re-'
fleeted in trends such as: the rapidity of sdcil and-'technological-
change; the importance of credentials in society; tie emergence of cow-
pulsory education for purposes of re-certification and re-liceniure; and
the increased recogdition that knowledge is a means of gaining - some control
over one 's 'destiny.
2. Higher education institutions face serinds financial problems in the
immediate future.
, 3. The evolving needs of society are requiring, both quantitatively and
qualitatively, an adult population-that is trained in a specialized-
fashion and is educated in a generalized fpshion.
4. The educRtional needs of Various neglected populations in society --.
namely disadvantaged adults, women, senior citizens, ,minority groups;
migrants, adults in mental and correctional institutions--have not_been
served adequately by higher education and other educational institutions.
The lack of adequate information about the current status of post-
secondary continuing education in New York State has havered efforts to
develop a comprehensive Statewide plan for post-secondary continuing educe-'
tion. In the past, a major data collectiOn effort has been conducted by the
U.S. Office of Education thrbugh the'Higher Education General Information
Survey (REGIS).. .Tpis survey has provided data on the numbers of registrations
in three credit categories (i.e., degree - credit, non-degree *credit, and
26
-4'

.
non- credit) by academic subjects:and by tea typei of instruction (e.g:, class,
. ..
.....-, ...)short course, lecturceseries, broadcast TV, 'etc.). -.
*I t . ,.,
.
Anadditional source,
of information has been the joint reports
prepared by the Assoei%Lion of Univers.irAiEverAing Colleges_tA_UEC) a_nst the_
---Natinnal-University Extension Association (NUE0:1 Thase-reports have pro-
vided data on enrollmeht statistics for AUEJ addNUEA member- institutions for ,
__J'
-three, methods ,(classes, conferences, and' correspondence study),aadjor the.
. . .
colleges Within the..: 4niversity. ,Whire certain kinds of these data htve beeno
reportee since the 1960-61-fis&1 year, the reporting.
in4itutions have beech r
limited to those member institutions of AUECand NUEA. .-
. . . . .
.A third major source of information about continuing education;
`-- activity that has a bearing orpolicy for pbst-secondary conLinuing-educatioT,
lis the New York Cooperative (Agricultural) Extension Service, whigh has
developed a management information service. in collaboration with the other
forty-nine states and the U.S. Department of Agricialture. There are five
components of the state system: plan of work, plan of work projection,
activity' report, progress report, and personnel.
The plan of work fdentlifies thamajor.prOgra;ri-thrUati'Planned fob the
caking-iistal-iear and indicates resource allocation by purpose, subject, and
type of audience.' The plan-of work projection identifies resource allocation
fot,the. subsequent yeass-by porp,se. The.actIvity report indicates resource
'expenditures by purpose, subject, ant; lience. The progress report is a
qualitative assessment of achievements.' The personnel component is a Current
inventory of professional staff.
+in,mnimemit
1See, for example, a report_prepared.by the Joint AUEC -NUEA Committeeon Data'ane,DefinitiOns, ?rograa:,and Registrations, 1971-72-(Norman, Okla.and Washington, D.C.: The ASSOCiatiOh of bniversity Evening CollLges andThe National University Extension Association, n.d.).
.*---

o
17
This reporting syhem was developed Specifically to accommodate the
operating procedures, traditons, and philosophy of the Cooperative Extension
Service'. The data generated apply only to this subsystem of continuing edu-!
cation, and it is quationalalewhe-t4erfhse-spectal-fttAirdAra-aaleetiondii-sign
would be applicable to other programs of adult education.
The need for addi.tional information about what was going'on.
'in post-/. ,
.
, sec,
. 1;!-.._
ondaryr
continuing education was A concern shared wi h,sveral other indi-_,. .. . .
. ...)- ,1 . .
_ _.
ArldniiiAIS And organizations. Mention will be made only of the effort that was
1 0
most prominent and visible at the.-autset of the study; i.e., that of the
Commission on Non-Traditional Study. The Commission, through the support of
the Carnegie Corporation, the College Entransce,Examination Board, and the
k_Educational Testing` Service, was beginning in 1971 and 1972 to acquire infOrma--
tion and to identify and study the.iisues.I'
Thus, while about continuing education activity An New York State
did exist, the information was limited primarily toenrollment statistics in
the various subject-matter areas. It was encouraging, however, to note the
increasing interest in acquiring more information about adult learners acid
UsducAtionai programs s rving adults, that was developing on the national
and in the Bureau-or- ost-Secondary,Continuing Education in 1970-71.
There was alSo an increased capability in management information
.systems related. to #dult continuing education, such as in Cooperative Extension,
I '
but the data pertain to the mission of that Bar,icular organization. In
summary, the existing data- collection systems provide information about enroll-1'
ments''in post - secondary continuing educatioa.coursesand prograMs only. SuchO
data have thus been found insufficient for comprehensive long-range planning in
,ISamuel B. Gould and K. Patricia Cross, eds.,Fxplorations in Non-
';Traditional Stu (San Francisco, Calif.-- Jossey-uiss, Inc., 1970, p. ix:
2 8.
18
pgst- secondary continuing education. Knowledge about the number of enrollments
explains very little about caar.:cteristicsof the adult students and about the
nature of the instruction that-is offered.
Purpose of the ;Study
In addressing the need tp supplement the existing information (i.e.,
enrollment data) about the current status of continuing education:three
general questions emerged: What specific substantiye information would be
u-Aful in describing what is now going on in post-secondary, continuing edu-
cation? What data - collection techniques are most appropriate for providing a
4
compreheqsiv&yiew of post-secondary continuing education in New:York State?'1
What magnitude of post-secondary continuing education should be examined?
As stated previously, the magnitude of the investigatioc_ was limited
to-a stratified sample of continuing education activiOes-ConduCted by 45-
degree-granting post-secondary educational institutions from a total; of 229
colleges and universities at the time'of the Wtudy.
In discussioni with persons responsible for policy and planning for
e -
post - secondary continuing education, in the State Education Department, specific
needs for certain kinds of information were identified. These people desired
to supplem4nt the existing data on enrollments with additional knowledge about
who was being served: What are these continuing education students like?,
Also, information was desired concerning how, when, and where continuing
education offerings were provided. Another major interest was in findfng out
how present offerings were being financed.,
Using these expressions of need, the study began with -the primary
purpose of describing the nature and scope of continuing educption=activities
in post-secondary educational institutions in the State. A valid and reliable
29

'4
-19
description of the post- secondary continuing education activities and the
participants involved would assist in the formulation of a Statewide Plan by
answering,such questions as: Whom should post-secondary continuing education
serve? What should be the priorities for post-secondary continuing education
in both the short-range and the long-range future? What changes in post-'
secondary continuing education offerings should be made? What policies should
be advocated for post-secondary continuing education?
Neither the plaaners nor the research team members expected the study
findings to to provide direct answers to these questions. Rather, the findings
would-51 tiled to answer "Where-are-we-now?" types Of questions. Thus, the
planners would be more assured_of a valid starting point for asking questionsw-
relating'to "What,should/ought pos seCondary continuing education be in five
years?" "In ten years ?"
Attentidn was also directed to methodological.concerns. Certain guide-
lines for the data-collection system were suggested. Representatives of the
:40
SED indicated a desire for the data-collection system to be integrated
eventual into a management information system being developed by the SED.
- I
This criterion imposed 4 standardized format for the responses so they could be
computer-stored. It waSalso desired that the data could be generalized for,
all post-secondary conti
"4-
uing education.
In the process o working on the methodological issIkts it .became
evident that the most prssing problem involved the development of an effective
and efficient system_fortolleCting data through post - secondary educational
institutions abcut their Continuing education programs and clientele. Thus,
it became necessary to modify the original goals of the study and focus on
,
furthering our knowledge *bout appropriate data-collection procedures- for
.
detrmining what is going on in post - seconds -y continuing-eaocation;.
30
20
Therifore, the primary purposes of the institutional survey, as with
the. Focus Delphi, became
1. To test the feasibility of an institutional sampling survey for providing
descriptive data about the nature and scope of continuing education in
post-secondary degree-granting institutions
2. To test the appropriateness of_selected techniques for analyzing he
data
3. To illustrate how descriptive data obtained could be used for policy
formulation. and for long -range planning.
Since the data-collection effort was implemented to fulfill the initial
intentions of the project, &secondary purpose of.the study was to seek answers
to questions such as:
1. Who is presently being served by- degree granting post-seconderieilucation
institutions?
a. What-is the age, sex, race, and educational. level of the people who
are participating at the present time?
'b. What prerequisites are required, if any, for participation?
2. Who is not presently being served-Who might be?
3. For those being-reached by degree-granting post-secondary education
institutions, how are they being served?
a. What is the type, nature, and duration of the offerings?
b.. Where offered?.
c. By whom?
4. Row are the present offerings being financed?
31
.
J'
Design of the Study
Designation and Selection of the Sample
Three sources of informationenrollments, an a. It learner's total,
educational activity, and-instructional activities--were considered as having
cthe potential of providing a standardized measure of participation in post-
secondary continuing education activity. There are advantages and limitations
associated with collecting each of these types of information. Thas-e-t-h-ree-1-,
sources also differ.in the extent of information provided aLout,the nature and
scope of port-secondary continuing education.
Ttaditionall an enrollment has been the-nnitsd-analsis for des-,
crihing participation inl.......Ana-fliiWiulatinglioticy about, higher continuing
education-activities. An enrollmeht may be defined as the act of partici-
pation in a single program." While data about the numbers of enrollments in
'courses and programs are usually available, they are limited to providing
answers about the numbers of io i Aduals,being served by-a gAten program, unit," _
Or insticutton. These course or program enrollment statistics reveal, nothing
about who participates inpost-secondary continuing education and why.'4*
Although participants usually provide some information about them-
selves on registration forms, these data are seldom compiled and reported.
Even when available, only a minimum amount of additional information is known
about the participants, and very little is known about the nature of the
instructional activity.
Furtherraore, it Is difficult to get one standardized operational
definition of an "enrollment." Institutions arc still in the process of
differentiating between full-time and part-time students; some continuing
32
22.-
educators would even question whether this distinction serves any valid purpose
as far as adult learning is concerned.
The second measure_of_participationan individual's entire educational
activity--is a new, and most revealing, approach t( understanding how he or she
engages-in continuing learning activity. This research. approach focuses oa
the learning activities of individuals--tather than on an analysis of the
clientele of a specific institution or program. All learning activities under-
taken by an adult during a certain period of time--such as one year--are studied.
Thus, an individual's learning may involve many different activities such as
Wending a trainingprggram at work, participating in a program aponaored by
a professional association, attending a lecture series at a museum, taking part
in a discussion group at church, teaching himself or-herself eamettfak, as well
as taking a course. Thus, ;his approach is effective in determining the-nature
and scope of adult learning activity since it is not restricted to methods,
subject,matter areas, sponsoring institutions, or locations.
If this research approach were used, the adult population of the State
would become the population for the study. Such studies have customarily
employed both survey and interview techniques'in the data-collection process.
The interview techhique provides the opportunity to probe for learning exper-
iences that are not'immediately recalled by the subjects The limItAtions,of-4)
surveying adult learners lie' primarily with tne expense associated with
collecting the data, and the amount of time required for dispelling Concerns
4bout invading a person's privacy.
The instructional activity of faculty and staff of degree-granting
post-secondaiy institutions in New York State was considered a third source of
information about participation in educational activities that could be useful
is formulating policy for post-seebddary continuing education. An instructional
to'
33

. activity was deIined as any activity which has the DIRECT p4pose of, improving'
the knowledge, skill, or sensitivity (attitude) of an individual, group, or
mass audience. Examples would include classes, workshops, tutorials, lectures,
and-presentations on mass media provided by college an4 university staff:
The advantages of using instructional activitiek as the unit of
A
'analysis for the study were that: (1) data could be obt fined directly about
the nature and _SoOpe of continuing-education offerings id terms of the methods
used (the "haw"), the content areas (the."what"), and the place and time of
- .
rra441.6Rffrines kt[v. noollo,laitt where ), tz -it Aoliisanticipated t4,q, 1,,,f; it 44,1".44 9(.3,04k.-.A.
.0. 711,0'' *".d. . wfgra .--- ..e lk:04Let4t, 4",0**
1
tt. 'nformation'
'bout the individuals (the "who") participating in the activity'an about the,
methods of financing could also be obtained from the instructor; (3) it would
-also be possible to identify the faculty and staff providing'instructional
activities in post-secondary institutions; and (4) it should be m4re economical
to study "instructional activities" of faculty than to review the "total
educational activity" of New York State adults_ because institutional affilia-
tion provided an access for identifying faculty and s,taff, whereas no
organizational membership list or mailing list was available that included all
adults residing in the State.
At least two limitations were foreseen in studying instructional
activity: (1) Etandardized techniques for obtaining the desired data did not
exist, and (2) it would be impossible to collect data about all instructional
activity in post-secondary educational institutions.
The study staff felt that the advantages exceeded the limitations.
Thus, the instructional activity provided by post-secondary educational insti-
tutions was selected as the principal unit of analysis of the study. Two
assumptions relevant to this decision were also made by the staff: First, it
was assumed that the information collected about instructional activities had0
34

24
the pdtential for being collected and aggregated within each post-'secondary, \
institution at some future time. Second, it was alto believed that college and \.
university faculty would cooperate in providing the information requested.
The magnitude of instructional activities in post-secondary educational
institutions dictated that a sampling technique be used. The theory under-
lying sampling prociedures is based on the assumption tha_ o we'll proportion may
be drawn from a total population "of events in such a way that :ne findings for
the smaller pr /portion (or sample) closely approximate thelindings for the
entire population.'
At the time of the study, there were 229 post,sedondary,educational
in titutions employing approximately 37,900 full-time faculty members. It was
also noted that instruction was offered throughout the year. Thus, it seemed
necessary to sample both instructors and time periods. /
In order to limit the scope of.the study, a two-stage sampling procedutira
was employed. First, a stratified sample of the faculty and staff from all
-degree-granting post-secondary education institutions was drawn. Second, each
perion was aasigned one to five reporting weeks according to a specified- pro-
dedure. The detailed procedure for selectingthe faculty sample is described
in Appendi4
Jn summary form, the faculty-Aampling,prOcedure involved four general
steps:'
r. Determining the population (i.e., the number of full-time and part-time
staff for each of the 229 institutions)
2. Dividing the population into a number of parts (or strata) and subparts
(clusters)
'William L. Hays; Statistics es, 2d ed. (New York:___NoltRinehart-and-LWieston-Inc.', 1973),-,---4. 72-75.

3. Selectidg the sample.
4. Identifying the individuals who belonged to the clusters cOmprising the
25
sample.
Since the number of full-time and part-time staff in post-secendary
institutions (the population.) was unavailable, it was estimated by mulciplying
the number of full-time faculty at each institution by three. This was done to
provide an estimate of part-time faculty, one-tithe'faculty, and professional,
staff members as well as full-time faculty who could possibly provide instruc-.
tional activities.
The population was divided into a number of parts and subparts (clutters
so that a stratified sample could be drawn. Such a scheme is useful for in-
suring a representative sample, and-it may reduce the error in estimation.'1.
The population was stratified as follows. Firse. the estimated number of full-
time staff in each institution was divided into ?coups, or clusters, of 20 each.;
Second, the clusters were then consolidated into 28 groups or strata (caned
zones) of 200 clusters each.
Two'samples were drawn so that it would be possible to provide estimates
of.statis,tical variation for the total population. unless two samples are
compared, it is impossible to determine variance how'different the
various cases are from each other) in the population. Each' sample was drawn
by randomly selecting a cluster from the first stratum (or zone) and by
selecting every succeeding 200th cluster froM\the remaining strata (zones).
Thus, each sample consisted of 28 clusters sincesryne cluster was drawn from
each of the 28 4rata (zone's).
Since the sampling process s based on_estimated numbers of full-t
'William L.
Holt, Rinehart and
Sys, S atis
nston, 19/3), p. 290.or th Social Sci nc
36
d ed. (New York;

26
staff, and since a master list of all full-time staff did not exist, it was
____---necessary to usesone.Isrge directory of names as a means to define the alpha-
betical parameters which would - identify - -the names of the persons within each of
the clusters selected through the stratified sampling process described above.
Through a pumber-assigning pIan it was possible to know which institution was
associated with each cluster drawn in the staple. For each institution having.
one or more clusters, in a sample, the large 'directory of names was divided into
a number of partf equarto the number of clusters associated with that insti--
tution. Thus, if an inseitution had 347 clusters, the directory was divided
into 347 parts. The nanls of the individuals at the beginning and the end of
the perts of the directory that corresponded to the sample clusters became the ,
alphabetical parameters for identifying the individual faculty and staftmembers
from that institution._ Each of the 47 institution: was asked to provide theo
names of faculty and staff that fell within the designated alphabetical pare-
maters=for that institution. For a listing of the maim boundaries for each of
the 47 institutions in the sample, see Appendix S.
This complex sampling procedure was followed for two major reasons.
_First, it was necessary for making estimates about the complete population of
instructional activities: Second, it provided 'a means of identifying a Sample:.
of faculty members even though a directory of all faculty members in poet-
secondary educational institutions did not exist.
The sampling procedure resulted in the identification of 1,076 faculty
and staff from the 45 cooperating institutions.. Two institutions did_not grant
permission to the research teim to conduct the-study. Subsequently, a, sample
of faculty was needed as respondents for the Focus Delphi study reported in
Chapter III. The Focus Delphi faculty sample was drawn from the institutional
survey sample because the names had 1)een obtained through a stratified sampling,
37

27
process, the names were available and the reduction in number woujornot ad-
versel affect the institutional survey. The Focus Delphi sample removed
every fifth name--209 names in all- -from the 1,076 names in the original -
sample. As a result, the size ceI the institutional survey sample was reduced 4
from 1,076 to 861-7-
It was decided that instractional activities should a sampled over a4.
one-year period of time because instruction offered through post-seconday...
continuing education is available throughout the entire year. Since the:Atus
of the study was on continuing education, programs and courses ?fr red during.(
the summer and between terms were as important as those available during the
academic year. The time-sampling procedure was accomplished in the following
mantle r-:
1. Each of the 867 persons in the sample was first asked to estimate the
amount of time spent in instructional activity during the preceding twelve-
month period.
2. Using the above data, one to fiye reportin& weeks were assigned to each
respondent. The rationale for basing the number of reporting weeks on the
extent of involvement in continuing education instruction was to improve
the sensitivity of the response. .Those individuals who p -, vide extnsive
instruction for continuing education students, it was assumed, would be
4=
involved with a variety of students, modes of instruction, subject matter .
areas, etc. Thus, it seemed desirable to sample as many as,five weeks in
the year for these people-. Conversely, i6- was assumed that those less
involved in post-secondary continuing education instructien wOuI4 have
less variation to report. The number of reporting weeks assigned to each
subject, therefore, was based on the hours of continuing-education instruc-
tion provided 4uring the preceding twelve-month period. The correspondence
IP
38
4.

28
hetweem the hours -of instruction and'weeks assigned to report is shown in
Table 1.
TABLE 1
NUMBER OP-RtkIRTINes'IWEEKS ASSIGNED TO-SUBJECTS
Number ofReporting_Weeks
Aslned
4
.r
Number.
of
Subjects
6
10
15
26'
Number of Hours, of ContinuingEducation Instruction Re6rted .
During Preceding 12-Month Period
-More than 1,000
600-999
200-599
100-199
1 810 Less- than 100
For those who failed to provide an estimate of time in comtinuing edvAda-
tion instructioh, one reporting weak was arbitrarily assigned. While some
sensitivity would be sacrificed by this decisic;n, it was felt that data _
for one week would be preferred to no data-at all.
The actual reporting weeks'for each individual were assigned using a table
random numbers. This technique is one of the most common schemes.for
sapling- events randomly and independently.'
Selection oT a Data- Collection Method
Since information was desired from 867 individuals in 45 post-secondary
'William L. Hays, Statistics for the Social Sciences, 2d ed. (New Yorkl.HOlt, Rinehart and Winston, Inc., 1973), p. 73.
39
it
4

A29
education institutions throughout the State, and, given the-resources for.
carrying out the study, the survey technique was selected as the,most effective
and efficient method for collecting the necessary data. A survey would be
efficient since the questionnaire could be administered expediently"in any
_location in the State with a_ minimum of expense. A surrey questionnaire would4
.be-effective since the same units of descriptive data about continuing activi-e%
ties could be collected from each source. the- survey technique was employed
on the assumption that a large sample size was desirable, that any ppat-:--
.aeCondary instructor in the State should have the potential for being included
in the. sample, and that the instructors would be willing to provide the desired
data. The survey technique was selected instead of theirterview method prir
marily because of the greater costs involved in condUtting personaltinterviews
as contrasted with the mailing of questionnaires.
Instrumentatim
Three instruments for collecting data were developed. A copy of each
instrument is attached in Appendix C.
BSCP Form 1 was designed to collett (a) es mates of lime spent in
twenty-One categories of instructional activity during 1970-71 and projected
for- 1971-72; and (b) demogrt bhic data about the respondahts.
purpose for'`this Destrument was to obtain t -ester, datafor use as a basis
for determining the number of porting weeks for each respondent.-
The 21 categories of instructional activity were-deVe1oped. by the
research team to include all possible types of instructional_-Sctivity.. -
Categories 1 -6, included instruction creditable toward_ academic degrees, an
Categories 7-16 included non-credit instruction. Categories 17-21 included
40

. 30 40,
"In
instructional activitl s at levels other than post-secondary and counseling.,
The categories selected were:
1. Regular Division, Lower Di- vision, Undergraduate
2. Refful-.. JiVision, Upper Division, Undergradurite
3. Regular DrVislOA, Graduate,. I
4._ Continuing Education Division, LowerN.pivision; Undergraduate
5. -Continuing EducationiOsion, Upper Division, Undergraduate
6.- Continuing Education Division, Graduate
7. Instruction in'professional and technical knowledge and,skills foriondividuals with previous-college work or equivaledI experience
8. Technical and vocational instruction for post-high school: students withlittle or no previous college work or equivalent-experience
9. Remedial instruction for post-high school students preparing for academicwork at the College level
10. Sectarian, moral, or religious
11.- Sports, recreation, hcobtes, handicrafts
12. Art, drama, music, and other cultural development activities
13. Rome and family life
14. Current events, public affairs, and citizenship
15. Agriculture
16. Other instruction not credicable toward academic degrees
17. Early childhood education
18. Elementary level
19. Secondary level academic or technical-vocational
20. Counseling
21. Othez
The questionnaire was sent to each person in the sample during January
and February, 1972.
41

RSCP pprm2 waA developed to collect descriptive data about the re-
spondent's instructional activities. Information,was sought about (a) the
lenumber of activities, ) the number of participants, (c) the type of pre-
.
,requisite competencies re ired for participatibd, (d) the objectives of the4
activitY,1111ti. the medium and mode of instruction used, '(f) the subject matter
included, (g) the length and place (A.the activity, and .(h) the number and
type of sources of financial support for the activity.
The ArreThennaire was .developed so that 10 instructional activities
could be described on the response sheet. The respondent selected and coded
his or her response for each variable according to d list which way; enclosed
with the questionnaire.
The altern i e respOnses f6r all but one of the variables were devel-
oped by the r h team. The subcategories were intended to be mutually
exclusive whilk providing a comprehensive description of the variable. A
system that was developed bly the U.S. Office of Education for classifyiGg the
various subject-matter areas was selected becauseofits pre-vioustSelw
collecting data ft-dm-colleges and universities. The major variables and their
subcategories were:
1. Objectives oftheinstructional Activity'--This variable was used to des-
cribe the type of instruccional objective addressed by the instructor
Three objectives involved credit, and four involved non-credit activities.
Objectives leading to an academic degree or diploma
b. Objectives leading to a general or vocational diploma
c. Objectives leading to certification or licensing
d. Objectives designed to enhance general knowledge without regard to
diploma, certification, or degree requirements
42

32
It. Objectives designed to enhance specific knowledge relating to indi-
vidual -ar institutional problems or interests without regard to credit
1. Objectives leading to remedial or basic preparation-WMOa regard
tq credit
Objectives leading to special or custodial education
h. Other
2. The Medium of Instruction Used--This variabli was included to determine
''the type of contact with learners that was used by instructors. There were
nine response categories.
a. Writing an evaluation of performance
b. Designing or writing instructional materials
c. Broadcasting: live TV--open reception
d. Broadcasting: -Live TV- -closed circuit
e. Broadcasting: recording TV tape for delayed use
f. Broadcasting: live audio--open reception
g. Broadcasting: live audio--closed circuit
h. Broadcasting: recording audio material for delayed use
i. Filming
j. Addressing individuals face-to-face, alone, or in groups
3. Instructional Mode - -This variable was used to describe the ways that the
ipstructor used in teaching his or her students. Seven response tate-
gories were provided.
a. Lecture, exposition, or demonstration._
b. Seminar, dialogue, or discussion
c. Workshop, lab, or supervision of experiential learning
d. Lecture/seminar combinatiLl,
e. Lecture/workshop combination
43
3-3
f. Sftinar/workshop combination
g,. Lecture/seminar/workshop combination
4,4. Subject Matter--This was im000-d to discover the nature of the content
that was taught. Twenty-six different subject-matter responses were pro--
vided. The complete list is shown in Code List F with the instrumentation
in Appendix C.
5. Place of Activity--Twelve different locations were provided so the re-_
spondent could identify the site where the instructional activity took
place.
a. Church or synagogue
b, School or college facility
c. Government facility-
d. Cultural facility
e. Voluntary association facility
f. Commerical facility
g. Broadcasting facility
h. Labor union facility
i. Place of uusiness
j. Private home
k. En roue
1. Other
6. Prerequisite Competencies for Participation - -The respondent was asked to
indicate the yea:-.s of schooling and experiential prerequisites needed by
the learners to participate in the instructional activity. Ten formal'
educational and eleven experiential, prerequisites were provided.
a. Formal education required by learners to receive instruction:1 *
(1) no years of schooling required
"-` 44

(24 completion of l_to 7 grades of school
(3) completion of 8 grades of school
(4) completion'of-9 to 11 grades of school
(5) completion of 12 grades of school
(6) completion of 1 year of college
(7) completion of 2 years of college
(8) completion of 3 years of college
(9) completion of 4-year college degree
(10) completion of an advanced degree or first professional degree.'
b. Experiential prerequisites needed by learners to receive instruction:
(1) none
(2) functional literacy
(3) vocational experience comparatrt hi'gir--seho'61experience
(4) understanding of arts, sciences, or humanities comparable to
high school exp2rience
-(5) vocational, technical, ar professional experiencC Comparable
to two years of college
(6) understanding of arts, sciences, or humanities-comparable to two
- years of college
(7) technical or professional experience comparable' biCealaureate
degree
S.
(8) understanding of arts, sciences, or humanities comparabl to
baccalaureatee-Ovgree
(9) advanced technical or professional experience comparable to
Master's or first professional degree
(10) advanced Understanding of arts, sciences, or humanities comparable
to a Master's ot.fir4t professional degree,
45 1
'35
This questionnaire was self-administered according to the schedule
of assigned"report.ng weeks for each respondent during the twelve-month period
from March, 1972 to March, 1973.
BSCP Form 3 was designed to elicit information about the participants
in the instructional activities report_zd on BSCP Form 2. The respondents were
asked to provide data abtit (a) itne humber of learners,, according to sex, race,
age, and number of years of school completed, and () about the people who were
involved in planning the instructional activity.
The primary instruments--BSCP vorms 2 and 3--and the appropriate instruc-
Lions were reviewea by members of the project team, by members of- the projet
--alltriatrycommtttgel, and by representatimes,of the_projiA sponsor. 'Six faculty
members at Syracuse University were involved in a pretest of. the materials.
The nevi, -ors made suggestions about items such as length of the_ questionnaire,
clarification of the purpose ofbthe questionnaire, use of examples or
trations, and the clarity and brevity OrAhe instructions. All suggestions were
cOnsidered and appropriate revtsionere made. Both,Fermirand 3 were re-
worked to fit tne sheet of paper. The purpose4 of the study and of the data-
gathering instruments were re-stated. The meanings cf key terms and the
instructions were checked for clarity. Although brevity of the communication
was a major goal, additions were dncluded whenever communication was nhanced.
Coding systems that might be familiar to tl-e reader, (such as the U S. Office
of Education subject-matter coding scheme), were used whenever possible. An
example of how to record instructional activities was added.
Data Collection-
The instructional activity data were collected during the fifty-two
week period begipnint March 3, 1972 'and ending March 4, 1973. The first week
36
V
of March, 1972 was the earliest week that questionnaires could be distributed
because some institutions did not.providethe names_of their faculty members
who were selected in the sample and because revisions were still being tncor-,
porated-t6tothe questionnaires until that week.
The respondehts were contacted by a personal letter which explained
'the purposes of the study and requested their participation. Each respondent
was asked to report each instructional activity he engaged in during the
specified week on BSCP Form 2 and to ovide-dstdibout the participants in
elfin activity on BSCP Form 3. The reporting period began 'on a Monday and
ended the following Sunday. The reporting period was selected so that the
questionnaires would be on the respondent's desk
her reporting week. Onthe following Monday, it
would add any instsuctional activities he or she
end anOhen return the questlionnaires.
on Monday morning of his or
was hoped that the respondent
ibad_provIded-during_the
'Two efforts were made to encourage the temple of faculty and staff to
respond to the questionnaires prior to the collection of the data. First, the
chief administrative officer of the colleges and universities from which the
faculty and staff sample was drawn was asked to endorse the study and to
encourage participation in it. Forty-five of the forty - seven- -'administrators
did agree to support the study and to coopurate-With the research team. Second,
the institution was asked to designate an individual who would serve as a
liaison person between the institution and the research team. This individual
__assisted the research team by providing names of the faculty -and -staff sample
based on the alphabetical parameter guidelines provided.' He also responded
to questions from persons within his institution, and he assisted the research
team with the follow -up activities with non-respondent*'.
47

37
Three general approaches were used throughout the study to encourage a
, .
high rate of response by participants. Copies of the various communications
are attached in Appeddix D. Initially, a second letter was sent to-the non-
respondent if his questionnaire had not been received within seven days from
the end of the reposing week. If the individual had not responded after one
additional week, an attempt was made to locate the individual by telephone..
The difficulties and expense of locating faculty members were so great that an
alternative follow-up procedure was developed. The second approach involved
the assistance of the contHt person at each institution. Again, individuals
were given seven days for sending in the data-collection forms. Two weeks
after the close of a reporting period,--the appropriate contact person was
14;
requested to communicate with each non-resporident 'his institution. Copies
of a suggested memorandum- were made- availahle-for- e- contact person to use if
he desired If a-third week had elapsed without hearing from the individual,
the research team attempted to reach him by telephone. This procedure also
proved to be difficult and costly, and it became necessary to eliminate the
telephone contacts because of the expense involved., The third effort to in-
crease participation involved sending a brief memorandum which asked the re-
spondent to report whether or not he or she was involved in instructional
activity during the specified week. This procedure resulted in improving the
response rate, although many of these respondents had,provided no instruction1
- during the assigned reporting period.
At this point, we can merely speculate about the reasons for the re-
maining non-respondents. Perhaps the goal of a high response rate was un-
realistic. University personnel are seldom asked to provide this type of
information, even within thelr own institution. Many faculty are used to being
48

'38
paid for p viding information and advice. More information is needed about
ways and means to increase the response rate of college-Anti-:university
instructors.
Response Rate
,A total of 977 questionnaires was mailed to-the 867 perions in the
sample during the 52-week period, according to the predetermined schedule of
assigned week-6. Of this total, 113 questionnaires (11.5 percent) were returned
because the addressee could not be reached. Four reasons were given as to why
the questionnaire could not be delivered: (1) the person had Left the cortege
or university, (2).the person was on sabbatic leave at another location,
(3) the person was deceased, or (4) the krson had moved and left no forwarding
address. Persons leaving the university accounted for most of -the returned
questionnaires.
For three reasons, no attempt was made to locate replacements for the
1p individuals who could not be reached. . First, some percentage of faculty
turnover occurs naturally each year. Second, any replacement with P faculty
member who was outside the alphabetical parameters of the cluster, would have,
violated the sampling procedures followed. Third, based upon the experience
of the project -staff in obtaining the names of the faculty who were included
initially in the sample cluster,'any ready replacement-with a new faculty
member within the alphabetical parameters of the cluster would have been
difficult, it not impossible, for some institutions, Apparently SOff2 insti-
tutions did not maintain a central listing of current faculty for the 1972-73,
41-
academic year so that obtaining the names of the initial sample proved to be
a surprisingly, difficult task.
49

The number of responses by each reporting week is shown in Table 66,
Appendix E. A summary'of that information is presented in Table 2.
TABLE 2-
SUMMARY OF fiENPAIOU70--INSTAUCTIONAL ACTIVITY SURVEY
39
,Number ?
Percent ofTotal Mailing
Percent ofNumber Reached
Total Gtoss Mailing 977
Not Reached 113 11:56
Reached - 864 88.44
Declined to participate 80 8.20 9.25
- questionnaires not 'returned 323 33.06 37.38
,Questionnaires returned 461 47.18 53.35
As shown in Table .'2, 53 percent (N=461) of the questionnaire& that
could be delivered were returned by the respondents. Respondents declined to
complete approximately 9 percent Of the questionnaires, and 37 percent of the
questionnaires were not returned_
Techniques the_Data
Since the task of developing effective devices for collecting informa-
tion about post-secondary continuing education emerged as an'important purpose
of the study, the ways in which the data could t!e,analyzed became an equally
important issue. All analyzed data-e some.point` would have to meet some
criterion of utility; i.e., "Were the data useful in policy planning for post-
secondary continuinveducationT"
Three approaches were used to extract meaning from the data. One
0-14--
technique used statistics from the study to elv.trapolate to the total population;
51)

40
i.e., all post-secondary continuing education in the State. A second technique- -4
the computation of descriptiOe statistics--is widely used in analyzing-data and
needs little explanation. The third approach provided descriptive data'about
different definitions of post-secondary continuing education,.
Each technique will be described and illustrative examples of its use
will be provided. Also, the advantages and imitations of each technique, as
seen-by the project staff, will be presented'.
Extrapolation to the Total Population
When valid, summary statistics from a.sample of subjects provide
e timationslItithin known percentage_ points of accuracy, and to a known level
of c nfidence--of totals for an entire population. The translation of summary
s :statistics based on a sample into estimates for the national adult population
is evident in the familiar national opinion polls and from the national-in-
ventory,of educational activities of 'adults.1
The stiatified sampling procedure- used in this study was deaigne o
that the statistics obtained could be translated into estimates for all post-
secondary eduCational_institutions-in the State. Since only a small percentage
of the population is queried, a major advantage of sampling is that the avail-,
able resources can be used for more detailed questioning"of respondents than
would be possible in a total population survey. Also, the sampler is much more
aware of the idiosyncrasies Of the sampled populatiOn when directly involved
in choosing and querying the sample than is the case when the surveyor must
query through an _institutional middleman. The major limitation in this'
1John W. C. Johnstone -and Raman J. Rivera, Volunteers for Learning(Chi go: Aldine Publishing Co., 1965), p. 33.
51

41
extrapolation approach is the difficulty of obtaining reliable data. The
sampling procedures employed in this study allow the survefor to have a high
degree of confidence in the reliability of the data, but these procedures do
not guarantee that the data will be reliable.
A high response rate (e.g., 80 percent, from partidipants in the study
is also,essential for determining the level of confidence that can be placed
in the'data, While 53 percent of the questionnaires that could be delivered
were returned, this rate of response prevents the declaration of accurateS
estimates'for post-secondary continuing education in the State.
Even so, selected findings from the data will be presented to illus-
trate how the,data can be used. The survey team also contends that the major
error in 'the data is that they provide a too-conservative,view of the situa-
tion. Because of the ease of responding to thy questionnaire for persons
-having no instructional activity to report, the follow-up efforts directed to
non - respondents elicited primarily "no activity" reports. Presumably those
,-,ho did have instructional activities, and therefore had to fill'out a
questionnaire in detail, were less likely,to takel.he time to respond.
The procedures used for translating the statistics into estiliatee'for
_ the State -are preee ited intippendix F. All estimates are for the one-year
period from March, 1971 to March", 1973. The esamates are also based on
statistics which have been converted from theriaw data to take into account
the differential weights assigned to individuals with different numbers -of
reporting periods.
Selected Examples
Statistics pertaining to (a) the number of instructional activities,
(b) the number of instructor hours, (c) the number of student hours, and_
52 .N

(d) Aemographic characteristics of the students were translated into estimates
for post-secondary education in Wad State.' This sect4.on will present selected
1
,
findings for illustrative purposes followed by tables of supporting data.
Tables 3 - 8,present estimates concerning all instructional activities.
Estirates relating to instructor hours and student hours are provided In
'" Tables 9 - 12 and Tables 13 -.15 respectively. The -estimates-for demographic
items are found in Table 16. The interested reader is encouraged tb examine--
each table for other findings whicn may be0of interest and are not mentioned in
the narrative.
As for the number of post-secondary instructional activities provided.
in the State during the'period MArch, 1972 to March 1973, the data presented
can be used to examine the activities by various (a) purposes, (b) subject
matter areas, (c) prerequisites, (d) methods of communication used by the
instructor, (e) instructional modes used by the instructor, and (f) locations
where the activity took -place. Based on the statistics that were obtained, it
*4 estimated at more th-an.I7,5 marfon different instructional attivities--t
were provided by -secondary educational institutions in the State during. -\
the one-year_period,studied (table 3). The reader is reminded that an G
.
.
"instructional activity" involved AFertiod of time in which an instructor was "
gole
r-in cogtinuous contact with one or more learners. Thud, the number refers to
presentations,ttlasses, meetings, and personal conferences rather than to
courses, residential conferences, and programs.
,Other projected estimates concerning the number of instructional
activities included:
1. More than 16.5 million instructional activities took place in small-
groups (Table 6)
2. ApproMmitely 15 million instructionalTactivities took place in a college
or university facility (Table 8)
0
53
t.7

t More than 12 million instructional activities required 12 years of
schooling or more as a requisite for pArticiparion (Table 5)
4. More than instructional activities- involved academic or,
diploma credit (Table 3).
TABLE 3
ESTIMKTED NUMBER OF INSTRUCTIONAL ACTIVITIES-- IN DIFFERENT OBJECTIVE CATE IES
43
Percent of -
C1c1EIXadPhi2EtiEt.L--.1112E1SvitienEstimated Number_
(in thousands)
1 Academic diploma or degree (HighSchool Equivalency, B.A., M.S.,M.D., etc.) -51.97 9,110
2 General or vocational diploma 679
3 Certification or licensing as a6.48 1,137:,
4 General knowledge without regard todiploma,' certification, or degree.
requirementa 15.03 2,635
5 Individual or institutional problems' without regard to diploma,i /
certification, or degree.re,airements 12.34 2;163
nr'1,
6 Remedial oe-basic preparation withoutregard to diploma, certification,or degree requirements 6.88 1,206
7 Special or custodial education 3.40
Other 0.00 0
Total 99.97 17,527
54.

TABLE 4
ESTIMATED NUMBER OF INSTRUCTIONAL ACTIVITIESBY'SUBJECT-MATTER SUBCATEGORIES
Code
1
2
3
4;,7,.:-_
5t- 4.:
6
7
8
9
'0
11
12
13
14
15
16
17
18
19
C
2122
23
4950-
51'
Percent of Estimated Number
Subject I' ,'e- All Activities
Agriculture and Natural Resources 0.63
Architecture and Environmental Design 0.94
Area Studies 0.00
Biological Sciences 1.50
Business and Management 4.19,',"
e Communications 4.27
7.' Computer and Information'Science 0.00, 4cEducaxionEducation 3.40
- Engineering 4.20Fine and Applied Arts -8.54-
Foreign Language 0.68
Health'Professions 5.06
Home Economics 0.. C0
Law, 0.63
LeETers 30.38
Library Science 0.28
withematics 2.45
Military Science 0.00
Physical Science 2.61
Psychology 1.74
Public AffaIrstWnd Services 0.07
Social Sciences_ . 1.02
Theology 2.13
__1..97_____:___In terd i qc-iplthary-,-
Recreatic.'n , 14.55
Other 8.06
99.97
(in thousands)
111
166
\O263
735
749
0
596
736-1498
119
8870
Ill
5325
42430
0
471305
14
180
374
347_2551
1414
17527
55

r
45
TABLES
ESTIMATED NUMBER OF INSTRUCTIONALACTIVITIES BYYEARS OF SCHOOLING REQUIRED FOR PARTICIPATION
Years of Schooling Requiredfor Participatioi'
Less than a high school diploma
Completion of 12 grades of school
Completion of some college (1-3 years)
Completion of a baccalaureate ur advancedcollege degree
Total
56
Percent ofAll Activities
Estimated Numbertin thousands)
32.22 5,782
36.01 6,/:62
2,52314.06
99.98 17,942
57

TABLE 6
PERCENT AND ESTIMATED NUMBER OF INSTRUCTIONAL ACTIVITIES BY CATEGORYOF MEDIUM OF COMMUNICATION USED BY INSTRUCTOR
Percent of tVtimated Number
Code Medium of Communication All Activities (in thousands)
0 Writing an evaluation of perform-ance (e.g., instructionalcorrespondence)
Writing or designing instructionalmaterial 4.2
2 Broadcasting: Live TV-openreception
3 Broadcasting: Live TV-closedcircuit
4 Broadcasting: Recording TV tape fordelayed use
5 Broadcasting: Live audio-openreception
Broadcasting: Live audio-closedcircuit
7 Broadcasting: Recording audio materialfor delayed use
Filming
9 Addressing individuals face-to-face (alone or in groups)
0.6a
0.2
93.1
Total 100.0
--335
748
14
0
70
0
28
42
16 573
17,810
aData pertaining to the six broadcasting categories were clnsolidatedinto one category for computing the percentage statistic.
58

47
TABLE 7
PERCENT AND ESTIMATED NUMBER OF INSTRUCTIONAL ACTIVITIES BY CATEGORY
OF INSTRUCTIONAL MODE USED BY INSTRUCTOR
Code Instructional Mode
Percent ofAll Activities
Estimated NumberSin thousands)
0 No Response 1.1
1 Lecture, exposition or demonstration 26.8 4,770
2 Seminar, dialogue or discussion 26.4 4,687
3 Workshop, lab, or supervision ofexperiential learning 5.6 998
4 Combination of Lecture and Seminar 29.4 5,228
5 Combination of Lecture and Workshop 7.3 1,303
6 Combination of Seminar and Workshop 0.5 97
7 Combination of Lecture, Seminar,
and Workshop 2.8 499
Total 99.9 17,582
59SO

48
TABLE 8
,PERCENT AND ESTIMATED NUMBER OF INSTRUCTIONAL ACTIVITIES BY
PLACE OF ACTIVITY CATEGORIES
Code Place of Activity
Percent ofAll Activities
Estimated Number(in thousands)
0 Church or Synagogue 1.2 208
1 School, college, residentialschool, extension center 84.8 15,073
2 Federal, state, county, ormunicipal government facility 4.6 818
3 Cultural facility (non-governMent,non-profit) 0.9 166
4 Voluntary association facility 0.2 28
5 Commercial facility 0.0 0
6 Broadcasting facility 0.0 0
7 Labor union facility C.0 0
8 Place of business . 0.4 69
9 Private home 2.7 485
10 En route 0.0- 0
11 Other 5.Z 929
Total 1000 17,776
61

TABLE 9
ESTIMATED-NUMBER-WINSTRUCTCR HOURS EXPENDEDIN DIFFERENT CATEGORIES (lr OBJECTIVES
Code Type of Objective
Percent ofAll Time
1 Academic diploma or degree (HighSchool Equivalency, B.A., M.S.,
M.D., etc.)
Estimated Hoursin thousands)
54.76 15,\614
2 General or vocational diploma 2.73:, 781
3 Certification or licensing as a5.43 1,5rspecialist
4 General knowledge without regard todiploma, certification, or degree
requirements 13,16 3,754
5 Individual or institutional problemswithout regard to diploma, certifi-cation, or 4gtee requirements 12.20 3,481
Remedial or basic preparation withoutregard to diploma, certification,or degree requirements 7.84 2,237
7 Special or custodial education 3.83 1,094
8 Other 0 0
Total 99.95 28,511
49
Similarly, estimates of the amount of time spenf by instructors in
carrying out the instructional activities were computed. Table 9 shows that
approximately 28.5 million instructor hours were involved in the estimated
17.5 million instructional activities during the period from March, 1972 to
March 1973. More than 15.6 million hours were involved with academic degree
credit activities and approximately 10.5 million hours were devoted to four
62I

TABLE 10
'ESTIMATED NUMBER OF INSTRUCTOR HOURS EXPENDEDIN DIFFERENT SUBJECT-MATTER AREAS
Code Subject Matter"Percent ofAll Time
Estimated Hours(in thousands)
1 Agriculture and Natural Resources 0.82 222
2 Architecture and Environmental Design 1.07 291
3 Area Studies , 0.00 0
4 Biological Scivnces 1.20 326
5 Business and Management 5.43 1,472
6 Communications 3.49 945
7 Computer and Information Science 0.00 0
8 EducaIloh 7.40 2,005
9 Engineeri'llg 6.26 1,698
10 Fine and Applied Arts / 9.62 2,607
11 Foreign Language _ 1.68 45S
12 Health Professions 6.22 1,687
13 Home Economics 0.00' 0
14 Law 0.54 146
15 Letters 1 21.96 5,953
...-
16 Library Science - 0.08 21
17 Mathematics 1.81 490
18 Military Science . '0.00 0
19 Physical Science 2.64 716
20 . Psychology 2.10 570
21 Public Affairs and.Services 0.20 55
22 Social Sciences 0.90 24S
23 Theology . 3.26 884
49 Interdisciplinary 1.41 381
50 Recreation 10.84 2,939
5,1 Other 11.07 3.002___---
Total 100.00 27,110
e*,
63

51 .
TABLE 11
ESTIMATED NUMBER OF INSTRUCTOR HOURS EXPENDED BY YEARSOF SCHOOLING PREREQUISITE CATEGORIES FOR STUDENTS
.
Code'
Years of SchoolingRequired` for Participation
Percent ofAll Time
Estimated Hours(in thousands)
0 None 7.31 2,101
1-2 Completion of 8 grades of school 12.58 3,617
3 Completion of 9-11 grades of school 9.12 2,622
4 Completion of 12 grades of school 29.56 8,498
5-6-7 Completion of some college (1-3years) 23.43 6,735
8 Completion of 4 years of college 8.03 y 2;309
9 completion of an advanced collegedegree 9.94 2 859
ATotal 99.97 28,741
categories of non-credit instruction (Codes 4, 5, 6, and 7). Other estimates
pertaining to instructor hours included:
1. More than 25.8 million hours were involved with face-to-face groups
(Table 12)
2. Wr .ing or designing instructional material occupied 1.6 million hours
(Table 12)
3. More than 1 million instructor hours were devoted to each of eight subject-
matteraretls--Letters, Other, Recreation, Fine and- Applied Arts, Education,
Engineering, Health Professions. and Business and Management (Table 10)
4. More than 20 million instructional hours were spent in teaching students
'who had completed 12 years or more of school (Codes 4-9, Table 11).4
64

52
TABU 12
ESTIMATED NUMBER OF INSTRUCTOR HOURS EXPENDEDIN DIFFERENT MEDIA OF COMMUNICATION
Percent of Estimated Hours
bode Medium of Comunication All Time (in thoubands)
0 Writing an evaluation of performance(e.g., instructional correspondence) 2.50 714
1 Writing or designing instructionalmaterial 5;83 1,663
2-7 Broadcasting' 0.80 229
8 Filming 0.29 83
9 Addressing individuals face-to-face(alone or in group') Mat 25.822
Total 99'98
11
28,511
'Data pertaining to the six broadcasting categories /i.e., live TV--
open reception, live TV --closed circuit, tvcording,TV tape for delayed use,
live audio--open reception, live audio--closed circuit, recording audio
material for delayed use) were consolidated into one category for computing
the percentage and the estimated hours.
It was also possible to'obtain an estimate of the_number_of student ,
hours involved in the activities that were reported. These data were obtained
by multiplying the length of each instructional activity by the number of
activity parti ip is and translating these'statietics into estimates for the
State. The data pcksented in Tables 13 - 15 can be used to examine the total
number of student hours by various (a) objectives, (b) media of communication,
and (c) instructional modes.
The estimates for the State indicated that:
1. Approximately 182 million hours were invested by students in learning
activities during_ the pE Lod studied (Table 13)
65
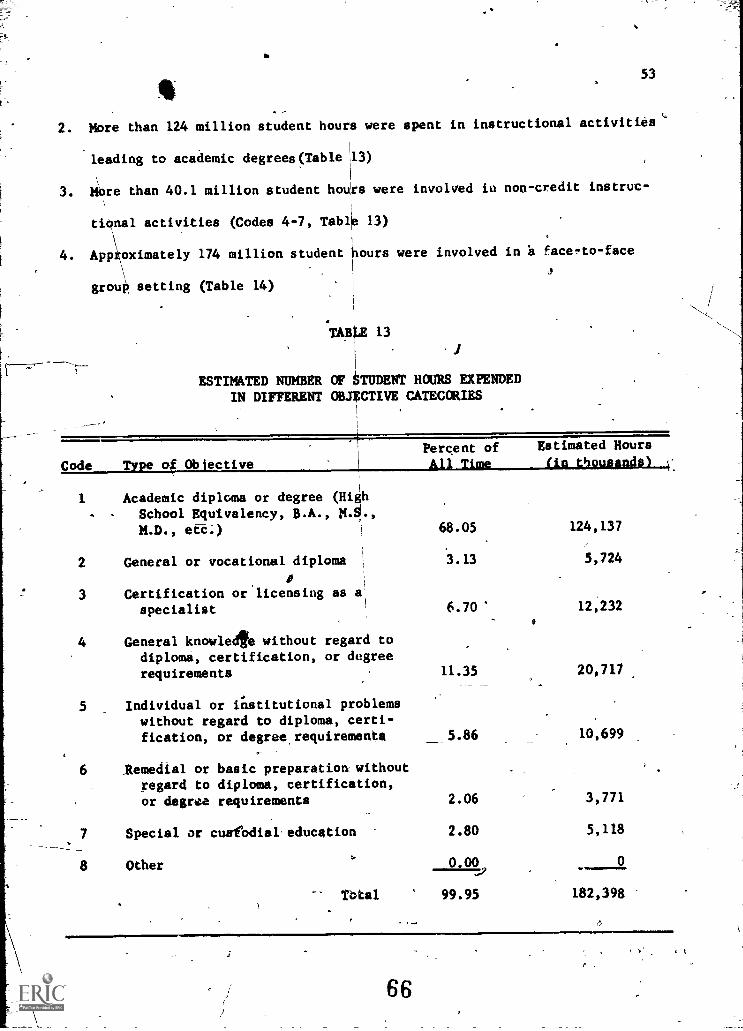
53
-
2. More than 124 million student hours were spent in instructional activities
leading to academic degrees (Table 13)
3. More than 40.1 million student bouts were involved in non-credit instruc-
tional activities (Codes 4-7, Table 13)
\ 1
4. Approximately 174 million student hours were involved in a face -to-face
1
group setting (Table 14)
TAI4 13J
ESTIMATED NUMBER OF $TUDENT HOURS EXPENDEDIN DIFFERENT OBJECTIVE CATEGORIES
Code Type o ObjectivePercent ofAll Time
1 Academic diploma or degree (HighSchool Equivalency, 8.A., M.S.,M.D., etc;)
2 General or vocational diploma
I
3 Certification or'licensing as Iv
specialist
4 General knowledge without regard todiploma, certification, or degree
68.05
3.13
6.70'
Estimated Hours
(in thqpsands)
124,137
5,724
12,232
requirements 11.35 20,717
5 Individual or institutional problemswithout regard to diploma, certi-fication, or degree,requirementa 5.86 10,699
6 _Remedial or basic preparation. without
regard_ to diploma, certification,or degree requirements 2.06 3,771
7 Special or cusfodial-education 2.80 5,118
8 Other 0.00 0
Total 99.95 182,398
66
6

54
TABL114
ESTIMATE D NUMBER OF "STUDENT HOUR§EXPENLIED.IN DIFFERENT MEDIA OF COMMUNICATION
4'
Pdrcent of Estimated HoursCode Medium of Communication
- All Time ...fin thousands)
0 Writing an evaluation of performance(e.g., instructional correspondenv) 0.58 1,054
1 Writing dr designing instructional'material 2.69 4,911
2-7 Broadcasting'. 1.27 2,309
8 Filming 0.03 55
9 Addressing individuals face-to-face(alone or in groups) 95.43 174,068
1
Total 100.00 182,397
"Data pertaining to the six broadcasting categories (i.e., live TV --
open reception, live TV-- closed circuit, recording TV tape, for delayed use,live audio--open reception, live audio-' - closed circuit, recording audio
material for delayed use).-were consolidated into one category for computing_purposes.
5. M ore than 40 million student hours were spent in each of three modes of
indtruction: (a) lecture /seminar combination, (b) seminar, and (c) lecture
(Table 15).
The responding instructors also provided descriptive information about
the/persons who had participated in their instructional activities. In cases
where it was not possible to provide accurate statistics, the instructors were
asked to estimate the numbers of different individuals by categories of age,
race, sex, ae.d prior years of schooling completed. Thus, the reader should
know that the following statistics are based on, in some cases, the beet esti-
?'
mates'ofcthe instructors rather than on actual tuMbere. While some degree ob,
641

a
4
TABLE t5
ESTIMATED NUMBER OF STUDENT HOURS EXPENDEDIN DIFFERENT MOUES OF-JitriSTAUCTION
55
Code Mode of InstructilnPercent ofAll Time
Estimated Hours(in thousandkl__
.. .
1 LeCturi, exposition, or demonstration 24.55, 44,777
2 ' Seminar, dialogue, or discussion ' ''----25.21.
45,975-
3 Workshop, lab, or supervision ofexperiential learning 8.37 15,274
.4. Combi4tton of Lecture and eminar 26.51 48,350 -
: 5Comeination of Lecture and rkshop 10.14 18,07
6 Combination of Seminallin4 Workshop , 0.85 1,558
7 'Combination Olt:cture; Seminar,and Workshop 4.37 7,966
Dotal 100.00 182,397
error was in Olved, it was felt that the estimates could be use( since some
1
people tend overestimate while others tend to underestimate. Thus, errors
in judgment would be ran oily distributed with the result that th..y tend to
'cancel the effects of'each'other.
The estimates for the total population are given ip Table 16. It
should be noted that each instructional activity-represents a single, continu-
ous contact between_aVinstructor and one or more'learners.
tional college course would consist of several instructional activities
distributed over a period of time.
Cossiderfng(afl activities" provided by colleges ASA
universities in New York State during the period from March, 1972 to March,
1973, it was estimated that:
68

56
TABLE 16
ESTIMATED NuMBER OF PAWICIPANTS IN ALL INSTRUCTIOI1AL ACTIVITIES'BY DEMOGRAPHIC CATEGORIES
(in thousands)
A
mate Female
125,396 9,,011
American1ndmh
4.30
AmericanOriental Amer 'cap
2,6901 14,948
17 -24 25 34
Spanish
SuenmmW
7,1-9
35 44
GitI( i, art Other
181,80611111.
4,479
411 54 55
65 andover
155,210
K -7
4,229
25,390 10,386 4,423 1,830
8
763
9 11 12
114,075 70,193
13 14 15 16 L.rer 16
80,565 16,404 28,094
'The estimated nuliber of ?articipaits was based on reported data. The
totals for the different variables may not coincide because missing data werenot,replaced by estimates but were computed as zeroes.
`Information explaining why persons under 17 years of age were parti-cipating in post-secondary instructional activities was not obtained.
1. Approximately 222.4 million persons took part in a total of 17.5 million
instructional activities
The participants involved approximately 125 million men .--K1 97 million
women
More than 181 million of the participants were Caucasian as contrasted to
30 miliion non-Caucas an participants
69

57
4. Only f.2 Million of the participants were 45 c..e of age or older
5. The over -65 age group was represented by only 111,000 persons
6. The number of participants with no previous schooling was estimated to be
almost 3 million; 28 milliokparticipants had completed more than 16 years
of school
7. More than 195 million of the students had completftd 12 or more years of
school.
Descriptive Statistics
For samples of numerical data, familiar descriptive statistics are
used b"...cause they happen to be simple and useful.- Their utility lies in their
capacity for summarizing large nmounts of data into a particular numerical
value. Descriptive statistics, therefore, are sSlected on the basis of what
they tell add what the writer Wishes to communi4te about a given sample of
numerical data.
The two statistics selected for summarizing the data wer (a) pro-
portions, and (b. cross-tabulation summations and \proportions. Proportions were
useful in defining the relative location of a particular numerical value within
the total set of data. Their use is limited only by, the accuracy of the sample.
Selected Examples of Findings Using Percentages
the
In the previous section,'Tables 3-15 preseatf data which indicated
.portion of each subcategory of the total category In examining these
data, it is possible to note that;
1. instruction r activities involving academic .:relit comprisei a majority
(almost 52 percent) of all post- secondary instructional\ activities (Table 3)
70

58
2. More than ne-third of all instructional activities, however, addressed
non-credit ob'ectives (Codes 4, 5, and 6, Table 3)
3. As for subject-matter, the largest percentage (30 percent) of the activities
was offered in Letters (including speech, philosophy, linguistics) (Table 4)
4. The other subject-matter areas most likely to be included were, in descend-
ing crder: Recreation (14 peretnt); Fine and Applied Arts (8.5 percent);
OtMbr subjects that respondents did not classify in the categories' (8
percent); Health Professions (5 percent); Communications (4 percent);
Engineering (4 percent); Business and Management (4 percent); and Education
(3 percent) (Table 4)
5. Approximately one-third (32 percent) of the activities were., available to
persons who had completed less than twelve grades of school (Table 5)
6. The face-to-face group was clearly the dominant medium of instruction,
since it was used in 93 percent of all instructional actives_Cralle,6)_
7. Three instructional modes, were used almost equally--lecture/discussion
(29 percent), lecture (26 percent), and discussion (26 percent) (Table 7)
8. Approximately 15 percent of all instructional activity was held outside
college and university facilities. Government and other facilities (each
5 percent), private homes (3 percent), and churches (1 percent) were the
non-college facilities most used (Table 8)
9. While the Letters subject-matter area accounted for approximately 30 per-
cent of all instructional activity, less than 22 percent of all instructor
time was involved (Table 10)
'The reasons for this large number of subject-matter classifications
as "Other" are unknown. The claesification scheme may have lacked sufficientcategories for some while being too complex for other respondents.
71
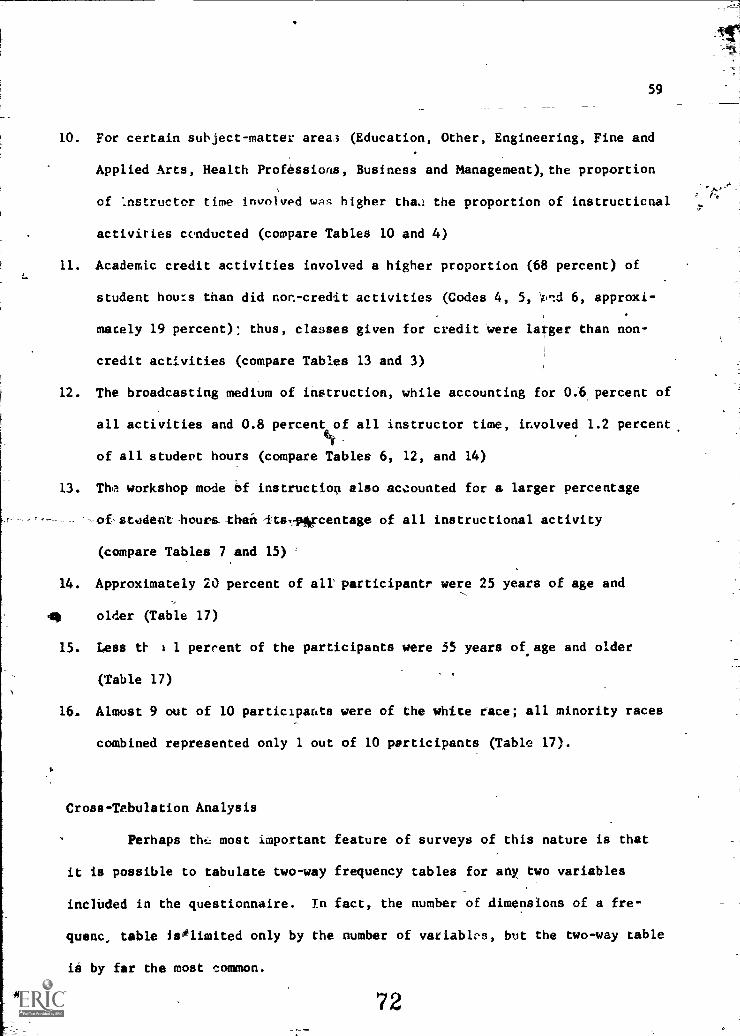
59
10. For certain subject-matter area; (Education, Other, Engineering, Fine and
Applied Arts, Health Professions, Business and Management), the proportion
of Instructor time involved was higher tha.1 the proportion of instructional
activities conducted (compare Tables 10 and 4)
11. Academic credit activities involved a higher proportion (68 percent) of
student hou:s than did non-credit activities (Codes 4, 5, Ibnd 6, approxi-
macely 19 percent); thus, classes given for credit were larger than non-
credit activities (compare Tables 13 and 3)
12. The broadcasting medium of instruction, while accounting for 0.6 percent of
all activities and 0.8 percent of all instructor time, involved 1.2 percent,
of all student hours (compare Tables 6, 12, and 14)
13. The workshop mode of instruction also accounted for a larger percentage
-ofstodent-hours.-taraii Itsrftrcentage of all instructional activity
(compare Tables 7 and 15)
14. Approximately 20 percent of all' participantr were 25 years of age and
44 older (Table 17)
15. Less tF 1 percent of the participants were 55 years of. age and older
('Table 17)
16. Almost 9 out of 10 participants were of the white race; all minority races
combined represented only 1 out of 10 participants (Table 17).
Cross - Tabulation Analysis
Perhaps th:, most important feature of surveys of this nature is that
it is possible to tabulate two-way frequency tables for any two variables
included in the questionnaire. In fact, the number of dimensions of a fre-
quent, table is*limited only by the number of variables, but the two-way table
is by far the most common.
72

60
TABLE 17
DEMOGRAPHIC CHARACTERISTICS OF ALL PARTICIPANTS INALL POST-SECONDARY INSTRUCTIONAL ACTIVITIES
(in percentages)
Male Female
56.4 43.6
Ras.oai
Group
Age
C.
1
American AmericanIndian Oriental
0.2 1.3
Under 17 17 - 24
9.7 71.0
Nara K - 7
1.3 1.9
Prior Veersof Schaaf
fnmplitted
Black SpanishAmerican Surnamed Caucasian
7.1 3.4 86.0 2.1
28 34 35 - 44 45 -_54
11.6 4.8
65 - 8446 andOiler
2.0 0.8 0.1
8 9 - 11 12
0.4 6.5 32.3
13 - 14 15 - le
37.1 7.6 12.9.1N
lInformation explaining why persons under 17 years of age were partici-pating in post-secondary instructional activities was not obtained.
The preceding sections have focused on the percentages of, and popu-
latinn estimates applicable to, the\subcategeriel of single variables (i.e.,
objective, plaza of activity, subject-matter, etc.). In Tables 18-29, the data
are arrayed in matrices so that the data can be analyzed in terms of two
variables.
The findings are presented as proportions and population estimates so
that it will be possible to obtain specific answers. The following examples
are circled in the table f ,icated to illustrate how the data can be used:
73

61
(a) acre than 5_percent of all instructional activity was non-credit instruc-
tion in the area of Fine and Applied Arts (Table 18); (b) more than 46 percent
of all instructional activity occurred in a face-to-face group getting and
addressed-academic degree objectives Table 21); (c) there were approximately
5.8 million non-credit instructional activities (Table 22) provided to face-to-
face groups in the State during the period of March, 1972 to March, 1973; and
(d) the lecture/discussion mode of instruction addressing academic degree
objectives accounted for over 18 percent of all instruction activities
(Table 26).
The data pertaining to purpose and subject-matter of all post-secondary
instructional activity are displayed in -ablas 18-19. Instructional activities-
addressing academic objectives in Letters comprised the largest single pro-
portion (22 percent), followed by non-credit general knowledge instruction in
Recreation (9 percent), remedial instruction in Letters (5 percent), and
academic degree instruction in Engineering and the Health Professions
percent). The translation of.these proportions into estimates of the total
number of instructional'activities in the State is shown in Table'19.
A two-way frequency tabulation for these same variables in terms of
all instructor time is shown in Table 20. The proportion of.all instructor_
time in some areas exceeded the number of all instructional activities in those
areas. For example, more than 3.5 percent of all instructor time was devoted
to academic credit and to pen-credit specific knowledge instructional activ-
ities in Education. In terms of the,tutal nualber of instructional activities,
these two subcategories accounted for 1.6 and 1.5 percent of the activities
provided (Table 18). Other subject-matter/objective categories in which the
proportion of instructor Arne exceeded the proportion of instructional ;cti-
vities conducted included: (a) academic credit activities in Business and
74

75
TABLE 18
PERCENT OF ALL INSTRUCTIONAL ACTIVITIES CLASSIFIEDBY SUBJECT-MATTER AREA AND OBJECTIVE CATEGORIES
----_:-- Objective Addressed by InstructorTotal Percentof all
instructionalActivities
Subject-Matterof Instruttion Degree Diploma
Certification
GeneralKnowledge
SpecificKnowledge Remedial
SpecialEducation
iAgriculture 0.0 0.0 0.0 0.6 0.0 0.0 0.0 0.6Architecture 0.8 0.0 0.2 0.0 0.0 0.0 0.0 1.0
,Area Studies 0.0 0.0 0.0 _ 0.0 0.0 0.0 0.0 0.0Bic Science 1.3 0.0 0.1 ,- -0.0 _ 0.1 0.0 0.0 1.5Bus/Mgmt 3.7 0.2 0.0 0.1 6.2 0.0 0.0 4.2Communication 1.7 1.9 0.0 0.2 0.3 0.1 0.0 4.2Computer 0.0 0.0 0.0 0.0 0.0 0.0 0.0 0.0Education 1.6 0.0 0.3 0.0 1.5 0.0 0.0 3.4Engineering 4.2 0.0 0.0 0.0 0.2 0.0 0.0 4.4Fine/App Arts 2 3.7 0.0 1.6 3.5 0.0) 0.6 8.5For Language 0.5 0.0 0.0 0.0 0.6 0.0 0.0 1.1Health Prof 4.0 0.0 0.9 .0.0 0.1 0.0 0.0 5.0Home Ec 0.0 '-0.0 0.0 0.0 0.0 0.0 0.0 0.0Law 0.6 0.0 0.0 0.1 0.0 0.0 0.0 0.7Letters 22.2 0.0 0.9 0.6 1.6 5.1 0.0 30.4Lib Science 0.0 0.2 0.0 0.0 0.0 0.0 0.0 0.2Mathematics 1.8 0.5 0.0 0.0 OA 0.0 0.2. 2.5Mil Science 0.0 0.0 0.0 0.0 0.0 0.0 0.0 0.0Phy Science 2.7 0.0 0.0 0.0 0.0 0.0 0.0 2.7Psychology 0.8 0.0 0.0 0.9 -0.0 0.0 0.0 1.7Pub Affairs 0.1 0.0 0.0 0.0 -- 0.0- 0.0 0.0 0.1Svc Science 0.6 0.4 0.0 0.0 0.0 0.0 0.0 1.0Theology 0.6 0.0 0.0 0.6 0.9 0.0 0.1 2.2Interdis 1.04 0.0 0.0, 0.6 0.Q 0.0 1.9Recreation 0.0 0.0 1.9 9.3 2.5
- 0.0 0.9 14.6Other 1.7 0.0 2.1 0.7 0.2 1.7 1.7 8.1
-Total Percentof all Instruc-tional Activities 52.,0 3.9 6.4 15.0 12.3 6.9 3.5 1.00.0
76
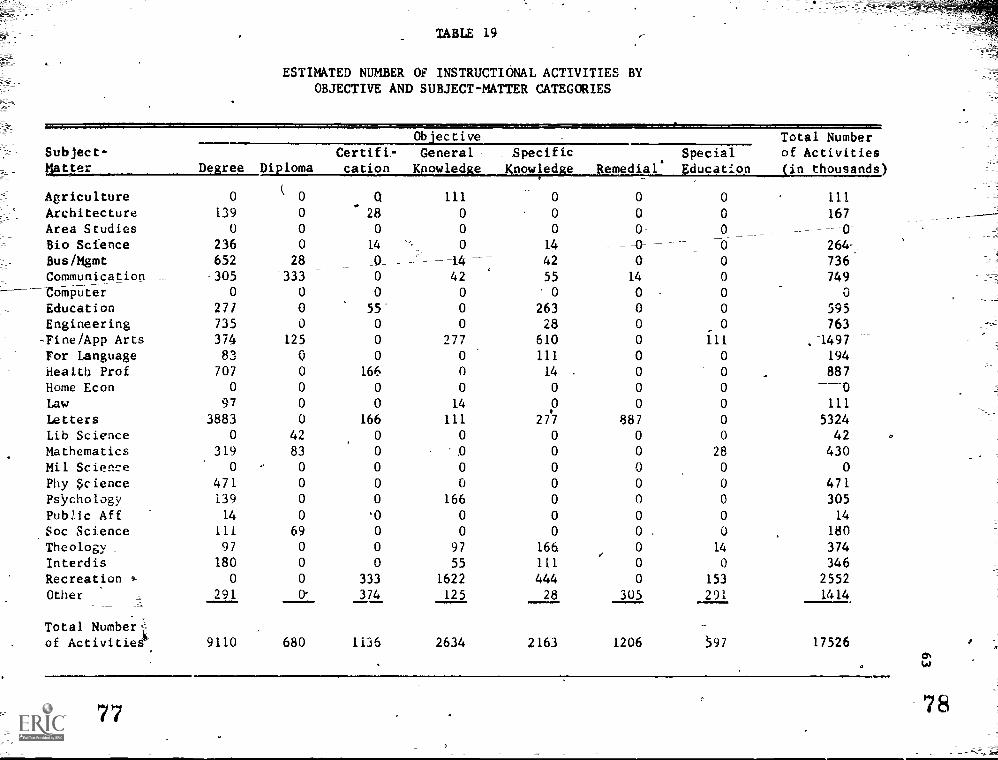
TABLE 19
ESTIMATED NUMBER OF INSTRUCTIONAL ACTIVITIES BYOBJECTIVE AND SUBJECT-MATTER CATEGORIES
Objective Total NumberSubject- Certifi- General Specific Special of ActivitiesMatter De ree D loma cation K led e Knowled e Remedial. Education in thousands
Agriculture 0(
0 111 0 0 0 111
Architecture 139 0 28 0 0 0 0 167
Area Studies 0 0 0 0 0 0 0_ -0-
Bio Science 236 0 14 0 14 -Al 0 264
Bus/Mgmt 652 28 _0_ ---I4 42 0 0 736
Communication 305 333 0 42 55 14 0 749
--Computer 0 0 0 0 0 0 0 0
Education 277 0 55' 0 263 0 0 595
Engineering 735 0 0 0 28 0 0 763
-Fine/App Arts 374 125 0 277 610 0 111 -1497
For Language 83 V 0 0 111 0 0 194
Health Prof 707 0 166 0 14 0 0 887Home Econ 0 0 0 0 0 0 0Law 97 0 0 14 0 0 111
Letters 3883 0 166 111 277 887 0 5324Lib Science 0 42 0 0 0 0 0 42
Mathematics 319 83 0 0 0 28 430Mil Science 0 0 0 0 0 0 0 0
Phy $cience 471 0 0 0 0 0 0 471Psychology 139 0 0 166 0 0 0 305
Pubac Aff 14 0 0 0 0 0 14
Soc Science 111 69 0 0 0 0 . 0 180
Theology 97 0 0 97 166 0 14 374
Interdis 180 0 0 55 111 0 0 346Recreation 0 0 333 1622 444 0 153 2552Other 291 374 125 28 305 291 1414
Total Number.:-
of Activities 9110 680 1136 2634 2163 1206 X97 17526
77

TABLE 20
PERCENT OF ALL INSTRUCTOR HOURS BY OBJECTIVE'AND SUBJECT-MATTER CATEGORIES
Subject-Matter
. Ob ective Total Percent-of All Inetruc-'tor Hours'Degree Diploma
Certifi-cation;
GeneralKnowledge
SpecificKnowledge Remedial
SpecialEducation
Agriculture 0.0 0%0 0.0 0.8 0.0 0.0 0.0 0.8Architecture 0.9 0.0 0.1 0.0V 0.0 0.6 0.0 1.0
Area Studies 0.0 '3.0 0.0 0.0 0.0 0.0 0.0 0.0Bio Science 1.1 0.0 0.1 0.0 0.1 0.0 0.0 1.3
Bus/Mgmt 4.7 0.3 0.0 0.1 0.3 0.0 0.0 r 5.4Communication 1.5 1.3 0.0 0.5 0.2 0.1 0.0 3:6Computer 0.0 0.0 0.0 0.0. 0.0 0.0 0.0 0.0
Education 3.6 0.0 '0.3 0.0 3.5 0.0 0.0 7.4
Engineering 6.1 0.0 0.0 0.0 0.2" 0.0 0.0 6.3Fine/App Arts 3.7 0.6 0.0 1.2 3.0 0.0 1.1 9.6
For Language 0.3 0.0 0.0 0.0 1.3 0.0 0.0 1.6
Health Ptof 5.2 0.0 1.0 0.0 0.1 0.0 0.0 6.3Home Econ 0.0 '0.0 0.0 0.0 0.0 o.6 0.0 . 0.0
Law 0.4 0.0 0.0 0.2 0.0 0.0 0.0 0.6
Letters . 15.8 0.0 0.9:,: 0.5 1.0 3.7 0.0 21.9
Lib Science 0.0 0.1 0.0 0.0 0.0 0.0 0.4 0.1
Mathematics 1.5 0.2 0.0 0.0 0.0 0.0 0.1 1.8
Mil Science 0.0 0.0 0.0 0.0 0.0 0.0 0.0 0.0
Phy Science 2.6 0.0 0.0 0.0 0.0 0.0 0.0 2.6Psychology 1.1 0.0 0.0 1.0 0.0 0.0 0.0 2.1
Public Aff 0.2 0.0 0.0 0.0 0.0 0.0 0.0 0.2
Soc Science 0.5 0.4 0.0 0.0 0.0 0.0 0.0 0.9
Theology 1.4 0.0 0.0 0.7 1.1 0.0 0.1 3.3
Interdis 9.6 0.0 0.0 0.4 0.4 0.0 0.0 1.4
Recreation 0.0 0.0 1.2 7,.6 1.5 0.0 0.5 10.8
Other 1.3 0.0 2.1 1.0 0.2 4.5 2.0 11.1
Total Percentof All Instruc-tor HOurs 52.5 2.9 5.7 /4.0 12.1) 8.3 3.8 100.1

Management, E
65
interlog, Fine and Applied Arts, and the health Professions;
and (b) remedial or basic Oieparation activities in "Other" subject-matter ,
A
areas.
I
The data,pertainihg to a cross tabulation'of instructional activities
iK
, .
.
by ot ective and'1fnedium_A communication are shown in Tables 21-22. Probably .
the most striking Oncl4sion is the exclusive use of one method of communicatiori-/
(face7to-face communication in a group) Aor instructional activities in four
objective categories. The translation of the proportions into estimates of the,
number of instructional activities by medium of communication is shown in
Table 22. When instructor time is analyzed in terms of these'same two vari-
ables, the face-to-face group involved 90 percent of all instructor.time
----- (Table 23).
TABLE 21
PERCENT OF INSTRUCTIONAL ACTIVITIES CLASSIFIEDBY OBJECTIVE AND METHOD
Medium of Communication Total Perce6t
Type of Written Broad- of Instruction-
Objective Evaluation Design cast' Film Group al Activities
Academic Degree 1.6 3.8 . 0.5 0.2 52.4( 46.3 )
Voc/Gen Diploma 0.0 -------1 0.1 0.2 0.0 3.6 3.9
Certification 0.0 , 0.0 0.0 \\0.0 6.4 6.4
Gen Knowledge 0.0 0.0 0 0.0 14.8 14,8
Spec Knowledge 0.3, 0.3 0.0 020 11.5 12.1 1
Remedial 0.0 0.0 0.0 0.0 6._8. 6.8
Special Education 0.0 _ 0.0 0.0 0.0 3.6 3.6
Totallercent ofInstr6ctionalActivities 1.9 4.2 0.7 0.2 93.0 100.0
1Data pertaining to six broadcasting subcategories were consolidated
in one category.
81

TABLE 22
ESTIMATED NUMBER OF INSTRUCTDNAL ACTIVITIES BY OBJECTIVEArT) METHOD OF CCHMUIIICATION CATEGORIES
Medium of Communicatior.
Live 4- Live Live Live Re- To'.41 Number
Type of Written TV TV TV Audio Audi- cord- of Activities
Objective Eval ])tsign__.2perEL Film Group (in thousands)
Academic Degree 280 679 14 0 70 0 0 0 42 8281 9366
Voc/Gen Diploma 0 14 0 0 0 0 28- 0 0 641 683
Gertificaeio4 0 3 0 0 C G 0 0 0 1137 1137
Gen Knowledge 0 0 0 0 0 0 0 0 0 26262626
Spec T:now!edge 55 5s 0 0 0 r ') 0 0 0 204 2154
Remedial 0 U 0 O. 0 0 G 0 .,-.) 1202 1202
Special Educ 0 0 0 0 G 0 a--_ 0 0 642 642---
Total Numberof 335 748 14 0 70_ 0 78 0 41 16573 17810

TABLE 23
PERCENT OF ALL INSTRUCTUR HOURS BY VECTIVEAND MEDIUM OF CCHMUNICATION CAT DRIES
61
''''.====g1=111=17111111M2IMMedium of Communication Total Percent
Type ofObjecti.ve
WrittenEvaluation Design
Broad-cast' Film *Troup
of All Instruc-for Hours
Academic Degree 2.3 5.5 0.5 0:3--- 46.1 54.7Voc/Gen Diploma 0.0 0.0 ,0.3 0.0 2.4 2.7Certification 0.0 0.0 0.0 0.0 5.4 5.4Gen Knowledge ' 0.0 0.0 0.0 0.0 1,10. 13.2Spe. Knowledge 0.2 0.3 0.0 0.0 11:7 12.2
Rediedial 0.0 0.0 0.0 0.0 7.8 . 7.8.Special Education 0.0 0.0 0.0 0.0 3.8 3.8
Total Percent ofAll InstructorHours 2.5 5.8 0.8 0.3 90.4 99.8
'Data pertaining to the broadcasting media were consolidated into one-category.
An analysis of the data about objective and place of instruction shows
c at instructional activities for all-objectives occurred primarily in a
college or school facility (Table 24). Almost 47 percent of all instruction
was concerned with academic degree objectives and occurred in a college or
3cbool. However, 3 percent of all instruction for academic degree purposes
took place in a government facility. As for non-credit general knowledge and
apecific knowledge instruction, the college or'school facility (including resi-
dential and extension centers) was the primary location of Instruction for all
objective categories. The corresponding e:tiMates of instructional activities
in the Stdce by location are given in Table 25.
A cross tabulation o; instructional activities by objective and mode of
instruction is shown in Table 26. Academic instructional activities utilizing
the lecture/discussion combination mode.a,:counted for the 'argest single
84 4

TABLE 24
PERCENT OF ALL INSTRUCTIONAL ACTIVITY CLASSIFIED BY OBJECTIVE
AND PLACE OF ACTIVITY CATEGORIES
Place of ActivityBroad- En
/110smo
Total Per-cent of All
Instruction-Coll/ Vol Comer-
Objective Church Univ Govt Cult Assn cial cast Labor Bus Home Route Other )" Acttaa
A6a4emic Degree 0.2 46.7 3.0 0.0 0.0 0.0 0.0 u.0 0.0 '1.7 0.0 0.7 52.3
Voc/Gen Diploma 0.0 3.8 0.0 0.0 0.0 0.0 0.0 0.0 0.0 0.0 .0.0 0.0 3.8
,lrtification 0.0 5.4 1.0 0,0 0.0 0.0 0.0 0.0 0.0 0.0 0.0 0.0 6.4
Gen J...owledge 0.5 8.6 0.2 0.3 0.0 0.0 0.0 0.0 0.4 0.4 0.0 4.4 14.8
Spec Knowledge 0.3 10.4 0.1 0.6 0.2 0.0 0.0 0.0 0.0 0.6 0.0 0.0 12.2
Remedial 0.0 6.8 0.0 0.0 0.0 0.0 0.0 0.0, 0.0 0.0 0.0 0.0 6.8
Special Educ, 0.1 3.1 0.2 0.0 0.0 0.0 0.0 0.0 0.0 0.0 0.0 0.2 3.6
Total Percentof All Instruc-tional Activity 1.1 84.8 4.5 0.9 0.2 0.0 0.0 0.0 0.4 2.7 0.0 5.3 99.9
3586

TABLE 25
ESTIMATED NUMBER OF INSTRUCTIONAL ACTIVITIES BY OBJECTIVEAND PLACE OF ACTIVITY CATEGORIES
Place of Activity Total Numberof ActivitiesColl/ Vol Commer- Broad- En
Objective Church Univ Covt Cult Assn cial cast Labor Bus Home Route Other (in thousands)
Academic DegreeVoclGen Diploma
420
0
.8306
679541
0
0
00
0
0
0
0o-
0
0
0
0
305
0
W0
125 93190 679
Certification O. 951 180 0 0 0 0 0 0 0 0 0 1137Gen Knowledge 97 1525 42 55 0 0 0 0 69 69 0 777 2634-Spec Knowledge 55 1844 14 111 28 0 0 0 0 111 0 0 2163Remedial 0 1206 0 0 0 0 0 0 0 '0 0 0 1206Special Education 14 j.55 42 0 0 0 0 0 0 0 28 639
Total Number ofActivities(in thousands) 208 15072 819 .166, 28 0 0 0 69 485 0 930 17777
G.
87 88 `73

.t.
ATABLE 26
PERCENT OF INSTRUCTIONAL ACTIVITY CLASSIFIED BY OBJE'l-PIVE
AND MODE OF INSTRUCTION CATEGORIES
Mode of Instruction 'Total Percent
Type of Lecture/ Lecturef-Discuss/ Lect /Disc/ of Instruction -
Objeclive Other Lecture DisLiss_iarkshop Discuss Workshop Workshop Workshop al Activity
Academic Degree 0.8 10.0 13.8 4.3 LILO . 2.7 2_00 2.1, 52.5
Voc/Gen Diploma 0.0 0.0 3.0 0.2 0.6 0.0 0.0 0.0 3.84
Certification 0.0 1.9 1.7 0.2 h.9 0.5 0.2 6.4
Gen Knowledge 0.0 10.2 1.6 0.4 2.1 0.0 0.0 0.5 14.8
Spec Knowledge 0.3 4.8 2.3 0.0 1.7 3.1 0.0 0.0 12.2
Remedial 0.0 0.P 2.9 0.0 3.9 0.0 0.0 0.0 6.6
Special Education 0.0 0.0 1,0 0.6 0.7 1.0 0.2 0.0 3.5
Total Percentof Instructional
Activity 1.1 26.9 26.3 5.7 29.4 7.3 0.5 2.8 100.0
8990
't
0

71
percentage (18) of all activities. The discussion mode for academic degree
purposes accounted for almost 14 percent of all Instruction The lecture 'mode
was used primarily for academic degree and non-credit general knowledge ub-
jactives; each category comprised more than 10 percent of all instruction.
The translation into population estimates is displayed in Table 27. These same
two variables were also analyzed in terms of all student hours spent in post-
secondary instructional activity. The proportions and estimates are shown in
TABLE 27
ESTIMATED NUMBER OF INSTRUCTIONAL ACTIVITIESBY OBJECTIVE AND INSTRUCTIONAL MODE
-1"...Instructional Mode Estimated
r.c "c- W-r-k- 7-ct/ T-cLiDiac/ Numb-°r. (in
TlhjectiAe ture cuss shop Disc Wksp Wksp Workshop thousands)
Academic Degree 1775 2454 763 3286 471 55 374 9178Voc/Gen Diploma 0 541 28 .111 0 0 0 680Certification 333 305 28 333 97 0 42 1138 ,
Gen Kr.owledge 1817 291 69 374 0 Q 83 2634Spec Knowledge 846 402 0 305 555 0 0 2108.ReMediall 0 513 -0- 693 0, 0 0 1206
Spezial Educ 0- 180- 111 125- 180 42 0 638
Estimated Number(in thousands) 4771 4686 999 5227 1303 97 - 499 17582
0
Tables 28 and 29. Whereas the lecture/discussion mode_for.academic objectives
1
had the largest percentage of instructional activitiy more student hours
were spent in lecture (21 percent) and discussion (17 percent) than in IdCture/
discussion (16 ptrcent) in pursuit of academic credit objectives. The dis-
cussion and lecture/discussion modes are, however, used kore for non-credit
general knowledge anti .,pecific knowledge objectives than is. the lecture.
91

72
TABLE 28
PERCENT OF ALL STUDENT HOURS BY OBJECTIVEAND INSTRUCTIONAL MODE CATEGORIES
Instructional Mode Total Per-cent of All
oursType ofOb'ective
Lec-ture
Dis-cuss
Work-sho
Lect/Disc
Lect/Wkss
Disc/Wks
Lect/Disc/Worksho.
Academic Degrez` ---,; Voc /Cen Diploma
CertificationGen KnowledgeSpec KnowledgeRemedialSpecial Educ
Total Percentof All Hours
21.30.00.22.01.0'
0.00.0
17.3
0.2
0.33.81.8
0.41.,
4.81.0
0.51.6
0.00.0
0.4
8.3
16.1
1.9
0.2
3.62.9
1.7
0.1
3.8
- 0.05.40:00.1
0.00.8
0.80.00.00.00.00.0
60.1
4.00.00.1
. 0.30.0OA0.0'
68.13.16.7
11.3
5.82.12.8
99.24.5 25.2 26.5 10.1 0.9 4.4
TABLE 29
ESTIMATED.NUMBER OF STUDENT HOURS FOR ALL INSTRUCTIONAL ACtIVITYBY OBJECTIVE AND INSTRUCTIONAL MODE CATEGORIES
Type of 1(objective
-k-
shop
:: 'tctional Mode Total Esti
-Lec-
ture
Dis-cuss DisF.
Lect/Wksp
Disc/Wksp
Lect/Disc/Workshop
mated Number(in thousands)
Academic De,gree 38892 ; 86\ 8724 29356 6882 1465 7332 124137
Voc/Gen Diploma 0 431 1768 '3524 0 , 0 0 5723
Certification 305 494 971 455 9915 , 0 92 12232
Gen Knowledge 3707 4939 2994 6535 0 0 542 20717
Spec Knowledge ;1873 3257. 0 5322 247 0 0 10699
_ Remedial 0 728 0 3043 .0 0 0 3771
Special Educ , C 2640 818 116 1452 92 0 5118
EstimatedNumber (inthousands) 44777 45975 15275 4835.1 18496 1557 7966 182397
92
//
/.
//
Ilse of Alternative Definitions del"
ft0°LliIainiteU0124.
6.
be previous sections reported the results from using various statisti-
?1 i
cal t hniques for analyzing the data. Examples of summary statistics and
estimates for post-secondary instructional activity in the State were gi(icn./
The third technique for analyzing the data involved different cOnoep-
Lions of post-secondary continuing education. Again, summary statistics and. 6
estimates for the State wiLi be used\
to provide descriptive data, about different/
definitions of post-secondary continuing education and to compare and contrast
continuing education activity with_all post-secondary instruction.
The clear-cut distinction between what is adult and continuing edu-
cation and what is not in colleges and universities is probably more blurred at-e
this point in time than in any previous point in history. One reason is that
the concept of "adult" is changing. OL: can now be _legally consIdeted an adult'
at the age of 18, whereas it was 21 only a few-years ago. Also, during the .
- late 19601s and early 1970's, colleges discarded the In loco parentis concept
and acknowledged (11-time residential undergraduate studedti`is adults. Thus,
most participants in post-secondary educational programs are now legally con-
sidered AS adults.
A second reason -why college and university continuing .education and
other university education programs are losing their distinct 'identities is
the emergence of flexible organizational arrangements and non-traditional study
programs. Tk- education of adults and youth in Colleges,and universities now
involves both groups on a full-time and.part-Ome basis, on a credit and non-,
credit basis'? in ,day and evening programs, in resiuential-and in off-campus
programs, and in the continu ng education division of the university and often
all other units of the university as well.
.93
74
t
Traditionally, degree-credit programs for full-time studentb-during
the day was the domain of university "youth" education. Now, adult students are
returning to participate full-time in degree programs, aid may "youth" take
courses during the evening hours as part of their academic program.
The domain of University Extension once consisted of the pattr-time
degree-credit student, and the Eton- credit student. Untversity Colleges_
developed for the adult studentnow attract many full-time students in their
courses. The Graduate School and the professional school increasingly-have had
to accommodate a growing ntimber of master's :Ind doctoral students who take
courses on a part-time basis. Also, all university units tend to engage in
some form of non-credit istructional activity, if only an occasional lecture
. series. Many sponsor,confereices and_short courses as well.
The project teemibegan initially with the following definition of
post-secondary cdntinuinigeducaLion:-
. Post - secondary cohtinuin&_education is considered to be anyand all activities of an'education nature engaged in by other thanfull-time undergraduate and graduate students who are traditionally
enrolled in de -c edit, certificate, or diploma curricula
These activiti include: courses (credit and non-credit, degreeand coa-degree);Aonferences (including institutes, snort courses,
seminars, lectlit series, round tables, workshops); independentstudy and corres ondence; counseling and guidance; radiv, T.V.,and multi-Media pogroms; and commurity service,programs.1
The broad scop0- f the activities referred to in the above definition,
1
the changing definition Of an adult, and the emerging flexibility of program
1
offerings; structure, an requirements suggested that an examination of in-
structional activities in the ,dichotomy r' "adult:" and "youth" education wc'jld
have little meaning in t day's college or university. If the purpose of the
'Robert E. Williams,."A Plan to Provide Leadership for the FullDevelciPmert of Post-Secondary-Continuing Education in New York State."
/Unpublished manuscript, Sureau/of Special College Programs, New York State
Education Department, AlbanyO.Y., 1971, p. 3....... /
/ ---- 4
1

study, was to assist Bureau of Special College Programs to de'velopeo.c:m-.
prehensive plan for the, future, 4 seemed unreasonable to restrict the sample/ IF
/of, instructional activities or the individuals who were selected to respond to
the4eporting of instructional activities in continuing education uLits df
75
colleges ang'Uni4ersities.`
_Analternative might be to think in terms of four major divisions of
/the university or college, each concerned \with learners who include both adult
N4
'4
and youth. Di ion I might be concerned \with degrue-credit programs for full-f
, me students; Division II would focus on degree-credit programs for part-tiph
students; DivLsion I would be concerned with non-credit prcgrams for full-_
time stuhents' and ivision IV would handle a:1 non-credit programs for part-.
tiMe st'dents.
. The above scheme is based upon the aRaumptions*tKat full-rim And port-
time students differ significantly in terms of (a) their life role*, (b) their
need,for the institution to make accommodations to the sturett, and/(c) Leir
counseling needs. It is also assumed that faculty and administrat rsinvoved
with the certification process '(i.e., credits and degrees) have different
concerns fr6m those of faculty.andadmlnistratOrs involved with learning
iactivities without regard_to credit, degrees, or certification.
Thus, in the analysis of the data, a decision was made to examine the
data pertaining to instructional activities h; different categories of adult
learners. Such data could be compared and contrasted to the data pertaining to
all instructional activities provided by colleges and unlarsities if nItsfred.
Post-se tondary contifn ing education,/therefore, was deft1 ed in terms of three
categories of adult,learncrs:
1. Category I--The instructional activities included in Categor;*146442,0411
non-credit instructional activities where els/majority of the participants
in the instructional activity were,25 years of age or older. This was

76
considered a basic category which has been traditionally accepted by
,
university personnel as "adult education."
2. Category 11--This category inclUded the instructional activities frOm
Category I plus all i,.tructienal activities leadingto an academic
diploma, degree,,,or to a certificate where the majority of the partici-
pants in the instructional activity were 25 years of age or oldet. This
category could include full-time students, but the students would be
considered " in the traditional sense sin, the majority were 25
. years of age. or mgder.
3. Category III--This category iicluded the instructional activities from
Category II plus alt non-credit instructional activities involving the
17-24 age group where the majority of the learners were between 17 and 24
years of age. ;
It would also be possible to designate a Category instructional
activities from Category III plus all instructional a that lead to an
academic diploma:degree, or to a certificate where the majority of,the parti-'
cipants were '7 years of age or older. The 4efinition.oi these or other
categories permits the policy planner to select the data most appropriate for
the situation.
'4I
Use of Category I Instruction s an Example
Using the distinctions indicated a'ove, it was possible to examine in
two ways just. those data that involved instructional activities addressed to
- objectives without retard to diploma, certification, or degree requirements fora
adults 25 years of age or older. Fir,st,Thow does this category of instructional
activity compare with or differ from all instructional activity reported? Thus,
some tables will include data about Category I in the context of all
96
77
instructional activity reported by the respondents. An example of displaying
data in this context Table 30..
In this particular table, four types of findings are presented. An
example of each type of finding is given below. The data pertaining to each
type of finding are circled in Table 30. The examples cited would be included
among the importan findings in Table 30. Example i--All (100 percent) in-
structional activities in Business and Management, Law, Conpunications, and
Interdisciplinary Studies addressing general knowledge objectives without
se,
regard to credit= werefound in Category I. Example 2-,More than 37 percent of
all instructional activities in Education were non-credit in nature and for
participants 25 years of,age and older. Example 3--Approximately 12 percent of
all instructional activity addressing general knowledge, non - credit objectives
was included in Category I. Example 4--Almost 6 percent of all instructional
activity reported by the respondents was directed toward non-credit objectives
for adults 25 years of age and older.
Second, what was the'nature and scope of instructional activities in
just this Category? In other tables, the statistics pertain, only to Category I
activities. Table 31, for example, displays the percentage of Category I
instructional activities using various media orcommunication. Since we are
examining all non-credit instructional Activities for adult..? 25 years orage
and older, three kinds of findings of interest. The following examples are
circled in the table. Example 1--Within the Category, 5 percent of the instruc-
tional activities addressing specific knowledge objectives involved designing
or writing instructional materials. Example 2--Approximately one-half (48 per-
cent) of the instructional activities in this Category addressed specific
knowledge objectives without regard to academic credit. Example 3--Almost 954
percent of all non-credit instructional activities for adults were conducted
within face-to-face groups.
97
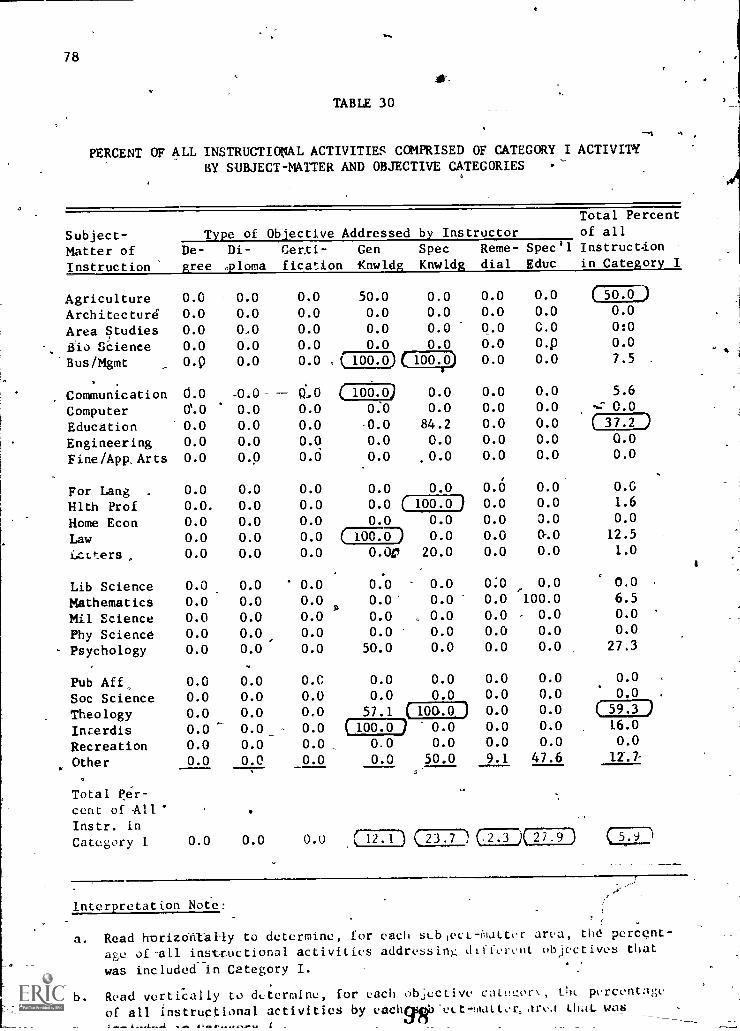
78
TABLE 30
PERCENT OF ALL INSTRUCTIMAL ACTIVITIES COMPRISED OF CATEGORY I ACTIVITYBY SUBJECT-MATTER AND OBJECTIVE CATEGORIES -
Subject-Matter ofInstruction
Total Percent
Type of Objective Addressed by Instructor of all
De- Di- Gen Spec Reme- Specil Instruct-ion
ree loma fication Knwld Knwld: dial Educ in Cate or
5
AgricultureArchitectureArea StudiesBio Science
0.0
0.0
0.00.0
0.0
0.0
o..o
0.0
0.0 50.0 0.0
0.0 o.o o.o
o.o 0.0 0.0
0.0 0.0 0.0
0.0o.o
0.00.0
0.0
o.o
G.0O.
( 50.0 )
o.o
0:00.0
Bus /Mgmt 0.0 o.o o.o ,( loo.o) ( 100.0) o.o 0.0 7.5 .
Communication 0.0 -0.0 0.0 0.0 5.6( 1004 0.0
Computer 0%0 0.0 0.0 0:o 0.0 0.0 0.0 -`' 0.0
Education 0.0 0.0 0.0 0.0 84.2 0.0 0.0 ( 37.2 )
Engineering 0.0 0.0 0.0 0.0 0.0 0.0 0.0 0.0
Fine/App.Arts 0.0 0.0 0.6 0.0 0.0 0.0 0.0 0.0
For Lang . 0.0 0.0 0.0 0.0 0.0 0.6 0.0 0.G
Hlth Prof 0.0. 0.0 0.0 0.0 1.60.0 0.0 ( 100.0
Home Econ 0.0 0.0 0.0 0.0 0.00.0 0.0 0.0
Law 0.0 0.0 0.0 12.50.0 ( loo.o ) 0.0
Lccters 0.0 0.0 o.o 0.0 1.00.0 0.0r 20.0
.
Lib Science 0.0 0.0 0.0 0.0 0.0 0.0 0.0 0.0
Mathematics 0.0 0.0 0.0 0.0 0.0 0.0 100.0 6.5
Mil Science 0.0 0.0 0.0 0.0 , 0.0 0.0 0.0 0.0
Phy Science 0.0 0.0 0.0 0.0 0.0 0.0 0.0 0.0
Psychology 0.0 0.0 0.0 50.0 0.0 0.0 0.0 27.3
Pub Aff, 0.0 0.0 0.G 0.0 0.0 0.0 0.0 0.0
Soc Science 0.0 0.0 0.0 0.0 0.0 0.0 0.0 0.0 .
TheologyIncerdis
0.00.0
0.0
0.0
0.0 57.1 104.0 0.00.0
0.00.00.0 ( 100.0 ) 0.0 16.0
Recreation 0.0 0.0 0.0 0.0 0.0 0.0 0.0 0.0
Other 0.0 0.0 0.0 0.0 50.0 9.1 47.6 12.7-
Total per-cent of AllInstr. inCategory I 0.0 0.0 0.0 ( 12.1) ( 23.7 ) (.2.3
Interpretation Note:
a. Read horizontally to determine, for each si_blect-halter area, th0 percent-
age of -all instructional activities addressing difivrea objectives that
was included in Category I.
b. Read vortically to determine, for each objective catu2or, OIL percentage
of all instructional activities by cachmalbleLt-!aatter,area that: was

_
79
TABLE 31
PERCENT OF-CATEGORYI INSTRUCTIONAL ACTIVITIES CLASSIFIED BYOBJECT]VE AND IDIUM OF COMMUNICA ION
/I.M11.1...Type of Objective.Addressed byInstructor
Medium of Communication TotalPercentin Category
WrittenEval Design
Broad-castl Film Group
Academic "Degree 0.0 0.0 0.0 0.0 0.0 0.0
Gen/Voc Diploma 0.0 0.0 0.0 0.0 0.0 0.0
Certification 0.0 0.0 0.0 0.0 0.0 0.0
General Knowledge 0.0 0.0 0.0 0.0 29.9 29.9
Specific Knowledge 0.') U.0 0.0 42.8
Remedial 0.0 0.0 0.0 0.0 2.6 2.6
Special Educacion 0.0 0.0 0.0 0.0 19.5 19.5
Total Percentin Category I \0:0 45.2 0.0 0.0 (24118) 100.0
'Data pertaining to the six broadcasting categories listed raviously
were consolidated into one category for computing purposes.
The remainder of this section will be devoted to presenting selected
°findings about non-credit. instruction for adults 25 years of age and older as
they relate to (a) the number of instructional activities offered, (b) the
number of instructor hours involved with these activities, (c) the number of
student hours invested in the activities, and (d) the demographic composition
of the students involved. The statistics were computed by tabulating twiLway
frequency tables for selected variables and converting the number of responses
in laca cell into proportions. The cross-tabulation procedure was discussed
previously in this chapter, and an explanation of the general statistical
procedures used is attached as Appendix F.
Using these approaches, other selected findings will be presented. The
table which includes the supporting date will be cited; the specific data Are
als0 circled as a convenience to the reader. The interested readezmay wish to
99

80
examine other data as well. In terms of all post-secondary instructional/
activity, the iustructional activities in Category I:
1. Comprised approximately 6 percent of all instructional activities offered
from March, 1972 to March, 1973 (Table 30)
2. Accounted for approximately 28 percent of all instructional activity
addressing special or custodial education objectives (Table 30)
3. Comprised approximately one-fourth of all instructional activities
focusing on specific knowledge objectives relating to individual or
institutional problems or interests without regard to.diploma, certifi-
cation, or degree requirements (Table 30)
4. Included 50 percent or more of all instructional activities offered in ehe
areas of Theology and Agriculture, and 37 percent of all instructional
activities in Education (Table 30)
5. Included,all (100 percent) of the instructional activities in Business and
Management, Communications, Law, and Interdisciplinary Areas addressing
general knowledge objectivei, and all instructional activities in Business
and Management, Health Professions, and Theology addressing specific.
41?
knowledge objectives (Table 30)
6. Included approximately 43 percent of all instructional activities using
the discussion/workshop approach for teaching students (Table 32)
7. Involved 100 percent of all instructional activities conducted at a place
of business, and 50 percent.Of all instructional activity held in, churches
and at voluntary association facilities (Table 35)
8. Included less than 1, perceilt of all remedial instruction (Table-30)
9. Was estimated to be greater than one million in New York State during the
period March, 1972 to March, 1973 (Table 36).
'As for just those instructional activities included in Category I:
1. Approximately 95 percent of all Category-I instructional activity utilized
inn

81
TABLE 32t
'PERCENT ALL INSTRUCTIONAL ACTIVITIES COMPRISED OF CATEGORY IACTIVITY BY OBJECTIVE AND MODE OF INSTRUCTION CATEGORIES
-Total Per-_
Mode tisf. Instruction cent !of All
Objective of Lt'- Dig- Work- Dect/ Lect/ Disc/ Lect/Disc/ InstructionActivity ture cuss shop Disc Wksp Wksp Workshop in Cate:;ory I
,
Academic Degree 0.0 0.0 0.0 0.0 0.0 0.0 0.0 0.0
Voc/Gen Diploma 0.0 0.0 0.0 -0.6 ..0.0 0.0 0.0 0.0
terti6.cation 0.0 0.0 0,0 0.0 0.0 0.0 0.0 0.0
Gen Knowledge 3.1 42.9 0.0 37.0 0.0 OA 0.0 12.1
Spec Knowledge 27.9 62.1 0.0 9.1 0.0 0.0 0.0 23.7
Remedial 0.0 0.0 0.0 4.0 0.0 0.0 0.0W _2.3Special Educ 0.0 92.3 0.0 0.0 0.0 100.0 0.0 32.6
Total Percentof All instructionin Category I 6.1 11.5 0.0 3.7' 0.0 W.9) 0.0 6.0
ore
TABLE 33
PERCENT OF CATEGORY I INSTRUCTIONAL ACTIVITIES CLASSIFIEDBY OBJECTIVE- AND MODE OF INSTRUCTION
Objective ofActivit
Mode of Instruction. Total Per-
Leo-.
ture
Dis-cuss
Work-shoe
Lect/
DiscLect/Wks'
Disc/Wks
Lect/Disc/ Cent in
Workshop Category
Academic Degree 0.0 0.0 0.0 0.0 0.0 0.0 0.0 0.0
Voc/Gen Diploma 0.0 0.0 0.0 -0.0 0.0 0.0 0.0 0.0
CertificaEion 0.0 0.0 0.0 0.0 0.0 0.0 0.0 0.0
Gen Knowledge 5.2 11.7 0.0 13.0 0.0 0.0 0.0 29.9
Spec Knowledge t 22.1 23.4 0.0 2.6 0.0 0.0 0.0 `48.1
Remedial 0.0 0.0 0.0 2.6 0.0 0.0 0.0 2.6
Special Educ 0.0 15.6 0.0 0.0 0.0 3.9 , 0.0 19.5
Total Percentin Category 27.3 (50.7) 0.0 18.2 0.0 3.9 0.0 100.1
101.
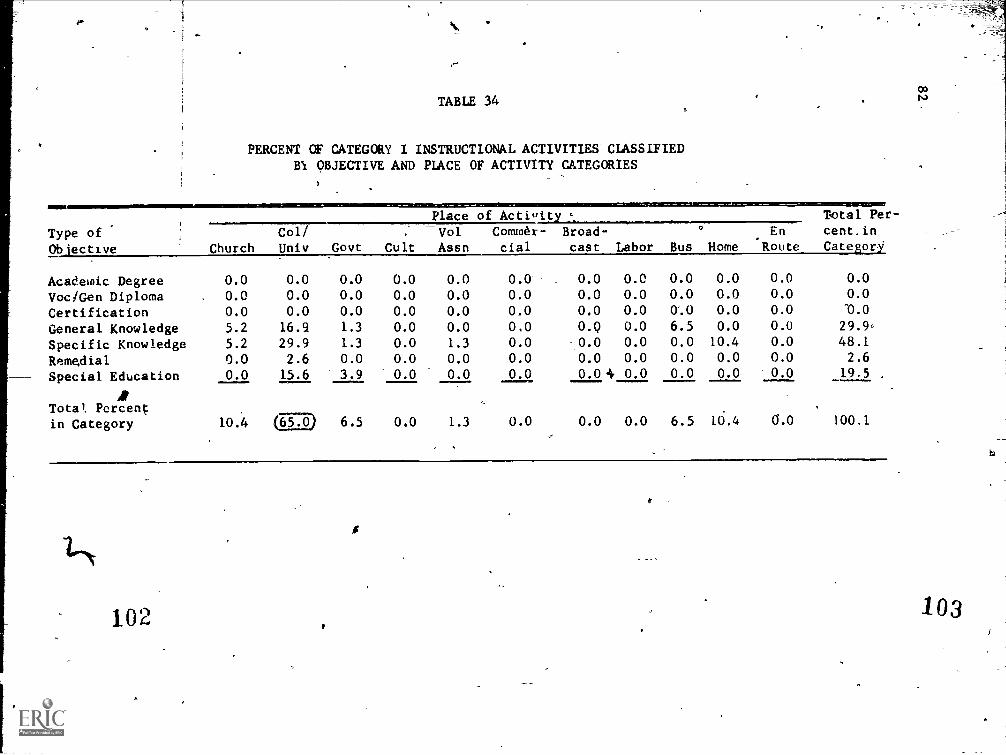
P.
TABLE 34
PERCENT OF CATEGORY I INSTRUCTIONAL ACTIVITIES' CLASSIFIEDB1 OBJECTIVE AND PLACE OF ACTIVITY CATEGORIES
Place of Activity '_ Total Per-
Type of Col/ Vol Comer- Broad- u En cent, in
Objective Church Univ Govt Cult Assn cial cast Labor Bus Home Route Category
Academic Degree 0.0 0.0 0.0 0.0 0.0 0.0 0.0 0.0 0.0 0.0 0.0 0.0
Voc/Gen Diploma 0.0 0.0 0.0 0.0 0.0 0.0 0.0 0.0 0.0 0.0 0.0 0.0
Certification 0.0 0.0 0.0 0.0 0.0 0.0 0.0 0.0 OA 0.0 0.0 10.0
General Knowledge 5.2 16.9 1.3 0.0 0.0 0.0 0.Q 0.0 6.5 0.0 0.0 29.9
Specific Knowledge 5.2 29.9 1.3 0.0 1.3 0.0 0.0 0.0 0.0 10.4 0.0 48.1
Remedial 0.0 2.6 0.0 0.0 0.0 0.0 0.0 0.0 0.0 0.0 0.0 2.6
Special Education 0.0 15.6 3.9 0.0 0.0 0.0 0.04 0.0 0.0 0.0 0.0 19.5
APTotal. Percent
in Category 10.4 (65.0) 6.5 0.0 1.3 0.0 0.0 0.0 6.5 10.4 0.0 100.1
10%
,
103
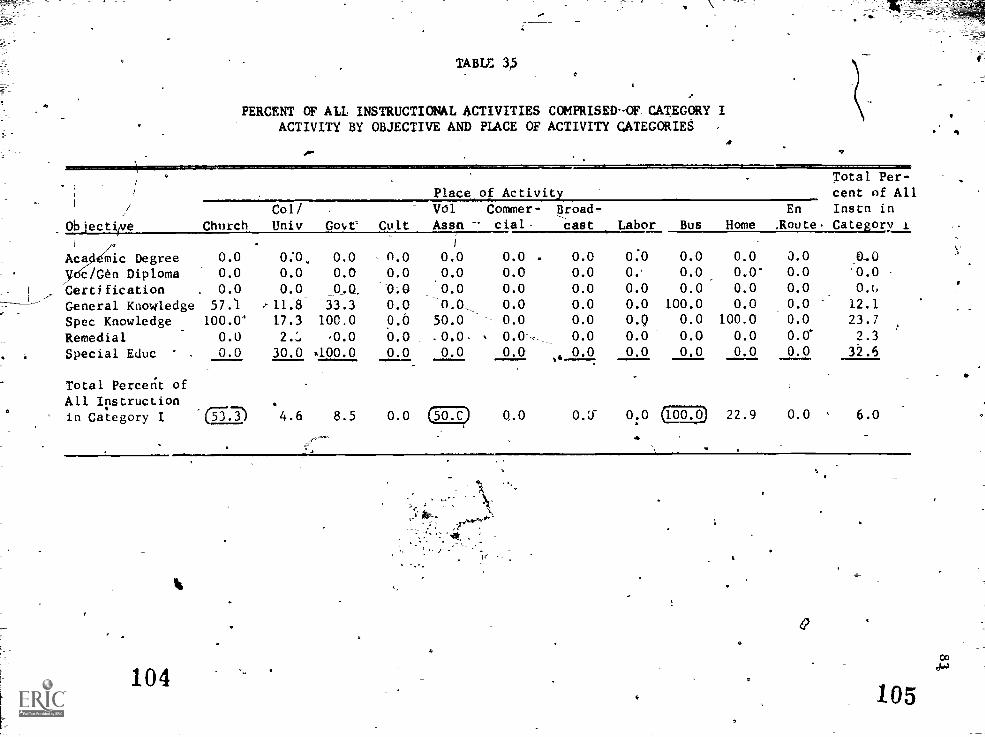
TABU 3,5
PERCENT OF AIL INSTRUCTIONAL ACTIVITIES COMPRISED-OF CATEGORY IACTIVITY BY OBJECTIVE AND PLACE OF ACTIVITY CATEGORIES
Ob jecti1ve
Place_of ActivityTotal Per-cent of AllInstn inCategory iChurch
Col/
Univ Govt Cult
Vol Commer-Assn cial-
Broad-cast Labor Bus Home
En,Route.
Aca4Mic Degree 0.0 0:0 0.0 0.0 0.0 0.0 . 0.0 0:0 0.0 0.0 3.0 0,0
c/Gen Diploma 0.0 0.0 0.0 0.0 0.0 0.0 o.o o. 0.0 0.0' 0.0 0.0
Certification 0.0 0.0 0.0. -0.0 0.0 0.0 0.0 0.0 0.0 0.0 0.0 0.0
General Knowledge 57,1 r11.8 33.3 0.0 rt.o_ 0.0 0.0 0.0 100.0 0.0 0.0 12.1
Spec Knowledge 100.0' 17.3 100.0 0.0 50.0 0.0 0.0 0.Q 0.0 100.0 0.0 23.7
Remedial 0.0 Z.:, .0.0 0.0 .o.o 0.0 0.0 0.0 0.0 0.0 0.0' 2.3
Special Educ 0.0 30.0 100.0 o.o 0.0 0.0 0.0 0.0 0.0 0.0 32.6
Total Perceft ofAll Instructionin Category I (-57.7) 4.6 8.5 0.0 (.50.C? 0.0 0.01" 0:0 (100.0) 22.9 0.0 6.0
I
104105

84 .
TABLE 36
' 14.
CATEGORY:I ACTIVITIES IN POPULATIONAND ISUBJECT-MATTER.GATEGORIES
ESTIMATED-NUMBER OFBY OBJECTIVE
Subject-Matzer ofInstructiOt
_Type of Ob4ctive Addreheil_by Instructor.Estimated Num-bec,, of Activi-
ties (intihousands)
Dr.- Di- Cer0./ Gen Spec -Re;e- Spec'lgree'Eloma fication Knewl;dg Knwl4dg dial Educ
Agriculture. 0 0 0 55 O. 0 55
Architectbre 0 0' 0 0 0 .0 0 0
Aria -Studies 0 o 0 0 0 0 0 0
"Bin Science 0 0 0 0 . 0 0 0 0
Busftml O 0 0 14 42 0 0 56
Communication o 0 -0 *42 0 0 0 42
Computer o 0 0 0 0 0 o
'EducationEngineering
o
o
o
0
00
0
0
7'20
0 .
0
. 04,0
2220
Fine/App Arts o o 0 0 0 0 0
For Language 0 0 0, 0 0 0 0 0
Health Prof 0 0 0 o 14 0 14
Home Econ o o -o o 0 0Law 0 0 0 14 0 0 0- 14
Letters 0 0 0 0 55 0 55-;
Lib Science o 0 0 0' 0 0 3 0
Mathematics o o 0 0' 0 0 28
Mil_Science o 0 0 0 0 0 0 0
Phy Science 0 0 0 0 0 0
Psychology 0 0 0 83 0 0 0 83
Public Aff 0 0 0 0 .0 0
Soc Science 0 0 0 0 0 0.
Theology
Interdis
00
0
0 055
55
166
0
0
0
o
0P5
Recreation' 0 0 0 0 0 0 0 0
Other 0 0- 0 0 14 28 139 181
Total, 0 - 318 513 28 167 (Eg)a
106

85
a face-to-face group as the medium of communication (Table 31)
2. 'Approximatelyfone-halr,(48Tercent) of Category I instructional activity
addressed specific knowledge objectives relating'to individual or instj.-. . a 0
tutional problems wi_hout regard tp credit (Table 31)
3. One-half of the instructional activities used the discussion technique
in teaching (Table 33)-
.4. Most percent)-took place -at a college or university facility; the
ff
remaining one-third of the instructional activities was held,in churches,
private homes, places of business, and government and voluntary-association
facilities. (Table 34,
The amount of instructor time spent in instruction was also of interest.
Since the respondents reported the length of each activity, it was possible to
determine the number' of instructor hours involved in Category I instructional
activities. As in the previbus section, selected findings will be presented,
and the tables incl'iding the-supporting data will be identified:, The findings.C
are alSo.circled as a convenience-to the reader. In terms of all instructor
time reported, the following findings emerged:
1. Nine percent of all instructor time (Table 37) was devoted to 6 percent of
all instructional activities_aable 30)
2. More than 40 percent of all instructor 'lours spent addressing two types of
objectives (spec,ifte knowledge relating to individual ox Institutional
40 problems or interests, without regard to credit, and special or custodial
4
education) was iacluded in Category I (Table 37)
3. Eight subject matter areas-(Agriebiture, Education, Theology, Law, Inter-
disciplinary Studies, Othe', Communications, and Psychology) were over-.
represented in Category I as they accounted for more than 9 percent of all
instructor time in their areas (Table 37)
oi

-
a
86
TABLE 37
. PERCENT OF ALL INSTRUCTdi HOURS INCLUDED IN CATEGORY IBY OBJECTIVE LND SUBJECT-MATTER CATEGORIES
Subiect-MatterAssa-DereeDilmnwldKnwld).,
ypLb-itiveAddrbITeof0e-cnstructorAcad Voc/Gen Certi-- Gen
Total Per-cent- of All
Hours inCategory I
Spec Reme-dial
Speg'lEduc
Agriculture 0.0 0.0. p.o 50.0 0.0 0.0 0.0 )
Architectyre 0.0 0.0 0.0 0.0 0.0 0.0 0.0 0.0\Area Studies 0.0 0.0 0.0 0.0 0.0 0.0 0.0 0.0
Bio Science 0.0 0.0 0.0 0.0 0.0 0.0 G.0 0.0
'BuiIMgmt 0.0 0.0 0.0 100.0 'ioo.o 0.0 0.0 7.1
EoMmUnication 0.0 40.0 0.0 100.0 0.0 0.0 0.0 (ITT)Computer 0.0 0.0, 0.0 0.0 OW 0.0 0.0 0.0
-Education 0.0 0.0, - 0.0 0.0 94.8 0.0 0.0 (44433)
,Engineering_ 0.0 0.0 0.0 0.0 0.0 0.0 0.0 , 0.0
Fine /App Arts 0.0 0.0 0.0 0.0 0.0 0.0 0.0 0.0.
.
For Language 0.0 _ 0.0 0.0 0.0 0.0 0.0 D.0 0.0
_Health Prof 0.0 , G.0 0.0 0,0 100.0 0.0 0.0 .1.0'
/tome Ecpn 0.0 0.0 0.0 0.0 0.0 0.0 0.0 0.0 -; .
°lam; 0.0 ,0.0- 0.0 100.0 0.0 0.0 0.0 (28.6)
Letters 0,,0 -, 0.0 0.0 0.0 30.0 0.0 0.0 7.74:'-'.
IAD Science 0.0 0.0 0.0 0.0 0.0 0.0 0.0 :Ip.o
Mathematics 0.0 0.0 Q.0 0.0 0.0 0.0 100.0 , 4.2
Mil Science 0.0 0.0.
0.0 0.0.
0.0 0.0 0.0 0.0
Phy Science 0.0 0.091 0.0 0.0 0.0 0.0 0 -, 0.0,
Psychology ,0.0 0.0 - 0.0 26.6 0.0 0.0 0.0 (12.8)
-,-
Public Aff 0.0 0.0 0.0 0.0 0.0' 0.0 0.0 0.0
Soc Science 0:0 0.0 0.0 0.0 0.0 0.0 0.0 0.0
Thec.logy 0.0 '.0.0 -0.0 30.8 100.0 0.0 0.0 (ITT)
Inteidis 0.0 0.D 9.0 '100.0 ,0.0 0.0 0.0 (27.9)
:Recreation 0.0 0.0 0.0 o.o 0.0 0.0 .0.0 0.0
Other 0.0 -0.0 0.0 0.0 57.1 2.7 76.5 (15.9)'
-Total Percentof All Hours
in Category_I 0.0
#
0.0 0.6 14.2 (477). 1.4 (8.9)(42.6)
1083.
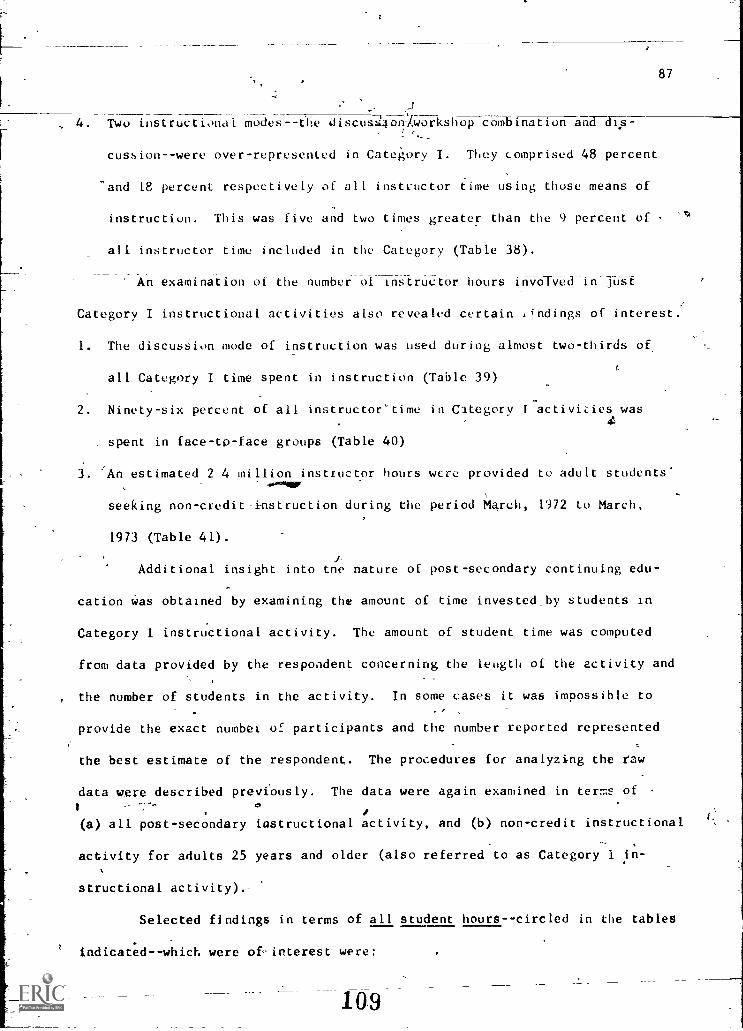
87
4. Two instructional modes--the disci424on/workshop combination ancTdis-
cussion- -were over-represented in Category I. They comprised 48 percent
'and 18 percent respectively of all instructor time using those means of
instruction. This was five and two times greater than the 9 percent of -
all instructor time included in the Category (Table 38).
An examination of the number of instructor hours invOTved in just
Category I instructional activities also revealed certain .findings of interest.
1. The discussion mode of instruction was used during almost two-thirds of
all Category I time spent in instruction (Table 39)
2. Ninety-six percent of all instructor` time in Category I-activities was
spent in face-to-face groups (Table 40)
3. An estimated 2 4 million instructor hours were provided to adult students'
seeking non-credit-instruction during the period M4rch, 1972 to March,
1973 (Table 41).
Additional insight into tne nature of post-secondary continuing edu-
cation was obtained by examining the amount of time invested -by students in
Category I instructional activity. The amount of student time was computed
from data provided by the respondent concerning the length of the activity and
, the number of students in the activity. In some_eases it was impossible to
provide the exact number of participants and the number reported represented
the best estimate of the respondent. The procedures for analyzing the taw
data were described previously. The data were again examined in terms of
(a) all post-secondary instructional activity, and (b) non-credit instructional
activity for adults 25 years and older (also referred to as Category I in-
'
structional activity).,
Selected findings in terms of all student hours--circled in the tables
indicatedwhich were of-interest were:
109

PERCENT OF ALL INSTRUCTOR HOURS INCLUDED IN CATEGORY I'BY OBJECTIVE AND MODE OF INSTRUCTION CATEGORIES
Type ofMode ofInstruction
Total Per-cent of All
Lec- Dis- Work- Lect/Disc
Lect /
WkspDisc/
-Wk-sp
Lect/Disc/ Hours in-Wttkshoo---CategoryObjective ture cuss shop
Academic Degree 0.0 0.0 0.0 0.0 0.0 0.0 0.0 ,0.0Voc/Gen Diploma 0.0 0.0 0.0 0.0 0.0 0.0 0.0 0.0
Certification .0.0 0.0 0.0 0.0 0.0 0.0 0.0 0.0-
Gen Knowledge 2.5 33.1 0.0 48.0 0.0 0.0 0.0 14.2
Spec Knowledge 35.2 82.1 0.0 8.1 0.0 0.0 0.0 41.0
Remedial 0.0 0.0 0.0, 1.9 0.0 0.0 0.0 1.4
Special Educ 0.0 96.9 0.0 0.0 0.0 100.0 0.0 46.3
Total Percentof All Hoursin Category I 7.1 0.0 5.3 0.0 0.0 8.8(18.3)
TABLE 39
PERCENT OF CATEGORY I INSTRUCTOR HOURS BY OBJECTIVEAND INSTRUCTIONAL MODE CATEGORIES
-
r'type of
Objective
Mode of Instruction Total Per-
Lec- Dis- Work- Lect/ Lect/ Disc/ Lect/Disc/ cent in
"recussshoD"cl ashop Disc 1----P- "-------A&i.Y---4ksWksh°PC!°'Academic Degree 0.0 . 0 0 0.0 0.0 0.0 0.0 ' 0.0 A.O.
Voc/Gen Diploma 0.0 0.0 0.0 0.0 0.0 0.0 0.0 0.0
Certification 0.0 0.0 0.0 0.0 0.0 0.0 0.0 0.0
Gen Knowledge 2.2 6.4 0.0 12.9 0.0 0.0 0.0 21.5
Spec Knowledge 17.7 37.3 0.0 1.8 0.0 0.0 f 0.0 56.8
Remedial 0.0 0.0 0.0 1.3 0.0 0.0 0.0 1.3
Special Educ 0.0 17.7 0.0 0,0 0.0 2.-8 0.0 20.5
fir
Total Percentin Category 19.9 (61.4) 0.0 16.0 0.0% 2.8 0.0 100.1
110

TABLE 40.
89
PERCENT OF CATEGORY I INSTRUCTOR HOURS BY OBJBWIVE
AND MEDIUM OF COMMUNICATION CATEGORIES
Type of
Medium of Communication Total Per-cent inWritten
0biective Eval Design Broadcastl Film Groin Ca[egorX__g
Academic Degree 0 0 0 0 0 0
Vor../Gen Diploma 0 O --0' 0- -0 0
Certification 0 -0 0 0 . 0 G
Gen Knowledge 0 0 00 0 22 22'
4pec Knowledge 0 3 0 0 53 56
Remedial 0 0 0 0 1 1
Special Educ 0 0 0 0 w 20 20
Total Percentin ategory 0 3 0, 0 99
1Data pertaining to the broadcasting media were consolidated into one
category. -11
4,
TABLE 41
ESTIMATED NUMBER OF INSTRUCTOR HOURS IN CATEGORY I INSTRUCTIONAL
ACTIVITIES BY OEJECTIVE AND INSTRUCTIONAL MODE CATEGORIES.
--
Type ofOb iective
Mode pf Inatruc ion
lee- Dis-
tune .cuss
Work-shop
Lect/Disc
Lect/Wksp_
DisF/Wksp Workshop thousands
Lect/Di6v/ Total (in
Academic Degree 0 0 0 0 9 0 0 ,0
Voc/Gen Diploma 0 0 __:.,0 0 0 0 0 0
Certification ,, 0 0 0 0 0 0 0 0
Gen Knowledge 55 158 0 319 0 0 0 532
Spec Knowledge 437 922, 0 44 0 0 0 1403
Remedial 0 .0 0 32 0 0 r.0 32
Special Educ 0 437 0 0 0 69 0 506
Total 492 1517 0 395 0 69 0 (2F;73
11

90
1.- Approximately 6 percent of all student hours were engaged in Category I
instructional activity (Table 42)
2. Approximately 50 percent of all student hours spent in addressing each of
two types of objectives (specific knowledge and special education)
occurred in this Category (Table 42)
3. Almost 12 percent of all student hours spent in the discussion mode of
instruction was included in Category I activity (Table 42).
As for findings concerning student hours icLCategory I activity, the
following=emerged:
1. More than 80 Percent of all student hours in Category I involved just two
modes of instruction--discussion (48 percent), and lecture/discussion
combination (34 percent) (Table 43)
2. .The face-to-face group was the medium of instruction used-fe'r nearly all
(99.7 percent) student hours in this Category (Table 44)
3. It was estimated that adults'25 years.of age and over spent approximately
11.2 million hours in instructional activities that adChressekl.non-credit
objectives during the period March, 1972 to March, 1973 (Table'45).
tiWhat do w know about the participan in post-secondary continuing
education? By definition, Category I instruct al activities consisted of
non-credit instruction offered to adults 25 years of age and over. Compared to
,pie participants in all instructional activities, there-were proport,onally
more women and more members of the white race who were participants in this
category of post-secondary education. Seventy-one perceneof the participants.'
were be',ieen the ages of 25 and 44. Although t )le instruction was without
regard for credit, approximately 80 percent` of the participants had completed
years of schooling and almost 50 percent were college graduates. Approx:i.r
mately 19 percent of the participants had completed 12 years bf schOet; this
112
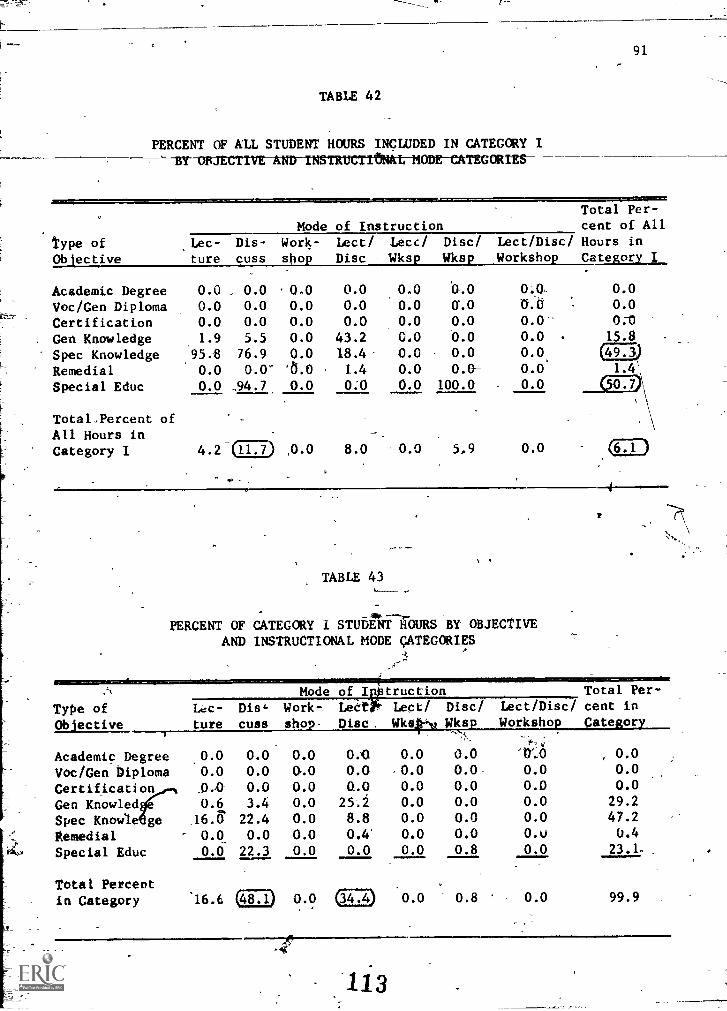
TABLE 42
PERCENT OF ALL STUDENT HOURS INCLUDED IN CATEGORY Itat-MODE-CATEGOR
type ofObjective
Mode of Instruction.Lec-ture
Dis-cuss
Work-shop
Lect/Disc
Lecc/Wksp
Disc/Wksp
Academic Degree 0.0 , 0.0 0.0 0.0 0.0 0.0
Noc/Gen Diploma 0.0 0.0 0.0 0.0 0.0 0.0
Certification 0.0 0.0 0.0 0.0 0.0 0.0
Gen Knowledge 1.9 5.5 0.0 43.2 0.0 0.0
Spec Knowledge 95.8 76.9 0.0 18.4- 0.0 0.0
Remedial 0.0 0.0' '0.0 , 1.4 0.0 0.0-
Special Educ 0.0 .94.7 0.0 0.0 0.0 100.0
Total.Percent ofAll Hours inCategory I 4.20T.7) 0.0 8.0 0.0 5.9
4,
91
Lect/Disc/Workshop
Total Per-cent of AllHours inCategory I
0.00.00.00.00.00.00.0
0.0
0.00.00.Ar
15.8
(MA)1.4'
TABLE 43
-PERCENT OF CATEGORY I STUDENT HOURS BY OBJECTIVEAND INSTRUCTIONAL MODE CATEGORIES
--...._1Made of I traction Total Per-
LeCtli Lect/ Disc/ Lect/Disc/ cent in
Disc. Wks4 Wksp Workshop CategoryType ofOb active
1.c-ture
Dishcuss
Work-shop-
Academic Degree 0.0 0.0 0.0
Voc/Gen Diploma 0.0 0.0 OACertification 0.0 0.0
Gen Knowled 0.6 3.4 0.0
Spec Knowle @g _16.6 22.4 0.0
Remedial o.o, 0.0 0.0
Special Educ 0.0 22.3 0.0
Total Percentin Category '16.6 (48.1) 0.0
0.G 0.0 0.0 0.0
0.0 ,0.0 0.0 0.0 0.0
0.0 0.0 0.0 -0.0 0.0
25;2 0.0 0.0 0.0 29.2
8.8 0.0 0.0 0.0 47.2
0.4' 0.0 0.0 0.0 0.4
0.0 0.0 0.8 0.0 23.1.
0.0 0.8 0.0 99.9(34.4
113
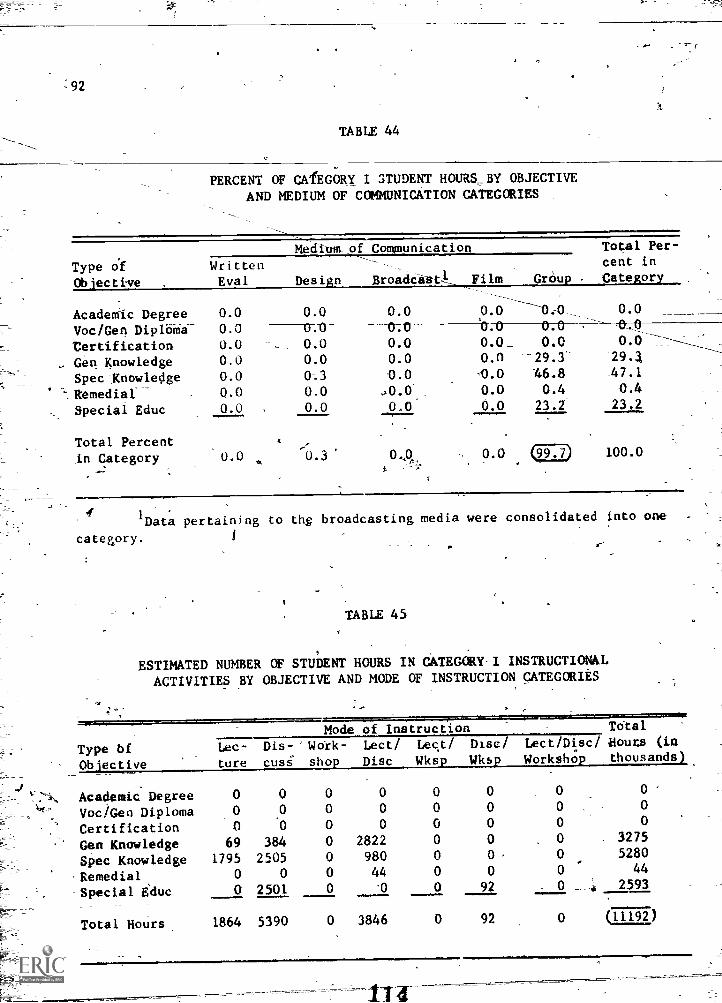
-:92
TABLE 44
PERCENT OF CATEGORY I STUDENT HOURS_ BY OBJECTIVEAND MEDIUM OF COMMUNICATION CATEGORIES
Type ofObjective
Medium o Communication
WrittenEval Design Broadea-191k_
Academic Degree 0.0 0.0 0.0
Voc/Gen Diploiria- 0.0 0:0 0.0-
Certification 0.0 0.0 0.0
Gen Knowledge 0.0 0.0 0.0
Spec Knowledge 0.0 0.3 0.0
Remedial 0.0 0.0 0.0
Special Educ 0.0 0.0 0.0
Total Percentin Category 0.0 a 0.3 0
Total Per-cent in
Film Group - Category
0.00.0
0.0
0.0 0.00.0 -29.3-0.0 46.80.0 0.40.0 23.2
0.029.347.10.423.2
0.0 (22z2) 100.0
1Data pertaining to thg broad-casting media were consolidated into one
category.
TABLE 45
ESTIMATED NUMBER OF STUDENT HOURS IN CATEGORY-I INSTRUCTIONAL
ACTIVITIES BY OBJECTIVE AND MODE OF INSTRUCTION CATEGORIES
Type bfObjective
Mode of Instruction Total
Lec-
ture
Dis- `Work-cuss_ shop
Lect/
DiscLect/Wksp
Disc/Wksp
Lect/Disc/ Hours (in
Workshop thousands)
Academic Degree 0 0 0 0 0 0 0 0
Voc/Gen Diploma 0 0 0 0 0 0 0
Certification 0 '0 0 0 0 0 0-
Gen Knowledge 69 384 0 2822 0 0 0 . 3275
Spec Knowledge 1795 2505 0 980 0 0-' 0 5280
Remedial 0 0 0 44 0 0 0 44
Special Educ 0 2501 0 -0 0 92 0 _ 2593
Total HoUrs 1864 5390 0 3846 0 92 0 CUM)

93
corresponded to almost 2.2 millioh adults who engaged in non - credit instruction
during the period of the study.
tilts, the rpical participant" in Category I instructional activityK 7
was a white male between the ages of 25 and 34 who had completed 'a bachelor's...
degree. The proportions of Category I participants in the various subcaiegohes
pertaining to age, sex, race, and number of prior years of schoolcompleted a .'
eshown in Table 46. The estimates for the total Category I popilation are N..
shown in Table 47;
TABLE 46
DEMOGRAPHIC CHARACTERISTICS OF PARTICIPANTSIN CATEGORY I INSTRUCTIONAL ACTIVITIES
(in percentages)
Sex
A.
Male Female
-
.
, .=5.1PILMNIW
over 16
47.5
55.0 45.0
RacialGroup
AmericanIndian
AmericanOriental
BlacI
American
SpanishSurnamed Caucasian Other
0.0 0.1 4.4 1.'8 92.9 0.7
Age
t
'Under 17 17 - 24 25 - 34 35 - 44 45 - 54 55 - 6466 andover
0.0 5.5 47.6 26.7 f2.7 7.4 0.0
Prior Veersof School
Completed
CI.
None K - 7 8 9 - 11 12 13 - 14 16 - 16 --------..,31.9
.
0.C' '0.1 0.0 0.5 18.8..
1.3
115
ti

94
TABLE 47
ESTIMATED NUMBER OF PARTICIPANTS IN CATEGuRY IINSTRUCTIONAL ACTIVITIES'
(in thousands)
Sex Mate Female .
A- 9,388 _7,696 _
.
$
.-,
Gump
Amerman ,,Indian
AmericanOriental
StackAmerican
Swank,
Surnamed- Com:asian
I
Other
,
0 14 610 250 12,711 97
Age Under 17
.
17 - 24 25 34 s_ 35 - 44 45 - 54 55 64
Wandover
0 915 7,862 4,410. 2,094 1,220 0
Prior Yearsof school
Completed
0
None K - 7 8 9 - 11 1.2 ' 13 - 14- 15 - 16
k- :
over 16 ;..----%
0 14 55 - 2,246 153 3,813 5,685 ,--
ter
'The estimated number of participants was based only on reported data.
The'totals for the different variables may not coincide because missing data
were replaced by estimates but were computed as a zero.-
Use ,of the Data in Planning Post-Secondam
jomcation
The determination of needS\for continuing education involves the col..
tection of three types of data. One 't - information about the current
situation was collected in this study of post-secondary instructional 4
activities. Studies of the current nature and scope of post-secondary
I
_95
continuing education provide an essential starting point for any long-range
plane ing activity but are not, by themselves, capable of determining future
_goals or priorities.
The second type of information concerns the desired state of affairs
(what the program should or ought to be). Such data, while often readily
accessible, may be overly idealistic, opinionated, or highly controversial.
Planners have frequently relied on the opinions and values of panels of experts
0
.
to set standards- of excellence. 'These standards, however, are often rejected
by the persons who are directly involved the proposed change. The Focus
Delphi technique, described inrthe next chapter, is one way whereby different -
' groups of people can be queried about the desirability of a proposed goal or
change.
The gap or difference between-the actual state of affairs and the
.desired state of affairs becomes the "need"--the third type of-Anformation
essential for planning. Needs can neither be'entirely based on data nor coo-
pletelf value-free. The specification of program needs involves weighing the
data and societal values against what is politically feasible.
Thus, the primary contribution of this study was_to provide_ data for- -
policy planners about the current status of post-secoddary continuing educa-
tion so that-better-informed -decisions could be made about the future. The
data were deliberately collected within the context of all post-secondary
education since continuing education must operate within the institutional '
system.
In the following paragraphs, three questions pertaining to the future
of post-secondary continuing education will be raised for the consideration of
policy planners and their advisors. Each question will be based on one or more
findings from the data. For each question, the planners will want to ask
117

96
questions such as: "Is this a desirable situation?' "If not, what could be?"
"What should be?" "How feasible is the desired change?" "What prfOrity does
the desired ,change have in terms of all'dejsirable goals?"
Query One: Who Is Presently Not Being ServedThrough Post-Secondary Continuing Education?
Altnough At is impossible To7Make exadtcomparisons ti-tWeen the
Characteristics of the - participants .in the sample and the population of
New,York State:, theeensus datacan be used for making approximate comparisons.
Table 48 presents data concerning the proportions of participants by racial
categories for all instructional activities, and Categories I, II, and III
activities. When compared to the Census data, it was concluded that post--..
--s-econdaryedutationr-instrtutiorrs-are -p-rovidiwg more instructional activities ,
proportionally, for memoers of the white (Caucasian) and "other" (e.g.,
Orient .1, American Indian) races than for black American and Spanish surnamed
persons'in New York State. Stated another way, members of the white und "other"
races will be overrepresented as participants in post-secondary, instructional
activities, and members of the black race and persons with Spanish surnames
will be underrepresented when their respective proportions of the total popu-
lation are considered.
Complris'zias between the proportions of the New York State population
and the participants in the sample of instructional activities also show dis-
parities #mong the age groups in the,State if the intent of post-secondary -,
;education institution$ is to provide a comprehensive plan for lifelong learning
for all citizens of the State. The.percehtagea shown from the Census data were
computed using the entire population as a base. Therefore, if the percentages
had been compute() from an adult and youth population comparable to the

TABLE 48
COMPARISON OF RACIAL COMPOSITION OF PARTICIPANTS' IN INSTRUCTIONAL ACTIVITIES
IN SAMPLE WITH NEW YORK STATE POPULATION
97
Race Census Data"
All-Activities
84.1 86.0 92:9 90.1 90.7
10.8 7.1 4.4 5.3 5.0 el.
Spanish surname 4.2 3.4 1.8 2.5 2.1
Other 1.0 3.6 0.8 2.2 2.3
"Computed from data pertaining to persons 15 years and older. Source:U.S. Bureau of the Census. Census of Population: -1970-. _General Social anEconomics_Characteristics. Final Report PC(1)-C34 New York. (Wgshington,
1).C.: _U.S. Government 'Printing. Office, 1972).,_p_. 293. _
-°
2For data pertaining CO Categories II and III, see Appendix G.
sample, the percentages would have been even larger. -The disparities are most
prnnounqed for adults over age 55. ,Clearly, the post-secondary education
institutions are not serving the Alder adult in the same proportions'asthey t
are represented in the New York State pdpulation. Table 49 presents the per-
.
ceutages of persona by age categories for New York State and for participants
in all instructional activities and Categories I, II, and III activities sampled
in this study.
The planners may decide that the current situation just --described isN.45
what ought to 4e And that no change in policy is needed. Or, a need for change
may be desirable; but the proposed change may be inappropriate or not feasible ___=
-because-of poor timing, low priority, a lack of political support _or other
reasons A third alternative course of action would be to ace eed to

.98
TABLE 49
COMPARISON OF THE PERCENTAGES OF PERSONS BY AGE CATEGORIES FOR NEW YORKSTATE AND FOR PARTICIPANTS IN 'THE INSTRUCTIONAL ACTIVITIES IN SAMPLE
Age Category Census Data'. All
ActivitiesCategories2
I II -III
1T-2:7- 17 - 9.7 0.0 1.8 1.2
17 to 24 years 71.0 5.5 12.7 49.6 ,
25 to 34 years 12.3 11.6 47.6 47.0 27.1
1
35 to 44 years 11.8 4.8 26.7 23.0 - 13.3
45 to 54 years 13.2' 2:0 1,2.7 10.6 6.0
55.to 64 years 10.1 0.8 7.4 4.6 2.6
ove r- 65 yea-rs-- _ 10.7 0.05 0.0 0.3 - 0.2
IPercentage represents the proportion of all persons in New York State
whose age falls within the given category. 'The missing percentages_ could notbe computed because of dissimilar categories. Source: (same as table above)
2For data pertaining to Categories Ifirnd III,- 'see Appendix G.
offer more educational opportunities for certain audiences (e.g., certain age_4
and ricial groups). This could be facilitated through actions such as pro
viding funds to post-secondary institutions to: (a) study the interests and
barriers to participation by the target audiences, (b) support program develop-
'
-ment activi:tieS for the target audiences,. and (c) reduce o remove any.tuition
. .
costs for the participants.. The specific policy or course of action selected
---.--- wili-Vaty,from situation tb-eltilatiOn-because of-varlation_ in tradition, in
the importance of various social forces, a90 in readinesi to change,,.'\
1 ;D

92taii2i110a4112Stent is Post"aMAIELContinuing Educa ion Time and Space-Free? -
99
-t
The study data showed that almost all instructional activity was con-
ducted in face-to-face group settings And within college and university
facilities. Very few instructional activities used media of communication that
wo111 facilitate independent study, or 4earains through the mass media. Alio,
the use of non-dolleSe facilities as locations for learning occurred for only
35 percent of the non- credit diferings'for adults 25 years of age and older.
These findings suggest questions as to "what ought to be the situation re'-.-/
garding the place and Medytm of adUlt learning."
1. Should continuing educition do 4aythiog to assist the adult who desires-.
-_-to undertake self-planned learning or who prefers independent study?
2. Should the college.or university increase its non-traditional instrud-
Afonal offerings for adplts who travel, whose work schedules conflict with
course offerings, or who are-home-bound because of responsibility or
physical condition?
. -Should continuing education develop a library of independent study
materials such as single concept films, audio cassettes, video tapes, etc:?
,Should continuing education offer more instruction over television ilk
radio?
5. Should instructors be-rewarded for providing learning opportupitiesthat
are free of time and space constraints?
Again, answers to questions such ds these which were suggested by the
7"-
data depend upon the values of the leaders And policy planners in post-
0
secondary education. 'Tradition and satisfaction with current practice may
result in a lack of leadership and resources for expanding the number 9f
nscructional activities that have greater flexibility as to when and where the
1

--------100
07r
learning activity covld be undertaken. On the other hand, the emerging
interest in non-traditional learning is stimulating some institutions to pro-
vide alternatives to the format that was designed forthe full-time; in-
-residence student betweeW 18 and 22 yeArs old.
-gyery_Three: To What Extent Should Post - Secondary
Institutions Engage in Continuing Education?
Post-secbndary institutions have been,, on the one hand, traditionally
invalved'in continuing-education, but, on the other hand, have never accepted
continuing education as the primary purpose ef the institution. Adult and
continuing education has, for somecritics, occupied only a marginal 'place-in
the system since it has teen ineffective in competing for status and rewards
from she System against research and'the teact4ing of full-time, in-residence
.students.,
This study attempted to examine continuing education within the con-
text'of the post-secondary education system. Continuing education (as defines'
by CWterary.I-:non-credit irstruction to adults 25 years of age and older)4k.
accounted for approximately 6 percent of all instructional activity, 9 percent
of all instructor time, and 6 percent of all student hours in all post-secondary
instruc,ional activity studied. If all instruction for credit for adults 25
years of age and over is add-d (Category II), then apptoximately 17 percent of
instructioaal activities were inclu.d.
What'ought to be the amount of continuing education activity provided
by post-secondary institutions? Is 6 percent of all activity adequate? Or
17 percent ?' Can this -level 'of activity 'e expected to meet the need for con-
tinuing edubakfOn that-has been mandated by certain professions? Cr the need
122

101
- for minority group adults and women to aequire appropria,te skills and creden-
tials for vocational and .i-ofessional advancement? Can the increasing pro.-
portion of older adults expect the post-secondary institution to provide
learning opportunities during pre-retirement and post-retirement years?
It seems likely that the tax-paying public will expect more instruction
from pest-secondary institutions. What policies and long-range goals wilj
assist the institutions to accommodate the increasing number of adult learners? '
How should new monies be spent and -41d monies be redirected? How many and what
kinds of personnel are needed? How should continuing education act4vity be
rewarded by the system?1
The three general questions were posed above to illustrate how informa-
tion about the current situation assists in long-range planning. The data,'as
we have seen, do not answer questions about needs. ,Rather, the various
findings must be examined in light of societal values and notions'of "the'
good." Once standards of excellence are identified, and agreed to, it is
passible to state what the needs (or gaps between the actual and desired
situations) are. The task is not yet dbne,Thowever, with the needs defined':
'Alternative goals sr.(' strategies for achieving the goals must be identified and ____
examined in terms of their various consequtnces.
Conclusions
The resultr, of this study bear on the _interests of, the project sponsor
and theiesearch team in (a, methodological and (4) substantive issues. The
-mettiodology was of interest because the process of determining educational
needs for adult and continuing education is complex, and, at this stage of
time, more of an art than a science. The substantirve findings were of interest
because of their utility for planning post-secon.,ary 'continuing education in
123

102
New York State. Additional knowledge about the need determination process,
and the edueatiortal needs in the State would assist institutional and State
planners as they attempt sto meet the adult's interests*and"needs for continuing
education.
This section will address six issues. Each issue will be described
briefly;-the experiences of the research team with the issue and appropriate
'ridings Will be reviewed. These corwlusions should be associated with the
director of the study and not with the entire project dam. The issues cf
'0interest are: (1) need for the data, (2) the data-collection methodology:
ti
(3) the sampling procedure, (4) the methods for analya_tpg the data, (5) the
substantive findings froth the study, and (6) financing conttn'ing education.
-L
Is There A Need For-More Data AboutContinuing. Education?
Throughout the study, it has, been argued that more and-better quality--
data are needed for planning purposes in post-secondary continuing education.
Too -little is known about the inputs and outputs of continuing education pro-pro-
grams:, the relative importance of continuing 'education in all post-secondary
education institutions, and the costs of continuing education. Since advisory
committee members often choose to emphasize and push for prbgrams of interest
to individual members, the policy planner* who seeks to provide a comprehensive
State program is at a disadvantage -when only limited data are available.
At no time during the study did the need for desired irformation
rdiminish. If anything, the investigators became aware of the number of situa-
tions where decisions were being made in the absence of information. The recent
interest in, and tile amount of resources being used. fet, developing management
information services Provides further evidence that.top management increasingly
recognizes the-value of data for plannAng purposes.orl

103
Three conclusions were reached as a result of this issue. First, two
kinds of information are essential in determining needs (the difference
between some present state of affairs and some desired state of affairs).
.This' study sought informdtiOn about-the current-situation-in postsecondaryL
continuing education. *However, these data must be supplemented with informa
tion about the desired state of affairs in order to determine needs. Few
organizations and program directors have attempted to identify or have collected::
data.about those standards of excellence that continuing education should
strive to attain. Nevertheless, the availability of descriptive data about,
the current situation provides an ave ue for asking questions as to "What-
oughtto be?"
Second,. there is a need for information that is collected in the con-
text of all post-secondary education. One issue that confronted the research
team-at the outset of the study was whether to collect data from just con-,
tinuinz education instructnrs or_from all persons providing post-secondary
instructional activity. latter source was considered preferable because
it was felt that (a) ndt all continuing eduCatton activity was conducted
through the unit designatecOor providing continuing education, and (b) know-
ledge was needed about the relationship of continuing education to all post
secondary education. 1.1eseltwo beliefs are still considered,gid. If change
needs to 0CCur with-in the 4st-secondary education system, then data showing.
the relative position of colitinuing education would be essential. The
finding that only 6 percent of all pOst-secondary education is devotecrto'
non-credit instruction for adults 25 years of age and older would be of
concern to most planners andcontinuing education leaders.
Third, appropriate rsourcts will be' required for obtaining data on
'educational needs. These data will seldt a be available from existing
15
sL

104
data-collection systems. The nature of need determination studies will no
doubt vary from one time to,another becauie the problems of adults and society
are dynamic rather' than static.
4
In summary, data_about_eucational needs= of adults-is a continuous-end
increasingly important element in long-range pla ling for continuing education.
While certain' data will Locus on individual and societal problems, other data
are required from the post-secondary education system. The costa of acquiring
these data will. increase` because this task( involves an additional ex"i_anditure
of funds in most institutions.
Was the Data-Collection-Strategy Appropriate?
-A mailed, self- administered yuestiondaire was used to collect the data.
The raterate of response (33 percent of all questionnaires that could be delivered)
suggests that other data-collection-procedures might have been more effective.
A major difficulty in obtaining a high response rate seemed to lie
with thp attitude of the respondent rather than with the data-collection
'method selected. While it would involvc more additional resources than were
committed to this study, it would seem essential to personally contact each
respondent in future studies-of this nature in order to create a positive'
attitude toward the study and, some level of commitment to it. Perhaps it will
not be necessary actually to.pay the respondent for completing questionnaires
or granting interviews in some studies, ,but it may be necessary in other
studies.
Improvements can always be made in the instrumentation used. - The
development of an effective and efficient data-gathering device should continue
to-be a priority research problem in adult and cant-Inuit(' education.
126

105
The face validity of the information collected was satisfactory for
most of the-variables.- The moisl. useful information pertained to six variables
(length of activity, objective, Medium of communication, instructional mode
used, placeplace of the activity, and the number of activities). Variablesin
which responses were ope.. to some question but still considbred valid and
useful were essentiallythr,ie: (a). the subject-matter area of the activity
(because of the large number of "Other" subject - matter areas reported),
(b) the number of patticipants (;because it was necessary to estimate the number r.
in some instances), and (c) information about the demographic characteristics
of the participants (again, because it'was necessary 4ote estimate in large
audiences).- There were two variables for which the information received was
-consideredl,less useful and valid. The subcategories pertaining to the:pre-
requisites required-of learners for participation and to the b&ys of financ.Ing
-instructional activities did noi provide useful data. Other tests' for validity _
(particularly content validity) should be a concern when adequate" time and
financial resources are available.
More information would also be useful about the reliability of the
data. Teat-retest correlatioAs wouldlend additional confidence to the
estimates for the State that are extrapolated from the raw data.
In summary, the attitude of the respondent. toward providing the data
seemed to be the ruder problem in colleting the data. The response'rate was
; lower than desired, although a higher response .rate may have been unduly
optirlastic. However, improvement or the response rate has to be the primary
concern in aimilar studies in the future: Other changes that improve the
validity and -reliability of the data would be desired refinements.
127

106
Should a Different Sampling Procedure Be Used?
A complex sampling procedure was used to identify the individuaYS who
would be queried about their instructional activit Both individuals and
time periods were sampled. The study sample actually was composed of two sub-
samples so that certain statistics could be obtained.
The two basic questions that must first of all be answered'are: "To
what_level is' it desirable to generalize the findings?" and "What resources are
available for conducting tie study?," Once the answers to these two questions
have been obtained, a decision needs to be made as to whether the available
resources are, adequate.-
Given the purposes_of this study, the desire to generalize'for all
post-secondary education in the State still Se-ems'to be valid. The decision to
query a saople rather than the entire population would seem to be the most
.practical alternative considering the resources that would be neededto include
each fapulty and profesgional staff member in the 229 post-secondary institu-
-,-tions in the State:
The decision to include all faculty and staff in post-secondary, edu-
cational institutions in the population also-can be defended if the concern is
with the nature and scope of all post-secOndarycontinuing education. It the
concern is only with the' instructional activities of continmeireducation
units, then the population can be restricted accordingly.
.As for the size of the sample 0=8671 the percentage of the on-
respondents (46 percent) no doPbt affected the-amount of confidence in the
data.- Certainly, the national opinion polls include smaller percentages of
the population studied in their surveys. The low response rate emerged as A
more. important connerkplan the sample size:
128
107
The sampling of time also seems to-be appropriate since continuing
4
education occurs throughout the - year,. Longitudinal studies, while more dlffi-
7cult to implement, are more likely to proVide higher quality data than cross-
- .g
sectional studies. The major disadvantage is that it .takes longer to complete
a longitudinal study than a cross-sectional study.
The idea of improving the sensitivity of response by assigning'one to
_
five reporting weeks based upon the degreP of continuing education instruc-
tional' activity also seems, theoretically sound. Unless -the responOnts-are
---committpd to the study, however, it may present a practical problem (i.e., a
lower response rate). The investigator may have to choose between a high
response rate and an improved sensitivity of response. statistician would
interpret a high response rate as enhancing the reliability of the data.
, Given the financial resources for conducting the study, the size of
the-sample was probably too large. ,A questionnaire is an impersonal, and
sometimes threatening, device. A smaller sample in fewer thstitutions would
have permitted more personal contact with respondents, either in collecting
the data through personal interviews or in explaining the data-collection
procedures in a ace-to-face setting. It became obvious that adequate re-
sources had not been requested for creating among respondents a favorable
attitude toward and a commitment to participate in the study.
lelaiiMary, the sampling procedures used, while somewhat complex, did
result in a stratified sample of faculty and staff. This was accomplished
:without ar. available, master list of,a11 faculty and staff in post-secondary
education. The sample size seemed to be less of an issue than the 53 percent
response rate. While the intent to generalize for post-Secondary continuing
in tha State was valid, the resources required for this task were
inadequate. More resources Were,needed to develop favorable attitudes and a
12 9

108
commitment to ,participate in the survey on the part of the respondents.
How Can the Data Be Analyzed?-
The raw data were tabulated in twn-way frequency...tables, converted
into percentages, translated into estimates for the Stitt., ,nd analyzed ac-
cording to,different definitionsiof continuing education. These statistical
-techniques were selected because the analysis would summarize the data in ways
that they could be used effectively.
The response rate of 53 percent was recognized as-was its probable
effect uponthe reliability.of the data However, it could be argued that
the description presented of post-secondary education in the,State by the data
is conservative. This position is based on the experiencei with non-respondents.
Persons with no instructional acti_vity-to report were More likely to respond
to repeated requests than were taiSse havOkiinstructional activity to report.
The percentages were useful in showing the relative location of sub-..
sets of a major variable. The statistic' that 6 percent of all post-secondary
instruction involved non-credit instruct-ion for adults 25 years of age and
older is only one of 41any examples.' The cross-tabulation analysis provided
similer data but for two variables: 'Thus, it was possible to determine the
proportion of al). instructional activities using various instructional modes
for the various categories of objectives.
The technique for translating the raw data into estimates for the State
can also be useful in illustrating the scope of post-secondary continuing edu-
cation. The sampling procedure was conducted in such a way that the appro-.-
pr4.ate computatiO4 could be made. A higher response rate, however, would have
permitted more confidence in the estimates.
130

.109
Care must 14 taken to interpret the estimated data according to the
definitions used a the st.1- The member of instructional activities, for
example, 'Tiers to the number of continuous contacts (such as a meeting,
lecture, presentation, demonstration) between an instructor and one or more
learners rather than the number of courses,_conferences, programs, etc.
The notion of alternative definitions of continuing education provided
yet another way of analyzing the data. Since an operational definit.. a of
continuing education could vary from institution to institution, such an
approach presented more than one option for examining-continuing education
Activity. An example of one approach was the presentation of data pertaining
to non-credit instruction primarily for adults 25 years of age and older which
,was presented earlier,
anners and continuing education leaders could learn, for example, the
type of obje ve% addressed, the methods used, and something of the student
body involved. Other definitions of continuing education were suggested-and-
could be used if desired.
In summary, four ways of analyzing the data were illustrated. Each
technique was used because of its capability to "summarize",and to "generalize."
The techniques are limited primarily by Ene reliability and validity of the
data.' As with any presentation of data, the user must "massage_Andintlzt-
with the data so that it can be used most effectively.
What Use Can e Made of the findings?
Although methodological issues emerged as the primary focus of the
studya,deseriptive data pertaining to the nature and scope nf,post-secondary
continuing education-were also cc,llected. Examples of the findings have been
liberally used throughout the narrative to illustrae the'kinds of statistics
that can result from Jata-analysis techniques that were used. It has also
131

been pointed out that the primary limitation in the data is that they were
obtained from 53 percent of the sample that could be contacted.
Nevertheless,- various findings may be of interest to planners ane con-
tinuing education leaders.- Three illustrations'of the use of the data foz.
planning Turposts were'proVided in a previous section. The reader is en-
ciousaged to make a thorough examination of each table of data. For example,
the reader might be concerned about the low amount of instructional activity
reported in home economics. '(Actually none was reported; this may have -.been
due to an inadequate sample size or that all persons in the sample presentinif
instruction inkhorn* economics chose not to complete the questionniire. The
continuing educator who feels deeply about problems_of human nutrition4 family
relationships and other probledis addressed by home economists might-be stimu-.
lated to expand the number of instructional offerings in these areas.. Thus, .
implications for continuing education can be drawn for each and every statistic
:presented.
In summary, descriptive data were presented about (1) the number of
instructional activities, (2) the number of- instructor hours, and (3) the
number of student hours.involved in post-secondary education. In addition,
these variables were analyay.ed in terms of (1) the type of objective addressed
by the instructor, 42) th bet- matter involved, (3) the medium of communiq.
ration, (4) the mode of instruction, and (5) the location of the instruction.
Certain statistics were translated into estimates for the State. Demographic
characteristics of the participants were identified; One portion of post-
secondary education activity (non-credit instruction for adults 25 years of
age and older) was separated out and analyzed in terms of the above variables.
I
132

WhILAELalummultAtsmtELItaUms.Continuin Education?
Ill
One of the initial.puiposes of the study was to obtain information -
about how continuing education-is financed. Questions were asked in theO
questionnaire about the fee for each activity and who contributed to the direct
and indirect costs. However, it became apparent to the research team that the
area of financing continuing,edueation required more sophisticated treatment
41than was possible through the survey. The information obtained from the
qUestionnaire merely identified the obviouslopersons, groups, and institutions'
who paid the fees and tuit't.on charged-by the continuing 9ducation unit. Thus,_
it teas recommended hat a thorcugh study of the economics of post-secondary
continuing echication be conducted apart from the survey of instructional
activities:
A final Note
--
Neither time, ng, nor impoverished circumstances hem to 1
diminish the adult population's desire and need to learn. More and..more, ,the
educational institution is being asked to accommodate its,offerings to thkr
adult's- life style.
Increasingly, the quality of human life will1be directly "related to
4
-the quality of learning opportunities. available to adults. Planners and con-_
-tirming educatiOn leaders can and must provide that quality component in adult
education. 4 4
The state of the art in program development and_lonk-range planning is.
just beginning to take shape. -The interest of plannerb in improving their
abilities to determine educational needs more effectively suggests an en-
couraging future for adult learners.
1 3 3

CHAPTER III
A SURVEY OF CONTINUING EDUCATION
OULU DEGREE-GRANTING POST-SECONDARY
INSTITUTIONS IN KTW,YORK STATE'- 4
Introductiori
The role of the Board of Rsttints of the University of the State of
New-Yurk Is to insure that there is effective development and expansion of the.
gal edfucaticnal system in the State andthat such a system meets estab-
lished tanderdT-fot-OWT1ty. As pare of this ioke, the RegAts are, iftla
1-unique osition to, effecrian integrated, articulated system of educatiod:for-
.
all ci4izens throughout 'the State. In order to develop, maintain, and expand
such a system, it is necessary to plan on a comprehensive). toordinated
. . .
Statewjide basis.0,040.1ftlf
The purpose of the task -reported` here was to supply the New Yerk State
Education Department higher education planning personnel with a coete range
of the perceptions of interested publics concernMg.growth and change for
continuing education and extension activities_ in degree-granting post-'
secondary instigations it New York State.
To satisfy that task, we turriedtola'su'rvey device` called the Focus
Delphi and developed by' Stuart A. Sandow with Delayne Hudspeth for the'1"?r
'This chapter was written by StuartA. Sandow. It is also availableas a separate pOlicatroni
9
from the Educational Policy Research Center, SyracuseUniversity Istleiirch Corporatio S New York 13210.
2
4
r
134

J
It113
New York State Education Department'in 1976. It itra device that collect the
perceptions of several interested - populations about an-array of goal-staten
ments and holds their several response groups separate for compaiison over
several reiterations'. 54.
Our sample included four interested publics: individuals who in some
1e 5
vay are part of the informal n'tjuence structure that-advises the New York
State Education Department; deans and diregters of .continuing education'pro=
ni"degree- grantinggrams g institutions; faculty who instruct in those programs;
and clients who buy service, both individually and in groups.
The entire project, of whilh this is only one part, is conceived of
as being within Phase-I of a twO-Tart study. In this first phase, weswere
primarily concerned with demonstrating a tool that would help the State
continually update the information in these areas. For that reason, the
Individuals selected..for participation do not reflect a scientific sample but
rathen, represent exemplars of people in groups'interested in'emerging policy(
-foy continuing education in new York State either as policy-makers, nAminis-
trators, faculty, or clients. While the data are suggestiye and the desire to
draw policy conclusions from the'data intriguing, thelhvestigaterd,:cannot_
supi.Jrt-any such use.
The data do-demonstrdte that, with the selection,of a large and
scientifically significant sample;, fia_reaultent=data-umlild be a most powerful_
body of information t( inform-the policy apparatus in the State.
The reader's attentioiola directed to: (1) the report ofthaprocess, s,
(2) the designer conclusions and observations, and (3) the analysiset the
"nom:data" prepared by Michael Folk as a demonstration of how the process and
data. could be analyzed if it were scientifically selected.
1,35
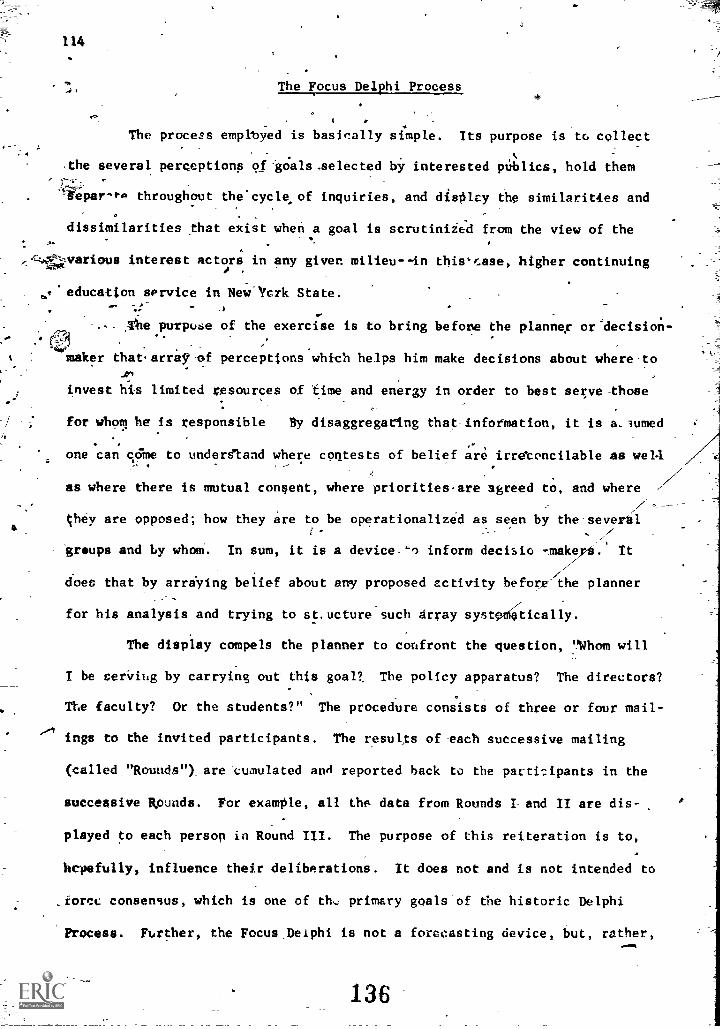
114
.4) The Focus Delphi Process
The process emplbyed is basically simple. Its purpose is to collect
the several perceptions of-goals.selected by interested publics, hold them
-irepar-ta throughout the'cyclpof inquiries, and display the similarit4es and
dissimilarities that exist when a-goal is scrutinized from the view of the
various interest actors in any given milieu--in thivcase, higher continuing
.f.education service in Newlicrk State.
The purpose of the exercise is to bring before the planner or-decision--41
maker that array-f perceptions which helps him make decisions about where to
invest his limited resources of time and energy in order to best serve those
for whoiR he is responsible By disaggregat'tng that information, it is a_3umed
one can collie to understand where contests of belief are irretencilable as well
) . /as where there is mutual consent, where priorities are agreed to, and where //'
they are opposed; how they are to be operationalized as seen by the-several!-
groups and by whoM. In sum, it is a device-'1 inform decisic - makep.' It
does that by arraying belief about any proposed activity before- the planner
for his analysis and trying to st.ucturesuch Array systtically.
The display compels the planner to confront the question, "Whom will
I be serving by carrying out this goal?. The policy apparatus? The directors?
The faculty? Or the students?" The procedure consists of three or four mail-
ings to the invited participants. The results of each successive mailing
(called "Rounds") are cumulated and reported hack to the participants in the
successive R,oinds. For example, all the data from Rounds I and II are dis-
played to each person in Round III. The purpose of this reiteration is to,
hcpefully, influence their deliberations. It does not and is not intended to
_force consensus, which is one of th.., primary goals of the historic Delphi
Process. norther, the Focus Delphi is not a forecasting device, but, rather,
136
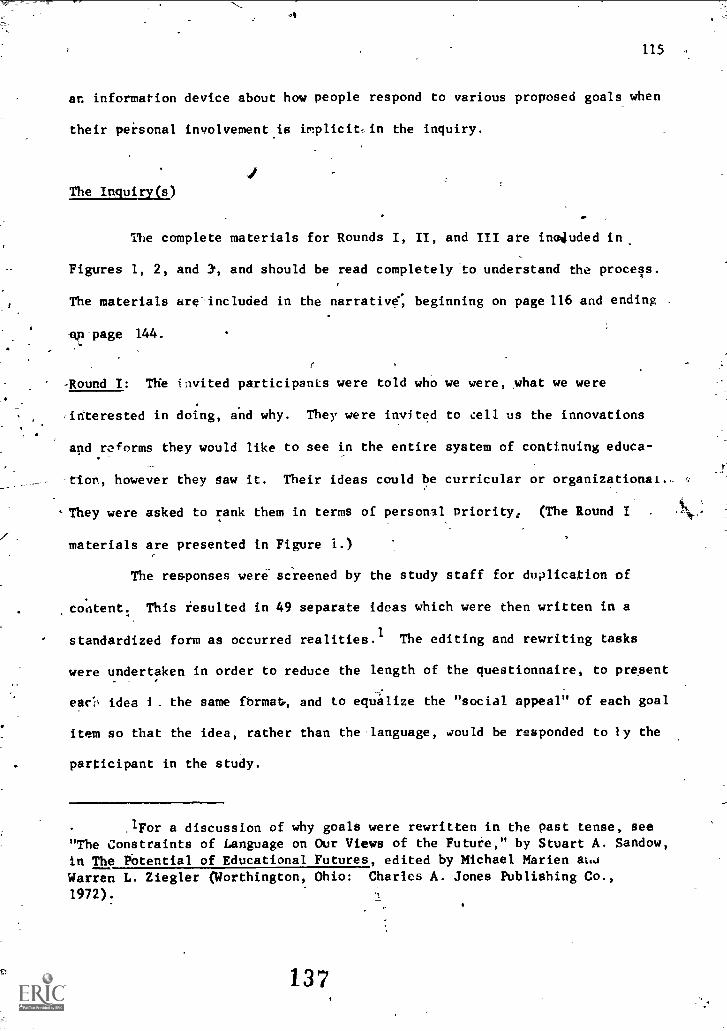
.115
an information device about how people respond to various proposed goals when
their personal involvement is implicit-,in the inquiry.
IThe Inquiry(s)
The complete materials for Rounds I, II, and III are included in
Figures 1, 2, and a, and should be read completely to understand the process.
The materials are included in the narrative; beginning on page 116 and ending
op page 144.
-Round I: The invited participants were told who we were, what we were
'interested in doing, and why. They were invited to cell us the innovations
and reforms they would like to see in the entire system of continuing educe-
tion, however they Saw it. Their ideas could be curricular or organizational.. -
They were asked to rank them in terms of person -al priority, (The Round I -
materials are presented in Figure 1.)
The responses were screened by the study staff for duplication of
content. This resulted in 49 separate ideas which were then written in a
standardized form as occurred realities.1 The editing and rewriting tasks
were undertaken in order to reduce the length of the questionnaire, to present
.-
eaco idea I_ the same Mt-mat', and to equalize the "social appeal" of each goal
item so that the idea, rather than the language, would be responded to ly the
participant in the study.
'For a discussion of why goals were rewritten in the past tense, see"The Constraints of Language on Our Views of the Future," by Stuart A. Sandow,in The Potential of Educational Futures, edited by Michael Marien
Warren L. Ziegler (Worthington, Ohio: Charles A. Jones Publishing Co.,
1972).
137

116
4.;
Fig. 1. Focus Delphi Round I Materials
138

117
3 C Educational Policy Research Center at Syracuse
RD l' 1/72 NYSEPRC/SURC
INTRODUCTION
The Educational Policy Research Center and the Department of AdultEducation of Syracuse University, at the request of the New York State Educa-tion Department, is conducinq a project to ascertain the current and futuregoals of persons involved in continuing education activities at degree-grantinginstitutions in this state. The four groups are policy-makers, administrators, fac-ulty, and students.
The survey itself consists of 4 questionnaires which should require no morethan 1 hour each to complet3. We ask your help and offer you the possibility ofinfluencing policy in this area of education, an opportunity to compare yourideas with other survey respondents prior to the %mond, third, and fourth roundsof questioning, and a copy of the final report.
In round one we are interested in your perceptions of two kinds of changes;REFORM and INNOVATION in each of two areas of concern; CURRICULA andORGANIZATION. In your response to us, consider the reasonableness of yourideas but not the practicability or probability or its being adopted.
For example: Under CURRICULA we urge you to propose new subject areal,new instructional techniques, or media you believe reasonable and desirable, (or \a return to old ideas), without regard to your feelings about the idea's acceptabilityto others who may have conflicting interests.
REFORM:
I NNOVrT I ON
CURRICULA:
DEFINITIONS
changes which you would like to see now within-the existingeducational system as you experience it in the present
possible, champs in the educational system which you wouldlike to see addressed now which might lead to future changes
the subject matter offered; the mode of instruction (e.gmlec-ture, seminar, independent study); standards of performancefor students; standirds for instructors; kinds of educationalmaterials used, inclu,',ng new media; and the methods of evalua-tion
ORGANIZATION: the administration of programs, scheduling procedures,registration piocedures, financial arrangements, targetgroups, locatialn, and similar matters.
139

118 .
INSTRUCTIONS
1. List:1 or 2 CURRICULA /REFORM ideas1 or 2 ORGANIZATIONAL/REFORM ideas1 or 2 CURRICULA/INNOVATION ideas1 or 2 ORGANIZATIONAL /INNOVATION ideas
2. Select:from the REFORM IDEAS the top priority itemfrom the INNOVATION IDEAS the top priority item
3. Chose:from those two items the TOP PRIORITY idea
4. SIGN the response form and mail postage has immediately
Thank you
SAMPLE RESPONSE FORMtilease do not let our examples-influence your response)
REFORM
trooLoi A RE f ORM
1. (more studies concerning urhirmacahlams)._
2 (Mare useilfAudioAisuatinstia) _
ow,Ahn 7 AT tONAI, FIE F ORM
3 traduced requisempnts for enia_LataXudvi..
, (increased financial aid forAmmigastusfyL___
INNOVATION
CURRICULA INNOVATION
5 men role innnlimmehing) ___
(studies in ecology)
fitt.AWATIONAL INNOv A r ION
(zitimnpacticiationAn the seem-in oteciucationorncesmsj_
is (citizen's with eme/Sne.permitted to set uarlishausingistailabfacilities)
PLEASE SIGN AND MAIL IMMEDIATELY
REFORM PfLeURfTYit ot the 41
IOLA OF HIGHEST PRIORITYel the ptegout 2i
;NNOV A I ION PRIORITY ,1 of 14..41
Response form RD1, NYS
EPRC/SURC
NAME
3
SPECIAL NOTE: Please remember to sign your name to the response form.
While you will remain anonynious throughout the study, we have no way of
knowing which group you are a member of without your name. It makes it
impossible to include your responses to this important study. Thanks.
Fig. 1Continuation 140

REFCRM
CtiFtRICI4A REFORM
1.
2,.
.
ORGANIZATIONAL REFORM
3.
4.
.41-
00.____-
p- INNOVATIONr0 , CURRICULA INNOVATION00rtr- 5.'00
see 61rr-,0p ORGANIZATIONAL INNOVATION
7
8
PLEASE SIGN AND MAIL. IMMFMATELY
141
N
REFORM PRIORITY- 11 of the 4)
-7%
IDEA OF HIGHEST PRIORITY(1 of the previous 21
INNOVATION PRIORITYIT of the 4)
Response form RD1 NYS
EPRC/SURC
NAME
142
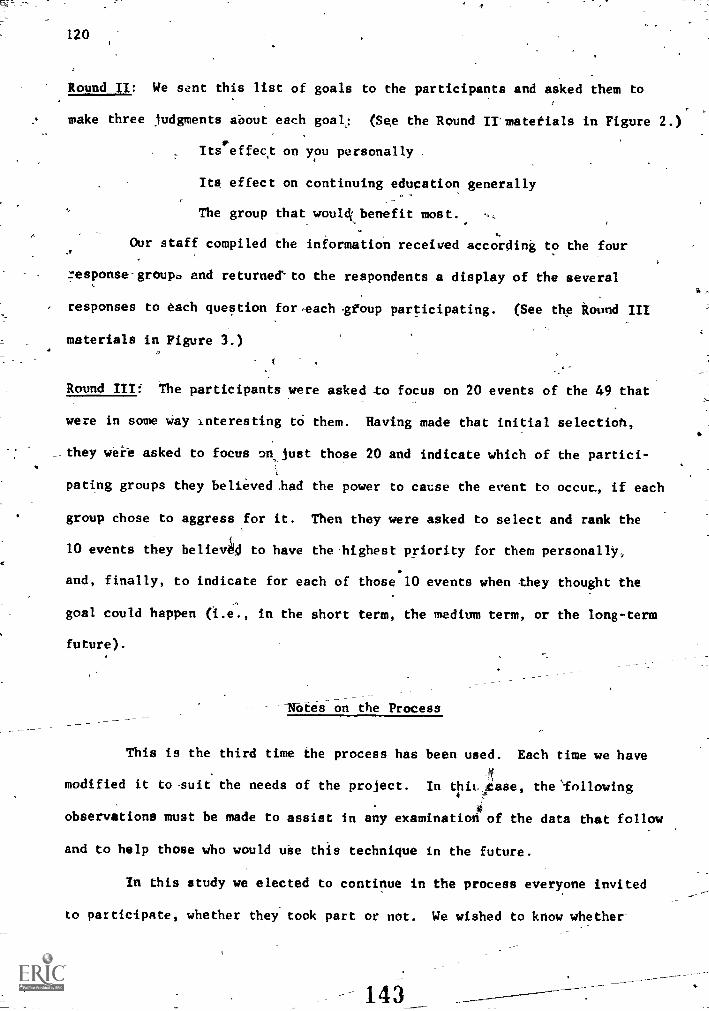
120
Round II: We sent this list of goals to the participants and asked them to
make three judgments about each goal,: (See the Round II materials in Figure 2.)
Its effect on you personally .
Its effect on continuing education generally
The group that would( benefit most.. ,,
Our staff compiled the information received according to the four
zesponse-groupo and returnelkto the respondents a display of the several
responses to each question foreach foup participating. (See the Round III
materials in Figure 3.)
Round III: The participants were asked to focus on 20 events of the 49 that
were in some way interesting to them. Having made that initial selectioh,
__they were asked to focus onjust those 20 and indicate which of the partici-
pating groups they believed had the power to cause the event to occur, if each
group chose to aggress for it. Then they were asked to select and rank the
10 events they beliel4d to have the highest priority for them personally,
and, finally, to indicate for each of those 10 events when they thought the
goal could happen (I ., in the short term, the medium term, or the long-term
future).
Hnt-es on the Process
This is the third time the process has been used. Each time we have
modified it to suit the needs of the project. In thit, ease, the\fnllowing4 ,7
observations must be made to assist in any examination of the data that follow
and to help those who would use this technique in the future.
In this study we elected to continue in the process everyone invited
to participate, whether they took part or not. We wished to know whether
143

121
people would ge\ n or out, depending on the nature of each successive
inquiry. We have no information from this study that tells us anything
definitive.
The study was conducted in-the busiest academic period--February
through June--and our level of participatiOn (about 20%) was greater than
expected.'
There is a tendency to forget what the lumbers in the data-represent.
It i4 imperative that the size of a sub-group's sample be considered when
making comparisons across groups.
While it is necessary to use numbers to display these impressions or
. 'feelings about goals, they in no way reflect what people want. They can
inform our, intuition and can help guide our thinking, but, in themselves, do
not tell us what people will really want once they have access to these
changes. This is a process of value only if itiis continually updated and
the priorities operationalized.
The Sample
A total of 445 individuals were invited to participate in the Focus
Delphi. They were drawn from fivel distinct groups of people. The five
groups and their numerical makeups were:
Policy Advisor /Influence- Structure 72
Deans and Direotofs 47
Faculty 210
Clients 116
Organizations (47)
Students --- (69)
Clients and students were grouped together as one group.
While the data for the2M-dy---Obi.ironly four groups, the researcher
was interestelLin---exarthirng the differences that might exist between those_An41-tridniriwho purchased service from continuing education programs asindividuals and those who came is members of organizing groups.
144

122
Fig. 2. Focus Delphi Round II Materials____-----
145
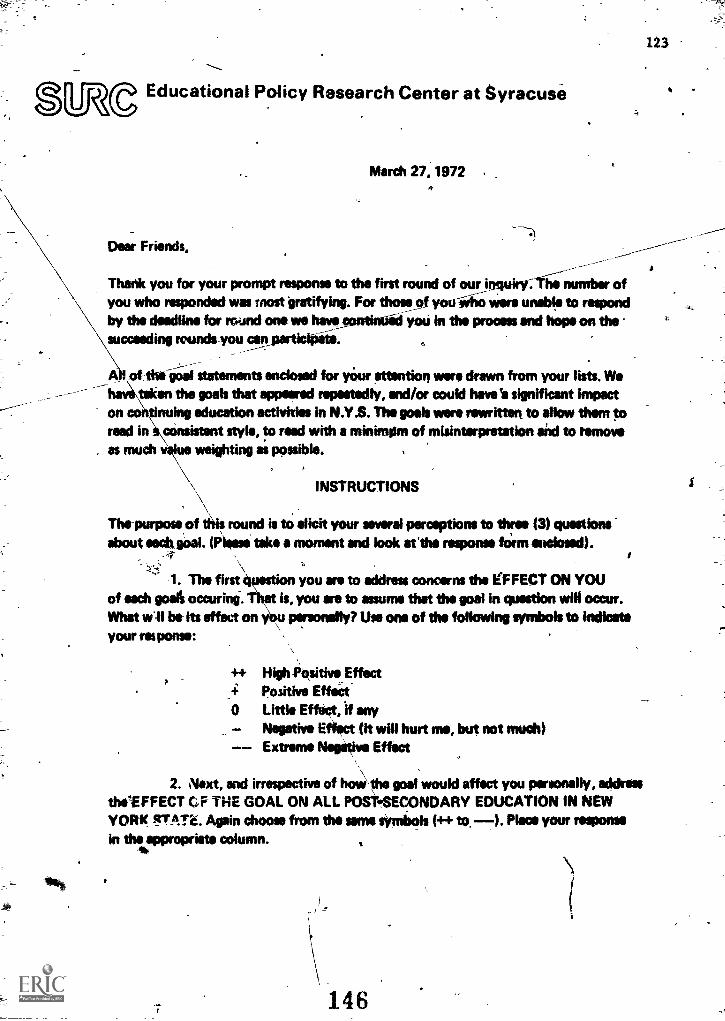
SMCEducational Policy Research Center at Syracuse
March 27,1972
Dear Friends,
123
_ ------_ --____----
Thank you for your prompt response to the first round of our_inquirf:The number ofyou who responded was most -gratifying. For those otyou who were unable to respondby the deadline for round one we hawse in the process and hope on thesucceeding rounds you cartparticit.
A ofthegoal statements enclosed for your attention were drawn from your lists. Wetoken the goals that appeared repeatedly, and/or could have h significant impact
on timing education activities in N.Y.S. The gosh were rewritten to allow them toread in *insistent style, to read with a rninktiom of misinterpretation aid to removeas much weighting as possble.
INSTRUCTIONS
The purpose of thus round is to elicit your several perceptions to three (3) questionsabout each goal. Whose take a moment and look at'the response form enclosed).
-4
1. The first \goad:ionof each goali occuring.What w11 be its effect onyour response:
you are to address concerns the EFFECT ON YOUis, you are to assume that the goal in question will occur.
personally? Use one of the following symbols to indicate
++ High Ositive Effect4: Positive Effect0 Little Effact, if any
Negative Effect (it will hurt me, but not much)-- Extreme Novick. Effect
2. Next, and irrespective of hossst\ he goal would affect you personally, addressthe EFFECT CF THE GOAL ON ALL POOSECONDARY EDUCATION IN NEWYORK STATk. Again choose from the same symbols (++ to ). Place your memo/in the appropriate column.
sip
146
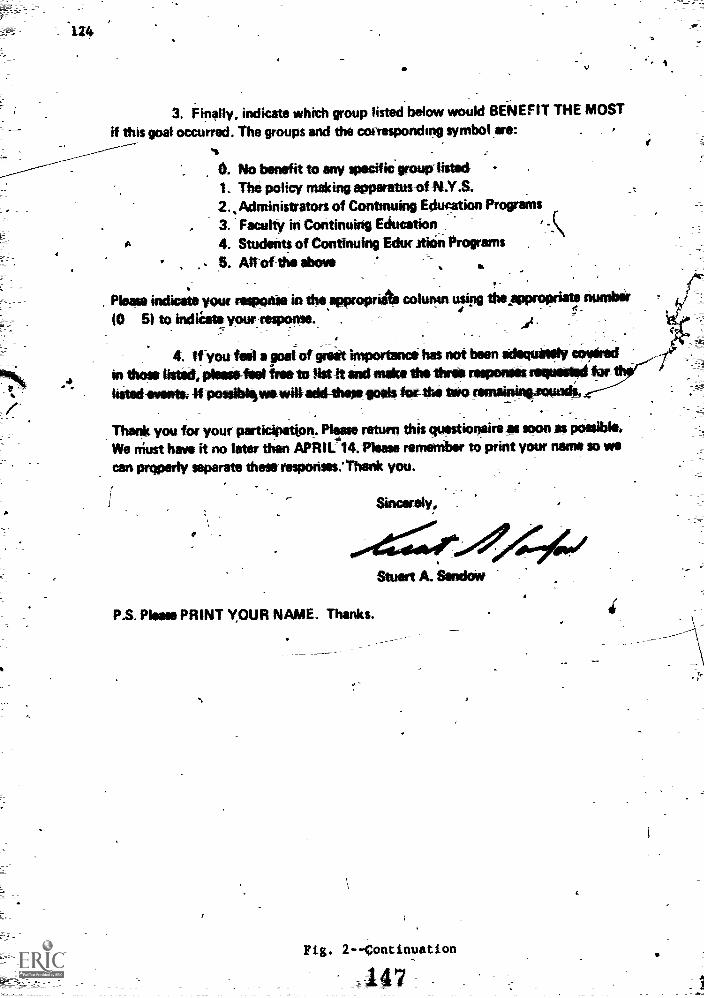
3. Finally, indicate which group listed below would BENEFIT THE MOST
if this goal occurred. The groups and the cocresponding symbol are:
6. No benefit to any specific*group listed -
1. The policy nuking epperatinf N.Y.&2. , Administrators- of Continuing-Edustation Programs3. Faculty hi Continuing Education j4. Students of Continuing Edit( Akin ProgramsB. Aft-of-the above
Please indicate your response in the appropriate coluam Ting the.eppropriate.(0 SI to Macaw yourresporric
4. If you feel a goal of great_ importance_ has not beenin those listed, pism-fait Ilse to list It and make the three responseslisted events. If -possiblg was W add-these goals for the trio
Thaw_ you for your parts on, Please return this truestionaire_esWe must has it no later than APRIL 14 -Please remember to print your name so we
can PAM* separate Mew responses:Thank you.
P.S. Please PRINT YOUR NAME. Thanks.
Sincerely,
Stuart A. Sandow
Fig. 2Continuation

-
N.Y.S.'Department,af Education Planning Study
GOAL
°
NAME
EFFECT ON YOU
4-, 0, (44
EFFECT ONPOST SEC-10
4-, 0,
BENEFICIARY
to, 1, 2, 3, 4, 751
1. Monroe Community College has taken the leadtr. publishing a Dean's List for Evening Dirviaionstudents:
.
. .1 _ --.
.
...,
.
,
'
*.
,
'2. ThO New York State Legislature has passed aW11 to offer tax incentivAlto individuals whodo not enroll in continuing activities
F.
0/.
.
.
.
.
.offered within the State,declaringan excessivenumber of underemployed degree holders.
. .
-3. The N.Y.S. Regents has decided that all tenuredpositions will be reviewed every 8 years. .
jam".
4. All fatuity in the N.Y.S. system of higher eu..
cation must participate in at least. 3 credits ofinstruction in their field every ocher year and atleast three credits of'instruction in a relatedarea every other year.
-71
0
.
.
.
,
.
_
.
.
.
5. The Department of Education has announced theavailability of 37,000 taped lecturis availableto any citizen through the public library system.The tapes are drawn from key lectures of faculqwithin the State University System. . .
v -.
, .
..
.
6. The Department of Education has initiated acentral clearing house for all non-dAgcee grantingactivities offered under its aegfs anywhe,-e inNewYork State. The number to call toll free is ,
_
«
.
--------.....___.
7. The Rockefeller Foundation has awarded a grantto the Department' of Education to help underwrite
13 experimental evening care centers for thechildren of parents enrolled in night courses.
.
.
149

C)O=
o=
r.O
130
it`GOAL.
116043-2 OF 7
EFFECT ON
EFFECT ON YOU POST SEC:E0 BENEFICIARY
+, 0, +, 0 -, (0, 1 2. 3, 4, 5)
8. Yht Cornell University Extension school hascor.pleted prapnrations to offer 31 one creditcro:'ses in the evening division in specific areas.
, rurging frog town government to interior designand decorating.
9. funds have be e available by the state
for three community colleges to expand their infor--marian and counseling services to include evening
ana part -tine students.
ip-6......."
_-- ---...
10. A.
a
of community colleges have insti-
tuted rf,g1stration -by -mail system that includes
both full and part-time programs.
.
------.."---
11. The State Education Department has published
r set of performance criteria for tile granting o.f----
to evening students that is sio144eantiir-,%_.
its rigidity and toughness of standardo.
.
..........--- ,.-__
12. ,Courses are now being offered in all but twocolleges in Dew York State in futures and fore--casting. *A.:JrAre open to evening division students.
.
-..---..........-w. --
13: lile State Universi.ty System has withdrawnaupporr for 248 courses offered at its- several-
cz,tpuses deemed lees than adequate in course con-
tent to warrant credit from an academic institu-
tion. The courses may be offered at the discretionof f*Allty and only if -..ore than 15 students enroll. .
14. The State Education Department has informedall administrative personnel that they must offer
at least one course each calendar year.
15. Through the New York State Chamber of Commerce
a non-credit course is now available to residents
of 14 communities detaiIing,tne furictions and
ozerations of all social ee*vices available to
them in the r...mmunity.
-

04
GOAL
111111043-U3 OF 7
EffECT-12k)EFFECT ON YOU POST SEC -ED BENEFICIARY
(++, +, 0, , --) ( + +. +, 4, . ---) (0, 1, 2, 3, 45)lb. The Continuing Education Office at SyracuseUniversity has announced that 41 of its coursesare now available in more than one instructionalmode. rtudents select their option at registra-tion: lecture, videotape, audio cassette, orprogrammed instruction.
.-,...---
17. Students attending any of tihe State UniversityCollege campuses full or part -t4tne may now apply
for speci=1 degree programs thelontent of whichis self.selectei1 and leads to a Bachelors ofAssorted Arts/Sciences.
---, __ --
_-
18. The Alumni Associations of the big six privateuniversities in New York State have begun arecruitment drive aimed at all graduates to invitethem to return for continuing education activities.This drive is hoped to increase revenues anabolster community interest in the institutions.
_
19. Ithaca College has initiated a placement center
for its older pct!-time students. Other institu7tions are watching the program with interest.
,.O. Cortland College, Ithaca College, rornell
University and_Syracuse University h,ve consoli-
dated theit,Departments of Film and Television.The saving in equipment and the increased
excellence of staff is seen as highly beneficialto all involved.
.
.
21. The continuing education ograms of all theinstitutions in the Albany area are now publishedin 'one cateog for use by area residents. Admissionto each institutions programs is handled _by onecentral office.
------
22. Nassau Community College has announced thatits facilities are available to any individual withspecial skills who is willing to teach them. Thecourses will be non-credit for the first year whilethe program is evaluated. Tuition will defer thecosts Incurred by curriculum specialis who willaid in the preparation: of materials.
\\
\\
\
152153
IN;

154
GOAL
EFFECT ON YOUEFFECT ON
POST SEC-ED
(++, +. 0,
BENEFICIARY
(0, 1, 2, 3, 4, 5)
______23 -rThe-F6tdPo,mdation has awarded a grant toCUNY-14_employ 15 Roving Lecturers who will offercourses rit---ech of the City's' colleges baithe same
semester.
- 24. The Continuing Education Office at Cornell,with the assistance of the Telephone Company andthe Chamber of Commerce, has compiled a "Blue Pages"
listing the human resources of the city, ex-PeaceCorps, Vista volunteers, reti.id experts, etc.
1
.
25. The Administration of the Continuing EducationPepartment at New York University has invited, allstudents to make suggestions to it concernilnipolicy and programs for next years offerings./
1
I
a.+t
26. The Regents of the Stdte of New Yott.6-aveasked colleges in each region of the Atete:to plan
their offerings cooperatively. ?
27. Syracuse University has dissolveddts All-University Board composed of studexiir faculty,administrators and staff. The aneoyncement Statedthat decisions in the future would be made by, those
accountable and responsible. ,.
28. The State Education Department has invitedspokesmen from industry and the professions to Reep
them informed of their needs-to help plan their
continuing education offerings.
- ----.
29. The State University at Albany is evaluating
a proposal to decentralize its continuing educe.tion offerings and locating courses in mini-centersscattered throughout the 'ity.
.
30. Through a grant from the -ustice Departmentthe community colleges in the State UniversitySystem are developing courses in crime control,crime motivation,and prevention,to be offered to
ilia ..,-...61 ,ablic thrclazh ccntiauitz_cducztItt,
.
1550
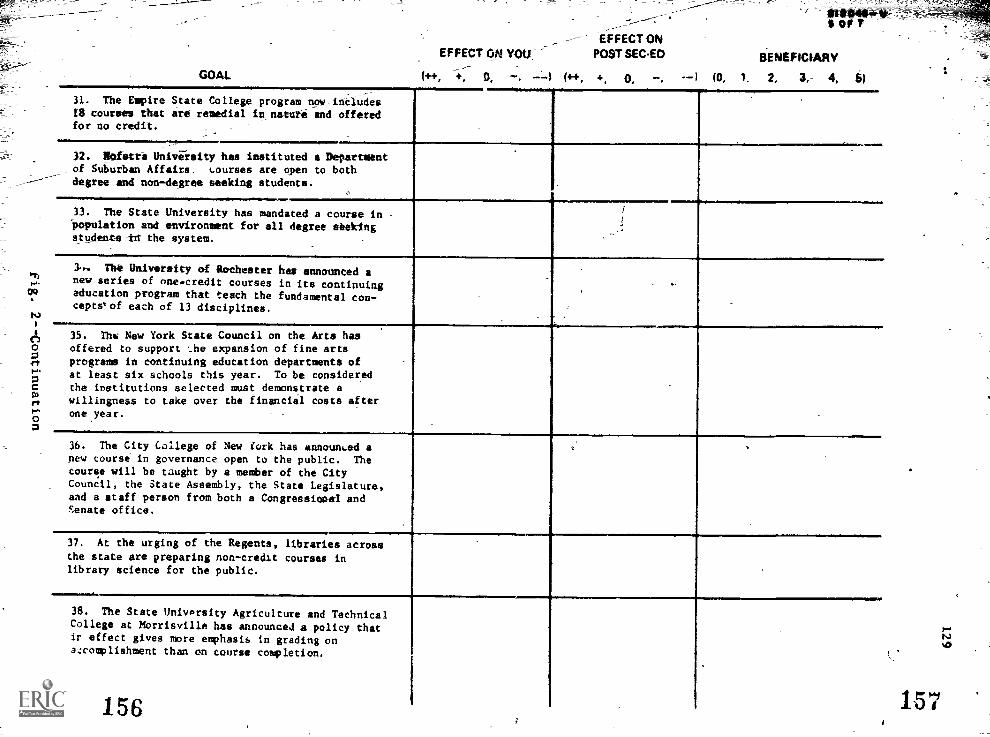
GOAL
EFFECT ONEFFECT ON YOU POST SEC-ED
(+4., +, a, 114, +. 0,
BENEFICIARY
(0, I. 2, 3, 4, 5). _--
31. The Empire State College program now--intludes18 courses that are remedial in_nature and offeredfor no credit.
32. Nofstra University has instituted a Departmentof Suburban Affairs_ t.oursei are open to bothdegree and non-degree seeking students.
33. The State University has mandated a course inPopulation and environment for all degree seekingstudents -trr the system. .--
3-. The University of Rochester has announced anew series of one.credit courses in its continuingeducation program that teach the fundamental con -cepts'of each of 13 disciplines.
,---
35. The New York State Council on the Arts hasoffered to support Lim expansion of fine artsprograms in continuing education departments ofat least six schools this year. To be consideredthe institutions selected must demonstrate awillingness to take over the financial costs afterone year.
36. The City College of New York has announced anew course in governance open to the public. Thecourse will be taught by a member of the CityCouncil, the State Assembly, the State Legislature,aad a staff person from both a Congression -ei andSenate office.
37. At the urging of the Regents, libraries across
the state are preparing non- credit courses inlibrary science for the public.
......
38. The State University Agriculture and TechnicalCollege at Morrisville has announced a policy thatit effect gives more emphasis in grading onazcoaplishment than on course completion.
1 151

*.
158.
GOAL
EFFECT ONEFFECT ON YOU POST SEC -ED BENEFICIARY
+, 0, . (++. +, (0. 1. 2, 3, 4. 5) .
39. Students at New York University entelled.innon - credit remedial courses prior to formaladmission are demanding credit for those courses.
.,................_.....
.
-........
40. Yeshiva University is experimenting with a
new internal management system that ignoresdifferences between credit/non-credit, youth/adult,degree/non-degree offerings. Students apply aftertwo years for a program appraisal and work out
. sliding credit for their studies.
.
.
41. ContinUing education programs at State gni-versity institutions are now following an open doorpolicy for anycourses offered under its aegis. .
.
;41..4
, ..-, , _`1
42. In a hotly-contestel policy statement theAAUP has come out in favor of modifying standardsfor appointmentti-to_locus more heavily on expertisein a field rather than on credentials held, inchoosing faculty appointments.
-1^-1,1.,
'l
43. The 'tate has increased its financial supportfor students enrolled in health related programs.
44 New York State is exploring a proposal thatwould have the effect offending continuous learningthrough age 16. The proposal involves guaranteeingeach resident fourteen years ot free access tothe public schools of the .Late that can be deedthroughout the individual life.
Al
45. Following the Yale Model, Syracuse, and Cornell,and New York University have advised their studentsthat tuition can be deferred at the Universityuntil after graduation to eliminate the need forstudent loans from commercial banking compmnies.
46. The 'tate-owned institutions now charge atuition, competitive with the drivate units in t%estate and the students receive vouchers to attendwhatever school they wish.
.
159
0

r
GOAL
EFFECT ON YOU
(++, +, 0, +,
1t1043 -uOn
EFFECT ONPOST SEC-ED BENEFICIARY
0, (0, 1, 2, 3. 4. 5)
47. Part-time evening students are now eligAble
for the Federal student loan guarantee program.
4-8. A bill is before the State Legislature toeliminate student tuition completely, for anyonefull or part-time, with income below the federal
poverty level In effect all students over 18 -
_declaring themselves independent are thought to
be-eligible.
...
49, The Middle StatesAccrediting Association hasissued a policy statement to Live-effect that
students and faculty involved in part-time orcontinuing education activiiee need not meet thecame requirements as full-time degree seekingprograms demand.
'
-.. .
,
.
160
#
161

J
s
.132
s
A
4.
..4
c,
s...
4
Fig, 3.. Focus Delphi Round III Materials
/ I
t
I
1162 ')' ,
a
Y
,
,e--i. _

,r
Educational Policy Research Center at Syracuse
0Dear Friends,
April 28, 1972
4-
Thank you for your prompt response to the secOnd round of our inquiry. The numbericipatedAof you participating continues to be most gratifying, For'those of you unable,,to respond
by the deadline we have continued you-in the process and hope that you '-lift; part
in this, thelast round. The most time coniuming-and difficult found is now behind us.
{The enclosed forms oncelgain list thagoals chosen from thine you submitted
,in Round I: /;
- InRound II you`-addressed three. (3rquestions for each goal: EFf-u-'. ON YOU,' EFFECT,ON SOCIETY, and BENEFICIARY.- All-your responses to /hose questions are displayed on the enclosed response
form. They are there to aid yOu in' your deliberations for this round.7
EXPLANATION-OF THE DATAN4.
- To the immediate right of each goal statement is a column listing the nuritboys
1 - 4. These refer to the foofparticipating groups:
1. The relevant policy making apparatus of NYS2. Administrators/Deans of Continuing Education Proorarns
3.. Faculty in Continuing Education4. Stub ntAlients of Continuing Education Programs
NOTE: Please farniliarize yourself with these numbers and groups.
:- Column I (EFFECT ON YOU) displays the Percentage of respokdents from
44410 group that felt the goal had a negative (-), neutral (0), or positive (+)
effect for themselves.
- Column II (EFFECT ON SOCIETY) displays the percentage of respondents
from each group that felt the goal had a negative (--). neutral (0), or positive (+)
effect on society.Column III (BENEFICIARY) displays the percentage of respondents of each
group and their respective estimates of who benefits.
NOTE: (NONE = No Single Group & 5)=- All Grouptsetally)- Take a momentrand exaine,thi first goal sta t and appropriate data.
- Familiarize yourself with the four categories of participants. /- BECAUSE OF THE LARGE AMOUNT OF DATA TO BE EXAMINED IN YOUR
DELIBERATIONS YOU ARE TO RESPONID IN THIS ROON10 OILY LY TWENTy
(20) ITEMS OVOST INTEREST TO YOU. (most-familiar with, interested in, opposed
to, etc.) YOU ARE TO DEAL ONLY WITH THOSE TWENT EVENTS. Please read
through the 49 events and make your setectien now.
163

134
!AISTRUCTIONS
The purpose of this final round is to elicit your thoughts about three (3) questions foreach of the TWENTY (20) goals you 'elected.
1. In column IV (PERCEPTION OF PbWER) you are asked to indicate 6 :di of theweups listed (choose only oee) has the power to ca u (' the goal to ow-ar if they chooseto. Please use the numbers assignee to each group (1-4 or 0, if no single group.) .
2. In Column V (PRIORITY) select from the TWENTY GOALS you chose to dealwith the ten most (moment to you and rank them in order of their priority for action.(1-10, one DJ would be the highest priority item)
3. In Column VI (TIME FRAME k based onall the data and your perceptions of powerand relative priority, indicate when you think these goals can or should occur. Please usethe fullowing coda):
SHORT TERe4 (ST) Within 18 monthsMEDIUM TERM(MT) Between 18 months and 3 yearsLONG TERM (LT) Later
Finally, thank you again for your participation. You have been most helpful. As soon aswe have compiled thethita and written our report, you will receive a copy for yourWE. WILL BE SENDING COPIES OF THE ! 0ORT ONLY TO THOSE OF-YOU WH:JPARTICIPATE IN THE LAST ROUND, so phase take the time now to respond.
WE MUST RECEIVE YOUR RESPONSES NO LATER THAN MAY 19. PLEASEPRINT YOUR NAME SO WE CAN PROPERI& SEPARATE THE RESPONSES.THANK YOU.
Stuart A. Sandow
P.S. PLEASE PRINT YOUR NAME. Thanks
Pfp1 t- i An
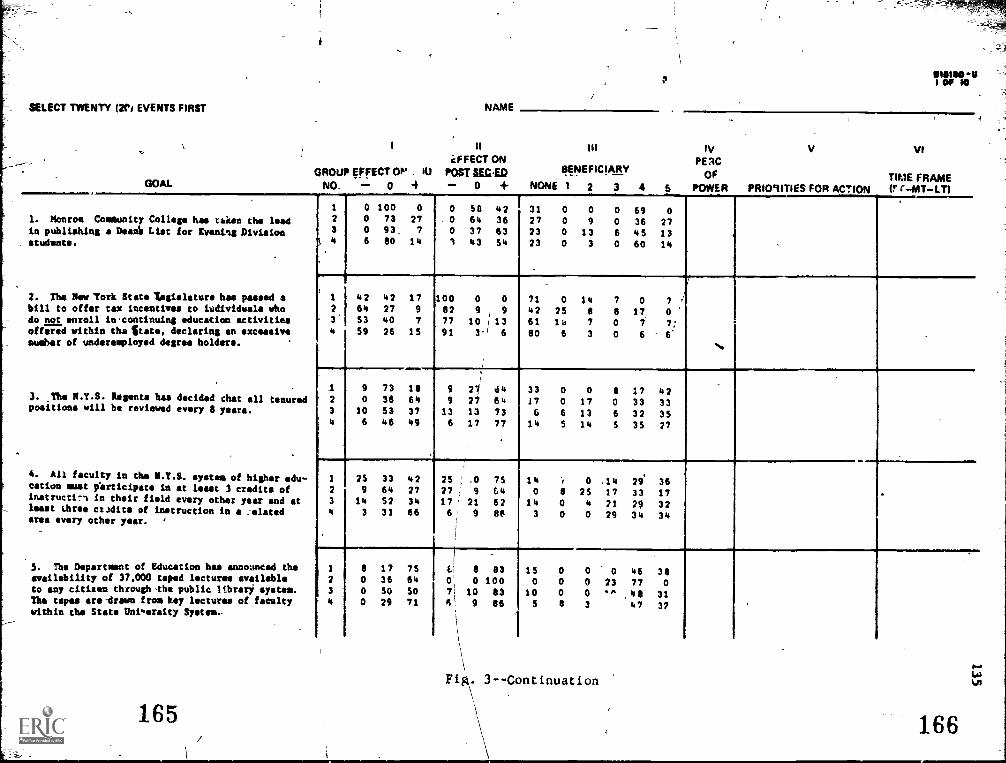
SELECT 'TWENTY (2f, EVENTS FIRST
1. Monroein publishinstudents.
2. The Dewbill to offs-do not enrol
offered withauthor of us
3. The N.Ypositions w
4. All fatcation mustinstrotttrtleast threearea every
5. The Depavailabilitto say citiThe tapes a
within the
GOAL
NAME
CFFECT ONGROUP EFFECT . IU Pon SEcgp
NO. 0 4 0 +
Ill
BENEFICIARY
NONE 1 2 3 4
1000OF of
IVPE RC
OFS POWER
V VI
TIME FRAMEPRIO9ITIES FOR ACTION fr r- -MT -LT)
Community College has tt.ien the leadg a Dee& List for Evening Division
Tort State 'Legislature has passed ar tax incentives to ludividuals who
1
2
3
4
0
0
06
1007393_80
0
27124
0
--O
0
1
SO 4264 3637 6343 54
31272323
00
0
0
09
133
0 690 366 450 60
027
1314
1
2
4264
4227
179
10082
0 0
91 ,
9
7142
0
25148
7 0
8 17 01 in continuing education activities 3 53 40 7 77 10 1 13 61 10 7 0 7 7;in tha State. declaring an excessivederemployed degree holders.
4 59 26 15 91 1-1 6 80 6 3 0 6 6'
9 73 18 9 2/ -44 33 0 0 8 17 42S. Regents has decided chat all tenured 2 0 36 64 9 27 64 17 0 17 0 33 3311 be reviewed every 8 years. 3 10 53 37 13 13 73 6 6 13 6 32 35
6 46 49 6 17 77 14 5 14 S 35 27
'try in the M.Y.S. system of higher edu- 1 25 33 42 25 ,1 .0 75 14 "9 0 .14 29 36Orticipate in at least 3 credits of 2 9 64 27 27 9 64 0 8 25 17 33 17in their field every other year and at 3 14 S2 34 17 . 21 62 14 0 4 21 29 32cladits of instruction in a :elatedther year.
artment of Education has announced the
4 3 31 66 61 9 88 3 0 0 29 34 34
1 8 17 75 t 8 83 15 0 0 0 46 38r of 37.000 taped lectures available 2 0 36 64 01 0 100 0 0 0 23 77 0ten through,the public library system. 3 0 50 50 71 10 83 10 0 0 " 48 31re-drawn from key lectures of faculty 4 0 29 71 4,
t
9 86 5 8 3 , 147 32State Uniersity System.
1
\
it\
165
Fig. 3-- Continuation
166

IIEFFECT ON
GROUP EFFECT ON YOU POST SECED
GOAL NO ^ 0 + -= 0 +
6. The Department of Education has initiated acentral clearing house for all non-degree grantingactivities offered wider its aegis anywhere in NewYork State. The number to call toll free is
7. The Rockefeller Fou:datior has .warded a grantto the Department of Education to help underwrite13 experimental evening care centerr for thechildren of parents enrolled in right courses.
8. The Cornell University Extension school hascompleted preparations to offer 31 one creditcourses in the evening division in specific areasranging from town government to interior designand decorating.
9. Funds have been made available by the $titefor three community colleges to expand their infor-mation and ca.aseling services to include evening
and part-time students.
10. A number of community colleges have insti-tuted registration-by-mail system that Includesboth full sod part-Use programs.
167
in
BENEFICIARY
NONE 1 2 3 4
IVPE RC
OF
5 POWER
V VI
TIME FRAMEPRIORITIES FOR ACTION ISTMTLTI
1 0 33 67 0 8 02 13 0 7 7 33 402 0 45 55 0 9 01 17 0 8 8 50 173 10 53 37 10 17 73 17 C 27 7 31 774 0 SO 50 0 79 71 18 15 9 0 32 26
1 0 75 25 0 - 8 92 13 0, 7 7 60 132 0 45 55 0 9 91 0 01 13 70 67 0
3 10 73 17 7 3 90 7 3 3 13 63 104 3 69 29 0 11 83 3 0' 3 5 82 8
1 0 67 33 b 33 5b 15 0 0 0 69 152 18 82 0 0 45 55 27 9 0 0 54 03 3 90 10 0 17 83 16 0 3 6 65 104 0 43 57 3 9. 89 3 0 3 6 75 14
0 83 17 0 25 75 15 0 0 8 5' 232 0 64 36 0 9 91 15 0 8 6 62 8
3 0 80 20 0 17 83 3 3 10 6 58 144 0 54 46 0 0 100 0 0 5 3 81 11
1 0 92 8 0 25 75 7 0 13 7 60 132 0 SS 45 0 9 91 0 0 25 0 50 253 0 77 23 0 7 93 3 0 23 3 52 194 3 57 40 6 0 94 2 2 17 5 49 24
'rig. 3--Continuation
168

GOAL
II
EFFECT ONGROUP EFFECT ON YOU POST SECECI
NO 0 + 0 +
III
BENEFICIARY
NONE I 2 3 4
fV
PE RC
OF6 POWER
V
PRIORITIES FOR ACTIONTIME FRAME(ST MT LT)
II. The State Education Department has published 1 17 25 58 42 8 50 59 0 0 0 a 33a set of perfole criteria for the granting of 2 SS 27 18 73 9 18 42 0 8 17 33 0
- degrees to evening students that is significant in, 3 7 60 33 13 3 83 7 3 0 3 41 45- its rigidity and toughness of standards. 4 14 46 40 26 9 66 22 8 11 8 14 36
1 0 58 42 0'
42 58 31 0 0 8.46 '15
12. Courses are now being offered in all but two 2 0 73 27 0 36 .64 45 0 0 0 55 0colleges in New York State in futures and fore- 3 0 89 11 4 62 35 58 0 0 4 3't 4casting. All are Open to evening division students. 4 9 64 27 9 24 67 25 0 0 0 63 13
" .
13. The State University Sistem has withdrawn .support for 248 courses offered at its several 1 .> 17 42 42 33 8 58 36 14 7 0 21 21campuses deemed less than adequate in course con- 2 18 64 18 45 9 45 36 18 0 0 27 18tent to warrant credit from an academic institu- 3 0 79 21 7 28 66 21 11 14 7 21 25t /04 . The courses may be offered at the discretionof faculty and only if more than 15 students enroll.
4 9 74 17 17 20 63 14 , 11 11 14 31 17
14. The State Education Department has intormed40 30 30 40 20 4C 33 8 25 8 8 17
all administrative rt.rsonnel that they must offer 2 36 27 36 36 36 27 33 17 25 0 A 17
at least one course each calendar year. 3 14 64 21 21 25 54 43 7 18 0 18 144 6 71 23 14 26 60 26 8 15 15 15 21
. '
15. Through the New York State Chamber of Commercea non-credit course is now minable to residents 0 58 42 0 25 75 73 0 0 0 $4 23
of 14 coossunities detailing the functions and2 0 50 50 0' 30 70 30 0 0 0 "0 20
operations of all social services available to0 73 27 0 27 73 13 3 7 0 53 23
they in the community.3 49 51 6 23 71 24 3 3 5 32 32
169Fig. 3 Cont inuat ion

GOAL
i
EFFECT ONGROUP EFFECT It4 YOU POST SEC-ED
NO 0 - 0 +
111
BENEFICIARY
NONE 1 2 3 4
Iv
PE RC
Of5 POWER
Vi
TIME FRAMEPRIORITIES FOR ACTION IST---MT LT)
16. The Continuing Education Office at Syracuse,-
University has announced that 41 of its courses 1 0 f3 27 0 18 82 15 Ii 0 8 38 38
are now available in more than one instructional2 .0,'45 S5 0 9 91 8 0 8 8 62 15
04C 70 30 13 13 73 11 0 1% 14 43 17mode. Students select their option at registra-that lecture, videotape, audio cassette, orprogrammed instruction.
.
0 69 31 6 3 91 6 0 0 8 51 37
,.
L7. Students attending any of the State University1 18 55 27 20 10 70 36 0 0 0 55 9
:tillage campuses full or part-time meg nw applyfor special degree programs the content cif which
2
3
18 457 73
3620
1830
9
107360
1870
0
3
0
3
0
3
45SO
3820
La self selected -and leads to a Bachelors oftssorted Arts/Sciences.
a 6 46 49 20 3 77 17 3 4 0 S7 17
.
0
Iii. The Alumni Associations of the big six privet*Iniversities in New York State have begun a 1 0 SO 50 10 10 80 18 0 9 0 18 S5
recruitment drive aimed at all graduates to invite 2 9 45 45 9 0 91 9 9 9 0 18 55
them to return for continuing education activities. 3 7 50 43 7 23 70 16 0 26 in 1C 32
this drive is hoped to increase revenues andtwister community interest in the institutions.
4 3 77 20 9 17 74 17 6 25 8 19 28
19. Ithaca College has initiated a placement center. 1 0 73 27 0 id 82 19 6 6 6 50 13
for its older part-time students. Other institu- 2 0 55 45 0 4-4 71 18 0 0 0 55 27
tions are ,..etching the program with interest. 3 0 80, 20 .4),-' 17 83 7 u 3 0 72 17
4 0 54 46 ,f0 3 97 3 0 6 0 80 11 .
....
20. Cortland College, Ithaca College, CornellUniversithand Syracuse University have causal- 1 9 45 45 ,0 9 91 8 17 17 0 A se
dated their Departments of Film and Television. 2 0 64 _48 0 9 91 0 15 V 9 31 38
The saving in equipment and the increased 3 0 87 ) 44 0 17 83 9 3 30 9 15 33
excellence of staff is seen as highly beneficial 4 0 78: 26 0 11 89 11 0 7- 8 19 3S
to all involved. , ,,i-
..1
4 .... -
1
171Fig. 3--Continuation
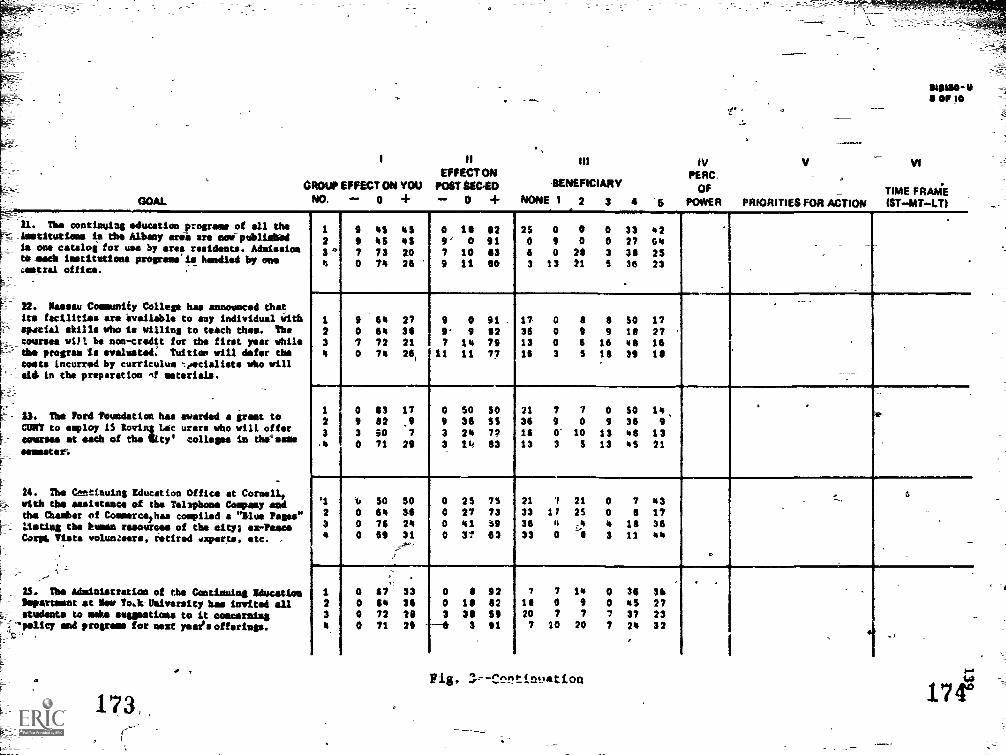
EFFECT ONGROUP EFFECT ON YOU POST SEM)NO. .,* 0 + 0 4-
In
BENEFICIARY
NONE 1 2 3
IVPE RC.
OFPOWER
V
PRIORITIES FOR ACTION
NOM- SIOP 10
VI
TIME FRAME(ST-MT-LT)
-II. The continuing education programa of all the---: imetitutioae in the Albany Amu are now-pub/iaked-_- lit-one catalog for 1041 by ants residents. Adnissica
to _each institutions programs' is handled by oneastral office.
11. Nassau Comity College has announced thatits facilities are insatiable to any individual With4040%1 skills who is willing to teach thee. The
ern be non-credit for the first year whilethe prover is evaluated: 'tuition will defer the
costs incurred by curriculum -;,nreialiste who willin the preparation qf neterials.
-
13. The Ford -foundation has awarded a grant toCURT to employ LS loving Let urine who will offercourses at each of the Sly' colleges in the-sameester'.
14. The Continuing Education Office at Cornell*-. with the sesietance of the Tellphons Company and
the Chamber of Cemeercephea compiled a "Blue Pages":little* the kern moms& of the city; ex-Peate
[Corps Vista volunteers, retired umperts, etc. -
':-'-'
[ IS. The Adainistration of the Continuing Educative[ Mspeztaent at kw IDA Ileivsrsity ham invited allr students to mho suggistioeut to it concernies
; 'polity and programs for next year's offerings.
123PS
9 05 059 45 457 73 200 74 26
82'79
180
1011
$2918380
25063
090
13
0 00 0
20 321 5
33273836
426%2523
-
.
1230
9 60 270 60 361 72 210 74 26
1
99.7
11
09
1011
91.827977
17361316
0003
o 89 96 16S 111
so180839
17271618
.
106317-
9 82 93 90 70 71 29
0933
SO36241%
SO557283
21361613
79O3
7 00 9
10 13S 13
SO364805
149
1321
. ..
#
23
I; SO 500 64 360 76 200 69 31
--4-
0000
2527013 1
75736963
2133363 3
'7
it40
21 025 0_4 li,..-I 3
78
1 $1 1
43173644
.
_ _a
.
123
0 67 330 90 360 72 290 71 29
003
81838
3
9282S991
71820
7
707
20
14 09 07 7
20 7
36OS3724,
36272332
-. .,
Fig, 1--Cntints*tion
173,-. 1744)
1

U
EFFECT ONGROUP EFFECT ON YOU POST SEC-ED
NO. 0 + +
II I
BENEFICIARY
NONE I 2 3 41
iti
PERCOF
5 POWER. TIME FRAME
RITPRIOIES FOR ACTION IST-MT-LT)
1-------26-. The Rmgents of the State of dew York haveasked colleges ti each glen of the State to plan-their offerings cooperat velv. . ,
12. Syracuse University dissolved its AllIfeiversity Board composed a students, faculty.-administrators and staff. e announcement statedthat decisions in the future would be midi by thou.:.accountable and responsible.
...
,
12'
0940
25184843
75733057
017
3
-80-
1017
SI100
72-80
I0
1419
010
711
'I2011C19'
0040
00
AO46
73704635
.
S,
23
018II15
82736885
189
210
35363250
927_2935
S5363915
31453159
80e9
150
1921
8080
0943
383631_
9.
.,
,
I
I
1234
0000
17183140
8382-6960
0000
17970
839193
100
14000
211810
8
00
178
0A
03
79
2425
57734856
_ .211: The State -Education Doper sent his invitedepokessen fro.. industry, and the re/Missions ..o keepthen informed of their needs to help plan theitcontinuing education offerings.
29.' T9mnState ,Uni ersity at Alban is evaluatinga proposal to de ntralize its con inuing educe-tion offerings ah locating courses in mini centersscattered throughout the arr.
30. Through a grant from the Justice Departmentthe community colleges in the State UniversitySystem') are developing courses in crisis control,crime eotivation;Imi prevention, to be . offered tothe general public through continuing ',education.
1234
09
116
645-47574
36271420
15271120
270
2220
55716760
36173729
0-0
00
0fr86
017
40
36424051
27251614
. .
ti
..
23
0900
58366249
42553851
0903
330
3423
67916674
110
2320
14 \006
0840
0800
83di3 5 :26
21233849
1/.5Fig. 3(Continuation
1.4
11c

GOAL
t
GROUP EFFECT ON YOUNO. 0
The Baplreitata College program nor includes-oceans that are remedial in nature and offeredse credit.
Lr_
Maitre Viii city has inctituted a Department
&urban Affairs. Courses as open to bothas and monrdegree seeking students.
_
46 State Univeztty has mandated a course ,aslitc4o1 and environment for all degree-seeking;mate in the 'Wes.
The OnAvet4ity of hathester has an.ouncod a'Otis* of neepredit courser td its continuingatiri program Cher teach the fundamental con-ts of each of J diecipl10- .
e Tads Sev'Tor; State :ouncil on the Arts IAfeted to support the xpandoon of "fine arts-sirens is continuing edictal-1.n departrnnts of
least six schools this year. to be consideredinstitotions ielett,d must demonstrate a
ilingfines to take over the financial wets afteru year.
1 -17 S 2S2 9 64 273 0 90 104 C 6 1144
0 2 11O 82 15
.0. -93 7O 74 26
1 27 SS 12 18 64 le3 7 59 34
6 46 49
23
0 3 179 64 273 3 130 5 -15
23
67 259 45 5O 70 306 34 40
itEFFECT ON
!PC/SIM-ED BENEFICIARY
) + NONE 1 r 3 4
IV V VIPE Re.
OF TIME FRAME5 POWER PRIORITIES FOR ACTION (ST-MT-LT)
6 83 23 0 0 0 54 239- 27 64 1 9 0 0 64 90 20 0 1 0 0 71 73 17 60 14 3 0 6 56 17
9 9 2 25 0 0 0 50 25SS 36 0 0 0 45 1
0 27 73 13 0 0 10 63 137 :C5 11 15 0i 0 0 76 9
40 20 40 45 9 0 0 36 11
45 27 27 45 9 0 0 9 3611 ".4 66 30 4 0 0 30 3711 17 71 i7 0 6 49 26
4 33 67 31 0 0 0 54 1518 9 74 9 0 0 9 64 1
7 21 7. 79 0 0 4 57 113 3 59 40 0 52 1
42 50 46 0 0 0 23 3118 1 64 9 9 9 0 36 36
0 23 77 16 0 9 6 3 319 17 74 11 6 6 0 54 23
Fig. 3-- Continuation
171 178

GOAL
The City College of New York has announced a-se course in governance open to the public.- Thewars* will be taught by a ether of the Cityamncil, the State Assembly, the State Legislature,4 a staff pe-:son from both a Congressional andnate office. .
At the urging of the Regents, lioraries acrosse state are preparing non-credit courses inbrary science for the public.
The State University Agriculture and-TechnicalIltse at Morrisville has announced a policy thateffect gives more emphasis in grading on:osplishment than on course completion.
), Students at New York University enrolled inno-credit remedial courses prior to formalimission are demanding credit for those courses.
4 Yeshiva University is expo imenting with ait internal management systet .net ignoresfferences between credit /non - credit, youth/adult,/gree/non -degree offerings. Students apply afterro rre for a program ap- -*Leal and work ovtAdit -redit for their ..dies.
ii
EFFECTGROUP EFFECT ON YOU POST SEC-E
NO. 0 0
BENEFICIARY
?CONE 1 2, 3 4
IVPE RC.
OF5 POWER
V VI
J0110OF 10
TIME FRAMEPRIORITIES FOR ACTION (STMT-1.11
2
3
4
0
03
3
100828766
0
181031
8
9a3
42272712
04
085
38-2720*-
0
9
0
6
0
0
0
3
0
0
100
46 -1545 1833 37
56 29
1 8 75 17 8 42 SO 54 0 0 0 38 82 9 45 45' 9 27 64 27 0 0 0 36 363 7 67 27 7 27 67 21 3 0 0 45 314 0 54 46 0 23 77 29 0 6 0 34 31
,0 i'83 17 25 8 67 36 0 0 0 54 89 64 27 18 36 45 45 0 0 9 18 27
3 71 25 19 11 70 19 0 0 4 52 264 3 63 34 21 6 74 21 0 6 9 SO 15
1 33 58 8 75 8 17 Ct 8 0 0 23 0-2 '.0 BO 10 70 20 10 78 0 0 0 11' 213 '7 70 3 80 7 13 65 0 3 6 26 0
17 80 3 77 17 .6 73 a 0 0 27 3
1 17 SO 33 0 0 100 8 0 0 0 62 312 0 70 3i. 30 10 60 27 9 0 9 iii 363 14 76 10 32 18 SO 36 C 7 4 36 184 3 82 15 32 12 56 33 0 6 3 45 12
ol
Flg. 3--Continuation 180
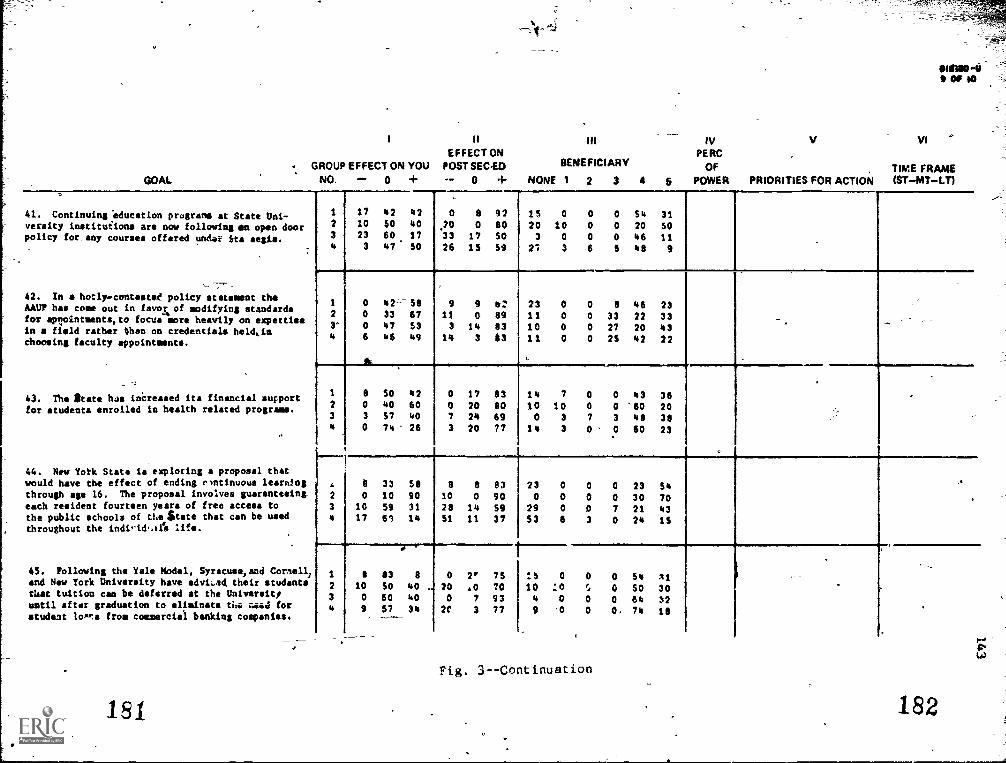
GOAL
EFFECT ONGROUP EFFECT ON YOU POST SECE0
NO. 0 +
41. Continuing education progranm at State Uni-versity instituiions are now following an open doorpolicy for, any courses offered under Ste aegis.
42. In a hotlycontested policy statement theAAUP has come out in favor.of modifying standardsfor aplointmentepto focus more heavily on expertisein a field rather bhan on credentials helckinchoosing faculty appointments.
43. The State has increased its financial supportfor students enrolled in health related programs.
44. New Yotk State is exploring a proposal thatwould have the effect of ending rmtinuous learningthrough age 16. The proposal involves guaranteeingeach resident fourteen years of free access tothe public schools of cheState that can be usedthroughout the indi-id,ate life.
45. Following the Yale Model. Syrscuse,and Connell;and New York University have adviL.ad their studentsthat tuition can be deferred at the Universit,until after graduation to eliminate 614 r.a:-.2 for
studaat loArs from commercial banking companies.
181
BENEFICIARY
NONE I 2 3 4
IVPE RC
OF
5 POWER
V VI
TIME FRAMEPRIORITIES FOR ACTION {ST MT LT)
1
2
3
1710233
42 4250 4060. 1747 SO
0203326
8
01715
9280SO54
15203
27
0
100
3
0
0
0
6
0 540 200 46S 48
31
50119
1 0 42-- Si 9 9 a: 23 0 0 6 48 232 0 33 67 11 0 89 11 0 0 33 22 33 _.r 0 47 53 3 14 63 10 0 0 27 20 43
6 46 49 14 3 83 11 0 0 2S 42 22
1 8 50 42 0 17 83 14 7 0 0 43 362 0 40 60 0 20 BO 10 10 0 0 "60 203 3 57 40 7 24 69 0 3 7 3 48 36
0 7 26 3 20 77 14 3 0 0 60 23
k
A 0 33 58 8 8 83 23 0 0 0 23 Sa2 0 10 90 10 0 90 0 0 0 0 30 703 10 59 31 28 14 59 29 0 0 7 21 43
17 69 14 51 11 37 53 6 3 0 24 15
1 8 83 8 0 2 7S 15 0 0 0 54 212 10 50 40 . 20 .0 70 10 :0 f.. 0 SO 303 0 60 40 0 7 93 4 0 0 0 64 32
9 5/ 34 2C 3 77 9 '0 0 O. 74 18
Fig. 3 -- Continuation
182

GOAL
:The State-owned institut/title coupetitive with the
tie and the students resewnever school they wish.
st
_r the Federal student loan;
1
g. A bal is before. the, StLiminate student tuition co*m#1 or part-tine, wiL'a into
overty level. In isffect sl
souring theslielves indepenet eligible.
'--__ 9. The Middle States Accred
_:- 'mind a policy statasenc totudents and faculty involvemanning education activitamt requirements as full -ti
ragtime demand.
183
II
EFFECT ONGROUP EFFECT ON YOU POST SECED . BENEFICIARY
NO. -- 0 - 0 + NONE 1 2 3 4
"II IV.PE RC
OF6 POWER
V
C
VI
TIME FRAMEPRIORITIES FOR ACTION (ST- MT -LTL----..-
,.cnis tk,w chimp a)rivate units in thet vouchers to attend
is are now eligibleguarantee program.
ate Legislature tosplerely, for anyonere below the Federal1 students over 18dent are thought to
sting Association hasthe effect chat
d in- part-time orins need not meet theBei degree seeking
.
23
17302314
500
3366
33704320
33202738
007
15
67806747
23202226
810
09,
800'
0.000
3120'4841
31503018
0
1
23
003.0
589
8350
42913350
003
0
09,06
1009197911
7.0It0
7000.
0000
0000
50648279
363'61421
c..
1
23
42182326
2518
1,5757
33642017
25183757
0903
7573.6340
239
2335
6006
00
3
0
0030
46'SS6050
733610 .
9
..............4
...
1
V34
33403726
42105040
.
25SO
1334
58'606760
0
010
6
42402334
5
404242
0033
310
36
30
1011
38101928
840231 1
-.
'Fig. 3--Continuation
1184
%
Group I: Polley Advisors--Drawn from lists of'various State advisory councils,
State legislators on education- related committees, officials of the State
Education Department, and members of the advisory council for this study.
Group II: Deans and Directors--For the purposes of the entire project, of
which this is only one part, a sample of46 institutions was selected from all
the post-secondary degree-granting institutions in New York State. The indi-
viduals responsible for continuing and extension programs at those institutions
were invited. In one institution, two individuals were invited to participate,
making a total of 47 participants.
Group III: Faculty--Again for the purposes of the greater project, a sample ofo
the faculty of thoat 46 institutions was.selected without reference to their
participction in continuing education'activities. From that master list, every
fifth name was selected as the sample for this study. This procedure resulted
in a total of 210 individuals who were invited"to participate.
Group IV: Clients/Students--The el-tents were defined as those organized
grrups who had purchased educational- services from, or utilized the resources
of, degree-granting institutions for the gain of their membership during the
past year. With the aid of Chambers of Commerce'from around the State, lists
Of organizations were culled and 4C0 separate organizations were queried toa
determine if they met those criteria. Forty-seven separate client organi-
zations were identified and agreed to participate.
The individual students were selected by personally contacting faculty .
in the study and asking them to invite any student wh( lould participate to
contact us. Sixty-nine individual students did so.
Data on levels of participation for the respondent categoila are
Pgresented in Tables 50 and 5'. Three feature might be noted: (1) 127 Of.
r*
146
the total sample of 46.5 responded at one time or other (2670; (2) 36 of the
'total sample 4onsistently responded to all three Rounds (97.); and (3) the
individual.students were the best respondents- -both it terms of their response
rate on each of the tree Rounds, and as the cordlOgroup responding to all threew
Rounds. The typical reasons given for not participating for all Rounds are
given in Table 52.
Goals Examined in the Study
The reader may wish to read through the list of goals examined in the
study. They were presented earlier in Figur 2, pages 122 to 131. The reader
is also encouraged, for any goal that interests him, to make the same kind of
examination of the data pertaining to that goal that has been indicated in
the'example in the following sections.
Ex Iorin Displayed
Included here is a demonstration of Policy,Aaalysis with the Focus
Delphi Data. To help the ader make use of the tables, we nave underlined
all the relevant data on each chart for goal number 44 which is used as an
example in the demonstration.
Note: The reader 1s also directed to pages 132-144(Figure.3) for a
display of the data for the following inquiries:
The effect of the goal on the respondent
tab-lePin order. You will see the kind of inquiries that you might make abol
The effect of the goal on Post-Secondary Education4
The perceptions of the respondent as to who tenefits
-Please read the Purpose, Examples, and Comments refeeri:of to each
f
any gbal listed,V4.
1861-

)
TABLE 50
LEVELS OF PARTICIPATION OF RESPONDENTS
147
Number UsableGroup Sent Responses % Usable
RespondedBut Did NotParticipate
I.- Tabulation of Responses from Round I:
13%
11%
28%22%39%
4410_.
-=.1-
6
40,
1
6
Policy-Influence 72 9Faculty/Staff 210 23
Deans and Directors 47 13
Client Organizations 45 10
Individual` Students 61 24
Unknowns/anonymous 10
'35 189
II. Tabulation of Responses from Rouhd II:
207!
17%
14%
23721%39%-
23
_
1
2
0
00
--1
4
I401
0
2
Policy -Influence 72 12
Faculty/Staff 210 29
Deans and Directors 47 11
'Client Organizations , 4P 47a 10
Individual Students 69a 2;Unknowns/anonymous ..' -
.
a445 9Z
III. Tabulation of Recponses from '?oozed III:
21%
14%, 11%21%177:
32%-
.
Policy - Influence _. . 1Q
Faculty/Staff 21.6 23Deans and Directors. 4' '0
Client Organizations \ ° 47 )
Mdividual Students 69 21
Unlidowns/anonymous ' 30, 44
44! 76 17% 8
aThe differential between the number of participants in Rounds I and1I is a result of the addition of 8 individual students and 2 representativesof client organizations./

,r
TABLE 51
4
RESPONSE RATE INIFFERENTIAL BY GROW!' FOR ALL ROUNDS
A. Faculty/Staff:
NumberNumberNumberNumberNumberNumberNumberNumber
of separaterespondingrespondingrespondingrespondingrespondingrespondingresponding
B. Individual Studenta:
NumberNumberNumberNumberNumberNumberNumberNumber
individuEls responding:e:r1101to all three Rounds: , 5 9 '
to Rounds I, II only: e 2
to Rounds III only: J. 4to Rounds onli/ 7
to Round I only: 9
to Round II only: , 8
to Round III only: 2
of ser_arate individuals respond 9g: 33responding to all thiee ROunds: 1Zresponds jg to Rounds I, II'oniy:
responding to Rounds, I, III only: 4
responding to Pounds II, III only : -7 4responding to Rounk.,I only: , 4responding to Round II only: 2
responding tdROund III only: 1
r
C. Client Organizations:
Number of separate individuals responding: 16
Number responding to'all three Rounds: 5
Number rekponCing to Rounds I, II only: . 1
umber responding to Rounds I; III only: 0
Numbliorespoiging to Rounds II, ;II onli:Numb responding to 1 fund I onli: -Nutber:responding to Round II.only:Number responding to Round 1II only: .
D. Deans and Directors:
.er
NumberNumberNumberNumberNumberNumberNumber
51
1
of separate individuals' responding: . 19
responding to all three Rounds: 6
responding to Rounds 1, II only: 2
responding to Rounds I, III only: 2
responding to Rounds II, III only: 2
responding to Round,/ only: 4respondiL, to Round II only: ' 1
responding to Round -III only: 2
188
I

-_=--
E. Policy- Influencers:
NumberNumber.
NumberNumberNumberNumberNumberNumber
da#
TABLE 51. .Cont.; twat ion'
of separateindtviduals responding:respondingresnondingrespondingrespondingresponding
respondingresponding
to
toto
to
to
to
to
all three Rounds:"
Rounds I, II only:Rdinds I, III only:Rounds II, III only:Round I only:
Round II only:Round III only:'
F. Composite Profile of Responses:
NumberNumberNumberNumberNumber
* Number
Number
of separate individuals responding:responding toresponding to
re ponding torendingnding.torlesp nding torEspozding toresponding to
all three Rounds:
ROunps I, Wooly:Rounds I, III dnly:RoOds II, III only:Round I only:n- .J2 TTntitnit, 11 I./111y;
Round III_bn y:
18
41
0
3
4
4
2
127
3612
10
19
261.0 yR
8

150
TABLE 52
TYPICAL REASONS GTE' FOR NOT PARTICIPATING OR ALL ROUNDS
t, Did not have time or staTtto participate
2.- Were nab,. involved in continuing education
FacultyiStrf':it
1. lot involved in continuing education.
2. Never fill out questionnaires' as a personal policy
Deans and Directors:/
1. Not involved in continuing education
fp
Representatives of Client Organizations:
1. Not involved in continuing education activities
2. Questionnaire loo difficult to understand
Individual Students,
1. Did not understand the questionna re,
I
_ .
190'
.4

.41
The analysis that follows should help you master the potential Of
the data display.
A Demonstration of Policy Analysis WithThe Focus Delphi Data .
151
To aid the reader in understanding both the Focus Delphi Process and
tvthe use and analysis of the data di:splayed, we have prepared this analysis of
r
one goal of interest to the researchers and underlined the appropriate data in ,
the tables that follow. It is suggested that's similar examination be con-
ducted for any event of interest to the reader to more clearly understand the
-implicationsuf the data. Again, we caution the reader that the data are not
drawn from a scientifically-selected sample and cannot be generalized beyond
the sample itself.
We have chosen Goal Number 44 for our examination:
Number 44. New work State is exploring a proposal that would
have the effect of ending continuous learning throughage 16. .The proposal involves guaranteeing each a
resident fourteen years of free access to the publicschools of the State that can be used throughout theindividual's life."
1. Data: We turn to Figure 3 (page 143) where the data from Round II are
displayed. For your convenience, we have here reproduced that
data:
II WI
EFFECT ONGROUP EFFECT ON YOU POST SECED BiNE IARY
NO 0 0 + NONE I 2 3 4 6GOAL
44. New York State is exploring a prcposal thatwould haws the effect of ending continuous learningthrough age 16. Thu proposal involves guaranteeingeach resident fourteen mars of free access tothe public schools of the state that can be usedthroughout the individuals life.
9
1
23
191
8 8 83 0 0 0 23 51410 0 90 0 0 0 J 30 7028 14 S 294 0 0 7 21 43Si 11 z 7 53 6 3 0 21. 15

152
Here we note that the majority of Group 1 (Polley Advisory
personnel) and of Group 2 (Deans and Directors of Continuing
Education programs) see a high positive effect on themselves if .
it occurred, while Croup 3 (Faculty) and Group 4 (Students) in
the majority of cases, see no effect on themselves.
Inquiry: Why does the student population sampled in this study not
realize the implications of such a change on their on situation?
The faculty also.seem lo have ignored the implications of such
a ,..:hange on teaching strotegiee necessary for random populations
not linked as age cohorts, Why? In this instance, the Deans
and Directors seem to be clear about the change making an effe t
for the good but none of them could possibly qualify to take
advantage of the change personally as students.
2. Data: We examine the perceptions of effect on post-secondary education
in New York State. Here we.note that a much higher percP.tage
of the Policy group see the goal as having positive effects.
The Deans and Directors persist in their assessment. The Faculty
see the effect on the system as beneficial but the majority of
the Students think the effect would be negative.
Inquiry: Here is a goal statement that appears to be designed to serve
students yet the majority of students feel it would be of no
-effect on them and a negative effect on the system. Why?
3. Data: We look to perceptions of benefit. The majority of Policy people
see it as benefiting all groups. Deans and Directors feel the
same. There is no clear majority in the Faculty. But the Students
persist with the tajority feeling that no one'would benefit.
192

153
AP
Inquiry: What affects the students' understanding of the'event that they
perceive. it not to be in their or anyone else's interest?
9
4. Data: We must look at the quantity of response that comprises those
percentages. Turn to item II, Table 50. Tabulation of
Resources from Round II. ,Twelve Policy people, 11 Deans and
Directors, 29 Faculty, and 37 Students/Clients participated in
those tabulations of percentages.
- 1 Inquiry: Are the percentages significant? (See next Data item)
5. Data: 'We turn new to the data tables in Table 53, page 57. We see
that Goal 44 was selected as one of the twenty most interesting
goals by 39 individual respondents out of a untve4se of 75.
That is more than 50%. Further, we can see that it is the 8th
most frequently picked goal.
Inquiry: Do groups differ in th,:ir&interest? (See next Data item)
6. Data: In Table 54, page 159, we see that 4 of lifor 40% of Group 1 put
it in the top 10 in priority. Thirty percent (30%) of Group 2,
50% of Group 3, and 16 1/27 of Group 4 locate'this goal as a Cop
priority item for attention.
Inquiry: How important is the item, to each group?
7. Data: Table 55, pages 161-162. Group 1 ranks Goal 44 5th highest in
priority. Group 2 ranks it 7th. Group 3 ranks it 2nd and
Group 4, the Students and Clients, rank it 25th. The aggregate
see it as ranking 7th in overall priority.
193

154
8. Data: We now can explore when people feel this goal can come about
in..1able.56, pages 164-165. Group 1 is spit: 50% see the
event happening in the short:-term and 50% see it in the long-(
term future. Group 2, on the otn4 hand, is in total agreement:
that the event will not happen until the-loag-term, future (even
though they Jee it as positively, affecting themselves and post-
secondary education generally). The Faculty is spread over the
full-time spectrum, as are the Students with tile majority seeing
the goal only in the long-term.4
Inquiry: Ir reference to.the respondents' perception of real time, does4
the event still rank as a top priority item?I
9. Data: In Table 57, page 166, we see that Goal 44 is the second highest
priority goal for the long-term future.
Inquiry: Here.is a goal that...many people think is valuable for the long-
term futbre. They are prepared to believe that it is not a
short-term goal. Are tney, in"effect, offering us sufficient
lead time to explore the feasibility of it through research?
If so, should we fund such research?
10. Data: In Table 58, page 167, 4e note that the majority of the goals
examined in the'survey are seen as short-term.
Inquiry: How do we make them happen: Which client groups are to be
served in-setting priorities? (See next Data item)
11. Data: Table 59, page 169-: displays the goal (ranked) with the time
estimate as Seen by each group.
194

155
12. Data: Table 60, pages 171-!72, is probably one of the most important
criteria to employ in deciding what goal to pursue. Looking ato
our goal, we see that 60% of Group 1 see themselves as having the
power to cause the event if they wanted to. One hundred percent
(100%) of Group 2 see Group 1 as having the power. Sixty-seven
(67%) of Group 3 see Group 1 as having the' pOwer and 85t _afz-
Group 4 see Group 1 as having the power. In the aggregate,
77% of all those who addressed themselves to this goal (31 of
75 people) felt that the power to cause it resided with the
Policy apparatus of the State and not with, the Students,
Faculty, or Directors.
Inquiry: Who has the power-to cause each goal as seen by each group?
13. Data: See Table 61, pages 174-175, for the display.
Inquiry,: Who is perceived to have the power to affect post-secondary
education in New York State?
14. Data: Table 62, page 117, displays the number of times each group is
seen as having the power to cause goals exam oe here to come
Into being. Groups I and 2 are seen as much more poirrful than
Groups 3 andn terms of the goals generated by the partici -.
pants in this study.
It is luggested that the reader now make a similar examination of the
goals that interest him personally and deliberate about the consensus and
dissensus that exists. Figure 3, pages 132 to 144 contains: (1) the goal
statements, (2) the responses of the four groups as to the perceived effect of
the goal on the individual respondent and on post-secondary education in
195

0
156
. general, and (3) the respondents' perceptionsof the beneficiaries of the goal6
if implemented.J-
The following tables of data are presented to assist the reader in
the analyzing of the data pertaining to an individual goal statement. For each
table, the purpose is explained, examples of interpretation are given, and
additional comments about the use of the table are provided.
It is the responsibility of the policy-maker to examine that array of
opinion before making plans and setting strategy that affect the lives of all
of us.
Lists of Goals With Corresponding TotalNumber of Respondents Who Included theGoal: Unranked and Ranked
Purpose
The "Unranked" table consist of the goals listed in ascending order
of goal number; the "Ranked" le consists of the goals ranked in ascending
order to the number of mes the goal was respboded to.
Example
Comments
Unranked--Goal 1 was responded to 11 times.
Goal 40 was responded to 22 times.
RankedCoal 1 was the least often mentioned in the responses(11 times).
Goal 28 was most often responded to (55 times).
This table is useful as a reference table. If one wer interested
in a particular goal, he could see hov often that goal was mentioned in the
"unranked" table; then, using the "ranked" table, he could see aPproximately
-196

M
157
TABLE 53
LIST DF"GOALS -WITH CVRRESPONDING TOTAL NUMBER OF RESPONDENTS
WHO INCLUDED THE MM.:- UNRANKED AND RANKED
O
UnrankedCoal Resp.
1 11
2 233 494 1 47
5 39
6 28
7 35
8 269 31
10 24 411 4212 12
13 23
14 '38
15 3016 33
17 35
18 27
19 31
20 26
21 29'22 3023 2324 2625 38
Coal
2627
28 -
29
30
I I
32
ir34
35
36
37
38
39
40
41
42
43
44
45
4647
4849
RankedResp. Goal kcsp. .Goal Resp.
48 1 11 21 29,
22 12 12 15 30,, .5.5 '14 ' 13 22 3021 32 14 9 3128 36 i 7 19 31.qi 17 20 '464 31
27 22 33 32
32 1;0 22 r 16 33, 13 .4. .L1 22 48 3325 2 23 47 3417 1'3 23 49 3420 23 23 7 3528 29 23 17 35
25,
-l0 24 14 , 38
22 31 24 25 '382f 43 24 5 3952 35 25 44 3924 3 25 11 42
39 '8 26 45 4242 20 26 4 47
31 24 26 26 -48
34 18 27 3 . 4933 6 28 42 52
34 30 28 28 5538 28
Total Number of Respondents: 75
.197
158
where, among all the other goals, it ranked, giving a measure of how much
interest there was in that particular goal.
If we were, interested in Goal 5 we could see from the "unranked"
table that there were 39 respondents who mentioned that goal. Looking then
to the "ranked" table, we see that 39 responses-was relatively high, telling
us that Goal 5 was generally of high interest.
,Number of Times Goal. Seen as Among_Top Tenin Priority, by Group and Aggregate
Pur pose
This table lists the number of times each goal was seen as one of
k, the top ten in priority. The box in the bottom right corner lists the
number of respondents for each group, and the total number of respondent&
wheri all groups are aggregated.
Example
Goal I was not mentioned by any of 16- -respondents iw-Group, 1
as being among the top ten in priority.
It was mentioned by two members of Group 2.
No members of Group 3.
Four members of Group 4.
Of all the' respondents, six mentioned Goal 1 as being
among the top ten in priority.
'Comments
Note that it is imps tar. 'len interpreting this table, as well as the
following tables, to keep in. mind the total number of respondents for each
group. Goal 5, for instance,.was listed four times (407, of the respondents)
1 as
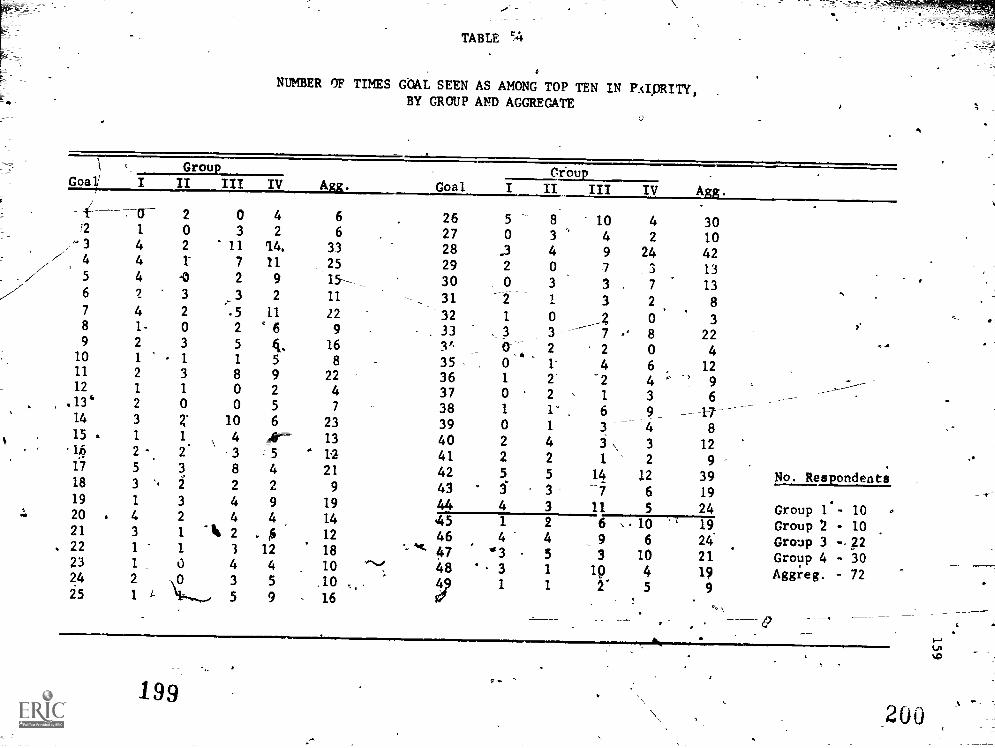
TABLE rA
NUMBER OF TIMES GOAL SEEN AS AMONG TOP TEN IN PAIQRITY,BY GROUP AND AGGREGATE
0
GoaGroup
GoalCroup
AggI II III IV I II III IV
-1- ----V 2 0 4 6 26 5 8 10 4 30'2 1 0 3 2 6 27 0 3 4 2 10
,A. 3 4 2 11 14. 33 28 .3 4 9 24 424 4 1- 7 11 25 29 2 0 7 3 135 4 -0 2 9 U- 30 0 3 3 7 13V' 6 2 3 3 2 11 31 -2 1 3 2 , 87 4 2 .5 U 22 32 1 0 0 38 1- 0 2 '6 9 33 3 -3 - 8 229 2 3 5 ft, 16 1,. i)
,4a 2. 2 0 410 1 - 1 1 5 8 35 0 1' 4 6 1211 2 3 8 9 22 36 1 2 -2 4 ' 912 1 1 0 2 4 37 0 2 1 3 6.134 2 0 0 5 7 38 1 1- 6 9____
17--14 3 Z 10 6 23 39 0 1 3-: 4 815 . 1 1 4 _ 13 40 2 4 3 \ 3 1214." 2 - 2. 3 5 ' 1-2 41 2 2 1 2 917 5 3 8 4 21 42 5 5 14 12 39 No. Respondent;18 3 `. i 2 2 9 43 3 3- -7 6 19 _ ,719 1 3 4 9 19 44 4 3 11 5 24 Group 1.- 1020 . 4 2 4 4 14 45 1 2 6 ,.10 '' 19 Group 2 - 1021 3 1 ii, 2 .b 12 46 4 4 9 6 24 Group 3 -.22. 22 1 1 3 12 18 47 '3 5 3 10 21 Group 4 - 3023 1 0 4 4 10 ) 48 '. 3 1 1Q 4 19 Aggreg. - 722425
2
1 i-
35
59
1016 Y
1 1 2' 5.
9
v.199
200

t.
160 a,
by Group 1 and nine times (30% of the respondents) by Group 4. It-seems to
4 have a higher priority among Group 1 thanGroup 4 but it was mentioned ewer
times.
Ranking According to Number of-Times
Seen as Among Topj-n .
by Group and Aggregate
Purpose
This table ,contains the same data As the preceding table, bilt, for
eacn group, the goals ars arranged'in de'scending order according to the :lumber
of times they were mentione,!.
;
4 - 'ExamPle, , v. Ys.
4
'Goals 42, 26 and 17 were most often mentioned (5 times) by group 1.
Comiaents
Goal 42 was also mentioned most: often by Group 3 (14 times).
It is-interesting to look at the relative positIons of certain "high
priority" goals across groups: Goal 26 was given a high priority by Groups
,land 3, but a relatively low priority by Group 4. One is lid to ask
why it that the Policy-makers, Deans, and Faculty members see this goal as
important, yec the Clients seem to find it unimportant. (Goal 26: "The
Regents of the State of New York I'ave asked colleges in each "region of the
State to plan their offerings cooperatively.1,,
201
r
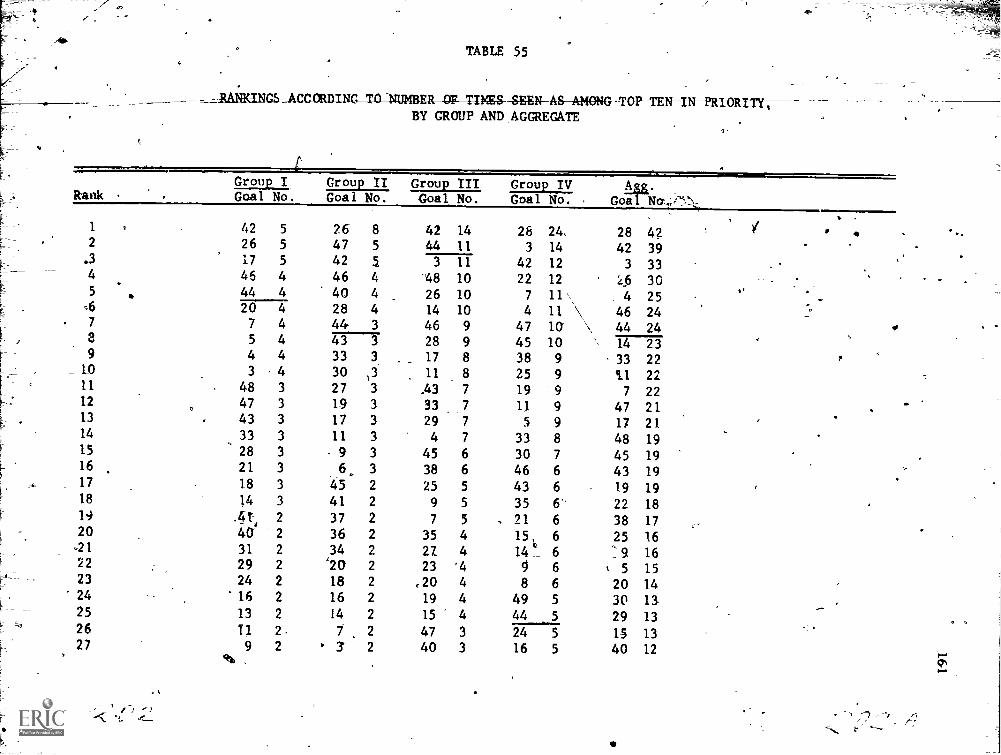
TABLE 55
_AtilitaNcs A cr, CsjuNG_TONUMBEW-OFTIMS- SEEN-AS-AMONG-TOP- TEN IN PRi6RifiBY GROUP AND AGGREGATE
RankGroup oup II Group III Group IV An.
Goal No--;Goal No. Goal No. Goal No. Goal No.It
1 s 42 5 26 8 42 14 28 24 28 422 26 5 47 5 44 11 3 14 42 39
.3 17 5 42 5 3 11 42 12 3 334 46 4 46 4 -48 10 22 12 26 305 ,. 44 4 40 4 26 10 7 11 4 25
=6 20 4 28 4 14 10 4 11 \ 46 24- 7 7 4 44 3 46 9 47 10' \ 44 24
elC.t 5 4 43 3 28 9 45 10 14 239 4 4 33 3 17 8 38 9 33 22
_ 10 3 4 30 .3 11 8 25 9 ill 2211 48 3 27 3 .43 7 19 9 7 2212 47 3 19 3 33 7 11 9 47 2113 43 3 17 3 29 7 5 9 17 2114 33 3- 11 3 4 7 33 8 48 1915 28 3 9 3 45 6 30 7 45 1916 . 21 3 6. 3 38 6 46 6 43 1917 18 3 45 2 25 5 43 6 19 1918 14 3 41 2 9 5 35 6 22 1819 04 t. 2 37 2 7 5 . 21 6 38 1720 40 2 36 2 35 4 15, 6 25 16
921 31 2 34 2 27 4 14 4_ 6 "9 1622 29 2 '20 2 23 '4 9 6 k 5 1523 24 2 18 2 ,20 4 8 6 20 1424 16 2 16 2 19 4 49 5 30 1325 13 2 14 2 15 4 44 5 29 1326 11 2 7, 2 47 3 24 5 1 -5 1327 9 2 3 2 40 3 16 5 40 12
-

TAKE 55--Continuation
Rank
Group I Group II Group III Group IV Agg.
Goal No. Goal No. . Goal No. Goal No. Goal No.
28 - 6 .2 1 2 39 3 13 5 35 12
29 49 1 49 ,1 31 3 10 5 21 12
30 \ 45 1 48 1 30 3 48 4 16 12
31 38 1 39 1 24 3 39 4 6 11
32 36 1 38 1 22 3 36 4 27 10
13 32 1 35 1 16 3 26 4 24 10
34 '25 1 31 ls 6 3 23 4 23 ,10
33_ 23 1 25 1 2 3 20 4 49 9
36 22 1 22 1 49 2 17 4 4f 9,.
37 19 1 21 1 36 2- 1 4 36 9
38 15 1 15 1 34 2 40 3 18 9
39 12 1 12 1 32 2 37 3 8 9,
40 10 1 10 1 21 2 29 3 39 8
41 .., 8 1 ,. 4 1 18 2 41 2 31 8.
42 2 1 32 0 8 2 31 2 10 8 No. Respondents
43 ,
,39 0 29 0 5 2 27 2 13 7
44 37 0 24 0 41 1 18 2 37 6 Group 1 - 10
45 35 0 23 0 37 1 12 2 2 6 Group 2 - 10
46 34 0 13 0 10 1 6 2 1 6 Group 3 - 22
47 30 0 8 0 13 0 2 2 34 4 Croup 4 - 30
48 27 0- 5 ,0 12 0 34 0 12 4 Aggreg. - 72
49 1 0 2 0 1 0 32 0 32 .3
203

163
Percent of Groups Seeing Time Frame as Short-Term,Medium-Term, Long -Term, Respectively, for EachGoal, by Group and Aggregate
Purpose
These data are based on respondents' replies concerning when they
thought the goals could or should occur.
Example
One hundred perc,mt of Group 1° who responded to Goal number 6 saw
the goal, to be snort -term.
One-half of Group 2, who responded saw it as medium-term, and one-half
_saw it as short-term.
Considering the aggregate group, 61% saw Goal 6 as short-term, 26%
saw it as medium-term, and 137 saw it as long-term.
Comments
This` table is useful if one has a particular goal in mind and he would
like some measure 'of the time'frame in terms of which each group thinks of
the goal, and'how much agreement there is among the groups as to the time frame.
Top Ten Short - Term 14,_sAiumrermaimGoals Based on Aggregate Responses
- N 4
Purpose
In this table only the data from the "aggregate" column of Table 57
are considered. The ten goals receiving the highest percentages as shott-term
are liste(, as well as,the ten receiving the highest percentages as medium- .
term :and as long-term.
205

TABLE 56
PERCENT OF GROUPS SEEING TIME FRAME AS SHORT-TERM, MEDIUM-TERM, LONG-TERM,
RESPECTIVELY, FOR EACH GOAL, BY GROUP AND AGGREGATE
GoaGrou Group II Group III Group IV Agg.
T ?IT LT ST MT LT ST MT LT ST MT ST MT LT
, 0 0 0 50 25 25 0 0 0 50 25 25 50 25 25
2 0 0 100 0 0 100- 33 0 67 11 0 89 12 6 82
3 50 50 - 0 ' 20 80 0 40 47 13 47 47 5 40 51 9
4 _0 50 50 0 40 60 56 22 22 39 44 17 34 39 26
5 50 0 50 33 33 33 71 14 14 20 60 20 38 38 24
6 100 0 0 50 50 0 57 29 14 57 14 29 61 26 13
7 50 25 25 67 33 0 63 38 0 67 20 13 63. 27 10
8 100 0 0 50 '50 0 100 0 0 54 38 8 65 30 5
9 100 0 0 50 50 0 70 30 0 67 33 \0 69 31 0
10 100 0 0 100 0 0 100 0 0 91 9 \O 94 6 0
11 33 67' 0 67 33 0 36, 45 18 33 50 1 35 48 16
12 50 50 0 0 100 0 0 0 0 75 0 2 64 18 18
13 50 50 0 0 100 0 40 20- 40 56 44 0 50 39 11
14- 33 67 0 20 60 20 .64 18 18 42 42 17 45 39 15
15 100 0 0 67 33 0 88 13 ,0 64 27 9 76 20 4
16 67 33 0 0 100 0 50 0 50 23 54 23 12 44 24
17 60 AO 0 50 50 0 40 40 20 40 .40 20 \ 47 38 16
18 73 25 0 40 60 0 17 83 0 80 20 0 \ 45 50 5
19 100 0 0 20 60 20 it 29 0 82 18 0 67 30 4-
20 25 50 25 33 67 0 40 40 20 22 56 22 27 55 18
21 50 25 25 33 33 33 80 20 0 67 22 11 64 23 14
22 0 100 0 0 100 0 67 33 0 31 63 6 41 56 4
23 100 0 0 0 100 7_ 0 63 25 13 43' 43 14 56 33 11
24 67 0 33 100 0 0 86 14 0 89 11 0 85 10 5+
25 '67 33 0 67 0 33 89 11 0 75 25 0 77 19 3

TABLE 56Continuation
Group- 1=1 Group-m Agg.Goal Si MT LT ST MT LT ST MT LT_ ST MT LT ST MT LT
26 57 0 43 33 _44 22 43 43 1 ' 20 40 40 37 35 28
27 50 50 0 100 0 0 71 29 0 50 50 'JD 63 32 -5_
28 100 0 0 57 29 14 50 50 0 77 23 0 67 29 4
29 50 0 50 0 100 0 14 43 43 57 43 0 33 44 22
30 100 0 0 50 50 0 83 0 17 55 45 0 64 32 5
31 53 50 0 67 0 33 57 43 0 50 33 17 58 32 11
50 50 0 50 0 50 100 0 0 67,, 33 0 75 17 8
33 67 33 0 20 20 60 67 33 0 55 18 27 55 24 21
34 0 100 Q 75 25 0 67 0 33 0 100 0 56 33 11
35 50 50 0 75 25 0 40 40 20 29 29 43 43 38 19
36 100 0 0 100 0 0 67 0 33 75 25 0 79 14 7 Amitrm,
37 100 0 0 17 83 0 50 25 25 63 38 0 47 47 5
$------ b7 -33 ,17 17 6 27 A__ 57 30 13
50
0
03c 50 0 33 67 40 20 40 38 13 50 33 22 4440- 0 67 33 25 75 0 67 17 17 75 25 0 47 41 12
4I 1JO 0 0 50 50 0 50 50 0 50 50 0 , 50 50 0
42 50_ 17 33 40 60 0 41 41 18 51 35 12 46 40 15 No. Respondents
43 75 0 67 33 0 63 25 13 71 29 0 68 27 5 '
44 50 0 0 0 100 23 31 46 27 18 55 25 22 53 Group 1 - 10
45 3 67 0 67 33 0 62 38 0 , 57 29 14 54 37 'Group 2 - 10
46 0 50 50 75 25 -0 64 18 18 20 50 30 43 33 23 Group 3 - 2247 50 50 0, 67 '33 0 -50-50 0 77- 15 8 =67 30 4 Group 4 - 3048 67 33 0 0 0 100 45 9 40 20 40. 41 19 41 Aggreg. - 7249 33 33 33 33 33 33 33 17 50 80-- 20 --752 13 35
207 208-N,

166
TABLE 57
TOP TEN SHORT-TERM, MEDIUM-TERM, AND LONG-TERM GOALSBASED ON AGGREGATE RESWNSES
Short-TermRank Goal Pct.
Midium-TermGoal Pct:
Long-TermGoal Pct.
1 10 94 22 56 2 82
2 24 85 20 55 44 53
3 36 79 3 51 39 44 No. Respondents
4 25- 77 41 50 48 41
5 15 76 18 50 49 35 'Group 1- - 10
6 32 75 11 48 26 28 Group 2 - 10
7- ' 9 69 37 47 4 26 Group 3 - 22
8 43 68 29 44 1 25 4: Group 4 - 30
9 -, 47 67 16 44 16 24- Aggreg. - 72
10 28 67 40 41 5 24
Example
p
nts
Goal 10 was rated as short-term in 9470 of the responses.
Goal 22 was seen the highest peotentage of the time (56%)-as medium-
-term.
Goal Was rated the highest percentage of the time (82%) as long-term.
___Ar quick_ look at the table indicates that most of the respondents saw
most of the goals as short-term. Only two goals were seen by more than 50%
of the respondents as long-term, Goals 2 and 44. Goal 2 had'e very low
interest and priority ranking. Goal 44 had a high interest ranking and a high_
priority ranking among all but Group 4, (which all groups see as the benefi-
ciary). (Goal 44: "New i.ork State is exploring a proposal that would have
4
the effect of ending continuous learning through age 16. The proposal involves
'guaranteeing each resident fourteen years of free access to the public schoo's

of the State that can be used through the individual's life.")
Percent of e a
167
Short-Term, Medium-,-Term and Long-Term,All Goals'Aggregated
Purpose
This tabic is generated by summing all the time-frame resporises
all the goals, by group. It is supposed to reflect each group's gendral view
of the time-frame for all the -goals taken together.
Example
Fifty-five percent of all the responses to-che Lime-frame quesliOn by.
Group 1 were short-term, 297 were medium -term, and 167 were long-term.
Comments
Clearly the g6ais Ire most oftikn seen as short-term,- though Group 2
_tended more toward medium-term and less toward short-term than the other groups..
TABLE 58
PERCENT OF GROUPS SEEING TIME FRAME AS SHORT-TERM;MEDIUM-TERM, LONG-1RM, ALL GOALS AGGREGATED
Croup- -I Grotty- II -Group IV ARg.ST MT LT ST MT LT ST MT LT ST MT LT ST MT LT
55 29 16 41 42 i7 56 29 15 53 32 15 '52 33 16
No. Respondents
Group 1 - 10
Growl!) 2 1-,10
Graff!) 3 - 22
Group 4 - 30Aggreg. - 72
210

.4
0.
168
Goals That Were Among the Top Fifteen inPr Responses
Purpose
This table allows one to see the top 15 priority goals foreach group,
along with the consensus view of the group as to its time-frame. Consensus
is defined as 40% or greater' agreement.
E carnple
Group one's highest Priority goal was Goal 42, which 50% of the
Group 1 respondents considered shore-term.4 .
Group two's sixth highest priority goal was Goal 28, and 57% of the
a-
Comments
Group 2-respondeuLs felt that it ought,to be a short-term goal.
A quick glance at the table reveals that most of the high priority.
goals were seen as short-term, particularly for Group 3. (Note: Only the
consensus percentage is listed; other places were filled in with
Hency a zero does not-indicate that no respondents saw the goal
as having_the corresponding time frame. It only indicates that
did not sea,-thet.:as the time-frame. When there are three zeroes
zeroes.
in question
the majority
, such as in
the case of Group two's respouse to Goal 26, then there was no consensus.
Perceptions of4ower: Group Seen as Most Powerful
Percentage of Responding Group Who Saw indicatedGroup With Power, and Number Who Responded
to That Goal'
Key': A = group seen as having powey
B = percentage who saw that group as having the
O
C = number who responded to that goal
Zero indicates "no consensus'
21.1
owes

GOALS THAT WERE AMONG THE TOP FIFTEEN IN PRIORITY COMPARED 9ITH T.,_,LS-FRAME RESPONSES'
Group IV Agkre_gate
Rank gozil.S'T1'iTET6_2L1_E,__MrLTGoMTalSTLT Goal ST MT LT Goal ST. MT .LT
,....=reiGroup I Group II Group III
,1 42 50 0 0 76 0 44 0 42' 41 41 0 28 77 0 02 26 57- 0 0 47 67 0 0 - .44 0 0 46 ",2 47 47 03 17 60 0 0 42 0r-60 0 3 0 47 0 42 53 0 04 .'46 0 50 50 46 75 0 0 48 45 0 45 22 0 63 03 44 50 _0 50 40 0 75 0 ' 26 42 43 0 _7' 67 0 0 !-
., 20 f-. 50 0 28 57 0 '0 14 64 0 0 4 0 44 -07
.
. 50 _0 0 44 0 0 100 46 64 0* 0 47 77 0- 08 5 50 0 50 43 67 0 -28r 50 50 0 45 57 0 0
4 0 50 50 33 0 0 60 17 40 40 0 38 64, 0 40
10 3' 50 50 0 30 50 50 0 11 00 45 0 25 75 0 011 48 67 0 , 0 27 100 £ 0 43 63 ) -',.0 19 82 0 012 47 50 50 0 4 19 , 6 60 '0 '33 67 -0 0 11 0 50 Q13 43 75 0 0 17 50 .10 0 ."-) 0 43 43 It 5 0 60 0.
14 33 67 0 ''0 11. 67 0 0 .i.- 56 10 . 0 33 55 0 015 28 TOO 0 C', 9
....
50 50 G 45 62 0 0 30 55 0' 0
28 67 G 0
42 46 0 0
3 0' 51 0
26' 0 0 04 .0 0 0'
46 43' 0 0.
44 0 0 53
14 45 0" 0
33 55 0_ 0
11 0 '48 0
7 63 0 047 67 0 017 47 0 0
48 4f 0 41
45 0 . 0.
° ,
tit
Group '1 - 10
Group 2 - 10Group 3 -22Group 4 - 30Aggreg. -
No. Respondents \N,
202 rcentage responses from ear 1-; group for each time frame given only if percentage greater than
or equal to- 40.

t.
170
1
Purpose_
--.
This table is meant to give some indication of.each group's perception
61 4 had the power to bring about eaeh,goal, together with some idea of how
=Rich agreyment thiprkiwas within LEe group as to the indicated perception.
Example
ConsidetiNCIF-18: look at the first column under "Grohs (Column
-------- A you will notice that Group 2 is seen by Group 1 as having'
the power.
CoMments
Column "B" indicates that 80% ofthe respond4nts'from Group I felt
ft.
Is way (i.e., that Group 2 had the power).
Column "C" indicates that there were five members of Group I who
responded to Coal 18.
Now look at Group three's response to Goal 18: Columns "A" and "e
both.have'zeroes in them, indicating that there was no consensus:
I Thus, no_stngle group got 40% or more of Group 3 respondent's
-,
votes.
_4
\ ,..!"..'"-
.
This tablefis useful if .--yoU have a particular goal in mind and would
...
like to tee whom any or all of the-groups Saw as having the power. Sometimes
it is interesting to read across the row for a particular. oal to see'what--,... -_
,
,..
-kind of agreement there is among the gips.-- ips. - There seems- to 4:se no agreement-
ifievarious groups on who has the power to bring about,Goel 15. Goal 21. ,
erecting in thatfall group--eXcept Group 2--see Group 2 as hailing the
power to bring it about.
214

TABLE 60
PERCEPTIONS OF POWER: GROUP SEEN AS MOST POWERFUL, PERCENTAGE OF RESPONDING GROUPWHO SAW INDTCATED GROUP WITH POWER, AND NUMBER WHO RESPONDED TO THAT GOAL
Group I Group Group III Group IV Alum...gate11- B -C BC ai A- B C, --A B C A
1 0 0 0 2 75 4 2 lor -1 2 50 6 2 64 112 0 0 2 1 100 2 1 -100 6 1 92 12 1 91 233 1 80 5 1 100 7 1 63 16 1 68 19 1 .71 494 0 83 6 1 100 6 1 50 12 1 57 21 1 , 55 -47-5 0 0 5 4 67 6 1 50 10 0 0 18 0 0 396 1 75 8 1 75 4 1 57 7 1 100 7 1 75 287 -0 0 4 0 50 4 0 0 10 2 44 16 0 0 358 0 0 3 0 0 2 2 67 6 2 73 . 15 2 65 2 6
A '67-- 3 1 50 4 2 58 1 f 2 67 12 2 48 3110 2 100 1 2 100 2 0- '-0 6 2 79 2 75 2411 1 43 7 1 60 5 1 54 13 1 73 15 1 57 4212 -0 0 2 2 100 1 2 100 1 3 50 8 3 42 1213 1 75 4 1 100 1 0 0 '7 1 56 10 1 48 2314 1 5Q 4 1 86 7 1 58 12 T 46 13 1 58 3815 4 50' 4 2 67 3 15 0 9 0 0 13 0 0 3016 0 0 8 0 0 3 2 50 8 2 43 14 2 42 3317 0 0 7 1 50 4 0 - 0 11 2 40 10 0 0 3518 2 80 5,, '2 60 5 0 0 8 0 0 6 2- 44 2719 2 :67 3 2 60 5 2 100 8 2 92 13 2 87 3120 2 80 5 2 75 4 2 80 5 2 82 11 2 81 2621 2 100 5. 1 67 . 3 2 88 8 2 64 11 2 76 2922 3 67 3 1 100 1 0 0 8 2 63 16 2 53 3023' 0 0 3 -0 100 1 2 40 10 2> 75 8 ,.2 .52
1
2324 2 80 5 2 100 1 2 50 10 2 67 9 2 65 262215 2 80 5 2 67 3, 2 50 12 2 53 17 2 58 3826. 1 71 7 .1 56 9 1 56 16 0 0 13 1 50 4827 2 100 2 2 39 4 2 43 7 2 43 7 2 55 22
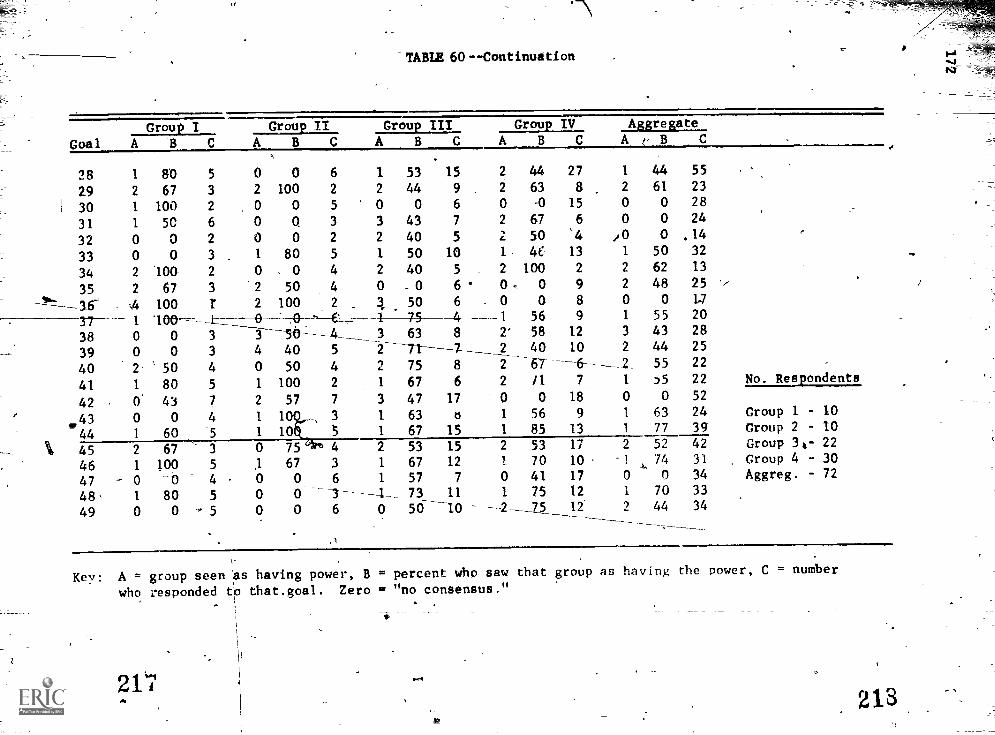
TABLE 60Continuation
Group I Group ,II Group III Group IV Aggregate
G o a l A E C A B C ABC ABC ist-BC28 1 80 5 0 0 6 1 53 15 2 44 27 1 44 55
2.9 2 67 3 2 100 2 2 44 9 2 63 8 2 61 23
30 1 100 2 0 0 5 0 0 6 0 -0 15 0 0 28
31 1 SC 6 0 Q 3 3 43 7 2 67 6 0 0 24
32 0 0 2 0 0 2 2 40 5 2 50 '4 /0 0 .14
33 0 0 3 1 80 5 1 50 10 1, 4t 13 1 50 32
34 2 loa 2 0 . 0 4 2 40 5 2 100 2 2 62 13
35 2 67 3 2 50 4 0 -0 6° 0._ 0 9 2 48 25
-"-'-'-----16' A 100 7 2 100 2 4 50 6 0 0 8 0 0 17
1 "100-----i_____1 56 9 1 55 20
17-- 0 :0 £:_.__ 1 75 438 0 0 3 3 ------56----4_ _3 63 8 2' 58 12 3 43 28
39 0 0 3 4 40 5 2 -71-----7--_ 2 40 10 2 44 25
40 2- 50 4 0 50 4 2 75 8 2 _-67----6-- 2_ 55 22
41 1 80 5 1 100 2 1 67 6 2 /1 7 1 )5 22
42 0. 43 7 2 57 7 3 47 17 0 0 18 0 0 52
.43 0 0 4 1 100 3 1 63 6 1 56 9 1 63 24
44 1 60 5 1 10 1 67 15 1 85 13 1 77 39
45 2 67 3 0 75 4 2 53 15 2 53 17 2 52 42
46 1 100 5 ,1 67 3 1 67 12 1 70 10 1 74 31
47 0 -0 4 0 0 6 1 57 7 0 41 17 0 0 34
48 1 80 5 0 0 --I-- --1___ 73 11 1 75 12 1 70 33
49 0 0 , 5 0 0 6 0 5010-- ---2-7_5 17 2 44 34
MI,.
No. Respondents
Group 1- 10Group 2 - 10
Group 34- 22Group 4 - 30Aggreg. - 72
Key: A = group seen as, having power, B = percent who saw that group as havi-ng the power, C = number
who responded tb that.goal. Zero = "no consensus."
217218

173
The Assignment of Power, as Seen byGroups 1, 2, 3, 4, andAggregate
Purpose
. This table is really five tables, one tattle corresponding to each
group. It is generated from the data shown in the last table, and designed to
show how influential ("powertilP) each of the groups sees each group.
Example
Consider. the first table (upper left); "Goals which Group 1 is seen
as..." The first column in that table indicates that Group l_sees itself as
having the power to cause Goals 3, 6, 9, 11, 140i,- 14,...ant 48 to occur. The
- second column indicates_that Group2 sees Group_1 as having the power to cause
Goals 2, 3, 4, 8,...and 46 to occur.
Comments---
Notice that the last table (lower right) is a listing of the.i6a1T-for-----===
which no consensus was seen as to who had the power. There seems to have been
less agreeme-nr-antoo-g -the -Members o Groups 1 and 2, respectively, than there
was among-the-other grOups, as indiisted-by the lengths of the dOlbmns.
It also seems apparent from the third and fourth tables (pertaining to
Groups 3 and 4, respectively) that Groups 3 ad,4 were not, in general, seen
as powerful.
liumbrofTimthe Power as, Seen by Each of the
Groups and Aggregate
Purpose
This table is simply a summation of the number of entries in each
column in the last fable.

TABLE 61
THE ASSIGNMENT OF POWER, AS SEEN BY GR(JPS I, II, III
IV AND AGGREGATE -
Gr. otrp- Group Group- Grottn-
I II III IV Aggnegate
Group-
I
Group .Group
II III
GioupIV Aggregate
Goats WhichGroup I is Seen as Having the Powerto Cause, as Seen by Groups I, II, III, IV, and
Aggregate:
Goals Which Group III is Seenas Having the Powerto Cause, as Seen by Groups I, II, III, IV, and
Aggregate:
3 2 2 2 2 22 38 31 12 12
'6 '3 3 3 3 36 38
9 4 4 4 4 38
11 6 5 6 6 42
13' -'' 9 6 11 11
14 11 11 13. 13
26 13 14 14 14
2830
1417
2628
3337
2628
31 21 33 43 33 Goals Which Group IV. is Seen as Having the 'Power
37 22 37.,
44 37 to Cause, as Seen by Groups I; II, III, IV, and
41 76 41 46 41 Aggregate:
44 = 33 43 48 43
46 41 44 44 15 5
-48 43 46 46 36 39
44 47
46 48
221220
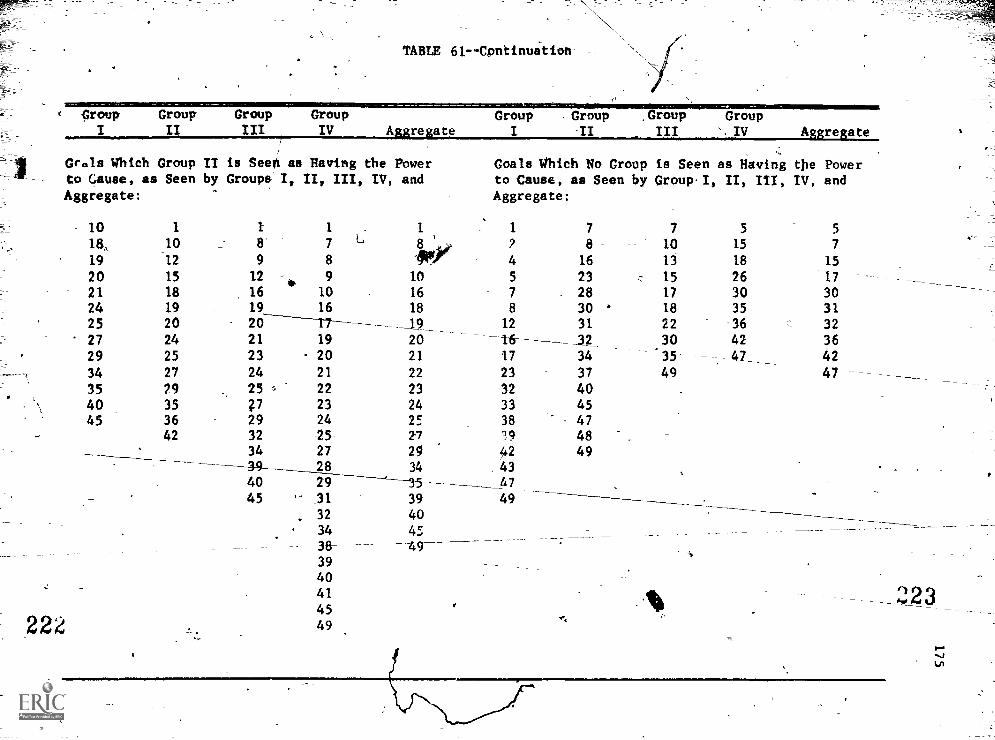
TABLE 61--Continuation- -
Group Group Group GroupI II III IV re ate
Gals Which Group II is Seen as Having the Powerto Cause, as Seen by Groups I, II, III, IV, andAggregate:
222
Group Group .Group GroupI II III IV A re ate
Goals Which No Group is Seen as Having tile Powerto Cause, as Seen by Group-I, II, III, IV, andAggregate:
10 1 1 1 1 1 7 7 3 5
18, 10 8- 7 8 , 2 8- 10 15 7
19 12 9 8 -011 4 16 13 18 15
20 15 12 9 10 5 23 15 26 17
21 18 16 10 16 7 28 17 30 3024 19 19 16 18 8 30 ' 18 35 3125 20 20 12 31 22 36 32
27 24 21 19 20 It- -____ _32 42 3629 25 23 20 21 17 34 35- 47_ 42
34 27 24 21 22 23 37 49 47-
35 29 25 -, 22 23 32 4040 35 V 23 24 33 45
45 36 29 24 25. 38 4742 32 -25- 27 35 48
34 27 29 42 4928 34 43
40 29 17
45 _31 39 49
32 4034 45
s387 49--39
4041
4549
___

176-
Example
Under "Group 1" it can seen that Group 1 saw itself as having the
power 15.ttmes, white Group 2 saw Group 1 as having the power 17 times.
Comments
IZ appears that Group 2 is in general seen as the most.powerful group
with respect to this total set of goals.
g.
224

177
TABLE 62
NUMBER OF TIMES EACH GROUP IS SEEN AS HAVING THE POWER,AS SEEN BY EACH OF THE GROUPS ANP AGGREGATE
Each Groupas Seen By
GroupI
GroupIZ
GroupIII
GroupIV Aggregate
Group 1
Group-2
Group 3
Group 4
Group 5_,
15
e 13
1
2-
18
31
14
r
1
. 2.
,.15
17
18
4
0
__HI-
13
26V
1
/
0
_9j-
16
21
2
0
-- 10
-
'No. Respondents
Qroup-1----10
eratIP .2_- JO__'Group 3 - 22
* -Group 4 , 30Aggreg. - 72
225

CHAPTER IV
AN EVALUATJOti OF ALTERNATIVE DATA-COLLECTION
SYSTEM FOR POST-SECONDARY CONTINWING EDUCATION
___.. The neeld,for additional infoimation.for use-by plalders concerned. .
_--
. ., . .-with developing a comprthensive.
., vlonrange master, plan for post-sicondary-
educationeducation war the reason for undertaking the entire project..
Thus' - third purpose_of the projtct was to assess_the -feasibility of Ante- J,
gra ng the two-data-collection systems used in this-study, into the exiatiwr. , . -..
kmerit information.system of the New Yoai State Education Department. ._
--....1
phase of the project involved the followirkg tasks: (I) iidentifyiog, the
bilities of the present infoikation 'system.; (2) identifying the strengtem
weaknesses of the two data systems developed for this study; (3) assessing
feasibility of inegrating the Focus Delphi and Ioitructional
rvey instrumenta_into the present= ormation-corleCifaa '..1-Y8tem and
( ) identifying alternative- approaches for collecting data pertaining to
post- secondary continuing education.
-EXistina Capabilities
s------____
.' .4.Three sour-4es_of information about the New York State Education.
0__ Department information system were consulted. Interviews were held1,41,4,
*
personnel in the Bureau of Statistical Services and Bureau of Spoc).al C'llege
Prograis, and data-collection instruments and published repqrts.
were examined.
__-
As with many organizations, the' State Education Department .(SE')) has

4 \I
been tn the process of changing from -a reporting/system based on pencil-and
paper summaries to a system which utilizes the capabilities of computers.
The conversion process often proceeds ,in two general stages. First, the
existing data-collection system is transfer d to the computer. As information
processors and users Itquire experlence h.the MliOntial and limitation's of
'the, computer, a second stage develops. At this point, the existing system can
... A:be evaluated in terms of the amount a$d'appropriateness=f the information
inputs into he system; newtsoiirces"bf information and additional alternati e.
,_ . '
It appears that the SED is involved in this first stage of develop-
data - collection techniques Can be explored.
4mcnt. The Department is presently in the procss of coordinating all educa-
tional information systems in one unit. Generally, this includes three
gtistfng systems: the Higher Education Data System (REDS), the Ifasic Educariont-
- Data Syiym (BEDS), and the Occupational Studies Data System (OSDS).
Four important characteristics of these systems need to be noteu aS
one considers alterations to the systerd such as the integration of an
additional instrument into the overall syste These characteristics-include:
1. Lev 'of data. aggregation - All three s systems (HEM, BEDS, and OSDS)
are designed to gather information from an institution about its total
population. This-information is obtained in the form of summary
statistics about the istitution as a whole- These systems are not
dpsigned to-provide information about isAdividual students faculty,
departmentk, or promos.
illata col lec Luc These-srs-tems-4re---disgne-d- t o c a. n&Le:- _
=
point in 'time on a regular basisusually-yearly. Also, data are collected
from every institution on the totaltpopulations in the respective areas. '
_
Allowing time forto,Ap-flation and dnalysis of.the.dati, this- can result
22 J

s*
1So*
#
- S
in findings being based on data that are two years Old.
. System uniformity 7 The subsystems (HERS, BEDS, OSDS) are designed to
have approximately the same structure and level of aggregation so that
each fits neatly into the overall system.
4. System alteratiun - The development of an overall system from the existing
data-collection syStems has proved difficult and time consuming' Major
/alterations or iV'tions to the present system appear to-be a factor of
time (to clarify what is want-d from the system) and of resources (to
gain experience with the system with various oPtions).
Thus, the current need appears to be achieving some degree of atability
in utilizing the existing data systems. Once this is achieved, interest will
no doubt turn to the complex and difficult task of finding ways to utilize the
capabilities of the computer in new and creative ways. It seems reasonable,
thereTore, for the Bureau ofSpecial College Programs to evaluate and
ide,...ify their information needs for post-secondary continuing education and
to continue expleJrations with the Bureau of Statistic. ti Services ror the
purpose of obtaining this information.
Assessin: the Instructional Activit- Surveand Focus Del hi as AlternativeData-Collection Systems
If we look at the task of colle:cing data as a system, then it is
appropriate to view it as a dynamic, ever- ch'nging entity. The system changes
from time ,to time as a result of use, continuing evaluation, the emergence of
,needs, and re-use.
Since no_single information system can be expected to provide all data
that are needed, the strengths and limitations of the Instructional Activity
Survey and focus Delphi were examined. The experiences of the research team
22,

-
.1
181.
* and the responses of participants were used in arriving at the following
conclusions.
Strengths./ The concepts of "instructional activity" and "perceived
needs of continuing education" which the instrumentation sought to measure are
valid bases for long-range olanriing. A major purpoie of educational insti-
tutions is to provide instruction;, therefore, a description of what is L-Ang,
provided is an essential starting poin't for policy formulation. Likewise,
the needs of continuing education as perceived by relevant groups (i.e.,
policy planners, continuing educators, students) provide,standards and
direction as to what continuing education should be doing. Thus, the gaps or
differences between what is and what ought to be can be more readily A_lenti-
fled as a basis for policy determination.
Both survey instruments provided new types of data that could sup
plemeat the data already obtained by Existing "data - collection systems. Data
were obtained from groups (i.e., instructors, students, and continuing
education administrators) that are seldom queried about adult education
policy. Both instruments also allowed for a greater specificity of informa-
tion than is possible in institutional reports.
Finally the Instructional Activity Survey instrument allowed for
cross tabulation of data (e.g., educational objectives by subject matter,
age of student, etc.) at a lower level of aggregation than present instru-
ments, thus allowing constructipn of a sharper and more detailed profile of
studen population and activities.
Weaknesses - The primary weakness of both data-collection instruments
was the inability to receive a desired response rate. In the institutional
survey, 53 percent of the questionnaires that could be delivered were returned
by respondents. An additional 9 percent of the questionnaires were returned
a9

182
by respondents who declined to participate and 37 petcent of the question-
naires were not. returned. The percentage of usable responses for the three
Focus Delphi Rounds varied among the four groups ftom 11 to 39 percent; the
overall percentages for Rounds I, II,and III were 20, 21,and 17 respectively.
Several reasons may help 'explain why the low response, to both instru-
meAts was obtained: (1) overcoming tradition, (2) a lack of understanding
regarding the significance of participation, (3) concerns about invasion of
privacy, and (4) skepticism of social science research.
Overcoming tradition or resistance to change probably presented the
most signifiCant hurdl . Faculty'members and policy planners traditionally
have not been surveyed for detailed information about their activities and/or
opinions in the field of continuing education. The request for information
was viewed by many as an imposition on their time which they were unwilling
to donate for he purpose of research.
It was also obvious that many respondents were` 'not convinced of the
significance of their participation in the study. The idea of obtaining
citizen inputs into policy formulation is still a new concept, and perhaps
the significance of this behavior has yet to become appreciated by the general
public. The importance of oarticipation has to be recognized for busy people
to take one or more hours of time to provide information to someone else.
Since college and university personnel are often reimbursed for providing
advice and consultation, it may be-necessary to provide a small honorarium
in exchange for a r,mmitment for providing essential information for planning
purposes in the future.
Numerous respondents also voiced concerns about the invasion of their
privacy by the request for certain ',Inds of information, such as the number
of Listructional activities and the length of these activities. The concern

yr 183
expressed most frequently was that the State was checking on how faculty
members spend their time. While some respondents may have used thts-ts an
excuse to avoid participation, others raised sincete questions as-to tilt
motivations underlying the project. A variety of means (e.g., obtaining
approval of the study from university administrators, contact by a college or
university official serving as liaison for the study, identification of the
purposes of the-study in the questionnaires,and personal communication via
letter and/or telephone) was used to inform and reassure participants about
the legitimacy of the purposes of the study. However, not all lingering
doubts were satisfied.
A lack of confidence in social science research methodology was also
expressed. This view was expressed by faculty members from the physical and
biological sciences. Such individbals who were likely to be involved in
conducting controlled experiments were skeptical -lbout the "rigor" of social
science research methodologies in general. Again, the inability to deal with
this on a face-to-face basis prevented the elimination of this reason for
nonparticipation.
A second limitation to obtaining a'high response rate is-probably
related to specific decisions that were made by the research team. In
retrospect, the scope of the study was probably too ambitious. Perhaps
involving fewer people from fewer institutions would have resulted in greater
participation. Tivee need for person-to-person contact, while evident through-
out the study, was restricted to written and telephone communication. With
fewer institut:ins, it would be possible for memies of the research team to
visit each institution and assist respondents on a face-to-face basis. Also,
the amount and kind of personalized process designed to educate and interest
the respondent was underestimated. iThis also related to _the-size-of the
LLProject_and the-aMOont of resources needed for intensive follovup arLivities.
231
184
Another strate decision that -.eemed to affect participation adversely
was level of simpl ded for completing the data- collection forms,
To some, the task seemed formidable; others apparently
to provide data.-
not understand how
44aIn summarizing the strengths and weaknesses of the Instructional
Activity Survey and Focus-Delphi data-collection devices, the following
conclusions were reached:
'1. Data pertaining to "instructional activities" and "perceived continuing
education needs" are appropriate for the purposes of long'range planning.
2. The existing SED data-collection systems - -at the present time- -have
been developed-to collect other kinds of data
3. The two instruments have the potential for collecting data about "needs"
and "instructional activities"
4. The data-gathering approaches employing certain traditional techniques
will need to be revised if a high response rate is desired. The need
for innovation seems most important in the area of personal contacts
with all respondents, of possible payment for participation, and in the
process of educating participants about the study.
-Feasibility of Integrating the Data-Collection Systems
An initial aim of the project was to examine the feasibility of
integrating the data-collectiOn processes developed fir this study into the
SED Information System. B -juxtaposing the characteristics of the SED
system presented earlierWith the characteristics of the Instructional
Activity Survey and Focvls Delphi subsystem, the following conclusions-were
reached:
1. Level of aggregation - The data - collection subsystem used in the project
232

185
gathered information at the.level of individual instructors, students7,
administrators and pol' ;y planners. This means Clat the raw data were
gathered at a level different from the data obtained by the SED system.
These data are obtained at the institutional level. Thus, the formats
are different, some kinds of data would be quite different, and the
techniques for analyzing the data wObld be different,
2. Data-collection - The project data - collection system focused on acuities
of four sub-populations over a specified period of time, rather'th 'on
a population of a higher education institution at a single point of time.
Also, the new subsystem provided certain information from a sample of
the total population from which the activities of the total population
could be inferred.
System uniformity'- The project. data - collection subsystem does' not have
the same structure or level of aggregation as the SED system. Thus,
it woulo be difficult to integrate the Instructional,Activity Survey
and the Focus Delphi into the overall system.
4. ,System alteration - The integration of the project data-collection
system into.the SED system and its use on a'regular basis would require
major alterations in the present SED system at the level of data-gathering
and at the level of storage., Major alteiations such as these would be
inappropriate at a time the SED system is attempting to consolidate the
already-existing data-collection subsystems into an overall information
system for the State Education Department. Once this has been accomp-
lished, however, it would be appropriate to explore how the SED system
can provide additional data-eolleotion, storage,and retrieval services.
Given the above consideration:, it seems reasotable to recommend that
the project data-collection system not be incorporated into the present SED
233

186
management information system in the san(e sense that the BEDS, BEDS, and OSDS
are being incorporated. However, technical difficulties aside, there appear
to be compelling arguments for the consolidation of a data-gathering and
,analysis subsystem such as this one into the SED policy planning system in
some capacity. There is an enormous amount of important information about the
clientele, their objectiVes and interests,.
and the offerings provided which
would be useful in policy planning if it could be acquired and interpreted.4
-IP
Approaches for Alternative Data Collection
On the oasis of this study, tnere appear to be five strategies from4."
which the SED can choose in establishing'a continuing data-gathering system
for post-secondary continuing education. They are: (1) utilize the existing
SED management information system, (2) incorporate certain additional cate-
gories of desired information into the SED system, (3) integrate the project
data-collection subsystem (or similar subsystem) into the SED management
information system, (4) supplement the existing SED information system-with
the project data-collection subsystem (or similar system), or (5) consider
data-collection subsystems that are developed for the purpose of providing
other kinds of information. Advantages and disadvantages of each alternative
strategy are listed below.
The first alternative strategy of'relying on the existing system
(i.e., enrollment data) is what has traditionally been used. As stated
earlier, enrollment data have limited utility for developing a comprehensive,
long-ringe plan for post-secondary continuing education. Therefore, it is not
recommended as a proper strategy for long-range planning.
The second strategy of incorporating certain categories of information
into the SED system is recommended as a short-range policy only. As the SED
system is being developed, it might be possible to suggest important categories
234

187
-of information which might be incorporatedwithout major alterations into the
present SED data information system.
It is our belief that the following information categories could
become part of a syStematic%information-gathering process at the institutional
level. of aggregation. Deans and directors of continuing education could
request a sample o narticipants in their programs to provide the desired
information on a recurring basis. Appropriate coding systems could be developed
for aggregating this information at the institutional level.
1. Information about the people who constitute the "enrollments." Such data
could include: (a) useful demographic data such as sex, race, date of-,
birth, number of years of school completed; (b) perceived needs and
interests in continuing education; and (c) suggestions for changes and.
innovation in program andior organizational procedures.
2. Information about the instructional activities offered through continuing
education and extension units. Such data could include: (a) descriptive
data about the program (such as length, number of participants, the
educational objectives addressed, mode of instruction, place, etc.); and
(b) the-Instructor's suggestions for changes and innovations in the
program and/or organizational procedures. The faculty selected to respond
would be chosen on'a random sampling basis.
3. Refining the categories pertain1ng to credentials. At the present time,
three sub-categories (credit, non-degree credit, and non-credit) exist.
It would seem reasonable thatan expansion of 06se categories would
assist the Department and post-secondary institutions to serve all adult
learners more effectively. Increasingly, pest - secondary edudation insti-
tutions are providing additional Alternatives for learning (such as study
skill centers, non-traditional studies, competency-based piograms) and are
revising procedures (such as awarding credit for life and work experience)

188
that att ifipt to meet the educational needs of adult studenfs without regard.
to level of schooling.- The distinction between "post-secondary" and-"ele-
mentary and secondary education for adults. cannot be always and cleatly
defined because the audience for continuing education involves adults for
whom compulsory schooling procedUres are not applicable. It is conceivable,
therefore, that enrollments .in,postsecondary education_institution programs- -
particularly in private institutions,'in Cooperative' Extension, in study
skills centers, and in programs serving_the elderly and handicapped adults--
could lead to:
a. A High School or High School Equivalency-diploma
b. An academic diplocia or degree at the undergraduate level (A.A.,
B.A., B.S., etc.)
c. An academic diploma or degree at the graduate 'or professional
level (M.A., M.S., M.D., Ph.D., etc.)
d. A general or vocational diploma
e. A cercificate.or lijcensure as a specialist _
f. The enhancement of knowledge, skill, or attitudes at the elementary
or secondary level without regard to diploma, degree, or certifi-
cation requirements.
g. The enhancement of knowledge, skill, or attitudes at the college
undergraduate level without regard to diploma, degree, or
certification requirpments.
h. The enhancement of knowledge, skill, or attitudes at the post-
baccalaureate level without regard to diploma, degree, or certifi-.
cation requirements.
Special or custodial education obiectivefi.
The three categories of infprmation suggested above would provide dat,
236

189
about popurations and activities not heretofore recognized. The data-
collecting procedures would have the advantage of fitting into established
patterns of institutional information-gathering patterns of behavior.- Thus,
it would _probably not brifgea'ry to expend vast resources for secue:g this
additional information. The availability of such data could provide a means
for relating to other units of the total educational system that also provide
education for adults.
The third strategy of integrating the project (or some similar) data-
coilectiOn systeal into the SED information system is not recommended at the
present time for reasons stated p eviously. The incompatibility of the two
systems at this point in-time is th mary.reason for selecting another
strategy.
The fourth strategy of supplementing the existing SED system output
with the project data-collection-system is also recommended under certain
situations. Several characteristics of this subsystem should be noted. It
is obvious that undertaking supplementary studies requires additional financial
resources and personal-effort. Studies would be undertaken'to meet closely
defined specific information needs. A variety of specific studies could be
conducted over a period of time, thus adding to the knowledge base. Certainti
studies could be repeats::; at certain time intervals if needed. At the same
time, an ongoing data-collection effort would assist the SED to keep up with
changes in society in general and in the.State in particular.
For example, individual studies could focus on: (a) the perceived
needs and interests of a new or changing client group (such as women returning
to the work force, military veterans, members in particular professions,
retired adults, etc.Y; (b) the changing nature of continuing education
offerings by various types of institutions (such as two-year colleges;
237

190
7
private,)aon-profit institutions; proprietary schools, etc.); and,(c) the
changing nature of continuing education offerings through various media
(e.g., educational television, learning resource centers, etc.). The popuIa-
tion of instructors could also be queried on a selective basis rather than
including all categories of college and university personnel. Thus, the
respondents could include only (a) all faculty instructing in continuing
education units, (b) part "time and one-time faculty, or (c) all full-timt
.facul.tY%
The fifth strategy is, to use other collection systems. One of the
ost promisins approaches involves a study of total educational activity of
adults in New York State. Such a study would ut'Aize sampling techniques used
by tb U.S. Bureau of the Ceasus and would best be conducted by personal
intervi Wile a study of this nature could involve extensive resources,
the study lrould be restricted to a single political unit of the State, a
metropolitaparea or a region. Johnstone andiRivera conducted such a study on
a national//basis and Tough and Coolican use similar techniques with a
number of adults.1
One other alternative system was examined by the research team. The,t
idea of' systematically inventorying the available opportunities for learning
has been or is being explOred at the University of Toronto, Pace University,
and the Regional Learning Service of Central New York, among others. The
primary beneficiaries of these eefforts--as seen by the project team--are the
adult learner and the counselor of adults. The data are of interest to policy4
Bianners in that the number and kind 'of course offerings serve as one indicator
1 John W. C. JohnIstone and Ramon Rivera, Volunteersfor Learning
(Chicago: Aldine Publishing Company, 1965); Allen M. Tough, The AdultsLearning Projects (Toronto, Ontario: The Ontario Institute for Studies inEducation, 1971); Patricia Mary Coolican, "The Learning Style of Mothers ofYoung Children" (Ph.D. dissertation, SyracuSe University, 1973).
22 R

191
of the interests of adults, particulay if the courses must bi paid fOr by
the adult students, and as information about how adult learners are served.
A listing of course offerings, however, has limited utility for planning
purposes.' Such a compilation presents no informallon about the participants--
their characteristics, their prior edueetional-experiences, their expectations,.
their interesta2in additional learning, etc. Nor does such a listing explain-,
,0very much about the ctimmtnity and societal probltms that educational.programt
could address.
In summary, the observations and expvience 3,ne" project teamr.
support the-belief that additional data are heed ;by SED personnel for
developing comprehensive plans for lifelong education; .Data need to be-
collected about the current situation (i.e., "the what 15") and contrasted
with the perceptions of needji.e., "the what ought to he") as identified Mj
adult learners, professional adult,..educators, and policy influencer-ft. Two
techniques--the Instructional Activity Survey and the Focus Delphiwere
tested for their ability to obtain such data. The implications of the $106y
findings for developing a continnIng data-collection system suggest that the
SED information system should be supplemented, either by incorporating selecte
information categories _that are compatible into the SET system, or by develop-
ing a new subsystem to collect additional data on a regularly scheduled !Amis.
The project.data-collection subsystem, with methodological revisions, could
be used in this effort.
y 239
o
0

A
SELECTED PDL --3 SITJEONTINUING EDUCATION
O
The preceding chapteri have focused on findings related to the goals.
of tfte,prOject. lefgeneral,-,.t4e areas weVW explored: (1) techntqUes for
describing post-secondary-Ccinsinuing education activity-in higher education
institutions in New Yorkita;e (2) a eonstration of the feasibility of0
gainvone technique to,collect data pertaining to the needs that continuing'
0
education should adaress,' arid (3) an assessme..t of alternative.data-collegtion
systems,in terms of collecting data for-use in developing long-range compre-
he nsive,plans for post-secondaiy cdntinuing education.
The purppse of this chapter to to identify selected policy issues for
further cqnsideration.and actiorbyindividbals and groups charged with pro-
vidiheleadership for post -secondary cont nuing education in the State.
Selected backgrou nd infor mation Lepro ided for'each issue..
Three assumptions were reccjnized during the process of identifying
policy questions, One; the inv stigators acted On-the assumption that the
State Education Department Va/s committed to the goal of developing wa compre-. .
hensive, long-range7 151 for post-secbndmiry continuing education that focuses
on,a system of eduetition that facilitates lifelong learn9 ing for all citizens
_ of the State." Two, the act of choosing a course of action is the domain of
c -administrators and Polity makers:. Thus, the role'of.the csearch,team has been0
- to collect and present the data. The following policy issues are presented
192
24O

for the consideration of-policfr makers responsible for post-secondary con-,
tinuing education. Three, itlwas ai'.so assumed that poct-secondtry continuing
education involves other.insfitutioasn addition to the higher Iducation
system. Since 1Fedfirawe-.4 colle-ted frc.a the acuity and staffs of higher
education institutions, the findingscan\only speak to the higher eduCation
phase of post-secondary education, Other policy questions could be derived
from different value systems and data from other institutions.
Selected Policy 'Sillies
1." Should educational offerings be expanded-for minority group adults?
I
The evidence showed that smaller Percentages of minority group adults
were reached through instruct/oda* activities, than were whites. Since minorityt
group members have also completed fewer years of schooling financed with public
funds, it eould be agued that greater-effort Should be dikected toward learn-
ing -activiltiesdesired by minority group members than toward those desired
by the white majority. The data also showed that minority group members11
participated more frequently in activities that addressed academic degree. . -
objectives for persons 25 and under rather than the educational objectives
included in Categories I, II, or/III. It may be that minority group members
)
who are actually admitted into/higher education institutions prefer degree-
credit instruction bec\use of the value of credentials to them, an also
because many minorit group adults did not have the opportunities t1 obtain
an academir degree previously.
This spggeats that opportunities for-degree-credit instruction be
expanded for minority group mak4bers. Thestrend Loward experienCe credentiaL-.
ling and the provision of realistic counseling services (itcluding improving,
study skills) also could be. increased.
241

194
It could also be argued that more degree programs should be available
tlein locations accessible to minority group members rather than staying within
the physical boundaries of a campus. While non-credit instructional activities
for,minoritf group adults could also be continued and expanded, the data
suggest that minori a-'cup adults place -the higher priority at the present
time on academic. degree-credit piOgrams. .Would participati=on. increase if more
space-free and time-free programs were provided?
2. *Should educational offerings for alder adults be expanded?
The data indicated that older adults were the most inadequately served
of all possible target audiences in the State. Since the proportion of older
ac.ilts in the population increases each year, can the educational institutions
afford to ignore this group? Because of the physical,social, and economic_
limitation % of older adult', intensive researcn and program development could
be_ initiAted to learn how to accommodate institutional offerings and supporting
services to the needs and interests of older adults.
3. Should non-credit offerings be expanded?
`Using the broe.iest definition of continuing education--credit activities
for adults 25 and over and all non-credit instruction for persons 17 and older--
continuing education\accounted for'only one-fourth of all instruction in post-
secondary education institutions. Other studies have shown that most adult
learning activities involve nt academic edit. If post-:secondary education
institutions ac,..tpt the challenge of facilitating lifelong education f'r all
cftizens of the State, then the adult's preference for instruction without
regard to credit or cartification requirtments needs to be addressed. In other
words, adults will seek. c'.it both credit and non-credit learning opportunities
becau. - of their individual diff.rences, but the greatest number of adult will
242
I
195
choose activities that fulfill an interest in learning -ather than in receiving
academic credit.
4. What is the institution's role in providing supportive anu resourceservices for self- lanned instruction?
The almost complete reliance on face-to-face groups as the medium of
communication with 'earners suggests a lack of recognition of an.; appreciation
for the "self-directed learner." Resiarchers--such as Tough and others pre-
viously cited--have documented the magnitude ok learning activities that are
being planned, carried out, and evaluated by the learner himself. The same
studies also show that the self-directed 1,2arnet needs a lot of assistance
from other people. If the post-secondary education system is going to facili-
tate lifelong learning, then extension research, prugram development, and ad---
ministrativesuppert_4re needed tO determine the most appropriate medium of
communication, instructional mode, and delivery system that will assist this
large audience of learners.
5. Should more educational offerings he offered off the campus?
The instructional activities reported in this study were es:-.ntially
placebound--in a college, university, or- school. facility. Continuing edu-
cation instructional activity occurs in other settings such as gdvernment
facilities, private homes,\and churches. While it may be impossible for the
boundaries of a specific campus to be "the boundaries of the state", as is the
Wisconsin idea, institutions, or consortia of institutions could serve a metro-,'
politan area, a community, or a region. What incentives could be offered to
an institution or aconsortiuM of im/..itutions to extend the campus to more
storefront locations, more private homes, more community centers, and more
retirement centers?

196
6. Should educational offerings based on societal' concerns and problemsbe expanded?
There appeared to be a concentration of instructional activities in
the subject-matter areas of Letters, the Liberal Arts, and certain professions.
Conversely, there weite few instructional activities that dealt with societal
problems, if the number of activities in Social Science, Interdisciplinary
Studies, Home Economics, and Public Affairs can be taken as one indicator. If
adults seek to control greater portions of their own destinies, can post-
secondary continuing education afford to ignore the controversial topics of
the 1.eriod? Instructional activities deSigned for the improvement of society
shculd not replace instructional activities oesigned to improve iadiviuuals.
Rather, the system should offer greater numbers of instructional activities
concerning social issues and problems to provide a balance in the kinds of
instruction offered. If the post-secondary educational institutions are un-
willing or unable to take leadership in dealing with societal change, then can 4 _
knowledge resources be made available to other institutions that develop
cational programs to assist adults in coping with change?
7. Should continuing education offerings to the professions he expanded?
Although certain professions--Education, Health and Theology--were
recipients of extensive instruction, the service across all professions rats
uneven. Very few activities were reported for adults in Arch*tecture,
Engineering, Business and Management, Library Science, Home Econt>mics, and
Social Work. Forces, such as the rapidity of technological change and the
increasing interdependence among subject-matter specialists in problem
solving, need no further documentation. If the continuing education neees of
professionals are to be met, then what institution is better prepared or has
greater resources for the job than the higher education institutions?
244

197
8. Should the existing State Education Department Management InformationSystem be supplemented with additional data?
The investigation found that existing datfi-collection systems provided
some data that would be useful in developing a long-range comprehensive plan
for post-secondary continuing education. However, it seems unlikely zhat_such
an information system can ever provide sufficient data for planning the future
of continuing education. For example, data concerning "needs" were no oeing
collected at the time of the study. Thus, could the present system be sup-
plemented in two ways: (1) by including additional items of information on
the Lurrent data-collection instruments at a tim, whe, such da.a could be
-orporated into tilt? EiSLQM; and (2) by conductinv, additional studies which
would provide suppleritntary data about "needs"? The data-collecion system
could be modified to collect descriptive data on a recurring basis about the
ct,rril-,It situation (,0,21 as tut instructional activity survey), and ,Ierceptions
nceds in cont!nuin,; education irorri relevant populations (..uch as was demon -
itrated h. the Focus Delphi). The Deportment 4:=11 also encounter' other specific
information deeds on an infrequent or nonrecumn, tiasis. These data would
best be obtained through independent studies. Fur example, more data are
needed abou- the various ways that post-secondary continuing education is
financed.
9. Should the administration of post-secondary continuing education
be changed?
Traditional ways of looking at continuing euJcation were found to be
inappropriate in today's higher education institution. Changes in definitions
of when one is considered an adult and when one is a full-time or a part-time
student, and emerging notions about lifelong learning suggest that new ad-
ministrative divisions of responsibility are in order.
245
198
Since the evidence suggests that colleges and universities will con-
tinue to be involved in the certification of learning, instructional activities
can be divided into two groups: academic credit instruction, and non-credit
inaituction. Also, it seems reasonable that although many individuals willlk
be able to engage id post-secondary educational activity on a full-time basis;
increasing numbers will seek not only traditional, but also space and time-free
education, as a secondary activity. The distinctions between academic and
non-credit instruction, and aetween full-time and part-tim'e,learners, have
important implications for educational practice. Thus, four divisions of
responsibility within post-secondary education institutions are possible:
(1) academic credit instruction for full-time students, (2) academic credit
instruction for part-time students, (3) non-credit instruction for full-time
students, and (4) non-credit instruction for part-time students. 11Wch of
post-secondary education is now offered is the first category. If the
institution chooses to provide opportunities for lifelong learning, could the
other three areas become the vehicle for providing post-secondary continuing
education for all citizens of the State?
10. Should all areas of post-seco5dary educational activity be studied?
The preceding nine questions were based on data gathered in a study
of instructional activities in higher education institutions. These issues
might change if the study had included post- secondary continuing education
activity provided by all institutions in the State. Therefore; it seems
feasible that in order to deve.op a comprehensive long-range plan for post-
secondary education in New York State, a study of all post.4econdary institu-
tions should be made. In addition, a few recent studies have shown that a
large part of an adult's learning activity is self-directed. This activity
also needs further study in order for post - secondary education to assist
246

199
individuals in planning, implementing, and evaluating their self-directed
learning, and as a basis for identifying educational needs and interests of
adults in the State.
Continuing education for adults seems to be emerging as a critical
need for our society. Continuing education can serve to prevent informational,
and ultimately social, obsolescence among adults. Therefore, can responsible
educational policy planners of today ignore the future of continuing education?
247

t
APPENDIX A
INDIVIDUAIS ASSISTING WITH THE PROJECT/'
248
200
.
I

INDIVIDUALS ASSISTING WITH THE PROJECT _
1. James Byrnes, Seniai DeiigaSpecialist, Educational Policy Researeh Center,Syracuse University Research Corporation
2. Alexander ,N. Charters, Vice President for Continuing___Eduaation-gn-Professor of Adult Educationr-Syracute-Diii-versity
1
Harlan G. Copeland, Associate Professor of Adult Education, Syracu eUniversity
,4. Michael Folk, Research Associate, Educational Policy Research Center,, Syracuse University Research Corporation
5. David Mathieson, Research4lasistant, Educational Policy Research Center,Syracuse University Research Corporation
6. Stuart A. Sandow, Research Fellow, Educational Policy Research center,Syracuse University Research Corporation
7. Roger Sorochty, Research Assistant, Syracuse University
8. Warren L. Ziegler, Ca-Director, Educational Policy Research Center, .
Syracuse University Research Corporation;s and AssoOate Adjunct Professor,of Adult Education, Syracuse University
24

6
APPENDIX B
PROCEDURE FOR SELECTION OF THE FACULTY SAMPLE
Zip
202

14410000007
.203
PROCEDURE FOR SELECTION OF THE FACULTY SAMPLE1
The basic kit for selection of the sample consists of the following:
a) a list of the degree granting institutions with the approjdiate-. number of, full-time fac!4Yin IThe=11-Wilsed was entitled
"HigherInstftationi-00erating in New York State" prepared bythe DiVision of Higher Education, the New York State'EducationDepartment, dated Augysf, 1971.):
b) a table of rand(*) numbers
c) a large alphabetic directory of names, tthe document "1970Statisticians and Others in Allied Professions" Was actually used)
4d) faculty directories for each of the 'institutions selected in the
sample.
The following procedure was followed in . selecting the sample:
Each institution was assigned a unique number i (1 m, 1, 2,...229).
Let Fistand for the number of full-time faculty in institution 1. The 229
'institutions were listed in decreasing order according pc, number of full-time
faculty.
Si was assumed to be the number of full-time-staff (including faculty)
. where Si 3 x Fi from which the number of clusters,of 20 full-time staff, C1,
was calculated (Ci =_Ei 20) for each offlthe.229 institutions.
Cumulative totals were ass,,ned, so that each institution was assignee
a unique It of serial numbers (e.g., institution number 46 was assigned the
numb 1-347, institution 53 was assigned 348-670, aneso forth). The size
of a set determines the probability that the corresponding institupon will be
chosen in the sample. Altugether thlre were 5599 setisl numberi-or clusters.
1=1.1
1Ptepared by James Byrnes, Educational Policy Research Center,Syracuse University Research Corporation.
?.51

204
It was decided to break the total pOpulatiol of 5589 Serial numbers
into 28 zones of 200 clusters each and to choose at random two clusters per
ezone- -one for each of two samples. (Two samples were drawn, so that statistical
estimates could be made for the complete population.) This aas done by
selecting two random numbers between 1 and 200, which turned out to be "189"
for sample 1 and "99" for sample 2. Then for each sample every 200th number
was selected starting with the given random number. The serial numbers chosen
for sample 1 began with "189" and ended with "5589."- Note that:
a) For each sample, one serial number is selected from each of the28 zones.
b) The probability of selection of a given cluster is 1/200 for eachsample,- but it is 2/200 = 1/100 that it will be chosen in atleast one sample.
c) Any institution which contains 200 or more clusters is chosenwith certarinty by this tichnique.
/
d) If the number of cluiters within a given institution is less than200, the probability of an institution being chosen for at leastone sample is the ratio of number of clusters to 100. For instance,institution number 30 had 159 clx_:ters,, thus it had 159/100 = 1.59probability of being chosen, for at least one sample.
Next it was determined which institution'each selected serial number
was associated with. For instance the first sample serial number was 189.
Hence the 189th of the 347 numbers assigned to institution 46 was selected.
The second sample number 389, was the 42nd of the 323 numbers assigned to
institution 53 (the 1st number assigned to institution 53 was 348, the second
was 349, etc.). Also the third sample number, 589, falls within the domain of
erial numbers assigned to.institution 53 (it is the 242nd), so that two
clusters were chosen from institution 53.
Now we are ready to show how the faculty names in the sample are td
be chosen. We will do it by way of example, using the sixth sample serial
(252

numbei chose (1189), since wevhave on hand the staff directory for
corresponding institution, SyracOse University' (number 21i).
There were 157-clusters assoiated witty Syracuse. We are interested
in the 76th cluster. We could go directly to the faculty-staff directory of
SyracOse, divide it into 157 parts,
t
ajnd take the 76th part, but that would be-
very t dio'is to do for each of the f(*ty-seven institutions. Instead we go toI
a "wise" directory, namely the "1970 8tatisticians and Others in Allied
Professions" directory, which is"cramed with 112.5 pages of names. It's
easy to divide these pages into 157 parts and find the exact names between
I
t
205
which the 76th part lies. The names We desire are between pages 54.7 and 55.4.
If we divide pages 54 and 55-into 10 parts (this was done by making a template
the size of one page divided into 10 Oval parts-7in three columns, then over-
laying the template on the page in qustion), we see that the last name before
page 54.7 is "Knowler, Lloyd A." and the first name of page 55.4 is
"Kosobud, Richard F." -A complete listing of the page number boundaries is
attached in Table 63.
Table 64 gives f complete listing of the names by institution that form
the-boundaries of clusters. Note that ,the boundary names for institution 211
in sample I are "Knowler, Lloyd A." and "Kosobud, Richard F." All that remains
is for the sampler to obtain the appropriate names, i.e., those names which
fall between the name boundaries listed
It is_ possible that some of the institutions may need to provide more
than one list of names in order to include_all faculty members, If this is
the case all names, from all lists, which fall between the indicated name
boundaries should be used.
253

206
It also possible' that several names in a given cluster will nc;t be
names of people the sampler will want to query: .For instance, it is estimated
that roughly 20% of the names( obtained will be iFm either the secretakial or
maintenance staff. The sampler will probably want to determine which names
fall into this "unwanted" category before administering the final instrument.
I
254
.?A
.1
J. _
O

WIZ 63
PAGE SPECIFICATIONS FOR BOUNDARIES
ti
. 207.
Inst.
Sample IStart
r46 ( 62
51_ 15.351 -'84.9
135 47.7// 30 25.1
211 54%7228 95.8
.
2181532048466
-154
37.4
98.4'63.2
67.7
,32.3
21.6
197 62
149 1
126 '44. 108.8
199 34.2
158 21.7
164 78.1 ,
209 81.9150 57.3
179 87.9
186 40.7
219 It.S
42 '47.9
118 26
105 57.3213 1
(
t
Finish Inst.
62.3.. ,__,---,T, 4615.6 4685.2 53
48.1 13525.8 135,55.4 30
96.6 22813.8 20699.3 1.53
64.2 2069.1 102
33.9 202
23.4 167 _63.9 100
3:1 , 207111. 188
3 15724.7 14481.3 6
85.4 122
61.6 208
93 163
47.3 1 2'24
/06 8057.3 161
1%1.5 131
76.1 1
113.5 168
,..--L__.----:--
255
Sample II'Start Finish .,.
3? .8
97.6: 53.612.191.3102.9
23.5
. 74:5
18.7
88.266.7
5.692.9
49.512.5
35%2102.5
16.6T06.7-
25.1
91
30.6
33.1.97.953,912.5,
,91.7
103.6/'24.3-
75.1419.6
"89.1
67.87.1
94.54.851.414.837,6
105.3
19.8110.1
. 29.1
95.536.5
1 8
'65.3 1.357.3 68.681. 97.538- 76
111=11M11,111M
4

208
TABLE 64
THE SAMPIED NAME BOUNDARIES BY INSTITUTION
1 Academy of Atronautics(2) Pratt, Robert W.
6 Albany Medical College(2, Chase, Gerald R.
20 Brooklyn College(2) Sargent, Thomas J.
30 City C011ege of New York(Ili Doege, Richard L.
Tryggveson, Anne
42 College of New Rochelle(1) Hynes, Robert F.
46 Cblumbia University(1) aosiry, James A.(2) Seiwart, Frank G.(2) Freersken, Gary 1,
e* Cornell 'University(72.1 Carothers, Doris
41) Robertson, Tim/ (0 King, Leslie J.
66( Fordham University(1) Francis, Almedeo
'80 Hofstra University(2) Aaron, James P.
84 Hunter College(1) McQuaid, Gertrude C.\
100 Lehm..n, Herbert H., College(2) Andersen, E. Sparre
102 Long Island University
Stern, Leonard
- Cook, Elsworth B.
Schillmoeller, Edward
Draper, John F.Tytun, Alex ,
Lamy, Payl G.
land,' Charles W.
toker; D. J.lezishman, Fred
Carter, Walter H.Rodrigues, Luis H.Kirkpatrick, Robert L.
Gammon, Edward
Beresford, John C.
Miehelsen,2111Alis B.
Babcock, Jarvis M.
(2) McFadden,Roger T. McWilliams, Paul C.
104 Manhattan College(1) Parl, Boris
105 'Manhattan School of kisic41) Lamy, Paul G.
256
Prabhu, N.
Oliva, E. L.

TABLE 64--Continuation
118- Mercy College(1) Dropkin, Lester D.
121 Molloy Catholic College for Women(2) Lamy, Paul G.
122 Monroe Community College(2) Warren, John S.
126 Nassau Community College(1) White, Mark A.
135 New York University(1) Busted, Thomas P.(2) Shah, K. R.(2) Brinks, James'
144
149
150
153
154
157
158
161
163
167
168
Pace College(2) Townes, James R.
Polytechnic Institute of 'Brooklyn(1) Aaron, James P.
Pratt Institute(1) Lamy, Paul G.
Queens College(1) Stromberg, Warren L.(2) Cobb, Whilfield
Rensselaer Pc ytechnic Institute(1) Cucich, Georg,.
Rochester Institute of Technology(2) Giambra, Leonard M.
Rockefeller University"(1) Cummings, Douglas S.
Russell Sage College(2) Matalas, Nicholas O.
Bonaventure University(2) Seri, Armand 1
St. John's diversity(2) Sidrauski, Martha
St. John Vianney Seminary(2) Greenberg, Bernard G.
25
209
Greenberg, Bernard G.
Merril, W. J.
Wilson, E. V.
Wood1 Donald F.
'Inglis, JamesSha, Lawrence H.Brown, Bruce M.
Virts, John R.
Anderson, Nancy S.
1
tiombardo, Angelo J.
S yderhoud, Henri G.C nlon, Mary 0.
Dekton, Leonard W.
Gorm n, Aloysia M.
Dietz,\Stephen K.
Nanni, I s F.
Soloman, Murray
Ery
\
Okuma, Akimichi

210
TABLE 64--Continuation
179 Skidmore ^ liege(1) Sanches, Cecilia A.
186 State U.C. Ag. & Tech. Morrisville(1) Hamilton, C. William
188 State University Cdilege at Brockport(2) Brown, BrAford S.
197 State University College at Oswego(1) Lowry, James A.
199 State University College at Potsdam(1) Garfinkel, Joseph
Siegel, Marilyn
Huitema, Bradley
Campion, Parry
Mann, Evelyn S.
Goldman, Herbert K.
202 State University Downstate Health Sciences Center(2) Barber, Warren G. Becker, Walter A.
204 State University of New York at Albany(1) Madsen, Richard W. Mhrczynski, Louis F.
206 State University of New York at Buffalo(2) Neville, William J. Norris, A. G.
207 State University of New York at Stony Brook(2) Jespersen, Howard W. Kanal, Prakash
208 State University Upstate Health Sciences Center.(2) Doege, Richard L. Eyermann, John G.
209 Sdffolk County Community College(1) Puffer, R.zch .Rogers, Pearl B.
211 Syiacuse University(1) Knowler, Lloyd A. Kosobud, Richard F.
*213 Tompkins Cortland Community College
(1) Aaron, James P.
218 University of Rochester(1) Gordesch, Johannes
219 Vassar College(1) Studdiford, W. B.
224 Wagner College(2) Fiekowsky, f?.ymour
228 Yeshiva University(1) Soults, Donald J.(2) Decker. MerCis C.
258
Zwickl, Os'ar
Gratehose, Donald A.
Verley, Frank A.
Godfrey, Milton L.
Stage, Albert R.Detwiler, Louise B.

MEW
Institution
211
COMPOSITION OF SAMPLE BY INSTITUTION
FocusTotal Delphi
Academy of Aeronautics 112Albany Medical College,
Union University 12 3
Brooklyn College, CityUniversity of New York 21 4
City College, City Uni-versity,of New Yark 23 4
College of Mew Rochelle 9 2
Columbia University 67 14
Cornell University 70 13
Fordham University 16 3
Hofstra University 68 14Hunter College, CityUniversity of New York 17 3
Herbert H. LehmanCollege 26 5
Long Island. University 14 3
-Manhattan College 7 2
Manhattan School of.Music . 26 5
Mercy College 13 2"
_Malay College 12 3Monroe Community College 14 2
Nassau Community College '6 4New York University 5.i IC
Pace College 6 '1
Polytechnic Instituteof Brooklyn 13 3
Pratt twtitute 19 4Queens College, City .
University of New York.49 8Rensselaer Polytechnic
Institute 8 2Rochester Instituta ofTechnology 12 2
Rockefeller University 9 2
Russell Sage College 8 2St. Bonaveture 0University
- _3 0
43
Institutional Number Selected to Repprt
9 0 1. 0 0 8
9 1 0 0 0 8
17 0 0\ 0 1 16
19 0 0! 1 0 18
7 - 0 0' 0 0 7
53 0 0 O. 1 5257 1 0 1 1 5413 0 0 0 0 1354 0 1 1 4 48
.4
14' 0 0 0 1. 13
21 0 0 U 0 2111 0 0 0 1 105 0 0 0 1 4
21-,
0 0 0 1 2011 0 0 1 0 10
9 0 0 0 0 912 0 0 0 3 912 0 0 0 1 1145 1 1 2 1 385 0 0 0 0 5
10 0 0 0 0 1015 0 0 Is 0 14
41 0 1 0 0 40
.6 6 '0 0 0 6
10 0 1 0 0 9
7 0 0 0 0 76 0 0 0 0 63 0 0 -0 0- 3
9

212
TABLE 65--Continuation
FocusTotal Delphi Institutional Number Se( tted to Report
Inst4tution Sample Sample Survey Sample 5wks 4wks 3wks 2wks lwk. --
St. :1ahn's University * * * * * *---- * *St. John VianneySeminary 4 0 4 0 0 0- 0 4
Skidmore College 1 0 1 0 1 0 0 0
Agricultdral and Techn1-cal College at MorriSville, State University 1
of New York 19 4 15 0 0 1 1 13
State University Collegeat Brockport, StateUniversity of New York 18 4 14 0 0 0 1 13
State University Collegeat Oswego, State Uni-versity of New York 10 2 8 0 1 0 2 5
Scate University Collegeat Potsdam,. State Uni-versity of New York 11 ** 11 0 0 0 0 11
State University of NewYork at Albany 12 2 . 10 0 0 1 0
State University of New--York at Buffalo 29 6 23 0 1 1 0 21
State University of NewYork at Stony Brook 25 5 20 0 0 20
State University of NewYork Downstate MedicalCenter * * * * * * *
State University of NewYork Upstate MedicalCenter 91 18 73 1 1 2 1 68
SuffolkCounty-Community College 16 3 13 0 0 1 0 12
Syracuse University 18 4 14 0 0 ) 0 14
Tompkins-ZortlandCommunity College 77 15'\ 62 1 1 2 5 53
University of Rochester 14 3 11 0 0 0 0 11
Vassar College 25 5 20 0 0 0 0 20
Wagner College ' 9 27
0 0 0 0 7
Yeshiva University 75 14 61 1 0 0' 0 60
Totals 1076 209 867 6 10 15 26 810
* Institution declined to participate in the study.** Names obtained afte locus Delphi sample was determined,
260

/
APPENDIX C :
. INSTRUMENTATION
1...
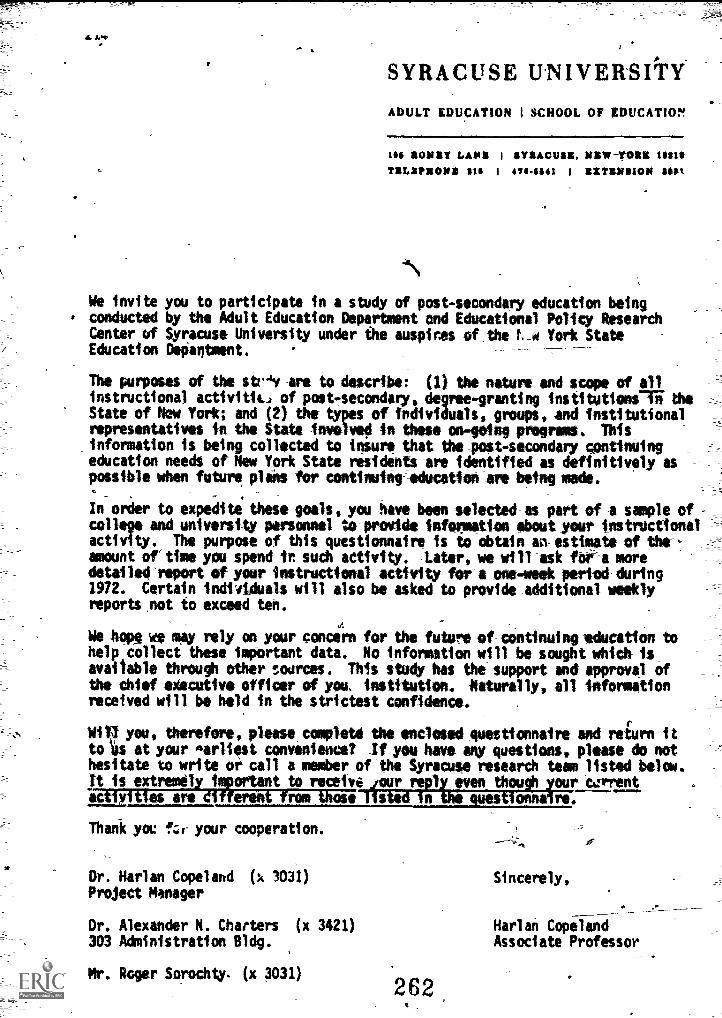
SYRACUSE UNIVERSITY
ADULT EDUCATION l SCHOOL OF ZDUCATIO:v.
IN ROUST LAPS I rilluicuss.NSW-rosit 11410
TILSPROWS 1111 I 11.1141 I ZITIN1111011 1411
4IN
We invite you to participate in a study of post-secondary education beingconducted by the Adult Education Department and Educational Policy ResearchCenter of Syracuse University under the auspices of.the t-44 York StateEducation Department.
The purposes of the str4v are to describe: (1) the nature and scope of allinstructional activitic, of postrsecondary, degree-granting institutions' iiiState of New York; and (2) the types of Individualsvgroups, and institutionsrepresentatives in the State involved in tense on-going programs. Thisinformation is being collected to insure that the -post- secondary continuingeducation needs of New York State residents-are identified as definitively aspossible when future plans for continuingAducation-are being made.
In order to expedite these goals, you -have been-selected-as part of -a sample ofcollege and university personnel-to:provide information about your Instructionsactivity. The purpose of this questionnaire is to obtain an- estimate ofamount of'time yal spend in such activity. latter, we will-ask far-a moredetailed report of yair instructional activity fora one-week period-during1972. Certain individuals will also be asked to provide addittonal Weeklyreports ,not to exceed tent.
We hope we may rely on your concern for the future of continuing education tohelp collect these important data. No information will be sought which isavailable through other sources. This study has the support and approval ofthe chief executive officer of you. institution. Naturally, all informationreceived will be held in the strictest confidence. .
Win you, therefore, please completd the enclosed questionnaire and return ittolls at your earliest convenience? If you have any questions, please do nothesitate to write or ,call a member of the Syracuse research team listed below.It is extremely i Ott to receive /our repi even they* your currentactivities are dif erect from those listed In questionna re.
Thank you f.r your cooperation.
Dr. Harlan Copeland (14 3031)
Project Manager
Dr. Alexander N. Charters (x 3421)
303 Administration Bldg.
Mr. Roger Sorochty. (x 3031)
262
Sincerely,
Harlan CopelandAssociate Professor

yj
NAME: Mr. Mrs. Miss
COLLEGE OR UNIVERSITY:
Last
215
BSCP form 1 p.1
Staff Questionnaire
First Middle
1. List all academic degrees or certlficates earned:_(-Enter years received; if none, so. state.)
1. Vocational or Technical CertificatiZ. Associate Degree -(two -year)
3. Bachelors Degree (B.A., B.S., etc.)4. Masters or similar professional degree5. Doctorate or advanced professional degree6. None
.1MtRimmimmemilMimm.MMII1111M.1!
immEmmemmamM.
mm.mmommEm
2. Barring unforeseen events, please estimate the total amount you expect toreceive from all wages, salary, fees, grants and fellowships, includingtuition waived and self-employment from teaching activities both insideand outside your institution during the calendar year 1971. (Informatiohwill be.treated confidentially.) Chit investment-type income.(Precision to less than a thousand dollars is not expected.)
NAME:' Mr. :irs. Miss
CURRENT BUSINESSADDRESS:
Last First Middle
ZIP
CURRENT BUSINESS PHONE No.: AREA (
YOUR DATE OF BIRTH: Month
ADMINISTRATIVE TITLE:(If none, so state.)
RANK OR POSITION: (Check one)ProfessorAssociate ProfessorAssistant ProfessorInstructorLecturerResearcn Associate.
MWMAIIImm
Day Year
Research AssistantFellow
Research FellowTeaching FellowGraduate AssistantTeaching Assistant
'263
-For Staff Use
IDSN
CN
SQ
YNRP
WT
Administrative AssistantSecretarial/Clerical,TechnicianAssistant InstructorMaintenanCeOther (Please describe)

Please enter below the best estimate of any amount of time you snent in instructional activities in the areas and
time periods listed below. Regardless of-whether yoU donated or were comensated for your services, include instruc-tional activities sponsored either by your institution or by an outside agency even if you met with only one individ-
ual. Omit family instruction and instruction undertaken on a one to one basis as a supervisor in a job or profession.
If you were not involved in any instructional activity, please indicate this.Cfs
A. Instruction not creditable towardacademic degrees (altered eitherinside or outside institutions ofhigher education including themass media).
SEPT. 1970 THROUGH AUG. 1971roT of different weeks Estimated total
of involvement during contact hoursthis period in which of instruction
you.provide some during this .
instruction period
1. Instruction in professional andtechnical knowledge and skills forindividuals with previous collegework -or equivalent experience.
2. Technical and vocational instructionfor post-high school students withlittle or no previous college workor equivalent experience.
3. Remedial instruction for post-highschool students preparing for academicwork at the college level.
4. Sectarian, moral or religious
5. Sports, recreation, hobbies. handicrafts
6. Art, drama, music and other culturaldevelopment activities
7. Home an family life
a. Current-events, public affairs, and
citizenship
9. Agricultuee
10. C.)er
11. None of the above
-,....
SEPT. 1971 THROUGH AUG. 1972fio. of different weelcs Estimated total
of involvement during contact hoursthis period in which of instructionyou provide some during thisinstruction period
.01.1111.. - 3 265

B. Instruction creditable towardacademic degrees
I) Regular Division Offerings
I. Lower division, undergraduate
2. Upper division, undergraduate
3.Graduate
4. None
of trwolvement during_this period in whichyou provide some
nstructi
wee.
involvement duringthis period in whichu provide some
instruction
-11) Continuing Education Division Offerings
I. Lower division, undergraduate
2. Upper division, undergraduate
3. Graduate
4. None
C. Other
I. Early childhood instruction
2. Elementary level
3. Secondary level academic,ortechnical-vocational
4. Counseling
5. Other (describe)
6. None of the above
INI.!
.....
....."
Tal.=liiM

218
SYRACUSE
ADULT EDL'CATI'ON
UNIVERSITY
SCHOOL OF EDUCATION
105 RONEY LANE i SYRACUSE, NEW YORK 13210
TELEPHONE 316 475-5541 EXTENSION 3061
We would like to take this opportunity to thank you for your cooperation inresponding to.the previous questionnaire concerning the study of post-secondarycontinuing education in the-State of New York. 'The purpose of that form was to-provide a gross estimate of the nature and extent of instructional activityprovided by administrators, faculty, and staff of post-secondary degree grant-ing institutions in New York State.
Based upon that information., you have.been,selected to provide a moredescription of your instructional activities for the following one week
period(s):
The week(s) has been selected randomly. The questionnaire(s) will be mailedso that it will arrive on your desk by Friday Preceding the reporting week.
The questionnaire fccompanying this letter is the first one, we would like you
to complete.
Hopefully the directions will provide the answers to any questionslyou may have-7
concerning' the completion of the Form. However, if we can be of a/hy assistance,-
please do not hesitate to contact myself o Roger Sorochty at the above phone
number or address.- 7t
We realize that providing this inflrmationswill represent an inv4tmentiflokm-4time and energy. We sincerely thank you for your efforts and cooperation this~far and look forward to your continued support of the study. ,
1
-?,.--- .
HGC:fdEnclosure
263 .
Sincerely yours,
Haflan CopelandAssociate' Professor

i
4
SYRACUSE UNIVERSI.TY
ADULT EDUCATION 1 SCHOOL OF EDUCATION
v_ -5--
Itlt ittiltRY LA NV. I MYkm'IINK, NEW yoNN I.:I 2 Iff
flitLitPlietit lit i 471641 KXTENSION tort
Some time ago, you were asked to provide some info n about the natureand extent of your activity as a teacher. This info ion is important inincreasing our underttanding about tl,_ Aature and e nt of post-secondarycontinuingNeducation in New York State. Your personal' response is imoortanbecause it it representative of approximately 125 other university gepersonnel in the State.,'
The enclosed questionnaire seeks more specific information about instructionalactivities than v- were able to obtain in the first questionnaire. We wouldgreatly appreciate your cooperation -in completing this form even though wedid not receive a response from you to' the earlier questionnaire.'
The week(s) has been selected randomly. The questioichaire(4 will be mailedso' that it will arrive on your desk by Friday preceding the reporting-Week.The- questionnaire accompanying this letter is the first one we would like you
to complete.
Hopefully the directions will provide the answers to-any questions you' may
have concerning-the- ccapietion of the Form. However, if we can be of anyassistance, please do not hesitate
L.contact mYielf orloger*Sorochty at the
above phone number or address. L.,
We Sincerely thank- you for your efforts and cooperation and look forward toyour continued support- the study.' Furthermore, we encourage.you to return
the Initial questionna'1ri Should you require an additional copy, please do
not hesitate to contact us.
HGC:fdEnclosure
000269r
Sincere' yours,
Harlan CopelandAssociate Professor

4
220
Instructions for Co letin MCP Form
The reporting unit in this study is ar instructional actIvityWith the exceptionsnoted in the next paragraph_, list ALL of instructional-iiAivities during the
week in-which you'have been asked to report, including Sundays and holidays. De
sure to include instructional activities whether -or not they are connected with your
primary place o' employment. Include Any activity which has the DIRECT purpose of
improving the knowledge, skill, or sensitivity (attitude) of an indiAdual, group or
mass audience.
Omit the following kinds of activities: 1) research, 2) preparation of research
reports for publicatiun, 3) any personal, learning activities, 4) instruction offamily members and 5) instruction related"to your employeri, employees and subordi-nates supervised by you, or to other. job-related colleagues within your own institu-
tion.
Include all other instructional activities ignoring any distinction between formal
oe infofdal Offie and space rc:strictions; whether associated w:th an educational
institution or not; and, whether no, ohe, or several learners were present: For
exam-:e, yea st tli report activities such as: 1) designing, zredting, writing,
filming or recording instructional material, 2) tutorial activity, 3) contuTtative
activity when it is primarily "instructional".W
,
You need not nanweach-activity: Describe each activity by entering the-appropriate
cods rumbers fr.'s the attached code sheets in the spaces provided on the Form. While
information about the time that the activity took place is desired, e'e study is not
a time-use study. the form does not have to account for all of your time leFi;he reporting period.
If you me tavclas or group of students more than once a week for the same general
purpose, record each Aeeting as a separate ,ctivity during the reporting week. You
will note tut the information provided In columns 2, 3, 4, 5, 6, and 13 may be
different for each of these similar-type activities.
We sugges, you examine the example entered on the first line of Fc-m 2 and the
explanation accompanying these instructions. When ynu are satisfied that you under-
stand the nature of that activity, proceed by supplying informatien pertinent to
your own :nstructional activities. The reporting -leek begins on Monday and ends with
the following Sunday.
e
Instructions for Form 3
Please complete one forM for each instructional activity you have lisued on Form 2.
Pecane of the difficuTty 'di estimating the number of these forms you would require,
we mgy not have inclwied enough. Please contact us if you require any additional
material.
Wheii yOu have recorded all of your ir.tructional activities for the reporting period,
return the-e4ext4genaire in the attached envelope: _7 you encounter any questions,
lease teLphone either Harlan Copqland or Roger Sorochty at (315) 476-5541, ext.
27U

221
Explanation of the Example Given on BSCP Form
The instructional activity used in the examplt occurred October 17 beginning at 9.7,0a.m. and lasted 50 minutes. There were_80 learners (participating in the activity`.
The exper4 ,ntial and formal education prerequisites (columns 6 and 7) and theub4ectives,(column 8) refer to those set by the instructor, not the studrt. There-fore, in the example, the lostructor felt that the learners partieipatin in theinstructional activity should have achieved functional literacy and completed nine'toeleven grades of school.
Likewise, the instructor chose number 4 from Code List C as the ob'ective because hewas not addressing diploma, certification or degree requirements. This does notpreclude individual learners fiJni ::etting different objectives.
The medium of commutii,ation used by the instructor is indicated, as being a lfye audio-closed circuit brigaiirTicumber 6 in Code List Di. We have chosen this category forthe example sirce it could consist of such procedures as an. amplified telephone hook-up between several points. The other categories should be_enlf-explanatery, It snouldbe mentioned that an activity in which you used a computer as an instructional -;aidshould be coded' number 9 in Lade Li-St D-While an activity in which you designed,-material for later use with a computer should be coded number 1 in Code List D..
The instructional mode used was, coded number 2 from Code List E since two-way commu-nicaillFwas involved in a discussion.
The content categories in Code List F are purposefully general. Many subjects, suchAS grouRihamics for instance, could be included in two 0- more categories. thistype of situation occurs, it is suggested that column 11, the content of the instruc-tion, be coded in a manner that will indicate the primary subject area in which theinstructional -activity is offered. In the example, code number 23--theology--wasused since the discussion focus, -,l on iu&o7Chric.tian values.
Columns 12 thrCugh 17 are used to identify sources of support for the instructionalactivity from Code List G. In the example, support (financial, facilities, time) wasprovided by 4 institutions andlor individuals. A religious organization (number 21)provided the most, a private non-profit educational institution (number 12) providedthe next greatest amount in terms of facilities, the instructor provided the thirdmost (number ;O1) in terms of h' time-and the learners (number 02), terough a small,_fee, provided the least. Although space is provided,to indicate as many as sixsources of support, there need not be six.
In column 18, the number indi-ates that there were 4 different s ousors (individuals,and/or institutions). While there is space to indicate 6 sources of support, theremay, of course, be more.
The direct source of our remuneration or red ient of our time is identified in theexemriThrire gious organ zat on n co umn e wo r rect is emphasize4,indicating the institution or individual who actually provided dm reffiuneratinndirectly to you or was the direct recipient of your voluntary contribution. Remuner-ation ma;, oe received in a vaiety of forms such as money, tuition remitt,nce, etc.
In column 200the instructor reported that he p.ovided the it truction without feeas evelunter activity.
The instructions; activity took place-in a college which has the amplified telephoneWork capability. 271

Name o Respondent
REPORT ON INSTRUCTIONAL ACTIVITIESDURING THE WEEK OF
me dayThrough
mo. day yr
BSCP Form 2ID
SN
CI
SO
REP
WT
2 3 4 5 6 7 8 9 I I I 12 13 14 1 IS 16 17 18 I 19 20 21
Data
TimeActivityRagan
Lengthof
Activity
Numberof
Learners
PrerequisitesFor Learner
Participation
InstructionCharectarisoe
..
Support Characteristics
Piaciof
Activity
uiea23
1-
v.).0
¢0 1t
iz 44
IEnter!timberpresent
If none,so state
(Enter from Code kist*)
*8 *c *o *E
(Enter from Code Lig)
diG *6
, Enter fromCode Liat
*II
4r.Zw
a.Xiii
g..:<uE(Li
J<a=oU.
U34.1
?.1-'
8a0
2n,-,..
tri'2
to002
.
1-zte.
g4-)
Indicate by code the types of Hist-tutions and /or individuals contributingdirect and/or ridoect support in money,time in *ace. Include voluntaryci+ntributiobb (Rank from most toleast.)
i
I 3 4 a f
Number ofdifferentdirect andindirectsponsors.
(Land inCode List rG.)
DIRECTinstitutionalsource ofyour momelation orrecipient ofyour time,if trot itary.
Was this a
voluntaryaquntyfor you?(Voluntarymeans you
receivedno Inman-oration).
tFatieryet at ni.,
CI10 17 9 00 AM 0 50 BO 2 3 6 2 23 21 12 `,1 02 4 21 Yes 1
I
2
III
IIIMO
III= IIII.III 111111111111111
111111 '
I:1 III1111 IRE 11191111111111111111111111111
II .
7 III........i.III
10 III III
...,,,,M.
1' ?'7

CODE LIST A,E xperient:al Pre-requisites Needed by the Learners
To Receive the Instruction
223
PODE LISTAmount of Formal Education Requirer%by the
Learners to Receive the Instruction
CODE ; CODE
1 eteme lie. literacy skills not required) 0
2 Functional literacy (acquired knowledge and skills in 1
reading and writing which allows one to effectively engagein activities in which literacy is normally assumed)" 2
3 Basic vocational training or experienor comparable to 3high school experience
4 6nderstanduii of Arti, Sciences, or Humanitiescomparable to high school experience
5 Study or experience in vocational, technical or professional 6areas comparable to trie associate degree (1,e. two years ofcollege) 7
4.
6 Understanding of Arts, Sciences, or Humanitiescomparable to the associate degree two years of college)
7 Technical or professional study or experience comparableto the baccalaureate degree
8 Study or understanding of Arts, Sciences, or Humanitiescomparable to the baccalaureate degree
9 Advanped technical oe professional study or experiencecomparable to a master's or first professional degree
10 .. *sidvanced study or understanding of Arts, Sciences,ror Humanitiescomparable to a master's or first professional degree
CODE t 1ST C
Educational Objectives and Credentials Addressed by the Instructor
CODE
1 Addresses instructional objet ors leading to an academicdiploma sr degree (High School Equivalency, B A , MS ,MD,etc)
2 Addresses instructional objectives leading to a general orvocational diploma
3 . Aseiresses instr.sctional objectives leading to certificationor licensing as a .pecialist
4 Addresses Instruct onal objectives designed to enh-ncegeneral knowledge without regard to diploma, certificationor degree requirements
5. Addresses ntructional objectives focusing on specificindividual or insttutionzt problems or interests withoutregard to diploma, certification or degree requirements
6 Addresses remedial or have preparation oectias v ithoutregard to diploma, certification or degreP requirements
7 . Adaresses special or custodial education objectives
8 Other (describe briefly on the reverse side of BSCP Form 2i
8
9
No credentials or years of schooling required
Compistion of 1 to 7 grades of school
Completion of 8 grades of school
Completion of one or more grades from 9 to 11
Completion of 12 grades of school
Completion of 1 year of college
Completion of 2 years of college
Completion of 3 years of college
Completion of a 4-year college degree
Completion of an advanced degree or frostprofessional degree beyond
ij
CODE LIST
Communications Medium Used by the Instructor
C("F
0
1.
Writing an eveluatton of performance (e g, instructionalcorrespondence)
Writing or designing instructional material (for use by learnersfor any medium eizluding those listed below and for independentstudy)
2 8roaCiCAnng Live TV Open reception'
3 Broadcasting Live TV closed circuit'
4 Broadcasting Recording TV tape (exclusively for delayed use)
5 Broadcasting Live audio open reception"
6 Broadcasting. Live audio closed circuit
7 , Broadcasting: Recording audio material(exclusively for delayed use)
8 Filmiing
9 Addressing inc 'victuals face to face alone or in groups (exclusively)
*Whether or not also recorded and whether or not live audiencewas also present.
NOTE An activity in which you watched a film with students or hearda recording should be coded 9 above, not 7 or 8
274

224
c00E LIST E CODE LIST F
Subsist Matter of InstructionInstructional-Mode Ur I by the Instructor
CODECODE
Lecture, exposition or dononsnation(including media use)
01
02Seminar. dialogue or discussior
033 Workshop, lab, or the supervision of experiential
learning (simulation, role playn.g, field trip,internship, etc )
04
06 ...Combination of 1 and 2 above
06Combination of 1 and 3 above
07 .
Combination of 2 and 3 above08 ..
Combination of 1, 2 and 3 above
CODE LIST G 09
Contributors of Direct and/or 10 .Indirect Support
INDIVIDUALSCODE 11 ,
01 .. . Self
02 . Student participants
03 .... Other inoincluals
.INST(TI,ITIONSCODE
11 . Public educational institutions (schools, colleges.residential schools)
12 Private non-profit educational institutions (schools.collegos, residential schools)
13 . Private profit making educational institutions(propiletary schools)
21 . .. Voluntary associations religious --
22 ..... Voluntary associationi. -Prelahicins
23 . Voluntary assocw.^^s other (civic, fraternal,health and wells. youth, etc
31 Community agency... libraries
32 .. Community agencies: -.7.useoms
33 Community agencies health and welfare
47 Cooperative (Agriculture) Extension
51 Government agencies' city or rovnty
52 Government :Agencies: state
53 ... Government agencies- federal (including military)
61 .. Busmen and industry
71 Labor unions
dt _ Mass media (including both ctimmerci.1 andeducational
91 ,... Foundations
2,75
Agriculture and Natural Resources
Architecture and Environmental Design
Area Studies (e.g., East Asia Middle East.)
Biological Somalis (inctrling Biochemistry and EasiogY)
Business and Management hn('rding Business Administration)
. Communications
Computer and Information Sciences
Education (including educational psychology. philosophy ofeducation, and educational administration)
Engineering
Fine and Applied Arts (including Photography, ceramics.weaving, etc.)
Foreign Languages
12 Health Professions
13 . Home Economics
14 Law
15 Letters (including Ling.,'stics, Speech, Philosophy)
16 Library Sciatica
17 .. Mathematics
18 . Military Scienc
IS Physical Sciences
70 Psychology
21 Public Affairs and Srvicor (including Social Work andPublic Administration) 1 6'
22 . SOcial Sciences (including economics, geography and politicalscience)
23 Theology
49 . loterdisciplinary
50 . Recreation (Sports, games)
51 Other
"- CODE LIST H
Where ACtFilty Took Place
CODE
0 Church*, Synagogue
1 .. School, collage, residential school, *Ataini001 center
2 .... Federal, state, county or municipal government facility
3 Cultural facility (nat.-government. non-proht)
Vokintary association facilit
Commerclatfacifity (including hotels)
6 Broadcasting facility
Labor union Utility
8 Place of bossiness
Private home
10 En rout*
11 . Other

Respondent's Name
Reporting Week thruMo. Day Yr. f go. Day Yr.
BSCP Form 3IDSN
CNSO
RP
WT
Activity Number: 2. Number of Learners Present:(From Column 1 of Fortn 2) (From Column 5 of Form 2)
Indicate whether this number is an:actual or estimated amount
C iter below the normal learner fee (tuition) for this activity even though some learners be exempt fromthe fee and ir.dicate the approximate unit to which the fee applies. If there is no fee, please indicate this.
Normal StudentTee: S
Unit: (check one)per semester credit hour
per quarter credit hourper each 60 minute clock hourper each 50 minute clock hourper meeting (of nr, uniform length)access fee (for multiple meetings of no uniform length)
_other (please describe)
None
c
[4. Of the total number of learners present (entered in item two above} enter ttle number which belongs in eachof the following categories In the appropriate space below. (Where large numbers of learners were presen', enteryour best estimate.) The totals on lines A, B, C, and D should be the same as the number given in Item 2 above.
LEARNEP CHARAC7ERISTIOS
Sex Male Female
RacialGroup
4
AmericanIndian
ENTER NUMBER OF LEARNERSIN EACH CATEGORY
American Black l Spanish
Oriental American Surnamed
Age ,Under 17 17 24 25 34 35 44
Caucasian Other
45 55 6465 andover
2 25
.
Prior Yearsof School
Completed
None K 7
,9 11 12
,
13 14 15 16 over 15
Who participated in planninc the mitructional activity?
1. The instructor: primarily
2. The participant's, primarily
3. 1 sponsoring institvu.ds), primarily
a combination of 1 and 2
a combination of 2 and 3
a combination of 1 and 3
a combination o 1, 2 and 3
276

APPENDIX D
MATERIALS USIA) IN F °LLCM -UP WITH NON-RES PONDE NTS
226
277
a

ADULT EDUCATION I SCHOOL OF EDUCATION
227
SYRACUSE UNIVERSITY
CRAWFORD CONTINUING EDUCATION CENTER
in RONNY LANZ 1 SYRACUSZ, NZW YORK IMOTILIIIPZONZ HA I 711-11441 I EITINSION $111
The personls) to whom the enclosed memorandum(a) is(are) addressed has(have)not returned Forms 2 and 3 of the study of post-secondary continuingeducation. These data are extremely important since the conclusions of thestudy will be derived from them.
After discussing the best way to encourage a response, it was fe't that anote from you would prove most successful. We have taken the` tberty ofenclosing the memo(s) for you to send, in order to place as little demandon your time as possible. Please feel free to rewrite the memo as you seefit.
We would tie most grateful if you would date and sign the memo(s) and seethat the person(s) concerned'is(ane) notified as soon as possible.
I cannot emphasize enough the importance of receiving these data. Yourefforts are most appreciated.
se,
0
HGC:dErfclosure(s)
Y
Sincerely,
Harlan CopelandAssociate Professor
278

228
MEMORANDUM
t
To: Date:
Subject: Study of Post-Secondary Continuing Education
Dr. Harlan Copeland, Project Director for the Study of Post-Secondary Continuing Education, has asked me to check if you receivedthe forms for reporting your instructional activity for a one-weekperiod. The reporting forms were distributed approximately two weeksago. As of today, your response has not been received.
I would like to Pnrniinsno yew- to return the inforrtion requestedsince ylur response represents approximately 125 college and universitypersonnel cpund the state. furthermore, the study has the approval ofthe chief executive officer of our institution.
'Please contact me or a member of the .,Syracuse Project Staff directlyif you have any (Jestions or-need additional forms: If your repl isalready in the mail, please disregard this memo.
QM behalf of the Syracuse University Project Staff and myself,thank you for your cooperat4- .
279
Sincerely yours,
O
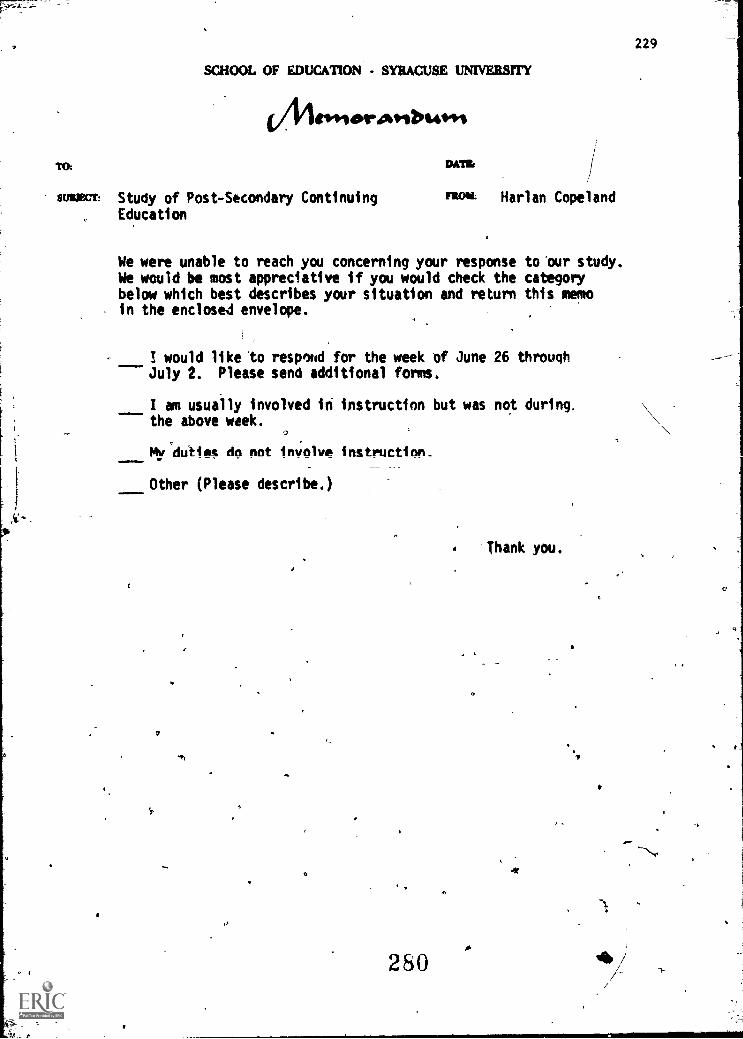
SCHOOL OF EDUCATION - SYRACUSE UNIVERSITY
0404101`0,1b14**1
'TO: DATIL
SUMECT! Study of Post-Secondary Continuing MMAId; Harlan Copeland
Education
We were unable to reach you concerning your response to our study.We would be most appreciative if you would check the categorybelow which best describes your situation and return this memoin the enclosed envelope.
I would like to respond for the week of June 26 throughJuly 2. Please send additional forms.
I am usually involved in instruction but was not during.the above week.
=11111111
hly:du+ios do not involve instruction_
Other (Please describe.)
7
O
280
Thank you.
229

4.
APPENDIX E
NUMBER OF RESPONSES TO THE INSTRUCTIONALACTIVITY SURVEY
281"230

TABLE 66
. 211
_NUMBER OF RESPONSES TO THE INSTRUCTIONAL ACTIVITY SURVEY
ft j. II g M .1-....-.. a
Week! Gross No. not Numberit No. Declj.ned2 No. o1 NO . of *Non-
No, Mailing Reached lte+s_____pondd Respondents Re, sE)9ds4
_ <4
6 20 3 13 '4 .
1 14 1 10 . 3,..
4 14 2 12..
0, .
...
5 17 4 12 , ,-4, I
2 16 c 9 ' 2'3 12 i 4 5 .-
2 19 11 5
1 17 2 10. ;., e
J.4 10 1 5 lir 4
-,
0 24 3 18- ' 3
3 14 1, al .2
1' Ili .0 1 8
v 3 /t4 0 9 51 14 r 1 8 5 iV - 14
_...., ik f
1V f . i1,11i,
Z.. ;15 .2 7 1 6
-, ; 2 17 1 7 9
-,' 2 i r6 11 - 2a 1 ' 16' - ' -+ 0 '41 -.4 5
2i
12 0 ai,-.-
9 '43 :
0 .-9 \ 0 '4,.4
76... i,
r1 127 2 17 8
0 ¶23 Q ,, 4-, 13 t 103 ;16 1 ; 1.1 4,..
2 '29 0, 19 10.
,19 1-". I, 9 -1
9
2 .. 112 1 , . 62 113 1 5
1- .3 22 3 ` *9 '-
/ 10
3- !154?-
4 . 9
5 i122 , 3 6- i
-13
1 117 ;. 4t, ,8 ' 8
3 16 1-- 8 7
0 15 ' 3 I C
1 17 0 0L 8 I 9-'
0
.../ 2 5 10
0'
- 9 10
2 9 .3 15 11
2. 7
2 1:8i **0 2 6
2 6 62 8 8
2 6 53 16 5.
0 7 8
1 262 15
3 18
4 22
5 18
6 15
7 21
8 18
9 12
10 2411 17
12 19
13 17
14 15
15a
16 17
, 17 1918 18'
19 17
20 14
21 9
22 2823 2324 1925 3126 2527 14
28 15,
29 25
30 18
31 2732 18
33 1934* 15
35 18
36 31
37 19
38 -19
39 10
40 15
4L . 21- 3
42 15 2
43 26 2
44 i7. 2
.
2/

232
66*Continuat ; on
W etc Gross No. not Number' No. Declined2 go. of )1o. of Non-
No Mai 1 i n Reached Reached to Res ond Respondentsr%Aesi_ondents
r
45
46
11
14
47. 1848 24
-49 19
--50-: 2 7
51 2J
5'4 11
3 8
2 12
4 14
7 17
3 16
2 25
0 201 10
0 ,k 5 - 3
1 7 4
0 5 9
3 9 5
1 5 10
2' 11 12
3 8 9
Hi
I
4 5
Totals 977 113 864 80 461 323
lInc tunes rsons in the sample who were deceased, had left theUnivers i e'y".; we te' sabbatic leave, and whose letters were returned by thepost office.
2lncludes persons in the sample who were reached and returned question-,inelicating they were too busy or refused to participate in tlr. study
for various reasons.
283,
t

0
APPENDIX F
PROCEDURES FOR ANALYZING THE DATA
233
,284

.d
234
PROCEDURES FOR ANALYZING THE DATA
The total facilty-staff population was partitioned into 28 paper zones
(call them zone 1, zone 2, . . ., zone 28) of 200 clusters each. For each
zone i (i=1, 2, ..., 28) two samples were chosen. If we use the subscripts
1 and 2 for the Lwo samples in zone i, then the results may be summarized as
Xii, X12, for the two X-populations (e.g., the X-populations might
be the number of students taught in a non-degree credit program),
;
Yi2, for the two Y-populations (e.g., the Y-populations might
be the number of faculty and staff who taught in a nonrdegree credit
program).
Usually we need estimates:
soA: the total X-population in the entire set of institutions
B: the total Y-pcpulation in the entire set of institutions
0: the ratio A/B
For example, A might be the total number of students who were taught
in non-degree credit programs during the sampling period-byfaculty-and-staff-,
at degree-granting institutions, while b is the total number of fa -culty -and
staff who taught in a non-degree credit program. The symbol 0 denotes the
ratio A/B, the average number of students per teacher over this time interval.
The sample provides estimates of the results that would have been
obtained from a complete census of all faculty and staff, with the same
questionnaire as was used in the sample, during the same period of time. For
an estimate of the ratio 0 we may take
f=X/Y
285
a

235
in which X is the total X-population in the entire sample, both 1st and 2nd
samples combined; Y has a similar definition for the total Y-population in
them sample.
To obtain estimates of a total population (e.g., A above) it was
/necessary to calculate the weights corresponding to each response in the
sample. Since the estimates were to be for a year, each respondent's (one
week) description of activities was multiplied by fifty-two, wi,tn some
excepti.Ins: for those who reported more than one week's activities the
quantities were weighted correspondingly less. For example, if a person
reported two weeks, his results were multiplied by 52 2 = 26 to get the
corresponding estimate of a full year's activities for him.
Next, it was necessary to determine how many real faculty members
each respondent "stood for." This was done by dividing the estimated total
number of faculty and staff in New York State (100,000) by the number of
(375). Thus, each resporeent stood for 100,000 f 375 = 266.67
respondents. Multiplying this by 52 (for 52 weeks) gives 13866:67.man weeks
per year which each sample respondent stood f
The survey was-originally designet, so as to allow for a fairly exact0
estimate of the potential variance in the estimates from the true values0
However, a number of factors caused the ..;ize of the sample of activities to
_ be_much. smaller than anticipated, and thus rendered such an analysis of vari-
ance unreasonable. These. factors are discussed elsewhere in the report, but
can be summarized here
1The experimedtal design which permits this analysis is based upon
procedure described by.W. Edward Deming in On Simplifications of SamplingDesign through Replication with Equal Probabilities and Without Stagei,"The American Statistical Association Journal, (March, 1956).
286
- Au
.
U.
Of the original sample -f 867, only 375 (43%) gave 461 valid re-
sponses. Of these 375 Individuals, only 105 (28% of the respondents; 127or
the original-sample) reported any instructional activities for the assigned
weeks. It should be noted, however, that the reporting periods included
holidays and vacation periods and the sample included administrators and non-
teaching staff.
In all, 668 valid instructional activities were reported, and of,
these some were not valid for certain categories of information primarily
because of missing data.1 Considering the fact tht in some cases the set of
activities was divided into as many as 216 distinct categories, it is obviouso
that the intended analysis of variance would not have lent any useful in-,
formation to the results of Ole study. u
mw111,...
r
lThis accounts for the fact that some of the grand totals in differ-
ent tables differ-somewhat. Forthe objective vs. subject-matter tables, for
instance, only 631 of the,668 reported activities were valid.
287 v

APPENDIX G
DEMOGRAPHIC CHARACTERISTICS qp. PARTICIPANTS
IN CATEGORY II AND CATEGORY III
INSTRUCTIONAL ACTIVITIES
- -
N
t 8

238
TABLE 67O
DEMOGRAPHIC CHARACTERISTICS OF PARTICIPANTSIN CATEGORY II INSTRUCTIONAL ACTIVITIES
(in percentages)
Sex
.
Male Female
,
-------A
65 and
over
_52.9 47.1
Racial
Group
Amerman
Indite 1
American
Oriental
Black
American
Spenmh
Surnamed Caucasian Other
0 . 0 1 . 8 5.3 - 2.5 90.1 0.4
- Age
C -
Under 17 17 24 25 14 -35 - 44 45 -- 54 f 55 64
1.8 12.7' 47.0 23.0 0.6 4.6 0.3
Prior Years,. *
of School
CompleUWa,None K 7 8 9 11 12 13 '14 15 16 OM l6 =
0 . 0 0 . 0 0.4 0.5 t6---.-0--- -9.8- 20.1 534-.
0
t
2 9

TABLE 68
DEMOGRAPHIC CHARACTERISTICS OF PARTICIPANTSIN CATEGORY III INSTRUCTIONAL ACTIVITIES
, (in percentages)
O
Sex
_ __
f44 le Female
.
45.4 54.6
Racial
Group
B
AmericanIndian
AmericanOriental
Black
American
Spanish
Surnamed I Caucasian Other
0.19 1.77 4.96 2.07 90.65 0.35
Age Under 17 17 24 25 34 33 44 45 54 55 6465 andover.
1.16 49.60 27.12 13.26 6.05 2.64 0.16
Prior Yearsof School
Completed
None K -- 7
0.38
i80.22
9 11
0.55
12
25.04
13 -- 14
31.75
.15 16
12.38
over 16
29.680.0

SELECTED BIBLIOGRAPHY
PAUEC-NUEA Committee on Data and Definitions. Program and Registration,
1971-72. Norman, Okla. and Washington, D.C.: The Association ofUniversity Evening Colleges and The Nationa' University Extension.Association, n.d.
Coolican, Patricia Mary. "The Learning Style of Mothers of Young Children."Ph.D. dissertation, Syracuse University; 1973.
Deming, W. Edward. "On Simplifications of Sampling Design Through Replicationwith Equal Probabilities and Without Stages." The American StatistkicalAssociation Journal,(March, 1956). 1F
Gould, Samuel B., and Cross, K. Patricia, eds. Explorations in Non*TraditionalStudy. Sin Frantisco, Calif.: Jossey-Bass, Inc., 1972.
Hays, William L. Statistics for the Social Sciences, 2d ed. New York: Holt,Rinehart and Winston, Inc., 1973.
Johnstone, John W. C., and Rivera, Ramon J. Vc1unteers for Learning.Chicago: Aldine Publishing Company, 1965.
Sandow, Stuart A. Educational Policy Formulation: Planning With the FocusDelphi._ and the Cross-Purpose Matrix. Syracuse, New York: Educa-tional Policy Research Center,Syri.:use.jniversity Research
Corporation, 1972.
. "The Constraints of Language on Our Views of the Future," In ThePotential of Educational Futures. Edited by Michael Marien andWarren L. Ziegler. Worthington, Ohio: Charles A. Jones PublishingCo., 1972.
Tough, Allen M. The Adult's Learning Projects. Toronto, Ontario: TheOntario'Institute for Studies in Education, 1971.
U. Bureau of the Census. Census of Population: 1970. General Social andEconomics CharacteristieS: ,Final Report PC (1)-C34 New York.WaShington,,D. C.: Government Printing Office, 1972.
/U.S. Department of Health,' Education, and Welfare. Higher Education General
Information Survey: Adult/Conttinuing Education ,Activities, inInstitutions ofvlii her Educat on. OE Form 2300-8. Washington, D C.:,Government Printing Office, 1
Williams, 1obert E. "A an to Provide L rship for the Full Developmentof Post-Seci...idary Continuing Education in New York State." Bureau oaf
Special College Programs, New York State Education Department, Albany,,
291