DOCUMENT RESUME TITLP Reading Progress: A Bi-Racial ...
24
ED 039 878 AUTHOR TITLP PUB DAT'? NOTE EDRS PRICE DESCRIPTORS IDENTIFIERS ABSTRACT DOCUMENT RESUME JC 700 158 Anderson, Clarence A.: And Others Reading Progress: A Bi-Racial Comparison A Study of the Reading Achievement of Black and White Students at Flint Community Junior College. May 70 23p. EDRS Price MF-$0.25 HC-$1.25 Comparative Analysis, *Comparative Statistics, Institutional Research, *Junior Colleges, *Program Evaluation, Reading Achievement, *Reading Improvement, Reading Instruction, Reading Tests, *Remedial Reading Programs, Statistical Studies *Michigan This study reports the impact of the Flint Community Junior College (Michigan) reading improvement program on 150 participating students in terms of general group and racial sub-group (black and white) performance. After the groups were compared according to race and ability for data-collecting purposes, pre- and post-test measurements were taken of reading vocabulary, reading comprehension, and speed of reading comprehension. Different forms of the Cooperative English Test--College Level were used for pre- and post-testing, and analysis of variance was used to identify statistical differences. Results showed significant improvements made by the group as a whole in each area. In addition, no significant statistical differences were noted in gains made by either sub-group in any area. Finally, 55 per cent of the black students and 72 per cent of the white students successfully achieved the 25th percentile rank in comprehension and speed (considered minimum for college-level reading). (JO) I
Transcript of DOCUMENT RESUME TITLP Reading Progress: A Bi-Racial ...

ED 039 878
AUTHORTITLP
PUB DAT'?
NOTE
EDRS PRICEDESCRIPTORS
IDENTIFIERS
ABSTRACT
DOCUMENT RESUME
JC 700 158
Anderson, Clarence A.: And OthersReading Progress: A Bi-Racial Comparison A Study ofthe Reading Achievement of Black and White Studentsat Flint Community Junior College.May 7023p.
EDRS Price MF-$0.25 HC-$1.25Comparative Analysis, *Comparative Statistics,Institutional Research, *Junior Colleges, *ProgramEvaluation, Reading Achievement, *ReadingImprovement, Reading Instruction, Reading Tests,*Remedial Reading Programs, Statistical Studies*Michigan
This study reports the impact of the Flint CommunityJunior College (Michigan) reading improvement program on 150participating students in terms of general group and racial sub-group(black and white) performance. After the groups were comparedaccording to race and ability for data-collecting purposes, pre- andpost-test measurements were taken of reading vocabulary, readingcomprehension, and speed of reading comprehension. Different forms ofthe Cooperative English Test--College Level were used for pre- andpost-testing, and analysis of variance was used to identifystatistical differences. Results showed significant improvements madeby the group as a whole in each area. In addition, no significantstatistical differences were noted in gains made by either sub-groupin any area. Finally, 55 per cent of the black students and 72 percent of the white students successfully achieved the 25th percentilerank in comprehension and speed (considered minimum for college-levelreading). (JO)
I

U.S. WARDER Of HEALTH, INICATION & MARE
INCE Of MCKIM
PIN DOCUMENT HAS EN PIRODUCHI EXACTLY id RECEIVE. HON TIE
PEEN OR 016ANHATION 01116INATIN6 IT. POINTS Of VIEW ON OM'S
STATED DO !LOT NECESSARILY IENII3IT OffiCIAL Cilia Of EDUCATION
POSITION OR POLICY.
READING PROGRESS: A BI-RACIAL COMPARISOli
A STUD' OF THE READING ACHIEVEMENT OF BLACK AND WHITESTUDENTS AT FLINT COMMUNITY JUNIOR COLLEGE
BY
Clarence A. AndersonDirector of Reading Services
Joseph SlobedaDirector of the Computer Center
Dr. Quarles R. HarperInstructor in Psychology
FLINT COMMUNITY JUNIOR COLLMEFLT NT, MICHIGAN
May 1970
This Research Study has been filed with the Clearinghouse for Junior CollegeInformation, The University Library, University of California, Los Angeles.
UNIVERSITY OF CALIF
LOS ANGELES
JUN 2 9 1970
CLEARINGHOUSE FORJUNIOR COLLEGE
INFORMATION!

If all college student:- grew up in home and school environments favorable toreading development, few would have to be referred to special reading classes andclinics. Every individual could be expected to progress at his own rate of growthin an environment providing affection, security, adequate physical and medicalcare, experiences appropriate to the individual's stage of development, suitablereading materials, and sound practice and instruction in reading throughout elementaryschool and high school. Be would be stimulated by frequent success; he would experi-ence a happy minimum of failure and frustration. Thus he would be able to attain thebest reading development for him, and his reading, in turn, would contribute to hisall-round development.
Actually, however, conditions are frequently unfavorable. Classes are large;books, pamph]ets, and magazines are inadequate; the curriculum is dull and drab,often remote from the student's daily life/ and not adapted to individual needs andinterests; and teaches have neither the time nor the knowledge and skill necessaryto help the seriously retarded readers. Consequently, a great number of studentsnow in college fall short of the reading proficiency of which they are capable. Manyare seriously handicapped in reading. This catalyzes, if not assures, academic fail-ure.
Fortunately, something can be done to improve reading skills. Students whosense their handtsap can voluntarily avail themselves of the resources of a collegereading service. Students unaware of their problem can be referred to such a serviceby a college teacher or counselor. Regardless of the mode of entry, a college readingservice, within its resources, stands ready to assist students with reading problems.
Tha reading service developed at Flint Community Junior College is centered ina reading center that caters to students at all levels of reading envelopment. Abatingthe reading problem at Mu through its reading center is a complete departure fromtraditionally recognized ways of handling incompetent readers at the college level.The approach is essentially that of the "individualizing of instruction," and largelyincorporates programmed and semi-programmed materials geared to individual treatment.
Upon admission to the FCJC Reading Center, an analysis is made of each student'sreading behavior. Instruction is then individualized to meet the specific needs ofeach student. The programmed nature of the instruction makes it possible for eachstudent to start on a level where he can aztieve success and confidently progress athis own learning and working rate. F4lly aware of his progress at all times, thestudent's progress, in turn, is monitored by the reading counselor, who when necessary,modifies the selection and sequence of material to help the student achieve optimumSuccess.
The FCJC reading program has received national recognition. The success of theprogram has been supported by statistical evidence and subjective appraisal. Testresults reveal that the great majority of the students have been assisted in theability to read, and student reaction, by way of subjective measurement, has correlatedwith objective data.
Despite ongoing evidence that the FCJC reading improvement service is successful,no investigation has been made of the degree of the impact of this program upon stu-dents of different ethnic groups. Studies investigating the relationship of readingprograms to race are occasionally found in elementary and secondary education, butrarely in higher education. Because of the large numbers of students fro.1 the major

racial groups (Caucasian and Negro) at FCJC, such a study should prove to be ofvalue to the college rep -ding service and the faculty in general.
OBJECTIVE OF THE STUDY
This study was designed to 1) determine the effectiveness of the FZUC: rasdingprogram upon stulents in general, 2) ascertain the effectiveness of the reading programupon black and white groups in particular, and 3) arrive at conclusic,e2:4 vitich canserve as a basis for additional improvements to the FCJC reading service.
HYPOME3E3 INVESTIG:.TED
In this study, eight hyc,otheses were tested:
1. No gains in readinr; vocabulary will be made by any of the students.
2. There will be no difference in the gains in vocrtbulary made by blackstudents and white st:dents.
3. No gains in reading comprehension will be made by any of the students.
4. There TAU be no difference in the gains in comprehension made by blackstudents and white stIllents.
5. No gains in speed of reading comprehension will be made by any of thestudents.
6. There will be no -iifference in the gains in speed of reading comprehen-sion made by blac% sthdents and white students.
7. No students initially below the minimum cutting rank (25th percentile incomprehension and sr:eed of comprehension) will achieve the minimum cuttingrank in order to acquire the "S" grade in Reading (English 020).
8. There will be no difference in the percentage of white and black studentsinitially below who achieve the minimum cutting rank in comprehensionand speed of comprehension for the "8" grade in heeling.
PROCEDURE AND METHODS
This study, conducted during the first semester of the 1969-70 school year,involved 150 students, 75 black and 75 white, who were enrolled in a one semester,3 credit course in reading improvement. All were subjected to an identical readingenvironment, involving diverse materials and levels of materials, based on studentneeds within the individualized approach. The 150 students were among a largernumber who had completed the course. An attempt was made to :awe the 75 studentsin each ethnic group as comp= arable as possible in terms of pre-test reading skillvrJriables. Different forms of the Cooperative Reading Test, College Level, wereused for Pre and Post-testing.
In statistical design, analysis of varilnce was used. The design was a two-fac-tor experiment with repeated measures of one factor. The groups were composed ofdifferent racial groups or different ability groups and the repeated measurementswere on vocabulary, comprehension, and speed.

SUrtMART CF RZADItC COURSE
Compariron of Vocabulary Pre and Post Test
75 White Students.
RESULTS*
Scores of 75 Black and
TABLE I
ANALYSIS OF VARIANCE OF VOCABULARY FOR 150 STUMM
Source ofVariation
Students
Subject©Within Groups
Tests
StudentsTeats
SS df
610.50 1
15655.00 148
1835.25 1
71.10
P
610.50
105.77 5.78 F = 3.92.95 (1,120)
1835.25 81.30 F = 6.85.99 (1,120)
1 71.10 3.15 F = 2.75.90 (1,120)
Within Groupe 3340.70 148 22.57
Interpretations All three F values exceed the table values for
significance.
Students - The comparison of black and white students has an F
value of 5.78 which exceeds the 3.92 (1,120) required at the .95
level. This significance indicates the groups compared are not
the same and precludes any interpretation of interaction of stu-
dents and tests.
*The numerous tables appearing in this report are rot wimberedsequentially throughout due to changes in the final organizational
presentation of the study.

TABIZ II
?ZAN VOCABULARY SCCRES FCR 150 STUDENTS
Pre-Test Post-Test Totals
131.ficks* 142.85 = 146.82 S.D. = 144.84 S.D. =
Whites* 144.73 S.D. = 150.65 S.D. = 147069 S.D. =
Totals 143.79 S .D . = 148.74 S.D. = 146.26 S.D. =
1*) 75 Students
.Le.a uS Ccmparison of the pro. and post test scores has an F valuep
of 81.30 which exceeds the 6.85 (1,120) required at the .99 level.
ihis significance indicates the post-test Performance is not the
same as the pre-test performance. Inspection of the means in
Table II indicates the pest-test performance is better than the
pre-test performance for both groups,
Inter-action - Any comparison of the inter-action of the students
is precluded by the significant difference between groups discussedunder students, Table I.

Comparison of Comprehension Pre and Post Test Scores of 150 Students
TABLE V
ANALYSIS OF VARIANCE OF CONPREHENSION
FOR 150 STUDENTS .
Source of SS df MS
Variation
Students 727.12 1 727.12 9.32 F= 6.85.99 (1,120)
Subjects Within 11553.50
Groups
148 78.064
Tests 2459.625 1 2459.625 71.743 F= 6.85.99 (1,120)
Student X 30.075 1 30.075 .877
Tests
Within Groups 5474.00 148 34.284
Interpretation: The F values are significant for students and tests at
the .99 level. The F values for interaction are not significant.
Students - The comparison of black and white students has an F value of
9.32 which exceeds the 6.85 (1,120) required at the .99 level. This
significance indicates the groups are not the same.and can not be compared.
Tests - Comparison of tests has an F value of 71.74 which exceeds the 6.85
770) reouired at the .99 level. Table VI records the mean equated score
of the two groups for the Pre and Post test scores. Inspection indicates
that the Post-test scores are higher than the Pre-test scores.
TABLE VI
MEAN COMPREHENSION SCORES FOR 150 STUDENTS
Group Pte-Test Post-Test Totals
Blacks* 143.13 S.D. = 148.22 S.D. = 145.68 S.D. =
Whites* 145.61 S.D. - 151.97 S.D. = 148.79 SD, =
Totals 144.37 S.D. = 150.10 S.D. = 147.23 S.D. =
(*) 75 Students
Inspection of these means indicates the mean totals of the Post-Tests are
above the mean totals of the Pte-Tests.

Comparison of Speed Pre and Post Test Scores of 75 Black and 75 WhiteStudents.
TABIE IL
ANALYSIS OP VARIAKE OF SPEED FOR 150 STUDENTS
Source of SS df MSVariation
Student 376.50 1 376.50 6.23 F = 3.92.95 (1,120)
Subjects Within 8962.50 148 60.55Groups
Tests 4531.87 1 4531.87 177.51 F = 6.85.99 (1,120)
Students 1 41.70 1 41.70 1.63Tests
Within Groups 3778.40 148 25.53
Interpretation: The F value for inter-action is not great enough toexceed the .90 level, indicating any change is uniforn for thegroups between Ire and Post tasting. The F values for students andtests both exceed the table values for significance.
Students -The comparison of the groups of students has an F valueof 6.23 which exceeds the 3.92 (1,120) required at the .95 level.This significance indicates the groups compared are not the same.Table I records the mean equated score of the two groups for thePre and Post test scores.
TABLE
MEAN SPEED SCORES FOR 150 STUDENTS
Pre-Test Post-Test Total
Blacks * 138.88 S.D. = 145.90 S.D. = 142.39 S.D. =
Whites* 140e37 S.D. = 148.89 S.D. = 1/4.63 S.D. =
Totals 62 S 1 7. S.D. = 1 1 S.D. =
(*) 75 Students
Inspection of these means indicates the differences beturson thegroups exist in the Pre test and well as the Post test.
Tests - The comparison of the Pre and Post test scores has an F valueof 177.51 which exceeds the 6.85 (1,120) required at the .99 level.This significance indicates the post-test performance is not the sameas the pre-test performance. Inspection of the means in Tableindicates the post-test performance exceeds the pre-test performancefor both groups.

The initial comparisons of 75 black and 75 white students in readingimprovement showed a significant difference at the .95 level between the
black and white groups for vocabulary, comprehension, and speed. This
finding meant that any pre-Atest and post-test changes would be contaminated
by group differences. To surmount this limitation, the two groups wereseparated into the upper, middle and lower thirds on the basis of comprehension
pre-test scores.
Analysis of the groups of middle and lower third also shoveldifferences which were significant at the .95 level for vocabulary, comprehension
and speed. Due to the contpminAting influence of group differences, no further
analysis was made of the midet.le and lower groups.
Analysis of variance indicated that the upper third groups did not
differ significantly and detailed interpretations are presented below.
Comparison of Vocabulary Pre and Post Test Scores of 25 Black and 25 White
Students (Upper Third)
TA13IE I
ANALYSIS OF VA.RIAIWN OF VOCABULARY FOR 50 STUDENTS
Source of SS df 16 F PVariation
Students 2.25 1 2.25 .01
Subjects Within 7510.90 48 156.47Groups
Tests 357.25 1 357.25 17.2 F = 7.31.99 (1,40)
Students ii. 5.27 1 5.27 .25
Tests
Within Groups 997.00 48 20.77.a..Interpretation: The F values for students and inter-action are notsignificant indicating the groups are not different and that thegroups do not change at a different rate between pre-test and post-test.
uomparison of the pre-test and post-test scores has an F value of17.2 which exceeds the 7.31 (1,40) required at the .99 level. This
significance indicates tb3 post-test performance is not the same as the

pre-test performance. Inspection of the means in Table II indicatesthe post-test performance exceeds that of the pre-test performance forboth grows.
TAi3lE II
SuCR;s3 Og VOCAbULARY FOR 50 STUDENTS
Group PreTest Post -Test Totals
black* 147.48 S.D. = 150.80 S.D. = 149.14 S.D. =22.4412,21=
Totals(*) 25 Students
Comparison of comprehension Pre and Post Test Scores of 50 Students(Upper Third)
TAbIE III
ANALYSIS OF VARIAN LE OF COMPPEHESSION
FUR 50 STUDENTS
Source of SS df ItS F PVariation
Students 92.25 1 92,25 2.78
Subjects WithinGroups 1601.90 48 33.37
Tests 14.50 1 14.50 .76
Students .1.Tests .50 1 .50 .02
Within Groups 908.90 48 18.93Interpretation: None of the F values exceed the .90 level forsignificance which indicates that the groups are not differentnor are there differences DetweAn the pre and post test scares.

Comparison of Speed Pre and Post Test Scores of 25 $lack and 25White Students (Upper Third)
TABIE IV
ANALYSIS OF VARIANCE Ce Sala) at 50 SIMMS
Source ofVariation
SS
Students 37.25
Sunjects WithinGroups
Tests
at
37.25
2164.70 48 45.09 .83
846.67 1 846.87 30.47 F = 1.31.99 (1,40)
Students i .45 1 .45 .01TestsWithin Groups 1334.10 48 27.79
Interpretation: The F values for students and inter-action arenot significant, indicating the groups are not different and that thegroups do not change at a different rat.;e between pre-test and post-test. comparison of the pre-test and post-test scores has an Fvalue of 30.47 which exceeds the 7.31 (1,40) required at the .59level. This significance indicates the post-test performance isnot the same as the pre-test performance. Inspection of the meansin Table V indicates the post-test performance exceeds that ofthe pre-test performance for both groups.
TABIE V
MEAN SCORES OF SPEED FOR 50 STIMNTS
Group Pre-Test Post-Test/m11
TotalsBlack* 143.68 S .D . = 149.36 S.D. = 146.52 S.D. =White* 144.76 S .D . = 150.72 S .D . = 147.74 S .D . =Totals 144,22 S .D . = 150.02 S .D . = 147.13 S .D . =(*) 25 Students
Conclusions:
1. There are significant improvements in vocabulary due totraining. 9

2. There are significant improvement:, in speed of reading
due to training.
3. The two groups (black and white) do not differ significantly
in their rate of imnrovement. This evidence was ofparticular interest in this investigation since the initialcomparisons included groups which ware significantlydifferent and showod different rates of improvement.However, when controls were employed that -eliriinated thedifferences between the groups, no differences betweenthe groups in the rate of improvement vemfound forvocabulary, comprehension and speed.
4

ABILITY CCMPARBD WITH PROGRESS
In order to investigate the relationship between student's ability
and progress, the separation of students into groups of upper, middle and
lower thirds on the basis of pre-test comprehension WS used to compare
Pre and Post tests. The comparison was made between the upper and lower
third groups for black students as well as white students.
I. Vocabulary showed significant differences for
students and test., but not for inter-action.The lack of inter-action indicates that improvementin vocabulary is not related to the comprehension
ability of the student tested.
II. Comprehension was the basis for separating the
groups and appeared related to progress for both
black and white students.
TABLE I
ANALYSIS CF ViRIANGE OF COmPREHENSION
FM. 50 BIAGK Say EMS
Source of S.S MS
Variation
Students 4342.75
Subjects Within 2141.30Groups
Tests 470.87
Students 1. 349.72Tests
Within Groups 1707.80 48 35.57
df
1 4342.75 97.23 F = 7.31.99 (1,40)
48 44,61
1 470.87 13.23 F = 7.31
P
349.72 9.82
.99 (1,40)
F = 7.31.99 (1,40)

TAi3lE II
ANALYSIS OF VARIANZ CF CQ4PREIMGION
Fat 50 SITE STUDENTS
Source of SS df lis F PVariationStudents 2819.62 1 2819.62 95.72 F = 7.31
.99 (1,40)
Subjects Within 1/108.30 48 29.34:'croups
Tests 979.75 1 979.75 34.96 F = 7.31.99 (1,40)
Students IC 712.85 1 712.85 25.44 F zz 7.31Tests .99 (1,40)
Within Groups 1344.90 48 28.01
Interpretations All F values exceed 7.31 (1,40) required forsignificance at the .99 level.
Students - The initial 75 students were separated into thirdsand significant difference between the upuer and lover thirdconfirms the precision of the separation.
Tests - The significance of the F values indicates change andinspection of Tattles III and IV reveals that the post-test scoresare larger than the pre-test scores.
TABIE III
nAN SCORES OF COFTREHENSION FOR 50 BLACK STUDENTS
Croup Pre-Test Post-TestUpper* 151.'72Lowers 134.4)
17-25 StudentsTotals 1 26
S.D. =S .D . =
S D
152.32 3 .D . =142.88 S .D . =
Totals;52.02 S .D . =138.84 S.D. =
1 7.60 S.D. = 1 S .D . =

TABIE IV
Yx-,AN SCCEES CF CettPREFENSION Fat 50 STITrJENTS
Group
Upper*Lower*
Pre-Test Post-Test Totals
153.48
137.52
Totals 145.50
Ti) 25 Students
S.D. =S.D. =SS .D. =
154.40 S.D. =149.12 S.D. =151.76 S.D. =
153.94 S.D. =
143.32 S.D. =
148_263 S.D. =
Inter- action - The significance of the inter-action is that
the upper and lower groups are not elanging at the same rate.
Inspection of Tables III and IV reveals that the lover groups
improve a greater amount than the upper groups.
III. Speed showed significance for students and
test for all students but only the white group
shows significance for inter-action.
TABIE V
ANALYSIS CF VARIANCE OF ma FOR 50 BIAGI( STUDENPS
Source ofVariat;Ion
Students 1909.75 1 1909.75
Subjects Within 2106.60 48 43.88
Groups
Tests 1056.25 1 1056.25
SS df }IS
43.62 F = 7.31.99 (1,40)
37.13 F = 7.31
.99 (1,40)
Students Y 16.75 1 16.75 .58
Text
Within Groups 1365.40 48 28.44

TABLE VI
ANALYSIS OF VARLthtE CF SPEED FCR 50 WHITE STUDENTS
Source ofVariation
Students
aubjects WithinGroups
Tests
StudentsTests
lithin Groups
SS df MS
1211.00 1 1211.00 27.25 7 = 7.31
.99 (1,40)
2120.30 48 44.17
1866.25 1 1866.25 69.97 F = 7.31.99 (1,40)
179.60 1 179.60 6.73 F =4.08.95 (1,40)
1280,10 48 26.66Interpretr:tion: The F values for students and tests "zzeeed 7.31 (1,40)
required for significance at the .99 level for black and whitestudents. The white student F value for inter - actions exceeds 4.08
(1140) required for significance at the .95 level.
Students - The initial 75 students were separated into thirds andsignificant difference may be interpreted to reflect relationshipbetween comprehension and speed.
Tests - The significance of the F values indicates change andinspection of Tables VII and VIII reveals that the post-test scoresare larger than the pre-test scores.
TABLE VII
MEAN SCORES CF SPEED FOR 50 BLACK STUDENTS
GIcup Pre-Test Post-Test Totals
Upper* 143.68 S .D . = 149.36 S.D. = 146.52 S .D . =Lower* 124.12 S.D. = 141,44 S .D . = 137.78 S.D. =Totals 1 8 't S.D. = 1 S .D . = 1 1 S.D. =
25 Students
TABIb VIII
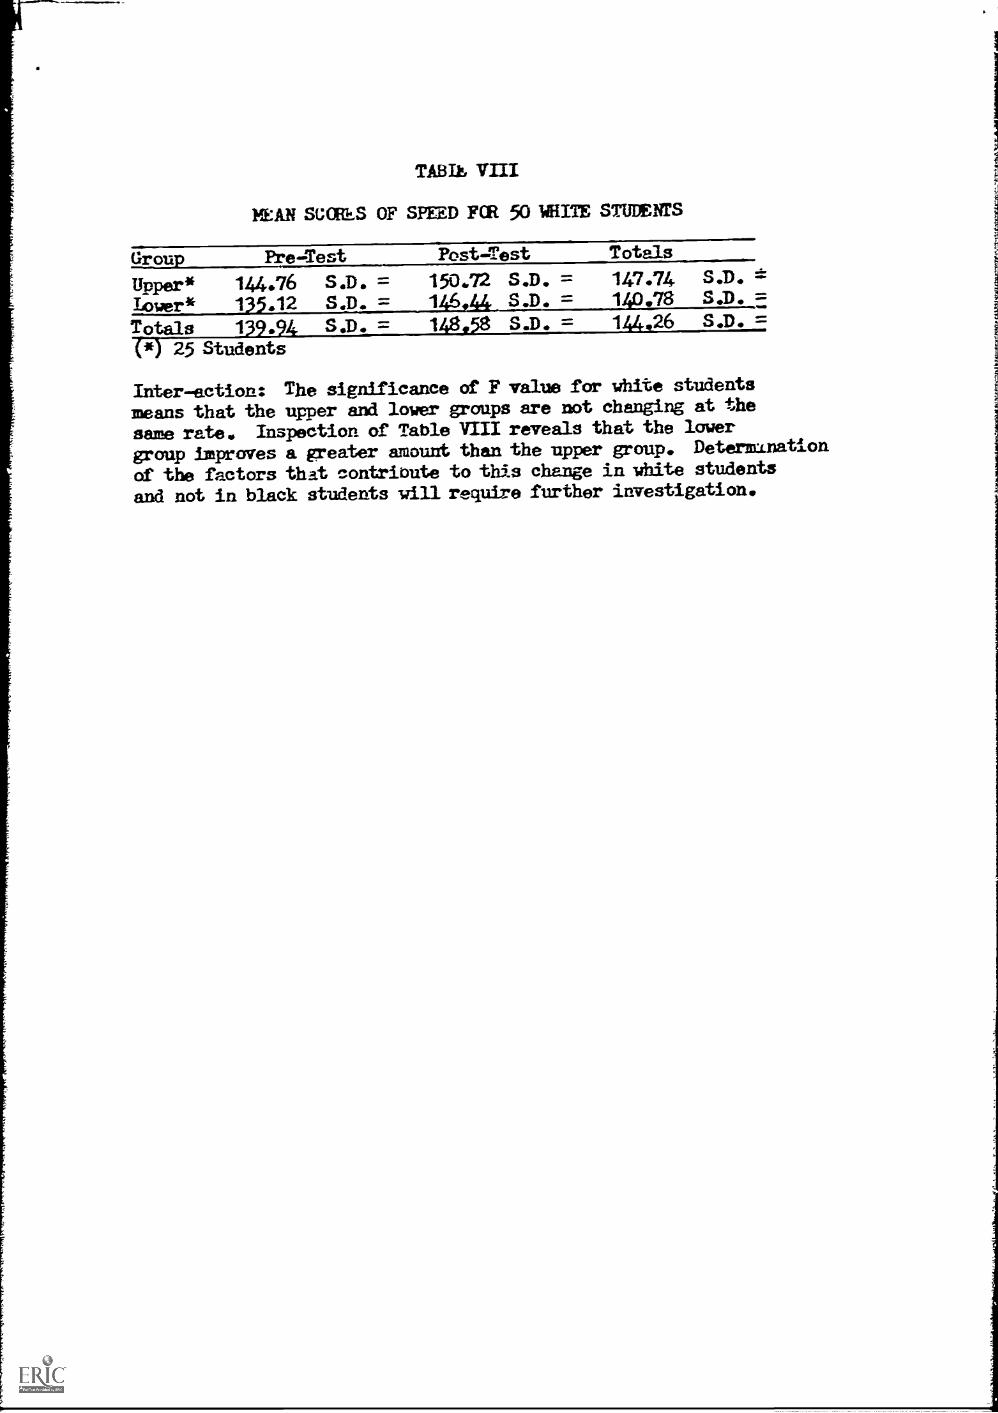
MEAN SCORES OF SPEED FCR 50 WRITE STUDENTS
Group Pre-Test Post-Test Totals
Upper* 144.76 S S.D. = 150.72 S .D. = 147.74 S.D.146±44 S.D. = 140.78 S.D.
Totals 139.94 S.D. = 148.58 S.D. = 144.26 S.D. =
(*) 25 Students
Inter-action: The significance of F value for white students
means that the upper and lover groups are not changing at the
same rate. Inspection of Table VIII reveals that the lower
group improves a greater amount than the upper group. Determination
of the factors that contribute to this change in white students
and not in black students will require further investigation,

PERFORMANCE VARIABILITY OF
R
1
fJ SITE STUDEVTS BY QUARTILE DEVIATION
VOCABULARY COMPREHENSION SPEED
Pre Post Pre Post Pi-e Post
16(43
irki 9
Qi
100I. =.11
33 23 43 11
27 11 31 9
12 7 14 4
41111
100
90
80
4o
27
11
The division of the white population into four equal parts (-lartiles)
demonstrates reading progress that (1) places the local pre-test -!istri;)ution
against the national test norms, and (2) provides a co,:parison of the post-test
achievellent with pre-test performance. The latter iniicat-)s that the post-test
distribution has moved significantly upward. The 25th percentile is the cuttinl
score for grading purposes.

PERFORAANCE VARIABILITY OF 75 BLACK STUDENTS BY QUARTILE DEVIATION
C
NTI
LE
VOCABULARY CCMPREHENSION
Pre Post Pre Post
SPEED
Pre Post
Ow. ..1.4
E 3
27 17
12 8
5 6
372411
11 276 19
3 9
The division of the black population into four elual parts (quartiles)demonstrates reading progress that (1) places the local ore-test distributionagainst the national test norms, and (2) provides a comparison of the post-testachievement with pre-test performance. The latter indicates that the post-testdistribution has moved markedly upward. The 25th percentile is the cuttingscore for grading purposes.

R
TI
READING PROGRESS OF 10 BEST BLACK STUDENTS
VOCABULARY
Pre
'00E"
PostCOMPREffENSION
Pre Post
100
90
80
70
50
40
30
20
10
0
SPED
Pre Post
Mean Percen- 7-19 12-29 3-13 16-58 2-11 21-43
tile Band
Percentile bands entail one standard error of measurement above an ear .edscore and one below it. When two comparative bands overlap, the difference is soheavily loaded with chance--accidental differences due to errors of meazdrement--that a real difference may not exist at all. When comparative bands do not over-lap, the odds are great that a real difference in perforzance exists. The :iffer-once in the bands of the 10 black students, particularly in comprehension and speed,can be interpreted as educationally significant in favor of genuine reading growth.

1'
isRC
NT1
L
READING PROGRESS OF 10 BS ST WHITE STUDENTS
VOCABULARY COMPREHENSION SPEED
Pre Post Pre Post Pre Post
100 10044100
90 _
I I,'
80 -
70 --
60-
50
C40'-C
30
F20 H-
C
10
0
80
70
50
40
30
20
10
0
Mean Percen- 4-13 18-40 3-11 21-64 312 24-49tile Band
The percentile band concept, involvin; the non-,overly: going of two comparativebands, indicates that a real difference exists in favor of genuine reading growthin the performance of the 10 best white students. This genuine growth is evidentin all three readine: skill areas.

THE FINDINGS
Following are the hypotheses and results of this study:
1. The first hypothesis, which stated that no gains in reading vocabularywill be made by any of the students, was rejected. Results showed there -
were significant improvements in vocabulary. For the 150 students as agroup, the difference between the pre and post-testing was significantat the .99 level (1 chance in 100 of an erroneous difference).
2. The second hypothesis, which stated that there will be no difference inthe gains in vocabulary made by black students and white students, requiredstratification of groups to complete the comparison of pre and post-testscores. Evidence showed the two groups were initially different. However,.segmentation of the black and white students into initial eauated groupsrevealed there was rho difference in the growth between the two races.
3. The third hypothesis, which stated that no gains in reading comprehensionwill be made by any of the students, was rejected. There was a significantimprovement in comprehension for the 150 students as a group. This improve-went was significant at the .99 level between the pre and post-tests,indicating but one chance in 100 of an erroneous difference.
4. The fourth hypothesis, which stated that there will be no difference in thegains in comprehension made by black and white students, was accepted. The
interaction between the 150 students (75 black and 75 white) was not statis-tically significant.
5. The fifth hypothesis, which stated that no gains in speed of reading compre-hension will be made by any of the students, was rejected. There were sig-nificant improvements in speed of understanding. For the 150 students as agroup, the difference between pre and post-testing was significant at the.99 level, indicating a small possibiility of error in the difference.
6. The sixth hypothesis, which stated that there will be no difference in thegains in speed of comprehension made by black students and white students,was accepted. Statf.stical evidence did not reject this hypothesis.
7. The seventh hypothesis, which stated that no student initially below theminimum cutting rank (25th percentile in comprehension and speed ofcomprehension) will achieve the minimum cutting rank in order to acquirethe "3" grade in Reading (English 020), was releska. Evidence showedthat at the beginning of the course for the 150 students, 68% were belowthe 25th percentile rank in comprehension and 80 were below in speed.At the end of the course, 36% were below this ranking in comprehensionand 38% were below in speed. The final grades assigned to students andsubmitted to the Registrar's Office were in accord with these statistics.63% of the students had now acquired the "S" grade.
8. The eighth hypothesis, which stated that there will be no difference inthe percentage of white and black students initially below who achievethe minimum cutting rank in comprehension and speed of comprehension forthe "S" grade in Reading, was redected. Of the 75 black students, 75% were

initially below the cutting score in comprehension, which reduced to 44%at coursees end; 92% were initially below in speed, which reduced to 46% at
course completion, For the 75 white students, 63% were initially below
the cutting score in comprehension, which reduced to 28% at course's end;
87% were initially below in speed, which reduced to 29% at course completion.
gnus, in terms of final grades based on ability to achieve the 25th percentile.
rank in comprehension and speed, 55p of the black students and 72p of the
white students acquired the "Sd grade.
CONCLUSIONS
The most iaportant finding of the study was the overall success of the FCJC
reading program. Computer assisted statistical analysis of the data made this con-
clusion readily available. The success of the program applied to both ethnic groups- -
black and white.
The 150 students as a group made significant progress in the three major readingskill areas investigated. _&wever, relative to comprehension, the lower one-third
blacks and the lower one-third whites made greater gains than the upper one-third
groups within respective ethnic groupihgs. The study did not establish a cause-effect
relationship for this finding. in the area of vocabulary, progress took place regard-
less of the comprehension level of the student. This finding was gratifying as colleges
generally have not been too successful in promoting vocabulary growth. Ths individual-
izing of the FCJC vocabulary program may have been the key factor here.
The comparing of students by ethnic groups was a complicated and challenging
process. as the 75 students within each group were not completely pre -test matched.
However, where controls were employed, equating black and wnite students statistically,
no differences were found between the races in the degree of improvement involving
vocabulary, comprehension, and speed.
The grading of students utilized the percentile rank concept, which is based ona stu-3ent's performance against that of students in the test norms group. (Previous
research at FCJC established the 25th percentile rank in comprehension and speed ofcomprehension, Cooperative Reading Test--College level, as the cutting score, below
which students have extreme difficulty in achieving success in college classes. The
25th percentile rank is comparable to high school reading ability and, in essence,
was determindd by faculty standards for academic success where textbooks are involved.)
The minimum, goal for students below this rank was to achieve reading progress thatwould attain this goal.within a one semester FCJC reading; program.
In achieving the minimum cutting rank for the "S" grade, approximately one-half
of the black students and three-fourths of the white students were successful. The0measurement of achievement and the assiz.nment of trades, was 1OO derived
completely possible inclusion of teacher bias. It was not within the
scope of this study to isolate the possible variables which contributed toward thegreater percentage of white students achieving higher and thus coquiring the "S" grade.
141alysis of variance, the major statistical technique, pointed out that many students
low in reading did make statistically significant gains in readine skills. However,
the gains for some were not adequate to achieve the gassing grade cutting point, (Grai
ing standards for reading, in reality, do not differ from faculty grading standards; if
below a designated score, failure is recorded.)
The study clearly indicated the need for additional attention to students relative

to cognitive and affective domains. Attitudes toward self and toward one's environ-
ment are imoortant factors in re dine achie.ement. The motivational factor alone
needed to be carefully researched. There was reason to believe that factors which
prevented black students from achieving higher were the same factors :4hich inhibited
white stu4ents. The study distinctly showed that ethnic /croup, taken independently,
cannot be identified as a "factor" in underachieving college reafliers.
The identification aLl treatment of the disadvantaged college reader, whether
black or white, cannot be conclusive unless affective measures represent a part of
the instructional scheme,