DOCUMENT RESUME National Education Association, … · 2013-11-08 · Subscription Rate: One-year...
77
ED 048 663 AUTHOR TITLE INSTITUTION REPORT NO PUB DATE NOTE AVAILABLE FROM EDRS PRICE DESCRIPTORS ABSTRACT DOCUMENT RESUME EA 003 402 Lee, Beatrice C., Ed. Rankings of the States, 1971. National Education Association, Washington, D.C., RR-1971-R1 71 76p. Publications Sales Section, National Education Association, 1201 Sixteenth Street, N.W., Washington, D.C. 20036 (Stock No. 435-25464, $1.50, quantity discounts) EDRS Price MF-$0.65 RC Not Available from EDRS. Academic Achievement, Average Daily Attendance, Average Daily Enrollment, *Census Figures, *Educational Finance, Educationally Disadvantaged, Family Income, Instructional Staff, Literacy, Population Trends, State Federal Aid, *State Surveys, *Statistical Data, Student Teacher Ratio, *Tables (Data), Tax Support, Teacher Salaries This report consists of tables that rank States according to 128 separate data items which provide information for understanding and evaluating various aspects of State school systems. Although the latest available figures are used, some are estimates and others are based on sampling studies. National totals are shown in most tables. Items covered in the tables are: population; enrollment and attendance; teachers; educational attainment; general financial resources; governmental revenue, expenditures, and debt; school revenue and expenditures; and miscellaneous items. An index is included. A related document is ED 041 384. (MLF)
Transcript of DOCUMENT RESUME National Education Association, … · 2013-11-08 · Subscription Rate: One-year...
ED 048 663
AUTHORTITLEINSTITUTIONREPORT NOPUB DATENOTEAVAILABLE FROM
EDRS PRICEDESCRIPTORS
ABSTRACT
DOCUMENT RESUME
EA 003 402
Lee, Beatrice C., Ed.Rankings of the States, 1971.National Education Association, Washington, D.C.,RR-1971-R17176p.Publications Sales Section, National EducationAssociation, 1201 Sixteenth Street, N.W.,Washington, D.C. 20036 (Stock No. 435-25464, $1.50,quantity discounts)
EDRS Price MF-$0.65 RC Not Available from EDRS.Academic Achievement, Average Daily Attendance,Average Daily Enrollment, *Census Figures,*Educational Finance, Educationally Disadvantaged,Family Income, Instructional Staff, Literacy,Population Trends, State Federal Aid, *StateSurveys, *Statistical Data, Student Teacher Ratio,*Tables (Data), Tax Support, Teacher Salaries
This report consists of tables that rank Statesaccording to 128 separate data items which provide information forunderstanding and evaluating various aspects of State school systems.Although the latest available figures are used, some are estimatesand others are based on sampling studies. National totals are shownin most tables. Items covered in the tables are: population;enrollment and attendance; teachers; educational attainment; generalfinancial resources; governmental revenue, expenditures, and debt;school revenue and expenditures; and miscellaneous items. An index isincluded. A related document is ED 041 384. (MLF)
kr.00cX)
OO-1-
LiU
U.S. DEPARTMENT OF HEALTH, EDUCATION 8 WELFARE
OFFICE OF EDUCATION
THIS DOCUMENT HAS BEEN REPRODUCED EXACTLY AS RECEIVED FROM THE
PERSON OR ORGANIZATION ORIGINATING IT. POINTS OF VIEW OR OPINIONS
STATED DO NOT NECESSARILY REPRESENT OFFICIAL OFFICE OF EDUCATION
POSITION OR PRICY.
RESEARCH REPORT 1971-R1
Rankings of theStates, 1971
Pfretseion to reproduce this copyrighted work has beengranted to the Educational Resources Information CenterIERIC) and to the organization operating under contractwith the Office of Education to reproduce documents in-cluded in the ERIC system by means of microfiche only,but this right is not conferred to any users of the micro-fiche received from the ERIC Document ReproductionService. Further reproduction of any part requires per-mission of the copyright owner.
CNI0 RESEARCH DIVISION - NATIONAL EDUCATION ASSOCIATIONdi
L_ '
riT4Copyright 0 1971 by the
National Education AssociationAll Rights Reserved PROCESS WITH MICROFICHE
AND PUBLISHER'S PRICES.
1 MICROFICHE REPRODUCTIONONLY.
NATIONAL EDUCATION ASSOCIATION
HELEN BAIN, PresidentSAM M. LAMBERT, Executive Secretary
GLEN ROBINSON, Assistant Executive Secretaryfor Research
RESEARCH DIVISION
GLEN ROBINSON, DirectorSIMEON P. TAYLOR III, Assistant DirectorWILLIAM S. GRAYBEAL, Assistant Director
ALTON B. SHERIDAN, Assistant DirectorFRIEDA S. SHAPIRO, Assistant DirectorJEAN M. FLANIGAN, Assistant DirectorGERTRUDE N. STIEBER, Senior Professional AssociateDONALD P. WALKER, Professional AssociateRICHARD E. SCOTT, Chief StatisticianVALDEANE RICE, Administrative AssociateELIZABETH C. MOFFATT, Senior Staff AssociateMARSHA A. REAM, Senior Staff AssociateKENNETH L. SANDVIG, Senior Staff AssociateJEANETTE G. VAUGHAN, Senior Staff AssociateANN T. McLAREN, Staff Associate
JEAN L. PROETSCH, Staff AssociateNINA C. SIMMONS, Staff Associate
ARTHURYNE J. TAYLOR, Staff AssociatePETER D. VEILLETTE, Staff Associate
ELIZABETH V. BRANT, Contract AnalystDOROTHY E. BURKE, Contract Analyst
DAVID S. CHESTER, Salary AnalystGLENDA N. GEORGE, Salary Analyst
YERCHANIG LOOSARARIAN, Contract AnalystGRACE BRUBAKER, Chief, Information
FRANCES H. REYNOLDS, LibrarianBARBARA B. SWEENEY, Chief, Graphics
HELEN KOLODZIEY, Assistant Chief, InformationMOLLY B. TEMPLETON, Assistant Librarian
ALICE R. MORTON, Archivist
BEATRICE C. LEE, Publications Editor
Research Report 1971-R1: RANKINGS OF THE STATES, 1971
Project Director: BEATRICE C. LEE, Publications I:ditor
Price of Report: Single copy, $1.50. Stock No. 435-25464. Discounts on quantity orders: 2-9 copies 10%; 10 ormore copies, 20%. All orders must be prepaid except those on official purchase order forms. Shipping and handlingcharges will be added to billed orders. Order from Publications Sales Section and make checks payable to theNational Education Association, 1201 Sixteenth Street, N.W., Washington, D.C. 20036.
Subscription Rate: One-year subscription to NEA Research Division Reports, $18; send inquiries to NEA RecordsDivision.
Reproduction: No part of this Report may be reproduced in any form without written permission from the NEAResearch Division, except by NEA Departments and affiliated associations. In all cases, reproduction of the ResearchReport materials must include the usual credit line and the copyright notice. Address communications to thePublications Editor.
CONTENTS
Foreword 4
Introduction 5
Population 6
Enrollment and Attendance 12
Teachers 18
Educational Attainment 26
General Financial Resources 29
Governmental Revenue 37
School Revenue 45
Governmental Expenditures and Debt 51
School Expenditures 57
Miscellaneous 67
Outlying Areas 71
Index 74
FOREWORD
The 128 ranked lists of state data that constitue this Report present infor-mation that may be used in understanding, explaining, interpreting, andpossibly evaluating various aspects of state school systems. The range ofitems, however, illustrates the difficulty of making a defensible single jucig-ment of the effort or the effectiveness of a given state in working on itseducational problems. These rankings are not suitable for combining intocomposite rankings for the 50 ^tate school systems.
It is hoped that the information presented in this Report will be useful inthe improvement of education.
GLEN ROBINSONDirector, Research Division
t
INTRODUCTION
5
The figures used in the rankings presented in this Report are the latestavailable. Some are estimates, prepared in advance of detailed reports, andhence are subject to revision. Some are based on sampling studies, for whichmeasures of sampling variability are not recorded here. Readers are cautionedagainst making conclusions based on slight differences among states in rank-ings on a specific item, and against using the data or rankings in trend re-search since generally the ser.,s is not revised when final figures becomeavailable. However, revised 1969-70 estimates for certain items are givenalong with 1970-71 estimates.
The national totals shown in most tables include the District of Columbia;but because the District comprises a single urban school system, and hence isnot comparable to state school systems, figures for it are not shown sepa-rately. Data for American Samoa, Canal Zone, Guam, Puerto Rico, and VirginIslands, whenever they are available, are given in a separate listing beginningon page 71.
AU dollar amounts for Alaska should be reduced by 30 percent to makethe purchasing power of Alaska figures generally comparable to figures re-ported for other areas of the United States. This is noted in the tables wherethis applies.
When the figures for two or more states are identical, the states are listedalphabetically and given the same rank; the appropriate number is thenpicked up with the next state in rank.
Appended to each table are the source or sources of the data and appro-priate definitions when necessary.
5
6
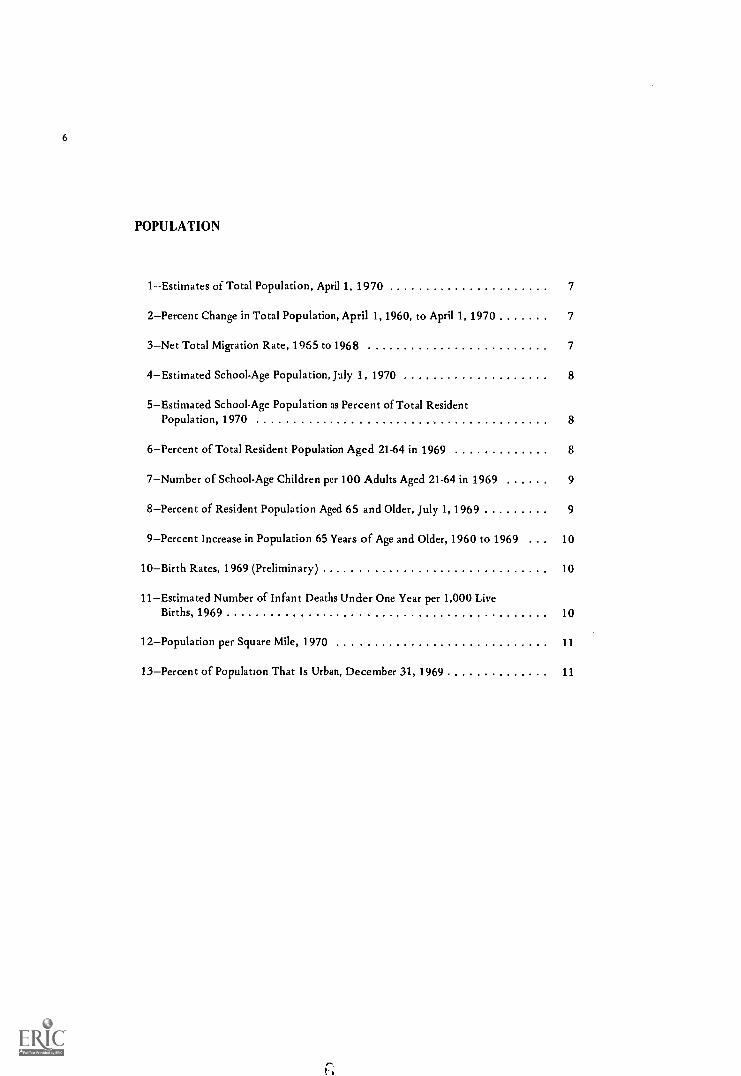
POPULATION
1--Estimates of Total Population, April 1, 1970 7
2Percent Change in Total Population, April 1, 1960, to April 1, 1970 7
3Net Total Migration Rate, 1965 to 1968 7
4Estimated School-Age Population, July 1, 1970 8
5Estimated School-Age Population as Percent of Total ResidentPopulation, 1970 8
6Percent of Total Resident Population Aged 21-64 in 1969 8
7Number of School-Age Children per 100 Adults Aged 21-64 in 1969 9
8Percent of Resident Population Aged 65 and Older, July 1, 1969 9
9Percent Increase in Population 65 Years of Age and Older, 1960 to 1969 10
10Birth Rates, 1969 (Preliminary) 10
11Estimated Number of Infant Deaths Under One Year per 1,000 LiveBirths, 1969 10
12Population per Square Mile, 1970 11
13Percent of Population That Is Urban, December 31, 1969 11
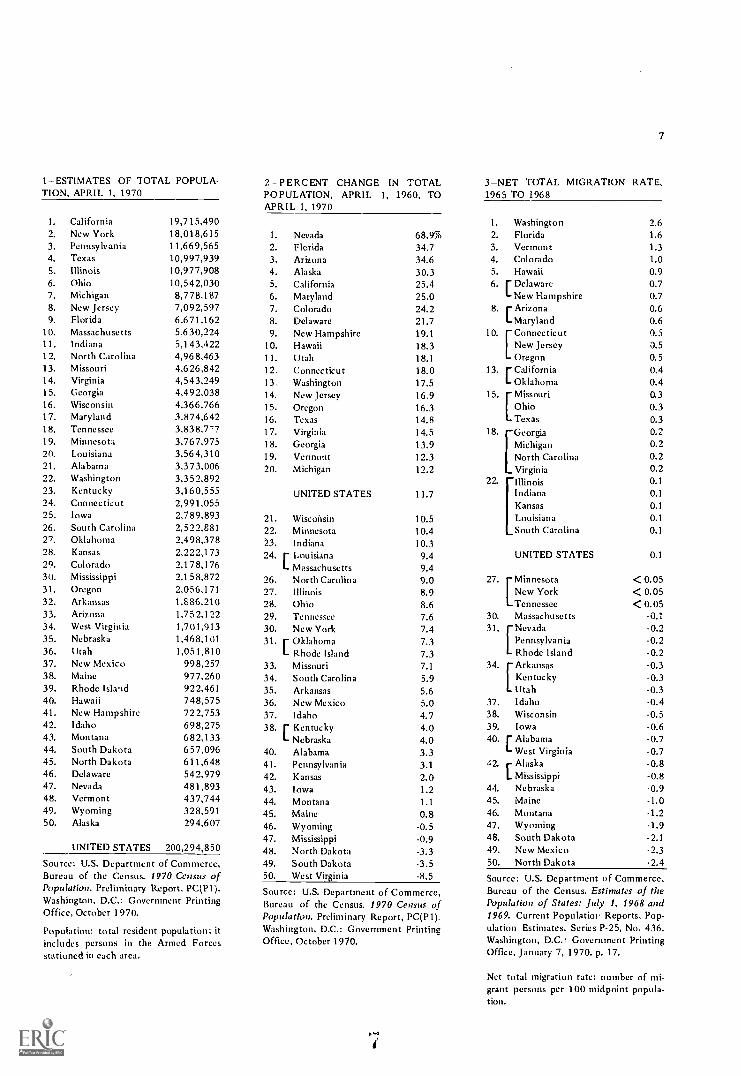
1-ESTIMATES OF TOTAL POPULA-TION, APRIL 1, 1970
2-P E RCENT CHANGE IN TOTALPOPULATION, APRIL 1, 1960, TOAPRIL 1, 1970
7
3-NET TOTAL MIGRATION RATE,1965 TO 1968
1. California 19,715,490 1. Washington 2.62. New York 18,018,615 1. Nevada 68.9% 2. Florida 1.63. Pennsylvania 11,669,565 2. Florida 34.7 3. Vermont 1.34. Texas 10,997,939 3. Arizona 34.6 4. Colorado 1.05. Illinois 10,977,908 4. Alaska 30.3 5. Hawaii 0.96. Ohio 10,542,030 5. California 25.4 6. r Delaware 0.77. Michigan 8,778,187 6. Maryland 25.0 L New Hampshire 0.78. New Jersey 7,092,597 7. Colorado 24.2 8. r Arizona 0.69. Florida 6,671,162 8. Delaware 21.7 L Maryland 0.6
10. Massachusetts 5.630,224 9. New Hampshire 19.1 10. rConnecticut 0.511. Indiana 5,143.422 10. Hawaii 18.3 IL New Jersey 0.512. North Carolina 4,968,463 11. Utah 18.1 Oregon 0.513. Missouri 4,626,842 12 Connecticut 18.0 13. r California 0.414. Virginia 4,543,249 13. Washington 17.5 L Oklahoma 0.415. Georgia 4,492,038 14. New Jersey 16.9 15. Missouri 0.316. Wisconsin 4,366,766 15. Oregon 16.3 0.317. Maryland 3,874,64218. Tennessee 3,838,7-7
16. Texas 14.817. Virginia 14.5 18. Noi
Texas 0.30.2
19. Minnesota 3,767,975 18. Georgia 13.9 Michigan 0.220. Louisiana 3,564,310 19. Vermont 12.3
[GOeeho
North Carolina 0.221. Alabama 3,373,00622. Washington 3,352,89223. Kentucky 3,160,555
20. Michigan 12.2
UNITED STATES 11.722.
Virginia 0.2di aoni 0.1
Indiana 0.124. Connecticut 2,991,055 Kansas 0.125. Iowa 2,789,893 21. Wisconsin 10.5 Louisiana 0.126. South Carolina 2,522,881 22. Minnesota 10.4 South Carolina 0.127. Oklahoma 2,498,378 23. Indiana 10.328. Kansas 2,222,173 24. r Louisiana 9.4 UNITED STATES 0.129. Colorado 2,178,176 L Massachusetts 9.430. Mississippi 2,158,872 26. North Carolina 9.0 27. Minnesota < 0.0531. Oregon 2,056,171 27. Illinois 8.9 New York < 0.0532. Arkansas 1,886,210 28. Ohio 8.6 Tennessee < 0.0533. Arizona 1,752,122 29. Tennessee 7.6 30. Massachusetts -0.134. West Virginia 1,701,913 30. New York 7.4 Nevada -0.235. Nebraska 1,468,101 31. r Oklahoma 7.3 Pennsylvania -0.2[36. Utah 1,051,810 L Rhode Island 7.3 Rhode Island -0.237. New Mexico 998,257 33. Missouri 7.1 34. Arkansas -0.338. Maine 977,260 34. South Carolina 5.9 Kentucky -0.339. Rhode Island 922,461 35. Arkansas 5.6 Utah -0.340. Hawaii 748,575 36. New Mexico 5.0 37. Idaho -0.441. New Hampshire 722,753 37. Idaho 4.7 38. Wisconsin -0.542. Idaho 698,275 38. r Kentucky 4.0 39. Iowa -0.643. Montana 682,133 L Nebraska 4.0 40. 1 Alabama -0.744. South Dakota 657,096 40. Alabama 3.3 L West Virginia -a745. North Dakota 611,648 41. Pennsylvania 3.1 42. r Alaska -0.846. Delaware 542,979 42. Kansas 2.0 `Mississippi -0.847. Nevada 481,893 43. Iowa 1.2 44. Nebraska -0.948. Vermont 437,744 44. Montana 1.1 45. Maine -1.049. Wyoming 328,591 45. Maine 0.8 46. Montana -1.250. Alaska 294,607 46. Wyoming -0.5 47. Wyoming -1.9
47. Mississippi -0.9 48. South Dakota -2.1UNITED STATES 200,294,850 48. North Dakota -3.3 49. New Mexico -2.3
Source: U.S. Department of Commerce, 49. South Dakota -3.5 50. North Dakota -2.4Bureau of the Census. 1970 Census of 50. West Virginia -8.5 Source: U.S. Department of Commerce,Population. Preliminary Report, PC(P1). Source: U.S. Department of Commerce, Bureau of the Census. Estimates of theWashington, D.C.: Government Printing Bureau of the Census. 1970 Census of Population of States: July 1, 1968 andOffice, October 1970. Population. Preliminary Report, PC(P1). 1969. Current Population Reports, Pop-Population: total resident population; it Washington, D.C.: Government Printing ulation Estimates, Series P-25, No. 436.includes persons in the Armed Forces Office, October 1970. Washington, D.C. ! Government Printing
stationed in each area. Office, January 7, 1970. p. 17.
Net total migration rate: number of mi-grant persons per 100 midpoint popula-tion.
8
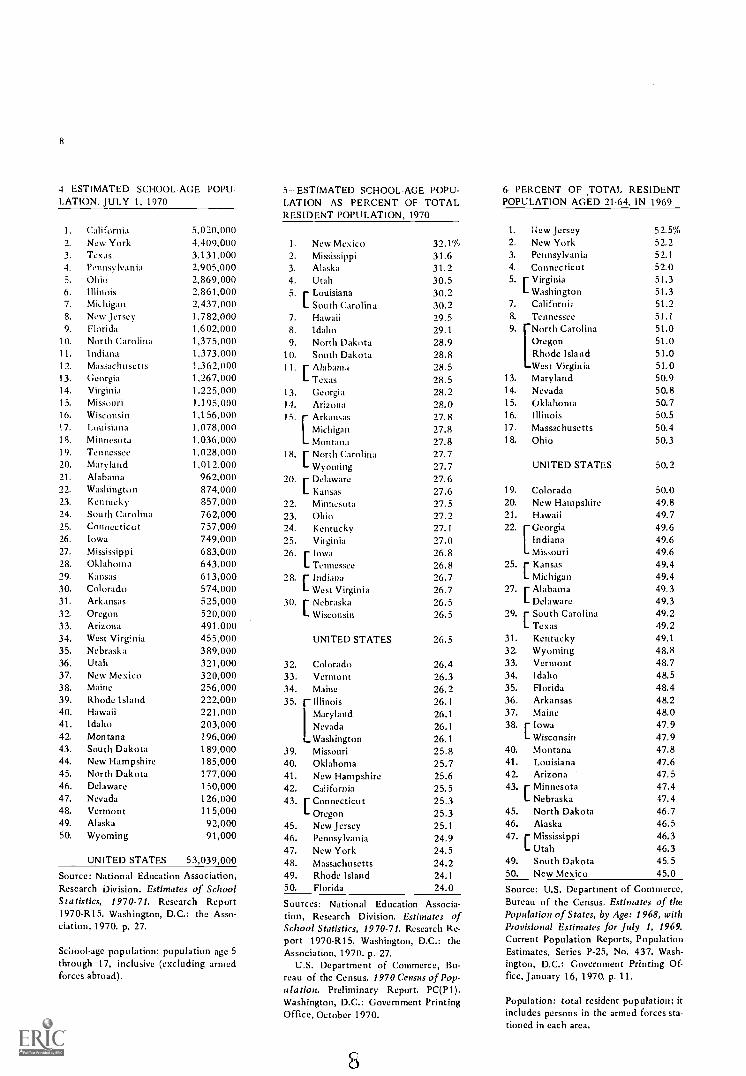
4 ESTIMATED SCHOOL-AGE POPU-LATION, JULY 1, 1970
1. California2. New York3. Texas4. Pennsylvania5. Ohio6. Illinois7. Michigan8. New Jersey9. Florida
10. North Carolina11. Indiana12. Massachusetts13. Georgia14. Virginia15. Missouri16. Wisconsin17. Louisiana18. Minnesota19. Tennessee
20. Maryland21. Alabama22. Washington23. Kentucky24. South Carolina25. Connecticut26. Iowa27. Mississippi28. Oklahoma29. Kansas
30. Colorado31. Arkansas32. Oregon33. Arizona34. West Virginia35. Nebraska36. Utah37. New Mexico38. Maine39. Rhode Island40. Hawaii41. Idaho42. Montana43. South Dakota44. New Hampshire45. North Dakota46. Delaware47. Nevada48. Vermont49. Alaska50. Wyoming
5,020,0004,409,0003,131 0002,905,0002,869,0002,861,0002,437,0001,782,0001,602.0001,375,0001,373,0001,362,0001,267,0001.225,0001.195,0001,156,0001,078,0001,036,00(11,028,0001,012,000
962,000874,000857,000762,000757,000749,000683,000643,000613,000574,000525,000520,000491.000455,000389,000321,000320,000256,000222,000221,000203,000196,000189,000185,000177,000150,000126,000115,00092,00091,000
UNITED STATES 53,039,000
Source: National Education Association,Research Division. Estimates of SchoolStatistics, 1970-71. Research Report1970-R15. Washington, D.C.: the Asso-ciation, 1970. p. 27.
School-age population: population age 5through 17, inclusive (excluding armedforces abroad).
5 ESTIMATED SCHOOL-AGE POPU-LATION AS PERCENT OF TOTALRESIDENT POPULATION, 1970
1. New Mexico2. Mississippi3. Alaska4. Utah5. r Louisiana
I- South Carolina7. Hawaii8. Idaho9. North Dakota
10. South Dakota11. r Alabama
L Texas13. Georgia14. Arizona15. Arkansas
MichiganMontana
18. r North CarolinaL Wyoming
20. r DelawareL Kansas
22. Minnesota23. Ohio24. Kentucky25. Virginia26. r Iowa
L Tennessee28. r Indiana
L West Virginia30. r Nebraska
L Wisconsin
UNITED STATES
32. Colorado33. Vermont34. Maine35. Illinois
MarylandNevadaWashington
39. Missouri40. Oklahoma41. New Hampshire42. California43. r Connecticut
L Oregon45. New Jersey46. Pennsylvania47. New York48. Massachusetts49. Rhode Island50. Florida
6-PERCENT OF TOTAL RESIDENTPOPULATION AGED 21-64, IN 1969
32.1% 2. New York52.552.2
1. New Jersey %
31.6 3. Pennsylvania 52.1
31.2 4, Connecticut 52.0
30.5 5. r Virginia 51.3
30.2 L Washington 51.37. California 51.2
29.5 8. Tennessee 51.1
29.1
28.8
9. North CarolinaOregon 51.0Rhode Island
51.0
28.951.0
28.5 West Virginia 51.0
28.5 13. Maryland 50.914. Nevada28.2 50.815. Oklahoma28.0 50.716. Illinois27.8 50.5
18. Ohio50.427.8 17. Massachusetts
27.8 50.3
27.7UNITED STATES27.7 50.2
27.619. Colorado27.6 50.0
27.5 20. New Hampshire 49.827.2 21. Hawaii 49.727.1
27.022.
LIndiana
49.649.6
26.8 Missouri 49.6
26.8 25. r Kansas 49.426.7 L Michigan 49.426.7 27. r Alabama 49.326.5 L Delaware 49.3
26.5 29. r South Carolina 49.2L Texas 49.2
26.5 31. Kentucky 49.132. Wyoming 48.8
26.4 33. Vermont 48.7
26.3 34. Idaho 48.5
26.2 35. Florida 48.4
26.1 36. Arkansas 48.2
26.1 37. Maine 48.0
26.1 38. r Iowa 47.9
26.1 L Wisconsin 47.9
25.8 40. Montana 47.8
25.7 41. Louisiana 47.6
25.6 42. Arizona 47.5
25.5 43. r Minnesota 47.4
25.3 L Nebraska 47.4
25.3 45. North Dakota 46.746. Alaska25.1 46.5
24.9 46.3L Utah
47. r Mississippi
24.5 46.3
24.2 49. South Dakota 45.5
24.1 50. New Mexico 45.0
24.0
Sources: National Education Associa-tion, Research Division. Estimates ofSchool Statistics, 1970-71. Research Re-port 1970-R15. Washington, D.C.: theAssociation, 1970. p. 27.
U.S. Department of Commerce, Bu-reau of the Census. 1970 Census of Pop-ulation. Preliminary Report. PC(P1).Washington, D.C.: Government PrintingOffice, October 1970.
8
Source: U.S. Department of Commerce,Bureau of the Census. Estimates of thePopulation of States, by Age: 1968, withProvisional Estimates for July 1, 1969.Current Population Reports, PopulationEstimates, Series P-25, No. 437. Wash-ington, D.C.: Government Printing Of-fice, January 16, 1970. p. 11.
Population: total resident population; itincludes persons in the armed forces sta-tioned in each area.
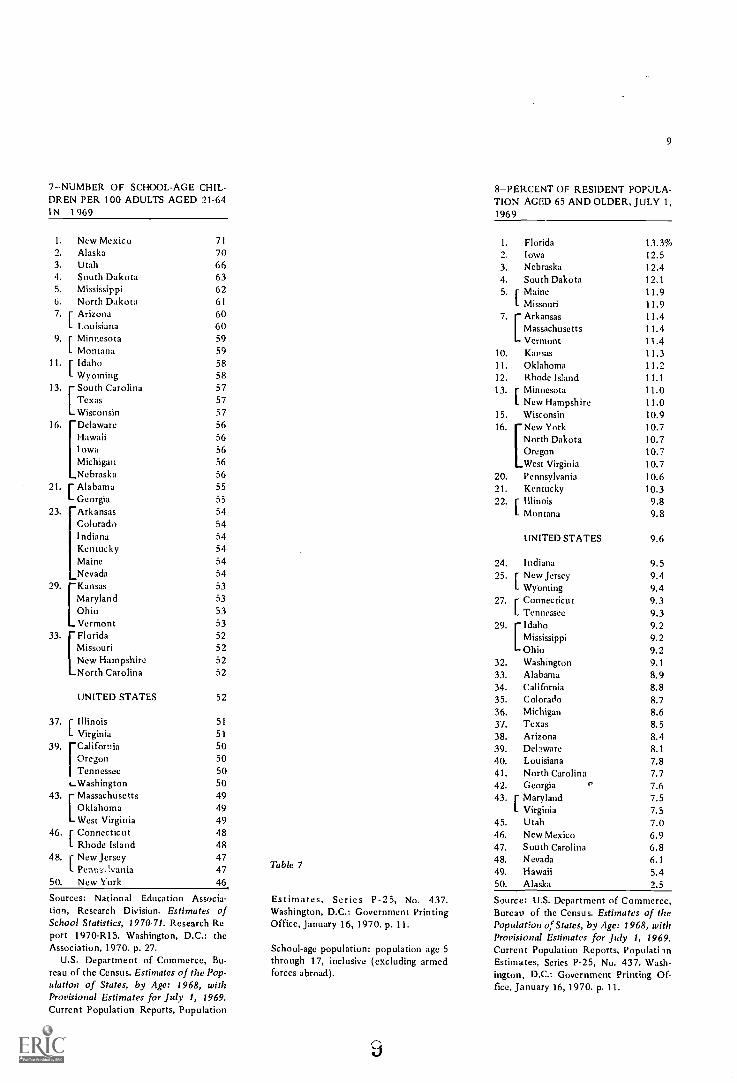
7--NUMBER OF SCHOOL-AGE CHIL-DREN PER 100 ADULTS AGED 21-64IN 1969
1. New Mexico2. Alaska3. Utah4. South Dakota5. Mississippi6. North Dakota7. I Arizona
L Louisiana9. [ Minnesota
L Montana11. r Idaho
L Wyoming13. South Carolina
TexasWisconsin
16. DelawareHawaiiIowaMichiganNebraska
21. (' AlabamaL Georgia
23. ArkansasColoradoIndianaKentuckyMaineNevada
29. KansasMarylandOhioVermont
33. FloridaMissouriNew HampshireNorth Carolina
71
7066636261
60605959585857575756565656
56
55555454545454545353535352525252
UNITED STATES 52
37. 1 IllinoisL Virginia
39. CaliforniaOregonTennessee
4-Washington43. Massachusetts
OklahomaWest Virginia
46. r ConnecticutL Rhode Island
48. r New JerseyI Pezins,J)vania
50. New Y ork
51
51
505050504949494848474746,
Sources: National Education Associa-tion, Research Division. Estimates ofSchool Statistics, 1970-71. Research Re-port 1970-R15. Washington, D.C.: theAssociation, 1970. p. 27.
U.S. Department of Commerce, Bu-reau of the Census. Estimates of the Pop-ulation of States, by Age: 1968, withProvisional Estimates for July 1, 1969.Current Population Reports, Population
Table 7
Estimates, Series P-25, No. 437.Washington, D.C.: Government PrintingOffice, January 16, 1970. p. 11.
School-age population: population age 5through 17, inclusive (excluding armedforces abroad).
9
8--PERCENT OF RESIDENT POPULA-TION AGED 65 AND OLDER, JULY 1,1969
1. Florida2. Iowa3. Nebraska4. South Dakota5. 1 Maine
L Missouri7. Arkansas
MassachusettsVermont
10. Kansas11. Oklahoma12. Rhode Island13. r Minnesota
L New Hampshire15. Wisconsin16. New York
North DakotaOregonWest Virginia
20. Pennsylvania21. Kentucky22. 1 Illinois
1. Montana
13.3%12.512.412,111.911.911.411.411.411.311.211.111.011.010.910.710.710.710.710.610.39.89.8
UNITED STATES 9.6
24. Indiana25. r New Jersey
L Wyoming27. r Connecticut
i_ Tennessee[IdahoMississippi
isohington32. Washington33. Alabama34. California35. Colorado36. MichiganV. Texas38. Arizona39. Delaware40. Louisiana41. North Carolina42. Georgia43. r Maryland
L Virginia45. Utah46. New Mexico47. South Carolina48. Nevada49. Hawaii50. Alaska
r
9.59.49.49.39.39.29.29.29.18.98.88.78.68.58.48.17.87.77.67.57.57.06.96.86.15.42.5
Source: U.S. Department of Commerce,Bureau of the Census. Estimates of thePopulation of States, by Age: 1968, withProvisional Estimates for July 1, 1969.Current Population Reports, PopulationEstimates, Series P-25, No. 437. Wash-ington, D.C.: Government Printing Of-fice, January 16, 1970. p. 11.
10
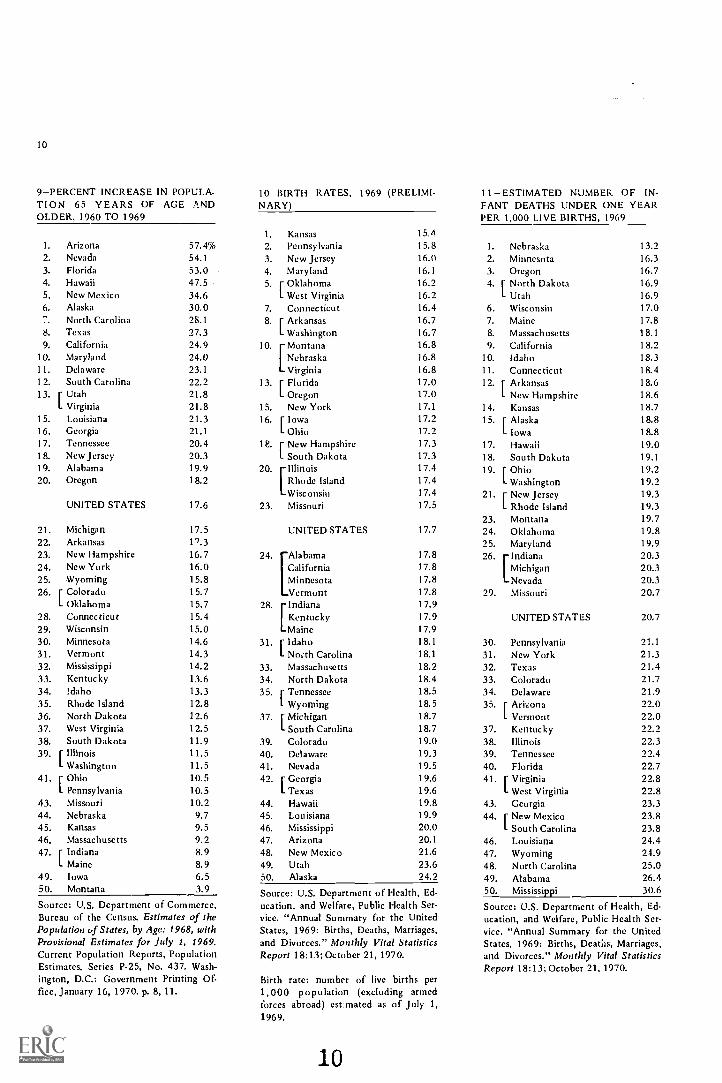
9-PERCENT INCREASE IN POPULA-TION 65 YEARS OF AGE ANDOLDER, 1960 TO 1969
1. Arizona2. Nevada3. Florida4. Hawaii5. New Mexico6. Alaska
North Carolina8. Texas9. California
10. Maryland11. Delaware12. South Carolina13. r Utah
L Virginia15. Louisiana16. Georgia17. Tennessee18. New Jersey19. Alabama20. Oregon
UNITED STATES
21. Michigan22. Arkansas23. New Hampshire24. New York25. Wyoming26. [ Colorado
L Oklahoma28. Connecticut29. Wisconsin30. Minnesota31. Vermont32. Mississippi33. Kentucky34. Idaho35. Rhode Island36. North Dakota37. West Virginia38. South Dakota39. r Illinois
L Washington41. Ohio
L Pennsylvania43. Missouri44. Nebraska45. Kansas46. Massachusetts47. r Indiana
L Maine49. Iowa50. Montana
10-BIRTH RATES, 1969 (PRELIMI-NARY)
1. Kansas57.4% 2. Pennsylvania54.1 3. New Jersey53.0 4. Maryland47.5 5. r Oklahoma34.6 L West Virginia30.0 7. Connecticut28.1 8. r Arkansas27.3 L Washington24.9 10. rMontana24.0 Nebraska23.1 L Virginia22.2 13. r Florida21.8 L Oregon21.8 15. New York21.3 16. [ Iowa21.1 L Ohio20.4 18. r New Hampshire20.3 1 South Dakota19.9 20. rr Illinois18.2 Rhode Island
Wisconsin17.6 23. Missouri
17.517.316.7 24.16.015.815.715.7 28.15.415.014.6 31.14.314.2 33.13.6 34.13.3 35.12.812.6 37.12.511.9 39.11.5 40.11.5 41.10.5 42.10.510.2 44,
9.7 45.9.5 46.9.2 47.8.9 48.8.9 49.6.5 50.3.9
Source: U.S. Department of Commerce,Bureau of the Census. Estimates of thePopulation of States, by Age: 1968, withProvisional Estimates for July 1, 1969.Current Population Reports, PopulationEstimates, Series P-25, No. 437. Wash-ington, D.C.: Government Printing Of-fice, January 16, 1970. p. 8, 11.
UNITED STATES
AlabamaCaliforniaMinnesotaVermont
[IndianaKentuckyMaine
[ IdahoL North Carolina
MassachusettsNorth DakotaTennessee
L Wyoming[ Michigan1 South Carolina
ColoradoDelawareNevada
[ GeorgiaL Texas
HawaiiLouisianaMississippiArizonaNew MexicoUtahAlaska
15.415.816.016.116.216.216.416.716.716.816.816.817.017.017.117.217.217.317.317.417.417.417.5
17.7
17.817.817.817.817.917.917.918.118.118.218.418.518.518.718.719.019.319.519.619.619.819.920.020.121.623.624.2
Source: U.S. Department of Health, Ed-ucation, and Welfare, Public Health Ser-vice. "Annual Summary for the UnitedStates, 1969: Births, Deaths, Marriages,and Divorces." Monthly Vital StatisticsReport 18:13; October 21, 1970.
Birth rate: number of live births per1,000 population (excluding armedforces abroad) estimated as of July 1,1969.
10
I 1- ESTIMATED NUMBER OF IN-FANT DEATHS UNDER ONE YEARPER 1,000 LIVE BIRTHS, 1969
1. Nebraska2. Minnesota3. Oregon4. r North Dakota
L Utah6. Wisconsin7. Maine8. Massachusetts9. California
10. Idaho11. Connecticut12. r Arkansas
13.216.316.716.916.917.017.818.118.218.318.418.6
L New Hampshire 18.614. Kansas 18.715. r Alaska 18.8
1 Iowa 18.817. Hawaii 19.018. South Dakota 19.119. r Ohio 19.2
1 Washington 19.221. r New Jersey 19.3
L Rhode Island 19.323. Montana 19.724. Oklahoma 19.825. Maryland 19.926. Indiana 20.3
Michigan 20.3Nevada 20.3
29. Missouri 20.7
UNITED STATES 20.7
30. Pennsylvania 21.131. New York 21.332. Texas 21.433. Colorado 21.734. Delaware 21.935. r Arizona 22.0
1 Vermont 22.037. Kentucky 22.238. Illinois 22.339. Tennessee 22.440. Florida 22.741. r Virginia 22.8
L Wcst Virginia 22.843. Georgia 23.344. [ New Mexico 23.8
South Carolina 23.846. Louisiana 24.447. Wyoming 24.948. North Carolina 25.049. Alabama 26.450. Mississippi 30.6
Source: U.S. Department of Health, Ed-ucation, and Welfare, Public Health Ser-vice. "Annual Summary for the UnitedStates, 1969: Births, Deaths, Marriages,and Divorces." Monthly Vital StatisticsReport 18:13; October 21, 1970.
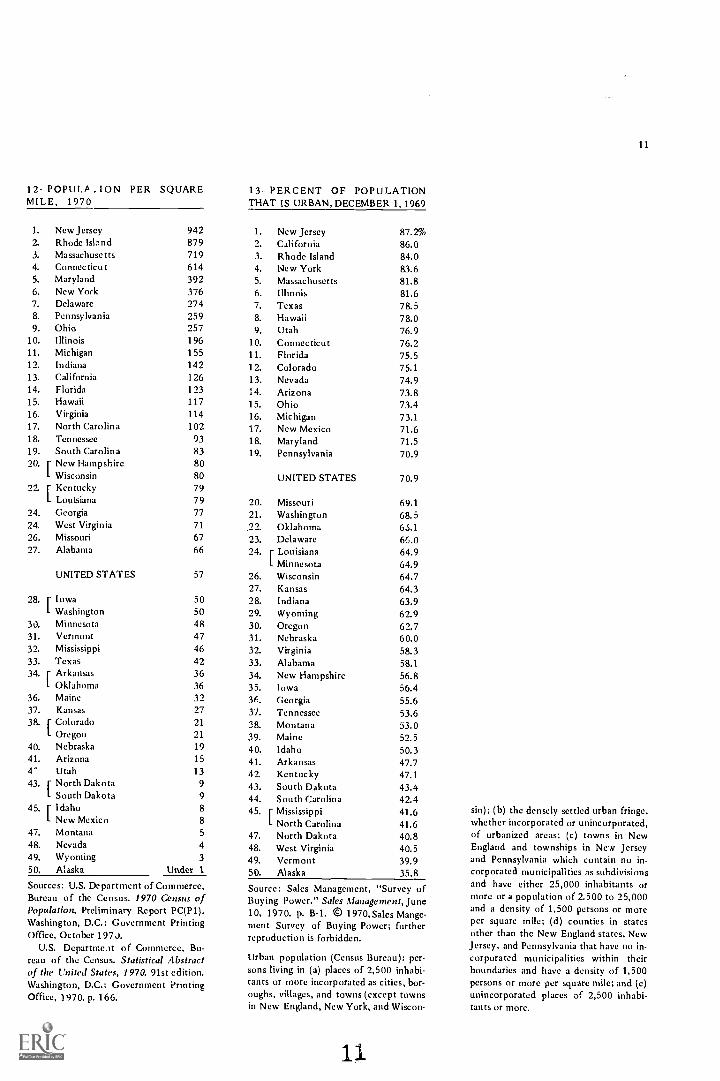
12-POPULA ;ION PERMILE, 1970
SQUARE
1. New Jersey 9422. Rhode Island 8793. Massachusetts 7194. Connecticut 6145. Maryland 3926. New York 3767. Delaware 2748. Pennsylvania 2599. Ohio 257
10. Illinois 19611. Michigan 15512. Indiana 14213. California 12614. Florida 12315. Hawaii 11716. Virginia 11417. North Carolina 10218. Tennessee 9319. South Carolina 83
20. r New Hampshire 80Wisconsin 80
22. r Kentucky 79L Louisiana 79
24. Georgia 77
24. West Virginia 71
26. Missouri 6727. Alabama 66
UNITED STATES 57
28. r Iowa 50Washington 50
30. Minnesota 4831. Vermont 4732. Mississippi 4633. Texas 4234. r Arkansas 36
L Oklahoma 3636. Maine 3237. Kansas 27
38. r Colorado 21
1- Oregon 21
40. Nebraska 19
41. Arizona 15
4- Utah 13
43. r North Dakota 9L South Dakota 9
45. r Idaho 8
L New Mexico 8
47. Montana 5
48. Nevada 449. Wyoming 3
50. Alaska Under 1
Sources: U.S. Department of Commerce,Bureau of the Census. 1970 Census ofPopulation. Preliminary Report PC(P1).Washington, D.C.: Government PrintingOffice, October 197J.
U.S. Departme.rt of Commerce, Bu-reau of the Census. Statistical Abstractof the United States, 1970. 91st edition.Washington, D.C.: Government ?rimingOffice, 1970. p. 166.
13-PERCENT OF POPULATIONTHAT IS URBAN, DECEMBER 1, 1969
1. New Jersey 87.2%2. California 86.03. Rhode Island 84.04. New York 83.65. Massachusetts 81.86. Illinois 81.67. Texas 78.58. Hawaii 78.09. Utah 76.9
10. Connecticut 76.211. Florida 75.512. Colorado 75.113. Nevada 74.914. Arizona 73.815. Ohio 73.416. Michigan 73.117. New Mexico 71.618. Maryland 71.519. Pennsylvania 70.9
UNITED STATES 70.9
20. Missouri 69.121. Washington 68.5
.22. Oklahoma 63.123. Delaware 66.024. r Louisiana 64.9
L Minnesota 64.926. Wisconsin 64.727. Kansas 64.328. Indiana 63.929. Wyoming 62.930. Oregon 62.731. Nebraska 60.032. Virginia 58.333. Alabama 58.134. New Hampshire 56.835. Iowa 56.431. Georgia 55.637. Tennessee 53.638. Montana 53.039. Maine 52.540. Idaho 50.341. Arkansas 47.742. Kentucky 47.143. South Dakota 43.444. South Carolina 42.445. r Mississippi 41.6
1 North Carolina 41.647. North Dakota 40.848. West Virginia 40.549. Vermont 39.950. Alaska 35.8
Source: Sales Management, "Survey ofBuying Power." Sales Management, June10, 1970. p. B-1. © 1970,Sales Mange-merit Survey of Buying Power; furtherreproduction is forbidden.
Urban population (Census Bureau): per-sons living in (a) places of 2,500 inhabi-tants or more incorporated as cities, bor-oughs, villages, and towns (except townsin New England, New York, and Wiscon-
13.
11
sin); (b) the densely settled urban fringe,whether incorporated or unincorporated,of urbanized areas; (c) towns in NewEngland and townships in New Jerseyand Pennsylvania which contain no in-corporated municipalities as subdivisionsand have either 25,000 inhabitants ormore or a population of 2.500 to 25,000and a density of 1,500 persons or moreper square mile; (d) counties in statesother than the New England states, NewJersey, and Pennsylvania that have no in-corporated municipalities within theirboundaries and have a density of 1,500persons or more per square mile; and (e)unincorporated places of 2,500 inhabi-tants or more.
12
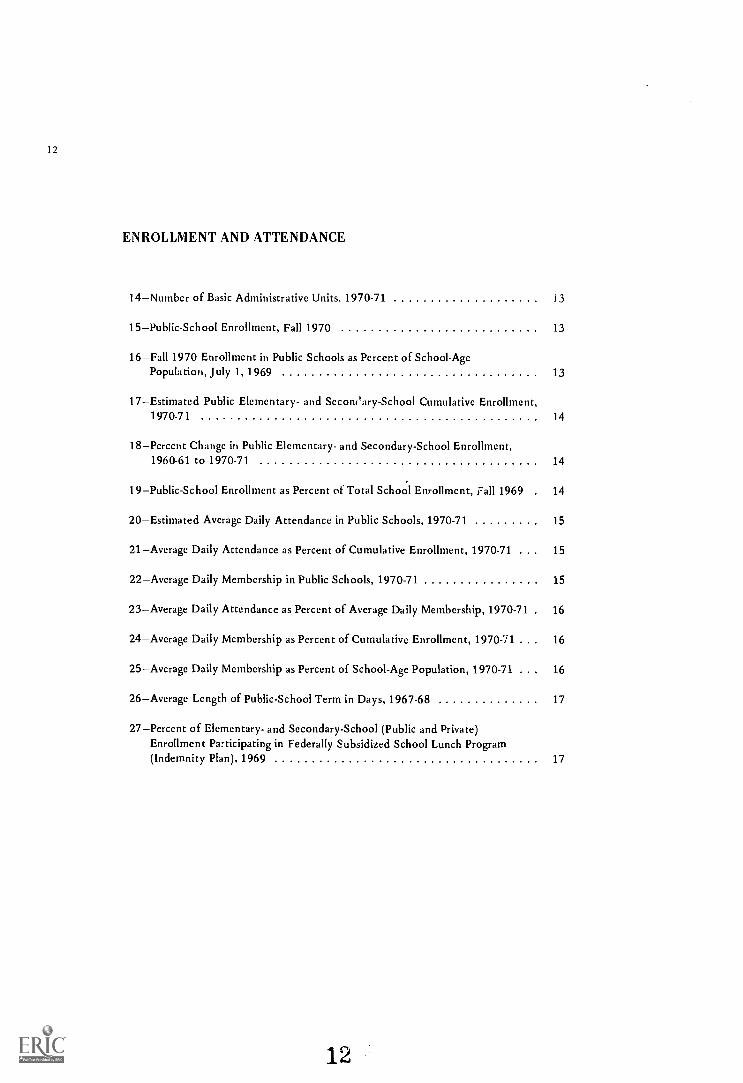
ENROLLMENT AND ATTENDANCE
14Number of Basic Administrative Units, 1970-71 i3
15Public-School Enrollment, Fall 1970 13
16Fall 1970 Enrollment in Public Schools as Percent of School-AgePopulation, July 1, 1969 13
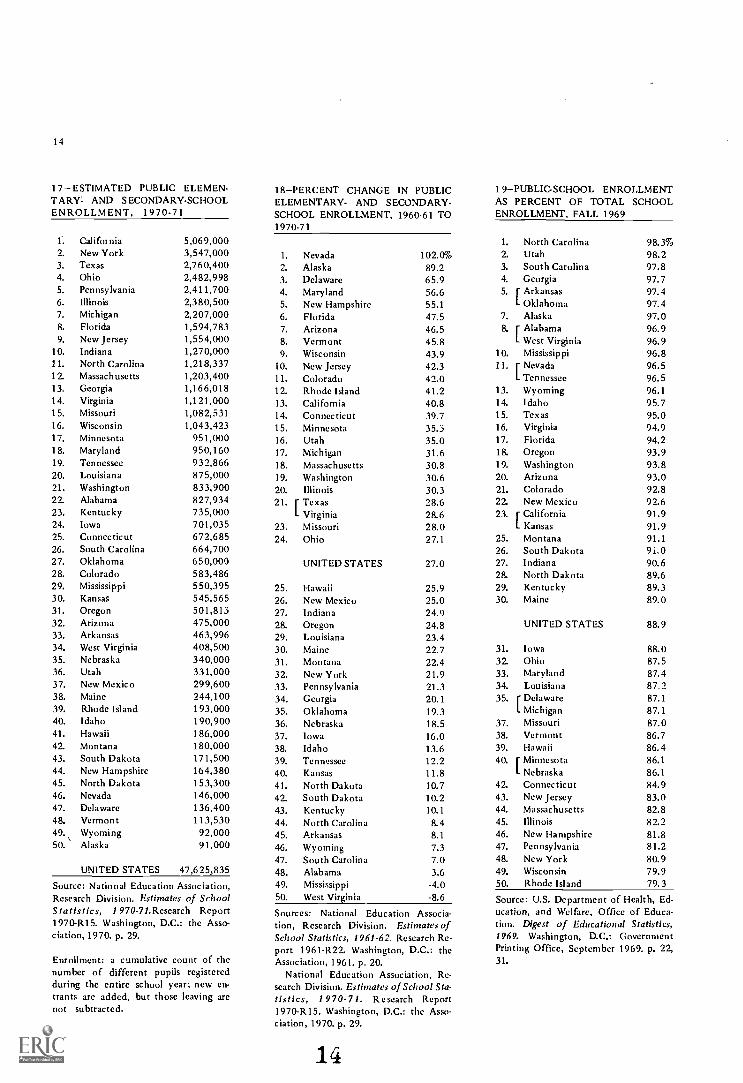
17Estimated Public Elementary- and Secondary-School Cumulative Enrollment,1970-71 14
18Percent Change in Public Elementary- and Secondary-School Enrollment,1960-61 to 1970-71 14
19Public-School Enrollment as Percent of Total School Enrollment, pall 1969 14
20Estimated Average Daily Attendance in Public Schools, 1970-71 15
21Average Daily Attendance as Percent of Cumulative Enrollment, 1970-71 . . 15
22Average Daily Membership in Public Schools, 1970-71 15
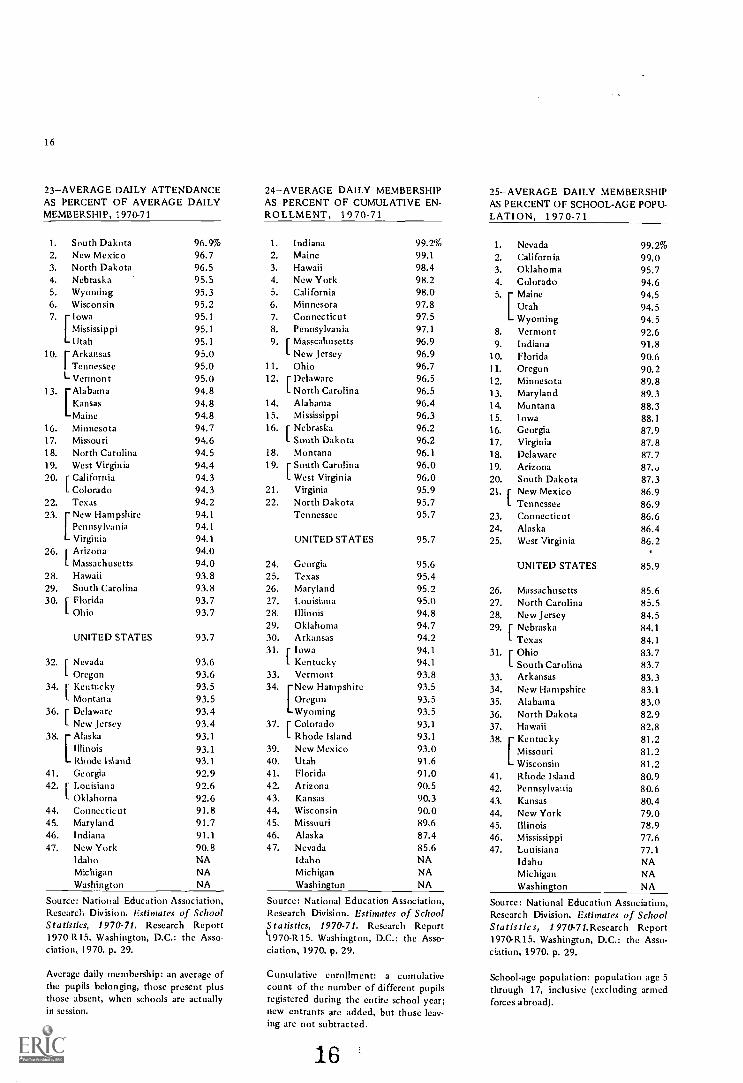
23Average Daily Attendance as Percent of Average Daily Membership, 1970-71 , 16
24Average Daily Membership as Percent of Cumulative Enrollment, 1970-71 . . , 16
25Average Daily Membership as Percent of School-Age Population, 1970-71 . . 16
26Average Length of Public-School Term in Days, 1967-68 17
27Percent of Elementary- and Secondary-School (Public and Private)Enrollment Participating in Federally Subsidized School Lunch Program(Indemnity Plan), 1969 17
12
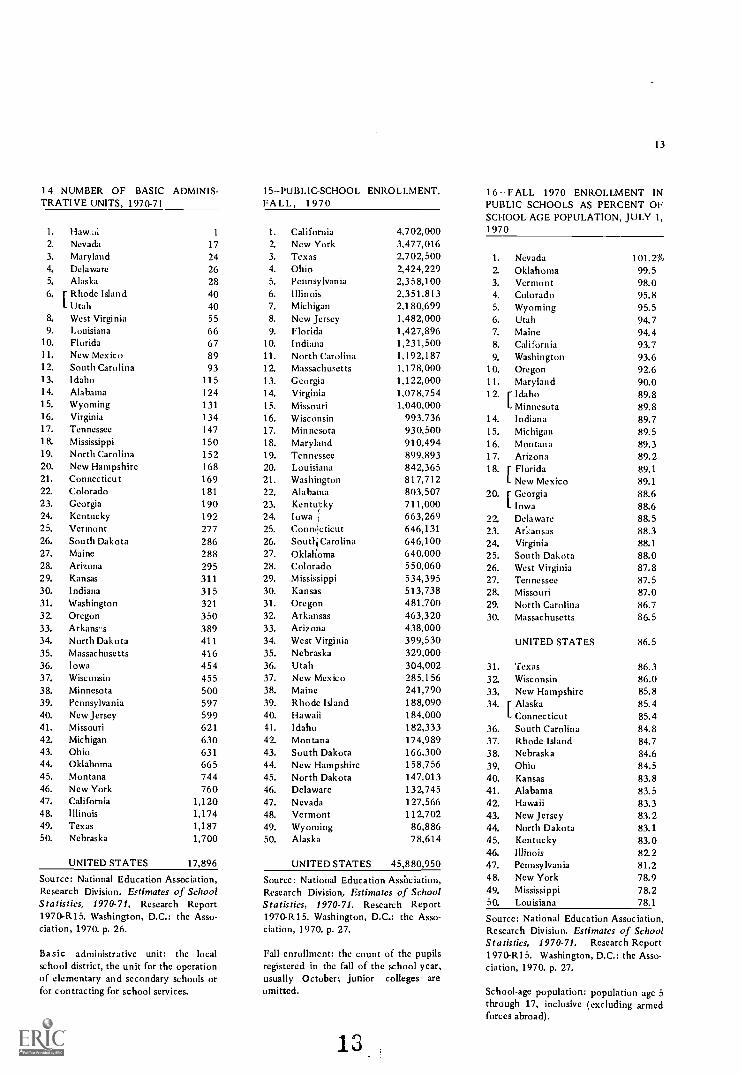
14- NUMBER OF BASICTRATIVE UNITS, 1970-71
ADMINIS- 15-PUBLIC-SCHOOL ENROLLMENT,FALL, 1970
1. Haw a; 1 1. California 4,702,0002. Nevada 17 2. New York 3,477,0163. Maryland 24 3. Texas 2,702,5004. Delaware 26 4. Ohio 2,424,2295. Alaska 28 5. Pennsylvania 2,358,1006. r Rhode Island 40 6. Illinois 2,351,813
L Utah 40 7. Michigan 2,1 80,6998. West Virginia 55 8. New Jersey 1,482,0009. Louisiana 66 9. Florida 1,427,896
10. Florida 67 10. Indiana 1,231,50011. New Mexico 89 11. North Carolina 1,192,18712. South Carolina 93 12. Massachusetts 1,178,00013. Idaho 115 13. Georgia 1,122,00014. Alabama 124 14. Virginia 1,078,75415. Wyoming 131 15. Missouri 1,040,00016. Virginia 134 16. Wisconsin 993,73617. Tennessee 147 17. Minnesota 930,50018. Mississippi 150 18. Maryland 910,49419. North Carolina 152 19. Tennessee 899,89320. New Hampshire 168 20. Louisiana 842,36521. Connecticut 169 21. Washington 817,71222. Colorado 181 22. Alabama 803,50723. Georgia 190 23. Kentucky 711,00024. Kentucky 192 24. Iowa 663,26925. Vermont 277 25. Comnicticut 646,13126. South Dakota 286 26. Soutli Carolina 646,10027. Maine 288 27. Oklahoma 640,00028. Arizona 295 28. Colorado 550,06029. Kansas 311 29. Mississippi 534,39530. Indiana 315 30. Kansas 513,73831. Washington 321 31. Oregon 481,70032. Oregon 350 32. Arkansas 463,32033. Arkansas 389 33. Arizona 438,00034. North Dakota 411 34. West Virginia 399,53035. Massachusetts 416 35. Nebraska 329,00036. Iowa 454 36. Utah 304,00237. Wisconsin 455 37. New Mexico 285,15638. Minnesota 500 38. Maine 241,79039. Pennsylvania 597 39. Rhode Island 188,09040. New Jersey 599 40. Hawaii 184,00041. Missouri 621 41. Idaho 182,33342. Michigan 630 42. Montana 174,98943. Ohio 631 43. South Dakota 166,30044. Oklahoma 665 44. New Hampshire 158,75645. Montana 744 45. North Dakota 147,01346. New York 760 46. Delaware 132,74547. California 1,120 47. Nevada 127,56648. Illinois 1,174 48. Vermont 112,70249. Texas 1,187 49. Wyoming 86,88650. Nebraska 1,700 50. Alaska 78,614
UNITED STATES 17,896 UNITED STATES 45,880,950Source: National Education Association,Research Division. Estimates of SchoolStatistics, 1970-71. Research Report1970-R15. Washington, D.C.: the Asso-ciation, 1970. p. 26.
Basic administrative unit: the localschool district, the unit for the operationof elementary and secondary schools orfor contracting for school services.
Source: National Education AssOciation,Research Division. Estimates of SchoolStatistics, 1970-71. Research Report1970-R15. Washington, D.C.: the Asso-ciation, 1970. p. 27.
Fall enrollment: the count of the pupilsregistered in the fall of the school year,usually October; junior colleges areomitted.
13
1 6- F ALL 1970 ENROLLMENT INPUBLIC SCHOOLS AS PERCENT OFSCHOOL-AGE POPULATION, JULY 1,197 0
1. Nevada 101.2%2. Oklahoma 99.53. Vermont 98.04. Colorado 95.85. Wyoming 95.56. Utah 94.77. Maine 94.48. California 93.79. Washington 93.6
10. Oregon 92.611. Maryland 90.012. r Idaho 89.8
L Minnesota 89.814. Indiana 89.715. Michigan 89.516. Montana 89.317. Arizona 89.218. r Florida 89.1
L New Mexico 89.120. r Georgia 88.6
L Iowa 88.622. Delaware 88.523. Arkansas 88.324. Virginia 88.125. South Dakota 88.026. West Virginia 87.827. Tennessee 87.528. Missouri 87.029. North Carolina 86.730. Massachusetts 86.5
UNITED STATES 86.5
31. Texas 86.332. Wisconsin 86.033. New Hampshire 85.834. r Alaska 85.4
L Connecticut 85.436. South Carolina 84.837. Rhode Island 84.738. Nebraska 84.639. Ohio 84.540. Kansas 83.841. Alabama 83.542. Hawaii 83.343. New Jersey 83.244. North Dakota 83.145. Kentucky 83.046. Illinois 82.247. Pennsylvania 81.248. New York 78.949. Mississippi 78.250. Louisiana 78.1
Source: National Education Association,Research Division. Estimates of SchoolStatistics, 1970-71. Research Report1970 -R15. Washington, D.C.: the Asso-ciation, 1970. p. 27.
School-age population: population age 5through 17, inclusive (excluding armedforces abroad).
14
1 7- ESTIMATED PUBLIC ELEMEN-TARY: AND SECONDARY-SCHOOLENROLLMENT, 1970-71
1. Califotnia 5,069,0002. New York 3,547,0003. Texas 2,760,4004. Ohio 2,482,9985. Pennsylvania 2,411,7006. Illinois 2,380,5007. Michigan 2,207,0008. Florida 1,594,7839. New Jersey 1,554,000
10. Indiana 1,270,00011. North Carolina 1,218,33712. Massachusetts 1,203,40013. Georgia 1,166,01814. Virginia 1,121,00015. Missouri 1,082,53116. Wisconsin 1,043,42317. Minnesota 951,00018. Maryland 950,16019. Tennessee 932,86620. Louisiana 875,00021. Washington 833,90022. Alabama 827,93423. Kentucky 735,00024. Iowa 701,03525. Connecticut 672,68526. South Carolina 664,70027. Oklahoma 650,00028. Colorado 583,48629. Mississippi 550,39530. Kansas 545,56531. Oregon 501,81332. Arizona 475,00033. Arkansas 463,99634. West Virginia 408,50035. Nebraska 340,00036. Utah 331,00037. New Mexico 299,60038. Maine 244,10039. Rhode Island 193,00040. Idaho 190,90041. Hawaii 186,00042. Montana 180,00043. South Dakota 171,50044. New Hampshire 164,38045. North Dakota 153,30046. Nevada 146,00047. Delaware 136,40048. Vermont 113,53049. Wyoming 92,00050. Alaska 91,000
UNITED STATES 47,625,835
Source: National Education Association,Research Division. Estimates of SchoolStatistics, 1 970-71,Research Report1970-R15. Washington, D.C.: the Asso-ciation, 1970. p. 29.
Enrollment: a cumulative count of thenumber of different pupils registeredduring the entire school year; new en-trants are added, but those leaving arenot subtracted.
18-PERCENT CHANGE IN PUBLICELEMENTARY- AND SECONDARY-SCHOOL ENROLLMENT, 1960-61 TO1970-71
1. Nevada 102.0%2. Alaska 89.23. Delaware 65.94. Maryland 56.65. New Hampshire 55.16. Florida 47.57. Arizona 46.58. Vermont 45.89. Wisconsin 43.9
10. New Jersey 42.311. Colorado 42.012. Rhode Island 41.213. California 40.814. Connecticut 39.715. Minnesota 35.316. Utah 35.017. Michigan 31.618. Massachusetts 30.819. Washington 30.620. Illinois 30.321. r Texas 28.6
L Virginia 28.623. Missouri 28.024. Ohio 27.1
25.26.27.28.29.30.31.32.33.34.35.36.37.38.39.40.41.42.43.44.45.46.47.48.49.50.
UNITED STATES 27.0
HawaiiNew MexicoIndianaOregonLouisianaMaineMontanaNew YorkPennsylvaniaGeorgiaOklahomaNebraskaIowaIdahoTennesseeKansasNorth DakotaSouth DakotaKentuckyNorth CarolinaArkansasWyomingSouth CarolinaAlabamaMississippiWest Virginia
25.925.024.924.823.422.722.421.921.320.119.318.516.013.612.211.810.710.210.18.48.l7.37.03.6
-4.0-8.6
Sources: National Education Associa-tion, Research Division. Estimates ofSchool Statistics, 1961-62. Research Re-port 1961-R22. Washington, D.C.: theAssociation, 1961. p. 20.
National Education Association, Re-search Division. Estimates of School Sta-tistics, 1970-71. Research Report1970-R15. Washington, D.C.: the Asso-ciation, 1970. p. 29.
14
1 9-PUBLIC-SCHOOL ENROLLMENTAS PERCENT OF TOTAL SCHOOLENROLLMENT, FALL 1969
1. North Carolina2. Utah3. South Carolina4. Georgia5. r Arkansas
L Oklahoma7. Alaska8. r Alabama
L West Virginia10. Mississippi11. r Nevada
98.3%98.297.897.797.497.497.096.996.996.896.5
L Tennessee 96.513. Wyoming 96.114. Idaho 95.715. Texas 95.016. Virginia 94.917. Florida 94.218. Oregon 93.919. Washington 93.820. Arizona 93.021. Colorado 92.822. New Mexico 92.623. r California 91.9
L Kansas 91.925. Montana 91.126. South Dakota 9i.027. Indiana 90.628. North Dakota 89.629. Kentucky 89.330. Maine 89.0
UNITED STATES 88.9
31. Iowa 88.032. Ohio 87.533. Maryland 87.434. Louisiana 87.235. r Delaware 87.1
L Michigan 87.137. Missouri 87.038. Vermont 86.739. Hawaii 86.440. [ Minnesota 86.1
L Nebraska 86.142. Connecticut 84.943. New Jersey 83.044. Massachusetts 82.845. Illinois 82.246. New Hampshire 81.847. Pennsylvania 81.248. New York 80.949. Wisconsin 79.950. Rhode Island 79.3
Source: U.S. Department of Health, Ed-ucation, and Welfare, Office of Educa-tion. Digest of Educational Statistics,1969. Washington, D.C.: GovernmentPrinting Office, September 1969. p. 22,31.
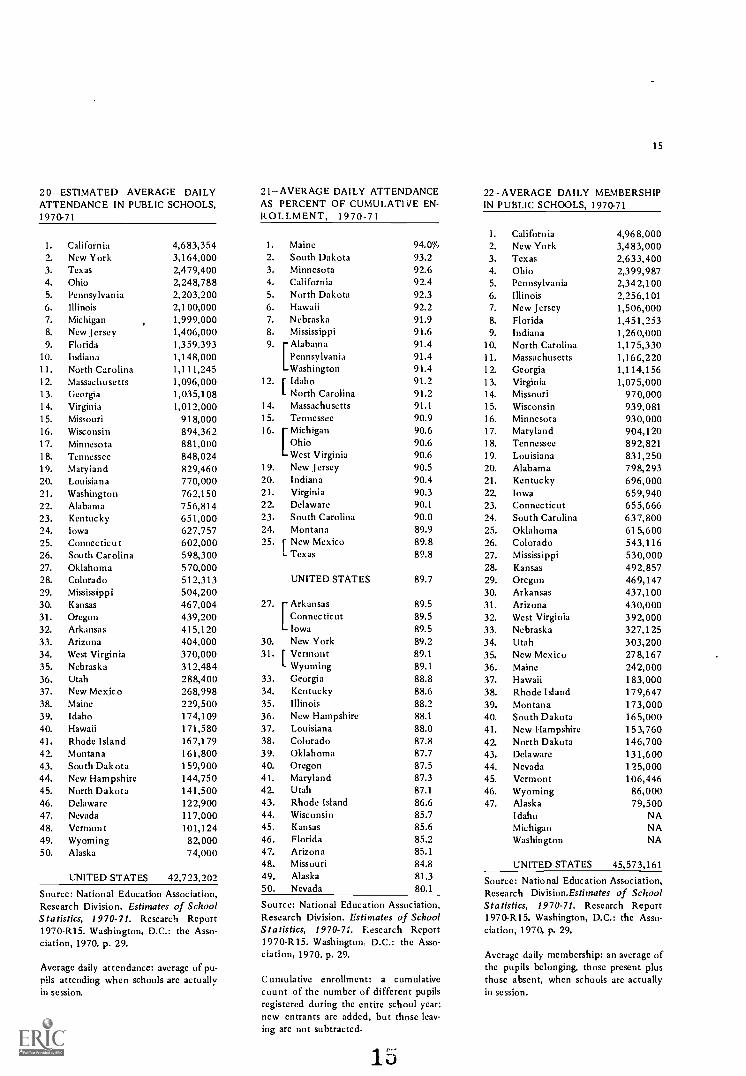
20 ESTIMATED AVERAGE DAILYATTENDANCE IN PUBLIC SCHOOLS,1970-71
1. California 4,683,3542. New York 3,164,0003. Texas 2,479,4004. Ohio 2,248,7885. Pennsylvania 2,203,2006. Illinois 2,100,0007. Michigan 1,999,0008. New Jersey 1,406,0009. Florida 1,359,393
10. Indiana 1,148,00011. North Carolina 1,111,24512. Massachusetts 1,096,00013. Georgia 1,035,10814. Virginia 1,012,00015. Missouri 918,00016. Wisconsin 894,36217. Minnesota 881,00018. Tennessee 848,02419. Maryland 829,46020. Louisiana 770,00021. Washington 762,15022. Alabama 756,81423. Kentucky 651,00024. Iowa 627,75725. Connecticut 602,00026. South Carolina 598,30027. Oklahoma 570,00028. Colorado 512,31329. Mississippi 504,20030. Kansas 467,00431. Oregon 439,20032. Arkansas 415,12033. Arizona 404,00034. West Virginia 370,00035. Nebraska 312,48436. Utah 288,40037. New Mexico 268,99838. Maine 229,50039. Idaho 174,10940. Hawaii 171,58041. Rhode Island 167,17942. Montana 161,80043. South Dakota 159,90044. New Hampshire 144,75045. North Dakota 141,50046. Delaware 122,90047. Nevada 117,00048. Vermont 101,12449. Wyoming 82,00050. Alaska 74,000
UNITED STATES 42,723,202
Source: National Education Association,Research Division. Estimates of SchoolStatistics, 1970-71. Research Report1970-R15. Washington, D.C.: the Asso-ciation, 1970. p. 29.
Average daily attendance: average of pu-pils attending when schools are actuallyin session.
21-AVERAGE DAILY ATTENDANCEAS PERCENT OF CUMULATIVE EN-ROLLMENT, 1970-71
1. Maine 94.0%2. South Dakota 93.23. Minnesota 92.64. California 92.45. North Dakota 92.36. Hawaii 92.27. Nebraska 91.98. Mississippi 91.69. Alabama 91.4
Pennsylvania 91.4Washington 91.4
12. r Idaho 91.21 North Carolina 91.2
14. Massachusetts 91.1
15. Tennessee 90.916. Michigan 90.6
Ohio 90.6West Virginia 90.6
19. New Jersey 90.520. Indiana 90.421. Virginia 90.322. Delaware 90.1
23. South Carolina 90.024. Montana 89.925. r New Mexico 89.8
L Texas 89.8
UNITED STATES 89.7
27. Arkansas 89.5Connecticut 89.5Iowa 89.5
30. New York 89.231. f Vermont 89.1
L Wyoming 89.1
33. Georgia 88.834. Kentucky 88.635. Illinois 88.2
36. New Hampshire 88.1
37. Louisiana 88.038. Colorado 87.839. Oklahoma 87.740. Oregon 87.541. Maryland 87.342. Utah 87.143. Rhode Island 86.644. Wisconsin 85.745. Kansas 85.646. Florida 85.247. Arizona 85.1
48. Missouri 84.849. Alaska 81.350. Nevada 80.1
Source: National Education Association,Research Division. Estimates of SchoolStatistics, 1970-71. Research Report1970-R15. Washington. D.C.: the Asso-ciation, 1970. p. 29.
Cumulative enrollment: a cumulativecount of the number of different pupilsregistered during the entire school year;new entrants are added, but those leav-ing are not subtracted.
15
15
22-AVERAGE DAILY MEMBERSHIPIN PUBLIC SCHOOLS, 1970-71
1. California2. New York3. Texas4. Ohio5. Pennsylvania6. Illinois7. New Jersey8. Florida9. Indiana
10. North Carolina11. Massachusetts12. Georgia13. Virginia14. Missouri15. Wisconsin16. Minnesota17. Maryland18. Tennessee19. Louisiana20. Alabama21. Kentucky22. Iowa23. Connecticut24. South Carolina25. Oklahoma26. Colorado27. Mississippi28. Kansas29. Oregon30. Arkansas31. Arizona32. West Virginia33. Nebraska34. Utah35. New Mexico36. Maine37. Hawaii38. Rhode Island39. Montana40. South Dakota41. New Hampshire42. North Dakota43. Delaware44. Nevada45. Vermont46. Wyoming47. Alaska
IdahoMichiganWashington
4,96 8,0003,483,0002,633,4002,399,9872,342,1002,256,1011,506,0001,451,2531,260,0001,175,3301,166,2201,114,1561,075,000
970,000939,081930,000904,120892,821831,250798,293696,000659,940655,666637,800615,600543,116530,000492,857469,147437,100430,000392,000327,125303,200278,167242,000183,000179,647173,000165,000153,760146,700131,600125,000106,44686,00079,500
NANANA
UNITED STATES 45,573,161
Source: National Education Association,Research Division.Estimates of SchoolStatistics, 1970-71. Research Report1970 -R15. Washington, D.C.: the Asso-ciation, 1970. p. 29.
Average daily membership: an average ofthe pupils belonging, those present plusthose absent, when schools are actuallyin session.
16
23-AVERAGE DAILY ATTENDANCEAS PERCENT OF AVERAGE DAILYMEMBERSHIP, 1970-71
1, South Dakota2. New Mexico3. North Dakota4. Nebraska5. Wyoming6. Wisconsin7. Iowa
MississippiUtah
96.9%96.796.595.595.395.295.195.195.1
10. r Arkansas 95.0I Tennessee 95.0L Vermont 95.0
Alabama 94.8Kansas[ 94.8Maine 94.8
16. Minnesota 94.717. Missouri 94.618. North Carolina 94.519. West Virginia 94.420. r California 94.3
L Colorado 94.322. Texas 94.2
Hampshire 94.1[NewPennsylvania 94.1Virginia 94.1
26. I Arizona 94.0L Massachusetts 94.0
28. Hawaii 93.829. South Carolina 93.830. r Florida 93.7
L Ohio 93.7
UNITED STATES 93.7
32. r Nevada 93.6I Oregon 93.6
34. [ Kentucky 93.5L Montana 93.5
36. r Delaware 93.4L New Jersey 93.4
38. Alaska 93.1Illinois 93.1Rhode Island 93.1
41. Georgia 92.942. r Louisiana 92.6
1 Oklahoma 92.644. Connecticut 91.845. Maryland 91.746. Indiana 91.1
47. New York 90.8Idaho NAMichigan NAWashington NA
Source: National Education Association,Research Division. Estimates of SchoolStatistics, 1970-71. Research Report1970-R15. Washington, D.C.: the Asso-ciation, 1970. p. 29.
Average daily membership: an average ofthe pupils belonging, those present plusthose absent, when schools are actuallyin session.
24-AVERAGE DAILY MEMBERSHIPAS PERCENT OF CUMULATIVE EN-ROLLMENT, 1970 -71
1. Indiana 99.2%2. Maine 99.1
3. Hawaii 98.44. New York 98.25. California 98.06. Minnesota 97.87. Connecticut 97.58. Pennsylvania 97.1
9. r Masscahusetts 96.9L New Jersey 96.9
11. Ohio 96.712. r Delaware 96.5
L North Carolina 96.514. Alabama 96.415. Mississippi 96.316. r Nebraska 96.2
L South Dakota 96.218. Montana 96.119. r South Carolina 96.0
L West Virginia 96.021. Virginia 95.922. North Dakota 95.7
Tennessee 95.7
UNITED STATES 95.7
24. Georgia 95.625. Texas 95.426. Maryland 95.227. Louisiana 95.028. Illinois 94.829. Oklahoma 94.730. Arkansas 94.231. r Iowa 94.1
I. Kentucky 94.133. Vermont 93.8
Hampshire 93.5[NewOregon 93.5Wyoming 93.5
37. r Colorado 93.1L Rhode Island 93.1
39. New Mexico 93.040. Utah 91.641. Florida 91.042. Arizona 90.543. Kansas 90.344. Wisconsin 90.045. Missouri 89,646. Alaska 87.447. Nevada 85.6
Idaho NAMichigan NAWashington NA
Source: National Education Association,Research Division. Estimates of SchoolStatistics, 1970-71. Research Report11970-R15.
Washington, D.C.: the Asso-ciation, 1970. p. 29.
Cumulative enrollment: a cumulativecount of the number of different pupilsregistered during the entire school year;new entrants are added, but those leav-ing are not subtracted.
16
25-AVERAGE DAILY MEMBERSHIPAS PERCENT OF SCHOOL-AGE POPU-LATION, 1 97 0-71
1. Nevada 99.2%2. California 99.03. Oklahoma 95.74. Colorado 94.65. r Maine 94.5
Utah 94.5Wyoming 94.5
8. Vermont 92.69. Indiana 91.8
10. Florida 90.611. Oregon 90.212. Minnesota 89.813. Maryland 89.314. Montana 88.315. Iowa 88.116. Georgia 87.917. Virginia 87.818. Delaware 87.719. Arizona 87.,,20. South Dakota 87.321. 1 New Mexico 86.9
L Tennessee 86.923. Connecticut 86.624. Alaska 86.425. West Virginia 86.2
UNITED STATES 85.9
26. Massachusetts27. North Carolina28. New Jersey29. r Nebraska
I Texas31. r Ohio
L South Carolina33. Arkansas34. New Hampshire35. Alabama36. North Dakota37. Hawaii38. Kentucky
MissouriWisconsin
41. Rhode Island42. Pennsylvania43. Kansas
44. New York45. Illinois46. Mississippi47.
IdahoMichiganWashington
85.685.584.584.184.183.783.783.383.1
83.082.982.881.281.281.280.980.680.479.078.977.677.1NANANA
Source: National Education Association,Research Division. Estimates of SchoolStatistics, 1 970-71.Research Report1970-R15. Washington, D.C.: the Asso-ciation, 1970. p. 29.
School-age population: population age 5through 17, inclusive (excluding armedforces abroad).
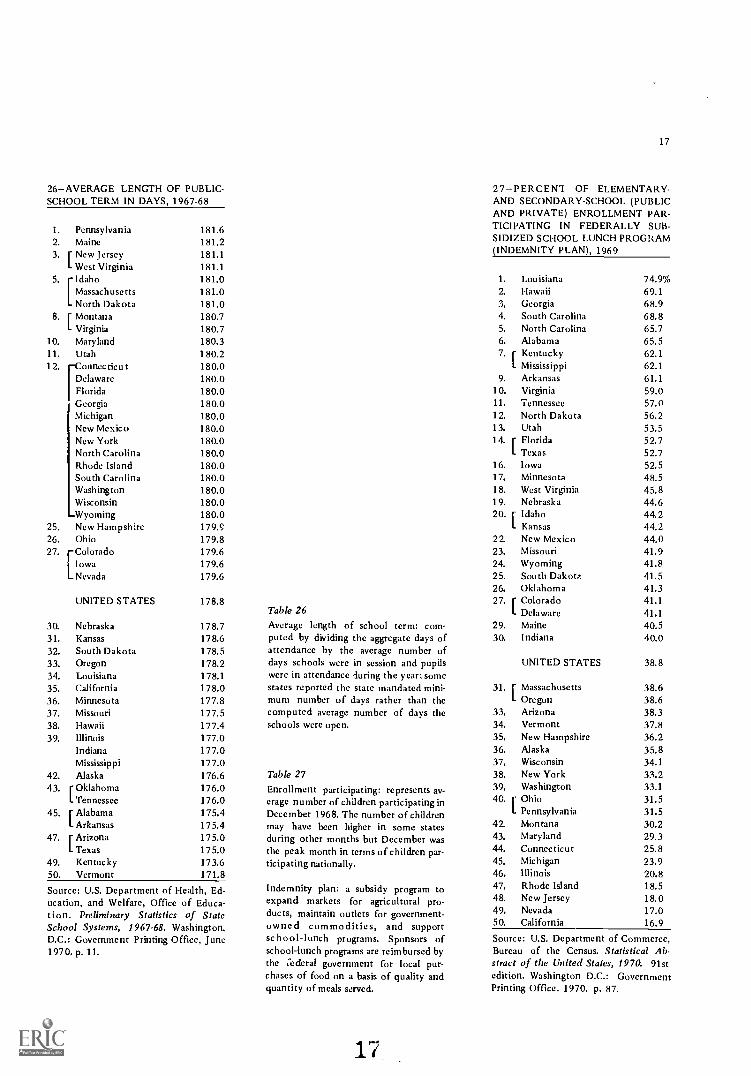
26-AVERAGE LENGTH OF PUBLIC-SCHOOL TERM IN DAYS, 1967-68
1. Pennsylvania 181.62. Maine 181.23. r New Jersey 181.1
L West Virginia 181.15. Idaho 181.0
Massachusetts 1 8 1. 0
North Dakota 181.08. [ Montana 180.7
I Virginia 180.710. Maryland 180.311. Utah 180.212. Connecticut 180.0
Delaware 180.0Florida 180.0Georgia 180.0Michigan 180.0New Mexico 180.0New York 180.0North Carolina 180.0Rhode Island 180.0South Carolina 180.0Washington 180.0Wisconsin 180.0
-Wyoming 180.025. New Hampshire 179.926. Ohio 179.827. Colorado 179.6
Iowa 179.6Nevada 179.6
UNITED STATES 178.8
30. Nebraska 178.731. Kansas 178.632. South Dakota 178.533. Oregon 178.234. Louisiana 178.135. California 178.036. Minnesota 177.837. Missouri 177.538. Hawaii 177.439. Illinois 177.0
Indiana 177.0Mississippi 177.0
42. Alaska 176.643. r Oklahoma 176.0
L Tennessee 176.045. r Alabama 175.4
Arkansas 175.447. r Arizona 175.0
L Texas 175.049. Kentucky 173.650. Vermont 171.8
Source: U.S. Department of Health, Ed-ucation, and Welfare, Office of Educa-tion. Preliminary Statistics of StateSchool Systems, 1967-68. Washington,D.C.: Government Printing Office, June1970. p. 11.
Table 26Average length of school term: com-puted by dividing the aggregate days ofattendance by the average number ofdays schools were in session and pupilswere in attendance during the year; somestates reported the state mandated mini-mum number of days rather than thecomputed average number of days theschools were open.
Table 27Enrollment participating: represents av-erage number of children participating inDecember 1968. The number of childrenmay have been higher in some statesduring other months but December wasthe peak month in terms of children par-ticipating nationally.
Indemnity plan: a subsidy program toexpand markets for agricultural pro-ducts, maintain outlets for government-owned commodities, and supportschool-lunch programs. Sponsors ofschool-lunch programs are reimbursed bythe Cederal government for local pur-chases of food on a basis of quality andquantity of meals served.
17
17
27- PERCENT OF ELEMENTARY-AND SECONDARY-SCHOOL (PUBLICAND PRIVATE) ENROLLMENT PAR-TICIPATING IN FEDERALLY SUB-SIDIZED SCHOOL LUNCH PROGRAM(INDEMNITY PLAN), 1969
1. Louisiana 74.9%2. Hawaii 69.13. Georgia 68.94. South Carolina 68.85. North Carolina 65.76. Alabama 65.57. r Kentucky 62.1
L Mississippi 62.19. Arkansas 61.1
10. Virginia 59.011. Tennessee 57.012. North Dakota 56.213. Utah 53.514. r Florida 52.7
L Texas 52.716. Iowa 52.517. Minnesota 48.518. West Virginia 45.819. Nebraska 44.620. r Idaho 44.2
L Kansas 44.222. New Mexico 44.023. Missouri 41.924. Wyoming 41.825. South Dakota 41.526. Oklahoma 41.327. r Colorado 41.1
L Delaware 41.129. Maine 40.530. Indiana 40.0
UNITED STATES 38.8
31. r Massachusetts 38.6I Oregon 38.6
33. Arizona 38.334. Vermont 37.835. New Hampshire 36.236. Alaska 35.837. Wisconsin 34.138. New York 33.239. Washington 33.140. r Ohio 31.5
L Pennsylvania 31.542. Montana 30.243. Maryland 29.344. Connecticut 25.845. Michigan 23.946. Illinois 20.847. Rhode Island 18.548. New Jersey 18.049. Nevada 17.050. California 16.9
Source: U.S. Department of Commerce,Bureau of the Census. Statistical Ab-stract of the United States, 1970. 91stedition. Washington D.C.: GovernmentPrinting Office, 1970. p. 87.
18
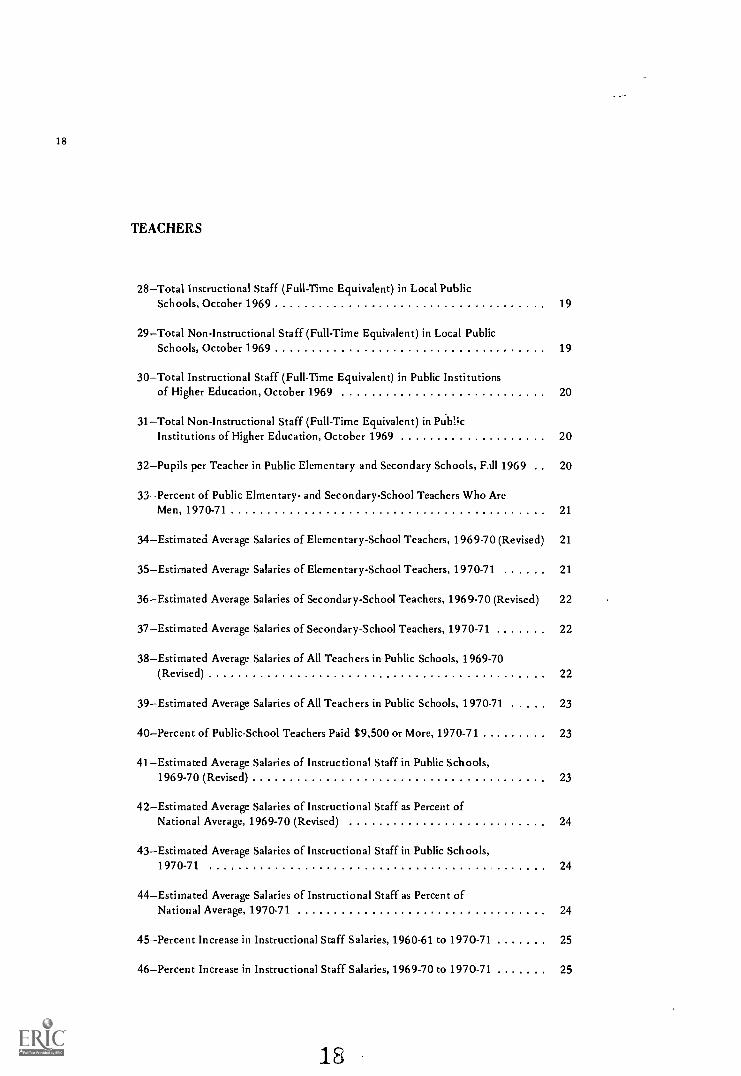
TEACHERS
28Total Instructional Staff (Full-Time Equivalent) in Local PublicSchools, October 1969 19
29Total Non-Instructional Staff (Full-Time Equivalent) in Local PublicSchools, October 1969 19
30Total Instructional Staff (Full-Time Equivalent) in Public Institutionsof Higher Education, October 1969 20
31Total Non-Instructional Staff (Full-Time Equivalent) in Pub! ;cInstitutions of Higher Education, October 1969 20
32Pupils per Teacher in Public Elementary and Secondary Schools, Fall 1969 20
33Percent of Public Elmentary- and Secondary-School Teachers Who AreMen, 1970-71 21
34Estimated Average Salaries of Elementary-School Teachers, 1969-70 (Revised) 21
35Estimated Average Salaries of Elementary-School Teachers, 1970-71 21
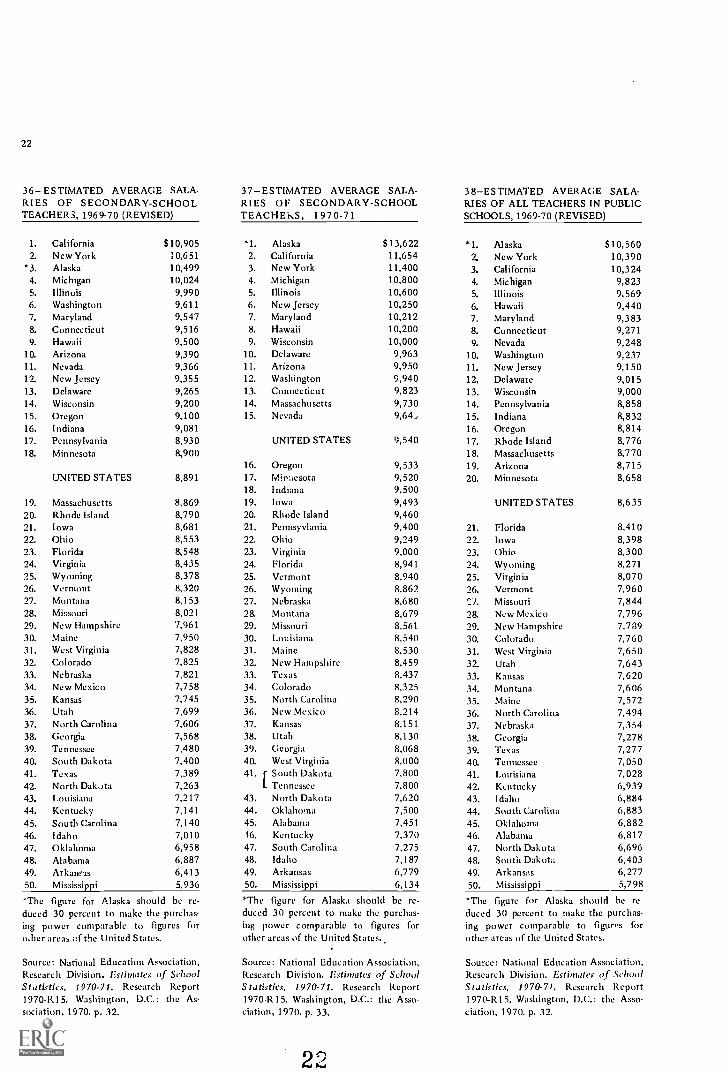
36Estimated Average Salaries of Secondary-School Teachers, 1969-70 (Revised) 22
37Estimated Average Salaries of Secondary-School Teachers, 1970-71 22
38Estimated Average Salaries of All Teachers in Public Schools, 1969-70(Revised) 22
39Estimated Average Salaries of All Teachers in Public Schools, 1970-71 23
40Percent of Public-School Teachers Paid $9,500 or More, 1970-71 23
41Estimated Average Salaries of Instructional Staff in Public Schools,1969-70 (Revised) 23
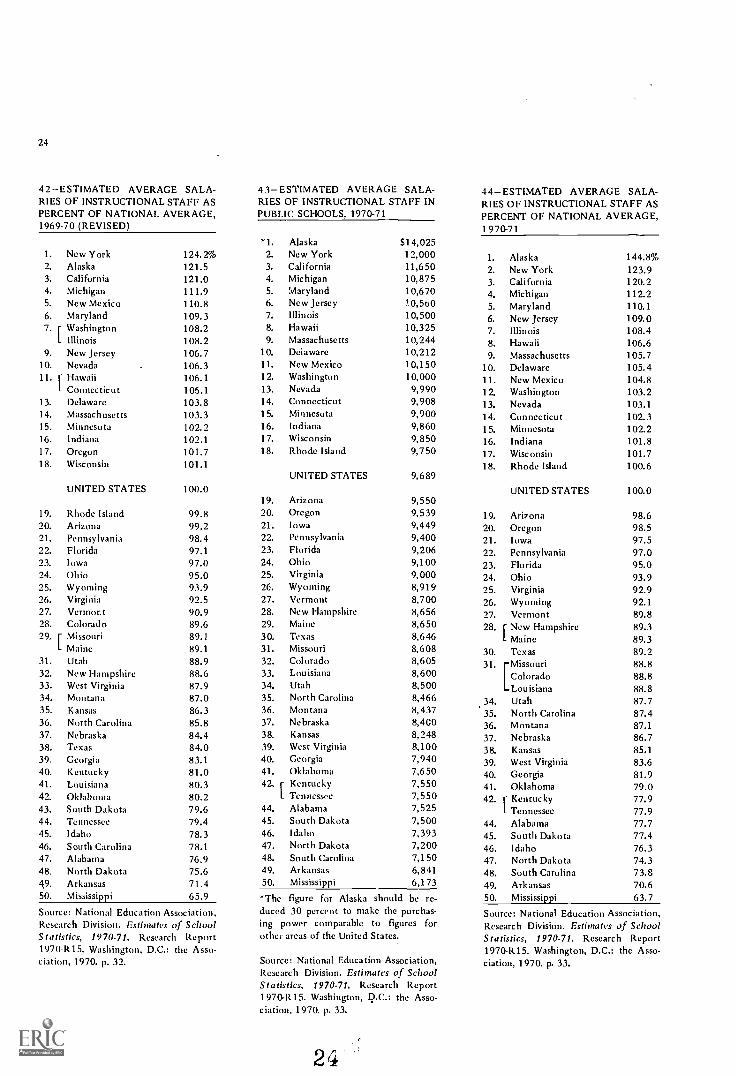
42Estimated Average Salaries of Instructional Staff as Percent ofNational Average, 1969-70 (Revised) 24
43Estimated Average Salaries of Instructional Staff in Public Schools,1970-71 24
44Estimated Average Salaries of Instructional Staff as Percent ofNational Average, 1970-71 24
45Percent Increase in Instructional Staff Salaries, 1960-61 to 1970-71 25
46Percent Increase in Instructional Staff Salaries, 1969-70 to 1970-71 25
18
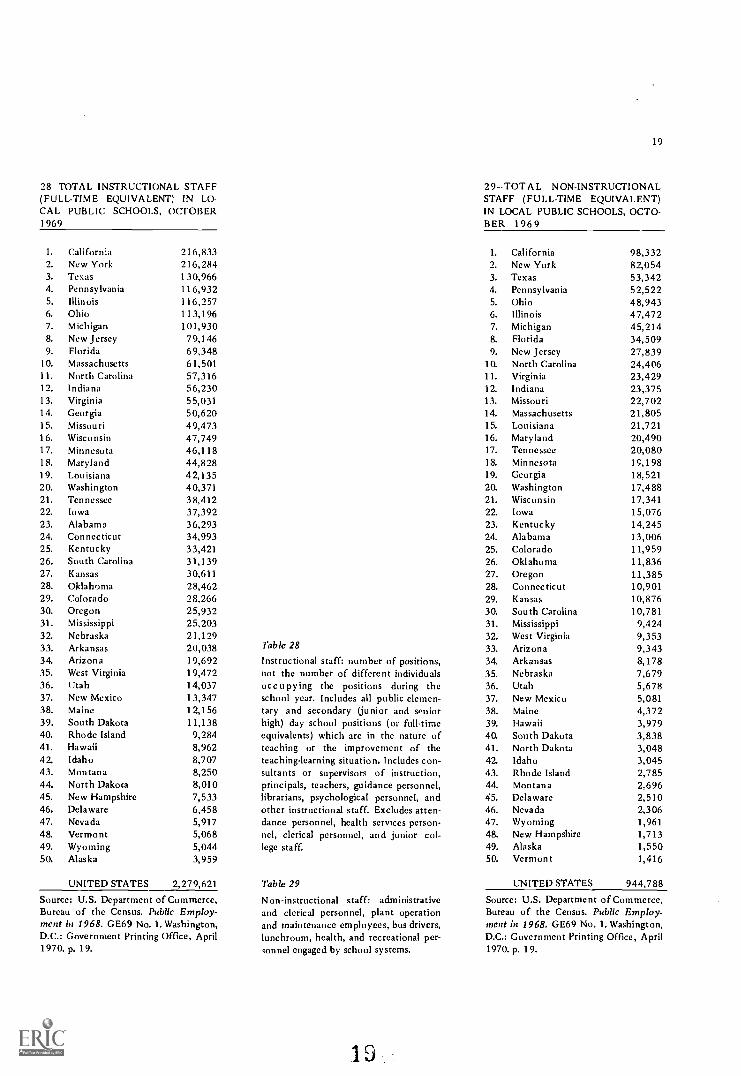
28-TOTAL INSTRUCTIONAL STAFF(FULL-TIME EQUIVALENT) IN LO-CAL1969
PUBLIC SCHOOLS, OCTOBER
1. California 216,8332. New York 216,2843. Texas 130,9664. Pennsylvania 116,9325. Illinois 116,2576. Ohio 113,1967. Michigan 101,9308. New Jersey 79,1469. Florida 69,348
10. Massachusetts 61,50111. North Carolina 57,31612. Indiana 56,23013. Virginia 55,03114. Georgia 50,62015. Missouri 49,47316. Wisconsin 47,74917. Minnesota 46,11818. Maryland 44,82819. Louisiana 42,13520. Washington 40,37121. Tennessee 38,41222. Iowa 37,39223. Alabama 36,29324. Connecticut 34,99325. Kentucky 33,42126. South Carolina 31,13927. Kansas 30,61128. Oklahoma 28,46229. Colorado 28,26630. Oregon 25,93231. Mississippi 25,20332. Nebraska 21,12933. Arkansas 20,03834. Arizona 19,69235. West Virginia 19,47236. Utah 14,03737. New Mexico 13,34738. Maine 12,15639. South Dakota 11,13840. Rhode Island 9,28441. Hawaii 8,96242. Idaho 8,70743. Montana 8,25044. North Dakota 8,01045. New Hampshire 7,53346. Delaware 6,45847. Nevada 5,91748. Vermont 5,06849. Wyoming 5,04450. Alaska 3,959
UNITED STATES 2,279,621
Source: U.S. Department of Commerce,Bureau of the Census. Public Employ-ment in 1968. GE69 No. 1. Washington,D.C.: Government Printing Office, April1970. p. 19.
Table 28
Instructional staff: number of positions,not the number of different individualsoccupying the positions during theschool year. Includes all public elemen-tary and secondary (junior and seniorhigh) day school positions (of full-timeequivalents) which are in the nature ofteaching or the improvement of theteaching-learning situation. Includes con-sultants or supervisors of instruction,principals, teachers, guidance personnel,librarians, psychological personnel, andother instructional staff. Excludes atten-dance personnel, health services person-nel, clerical personnel, and junior col-lege staff.
Table 29
Non-instructional staff: administrativeand clerical personnel, plant operationand maintenance employees, bus drivers,lunchroom, health, and recreational per-sonnel engaged by school systems.
19
29-TOT A L NON-INSTRUCTIONALSTAFF (FULL-TIME EQUIVALENT)IN LOCAL PUBLIC SCHOOLS, OCTO-BER 1969
1. California 98,3322. New York 82,0543. Texas 53,3424. Pennsylvania 52,5225. Ohio 48,9436. Illinois 47,4727. Michigan 45,2148. Florida 34,5099. New Jersey 27,839
10. North Carolina 24,40611. Virginia 23,42912. Indiana 23,37513. Missouri 22,70214. Massachusetts 21,80515. Louisiana 21,72116. Maryland 20,49017. Tennessee 20,08018. Minnesota 19,19819. Georgia 18,52120. Washington 17,48821. Wisconsin 17,34122. Iowa 15,07623. Kentucky 14,24524. Alabama 13,00625. Colorado 11,95926. Oklahoma 11,83627. Oregon 11,38528. Connecticut 10,90129. Kansas 10,87630. South Carolina 10,78131. Mississippi 9,42432. West Virginia 9,35333. Arizona 9,34334. Arkansas 8,17835. Nebraska 7,67936. Utah 5,67837. New Mexico 5,08138. Maine 4,37239. Hawaii 3,97940. South Dakota 3,83841. North Dakota 3,04842. Idaho 3,04543. Rhode Island 2,78544. Montana 2,69645. Delaware 2,51046. Nevada 2,30647. Wyoming 1,96148. New Hampshire 1,71349. Alaska 1,55050. Vermont 1,416
UNITED STATES 944,788
Source: U.S. Department of Commerce,Bureau of the Census. Public Employ.ment in 1968. GE69 No. 1, Washington,D.C.: Government Printing Office, April1970. p. 19.

20
30-TOTAL INSTRUCTIONAL STAFF(FULL-TIME EQUIVALENT) IN PUB-LIC INSTITUTIONS OF HIGHER EDU-CATION, OCTOBER 1969
1. California 37,9332. New York 23,1733. Michigan 15,6174. Texas 15,1375. Illinois 14,1236. Wisconsin 12,3907. Ohio 12,2488. Pennsylvania 9,6209. Florida 9,074
10. Washington 8,91911. Indiana 8,90512. Maryland 8,30913. Minnesota 7,30214. Virginia 7,12115. North Carolina 7,03616. Louisiana 6,72817. Missouri 6,47318. Tennessee 6,02019. New Jersey 5,91920. Colorado 5,62921. Kansas 5,54422. Kentucky 5,39323. Georgia 5,10524. Oregon 5,01225. Iowa 4,66126. Alabama 4,37127. Oklahoma 4,32728. Massachusetts 4,00729. Arizona 3,84330. Nebraska 3,50531. Mississippi 3,45532. Connecticut 2,98333. Utah 2,96734. West Virginia 2,91435. Arkansas 2,80236. New Mexico 2,17037. Montana 2,06438. South Carolina 1,98639. Hawaii 1,97040. North Dakota 1,69741. Idaho 1,39542. South Dakota 1,30443. Rhode Island 1,22144. Maine 1,18045. Nevada 97746. Delaware 94147. New Hampshire 81548. Wyoming 73349. Vermont 57650. Alaska 281
JNITED STATES 308,335
Source: U.S. Department of Commerce,Bureau of the Census. Public Employ-ment in 1968. GE69 Nu. 1. Washington,D.C.: Government Printing Office, April1970. p. 20.
Instructional staff: those engaged inteaching and related academic researchin colleges and universities, includingthose in hospitals, agricultural experi-ment stations, and farms.
31-TOTAL NON-INSTRUCTIONALSTAFF (FULL-TIME EQUIVALENT)I N PUBLIC INSTITUTIONS OFHIGHER EDUCATION, OCTOBER1969
1. California 51,1312. Michigan 30,9613. New York 28,8854. Texas 26,1235. Ohio 25,1666. Illinois 21,7627. Florida 16,6368. Indiana 15,5759. Wisconsin 13,578
10. Washington 12,60311. Virginia 12,39012. Pennsylvania 11,88913. North Carolina 11,86614. Colorado 9,64615. Missouri 9,46416. Georgia 9,30317. Minnesota 9,19818. Louisiana 9,01119. Iowa 8,51320. Oklahoma 8,21021. Tennessee 7,99222. Maryland 7,94523. Oregon 7,67724. Alabama 7,55825. Kentucky 6,97026. New Jersey 6,E8027. Mississippi 6,64128. Kansas 6,58429. Arizona 5,63330. Nebraska 5,00431. South Carolina 4,99732. New Mexico 4,74633. West Virginia 4,65134. Arkansas 4,43235. Connecticut 4,29936. Utah 4,29537. Massachusetts 4,22038. Montana 2,79939. Hawaii 2,77040. North Dakota 2,70441. Maine 2,55042. Delaware 2,41543. New Hampshire 2,29544. South Dakota 2,22045. Idaho 2,02046. Rhode Island 1,83947. Vermont 1,39548. Wyoming 1,37749. Nevada 93450. Alaska 733
UNITED STATES 469,026
Sourer: U.S. Department of Commerce,Bureau of the Census. Public Employ-ment in 1968. GE69 No. 1. Washington,D.C.: Government Printing Office, April1970. p. 20.
Non-instructional staff: cafeteria work-ers, clerical and custodial workers in col-leges and universities, hospitals, agricul-tural experiment stations, and farms.
20
32-PUPILS PER TEACHER IN PUB-LIC ELEMENTARY AND SECON-DARY SCHOOLS, FALL 1969
1. South Dakota 18.72. Vermont 19.13. North Dakota 19.34. Wyoming 19.45. Nebraska 19.56. Maine 19.97. Iowa 20.08. Oregon 20.29. Kansas 20.3
10. New York 20.411. r Connecticut 20.7
1- Montana 20.713. Wisconsin 20.914. Massachusetts 21.115. New Jersey 21.216. Rhode Island 21.317. Maryland 21.418. Oklahoma 21.619. New Hampshire 21.720. r Illinois 21.8
L Minnesota 21.822. Alaska 21.923. Pennsylvania 22.324. [ Idaho 22.6
L Missouri 22.6
UNITED STATES 22.7
26. Colorado 22.8Delaware 22.8
28. Virginia 22.929. r Florida 23.0
L North Carolina 23.031. Michigan 23.232. Arizona 23.433. r Arkansas 23.5
L New Mexico 23.535. r Hawaii 23.6
West Virginia 23.637. r Louisiana 23.7
L South Carolina 23.739. Texas 23.940. [ Kentucky 24.0
Ohio 24.042. r Alabama 24.1
`Calif( rnia 24.144. Indiana 24.245. Washington 24.746. Nevada 24.947. Mississippi 25.448. Georgia 25.949. Tennessee 26.050. Utah 26.6
Source: U.S. Department of Health, Ed-ucation, and Welfare, Office of Educa-tion. Statistics of Public Schools,1969. Washington, D.C.: GovernmentPrinting Office, 1970. p. 21.
21
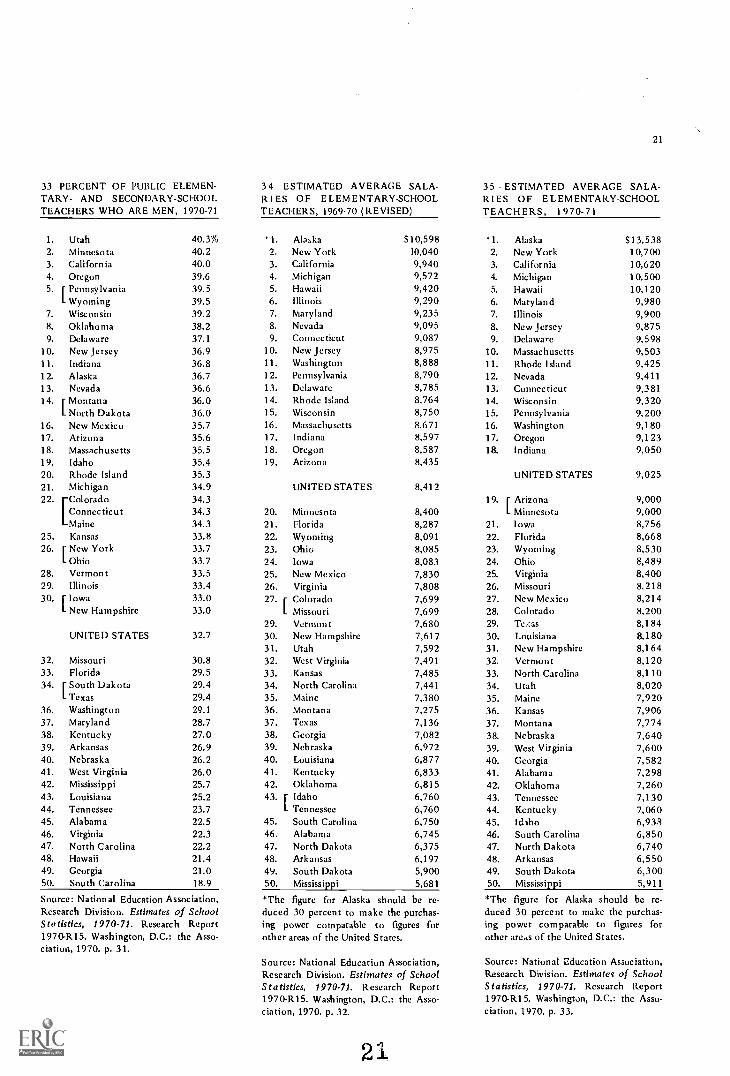
33-PERCENT OF PUBLIC ELEMEN-TARY- AND SECONDARY-SCHOOLTEACHERS WHO ARE MEN, 1970-71
34- ESTIMATED AVERAGE SALA-RIES OF ELEMENTARY- SCHOOLTEACHERS, 1969-70 (REVISED)
3 5- ESTIMATED AVERAGE SALA-RIES OF ELEMENTARY- SCHOOLTEACHERS, 1970 -71
1. Utah 40.3% `1. Alaska S10,598 41. Alaska S13,5382. Minnesota 40.2 2. New York 10,040 2. New York 10,7003. California 40.0 3. California 9,940 3. California 10,6204. Oregon 39.6 4. Michigan 9,572 4. Michigan 10,5005. r Pennsylvania 39.5 5. Hawaii 9,420 5. Hawaii 10,120
L Wyoming 39.5 6. Illinois 9,290 6. Maryland 9,9807. Wisconsin 39.2 7. Maryland 9,235 7. Illinois 9,9008. Oklahoma 38.2 8. Nevada 9,095 8. New Jersey 9,8759. Delaware 37.1 9. Connecticut 9,087 9. Delaware 9,598
10. New Jersey 36.9 10. New Jersey 8,975 10. Massachusetts 9,50311. Indiana 36.8 11. Washington 8,888 11. Rhode Island 9,42512. Alaska 36.7 12. Pennsylvania 8,790 12. Nevada 9,41113. Nevada 36.6 13. Delaware 8,785 13. Connecticut 9,38114. r Montana 36.0 14. Rhode Island 8,764 14. Wisconsin 9,320
L North Dakota 36.0 15. Wisconsin 8,750 15. Pennsylvania 9,20016. New Mexico 35.7 16. Massachusetts 8,671 16. Washington 9,18017. Arizona 35.6 17. Indiana 8,597 17. Oregon 9,12318. Massachusetts 35.5 18. Oregon 8,587 18. Indiana 9,05019. Idaho 35.4 19. Arizona 8,43520. Rhode Island 35.3 UNITED STATES 9,02521. Michigan 34.9 UNITED STATES 8,412
Colorado(Colorado 34.3 19. r Arizona 9,000Connecticut 34.3 20. Minnesota 8,400 L Minnesota 9,000Maine 34.3 21. Florida 8,287 21. Iowa 8,756
25. Kansas 33.8 22. Wyoming 8,091 22. Florida 8,66826. r New York 33.7 23. Ohio 8,085 23. Wyoming 8,530
L Ohio 33.7 24. Iowa 8,083 24. Ohio 8,48928. Vermont 33.5 25. New Mexico 7,830 25. Virginia 8,40029. Illinois 33.4 26. Virginia 7,808 26. Missouri 8.21830. r Iowa 33.0 27. r Colorado 7,699 27. New Mexico 8,214
I- New Hampshire 33.0 L Missouri 7,699 28. Colorado 8,20029. Vermont 7,680 29. Te :as 8,184
UNITED STATES 32.7 30. New Hampshire 7,617 30. Louisiana 8,18031. Utah 7,592 31. New Hampshire 8,164
32. Missouri 30.8 32. West Virginia 7,491 32. Vermont 8,12033. Florida 29.5 33. Kansas 7,485 33. North Carolina 8,11034. r South Dakota 29.4 34. North Carolina 7,441 34. Utah 8,020
I- Texas 29.4 35. Maine 7,380 35. Maine 7,92036. Washington 29.1 36. Montana 7,275 36. Kansas 7,90637. Maryland 28.7 37. Texas 7,136 37. Montana 7,77438. Kentucky 27.0 38. Georgia 7,082 38. Nebraska 7,64039. Arkansas 26.9 39. Nebraska 6,972 39. West Virginia 7,60040. Nebraska 26.2 40. Louisiana 6,877 40. Georgia 7,58241. West Virginia 26.0 41. Kentucky 6,833 41. Alabama 7,29842. Mississippi 25.7 42. Oklahoma 6,815 42. Oklahoma 27,26043. Louisiana 25.2 43. r Idaho 6,760 43. Tennessee 7,13044. Tennessee 23.7 L Tennessee 6,760 44. Kentucky 7,06045. Alabama 22.5 45. South Carolina 6,750 45. Idaho 6,93.346. Virginia 22.3 46. Alabama 6,745 46. South Carolina 6,85047. North Carolina 22.2 47. North Dakota 6,375 47. North Dakota 6,74048. Hawaii 21.4 48. Arkansas 6,197 48. Arkansas 6,55049. Georgia 21.0 49. South Dakota 5,900 49. South Dakota 6,30050. South Carolina 18.9 50. Mississippi 5,681 50. Mississippi 5,911
Source: National Education Association,Research Division. Estimates of SchoolStatistics, 1970-71. Research Report1970-R15. Washington, D.C.: the Asso-ciation, 1970. p. 31.
*The figure for Alaska should be re-duced 30 percent to make the purchas-ing power comparable to figures forother areas of the United States.
Source: National Education Association,Research Division. Estimates of SchoolStatistics, 1970.71. Research Report1970-R15. Washington, D.C.: the Asso-ciation, 1970. p. 32.
21
*The figure for Alaska should be re-duced 30 percent to make the purchas-ing power comparable to figures forother areas of the United States.
Source: National ;Education Association,Research Division. Estimates of SchoolStatistics, 1970-71. Research Report1970-R15. Washington, D.C.: the Asso-ciation, 1970. p. 33.
22
36-ESTIMATED AVERAGE SALA. 37-ESTIMATED AVERAGE SALA-RIES OF SECONDARY-SCHOOLTEACHERS, 1969-70 (REVISED)
RIES OF SECONDARY-SCHOOLTEACHERS, 1970 -71
1. California $10,905 *1. Alaska $13,6222. New York 10,651 2. California 11,654
Alaska 10,499 3. New York 11,4004. Michigan 10,024 4. Michigan 10,8005. Illinois 9,990 5. Illinois 10,6006. Washington 9,611 6. New Jersey 10,2507. Maryland 9,547 7. Maryland 10,2128. Connecticut 9,516 8. Hawaii 10,2009. Hawaii 9,500 9. Wisconsin 10,000
10. Arizona 9,390 10. Delaware 9,96311. Nevada 9,366 11. Arizona 9,95012. New Jersey 9,355 12. Washington 9,94013. Delaware 9,265 13. Connecticut 9,82314. Wisconsin 9,200 14. Massachusetts 9,73015. Oregon 9,100 15. Nevada 9,64,16. Indiana 9,08117. Pennsylvania 8,930 UNITED STATES 9,54018. Minnesota 8,900
16. Oregon 9,533UNITED STATES 8,891 17. Mits:wsota 9,520
18. Indiana 9,50019. Massachusetts 8,869 19. Iowa 9,49320. Rhode Island 8,790 20. Rhode Island 9,46021. Iowa 8,681 21. Pennsyvlania 9,40022. Ohio 8,553 22. Ohio 9,24923. Florida 8,548 23. Virginia 9,00024. Virginia 8,435 24. Florida 8,94125. Wyoming 8,378 25. Vermont 8,94026. Vermont 8,320 26. Wyoming 8,86227. Montana 8,153 27. Nebraska 8,68028. Missouri 8,021 28. Montana 8,67929. New Hampshire 7,961 29. Missouri 8,56130. Maine 7,950 30. Louisiana 8,54031. West Virginia 7,828 31. Maine 8,53032. Colorado 7,825 32. New Hampshire 8,45933. Nebraska 7,821 33. Texas 8,43734. New Mexico 7,758 34. Colorado 8,32535. Kansas 7,745 35. North Carolina 8,29036. Utah 7,699 36. New Mexico 8,21437. North Carolina 7,606 37. Kansas 8,151
38. Georgia 7,568 38. Utah 8,13039. Tennessee 7,480 39. Georgia 8,06840. South Dakota 7,400 40. West Virginia 8,00041. Texas 7,389 41. r South Dakota 7,80042. North Dakota 7,263 L Tennessee 7,80043. Louisiana 7,217 43. North Dakota 7,62044. Kentucky 7,141 44. Oklahoma 7,50045. South Carolina 7,140 45. Alabama 7,45146. Idaho 7,010 36. Kentucky 7,37047. Oklahoma 6,958 47. South Carolina 7,27548. Alabama 6,887 48. Idaho 7,18749. Arkansas 6,413 49. Arkansas 6,77950. Mississippi 5,936 50. Mississippi 6,134
The figure for Alaska should be re-duced 30 percent to make the purchas-ing power comparable to figures forother areas of the United States.
Source: National Education Association,Research Division. Estimates of SchoolStatistics, 1970-71. Research Report1970-R15. Washington, D.C.: the As-sociation, 1970. p. 32.
*The figure for Alaska should be re-duced 30 percent to make the purchas-ing power comparable to figures forother areas of the United States.
Source: National Education Association,Research Division. Estimates of SchoolStatistics, 1970-71. Research Report1970-R15. Washington, D.C.: the Asso-ciation, 1970. p. 33.
2
38-ESTIMATED AVERAGE SALA-RIES OF ALL TEACHERS IN PUBLICSCHOOLS, 1969-70 (REVISED)
*1. Alaska $10,5602. New York 10,3903. California 10,3244. Michigan 9,8235. Illinois 9,5696. Hawaii 9,4407. Maryland 9,3838. Connecticut 9,2719. Nevada 9,248
10. Washington 9,23711. New Jersey 9,15012. Delaware 9,01513. Wisconsin 9,00014. Pennsylvania 8,85815. Indiana 8,83216. Oregon 8,81417. Rhode Island 8,77618. Massachusetts 8,77019. Arizona 8,71520. Minnesota 8,658
UNITED STATES 8,635
21. Florida 8,410Iowa 8,398
23. Ohio 8,30024. Wyoming 8,271
25. Virginia 8,07026. Vermont 7,960
Missouri 7,84428. New Mexico 7,79629. New Hampshire 7,73930. Colorado 7,76031. West Virginia 7,65032. Utah 7,64333. Kansas 7,62034. Montana 7,60635. Maine 7,57236. North Carolina 7,49437. Nebraska 7,35438. Georgia 7,27839. Texas 7,27740. Tennessee 7,05041. Louisiana 7,02842. K,ntucky 6,93943. Idaho 6,88444. South Carolina 6,88345. Oklahoma 6,88246. Alabama 6,81747. North Dakota 6,69648. South Dakota 6,40349. Arkansas 6,27750. Mississippi 5,798
The figure for Alaska should be re-
duced 30 percent to snake the purchas-ing power comparable to figures forother areas of the United States.
Source: National Education Association,Research Division. Estimates of SchoolStatistics, 1970-71. Research Report1970 -R15. Washington, D.C.: the Asso-ciation, 1970. p. 32.
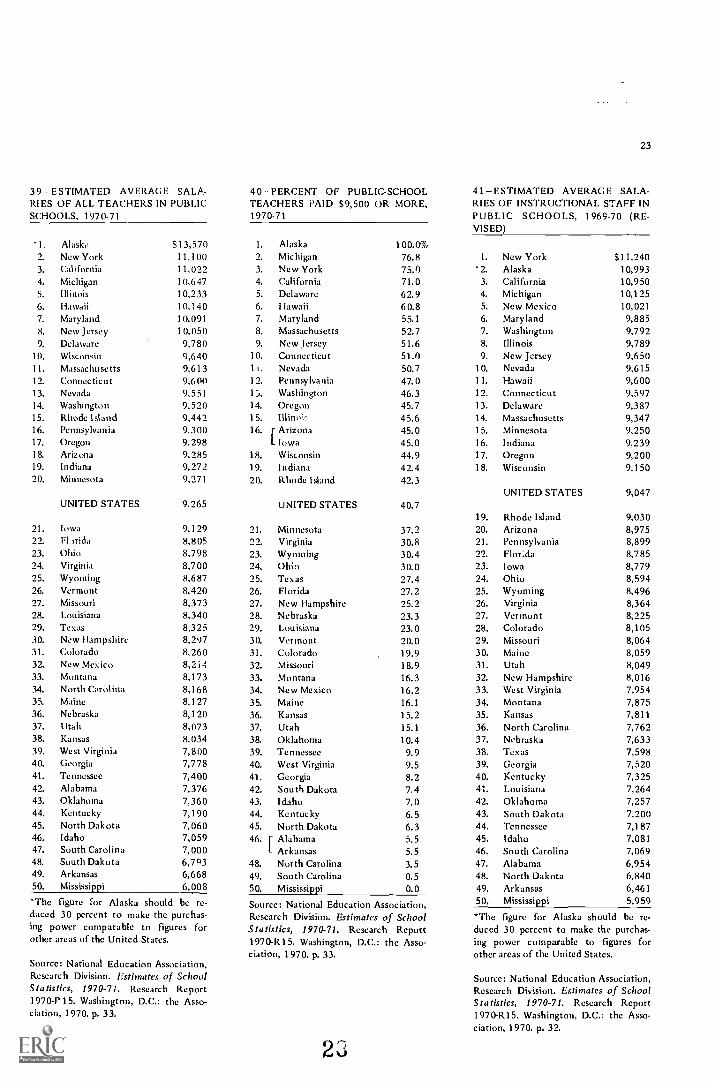
39- ESTIMATED AVERAGE SALA-RIES OF ALL TEACHERS IN PUBLICSCHOOLS, 1970-71
'1. Alaska S13,5702. New York 11,1003. California 11,0224. Michigan 10,6475. Illinois 10,2336. Hawaii 10,1407. Maryland 10,0918. New Jersey 10,0509. Delaware 9,780
10. Wisconsin 9,64011. Massachusetts 9,61312. Connecticut 9,60013. Nevada 9,55114. Washington 9,52015. Rhode Island 9,44216. Pennsylvania 9,30017. Oregon 9,29818. Arizona 9,28519. Indiana 9,27220. Minnesota 9,271
UNITED STATES 9,265
21. Iowa 9,12922. Florida 8,80523. Ohio 8,79824. Virginia 8,70025. Wyoming 8,68726. Vermont 8,42027. Missouri 8,37328. Louisiana 8,34029. Texas 8,32530. New Hampshire 8,29731. Colorado 8,26032. New Mexico 8,2i433. Montana 8,17334. North Carolina 8,16835. Maine 8,1 2736. Nebraska 8,1 2037. Utah 8,07338. Kansas 8,03439. West Virginia 7,80040. Georgia 7,77841. Tennessee 7,40042. Alabama 7,37643. Oklahoma 7,36044. Kentucky 7,19045. North Dakota 7,06046. Idaho 7,05947. South Carolina 7,00048. South Dakota 6,79349. Arkansas 6,66850. Mississippi 6,008
'The figure for Alaska should be re-duced 30 percent to make the purchas-ing power comparable to figures forother areas of the United States.
Source: National Education Association,Research Division. Estimates of SchoolStatistics, 1970-71. Research Report1970-F 15. Washington, D.C.: the Asso-ciation, 1970, p. 33.
4 0 -PERCENT OF PUBLIC-SCHOOLTEACHERS PAID S9,500 OR MORE,1970-71
1. Alaska2. Michigan3. New York4. California5. Delaware6. Hawaii7. Maryland8. Massachusetts9. New Jersey
10. Connecticut1 i Nevada12. Pennsylvania13. Washington14. Oregon1 5, Illinoir.16. r Arizona
L Iowa18. Wisconsin19. Indiana20. Rhode Island
100.0%76.875.071.062.960.855.1
52.751.651.050.747.046.345.745.645.045.044.942.442.3
UNITED STATES 40.7
21. Minnesota22. Virginia23. Wyoming24, Ohio25. Texas26. Florida27. New Hampshire28. Nebraska29. Louisiana30. Vermont31. Colorado32. Missouri33. Montana34. New Mexico35. Maine36. Kansas
37. Utah38. Oklahoma39. Tennessee40. West Virginia41. Georgia42. South Dakota43. Idaho44. Kentucky45. North Dakota46. r Alabama
I- Arkansas48. North Carolina49. South Carolina50. Mississippi
37.230.830.430.027.427.225.223.323.020.019.918.916.316.216.1
15.215.1
10.49.99.58.27.47.06.56.35.55.53.50.50.0
Source: National Education Association,Research Division, Estimates of SchoolStatistics, 1970-71. Research Report1970-R15. Washington, D.C.: the Asso-ciation, 1970. p. 33.
23
41-ESTIMATED AVERAGE SALA-RIES OF INSTRUCTIONAL STAFF INPUBLIC SCHOOLS, 1969-70 (RE-VISED)
1. New York S11,240*2. Alaska 10,9933. California 10,9504. Michigan 10,1255. New Mexico 10,0216. Maryland 9,8857. Washington 9,7928. Illinois 9,7899. New Jersey 9,650
10. Nevada 9,61511. Hawaii 9,60012. Connecticut 9,59713. Delaware 9,38714. Massachusetts 9,34715. Minnesota 9,25016. Indiana 9,23917. Oregon 9,20018. Wisconsin 9,150
UNITED STATES 9,047
19. Rhode Island20. Arizona21. Pennsylvania22. Florida23. Iowa24. Ohio25. Wyoming26. Virginia27. Vermont28. Colorado29. Missouri30. Maine31. Utah32. New Hampshire33. West Virginia34. Montana35. Kansas
36. North Carolina37. Nebraska38. Texas39. Georgia40. Kentucky41. Louisiana42. Oklahoma43. South Dakota44. Tennessee45. Idaho46. South Carolina47. Alabama48. North Dakota49. Arkansas50. Mississippi
9,0308,9758,8998,7858,7798,5948,4968,3648,2258,1058,0648,0598,0498,0167,9547,8757,8117,7627,6337,5987,5207,3257,2647,2577,2007,1877,0817,0696,9546,8406,4615,959
*The figure for Alaska should be re-duced 30 percent to make the purchas-ing power comparable to figures forother areas of the United States.
Source: National Education Association,Research Division. Estimates of SchoolStatistics, 1970-71. Research Report1970-R15. Washington, D.C.: the Asso-ciation, 1970. p. 32.
24
42- ESTIMATED AVERAGE SALA- 43- ESTIMATED AVERAGE SALA- 44- ESTIMATED AVERAGE SALA-RIES OF INSTRUCTIONAL STAFF ASPERCENT OF NATIONAL AVERAGE,1969-70 (REVISED)
RIES OF INSTRUCTIONAL STAFF INPUBLIC SCHOOLS, 1970-71
RIES OF INSTRUCTIONAL STAFF ASPERCENT OF NATIONAL AVERAGE,1 970-71
*1. Alaska $14,0251. New York 124.2% 2. New York 12,000 1. Alaska 144.8%2. Alaska 121.5 3. California 11,650 2. New York 123.93. California 121.0 4. Michigan 10,875 3. California 120.24. Michigan 111.9 5. Maryland 10,670 4. Michigan 112.25. New Mexico 110.8 6. New Jersey 10,560 5. Maryland 110.16. Maryland 109.3 7. Illinois 10,500 6. New Jersey 109.07. r Washington 108.2 8. Hawaii 10,325 7. Illinois 108.4
L Illinois 108.2 9. Massachusetts 10,244 8. Hawaii 106.69. New Jersey 106.7 10. Delaware 10,212 9. Massachusetts 105.7
10. Nevada 106.3 11. New Mexico 10,150 10. Delaware 105.4
11.{Hawaii 106.1 12. Washington 10,000 11. New Mexico 104.8Connecticut 106.1 13. Nevada 9,990 12. Washington 103.2
13. Delaware 103.8 14. Connecticut 9,908 13. Nevada 103.114. Massachusetts 103.3 15. Minnesota 9,900 14. Connecticut 102.315. Minnesota 102.2 16. Indiana 9,860 15. Minnesota 102.216. Indiana 102.1 17. Wisconsin 9,850 16. Indiana 101.817. Oregon 101.7 18. Rhode Island 9,750 17. Wisconsin 101.718. Wisconsin 101.1 18. Rhode Island 100.6
UNITED STATES 9,689UNITED STATES 100.0 UNITED STATES 100.0
19. Arizona 9,55019. Rhode Island 99.8 20. Oregon 9,539 19. Arizona 98.620. Arizona 99.2 21. Iowa 9,449 20. Oregon 98.521. Pennsylvania 98.4 22. Pennsylvania 9,400 21. Iowa 97.522. Florida 97.1 23. Florida 9,206 22. Pennsylvania 97.023. Iowa 97.0 24. Ohio 9,100 23. Florida 95.024. Ohio 95.0 25. Virginia 9,000 24. Ohio 93.925. Wyoming 93.9 26. Wyoming 8,919 25. Virginia 92.926. Virginia 92.5 27. Vermont 8,700 26. Wyoming 92.127. Vermont 90.9 28. New Hampshire 8,656 27. Vermont 89.828. Colorado 89.6 29. Maine 8,650 28. r New Hampshire 89.329. f Missouri 89.1 30. Texas 8,646 Maine 89.3
I- Maine 89.1 31. Missouri 8,608 30. Texas 89.231. Utah 88.9 32. Colorado 8,605 88.832. New Hampshire 88.6 33. Louisiana 8,600
[MissouriColorado 88.8
33. West Virginia 87.9 34. Utah 8,500 Louisiana 88.834. Montana 87.0 35. North Carolina 8,466 34. Utah 87.735. Kansas 86.3 36. Montana 8,437 35. North Carolina 87.436. North Carolina 85.8 37. Nebraska 8,400 36. Montana 87.137. Nebraska 84.4 38. Kansas 8,248 37. Nebraska 86.738. Texas 84.0 39. West Virginia 8,100 38. Kansas 85.139. Georgia 83.1 40. Georgia 7,940 39. West Virginia 83.640. Kentucky 81.0 41. Oklahoma 7,650 40. Georgia 81.941. Louisiana 80.3 42. r Kentucky 7,550 41. Oklahoma 79.042. Oklahoma 80.2 L Tennessee 7,550 42. r Kentucky 77.943. South Dakota 79.6 44. Alabama 7,525 1. Tennessee 77.944. Tennessee 79.4 45. South Dakota 7,500 44. Alabama 77.745. Idaho 78.3 46. Idaho 7,393 45. South Dakota 77.446. South Carolina 78.1 47. North Dakota 7,200 46. Idaho 76.347. Alabama 76.9 48. South Carolina 7,150 47. North Dakota 74.348. North Dakota 75.6 49. Arkansas 6,841 48. South Carolina 73.849. Arkansas 71.4 50. Mississippi 6,173 49. Arkansas 70.650. Mississippi 65.9 The figure for Alaska should be re- 50. Mississippi 63.7Source: National Education Association,Research Division. Estimates of SchoolStatistics, 1970-71. Research Report1970-1(15. Washington, D.C.: the Asso-ciation, 1970. p. 32.
duced 30 percent to make the purchas-ing power comparable to figures forother areas of the United States.
Source: National Education Association,Research Division. Estimates of SchoolStatistics, 1970-71. Research Report1 970-R15. Washington, D.C.: the Asso-ciation, 1970. p. 33.
24
Source: National Education Association,Research Division. Estimates of SchoolStatistics, 1970-71. Research Report1970-R15. Washington, D.C.: the Asso-ciation, 1970. p. 33.
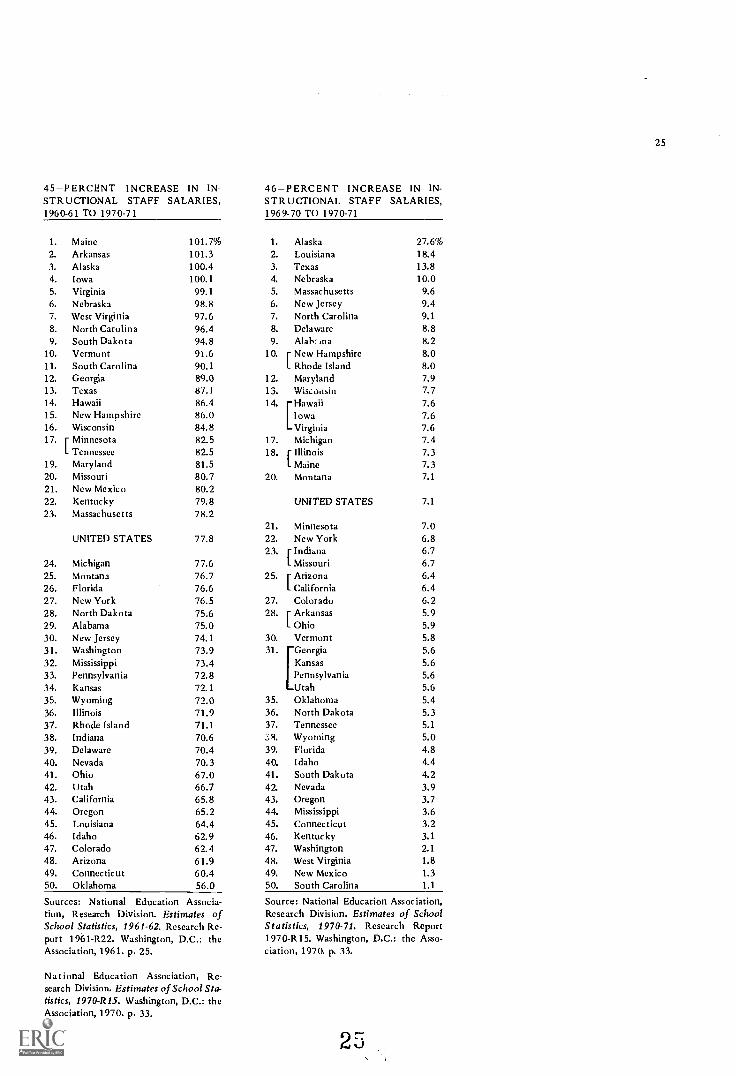
45-PERCENT INCREASE IN IN-STRUCTIONAL STAFF SALARIES,1960-61 TO 1970-71
1. Maine2. Arkansas3. Alaska4. Iowa5. Virginia6. Nebraska7. West Virginia8. North Carolina9. South Dakota
10. Vermont11. South Carolina12. Georgia13. Texas14. Hawaii15. New Hampshire16. Wisconsin17. r Minnesota
L Tennessee19. Maryland20. Missouri21. New Mexico22. Kentucky23. Massachusetts
24.25.
26.27.
28.
29.
30.31.32.
33.34.35.36.37.38.39.40.41.42.43.44.45.46.47.48.
49.50.
101.7%101.3100.4100.199.198.897.696.494.891.690.189.087.186.486.084.882.582.581.580.780.279.878.2
UNITED STATES 77.8
MichiganMontanaFloridaNew YorkNorth DakotaAlabamaNew JerseyWashingtonMississippiPennsylvaniaKansas
WyomingIllinoisRhode IslandIndianaDelawareNevadaOhioUtahCaliforniaOregonLouisianaIdahoColoradoArizonaConnecticutOklahoma
77.676.776.676.575.675.074.1
73.973.472.872.172.071.971.170.670.470.367.066.765.865.264.462.962.461.960.456.0
Sources: National Education Associa-tion, Research Division. Estimates ofSchool Statistics, 1961-62. Research Re-port 1961-R22. Washington, D.C.: theAssociation, 1961. p. 25.
National Education Association, Re-search Division. Estimates of School Sta-tistics, 1970-R15. Washington, D.C.: theAssociation, 1970. p. 33.
46-PERCENT INCREASE IN IN-STRUCTIONAL STAFF SALARIES,1969-70 TO 1970-71
1. Alaska 27.6%2. Louisiana 18.43. Texas 13.84. Nebraska 10.05. Massachusetts 9.66. New Jersey 9.47. North Carolina 9.1
8. Delaware 8.89. Alai,: ma 8.2
10. r New Hampshire 8.0L Rhode Island 8.0
12. Maryland 7.913. Wisconsin 7.7
14. Hawaii 7.6Iowa 7.6Virginia 7.6
17. Michigan 7.418. r Illinois 7.3
I- Maine 7.320. Montana 7.1
UNITED STATES 7.1
21. Minnesota 7.022. New York 6.823. r Indi.na 6.7
I- Missouri 6.725. r Arizona 6.4
L California 6.427. Colorado 6.228. r Arkansas 5.9
L Ohio 5.930. Vermont 5.831. Georgia 5.6
Kansas 5.6Pennsylvania 5.6Utah 5.6
35. Oklahoma 5.436. North Dakota 5.337. Tennessee 5.1
A. Wyoming 5.039. Florida 4.840. Idaho 4.441. South Dakota 4.242. Nevada 3.943. Oregon 3.744. Mississippi 3.645. Connecticut 3.246. Kentucky 3.1
47. Washington 2.1
48. West Virginia 1.849. New Mexico 1.3
50. South Carolina 1.1
Source: National Education Association,Research Division. Estimates of SchoolStatistics, I 970-71. Research Report1970-R15. Washington, D.C.: the Asso-ciation, 1970. p. 33.
25
26
EDUCATIONAL ATTAINMENT
47Median School Years Completed by Persons 25 Years Old and Older, 1960 . . 27
48Percent of Population 14 Years Old and Older Illiterate in 1960 27
49Public High-School Graduates in 1969-70 as Percent of Public-SchoolNinth-Graders in Fall 1966 28
50Percent Increase in Number of Public High-School Graduates, 1964-65 to1969-70 28
26
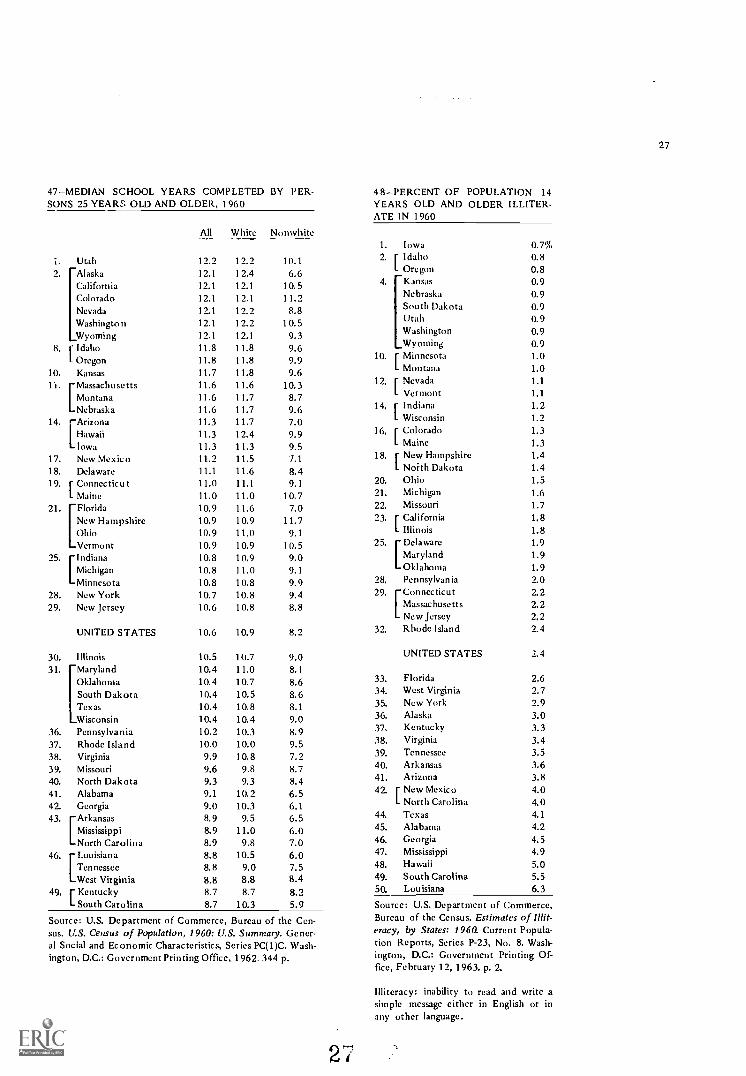
47-MEDIAN SCHOOL YEARS COMPLETED BY PER-SONS 25 YEARS OLD AND OLDER, 1960
1.
2.
UtahAlaskaCaliforniaColoradoNevadaWashingtonWyoming
All
12.212.1
12.112.1
12.1
12.112.1
White Nonwhite
12.212.412.112.112.212.212.1
10.16.6
10.511.28.8
10.59.3
8. r Idaho 11.8 11.8 9.6L Oregon 11.8 11.8 9.9
10. Kansas 11.7 11.8 9.61'i. Massachusetts 11.6 11.6 10.3
[Montana11.6 11.7 8.7
Nebraska 11.6 11.7 9.614. Arizona 11.3 11.7 7.0
Hawaii 11.3 12.4 9.9Iowa 11.3 11.3 9.5
17. New Mexico 11.2 11.5 7.1
18. Delaware 11.1 11.6 8.419. r Connecticut 11.0 11.1 9.1
L Maine 11.0 11.0 10.721. Florida 10.9 11.6 7.0
New Hampshire 10.9 10.9 11.7Ohio 10.9 11.0 9.1Vermont 10.9 10.9 10.5
25. Indiana 10.8 10.9 9.0Michigan 10.8 11.0 9.1Minnesota 10.8 10.8 9.9
28. New York 10.7 10.8 9.429. New Jersey 10.6 10.8 8.8
UNITED STATES 10.6 10.9 8.2
30. Illinois 10.5 10.7 9.031. Maryland 10.4 11.0 8.1
Oklahoma 10.4 10.7 8.6South Dakota 10.4 10.5 8.6Texas 10.4 10.8 8.1Wisconsin 10.4 10.4 9.0
36. Pennsylvania 10.2 10.3 8.937. Rhode Island 10.0 10.0 9.538. Virginia 9.9 10.8 7.239. Missouri 9.6 9.8 8.740. North Dakota 9.3 9.3 8.441. Alabama 9.1 10.2 6.542. Georgia 9.0 10.3 6.1
8.9 9.5 6.5[ArkansasMississippi 8.9 11.0 6.0North Carolina 8.9 9.8 7.0
46. Louisiana 8.8 10.5 6.0
[Tennessee8.8 9.0 7.5
West Virginia 8.8 8.8 8.449. r Kentucky 8.7 8.7 8.2
L South Carolina 8.7 10.3 5.9
Source: U.S. Department of Commerce, Bureau of the Cen-sus. U.S. Census of Population, 1960: U.S. Summary. Gener-al Social and Economic Characteristics, Series PC(1)C. Wash-ington, D.C.: Government Printing Office, 1962. 344 p.
48-PERCENT OF POPULATION 14YEARS OLD AND OLDER ILLITER-ATE IN 1960
1. Iowa2. r Idaho
L Oregon4. Kansas
NebraskaSouth DakotaUtahWashingtonWyoming
10. 1 MinnesotaL Montana
12. r NevadaI- Vermont
14. r IndianaL Wisconsin
16. r ColoradoL Maine
18. r New HampshireL North Dakota
20. Ohio21. Michigan22. Missouri23. r California
L Illinois25. Delaware
MarylandOklahoma
28. Pennsylvania29. Connecticut
MassachusettsNew Jersey
32. Rhode Island
0.7%0.80.80.90.90.90.90.90.91.01.01.1
1.1
1.21.21.31.31.41.41.51.61.71.81.81.91.91.92.02.22.22.22.4
UNITED STATES 2.4
33. Florida34. West Virginia35. New York36. Alaska37. Kentucky38. Virginia39. Tennessee40. Arkansas41. Arizona42. r New Mexico
L North Carolina44. Texas45. Alabama46. Georgia47. Mississippi48. Hawaii49. South Carolina50. Louisiana
2.62.72.93.03.33.43.53.63.84.04.04.14.24.54.95.05.56.3
Source: U.S. Department of Commerce,Bureau of the Census. Estimates of Illit-eracy, by States: 1960. Current Popula-tion Reports, Series P-23, No. 8. Wash-ington, D.C.: Government Printing Of-fice, February 12, 1963. p. 2.
Illiteracy: inability to read and write asimple message either in English or inany other language.
27
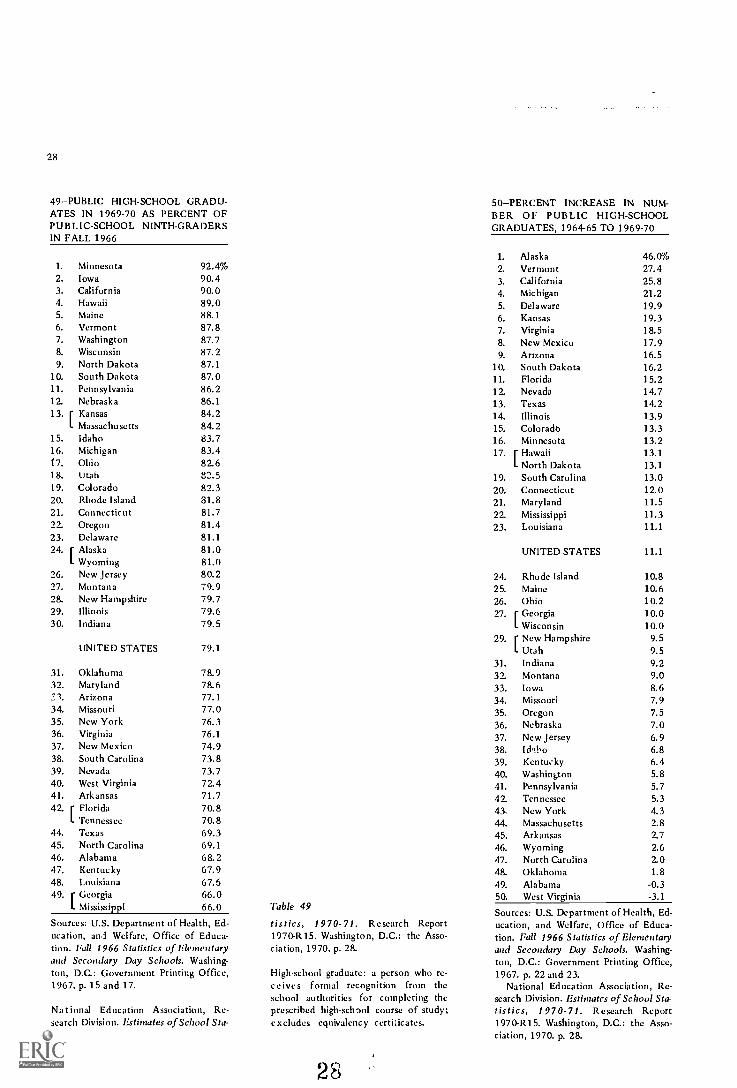
28
49-PUBLIC HIGH-SCHOOL GRADU-ATES IN 1969-70 AS PERCENT OFPUBLIC-SCHOOL NINTH-GRADERSIN FALL 1966
1. Minnesota 92.4%2. Iowa 90.43. California 90.04. Hawaii 89.05. Maine 88.16. Vermont 87.87. Washington 87.78. Wisconsin 87.29. North Dakota 87.1
10. South Dakota 87.011. Pennsylvania 86.212. Nebraska 86.113. r Kansas 84.2
L Massachusetts 84.215. Idaho 83.716. Michigan 83.417. Ohio 82.618. Utah 82.519. Colorado 82.320. Rhode Island 81.821. Connecticut 81.722. Oregon 81.423. Delaware 81.124. r Alaska 81.0
L Wyoming 81.026. New Jersey 80.227. Montana 79.928. New Hampshire 79.729. Illinois 79.630. Indiana 79.5
UNITED STATES 79.1
31. Oklahoma 78.932. Maryland 78.6
t. Arizona 77.134. Missouri 77.035. New York 76.336. Virginia 76.137. New Mexico 74.938. South Carolina 73.839. Nevada 73.740. West Virginia 72.441. Arkansas 71.742. r Florida 70.8
L Tennessee 70.844. Texas 69.345. North Carolina 69.146. Alabama 68.247. Kentucky 67.948. Louisiana 67.649. r Georgia 66.0
L Mississippi 66.0
Sources: U.S. Department of Health, Ed-ucation, and Welfare, Office of Educa-tion. Fall 1966 Statistics of Elementaryand Secondary Day Schools. Washing-ton, D.C.: Government Printing Office,1967. p. 15 and 17.
National Education Association, Re-
search Division. Estimates of School Sta-
Thble 49
tistics, 1970-71. Research Report1970-R15. Washington, D.C.: the Asso-ciation, 1970. p. 28.
High-school graduate: a person who re-ceives formal recognition from the
school authorities for completing theprescribed high-school course of study;excludes equivalency certiicates.
28
50-PERCENT INCREASE IN NUM-BER OF PUBLIC HIGH-SCHOOLGRADUATES, 1964-65 TO 1969-70
1. Alaska 46.0%2. Vermont 27.43. California 25.84. Michigan 21.25. Delaware 19.96. Kansas 19.37. Virginia 18.58. New Mexico 17.99. Arizona 16.5
10. South Dakota 16.211. Florida 15.212. Nevada 14.713. Texas 14.214. Illinois 13.915. Colorado 13.316. Minnesota 13.217. r Hawaii 13.1
L North Dakota 13.119. South Carolina 13.020. Connecticut 12.021. Maryland 11.522. Mississippi 11.323. Louisiana 11.1
UNITED STATES 11.1
24. Rhode Island 10.825. Maine 10.626. Ohio 10.227. [ Georgia 10.0
I- Wisconsin 10.029. [ New Hampshire 9.5
L Utah 9.531. Indiana 9.232. Montana 9.033. Iowa 8.634. Missouri 7.935. Oregon 7.536. Nebraska 7.037. New Jersey 6.938. Idaho 6.839. Kentucky 6.440. Washington 5.841. Pennsylvania 5.7
42. Tennessee 5.343- New York 4.344. Massachusetts 2.845. Arkansas 2.746. Wyoming 2.647. North Carolina 2.048. Oklahoma 1.8
49. Alabama -0.350. West Virginia -3.1
Sources: U.S. Department of Health, Ed-ucation, and Welfare, Office of Educa-tion. Fall 1966 Statistics of Elementaryand Secondary Day Schools. Washing-ton, D.C.: Government Printing Office,1967. p. 22 and 23.
National Education Association, Re-search Division. Estimates of School Sta-tistics, 1970-71. Research Report1970-R15. Washington, D.C.: the Asso-ciation, 1970. p. 28.
29
GENERAL FINANCIAL RESOURCES
51Total Personal Income, 1969 (in Millions) 30
52Per-Capita Personal Income, 1969 30
53Per-Capita Personal Income as Percent of National Average, 1969 31
54Percent Increase in Per-Capita Personal Income, 1959 to 1969 31
55Personal Income per Child of School Age, 1969 32
56Personal Income per Child in Average Daily Attendance, 1969 32
57Per-Capita Disposable Personal Income, 1968 33
58Per-Capita Disposable Income as Percent of Per-Capita Personal Income, 1968 33
59Percent Increase in Per-Capita Disposable Income, 1965 to 1968 34
60Personal Income from Government (Federal, State, and Local) Employmentas Percent of Total Personal Income, 1969 34
61-Farm Income (Gross), Total Cash Receipts, 1969 (in Millions) 34
62Net Effective Buying Income per Household, 1969 35
63Percent of Households with Cash Incomes Under $3,000 in 1969 35
64Percent of Households with Cash Incomes Under $5,000 in 1969 36
65Percent of Households with Cash Incomes of $10,000 or More in 1969 36
2J
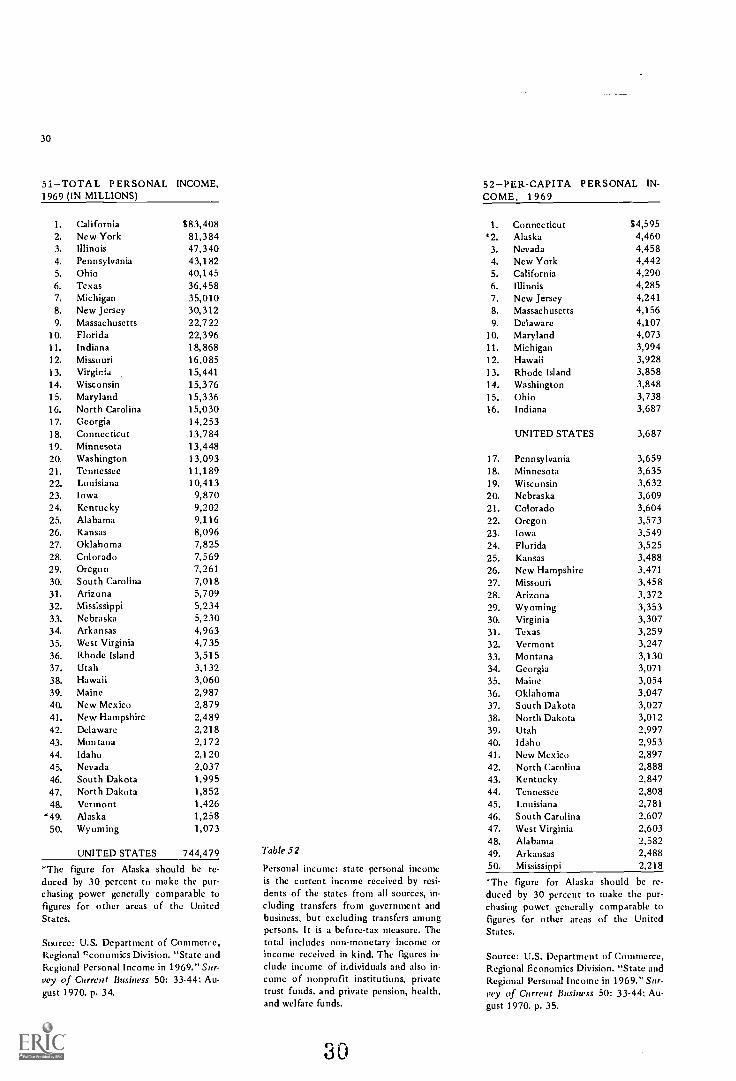
30
51-TOTAL PERSONAL INCOME,1969 (IN MILLIONS)
1. California 883,4082. New York 81,3843. Illinois 47,3404. Pennsylvania 43,1825. Ohio 40,1456. Texas 36,4587. Michigan 35,0108. New Jersey 30,3129. Massachusetts 22,722
10. Florida 22,39611. Indiana 18,86812. Missouri 16,08513. Virginia 15,44114. Wisconsin 15,37615. Maryland 15,33616. North Carolina 15,03017. Georgia 14,25318. Connecticut 13,78419. Minnesota 13,44820. Washington 13,09321. Tennessee 11,18922. Louisiana 10,41323. Iowa 9,87024. Kentucky 9,20225. Alabama 9,11626. Kansas 8,09627. Oklahoma 7,82528. Colorado 7,56929. Oregon 7,26130. South Carolina 7,01831. Arizona 5,70932. Mississippi 5,23433. Nebraska 5,23034. Arkansas 4,96335. West Virginia 4,73536. Rhode Island 3,51537. Utah 3,13238. Hawaii 3,06039. Maine 2,98740. New Mexico 2,87941. New Hampshire 2,48942. Delaware 2,21843. Montana 2,17244. Idaho 2,12045. Nevada 2,03746. South Dakota 1,99547. North Dakota 1,85248. Vermont 1,426
'49. Alaska 1,25850. Wyoming 1,073
UNITED STATES 744,479
The figure for Alaska should be re-duced by 30 percent to make the pur-chasing power generally comparable tofigures for other areas of the UnitedStates.
Source: U.S. Department of Commerce,Regional 7conomics Division. "State andRegional Personal Income in 1969."Sur-vey of Current Business 50: 33-44; Au-gust 1970. p. 34.
Table 52
Personal income: state personal incomeis the current income received by resi-dents of the states from all sources, in-cluding transfers from government andbusiness, but excluding transfers amongpersons. It is a before-tax measure. Thetotal includes non-monetary income orincome received in kind. The figures in-clude income of individuals and also in-come of nonprofit institutions, privatetrust funds, and private pension, health,and welfare funds.
30
52-PER-CAPITA PERSONAL IN-COME, 1969
1. Connecticut 84,595*2. Alaska 4,460
3. Nevada 4,4584. New York 4,4425. California 4,2906. Illinois 4,2857. New Jersey 4,2418. Massachusetts 4,1569, Delaware 4,107
10. Maryland 4,07311. Michigan 3,99412. Hawaii 3,92813. Rhode Island 3,85814. Washington 3,84815. Ohio 3,73816. Indiana 3,687
UNITED STATES 3,687
17. Pennsylvania 3,65918. Minnesota 3,63519. Wisconsin 3,63220. Nebraska 3,60921. Colorado 3,60422. Oregon 3,57323. Iowa 3,54924. Florida 3,52525. Kansas 3,48826. New Hampshire 3,47127. Missouri 3,45828. Arizona 3,37229. Wyoming 3,35330. Virginia 3,30731. Texas 3,25932. Vermont 3,24733. Montana 3,13034. Georgia 3,07135. Maine 3,05436. Oklahoma 3,04737. South Dakota 3,02738. North Dakota 3,01239. Utah 2,99740. Idaho 2,95341. New Mexico 2,89742. North Carolina 2,88843. Kentucky 2,84744. Tennessee 2,80845. Louisiana 2,78146. South Carolina 2,60747. West Virginia 2,60348. Alabama 2,58249. Arkansas 2,48850. Mississippi 2,218
The figure for Alaska should be re-duced by 30 percent to make the pur-chasing power generally comparable tofigures for other areas of the UnitedStates.
Source: U.S. Department of Commerce,Regional Economics Division. "State andRegional Personal Income in I969."Sur-vey of Current Business 50: 33-44; Au-gust 1970. p. 35.
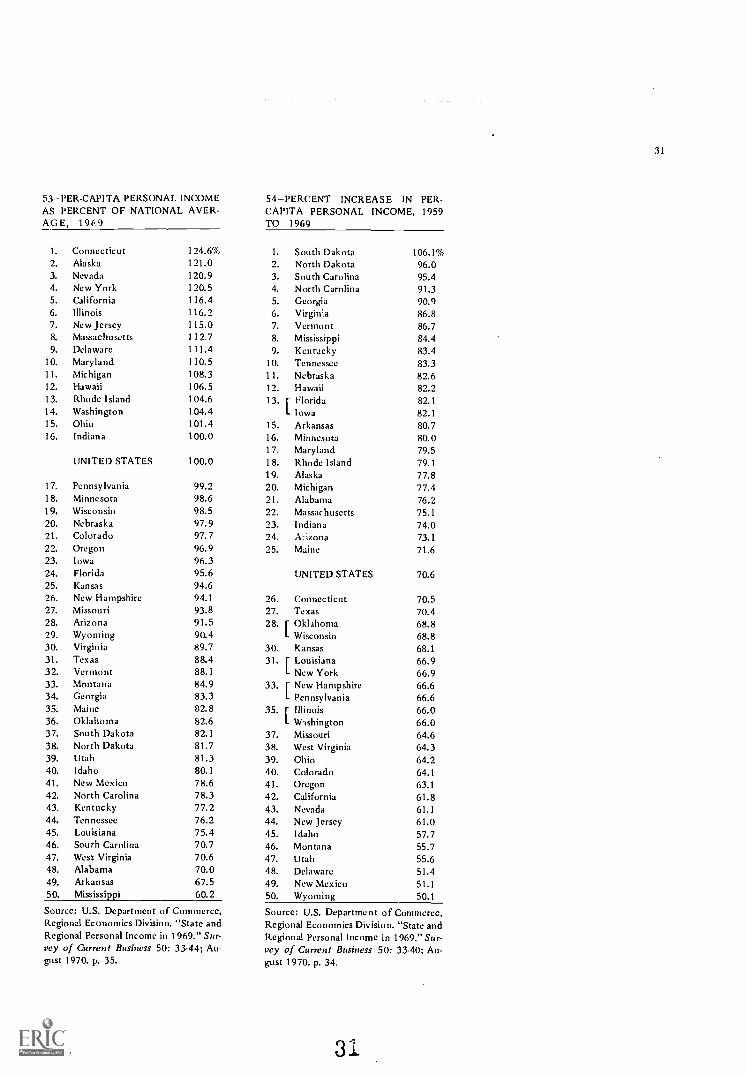
53- PER - CAPITA PERSONAL INCOMEAS PERCENT OF NATIONAL AVER-AGE, 19(9
1. Connecticut 124.6%2. Alaska 121.03. Nevada 120.94. New York 120.55. California 116.46. Illinois 116.27. New Jersey 115.08. Massachusetts 112.79. Delaware 111.4
10. Maryland 110.511. Michigan 108.312. Hawaii 106.513. Rhode Island 104.614. Washington 104.415. Ohio 101.416. Indiana 100.0
UNITED STATES 100.0
17. Pennsylvania 99.218. Minnesota 98.619. Wisconsin 98.520. Nebraska 97.921. Colorado 97.722. Oregon 96.923. Iowa 96.324. Florida 95.625. Kansas 94.626. New Hampshire 94.127. Missouri 93.828. Arizona 91.529. Wyoming 90.430. Virginia 89.731. Texas 88.432. Vermont 88.133. Montana 84.934. Georgia 83.335. Maine 82.836. Oklahoma 82.637. South Dakota 82.138. North Dakota 81.739. Utah 81.340. Idaho 80.141. New Mexico 78.642. North Carolina 78.343. Kentucky 77.244. Tennessee 76.245. Louisiana 75.446. South Carolina 70.747. West Virginia 70.648. Alabama 70.049. Arkansas 67.550. Mississippi 60.2
Source: U.S. Department of Commerce,Regional Economics Division. "State andRegional Personal Income in 1969." Sur-vey of Current Business 50: 33-44; Au-gust 1970. p. 35.
54-PERCENT INCREASE IN PER-CAPITA PERSONAL INCOME, 1959TO 1969
1. South Dakota 106.1%2. North Dakota 96.03. South Carolina 95.44. North Carolina 91.35. Georgia 90.96. Virginia 86.87. Vermont 86.78. Mississippi 84.49. Kentucky 83.4
10. Tennessee 83.311. Nebraska 82.612. Hawaii 82.213. r Florida 82.1
I- Iowa 82.115. Arkansas 80.716. Minnesota 80.017. Maryland 79.518. Rhode Island 79.119. Alaska 77.820. Michigan 77.421. Alabama 76.222. Massachusetts 75.123. Indiana 74.024. Acizona 73.125. Maine 71.6
UNITED STATES 70.6
26. Connecticut 70.527. Texas 70.428. r Oklahoma 68.8
L Wisconsin 68.830. Kansas 68.1
31.fLouisiana 66.9
L New York 66.933. [ New Hampshire 66.6
I Pennsylvania 66.635. r Illinois 66.0
L Washington 66.037. Missouri 64.638. West Virginia 64.339. Ohio 64.240. Colorado 64.141. Oregon 63.142. California 61.843. Nevada 61.144. New Jersey 61.045. Idaho 57.746. Montana 55.747. Utah 55.648. Delaware 51.449. New Mexico 51.150. Wyoming 50.1
Source: U.S. Department of Commerce,Regional Economics Division. "State andRegional Personal Income in 1969." Sur-vey of Current Business 50: 33-40; Au-gust 1970. p. 34.
31
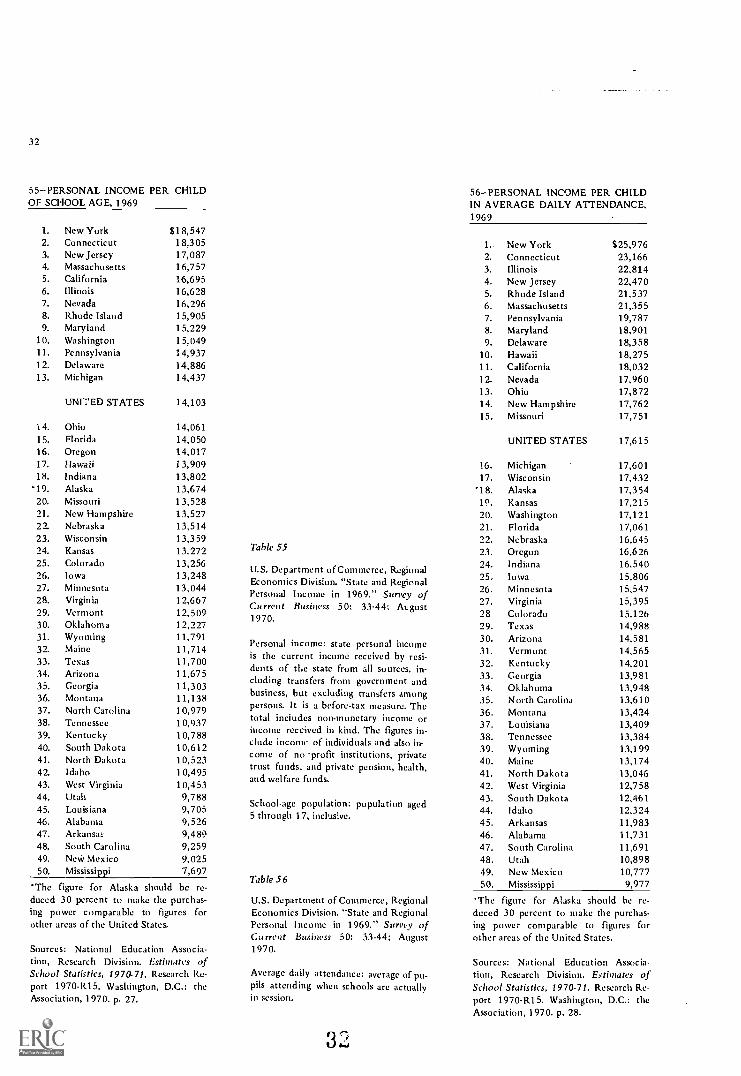
32
55-PERSONAL INCOME PER CHILDOF SCHOOL AGE, 1969
1. New York 818,5472. Connecticut 18,3053. New Jersey 17,0874. Massachusetts 16,7575. California 16,6956. Illinois 16,6287. Nevada 16,2968. Rhode Island 15,9059. Maryland 15,229
10. Washington 15,04911. Pennsylvania 14,93712. Delaware 14,88613. Michigan 14,437
UNITED STATES 14,103
14. Ohio 14,06115. Florida 14,05016. Oregon 14,01717. Hawaii 13,90918. Indiana 13,802
*19. Alaska 13,67420. Missouri 13,52821. New Hampshire 13,52722. Nebraska 13,51423. Wisconsin 13,35924. Kansas 13,27225. Colorado 13,25626. Iowa 13,24827. Minnesota 13,04428. Virginia 12,66729. Vermont 12,50930. Oklahoma 12,22731. Wyoming 11,79132. Maine 11,71433. Texas 11,70034. Arizona I 1,67535. Georgia 11,30336. Montana 11,13837. North Carolina 10,97938. Tennessee 10,93739. Kentucky 10,78840. South Dakota 10,61241. North Dakota 10,52342. Idaho 10,49543. West Virginia 10,45344. Utah 9,78845. Louisiana 9,70546. Alabama 9,52647. Arkansas 9,48948. South Carolina 9,25949. Nev' Mexico 9,02550. Mississippi 7,697
The figure for Alaska should be re-duced 30 percent to make the purchas-ing power comparable to figures forother areas of the United States.
Sources: National Education Associa-tion, Research Division. Estimates ofSchool Statistics, 1970-71. Research Re-port 1970-R15. Washington, D.C.: theAssociation, 1970. p. 27.
Table 55
U.S, Department of Commerce, RegionalEconomics Division, "State and RegionalPersonal Income in 1969." Survey ofCurrent Business 50: 33-44; August1970.
Personal income: state personal incomeis the current income received by resi-dents of the state from all sources, in-cluding transfers from government andbusiness, but excluding transfers amongpersons. It is a before-tax measure. Thetotal includes non-monetary income orincome received in kind. The figures in-clude income of individuals and also in-come of naprofit institutions, privatetrust funds, and private pension, health,and welfare funds.
School-age population: population aged5 through 17, inclusive.
Table 56
U.S. Department of Commerce, RegionalEconomics Division. "State and RegionalPersonal Income in 1969." Survey ofCu rrent Business 50: 33-44; August1970.
Average daily attendance: average of pu-pils attending when schools are actuallyin session,
56-PERSONAL INCOME PER CHILDIN AVERAGE DAILY ATTENDANCE,1969
1. New York 525,9762. Connecticut 23,1663. Illinois 22,8144. New Jersey 22,4705. Rhode Island 21,5376. Massachusetts 21,3557. Pennsylvania 19,7878. Maryland 18,9019. Delaware 18,358
10. Hawaii 18,27511. California 18,03212. Nevada 17,96013. Ohio 17,87214. New Hampshire 17,76215. Missouri 17,751
UNITED STATES 17,615
16. Michigan 17,60117. Wisconsin 17,432
'18. Alaska 17,35410. Kansas 17,21520. Washington 17,12121. Florida 17,06122. Nebraska 16,64523. Oregon 16,62624, Indiana 16,54025, Iowa 15,80626. Minnesota 15,54727. Virginia 15,39528 Colorado 15,12629. Texas 14,98830. Arizona 14,58131. Vermont 14,56532. Kentucky 14,20133. Georgia 13,98134. Oklahoma 13,94835. North Carolina 13,61036. Montana 13,42437. Louisiana 13,40938. Tennessee 13,38439. Wyoming 13,19940. Maine 13,17441. North Dakota 13,04642. West Virginia 12,75843. South Dakota 12,46144. Idaho 12,32445. Arkansas 11,98346. Alabama 11,73147. South Carolina 11,69148. Utah 10,89849. New Mexico 10,77750. Mississippi 9,977
'The figure for Alaska should be re-duced 30 percent to make the purchas-ing power comparable to figures forother areas of the United States.
Sources: National Education Associa-tion, Research Division. Estimates ofSchool Statistics, 1970-71. Research Re-port 1970-R15. Washington, D.C.: theAssociation, 1970. p. 28.
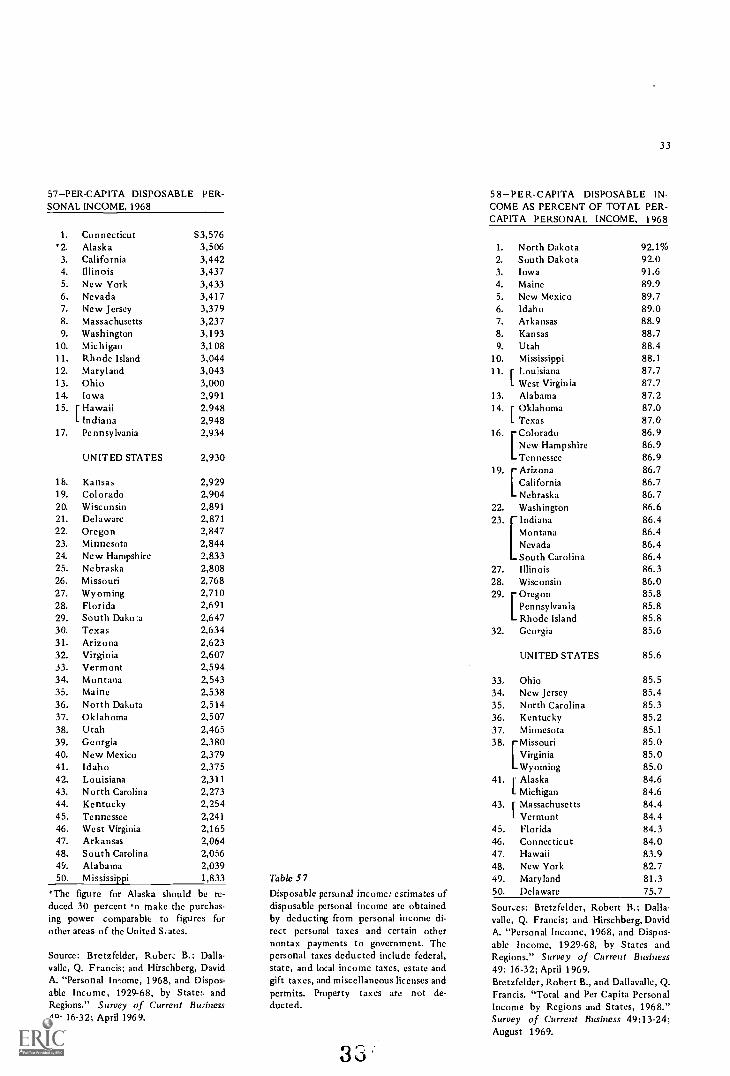
57-PER-CAPITA DISPOSABLE PER-SONAL INCOME, 1968
1. Connecticut*2. Alaska
3. California4. Illinois5. New York6. Nevada7. New Jersey8. Massachusetts9. Washington
10. Michigan11. Rhode Island12. Maryland13. Ohio14. Iowa15. r Hawaii
L Indiana17. Pennsylvania
83,5763,5063,4423,4373,4333,4173,3793,2373,1933,1083,0443,0433,0002,9912,9482,9482,934
UNITED STATES 2,930
18. Kansas 2,92919. Colorado 2,90420. Wisconsin 2,89121. Delaware 2,87122. Oregon 2,84723. Minnesota 2,84424. New Hampshire 2,83325. Nebraska 2,80826. Missouri 2,76827. Wyoming 2,71028. Florida 2,69129. South Dakota 2,64730. Texas 2,63431. Arizona 2,62332. Virginia 2,60733. Vermont 2,59434. Montana 2,54335. Maine 2,53836. North Dakota 2,51437. Oklahoma 2,50738. Utah 2,46539. Georgia 2,38040. New Mexico 2,37941. Idaho 2,37542. Louisiana 2,31143. North Carolina 2,27344. Kentucky 2,25445. Tennessee 2,24146. West Virginia 2,16547. Arkansas 2,06448. South Carolina 2,05649. Alabama 2,03950. Mississippi 1,833
*The figure for Alaska should be re-duced 30 percent to make the purchas-ing power comparable to figures forother areas of the United Sates.
Source: Bretzfelder, Robert B.; Dalla-valle, Q. Francis; and Hirschberg, DavidA. "Personal In-ome, 1968, and Dispos-able Income, 1929-68, by States, andRegions." Survey of Current Business49: 16-32; April 1969.
Table 57
Disposable personal income: estimates ofdisposable personal income are obtainedby deducting from personal income di-rect personal taxes and certain othernontax payments to government. Thepersonal taxes deducted include federal,state, and local income taxes, estate andgift taxes, and miscellaneous licenses andpermits. Property taxes are not de-
ducted.
33
58-PER-CAPITA DISPOSABLE IN-COME AS PERCENT OF TOTAL PER-CAPITA PERSONAL INCOME, 1968
1. North Dakota 92.1%2. South Dakota 92.03. Iowa 91.64. Maine 89.95. New Mexico 89.76. Idaho 89.07. Arkansas 88.98. Kansas 88.79. Utah 88.4
10. Mississippi 88.111. r Louisiana 87.7
L West Virginia 87.713. Alabama 87.214. 1 Oklahoma 87.0
I Texas 87.016. Colorado 86.9
New Hampshire 86.9Tennessee 86.9
19. Ariz ona 86.7California 86.7Nebraska 86.7
22. Washington 86.623. Indiana 86.4
Montana 86.4Nevada 86.4South Carolina 86.4
27. Illinois 86.328. Wisconsin 86.029. Oregon 85.8
Pennsylvania 85.8Rhode Island 85.8
32. Georgia 85.6
UNITED STATES 85.6
33. Ohio 85.534. New Jersey 85.435. North Carolina 85.336. Kentucky 85.237. Minnesota 85.138. Missouri 85.0
Virginia 85.0Wyoming 85.0
41. r Alaska 84.6L Michigan 84.6
43. r Massachusetts 84.4L Vermont 84.4
45. Florida 84.346. Connecticut 84.047. Hawaii 83.948. New York 82.749. Maryland 81.350. Delaware 75.7
Sour,es: Bretzfelder, Robert B.; Dalla-valle, Q. Francis; and Hirschberg, DavidA. "Personal Income, 1968, and Dispos-able Income, 1929-68, by States andRegions." Survey of Current Business49: 16-32; April 1969.Bretzfelder, Robert B., and Dallavalle, Q.Francis. "Total and Per Capita PersonalIncome by Regions and States, 1968."Survey of Current Business 49:13-24;August 1969.
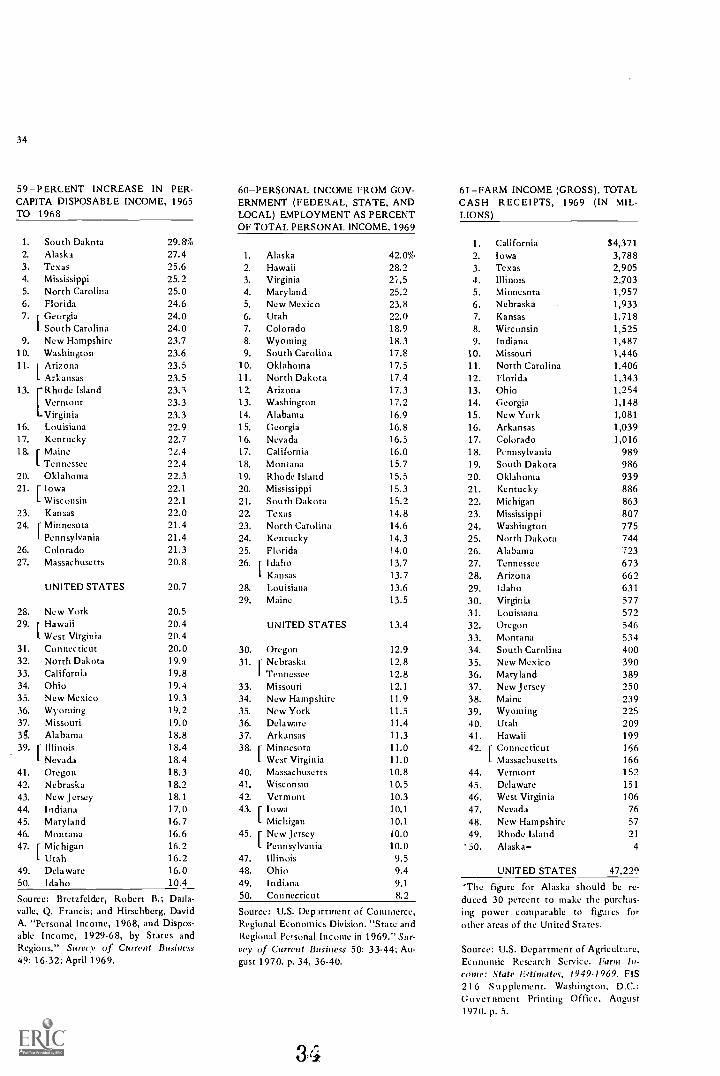
34
59-PERCENT INCREASE IN PER-CAPITA DISPOSABLE INCOME, 1965TO 1968
1. South Dakota2. Alaska3. Texas4. Mississippi5. North Carolina6. Florida7. r Georgia
L South Carolina9. New Hampshire
10. Washington11. I Arizona
L Arkansas13. Rhode Island13. ('Rhode
Virginia16. Louisiana17. Kentucky18. r Maine
L Tennessee20. Oklahoma21. r Iowa
L Wisconsin23. Kansas
24. r MinnesotaI. Pennsylvania
26. Colorado27. Massachusetts
UNITED STATES
28. New York29. r Hawaii
L West Virginia31. Connecticut32. North Dakota33. California34. Ohio35. New Mexico36. Wyoming37. Missouri3g. Alabama39. r Illinois
I- Nevada41. Oregon42. Nebraska43. New Jersey44. Indiana45. Maryland46. Montana47. r Michigan
L Utah49. Delaware50, Idaho
29.8%27.425.625.225.024.624.024.023.723.623.523.523.323.323.322.922.722.422.422.322.1
22.1
22.021.421.421.320.8
60-PERSONAL INCOME FROM GOV-ERNMENT (FEDERAL, STATE, ANDLOCAL) EMPLOYMENT AS PERCENTOF TOTAL PERSONAL INCOME, 1969
1. AlaskaHawaiiVirginiaMarylandNew MexicoUtahColoradoWyomingSouth CarolinaOklahomaNorth DakotaArizonaWashington
2.
3.
4.
5.
6.
7.
8.
9.
10,
11.
12.
13.
14, Alabama15. Georgia16. Nevada17. California18. Montana19. Rhode Island20. Mississippi21. South Dakota22. Texas23. North Carolina24. Kentucky25. Florida26. r Idaho
L Kansas20.7 28. Louisiana
29. Maine20.520.420.420.019.919.819.419.319.219.018.818.418.418.318.218.117.016.716.616.216.216.010.4
Source: Bretzfelder, Robert B.; Daila-valle, Q. Francis; and Hirschberg, DavidA. "Personal Income, 1968, and Dispos-able Income, 1929-68, by States andRegions." Survey of Current Business49: 16-32; April 1969.
42.0%28.221.525.223.822.018.918.317.817.517,417.317.216.916.816.5
16.015.715.515.315.214.814.614.3
14.0
13.713.713.613.5
UNITED STATES 13.4
30. Oregon31. r Nebraska
L Tennessee
33. Missouri34. New Hampshire35. New York36. Delaware37. Arkansas38. r Minnesota
L West Virginia40. Massachusetts41. Wisconsin42. Vermont43. r Iowa
I- Michigan45. r New Jersey
L Pennsylvania47. Illinois48. Ohio49. Indiana50. Connecticut
12.9
12.812.812.1
11.911.511.4
11.311.011,010.8
10.510.310.1
10.1
10.010.09.59.49.1
8.2
Source: U.S. Department of Commerce,Regional Economics Division. "State andRegional Personal Income in 1969." Sur-vey of Current Business 50: 33-44; Au-gust 1970. p. 34, 36-40.
3 t;
61-FARM INCOME (GROSS), TOTALCASH RECEIPTS, 1969 (IN MIL-LIONS)
1. California2. Iowa3. Texas4. Illinois5. Minnesota6. Nebraska7. Kansas
8. Wisconsin9. Indiana
10. Missouri11. North Carolina12. Florida13. Ohio14. Georgia15. New York16. Arkansas17. Colorado18. Pennsylvania19. South Dakota20. Oklahoma21. Kentucky22. Michigan23. Mississippi24. Washington25. North Dakota26. Alabama27. Tennessee
28. Arizona29. Idaho30. Virginia31. Louisiana32. Oregon33. Montana34. South Carolina35. New Mexico36. Maryland37. New Jersey38. Maine39. Wyoming40. Utah41. Hawaii42. r Connecticut
L Massachusetts44. Vermont45. Delaware46. West Virginia47. Nevada
48. New Hampshire49. Rhode Island
'30. Alaska-
54,3713,7882,9052,7031,9571,9331,7181,5251,4871,4461,4061,3431,2541,1481,0811,0391,016
989986939886863807775744723673662631577572546534400390389250239225209199166166152
151
106
7657
21
4
UNITED STATES 47,229
*The figure for Alaska should be re-duced 30 percent to make the purchas-ing power comparable to figures forother areas of the United States.
Source: U.S. Department of Agriculture,Economic Research Service. Farm In-come: State Estimates, 1949-1969. FIS216 Supplement. Washington, D.C.:Government Printing Office, August1970. p. 5.
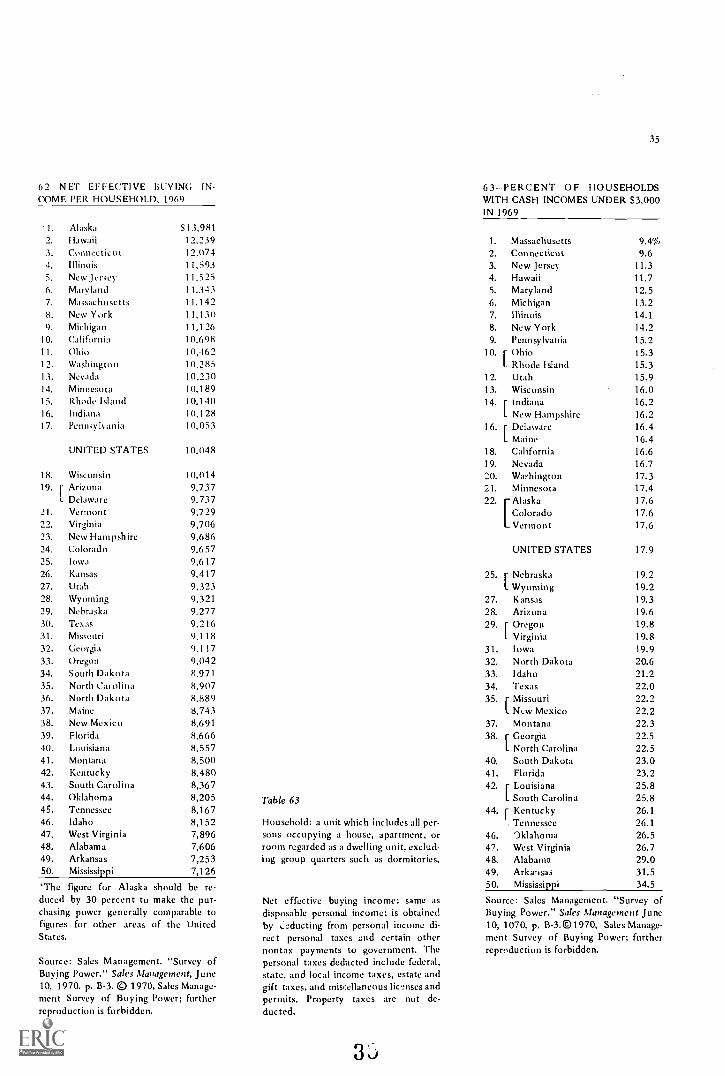
62 NET EFFECTIVE BUYING IN-COME l'ER HOUSEHOLD, 1969
1, Alaska3. Hawaii3. Connecticut4. Illinois5. New Jersey6. Maryland7. Massachusetts8. New York9. Michigan
10. California11. Ohio12. Washington13. Nevada
14. Minnesota15. Rhode Island16. Indiana17. Pennsylvania
513,98112,23912.07411,59311,52511,34311,14211,13011,12610,69810,46210.28510.23010,18910,14010,12810.053
UNITED STATES 10,048
18. Wisconsin19. F Arizona
I- Delaware21. Vermont22, Virginia23. New Hampshire24. Colorado25. Iowa26. Kansas
27. Utah28. Wyoming29. Nebraska30. Texas
31. Missouri32. Georgia33. Oregon
34. South Dakota35. North Carolina36. North Dakota37. Maine38. New Mexico39. Florida40. Louisiana41. Montana42. Kentucky43. South Carolina44. Oklahoma45. Tennessee
46. Idaho47. West Virginia48. Alabama49. Arkansas50. Mississippi
10,0149,7379,7379,7299,7069,6869,6579,6179,4179,3239,3219,2779,2169,1189,1179,0428,9718,9078,8898,7438,6918,6668,5578,5008,4808,3678,2058,1678,1527,8967,6067,2537,126
'The figure for Alaska should be re-duced by 30 percent to make the pur-chasing power generally comparable tofigures for other areas of the UnitedStates.
Source: Sales Management. "Survey ofBuying Power." Sales Management, June10, 1970. p. B-3. © 1970, Sales Manage-ment Survey of Buying Power; furtherreproduction is forbidden.
Table 63
Household: a unit which includes all per-sons occupying a house, apartment, orroom regarded as a dwelling unit, exclud-ing group quarters such as dormitories.
Net effective buying income: same asdisposable personal income; is obtainedby ieducting from personal income di-rect personal taxes and certain othernontax payments to government. Thepersonal taxes deducted include federal,state, and local income taxes, estate andgift taxes, and miscellaneous licenses andpermits. Property taxes are not de-
ducted.
3
35
63-PERCENT OF HOUSEHOLDSWITH CASH INCOMES UNDER 53,000IN 1969
1. Massachusetts 9.4%2. Connecticut 9.63. New Jersey 11.34. Hawaii 11.75. Maryland 12.56. Michigan 13.27. Illinois 14.18. New York 14.29. Pennsylvania 15.2
10. r Ohio 15.3
L Rhode Island 15.312. Utah 15.913. Wisconsin 16.014. r Indiana 16.2
L New Hampshire 16.216. r Delaware 16.4
L Maine 16.418. California 16.619. Nevada 16.720. Washington 17.321. Minnesota 17.422. Alaska 17.6
Colorado 17.6Vermont 17.6
UNITED STATES 17.9
25. r Nebraska 19.2Wyoming 19.2
27. Kansas 19.328. Arizona 19.629. r Oregon 19.8
I- Virginia 19.831. Iowa 19.932. North Dakota 20.633. Idaho 21.234. Texas 22.035. r Missouri 22.2
New Mexico 22.237. Montana 22.338. r Georgia 22.5
North Carolina 22.540. South Dakota 23.041. Florida 23.242. Louisianar 25.8
L South Carolina 25.844. r Kentucky 26.1
Tennessee 26.146. Oklahoma 26.547. West Virginia 26.748. Alabama 29.049. Arkansas 31.550. Mississippi 34.5
Source: Sales Management. "Survey ofBuying Power." Sales Management June10, 1070. p. B-3.©1970, Sales Manage-ment Survey of Buying Power; furtherreproduction is forbidden.
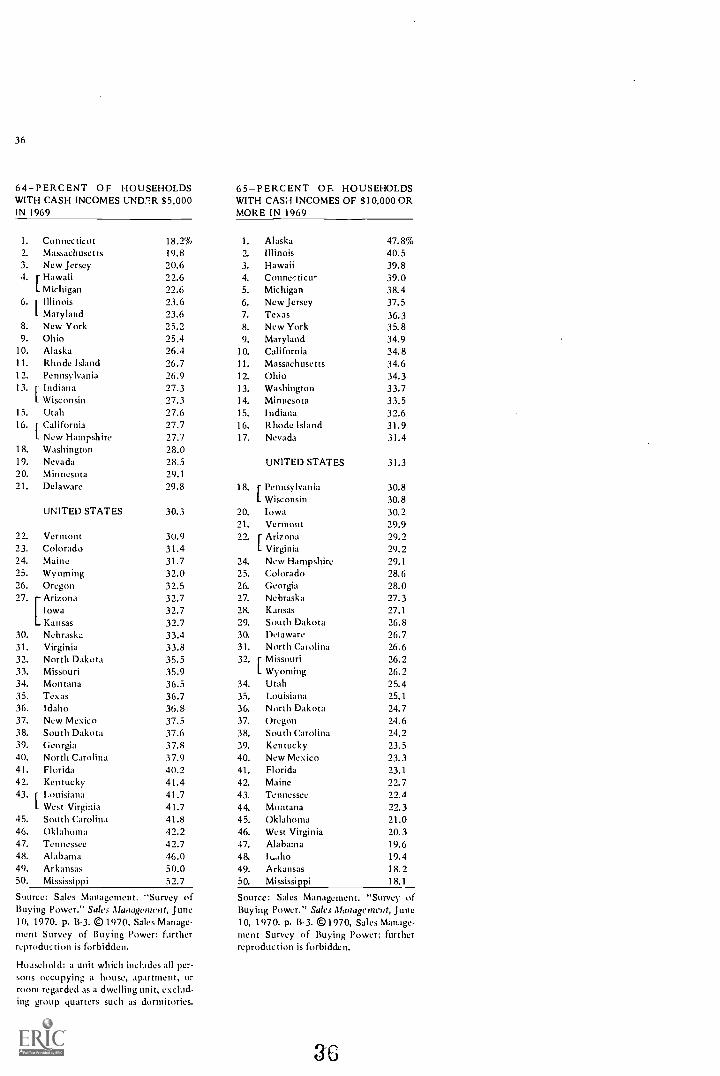
36
64 PERCENT OF HOUSEHOLDSWITH CASH INCOMES UND7112 S5,000IN 1969
1. Connecticut2. Massachusetts3. New Jersey4. r Hawaii
L Michigan6. r Illinois
L Maryland8. New York9. Ohio
10. Alaska11. Rhode Island12. Pennsylvania13. 1 Indiana
L Wisconsin15. Utah16. r California
L New Hampshire18. Washington19. Nevada20. Minnesota21. Delaware
2'2.
23.24.25.26.27.
30.31.32.33.34.35.36.37.38.39.40.41.42.43.
45.46.47.48.49.50.
18.2%19.820.622.622.623.623.625.225.426.426.726.927.327.327.627.727.728.028.529.129.8
UNITED STATES 30.3
VermontColoradoMaineWyomingOregonArizonaowa
KansasNebraskaVirginiaNorth DakotaMissouriMontanaTexasIdahoNew MexicoSouth DakotaGeorgiaNorth CarolinaFloridaKentuckyLouisianaWest VirginiaSouth CarolinaOklahomaTennesseeAlabamaArkansasMississippi
30.931.431.732.032.532.732.732.733.433.835.535.936.536.736.837.537.637.837.940.241.441.741.741.842.242.746.050.052.7
Source: Sales Management. "Survey ofBuying Power." Sales Management, June10, 1970. p. B-3. 01970, Sales Manage-ment Survey of Buying Power: furtherreproduction is forbidden.
Household: a unit which includes all per-sons occupying a house, apartment, orroom regarded as :1 dwelling unit, exclud-ing group quarters such as dormitories.
65-PERCENT OF. HOUSEHOLDSWITH CASH INCOMES OF S10,000 ORMORE IN 1969
1. Alaska 47.8%2. Illinois 40.53. Hawaii 39.84. Connecticut 39.05. Michigan 38.46. New Jersey 37.57. Texas 36.38. New York 35.89. Maryland 34.9
10. California 34.811. Massachusetts 34.612. Ohio 34.313. Washington 33.714. Minnesota 33.515. Indiana 32.616. Rhode Island 31.917. Nevada 31.4
UNITED STATES 31.3
18. r Pennsylvania 30.8L Wisconsin 30.8
20. Iowa 30.221. Vermont 29.922. r Arizona 29.2
L Virginia 29.224. New Hampshire 29.125. Colorado 28.626. Georgia 28.027. Nebraska 27.328. Kansas 27.129. South Dakota 26.830. Delaware 26.731, North Carolina 26.632. r Missouri 26.2
I. Wyoming 26.234. Utah 25.435. Louisiana 25.136. North Dakota 24.737. Oregon 24.638. South Carolina 24.239. Kentucky 23.540. New Mexico 23.341. Florida 23.142. Maine 22.743. Tennessee 22.444. Montana 22.345. Oklahoma 21.046. West Virginia 20.347. Alabama 19.648. 1..ho 19.449. Arkansas 18.250. Mississippi 18.1
Source: Sales Management. "Survey ofBuying Power." Sales Management, June10, 1970. p. 11-3. 01970, Sales Manage-ment Survey of Buying Power; furtherreproduction is forbidden.
3G

GOVERNMENTAL REVENUE
37
66Per-Capita Total General Revenue of All State and Local Governments,1968-69 38
67Per-Capita General Revenue of State and Local Governments fromOwn Sources, 1968-69 38
68General Revenue of State and Local Governments from Own Sources,1968-69, as Percent of Personal Income in 1969 39
69Per-Capita Total Tax Collections of State and Local Governments, 1968-69 . 39
70State and Local Tax Collections in 1968-69 as a Percent of PersonalIncome, 1969 40
71Per-Capita Property Tax Revenue of State and Local Governments, 1968-69 40
72Per-Capita Property Tax Revenue of Local Governments, 1968-69 41
73Property Tax Revenue of State and Local Governments as Percent ofTotal Tax Revenue of These Governments, 1968-69 41
74Local Property Tax Revenue as Percent of Total State-Local PropertyTax Revenue, 1968-69 42
75State and Local Property Tax Collections in 1968-69 as a Percent ofPersonal Income in 1969 42
76Per-Capita State Tax Revenue, Fiscal 1969 43
77Per-Capita State Tax Revenue, Fiscal 1970 43
78Per-Capita Local Tax Collections, 1968-69 43
79State Tax Revenue in Fiscal 1969 as Percent of Personal Income in 1968 . . 44
80State Tax Revenue in Fiscal 1970 (Preliminary) as Percent of PersonalIncome in 1969 44
3'
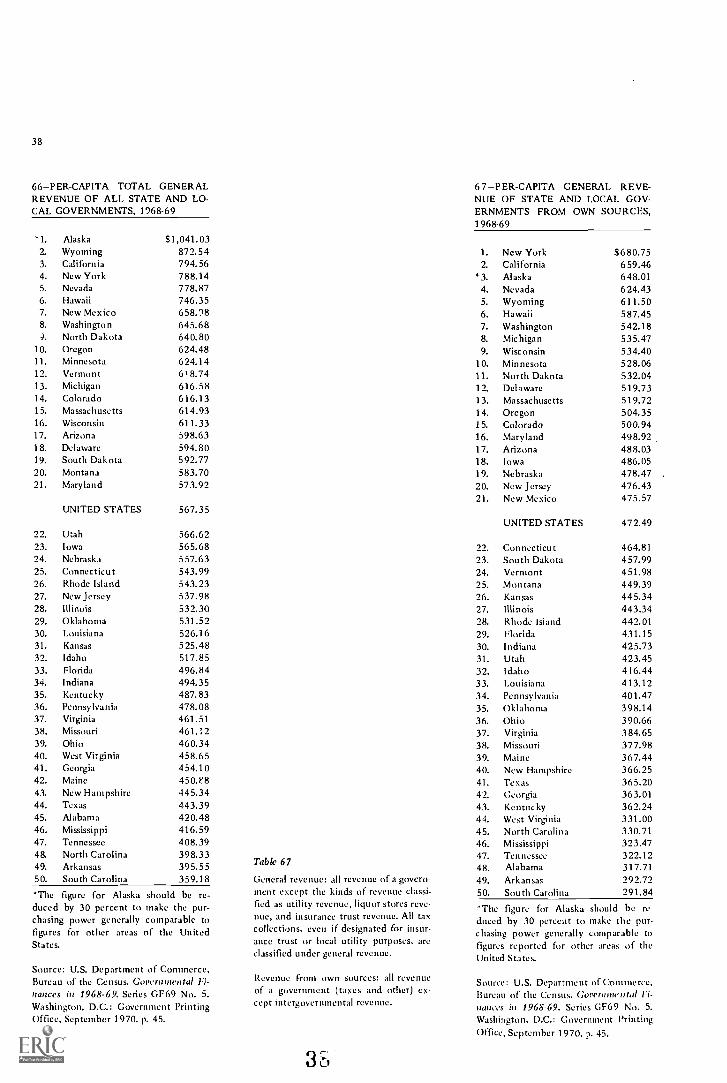
38
66-PER-CAPITA TOTAL GENERALREVENUE OF ALL STATE AND LO-CAL GOVERNMENTS, 1968-69
'1. Alaska S1,041.032. Wyoming 872.543. California 794.564. New York 788.145. Nevada 778.876. Hawaii 746.357. New Mexico 658.988. Washington 645.68
North Dakota 640.8010. Oregon 624.4811. Minnesota 624.1412. Vermont 618.7413. Michigan 616.5814. Colorado 616.1315. Massachusetts 614.9316. Wisconsin 611.3317. Arizona 598.6318. Delaware 594.8019. South Dakota 592.7720. Montana 583.7021. Maryland 573.92
UNITED STATES 567.35
22. Utah 566.6223. Iowa 565.6824. Nebraska 557.6325. Connecticut 543.9926. Rhode Island 543.2327. New Jersey 537.9828. Illinois 532.3029. Oklahoma 531.5230. Louisiana 526.1631. Kansas 525.4832. Idaho 517.8533. Florida 496.8434. Indiana 494.3535. Kentucky 487.8336. Pennsylvania 478.0837. Virginia 461.5138. Missouri 461.1239. Ohio 460.3440. West Virginia 458.6541. Georgia 454.1042. Maine 450. F843. New Hampshire 445.3444. Texas 443.3945. Alabama 420.4846. Mississippi 416.5947. Tennessee 408.3948. North Carolina 398.3349. Arkansas 395.5550. South Carolina 359.18
'The figure for Alaska should be re-duced by 30 percent to make the pur-chasing power generally comparable tofigures for other areas of the UnitedStates.
Source: U.S. Department of Commerce,Bureau of the Census. Governmental Fi-nances in 1968-69. Series GF69 No. 5.Washington, D.C.: Government PrintingOffice, September 1970. p. 45.
Table 67
General revenue: all revenue of a govern-ment except the kinds of revenue classi-fied as utility revenue, liquor stores reve-nue, and insurance trust revenue. All taxcollections, even if designated for insur-ance trust or local utility purposes, areclassified under general revenue.
Revenue from own sources: all revenueof a government (taxes and other) ex-cept intergovernmental revenue.
3
67-PER-CAPITA GENERAL REVE-NUE OF STATE AND LOCAL GOV-ERNMENTS FROM OWN SOURCES,1968-69
1. New York 5680.752. California 659.463. Alaska 648.014. Nevada 624.435. Wyoming 611.506. Hawaii 587.457. Washington 542.188. Michigan 535.479. Wisconsin 534.40
10. Minnesota 528.0611. North Dakota 532.0412. Delaware 519.7313. Massachusetts 519.7214. Oregon 504.3515. Colorado 500.9416. Maryland 498.9217. Arizona 488.0318. Iowa 486.0519. Nebraska 478.4720. New Jersey 476.4321. New Mexico 475.57
UNITED STATES 472.49
22. Connecticut 464.8123. South Dakota 457.9924. Vermont 451.9825. Montana 449.3926. Kansas 445.3427. Illinois 443.3428. Rhode Island 442.0129. Florida 431.1530. Indiana 425.7331. Utah 423.4532. Idaho 416.4433. Louisiana 413.1234. Pennsylvania 401.4735. Oklahoma 398.1436. Ohio 390.6637. Virginia 384.6538. Missouri 377.9839. Maine 367.4440. New Hampshire 366.2541. Tex as 365.2042. Georgia 363.0143. Kentucky 362.2444. West Virginia 331.0045. North Carolina 330.7146. Mississippi 323.4747. Tennessee 322.1248. Alabama 317.7149. Arkansas 292.7250. South Carolina 291.84
The figure for Alaska should be re-
duced by 30 percent to make the pur-chasing power generally comparable tofigures reported for other areas of theUnited States.
Source: U.S. Department of Commerce,Bureau of the Census. Governmental Fi-nances in 1968-69. Series GF69 No. 5.Washington, D.C.: Government PrintingOffice, September 1970. p. 45.

68-GENERAL REVENUE OF STATEAND LOCAL GOVERNMENTS FROMOWN SOURCES, 1968-69, AS PER-CENT OF PERSONAL INCOME IN1969
1. Wyoming 18.2%2. North Dakota 17.43. New Mexico 16.44. Cal ifornia 15.45. New York 15.36. Hawaii 15.27. South Dakota 15.18. Louisiana 14.99. Wisconsin 14.7
10. Mississippi 14.6'11. Alaska 14.5
Arizona 14.5Minnesota 14.5
14. Montana 14.415. Idaho 14.1
Oregon 14.1Utah 14.1Washington 14.1
19. Nevada 14.020. i Colorado 13.9
L Vermont 13.922. Iowa 13.7
Michigan 13.4Nebraska 13.3Oklahoma 13.1Kansas 12.8
UNITED STATES 12.8
27. r Delaware 12.7",:ntucky 12.7
'-West Virginia 12.730. Massachusetts 12.531. Alabama 12.332. r Florida 12.2
I- Maryland 12.234. Maine 12.035. r Arkansas 11.8
L Georgia 11.837. Virginia 11.6
11.5North Carolina 11.5
[Indiana
Rhode Island 11.5Tennessee 11.5
Jersey 11.2[NewSouth Carolina 11.2Texas 11.2
45. Pennsylvania 11.046. Missouri 10.947. New Hampshire 1 0,648. Ohio 10.549. Illinois 10.350. Connecticut 10.1
*The figure for Alaska should be re-duced by 30 percent to make the pur-chasing power generally comparable tofigures for other areas of the UnitedStates.
Sources: U.S. Department of Commerce,Regional Economics Division. "State and
Table 68
Regional Personal Income in 1969." Sur-vey of Current Business 50:33-44; Au-gust 1970. p. 34.
U.S. Department of Commerce, Bu-reau of the Census. Governmental Fi-nances is 1968-69. Series GF69 No. 5.Washington, D.C.: Government PrintingOffice, September 1970. p. 31-33.
Revenue from own sources: all revenueof a government (taxes and other) ex-cept intergovernmental revenue.
Personal income: state personal incomeis the current income received by resi-dents of the states from all sources, in-cluding transfers from government andbusiness, but excluding transfers amongpersons. It is a before-tax measure. Thetotal includes non-monetary income orincome received in kind. The figures in-clude income of individuals and also in-come of nenprofit institutions, privatetrust funds, and private pension, health,and welfare funds.
Table 69
Taxes: compulsory contributions ex-acted by a government for public pur-poses, except employee and employer as-sessments for retirement and social insur-ance purposes, which are classed as insur-ance trust revenue. All tax revenue isclassified under general revenue andcomprises amounts received (includinginterest and penalties but excluding re-'funds) front taxes imposed by the recipi-ent government. Amounts received by agovernment from a tax it imposes arecounted as tax revenue of that govern-ment, even though initially collected byanother government; however, anyamounts retained are treated as tax rev-enue of the collecting government. Taxamounts subsequently distributed to oth-er governments are classified as intergov-ernmental transactions.
39
69- PER CAPITA TOTAL TAXCOLLECTIONS OF STATE AND LO-CAL GOVERNMENTS, 1968-69
1. New York S575.512. California 539.993. Hawaii 480.234. Nevada 466.395. Massachusetts 452.596. Wisconsin 439.047. Michigan 428.268. Wyoming 413.739. Maryland 410.58
10. Washington 410.1211. Minnesota 406.1512. New Jersey 406.0613. Connecticut 392.15
14. Alaska 390.4915. Iowa 388.6016. Oregon 387.0017. Arizona 386.5718. Colorado 385.8019. Vermont 384.17
UNITED STATES 379.94
20. Rhode Island 378.6621. Illinois 372.8022. Delaware 372.1723. Nebraska 362.1324. South Dakota 352.8025. Montana 351.3326. Kansas 346.4027. Pennsylvania 339.5228. North Dakota 338.0629. Indiana 334.1930. Florida 329.8631. Idaho 327.9632. Utah 327.2133. New Mexico 323.5534. Virginia 313.7035. Maine 308.1136. Ohio 305.7737. Missouri 301.0238. New Hampshire 299.3739. Louisiana 297.8740. Oklahoma 287.0441. Kentucky 277.5242. Texas 275.6643. Georgia 269.6644. West Virginia 262.8245. North Carolina 258.8146. Tennessee 252.3147. Mississippi 241.9548. South Carolina 224.8449. Alabama 224.4750. Arkansas 220.82
*The figure for Alaska should be re-duced by 30 percent to make the pur-chasing power generally comparable tofigures for other areas of the UnitedStates.
Source: U.S. Department of CommerceBureau of the Census. Governmental Fi-nances in 1968-69. Series GF69 No. 5.Washington, D.C.: Government PrintingOffice, September 1970. p. 45.
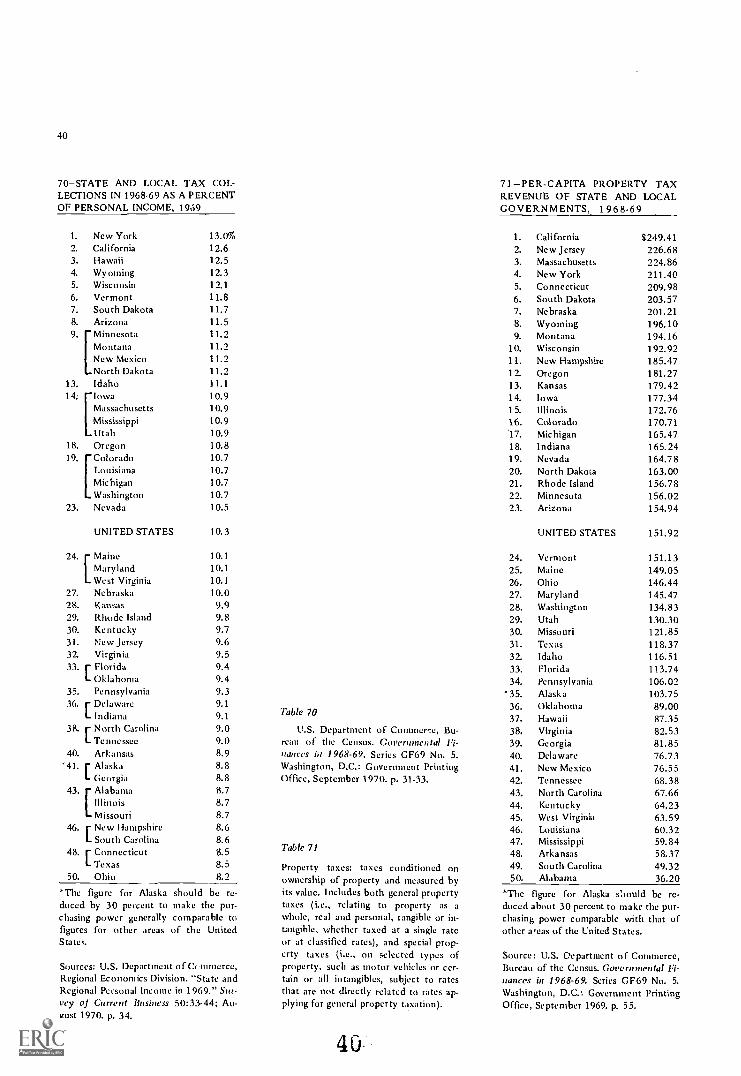
40
70-STATE AND LOCAL TAX COL-LECTIONS IN 1968-69 AS A PERCENTOF PERSONAL INCOME, 1959
1. New York2. California3. Hawaii4. Wyoming5. Wisconsin6. Vermont7. South Dakota8. Arizona
13.0%12.612.512.312.111.811.711.5
9. Minnesota 11.2Montana 11.2New Mexico 11.2North Dakota 11.2
13. Idaho 11.114: Iowa 10.9
Massachusetts 10.9Mississippi 10.9Utah 10.9
18. Oregon 10.819. Colorado 10.7
Louisiana 10.7Michigan 10.7Washington 10.7
23. Nevada 10.5
UNITED STATES 10.3
24. Maine 10.1Maryland 10.1West Virginia 10.1
27. Nebraska 10.028. Kansas 9.929. Rhode Island 9.830. Kentucky 9.731. New Jersey 9.632. Virginia 9.533. r Florida 9.4
L Oklahoma 9.435. Pennsylvania 9.336. r Delaware 9.1
Indiana 9.138. r North Carolina 9.0
L Tennessee 9.040. Arkansas 8.9
'41. r Alaska 8.8L Georgia 8.8
43. Alabama 8.7Illinois 8.7Missouri 8.7
46. li iniHI 8.6SNI,e,
8.648. r Connecticut 8.5
L Texas 8.550. Ohio 8.2
The figure for Alaska should be re-duced by 30 percent to make the pur-chasing power generally comparable tofigures for other areas of the UnitedStates.
Sources: U.S. Department of Ctinmerce,Regional Economics Division. "State andRegional Personal Income in 1969." Sur-vey of Current Business 50:33-44; Au-gust 1970. p. 34.
Table 70
U.S. Department of Commerce, Bu-reau of the Census. Governmental Fi-nances in 1968-69. Series GF69 No. 5.Washington, D.C.: Government PrintingOffice, September 1970. p. 31-33.
Table 71
Property taxes: taxes conditioned onownership of property and measured byits value. Includes both general propertytaxes (i.e., relating to property as awhole, real and personal, tangible or in-tangible, whether taxed at a single rateor at classified rates), and special prop-erty taxes (i.e., on selected types ofproperty, such as motor vehicles or cer-tain or all intangibles, subject to ratesthat are not directly related to rates ap-plying for general property taxation).
40.
71- PER - CAPITA PROPERTY TAXREVENUE OF STATE AND LOCALGOVERNMENTS, 1968 -69
1. California 5249.412. New Jersey 226.683. Massachusetts 224.864. New York 211.405. Connecticut 209.986. South Dakota 203.577. Nebraska 201.218. Wyoming 196.109. Montana 194.16
10. Wisconsin 192.9211. New Hampshire 185.4712. Oregon 181.2713. Kansas 179.4214. Iowa 177.3415. Illinois 172.7616. Colorado 170.7117. Michigan 165.4718. Indiana 165.2419. Nevada 164.7820. North Dakota 163.0021. Rhode Island 156.7822. Minnesota 156.0223. Arizona 154.94
UNITED STATES 151.92
24. Vermont 151.1325. Maine 149.0526. Ohio 146.4427. Maryland 145.4728. Washington 134.8329. Utah 130.3030. Missouri 121.8531. Texas 118.3732. Idaho 116.5133. Florida 113.7434. Pennsylvania 106.02
'35. Alaska 103.7536. Oklahoma 89.0037. Hawaii 87.3538. Virginia 82.5339. Georgia 81.8540. Delaware 76.7341. New Mexico 76.5542. Tennessee 68.3843. North Carolina 67.6644. Kentucky 64.2345. West Virginia 63.5946. Louisiana 60.3247. Mississippi 59.8448. Arkansas 58.3749. South Carolina 49.3250. Alabama 36.20
`The figure for Alaska should be re-duced about 30 percent to make the pur-chasing power comparable with that ofother areas of the United States.
Source: U.S. Department of Commerce,Bureau of the Census. Governmental Fi-nances in 1968-69. Series GF69 No. 5.Washington, D.C.: Government PrintingOffice, September 1969. p. 55.
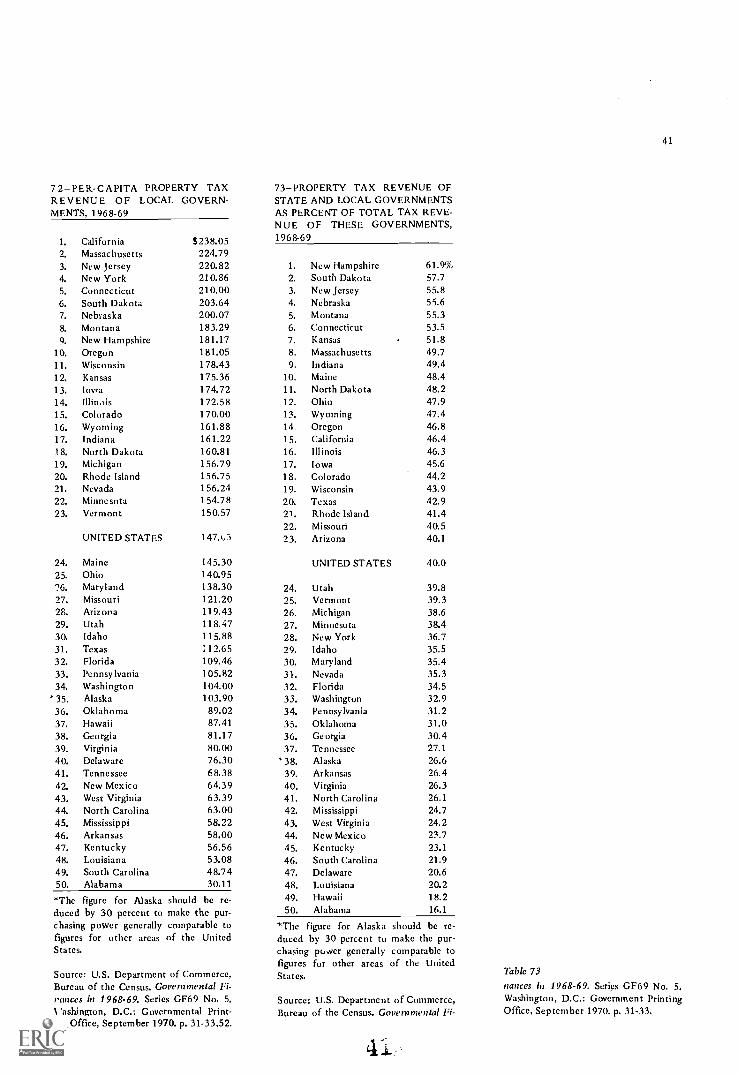
72 -PER- CAPITA PROPERTY TAXREVENUE OF LOCAL GOVERN-MENTS, 1968-69
1. California S238.052. Massachusetts 224.793. New Jersey 220.824. New York 210.865. Connecticut 210.006. South Dakota 203.647. Nebraska 200.078. Montana 183.299. New Hampshire 181.17
10. Oregon 181.0511. Wisconsin 178.4312. Kansas 175.3613. Iowa 174.7214. Illinois 172.5815. Colorado 170.0016. Wyoming 161.8817. Indiana 161.2218. North Dakota 160.8119. Michigan 156.7920. Rhode Island 156.7521. Nevada 156.2422. Minnesota 154.7823. Vermont 150.57
UNITED STATES 147.t,1
24. Maine 145.3025. Ohio 140.95
Maryland 138.3027. Missouri 121.2028. Arizona 119.4329. Utah 118.4730. Idaho 115.8831. Texas 112.6532. Florida 109.4633. Pennsylvania 105.8234. Washington 104.00
*35. Alaska 103.9036. Oklahoma 89.0237. Hawaii 87.4138. Georgia 81.1739. Virginia 80.0040. Delaware 76.3041. Tennessee 68.3842. New Mexico 64.3943. West Virginia 63.3944. North Carolina 63.0045. Mississippi 58.2246. Arkansas 58.0047. Kentucky 56.5648. Louisiana 53.0849. South Carolina 48.7450. Alabama 30.11
*The figure for Alaska should be re-duced by 30 percent to make the pur-chasing power generally comparable tofigures for other areas of the UnitedStates.
Source: U.S. Department of Commerce,Bureau of the Census. Governmental Vi-l'atICeS in 1968-69. Series GF69 No. 5.1 'ashington, D.C.: Governmental Print-i tg Office, September 1970. p. 31-33,52.
73-PROPERTY TAX REVENUE OFSTATE AND LOCAL GOVERNMENTSAS PERCENT OF TOTAL TAX REVE-NUE OF THESE GOVERNMENTS,1968-69
1. New Hampshire 61.9%2. South Dakota 57.73. New Jersey 55.84. Nebraska 55.65. Montana 55.36. Connecticut 53.57. Kansas 51.88. Massachusetts 49.79. Indiana 49.4
10. Maine 48.411. North Dakota 48.212. Ohio 47.913. Wyoming 47.414 Oregon 46.815. California 46.416. Illinois 46.317. Iowa 45.618. Colorado 44.219. Wisconsin 43.920. Texas 42.921. Rhode Island 41.422. Missouri 40.523. Arizona 40.1
UNITED STATES 40.0
24. Utah 39.825. Vermont 39.326. Michigan 38.627. Minnesota 38.428. New York 36.729. Idaho 35.530. Maryland 35.431. Nevada 35.332. Florida 34.533. Washington 32.934. Pennsylvania 31.235. Oklahoma 31.036. Georgia 30.437. Tennessee 27.138. Alaska 26.639. Arkansas 26.440. Virginia 26.341. North Carolina 26.142. Mississippi 24.743. West Virginia 24.244. New Mexico 23.745. Kentucky 23.146. South Carolina 21.947. Delaware 20.648. Louisiana 20.249. Hawaii 18.250. Alabama 16.1
The figure for Alaskaduccd by 30 percent tochasing power generallyfigures for other areas of the UnitedStates.
should be re-make the pur-comparable to
Source: U.S. Department of Commerce,Bureau of the Census. Governmental Vi-
4
41
Table 73
;lances in 1968-69. Series GF69 No. 5.Washington, D.C.: Government PrintingOffice, September 1970. p. 31-33.
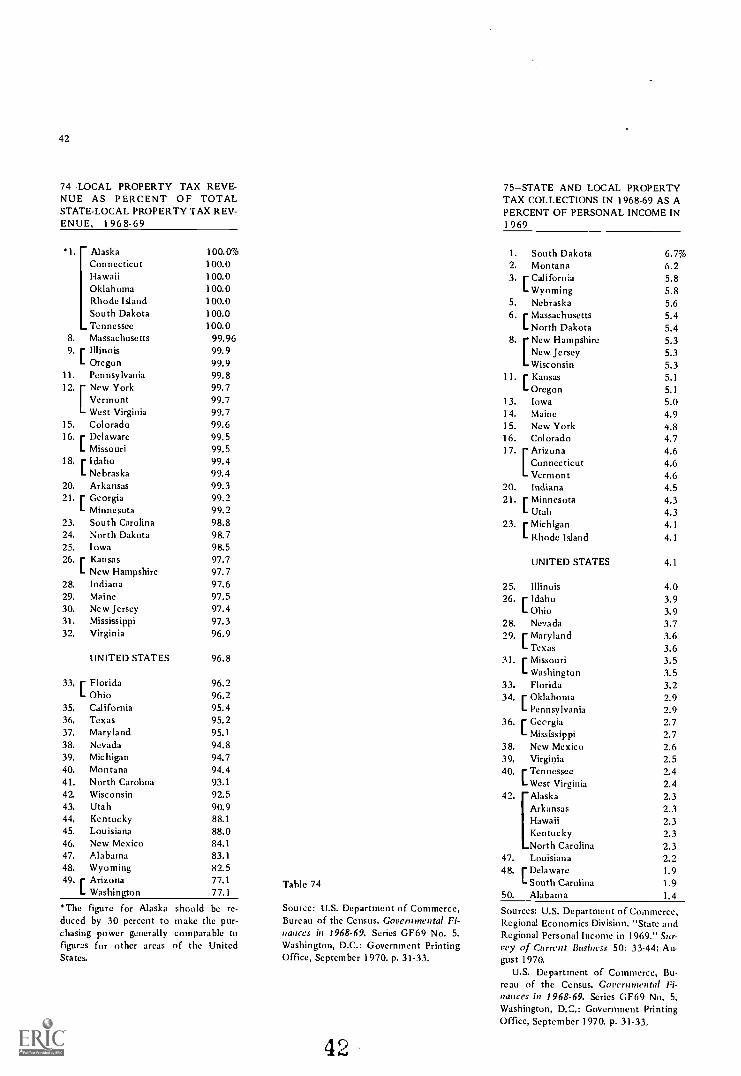
42
74-LOCAL PROPERTY TAX REVE-NUE AS PERCENT OF TOTALSTATE-LOCAL PROPERTY TAX REV-ENUE, 1 96 8-69
*1. AlaskaConnecticutHawaiiOklahomaRhode IslandSouth DakotaTennessee
8. Massachusetts9. r Illinois
L Oregon11. Pennsylvania
[New YorkVermontWest Virginia
15. Colorado16. r Delaware
L Missouri18. r Idaho
L Nebraska20. Arkansas21. r Georgia
L Minnesota23. South Carolina24. North Dakota25. Iowa
26.[KansasNew Hampshire
28. Indiana29. Maine30. New Jersey31. Mississippi32. Virginia
UNITED STATES
33. r FloridaL Ohio
35. California36. Texas37. Maryland38. Nevada39. Michigan40. Montana41. North Carolina42. Wisconsin43. Utah44. Kentucky45. Louisiana46. New Mexico47. Alabama48. Wyoming49. r Arizona
L Washington
100.0%100.0100.0100.0100.0100.0100.0
99.9699.999.999.899.799.799.799.699.599.599.499.499.399.299.298.898.798.597.797.797.697.597.497.396.9
96.8
96.296.295.495.295.194.894.794.493.192.590.988.188.084.183.182.577.177.1
*The figure for Alaska should be re-duced by 30 percent to make the pur-chasing power generally comparable tofigures for other areas of the UnitedStates.
Table 74
Source: U.S. Department of Commerce,Bureau of the Census. Governmental Fi-nances in 1968-69. Series GF69 No. 5.Washington, D.C.: Government PrintingOffice, September 1970. p. 31-33.
42
75-STATE AND LOCAL PROPERTYTAX COLLECTIONS IN 1968-69 AS APERCENT OF PERSONAL INCOME IN1969
1. South Dakota 6.7%2. Montana 6.23. r California 5.8
L Wyoming 5.85. Nebraska 5.66. r Massachusetts 5.4
L North Dakota 5.48. r New Hampshire 5.3
LNew Jersey 5.3Wisconsin 5.3
11. r Kansas 5.1L Oregon 5.1
13. Iowa 5.014. Maine 4.915. New York 4.816. Colorado 4.717. r Arizona 4.6
Connecticut 4.6Vermont 4.6
20. Indiana 4.521. r Minnesota 4.3
L Utah 4.323. r Michigan 4.1
L Rhode Island 4.1
UNITED STATES 4.1
25. Illinois 4.026. r Idaho 3.9
L Ohio 3.928. Nevada 3.729. r Maryland 3.6
L Texas 3.631. r Missouri 3.5
L Washington 3.533. Florida 3.234. r Oklahoma 2.9
L Pennsylvania 2.936. r Geergia 2.7
L Mississippi 2.738. New Mexico 2.639. Virginia 2.540. r Tennessee 2.4
L West Virginia 2.442. Alaska 2.3
Arkansas 2.3Hawaii 2.3Kentucky 2.3North Carolina 2.3
47. Louisiana 2.248. r Delaware 1.9
L South Carolina 1.950. Alabama 1.4
Sources: U.S. Department of Commerce,Regional Economics Division. "State andRegional Personal Income in 1 969." Sur-vey of Current Business 50: 33-44; Au-gust 1970.
U.S. Department of Commerce, Bu-reau of the Census. Governmental Fi-nances in 1968-69. Series GF69 No. 5.Washington, D.C.: Government PrintingOffice, September 1970. p. 31.33.
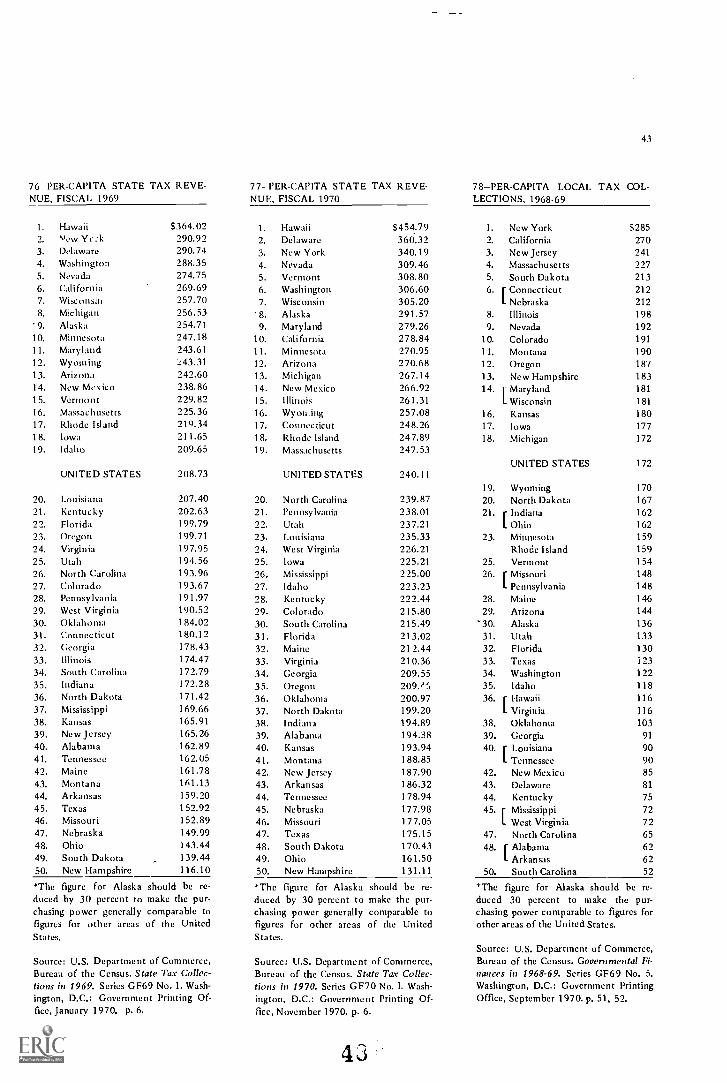
76 PER-CAPITA STATE TAX REVE-NUE, FISCAL 1969
77-PER-CAPITA STATE TAX REVE-NUE, FISCAL 1970
1. Hawaii 5364.02 1. Hawaii S454.792. New Ym-k 290.92 2. Delaware 360.323. Delaware 290.74 3. New York 340.194. Washington 288.35 4. Nevada 309.465. Nevada 274.75 5. Vermont 308.806. California 269.69 6. Washington 306.607. Wisconsin 257.70 7. Wisconsin 305.208. Michigan 256.53 8. Alaska 291.579. Alaska 254.71 9. Maryland 279.26
10. Minnesota 247.18 10. California 278.8411. Maryland 243.61 11. Minnesota 270.9512. Wyoming 243.31 12. Arizona 270.6813. Arizona 242.60 13. Michigan 267.1414. New Mexico 238.86 14. New Mexico 266.9215. Vermont 229.82 15. Illinois 261.3116. Massachusetts 225.36 16. Wyoming 257.0817. Rhode Island 219.34 17. Connecticut 248.2618. Iowa 211.65 18. Rhode Island 247.8919. Idaho 209.65 19. Massachusetts 247.53
UNITED STATES 208.73 UNITED STATES 240.11
20. Louisiana 207.40 20. North Carolina 239.8721. Kentucky 202.63 21. Pennsylvania 238.0122. Florida 199.79 22, Utah 237.2123. Oregon 199.71 23. Louisiana 235.3324. Virginia 197.95 24. West Virginia 226.2125. Utah 194.56 25. Iowa 225.2126. North Carolina 193.96 26. Mississippi 225.0027. Colorado 193.67 27. Idaho 223.2328. Pennsylvania 191.97 28. Kentucky 222.4429. West Virginia 190.52 29. Colorado 215.8030. Oklahoma 184.02 30. South Carolina 215.4931. Connecticut 180.12 31. Florida 213.0232. Georgia 178.43 32. Maine 212.4433. Illinois 174.47 33. Virginia 210.3634. South Carolina 172.79 34. Georgia 209.5535. Indiana 172.28 35. Oregon 209.'36. North Dakota 171.42 36. Oklahoma 200.9737. Mississippi 169.66 37. North Dakota 199.2038. Kansas 165.91 38. Indiana 194.8939. New Jersey 165.26 39. Alabama 194.3840. Alabama 162.89 40. Kansas 193.9441. Tennessee 162.05 41. Montana 188.8542. Maine 161.78 42. New Jersey 187.9043. Montana 161.13 43. Arkansas 186.3244. Arkansas 159.20 44. Tennessee 178.9445. Texas 152.92 45. Nebraska 177.9846. Missouri 152.89 46. Missouri 177.0547. Nebraska 149.99 47. Texas 175.1548. Ohio 143.44 48. South Dakota 170.4349. South Dakota 139.44 49. Ohio 161.5050. New Hampshire 116.10 50. New Hampshire 131.11
*The figure for Alaska should be re-duced by 30 percent to make the pur-chasing power generally comparable tofigures for other areas of the UnitedStates.
Source: U.S. Department of Commerce,Bureau of the Census. State Tax Collec-tions in 1969. Series GF69 No. 1. Wash-ington, D.C.: Government Printing Of-fice, January 1970. p. 6.
'The figure for Alaskaduced by 30 percent to make the pur-chasing power generally comparable tofigures for other areas of the UnitedStates.
should be re-
Source: U.S. Department of Commerce,Bureau of the Census. State Tax Collec-tions in 1970. Series GF70 No. 1. Wash-ington, D.C.: Government Printing Of-fice, November 1970. p. 6.
43
78-PER-CAPITA LOCAL TAX COL-LECTIONS, 1968-69
1. New York S2852. California 2703. New Jersey 2414. Massachusetts 2275. South Dakota 2136. [ Connecticut 212
L Nebraska 2128. Illinois 1989. Nevada 192
10. Colorado 19111. Montana 19012. Oregon 18713. New Hampshire 18314, r Maryland 181
L Wisconsin 181
16. Kansas 18017. Iowa 17718. Michigan 172
UNITED STATES 172
19. Wyoming 17020. North Dakota 16721. r Indiana 162
L Ohio 16223. Minnesota 159
Rhode Island 15925. Vermont 15426. r Missouri 148
1- Pennsylvania 14828. Maine 14629. Arizona 14430. Alaska 13631. Utah 13332. Florida 13033. Texas 12334. Washington 12235. Idaho 11836. r Hawaii 116
L Virginia 11638. Oklahoma 10339. Georgia 91
40. r Louisiana 90L Tennessee 90
42. New Mexico 8543. Delaware 81
44. Kentucky 7545. r Mississippi 72
L West Virginia 7247. North Carolina 6548. [ Alabama 62
1- Arkansas 6250. South Carolina 52
*The figure for Alaska should he re-duced 30 percent to make the pur-chasing power comparable to figures forother areas of the United States.
Source: U.S. Department of Commerce,Bureau of the Census. Governmental Fi-nances in 1968-69. Series GF69 No. 5.Washington, D.C.: Government PrintingOffice, September 1970. p. 51, 52.
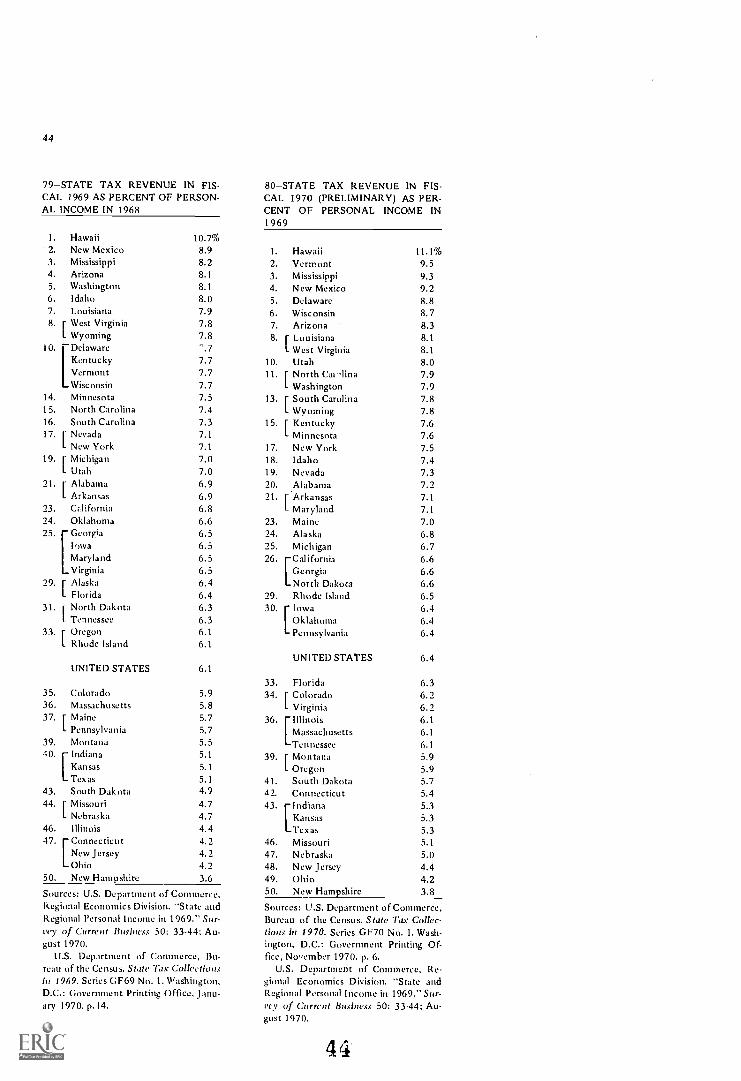
44
79-STATE TAX REVENUE IN FIS-CAL 1969 AS PERCENT OF PERSON-AL INCOME IN 1968
1. Hawaii2. New Mexico3. Mississippi4. Arizona5. Washington6. Idaho7. Louisiana
10.7%8.98.28.18.18.07.9
8. r West Virginia 7.8L Wyoming 7.8
10. DelawareKentucky 7.7Vermont 7.7Wisconsin 7.7
14. Minnesota 7.515. North Carolina 7.416. South Carolina 7.317. r Nevada 7.1
L New York 7.119. F Michigan 7.0
L Utah 7.021. r Alabama 6.9
L Arkansas 6.923. Ci-lifornia 6.824. Oklahoma 6.625. Georgia 6.5
Iowa 6.5Maryland 6.5Virginia 6.5
29. r Alaska 6.4L Florida 6.4
31. r North Dakota 6.3L Tennessee 6.3
33. r Oregon 6.1L Rhode Island 6.1
UNITED STATES 6.1
35. Colorado 5.936. Massachusetts 5.837. r Maine 5.7
L Pennsylvania 5.739. Montana 5.540. Indiana 5.1
Kansas 5.1Texas 5.1
43. South Dakota 4.944. r Missouri 4.7
L Nebraska 4.746. Illinois 4.447. Con nec tic u t 4.2
New Jersey 4.2Ohio 4.2
50. New Hampshire 3.6
Sources: U.S. Department of Commerce,Regional Economics Division. "State andRegional Personal Income in 1969." Sur-Vey of Current Business 50: 33-44; Au-gust 1970.
U.S. Department of Commerce, Bu-reau of the Census. State Tax Collectionsin 1969. Series G F69 No. 1. Washington,D.C.: Government Printing Office, Janu-ary 1970. p. 14.
80-STATE TAX REVENUE IN FIS-CAL 1970 (PRELIMINARY) AS PER-CENT OF PERSONAL INCOME IN1969
1. Hawaii 11.1%2. Vermont 9.53. Mississippi 9.34. New Mexico 9.25. Delaware 8.86. Wisconsin 8.77. Arizona 8.38. 1 Louisiana 8.1
I West Virginia 8.110. Utah 8.011. r North Catalina 7.9
I Washington 7.913. r South Carolina 7.8
I Wyoming 7.815. r Kentucky 7.6
L Minnesota 7.617. New York 7.518. Idaho 7.419. Nevada 7.320. Alabama 7.221. r Arkansas 7.1
L Maryland 7.123. Maine 7.024. Alaska 6.825. Michigan 6.726. California 6.6
Georgia 6.6North Dakota 6.6
29. Rhode Island 6.530. Iowa 6.4
Oklahoma 6.4Pennsylvania 6.4
UNITED STATES 6.4
33. Florida 6.334. r Colorado 6.2
L Virginia 6.26.1[Illinois
Massachusetts 6.1Tennessee 6.1
39. r Montana 5.9L Oregon 5.9
41. South Dakota 5.742. Connecticut 5.443. Indiana 5.3
Kansas 5.3Texas 5.3
46. Missouri 5.147. Nebraska 5.048. New Jersey 4.449. Ohio 4.250. New Hampshire 3.8
Sources: U.S. Department of Commerce,Bureau of the Census. State Tax Collec-tions in 1970. Series GF70 No. 1. Wash-ington, D.C.: Government Printing Of-fice, November 1970. p. 6.
U.S. Department of Commerce, Re-gional Economics Division. "State andRegional Personal Income in 1969." Sur-vey of Current Business 50: 33.44; Au-gust 1970.
44
45
SCHOOL REVENUE
81Public-School Revenue Receipts per Pupil in Average Daily Attendance,1969-70 (Revised) 46
82Public-School Revenue Receipts per Pupil in Average Daily Attendance,1970-71 46
83Public-School Revenue Receipts, 1969-70, as Percent of PersonalIncome, 1969 47
84Local and State Revenue Receipts for Public Schools in 1969-70 asPercent of Personal Income, 1969 47
85Estimated Percent of Revenue for Public Elementary and SecondarySchools from Local Governments, 1969-70 (Revised) 47
86Estimated Percent of Revenue for Public Elementary and SecondarySchools from Local Governments, 1970-71 48
87Estimated Percent of Revenue for Public Elementary and SecondarySchools from State Governments, 1969-70 (Revised) 48
88Estimated Percent of Revenue for Pub c Elementary and SecondarySchools from State Governments, 1970-71 49
89Estimated Percent of Revenue for Public Elementary and SecondarySchools from the Federal Government, 1969-70 (Revised) 49
90Estimated Percent of Revenue for Public Elementary and SecondarySchools from the Federal Government, 1970-71 50
91Local Public-School Revenue as Percent of State and Local SchoolRevenue, 1970-71 50
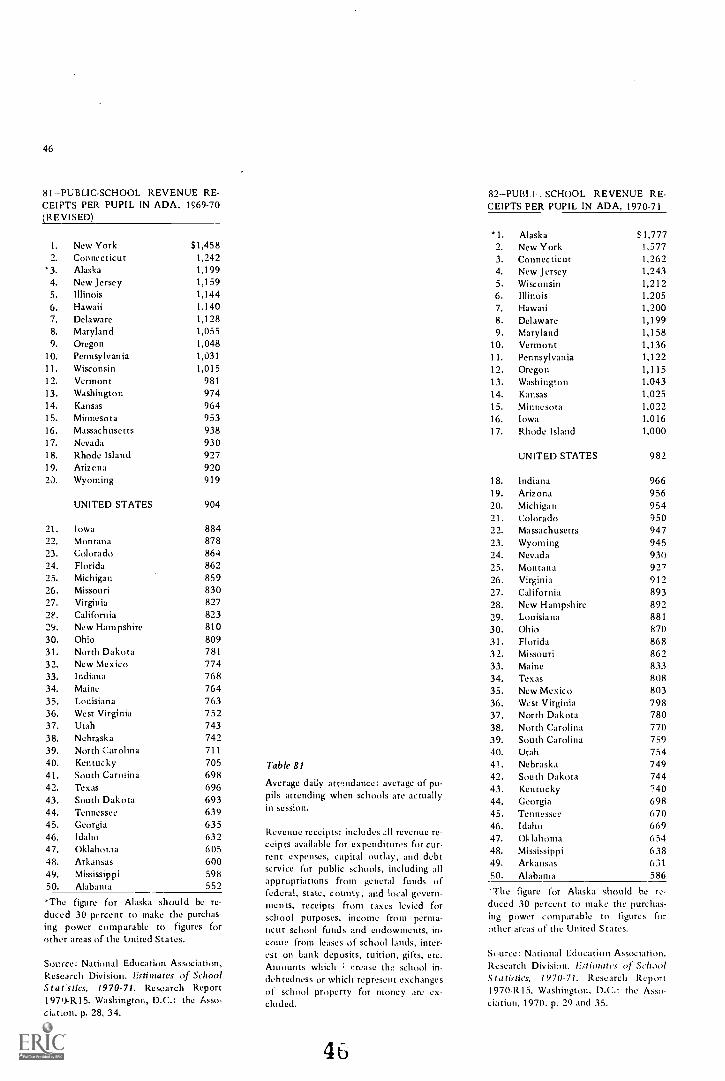
46
81-PUBLIC-SCHOOL REVENUE RE-CEIPTS PER PUPIL IN ADA, 1969-70(REVISED)
1. New York S1,4582. Connecticut 1,242
'3. Alaska 1,1994. New Jersey 1,1595. Illinois 1,1446. Hawaii 1,1407, Delaware 1,1288. Maryland 1,0559. Oregon 1,048
10. Pennsylvania 1,03111. Wisconsin 1,01512. Vermont 981
13. Washington 97414. Kansas 96415. Minnesota 95316. Massachusetts 93817. Nevada 93018. Rhode Island 92719. Arizona 9202J. Wyoming 919
UNITED STATES 904
21. Iowa 8842'2, Montana 87823. Colorado 86424. Florida 86225. Michigan 85926. Missouri 83027. Virginia 82721'. California 82329. New Hampshire 81030. Ohio 80931. North Dakota 781
32. New Mexico 77433. Indiana 76834. Maine 76435. Louisiana 76336. West Virginia 75237. Utah 74338. Nebraska 74239. North Carolina 71140. Kentucky 70541. South Carolina 69842. Texas 69643. South Dakota 69344. Tennessee 63945. Georgia 63546. Idaho 63247. Oklahoma 60548. Arkansas 60049. Mississippi 59850. Alabama 552
'The figure for Alaska should be re-duced 30 percent to make the purchas-ing power comparable to figures forother areas of the United States.
Source: National Education Association,Research Division. Estimates of SchoolSlat: sties, 1970-71. Research Report1970-R15. Washington, D.C.: the Asso-cLtion, p. 28, 34.
Table 81
Average daily attendance: average of pu-pils attending when schools are actuallyin session.
Revenue receipts: includes ::II revenue re-ceipts available for expenditures for cur-rent expenses, capital outlay, and debtservice for public schools, including allappropriations from general funds offederal, state, county, and local govern-ments, receipts from taxes levied forschool purposes,' income front perma-nent school funds and endowments, in-come front leases of school lands, inter-est on bank deposits, tuition, gifts, etc.Amounts which ; crease the school in-debtedness or which represent exchangesof school property for money are ex-cluded.
4.
82 -PUB! :-SCHOOL REVENUE RE-CEIPTS PER PUPIL IN ADA, 1970-71
*1. Alaska S1,7772. New York 1,5773. Connecticut 1,2624. New Jersey 1,2435, Wisconsin 1,2126. Illinois 1,2057. Hawaii 1,2008. Delaware 1,1999. Maryland 1,158
10. Vermont 1,13611. Pennsylvania 1,12212. Oregon 1,11513. Washington 1,04314. Kansas 1,02515. Minnesota 1,02216. Iowa 1,01617. Rhode Island 1,000
UNITED STATES 982
18. Indiana 96619. Arizona 95620. Michigan 95421. Colorado 95022. Massachusetts 94723. Wyoming 94524. Nevada 93025. Montana 92726. Virginia 91227. California 89328. New Hampshire 89229. Louisiana 881
30. Ohio 87031. Florida 86832. Missouri 86233. Maine 83334. Texas 80835. New Mexico 80336. West Virginia 79837. North Dakota 78038. North Carolina 77039. South Carolina 75940. Utah 75441. Nebraska 74942. South Dakota 74443. Kentucky 74044. Georgia 69845. Tennessee 67046. Idaho 66947. Oklahoma 65448. Mississippi 63849. Arkansas 63150. Alabama 586
The figure for Alaska should he re-
duced 30 percent to make the purchas-ing power comparable to figures forother areas of the United States.
Source: National Education Association,Research Division. Estimates of SchoolStatistics, 1970-71. Research Report1970-R15, Washington, D.C.: the Asso-ciation, 1970. p. 29 and 35.
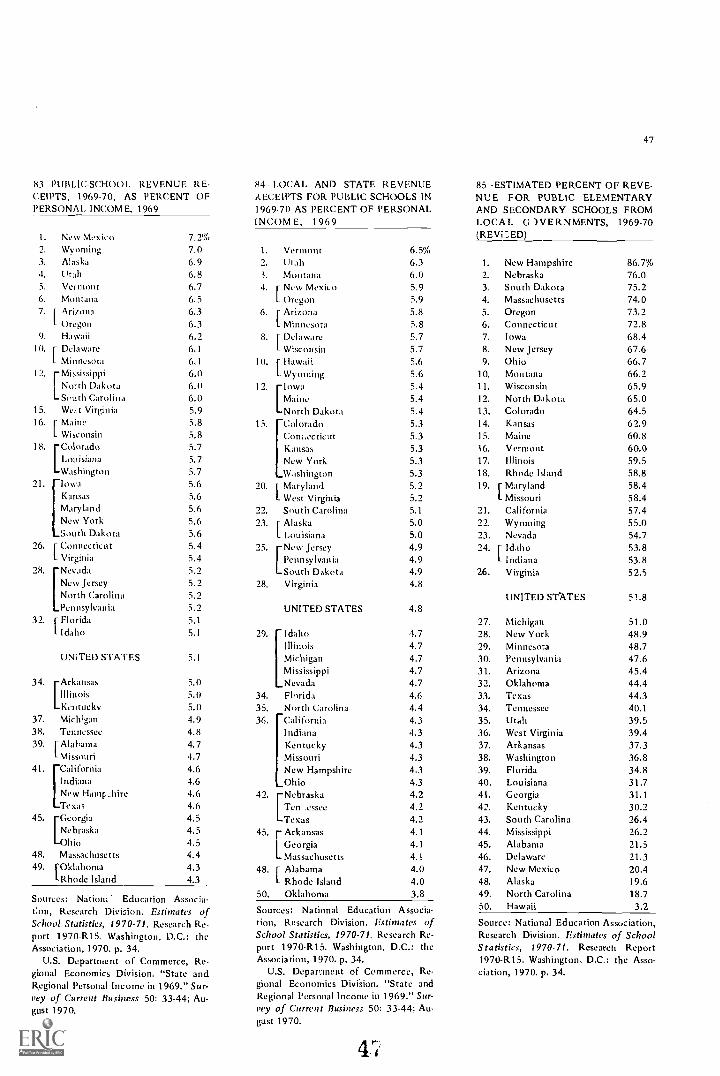
8.3 PUBLIC-SCHOOL REVENUE RE-CEIPTS, 1969-70, AS PERCENT OFPERSONAL. INCOME, 1969
1. New Mexico2. Wyoming3. Alaska4. Utah5. Verinont6. Montana7. 1 Arizona
L Oregon
7.2%7.06.96.86.76.56.36.3
9. Hawaii 6.210. r Delaware 6.1
L Minnesota 6.112. r Mississippi 6.0
1North Dakota 6.0
L South Carolina 6.015. West Virginia 5.916. r Maine 5.8
L Wisconsin 5.85.7[Colorado
Louisiana 5.7Washington 5.7
21. Iowa 5.6Kansas 5.6Maryland 5.6New York 5.6South Dakota
26. r connecticut5.65.4
I- Virginia 5.428. Nevada 5.2
New Jersey 5.2North Carolina 5.2Pennsylvania 5.2
32. r Florida 5.1
L Idaho 5.1
UNiTED STATES 5.1
34. Arkansas 5.0Illinois 5.0Kentucky 5.0
37. Michigan 4.938. Tennessee 4.839. [Alabama 4.7
L Missouri 4.741. California 4.6
Indiana 4.6New Hanm:hire 4.6Texas 4.6
4.5[GeorgiaNebraska 4.5Ohio 4.5
48. Massachusetts 4.449. [Oklahoma 4.3
I-Rhode Island 4.3
Sources: Nation: Education Associa-tion, Research Division. Estimates ofSchool Statistics, 1970-71. Research Re-port 1970-R15. Washington, D.C.: theAssociation, 1970. p. 34.
U.S. Department cif Commerce, Re-gional Economics Division. "State andRegional Personal Income in 1969." Sur-vey of Current Business 50: 33-44; Au-gust 1970.
84 LOCAL AND STATE REVENUE
47
85-ESTIMATED PERCENT OF REVE-RECEIPTS FOR PUBLIC SCHOOLS IN NUE FOR PUBLIC ELEMENTARY1969-70 AS PERCENT OF PERSONAL AND SECONDARY SCHOOLS FROMINCOME, 1969 LOCAL C )V E RNMENTS,
(REVILED)1969-70
1. Vermont 6.5%2. Utah 6.3 1. New Hampshire 86.7%3. Montana 6.0 2. Nebraska 76.04. r New Mexico 5.9 3. South Dakota 75.2
L Oregon 5.9 4. Massachusetts 74.06. 1 Arizona 5.8 5. Oregon 73.2
L Minnesota 5.8 6. Connecticut 72.88. r Delaware 5.7 7. Iowa 68.4
L Wisconsin 5.7 8. New Jersey 67.610. [ Hawaii 5.6 9. Ohio 66.7
L Wyoming 5.6 10. Montana 66.212. Iowa 5.4 11. Wisconsin 65.9
Maine 5.4 12. North Dakota 65.0North Dakota 5.4 13. Colorado 64.5
15. Colorado 5.3 14. Kansas 62.9Connecticut 5.3 15. Maine 60.8Kansas 5.3 16. Vermont 60.0New York 5.3 17. Illinois 59.5Washington 5.3 18. Rhode Island 58.8
20. i Maryland 5.2 19. r Maryland 58.4L West Virginia 5.2 L Missouri 58.4
22. South Carolina 5.1 21. California 57.423. ( Alaska 5.0 22. Wyoming 55.0
L Louisiana 5.0 23. Nevada 54.725. New Jersey 4.9 24. [ Idaho 53.8
Pennsylvania 4.9 L Indiana 53.8South Dakota 4.9 26. Virginia 52.5
28. Virginia 4.8UNITED STATES 51.8
UNITED STATES 4.827. Michigan 51.0
29. Idaho 4.7 28. New York 48.9Illinois 4.7 29. Minnesota 48.7Michigan 4.7 30. Pennsylvania 47.6Mississippi 4.7 31. Arizona 45.4Nevada 4.7 32. Oklahoma 44.4
34. Florida 4.6 33. Texas 44.335. North Carolina 4.4 34. Tennessee 40.136. California 4.3 35. Utah 39.5
Indiana 4.3 36. West Virginia 39.4Kentucky 4.3 37. Arkansas 37.3Missouri 4.3 38. Washington 36.8New Hampshire 4.3 39. Florida 34.8Ohio 4.3 40. Louisiana 31.7
4.2 41. Georgia 31.1[NebraskaTen .essee 4.2 42. Kentucky 30.2Texas 4.2 43. South Carolina 26.4
4.1 44. Mississippi 26.2[ArkansasGeorgia 4.1 45. Alabama 21.5Massachusetts 4.1 46. Delaware 21.3
48. r Alabama 4.0 47. New Mexico 20.4L Rhode Island 4.0 48. Alaska 19.6
50. Oklahoma 3.8 49. North Carolina 18.7
Sources: National Education Associa- 50. Hawaii 3.2
tion, Research Division. Estimates ofSchool Statistics, 1970-71. Research Re-port 1970-R15. Washington, D.C.: theAssociation, 1970. p. 34.
U.S. Depanment of Commerce, Re-gional Economics DiviSion. "State andRegional Personal Income in 1969." Sur-vey of Current Business 50: 33-44; Au-gust 1970.
4.
Source: National Education Association,Research Division. Estimates of SchoolStatistics, 1970-71. Research Report1970-R15. Washington, D.C.: the Asso-ciation, 1970. p. 34.
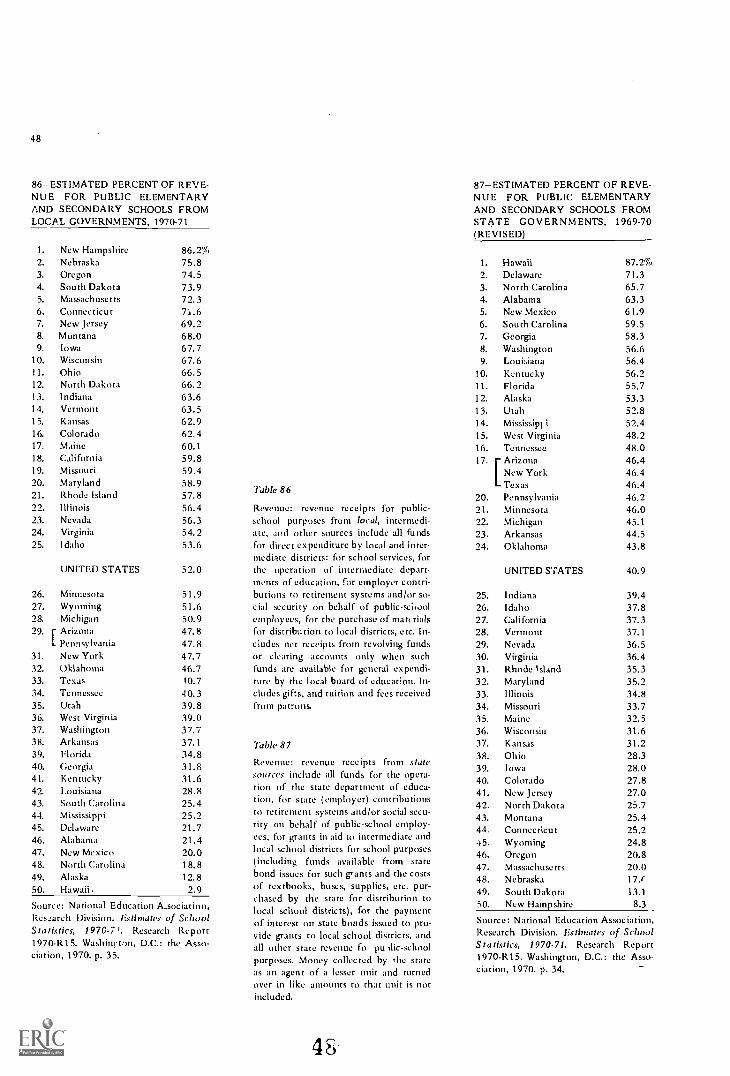
48
86-ESTIMATED PERCENT OF REVE-NUE FOR PUBLIC ELEMENTARYAND SECONDARY SCHOOLS FROMLOCAL GOVERNMENTS, 1970-71
1. New Hampshire 86.2%2. Nebraska 75.83. Oregon 74.54. South Dakota 73.95. Massachusetts 72.36. Connecticut 7).67. New Jersey 69.28. Montana 68.09. Iowa 67.7
10. Wisconsin 67.611. Ohio 66.512. North Dakota 66.213. Indiana 63.614. Vermont 63.515. Kansas 62.916. Colorado 62.417. Maine 60.118. California 59.819. Missouri 59.420. Maryland 58.921. Rhode Island 57.822. Illinois 56.423. Nevada 56.324. Virginia 54.225. Idaho 53.6
UNITED STATES 52.0
26. Minnesota 51.927. Wyoming 51.628. Michigan 50.929. Arizona 47.8
Pennsylvania 47.831. New York 47.732. Oklahoma 46.733. Texas 10.734. Tennessee 40.335. Utah 39.836. West Virginia 39.037. Washington 37.738. Arkansas 37.139. Florida 34.840. Georgia 31.841. Kentucky 31.642. Louisiana 28.843. South Carolina 25.444. Mississippi 25.245. Delaware 21.746. Alabama 21.447. New Mexico 20.048. North Carolina 18.849. Alaska 12.850. Hawaii. 2.9
Source: National Education A.sociation,Res.:arch Division. Estimates of SchoolStatistics, 1970-7 Research Report1970-R15. Washinrvm, D.C.: the Asso-ciation, 1970. p. 35.
Table 86
Revenue: revenue receipts for public-school purposes from local, intermedi-ate, and other sources include all fundsfor direct expenditure by local and inter-mediate districts: for school services, forthe operation of intermediate depart-ments of education, for employer contri-butions to retirement systems and/or so-cial security on behalf of public - schoolemployees, for the purchase of materialsfor distribution to local districts, etc. In-cludes net receipts from revolving fundsor clearing accounts only when suchfunds are available for general expendi-ture by the local board of education. In-cludes gifts, and tuition and fees receivedfrom patrons.
Thble 87
Revenue: revenue receipts from statesources include all funds for the opera-tion of the state department of educa-tion, for state (employer) contributionsto retirement systems and/or social secu-rity on behalf of public-school employ-ees, for grants in aid to intermediate andlocal school districts for school purposes(including funds available from statebond issues for such grants and the costsof textbooks, buses, supplies, etc. pur-chased by the state for distribution tolocal school districts), for the paymentof interest on state bonds issued to pro-vide grants to local school districts, andall other state revenue fo: pu die- schoolpurposes. Money collected by the stateas an agent of a lesser unit and turnedover in like amounts to that unit is notincluded.
4S
87-ESTIMATED PERCENT OF REVE-NUE FOR PUBLIC ELEMENTARYAND SECONDARY SCHOOLS FROMSTATE GOVERNMENTS, 1969-70(REVISED)
1. Hawaii 87.2%9, Delaware 71.33. North Carolina 65.74. Alabama 63.35. New Mexico 61.96. South Carolina 59.57. Georgia 58.38. Washington 56.69. Louisiana 56.4
10. Kentucky 56.211. Florida 55.712. Alaska 53.313. Utah 52.814. Mississipl i 52.415. West Virginia 48.216. Tennessee 48.017. r Arizona 46.4
New York 46.4Texas 46.4
20. Pennsylvania 46.221. Minnesota 46.022. Michigan 45.123. Arkansas 44.524. Oklahoma 43.8
UNITED STATES 40.9
25. Indiana 39.426. Idaho 37.827. California 37.328. Vermont 37.129. Nevada 36.530. Virginia 36.431. Rhode island 35.332. Maryland 35.233. Illinois 34.834. Missouri 33.735. Maine 32.536. Wisconsin 31.637. Kansas 31.238. Ohio 28.339. Iowa 28.040. Colorado 27.841. New Jersey 27.042. North Dakota 25.743. Montana 25.444. Connecticut 25.245. Wyoming 24.846. Oregon 20.847. Massachusetts 20.048. Nebraska 17.(49. South Dakota 13.150. New Hampshire 8.3
Source: National Education Association,Research Division. Estimates of SchoolStatistics, 1970-71. Research Report1970-R15. Washington, D.C.: the Asso-ciation, 1970. p. 34.
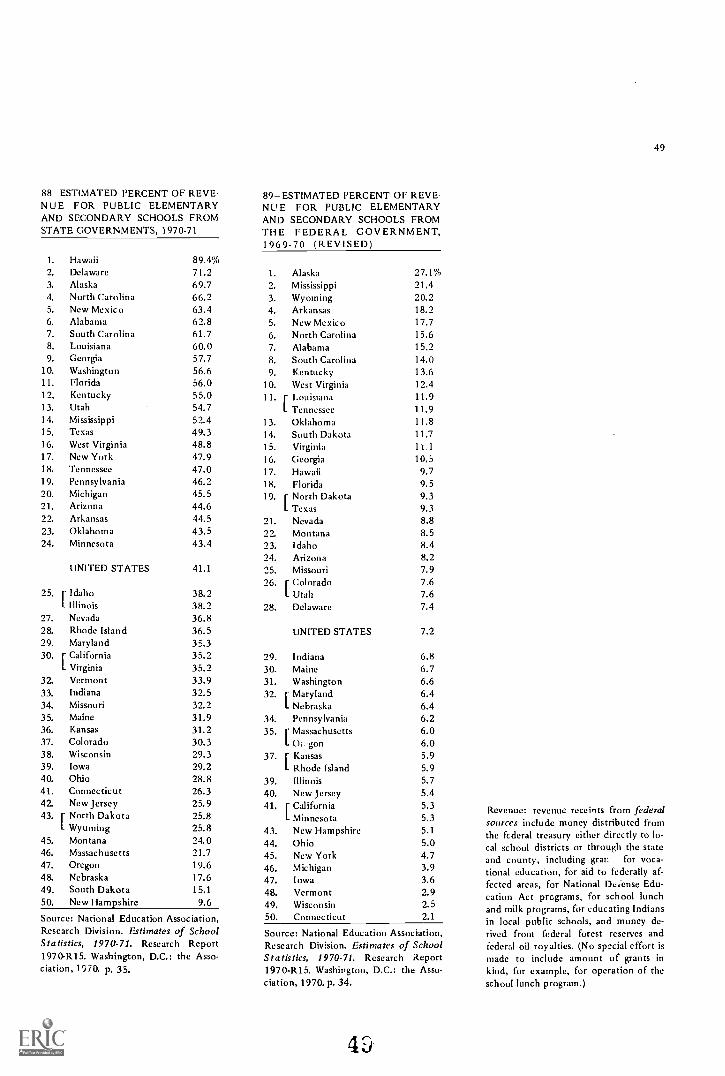
88-ESTIMATED PERCENT OF REVE-NUE FOR PUBLIC ELEMENTARYAND SECONDARY SCHOOLS FROMSTATE GOVERNMENTS, 1970-71
1. Hawaii 89.4%2. Delaware 71.23. Alaska 69.74. North Carolina 66.25. New Mexico 63.46. Alabama 62.87. South Carolina 61.78. Louisiana 60.09. Georgia 57.7
10. Washington 56.611. Florida 56.012. Kentucky 55.013. Utah 54.714. Mississippi 52.415. Texas 49.316. West Virginia 48.817. New York 47.918. Tennessee 47.019. Pennsylvania 46.220. Michigan 45.521. Arizona 44.622. Arkansas 44.523. Oklahoma 43.524. Minnesota 43.4
UNITED STATES 41.1
25. r IdahoL Illinois
27. Nevada28. Rhode Island29. Maryland30. r California
Virginia32. Vermont33. Indiana34. Missouri35. Maine36. Kansas37. Colorado38. Wisconsin39. Iowa40. Ohio41. Connecticut42. New Jersey43. r North Dakota
L Wyoming45. Montana46. Massachusetts47. Oregon48. Nebraska49. South Dakota50. New Hampshire
38.238.236.836.535.335.235.233.932.532.231.931.230.329.329.228.826.325.925.825.824.021.719.617.615.1
9.6
Source: National Education Association,Research Division. Estimates of SchoolStatistics, 1970-71. Research Report1970-R15. Washington, D.C.: the Asso-ciation, 1970, p. 35.
89-ESTIMATED PERCENT OF REVE-NUE FOR PUBLIC ELEMENTARYAND SECONDARY SCHOOLS FROMTHE FEDERAL GOVERNMENT,1969-70 (REVISED)
1. Alaska 27.1%2. Mississippi 21.43. Wyoming 20.24. Arkansas 18.25. New Mexico 17.76. North Carolina 15.67. Alabama 15.28. South Carolina 14.09. Kentucky 13.6
10. West Virginia 12.411. r Louisiana 11.9
L Tennessee 11.913. Oklahoma 11.814. South Dakota 11.715. Virginia 11.116. Georgia 10.517. Hawaii 9.718. Florida 9.519. r North Dakota 9.3
L Texas 9.321. Nevada 8.822. Montana 8.523. Idaho 8.424. Arizona 8.225. Missouri 7.926. r Colorado 7.6
1- Utah 7.628. Delaware 7.4
UNITED STATES 7.2
29. Indiana 6.830. Maine 6.731. Washington 6.632. [ Maryland 6.4
L Nebraska 6.434. Pennsylvania 6.235. r Massachusetts 6.0
L Oi 6.037. r Kansas 5.9
L Rhode Island 5.939. Illinois 5.740. New Jersey 5.441. r California 5.3
L Minnesota 5.343. New Hampshire 5.144. Ohio 5.045. New York 4.746. Michigan 3.947. Iowa 3.648. Vermont 2.949. Wisconsin 2.550. Connecticut 2.1
Source: National Education Association,Research Division. Estimates of SchoolStatistics, 1970-71. Research Report1970-R15. Washington, D.C.: the Asso-ciation, 1970. p. 34.
49
Revenue: revenue receints from federalsources include money distributed fromthe federal treasury either directly to lo-cal school districts or through the stateand county, including gran for voca-tional education, for aid to federally af-fected areas, for National De:ense Edu-cation Act programs, for school lunchand milk programs, for educating Indiansin local public schools, and money de-rived from federal forest reserves andfederal oil royalties. (No special effort ismade to include amount of grants inkind, for example, for operation of theschool lunch program.)
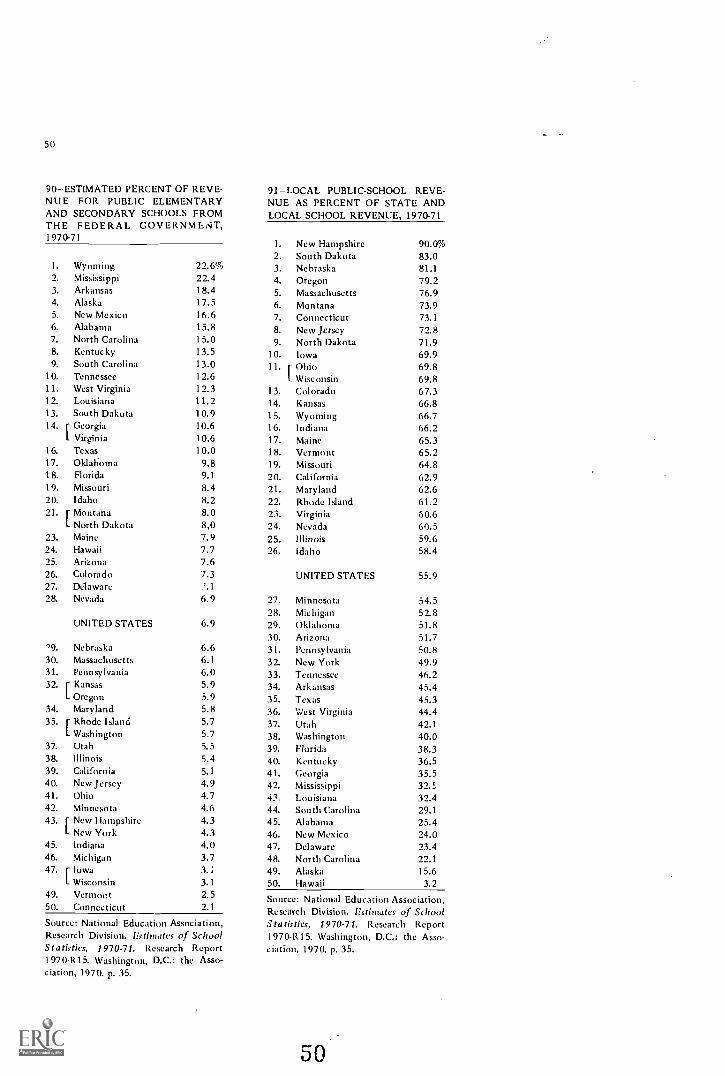
50
90-ESTIMATED PERCENT OF REVE-NUE FOR PUBLIC ELEMENTARYAND SECONDARY SCHOOLS FROMTHE FEDERAL GOVERNMEAT,1970-71
1. Wyoming 22.6%2. Mississippi 22.43. Arkansas 18.44. Alaska 17.55. New Mexico 16.66. Alabama 15.87. North Carolina 15.08. Kentucky 13.59. South Carolina 13.0
10. Tennessee 12.611. West Virginia 12.312. Louisiana 11.213. South Dakota 10.914. r Georgia 10.6
I. Virginia 10.616. Texas 10.017. Oklahoma 9.818. Florida 9.119. Missouri 8.420. Idaho 8.221. r Montana 8.0
L North Dakota 8,023. Maine 7.924. Hawaii 7.725. Arizona 7.626. Colorado 7.327. Delaware .'.1
28. Nevada 6.9
UNITED STATES 6.9
'9. Nebraska 6.630. Massachusetts 6.1
31. Pennsylvania 6.0
32.[Kansas 5.9Oregon 5.9
34. Maryland 5.835. r Rhode Island 5.7
L Washington 5.737. Utah 5.538. Illinois 5.439. California 5.1
40. New Jersey 4.941. Ohio 4.742. Minnesota 4.643. r New Hampshire 4.3
L New York 4.345. Indiana 4.046. Michigan 3.747. r Iowa 3.1
L Wisconsin 3.149. Vermont 2.550. Connecticut 2.1
Source: National Education Association,Research Division. Estimates of SchoolStatistics, 1970-71. Research Report1970-R15. Washington, D.C.: the Asso-ciation, 1970. p. 35.
91-LOCAL PUBLIC-SCHOOL REVE-NUE AS PERCENT OF STATE ANDLOCAL SCHOOL REVENUE, 1970-71
1. New Hampshire2. South Dakota3. Nebraska4. Oregon5. Massachusetts6. Montana7. Connecticut8. New Jersey9. North Dakota
10. Iowa11. r Ohio
I. Wisconsin13. Colorado14. Kansas15. Wyoming16. Indiana17. Maine18. Vermont19. Missouri20. California21. Maryland22. Rhode Island23. Virginia24. Nevada25. Illinois26. Idaho
90.0%83.081.179.276.973.973.172.871.969.969.869.867.366.866.766.265.365.264.862.962.661.260.660.559.658.4
UNITED STATES 55.9
27. Minnesota 54.528. Michigan 52.829. Oklahoma 51.830. Arizona 51.731. Pennsylvania 50.832. New York 49.933. Tennessee 46.234. Arkansas 45.435. Texas 45.336. West Virginia 44.437. Utah 42.138. Washington 40.039. Florida 38.340. Kentucky 36.541. Georgia 35.542. Mississippi 32.5.43. Louisiana 32.444. South Carolina 29.145. Alabama 25.446. New Mexico 24.047. Delaware 23.448. North Carolina 22.149. Alaska 15.650. Hawaii 3.2
Source: National Education Association,Research Division. 'Estimates of SchoolStatistics, 1970-71. Research Report1970-R.15. Washington, D.C.: the Asso-ciation, 1970. p. 35.
50
51
GOVERNMENTAL EXPENDITURES AND DEBT
92Per-Capita Total General Expenditures of the States fur all Functions,1969 52
93Per-Capita Total General Expenditures of State and Local Governments,1968-69 52
94Per-Capita Expenditure of State and Local Governments for PublicWelfare. 1968-69 53
95Per-Capita Expenditure of State and Local Governments for Healthand Hospitals. 1968-69 53
96Per-Capita Expenditure of State and Local Governments for PoliceProtection, 1968-69 54
97Per-Capita Expenditure of State and Local Governments for Fire Protection,1968-69 54
98Per-Capita Expenditure of State and Local Governments for Highways,1968-69 55
99Per-Capita Net Long-Term Debt (Full Faith and Credit Only) of StateGovernments at End of Fiscal Year, 1969 55
100Per-Capita Long-Term Debt of State and Local Governm:nts, Outstanding atEnd of Fiscal Year, 1968-69 56
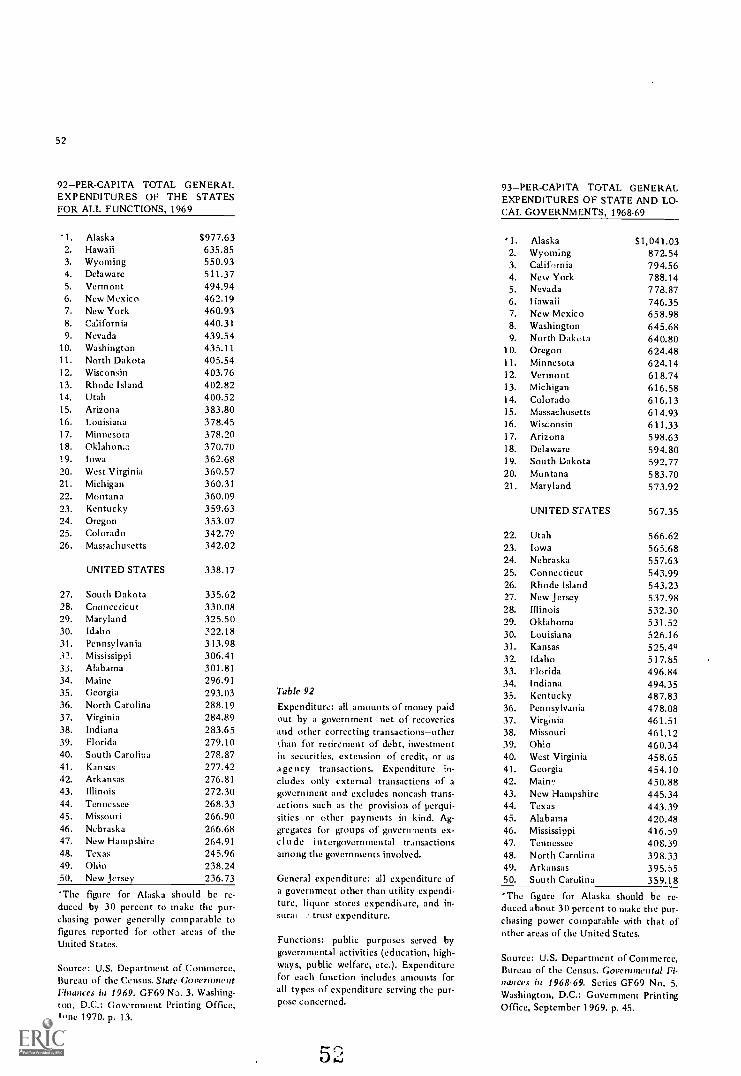
52
92-PER-CAPITA TOTAL GENERALEXPENDITURES OF THE STATESFOR ALL FUNCTIONS, 1969
'I. Alaska 8977.632. Hawaii 635.853. Wyoming 550.934. Delaware 511.375. Vermont 494.946. New Mexico 462.197. New York 460.938. California 440.319. Nevada 439.54
10. Washington 435.1111. North Dakota 405.5412. Wisconsin 403.7613. Rhode Island 402.8214. Utah 400.5215. Arizona 383.8016. Louisiana 378.4517. Minnesota 378.2018. Oklahoma 370.7019. Iowa 362.6820. West Virginia 360.5721. Michigan 360.312'2. Montana 360.0923. Kentucky 359.6324. Oregon 353.0725. Colorado 342.7926. Massachusetts 342.02
UNITED STATES 338.17
27. South Dakota 335.6228. Connecticut 330.0829. Maryland 325.5030. Idaho 322.1831. Pennsylvania 313.9832. Mississippi 306.4133. Alabama 301.8134. Maine 296.9135. Georgia 293.0336. North Carolina 288.1937. Virginia 284.8938. Indiana 283.6539. Florida 279.1040. South Carolina 278.8741. Kansas 277.4242. Arkansas 276.8143. Illinois 272.3044. Tennessee 268.3345. Missouri 266.9046. Nebraska 266.6847. New Hampshire 264.9148. Texas 245.9649. Ohio 238.2450. New Jersey 236.73
The figure for Alaska should be re-duced by 30 percent to make the pur-chasing power generally comparable tofigures reported for other areas of theUnited States.
Source: U.S. Department of Commerce,Bureau of the Census. State GovernmentFinances in 1969. G F69 No. 3. Washing-ton, D.C.: Government Printing Office,June 1970. p. 13.
Table 92
Expenditure: all amounts of money paidout by a government-net of recoveriesand other correcting transactions-otherthan for retirement of debt, investmentin securities, extension of credit, or asagency transactions. Expenditure in-cludes only external transactions of agovernment and excludes noncash trans-actions such as the provision of perqui-sides or other payments in kind. Ag-gregates for groups of governments ex-c I u de intergovernmental transactionsamong the governments involved.
General expenditure: all expenditure ofa government other than utility expendi-ture, liquor stores expenditare, and in-surai .2-trust expenditure.
Functions: public purposes served bygovernmental activities (education, high-ways, public welfare, etc.). Expenditurefor each function includes amounts forall types of expenditure serving the pur-pose concerned.
93-PER-CAPITA TOTAL GENERALEXPENDITURES OF STATE AND LO-CAL GOVERNMENTS, 1968-69
.1. Alaska 81,041.032. Wyoming 872.543. California 794.564. New York 788.145. Nevada 778.876. Hawaii 746.357. New Mexico 658.988. Washington 645.689. North Dakota 640.80
10. Oregon 624.4811. Minnesota 624.1412. Vermont 618.7413. Michigan 616.5814. Colorado 616.1315. Massachusetts 614.9316. Wisconsin 611.3317. Arizona 598.6318. Delaware 594.8019. South Dakota 592.7720. Montana 583.7021. Maryland 573.92
UNITED STATES 567.35
22. Utah 566.6223. Iowa 565.6824. Nebraska 557.6325. Connecticut 543.9926. Rhode Island 543.2327. New Jersey 537.9828. Illinois 532.3029. Oklahoma 531.5230. Louisiana 526.1631. Kansas 525.4932. Idaho 517.8533. Florida 496.8434. Indiana 494.3535. Kentucky 487.8336. Pennsylvania 478.0837. Virginia 461.5138. Missouri 461.1239. Ohio 460.3440. West Virginia 458.6541. Georgia 454.1042. Main? 450.8843. New Hampshire 445.3444. Texas 443.3945. Alabama 420.4846. Mississippi 416.o947. Tennessee 408.3948. North Carolina 398,3349. Arkansas 395.5550. South Carolina 359.18
The figure for Alaska should be re-duced about 30 percent to make the pur-chasing power comparable with that ofother areas of the United States.
Source: U.S. Department of Commerce,Bureau of the Census. Governmental Fi-nances in 1968-69. Series GF69 No. 5.Washington, D.C.: Government PrintingOffice, September 1969. p. 45.
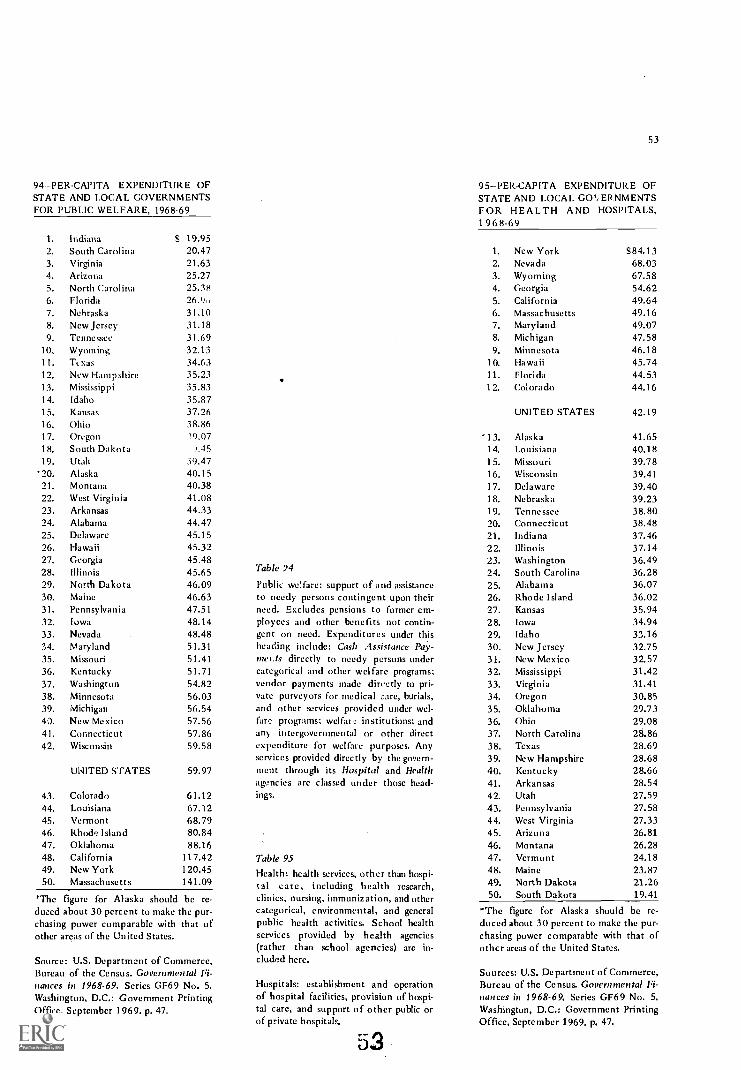
94-PER-CAPITA EXPENDITURE OFSTATE AND LOCAL GOVERNMENTSFOR l'UBLIC WELFARE, 1968-69
1. Indiana S 19.952. South Carolina 20.473. Virginia 21.634. Arizona 25.275. North Carolina 25.386. Florida 26.907. Nebraska 31.108. New Jersey 31.189. Tennessee 31.69
10. Wyoming 32.1311. Texas 34.6312. New Hampshire 35.2313. Mississippi 35.8314. Idaho 35.8715. Kansas 37.2616. Ohio 38.8617. Oregon 19.0718. South Dakota /.4519. Utah 39.47
'20. Alaska 40.1521. Montana 40.3822. West Virginia 41.0823. Arkansas 44.3324. Alabama 44.4725. Delaware 45.1526. Hawaii 45.3227. Georgia 45.4828. Illinois 45.6529. North Dakota 46.0930. Maine 46.6331. Pennsylvania 47.5132. Iowa 48.1433. Nevada 48.4834. Maryland 51.3135. Missouri 51.4136. Kentucky 51.7137. Washington 54.8238. Minnesota 56.0339. Michigan 56.5440. New Mexico 57.5641. Connecticut 57.8642. Wisconsin 59.58
UNITED STATES 59.97
43. Colorado 61.1244. Louisiana 67.1245. Vermont 68.7946. Rhode Island 80.8447. Oklahoma 88.1648. California 117.4249. New York 120.4550. Massachusetts 141.09
The figure for Alaska should be re-duced about 30 percent to make the pur-chasing power comparable with that ofother areas of the United States.
Source: U.S. Department of Commerce,Bureau of the Census. Governmental Fi-nances in 1968-69. Series GF69 No. 5.Washington, D.C.: Government PrintingOffice, September 1969. p. 47.
Table 94
Public welfare: support of and assistanceto needy persons contingent upon theirneed. Excludes pensions to former em-ployees and other benefits not contin-gent on need. Expenditures under thisheading include: Cash Assistance Pajl-tnet.ts directly to needy persons undercategorical and other welfare programs;vendor payments made directly to pri-vate purveyors for medical care, burials,and other services provided under wel-fare programs; welfat institutions; andany intergovernmental or other directexpenditure for welfare purposes. Anyservices provided directly by the govern-ment through its Hospital and Healthagencies are classed under those head-ings.
Table 95
Health: health services, other than hospi-tal care, including health research,clinics, nursing, immunization, and othercategorical, environmental, and generalpublic health activities. School healthservices provided by health agencies(rather than school agencies) are in-cluded here.
Hospitals: establishment and operationof hospital facilities, provision of hospi-tal care, and support of other public orof private hospitals.
53
53
95-PER-CAPITA EXPENDITURE OFSTATE AND LOCAL G0'; ER NMENTSFOR HEALTH A ND1 9 6 8-69
HOSPITALS,
1. New York $84.132. Nevada 68.033. Wyoming 67.584. Georgia 54.625. California 49.646. Massachusetts 49.167. Maryland 49.078. Michigan 47.589. Minnesota 46.18
10. Hawaii 45.7411. Florida 44.5312. Colorado 44.16
UNITED STATES 42.19
`13. Alaska 41.6514. Louisiana 40.1815. Missouri 39.7816. Wisconsin 39.4117. Delaware 39.4018. Nebraska 39.2319. Tennessee 38.8020. Connecticut 38.4821. Indiana 37.4622. Illinois 37.1423. Washington 36.4924. South Carolina 36.2825. Alabama 36.0726. Rhode Island 36.0227. Kansas 35.9428. Iowa 34.9429. Idaho 33.1630. New Jersey 32.7531. New Mexico 32.5732. Mississippi 31.4233. Virginia 31.4134. Oregon 30.8535. Oklahoma 29.7336. Ohio 29.0837. North Carolina 28.8638. Texas 28.6939. New Hampshire 28.6840. Kentucky 28.6641. Arkansas 28.5442. Utah 27.5943. Pennsylvania 27.5844. West Virginia 27.3345. Arizona 26.8146. Montana 26.2847. Vermont 24.1848. Maine 23.8749. North Dakota 21.2650. South Dakota 19.41
*The figure for Alaska should be re-duced about 30 percent to make the pur-chasing power comparable with that ofother areas of the United States.
Sources: U.S. Department of Commerce,Bureau of the Census. Governmental Fi-nances in 1968-69. Series GF69 No. 5.Washington, D.C.: Government PrintingOffice, September 1969. p. 47.
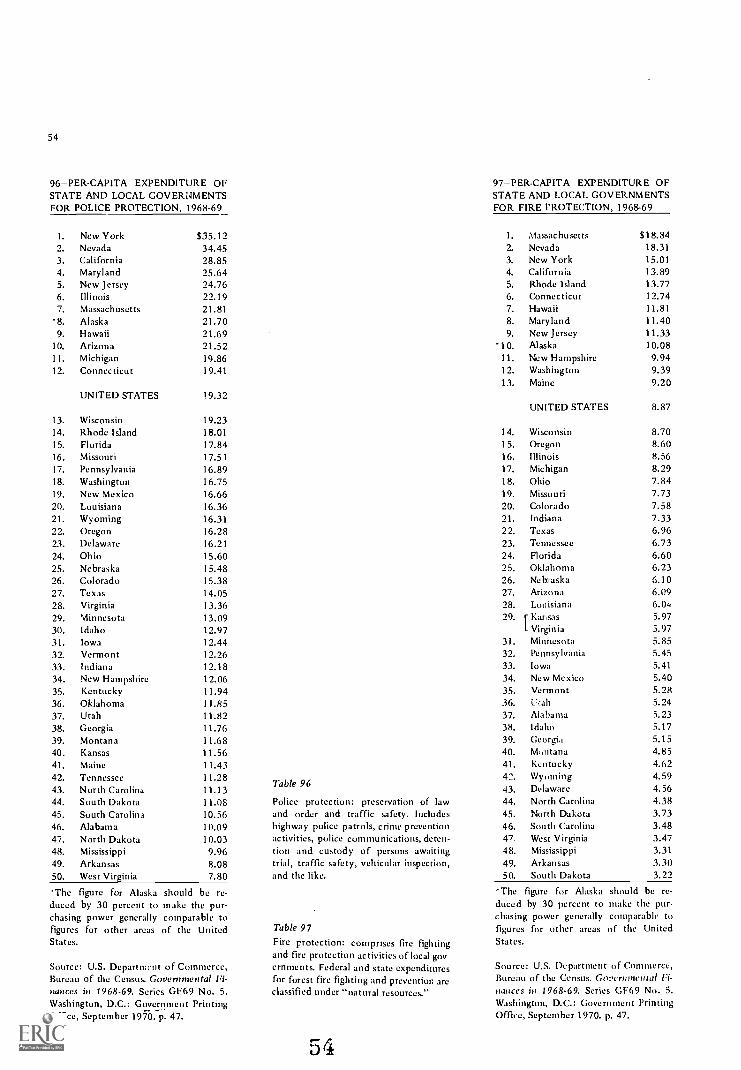
54
96-PER-CAPITA EXPENDITURE OFSTATE AND LOCAL GOVERNMENTSFOR POLICE PROTECTION, 1968-69
1. New York 335.122. Nevada 34.453. California 28.854. Maryland 25.645. New Jersey 24.766. Illinois 22.197. Massachusetts 21.818. Alaska 21.709. Hawaii 21.69
10. Arizona 21.5211. Michigan 19.8612. Connecticut 19.41
UNITED STATES 19.32
13. Wisconsin 19.2314. Rhode Island 18.0115. Florida 17.8416. Missouri 17.5117. Pennsylvania 16.8918. Washington 16.7519. New Mexico 16.6620. Louisiana 16.3621. Wyoming 16.3122. Oregon 16.2823. Delaware 16.2124. Ohio 15.6025. Nebraska 15.4826. Colorado 15.3827. Texas 14.0528. Virginia 13.3629. Minnesota 13.0930. Idaho 12.9731. Iowa 12.4432. Vermont 12.2633. Indiana 12.1834. New Hampshire 12.0635. Kentucky 11.9436. Oklahoma 11.8537. Utah 11.8238. Georgia 11.7639. Montana 11.6840. Kansas 11.5641. Maine 11.4342. Tennessee 11.2843. North Carolina 11.1344. South Dakota 11.0845. South Carolina 10.5646. Alabama 10.0947. North Dakota 10.0348. Mississippi 9.9649. Arkansas 8.0850. West Virginia 7.80
The figure for Alaska should be re-duced by 30 percent to make the pur-chasing power generally comparable tofigures for other areas of the UnitedStates.
Source: U.S. Department of Commerce,Bureau of the Census. Governmental Fi-nances in 1968-69. Series GF69 No. 5.Washington, D.C.: Government PrintingOffice, September 1970. p. 47.
mble 96
Police protection: preservation of lawand order and traffic safety. Includeshighway police patrols, crime preventionactivities, police communications, deten-tion and custody of persons awaitingtrial, traffic safety, vehicular inspection,and the like.
Table 97
Fire protection: comprises fire fightingand fire protection activities of local gov-ernments, Federal and state expendituresfor forest fire fighting and prevention areclassified under "natural resources."
54
97-PER-CAPITA EXPENDITURE OFSTATE AND LOCAL GOVERNMENTSFOR FIRE PROTECTION, 1968.69
1. Massachusetts2. Nevada3. New York4. California5. Rhode Island6. Connecticut7. Hawaii8. Maryland9. New Jersey
'10. Alaska11. New Hampshire12. Washington13. Maine
UNITED STATES
14. Wisconsin15. Oregon16. Illinois17. Michigan18. Ohio19. Missouri20. Colorado21. Indiana22. Texas23. Tennessee24. Florida25. Oklahoma26. Nebraska27. Arizona28. Louisiana29. r Kansas
L Virginia31. Minnesota32. Pennsylvania33. Iowa34. New Mexico35. Vermont36. LTall
37. Alabama38. Idaho39. Georgia40. Montana41. Kentucky42. V/yoming43. Delaware44. North Carolina45. North Dakota46. South Carolina47. West Virginia48. Mississippi49. Arkansas50. South Dakota
S18.3418.3115.0113.8913.7712.7411.8111.4011.3310.089.949.399.20
8.87
8.708.608.568.297.847.737.587.336.966.736.606.236.106.096.045.975.975.855.455.415.405.285.245.235.175.154.854.624.594.564.383.733.483.473.313.303.22
The figure for Alaska should be re-duced by 30 percent to make the pur-chasing power generally comparable tofigures for other areas of the UnitedStates.
Source: U.S. Department of Commerce,Bureau of the Census. Governmental 14-tiances in 1968-69. Series GF69 No, 5.Washington, D.C.: Government PrintingOffice, September 1970. p. 47.
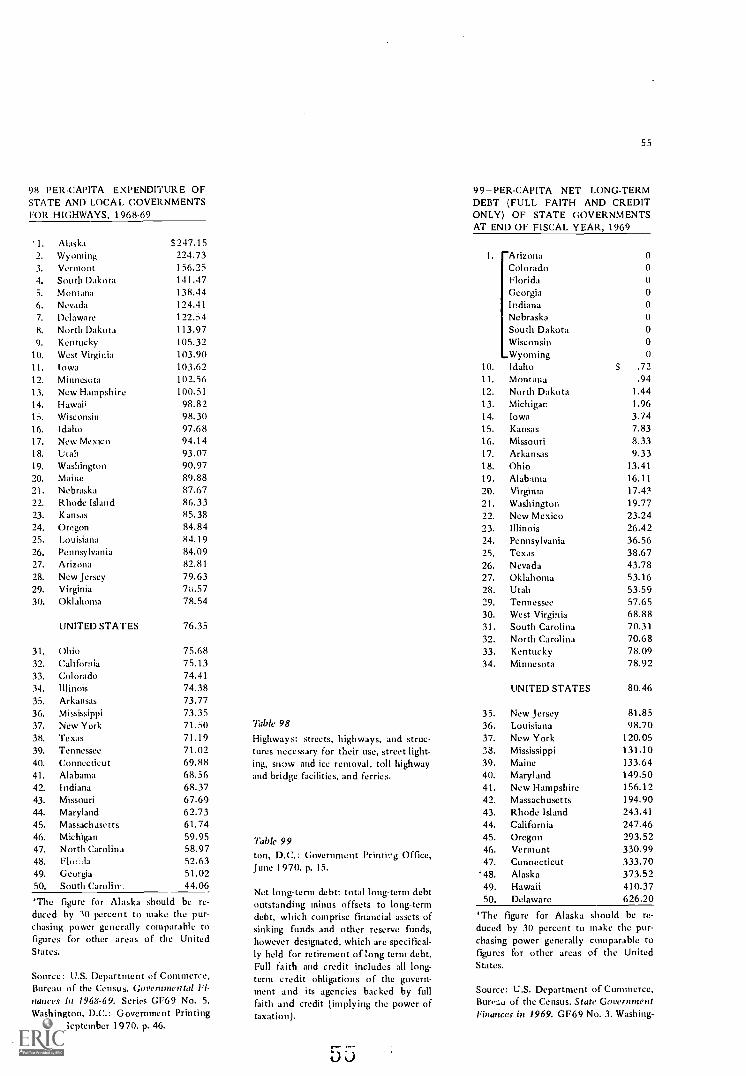
98 PER-CAPITA EXPENDITURE OFSTATE AND LOCAL GOVERNMENTSFOR HIGHWAYS, 1968-69
'1. Alaska S247.152. Wyoming 224.733. Vermont 156.254. South Dakota 141.475. Montana 138.446. Nevada 124.417. Delaware 122.548. North Dakota 113.979. Kentucky 105.32
10. West Virginia 103.9011. Iowa 103.6212. Minnesota 102.5613. New Hampshire 100.51
14. Hawaii 98.8215, Wisconsin 98.3016. Idaho 97.6817. New Mexico 94.1418. Utah 93.0719. Washington 90.9720. Maine 89.8821. Nebraska 87.6722. Rhode Island 86.3323. Kansas 85.3824. Oregon 84.8425. Louisiana 84.1926. Pennsylvania 84.0927. Arizona 82.81
28. New Jersey 79.6329. Virginia 7t,.5730. Oklahoma 78.54
UNITED STATES 76.35
31. Ohio 75.68
32. California 75.1333. Colorado 74.4134. Illinok 74.3835. Arkansas 73.7736. Mississippi 73.3537. New York 71.5038. Texas 71.1939. Tennessee 71.0240. Connecticut 69.8841. Alabama 68.5642. Indiana 68.3743. Missouri 67.6944. Maryland 62.7345. Massachusetts 61.7446. Michigan 59.9547. North Carolina 58.9748. Hot la 52.6349. Georgia 51.0250. South Carotin'. 44.06
The figure for Alaska should be re-
duced by 30 percent to make the pur-chasing power generally comparable tofigures for other areas of the UnitedStates.
Source: U.S. Department of Commerce,Bureau of the Census. Governmental Fi-nance's in 1968-69. Series GF69 No. 5.Washington, D.C.: Government PrintingOffice, September 1970. p. 46.
Table 98
Highways: streets, highways, and struc-tures necessary for their use, street light-ing, snow and ice removal, toll highwayand bridge facilities, and ferries.
Table 99ton, D.C.: Government Printkig Office,June 197(1. p. 15.
Net long-term debt: total long-term debtoutstanding minus offsets to long-termdebt, which comprise financial assets ofsinking funds and other reserve funds,however designated, which are specifical-ly held for retirement of long-term debt.Full faith and credit includes all long-term credit obligations of the govern-ment and its agencies backed by fullfaith and credit (implying the power oftaxation).
55
99-PER-CAPITA NET LONG-TERMDEBT (FULL FAITH AND CREDITONLY) OF STATE GOVERNMENTSAT END OF FISCAL YEAR, 1969
10.
11.
12.
13.
14.
15.
16.
17.
18.
19.
20.21.
22.
23.24.
25.
26.27.28.29.30.31.32.33.
34.
35.36.37.38.39.40.41.42.43.44.
45.46.47.
'48.49.50.
ArizonaColoradoFloridaGeorgiaIndianaNebraskaSouth DakotaWisconsinWyomingIdahoMontanaNorth DakotaMichiganIowaKansas
MissouriArkansasOhioAlabamaVirginiaWashingtonNew MexicoIllinoisPennsylvaniaTexasNevadaOklahomaUtahTennesseeWest VirginiaSouth CarolinaNorth CarolinaKentuckyMinnesota
0
0
0
00
00
0
0
S .72.94
1.441.963.747.838.339.33
13.4116.1117.4319.7723.2426.4236.5638.6743.7853.1653.5957.6568.8870.3170.6878.0978.92
UNITED STATES 80.46
New JerseyLouisianaNew YorkMississippiMaineMarylandNew HampshireMassachusettsRhode IslandCaliforniaOregonVermontConnecticutAlaskaHawaiiDelaware
81.8598.70
120.05131.10133.64149.50156.12194.90243.41247.46293.52330.99333.70373.52410.37626.20
*The figure for Alaska should be re-duced by 30 percent to make the pur-chasing power generally comparable tofigures for other areas of the UnitedStates.
Source: U.S. Department of Commerce,Bure....0 of the Census. State GovernmentFinances in 1969. GF69 No. 3. Washing-
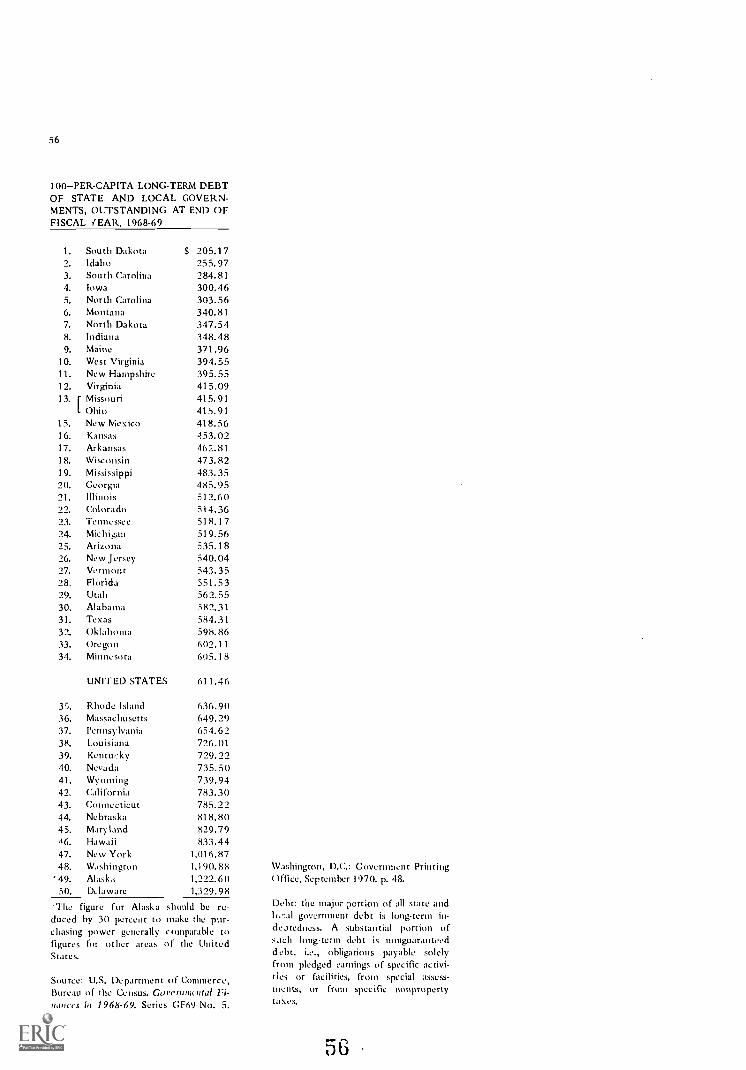
56
100-PER-CAPITA LONG-TERM DEBTOF STATE AND LOCAL GOVERN-MENTS, OUTSTANDING AT END OFFISCAL YEAR, 1968-69
1. South Dakota2. Idaho3. South Carolina4. Iowa5. North Carolina6. Montana7. North Dakota8. Indiana9. Maine
10. West Virginia11. New Hampshire12. Virginia13. r Missouri
I- Ohio15. New Mexico16. Kansas17. Arkansas18. Wisconsin19. Mississippi20. Georgia21. Illinois22. Colorado23. Tennessee24. Michigan25. Arizona26. New Jersey27. Vermont28. Florida29, Utah30. Alabama31. Texas32. Oklahoma33. Oregon34. Minnesota
35.36.37.38.39.40.41.42.43.44.45.4/6.
47.48.49.50.
S 205.17255.97284.81300.46303.56340.81347.54348.48371.96394.55395.55415.09415.91415.91418.56453.02462.81473.82483.35485.95512.60514.36518.17519.56535.18540.04543.35551.53562.55582.31584.31598.86602.11605.18
UNITED STATES 611.46
Rhode IslandMassachusettsPennsylvaniaLouisianaKentuckyNevadaWyomingCaliforniaConnecticutNebraskaMarylandHawaiiNew YorkWashingtonAlaskaDelaware
636.90649.29654.62726.01729.22735.50739.94783.30785.22818.80829.79833.44
1,016.871,190.881,222.6(11,329.98
The figure for Alaska should be re-duced by 30 percent to make the pur-chasing power generally comparable tofigures for other areas of the UnitedStates.
Source: U.S. Department of Commerce,Bureau of the Census. Covet-mm.)11.d Fi-mmees in 1968-69. Series GF69 No. 5.
Washington, D.C.: Government PrintingOffice, September 1970. p. 48.
Debt: the major portion of all state andl:al government debt is long-term in-deatedness. A substantial portion ofsad) long-term debt is nonguaranteeddebt, i.e., obligations payable solelyfrom pledged earnings of specific activi-ties or facilities, from special assess-ments, or from specific iumpropertytaxes.
17?
U
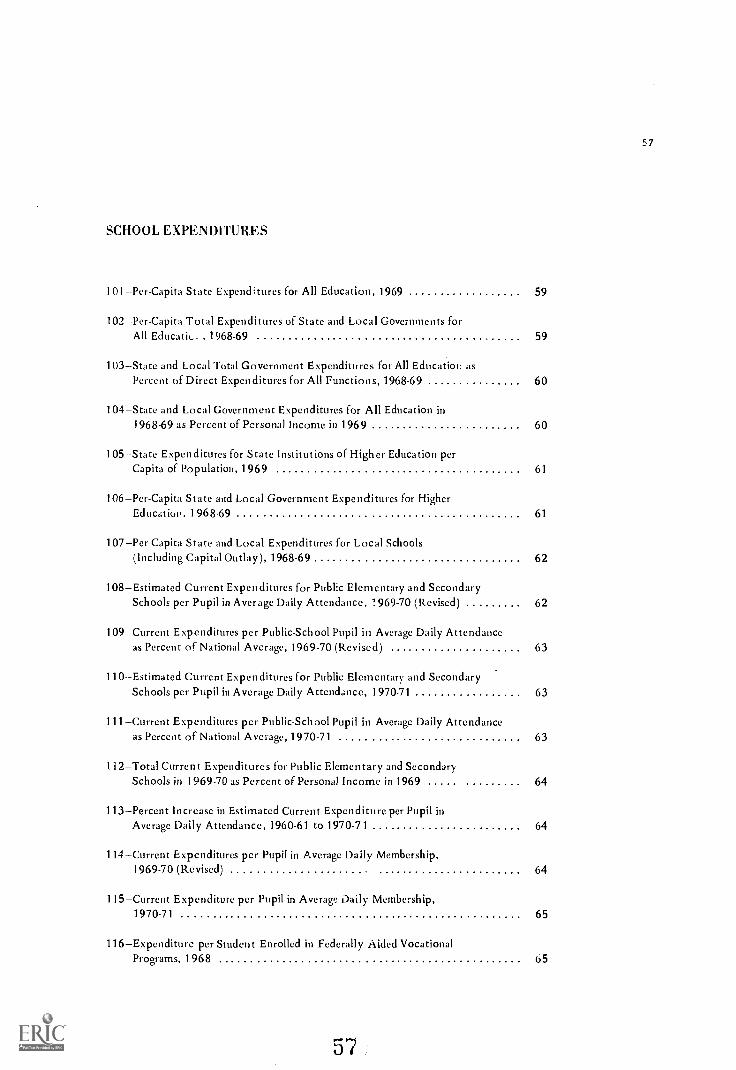
57
SCHOOL EXPENDITURES
101 -Per- Capita State Expenditures for All Education, 1969 59
102Per-Capita Total Expenditures of State and Local Governments forAll Educatic. 1968-69 59
103State and Local Total Government Expenditures for All Educatiol: asPercent of Direct Expenditures for All Functions, 1968-69 60
104State and Local Government Expenditures for All Education in1968-69 as Percent of Personal Income in 1969 60
105State Expenditures for State Institutions of Higher Education perCapita of Population, 1969 61
106Per-Capita State and Local Government Expenditures for HigherEducation. 1968-69 61
107Per-Capita State and Local Expenditures for Local Schools(Including Capital Outlay), 1968-69 62
108Estimated Current Expenditures for Public Elementary and SecondarySchools per Pupil in Average Daily Attendance, 1969-70 (Revised) 62
109Current Expenditures per Public-School Pupil in Average Daily Attendanceas Percent of National Average, 1969-70 (Revised) 63
110Estimated Current Expenditures for Public Elementary and SecondarySchools per Pupil in Average Daily Attendance, 1970-71 63
111Current Expenditures per Public-School Pupil in Average Daily Attendanceas Percent of National Average, 1970-71 63
1 i 2Total Current Expenditures for Public Elementary and SecondarySchools in 1969-70 as Percent of Personal Income in 1969 64
113Percent Increase in Estimated Current Expenditure per Pupil inAverage Daily Attendance, 1960-61 to 1970-71 64
1 14 Current Expenditures per Pupil in Average Daily Membership,1969-70 (Revised) 64
115Current Expenditure per Pupil in Average Daily Membership,1970-71 65
116Expenditure per Student Enrolled in Federally Aided VocationalPrograms, 1968 65
58
117Pupil Transportation Expenditures as Percent of Current Expendituresfor Public Elementary and Secondary Schools, 1968-69 65
118Average Cost of Transportation per Pupil Transported, 1968-69 66
119State Direct Expenditures for Public Welfare and Correction asPercent of State Direct Expenditures for All Education, 1969 66
58
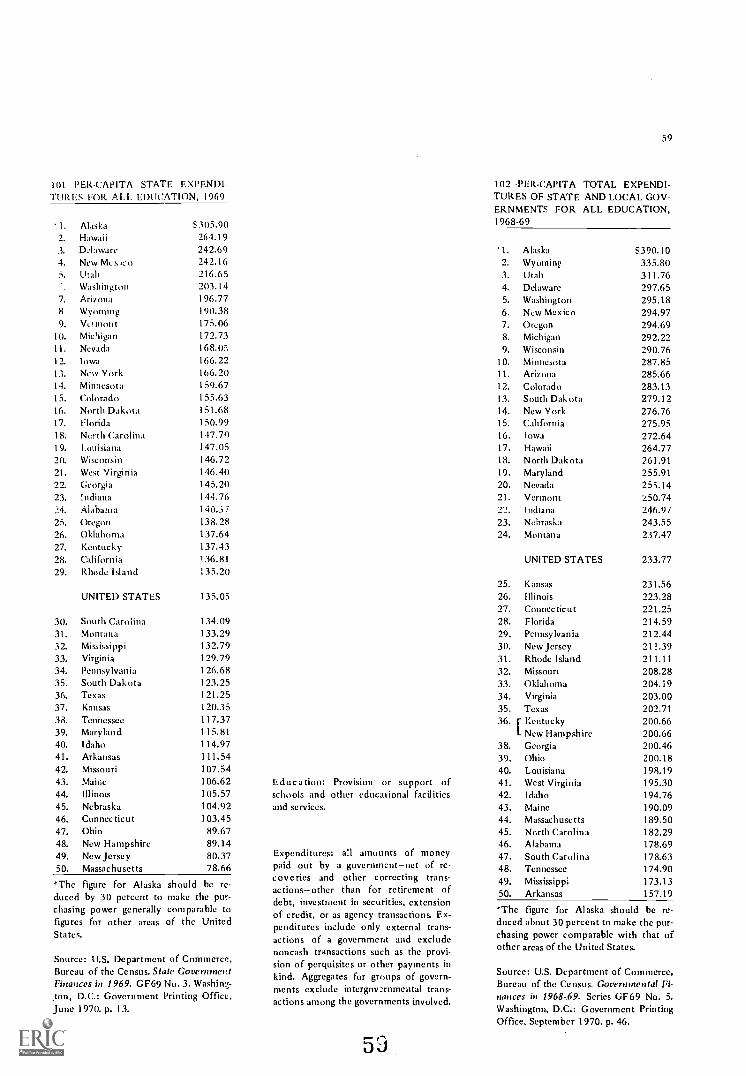
101 PER-CAPITA STATE EXPENDI-TURES FOR ALL EDUCATION, 1969
1. Alaska 5305.902. Hawaii 264.193. Delaware 242.694. New Mexico 242.163. Utah 216.65
Washington 2(13.14
7. Arizona 196.778. Wyoming 190.389. Vermont 175.06
10. Michigan 172.7311. Nevada 168.0312. Iowa 166.2213. New York 166.2014. Minnesota 159.6715. Colorado 155.6316. North Dakota 151.6817. Florida 150.9918. North Carolina 147.7019. Louisiana 147.0520. Wisconsin 146.7221. West Virginia 146.4022. Georgia 145.2023. Indiana 144.7624. Alabama 140.3725. Oregon 138.2826. Oklahoma 137.6427. Kentucky 137.4328. California 136.8129. Rhode Island 135.20
UNITED STATES 135.05
30. South Carolina 134.0931. Montana 133.2932. Mississippi 132.7933. Virginia 129.7934. Pennsylvania 126.6835. South Dakota 123.2536. Texas 121.2537. Kansas 120.3538. Tennessee 117.3739. Maryland 115.81
40. Idaho 114.9741. Arkansas 111.5442. Missouri 107.5443. Maine 106.6244. Illinois 105.5745. Nebraska 104.9246. Connecticut 103.4547. Ohio 89.6748, New Hampshire 89.1449. New Jersey 80.3750. Massachusetts 78.66
*The figure for Alaska should be re-duced by 30 percent to make the pur-chasing power generally comparable tofigures for other areas of the UnitedStates.
Source: U.S. Department of Commerce,Bureau of the Census. State GovermnevtFinances in 1969. GF69 No. 3. Washint!,-ton, D.C.: Government Printing Office,June 1970. p. 13.
Education: Provision or support ofschools and other educational facilitiesand services.
Expenditures: a!I amounts of moneypaid out by a government -net of re-coveries and other correcting trans-actions-other than for retirement ofdebt, investment in securities, extensionof credit, or as agency transactions. Ex-penditures include only external trans-actions of a government and excludenoncash transactions such as the provi-sion of perquisites or other payments inkind. Aggregates for groups of govern-ments exclude intergov.trnmental trans-actions among the governments involved.
53
59
102 -PER-CAPITA TOTAL EXPENDI-TURES OF STATE AND LOCAL GOV-ERNMENTS FOR ALL EDUCATION,1968-69
1. Alaska2. Wyoming3. Utah4. Delaware5. Washington6. New Mexico7. Oregon8. Michigan9. Wisconsin
10. Minnesota11. Arizona12. Colorado13. South Dakota14. New York15. California16. Iowa17. Hawaii18. North Dakota19. Maryland20. Nevada
21. Vermont22. Indiana23. Nebraska24. Montana
S390.10335.80311.76297.65295.18294.97294.69292.22290.76287.85285.66283.13279.12276.76275.95272.64264.77261.91255.91255.14250.74246.9/243.55237.47
UNITED STATES 233.77
25. Kansas
26. Illinois27. Connecticut28. Florida29. Pennsylvania30. New Jersey31. Rhode Island32. Missouri33. Oklahoma34. Virginia35. Texas
36. r Kentucky`New Hampshire
38. Georgia
39. Ohio40. Louisiana41. West Virginia42. Idaho43. Maine44. Massachusetts45. Ncrth Carolina46. Alabama47. South Carolina48. Tennessee
49. Mississippi50. Arkansas
231.56223.28221.25214.59212.44211.39211.11208.28204.19203.00202.71200.66200.66200.46200.18198.19195.30194.76190.09189.50182.29178.69178.63174.90173.13157.19
The figure for Alaska should be re-duced about 30 percent to make the pur-chasing power comparable with that ofother areas of the United States.
Source: U.S. Department of Commerce,Bureau of the Census. Governmental Fi-nances in 1968-69. Series GF69 No. 5.Washington, D.C.: Government PrintingOffice, September 1970. p. 46.
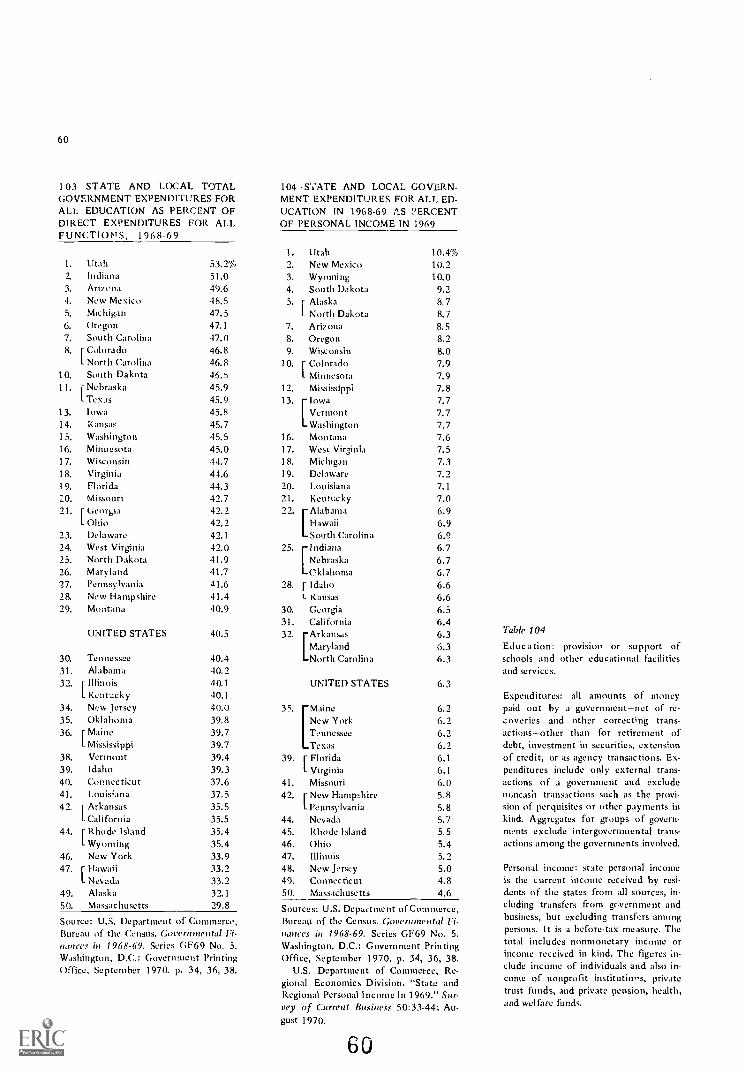
60
103 -STATE AND LOCAL TOTALGOVERNMENT EXPENDITURES FORALL EDUCATION AS PERCENT OFDIRECT EXPENDITURES FOR ALLFUNCTIONS, 1968-69
104 -STATE AND LOCAL GOVERN-MENT EXPENDITURES FOR ALL ED-UCATION IN 1968-69 1S PERCENTOF PERSONAL INCOME IN 1969
1. Utah 10.4%1, Utah 53.2% 2. New Mexico 10.22. Indiana 51.0 3. Wyoming 10.03, Arizona 49.6 4. South Dakota 9.24. New Mexico 48.5 5. r Alaska 8.75. Michigan 47.5 L North Dakota 8.76. Oregon 47.1 7. Arizona 8.57. South Carolina 47.0 8. Oregon 8.28. [ Colorado 46.8 9. Wisconsin 8.0
L North Carolina 46.8 10. f Colorado 7.910. South Dakota 46.:i I- Minnesota 7.911. i Nebraska 45.9 12. Mississippi 7.8
L Texas 45.9 13. Iowa 7.713. Iowa 45.8 I Vermont 7.714. Kansas 45.7 L Washington 7.715. Washington 45.5 16. Montana 7.616. Minnesota 45.0 17. West Virginia 7.517. Wisconsin 44.7 18. Michigan 7.318. Virginia 44.6 19. Delaware 7.219, Florida 44.3 20. Louisiana 7.1
20. Missouri 42.7 21. Kentucky 7.021. r Georgia 42.2 22. Alabama 6.9
L Ohio 42.2 I Hawaii 6.923. Delaware 42.1 South Carolina 6.924. West Virginia 42.0 25. Indiana 6.725. North Dakota 41.9 I Nebraska 6.726. Maryland 41.7 LCklahoma 6.727. Pennsylvania 41.6 28. [ Idaho 6.628. New Hampshire 41.4 L Kansas 6.629. Montana 40.9 30. Georgia 6.5
31. California 6.4UNITED STATES 40.5 32. Arkansas 6.3
Maryland 6.330. Tennessee 40.4 North Carolina 6.331, Alabama 40.232. [ Illinois 40.1 UNITED STATES 6.3
L Kentucky 40.1
34. New Jersey 40.0 35. Maine 6.235. Oklahoma 39.8 New York 6.236. [ Maine 39.7 Tennessee 6.2
I Mississippi 39.7 Texas 6.238. Vermont 39.4 39. r Florida 6.139. Idaho 39.3 L Virginia 6.140. Connecticut 37.6 41. Missouri 6.041. Louisiana 37.5 42. r New Hampshire 5.842. [ Arkansas 35.5 L Pennsylvania 5.8
L California 35.5 44. Nevada 5.744, i Rhode Island 35.4 45. Rhode Island 5.5
L Wyoming 35.4 46. Ohio 5.446. New York 33.9 47. Illinois 5.247. r Hawaii 33.2 48. New Jersey 5.0
L Nevada 33.2 49. Connecticut 4.849. Alaska 32.1 50. Massachusetts 4.650. Massachusetts 29.8
Source: U.S. Department of Continence,Bureau of the Census. Governmenta! Fi-nances in 1968-69. Series GF69 No. 5.Washington, D.C.: Government PrintingOffice, September 1970. p. 34, 36, 38.
Sources: U.S. Depactment of Commerce,Bureau of the Census. Governmental N-notices in 1968-69. Series GF69 No. 5,Washington, D.C.: Government PrintingOffice, September 1970. p. 34, 36, 38.
U.S. Department of Commerce, Re-gional Economics Division. "State andRegional Personal Income in 1969." Sur-vey of Current Business 50:33-44; Au-gust 1970.
60
Table 104
Education: provision or support ofschools and other educational facilitiesand services.
Expenditures: all amounts of moneypaid out by a government-net of re-coveries and other correcting trans-actions-other than for retirement ofdebt, investment in securities, extensionof credit, or as agency transactions. Ex-penditures include only external trans-actions of a government and excludenuncash transactions such as the provi-sion of perquisites or other payments inkind. Aggregates for groups of govern-ments exclude intergovernmental trans-actions among the governments involved.
Personal income: state personal Incomeis the current income received by resi-dents of tile states from all sources, in-cluding transfers from government andbusiness, but excluding transfers amongpersons. It is a before-tax measure. Thetotal includes nonmonetary income orincome received in kind. The figures in-clude income of individuals and also in-come of nonprofit institutions, privatetrust funds, and private pension, health,and welfare funds.
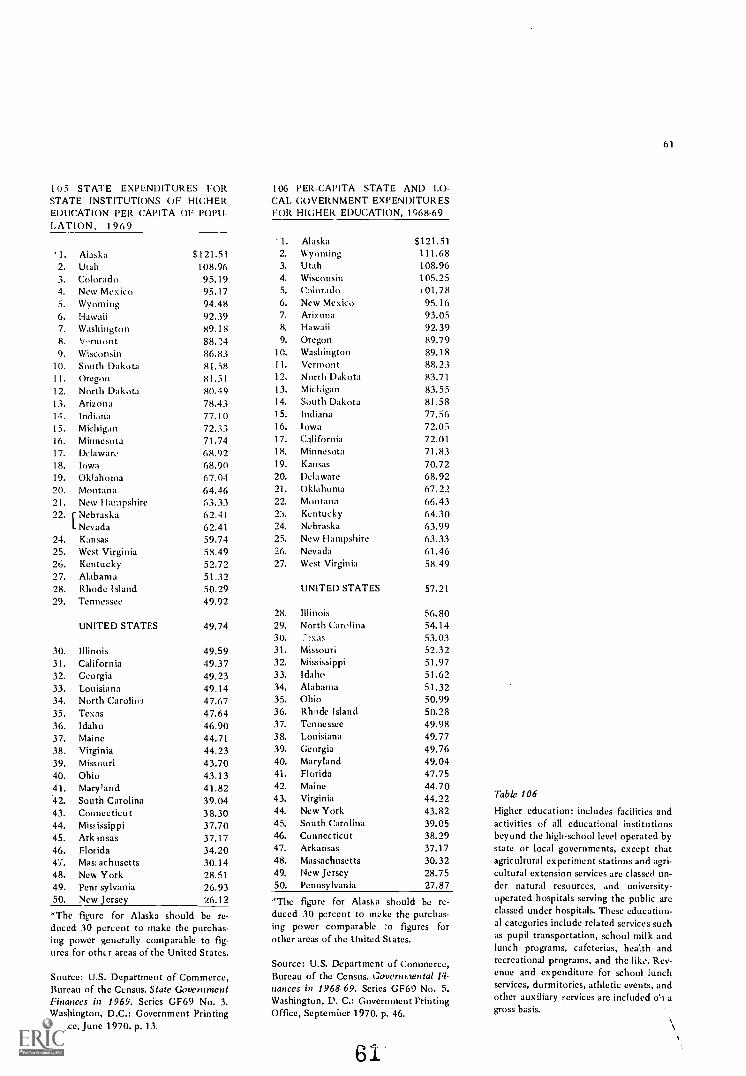
1 0 5 ST ATE EXPENDITURES FORSTATE INSTITUTIONS OF HIGHEREDUCATION PER CAPITA OF POPU-LATION, 1969
1. Alaska2. Utah3. Colorado4. New Mexico5. Wyoming6. Hawaii7. Washington8. V,trrn not9. Wisconsin
10. South Dakota11. Oregon12. North Dakota13. Arizona14. Indiana15. Michigan16. Minnesota17. Delaware18. Iowa19. Oklahoma20. Montana21. New Hampshire22. r Nebraska
1- Nevada
24. Kansas25. West Virginia26. Kentucky27. Alabama28. Rhode Island29. Tennessee
S 121.51108.9695.1995.1794.4892.3989.1888.2486.8381.5881.5180.4978.4377.1072.3371.7468.9268.9067.0464.4663.3362.4162.4159.7458.4952.7251.3250.2949.92
UNITED STATES 49.74
30. Illinois 49.5931. California 49.3732. Georgia 49.2333. Louisiana 49.1434. North Caroling 47.6735. Texas 47.6436. Idaho 46.9037. Maine 44.7138. Virginia 44.2339. Missouri 43.7040. Ohio 43.1341. Maryland 41.8242. South Carolina 39.0443. Connecticut 38.3044. Mist issippi 37.7045. Ark insas 37.1746. Florida 34.2047. Mast achusetts 30.1448. New York 28.5149. Pent sylvania 26.9350. New Jersey 26.12
The figure for Alaska should be re-duced 30 percent to make the purchas-ing power generally comparable to fig-ures for other areas of the United States.
Source: U.S. Department of Commerce,Bureau of the Census. State GovernmentPittances in 1969. Series GF69 No. 3.Washington, D.C.: Government PrintingOffice, June 1970. p. 13.
106 PER-CAPITA STATE AND LO-CAL GOVERNMENT EXPENDITURESFOR HIGHER EDUCATION, 1968-69
1. Alaska2. Wyoming3. Utah4. Wisconsin5. Colorado6. New Mexico7. Arizona8. Hawaii9. Oregon
10. WashingtonII. Vermont12, North Dakota13. Michigan14. South Dakota15. Indiana16. Iowa17. California18. Minnesota19. Kansas
20. Delaware21. Oklahoma22. Montana23. Kentucky24. Nebraska25. New Hampshire26. Nevada27, West Virginia
28.
29.30.31.32.33.34.35.36.37.38.39.40.41.42.43.44.45.46.47.48.49.50.
$121.51111.68108.96105.25(01.7895.1693.0592.3989.7989.1888.2383.7183.5581.5877.5672.0572.0171.8370.7268.9267.2266.4364.30(13.9963.3361.4658.49
UNITED STATES 57.21
IllinoisNorth Carolina:xas
MissouriMississippiIdahoAlabamaOhioRhode IslandTennesseeLouisianaGeorgiaMarylandFloridaMaineVirginiaNew YorkSouth CarolinaConnecticutArkansasMassachusettsNew JerseyPennsylvania
56.8054.1453.0352.3251.9751.6251.3250.9950.2849.9849.7749.7649.0447.7544.7044.2243.8239.0538.2937.1730.3228.7527.87
'The figure for Alaska should be re-
duced 30 percent to moke the purchas-ing power comparable ;o figures forother areas of the United States.
Source: U.S. Department of Commerce,Bureau of the Census. Governmental Fi-nances in 1968-69. Series GF69 No. 5.Washington, D. C.: Government PrintingOffice, September 1970. p. 46.
61
61
Table 106
Higher education: includes facilities andactivities of all educational institutionsbeyond the high-school level operated bystate or local governments, except thatagricultural experiment stations and agri-cultural extension services are classed un-der natural resources, and university-operated hospitals serving the public areclassed under hospitals. These education-al categories include related services suchas pupil transportation, school milk andlunch programs, cafeterias, heath andrecreational programs, and the like. Rev-enue and expenditure for school lunchservices, dormitories, athletic events, andother auxiliary services are included of agross basis.
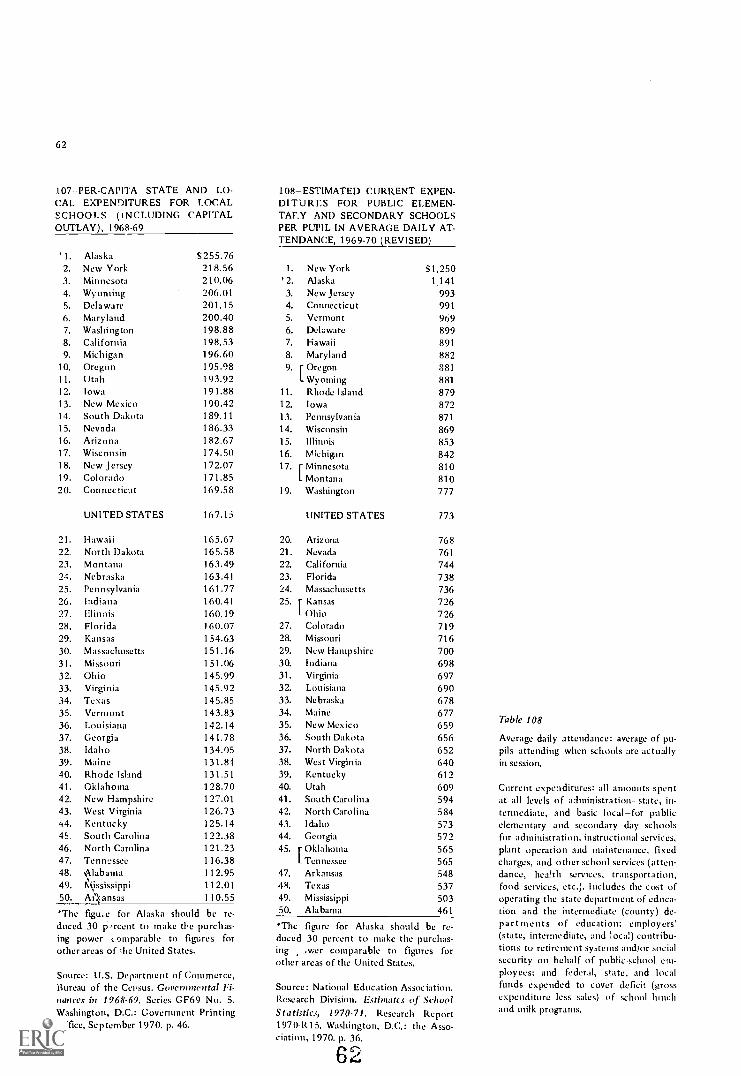
62
107 PER-CAPITA STATE AND LO-CAL EXPENDITURES FOR LOCALSCHOOLS (INCLUDINGOUTLAY), 1968-69
CAPITAL
1. Alaska S255.762. New York 218.563. Minnesota 210.064. Wyoming 206.015. Delaware 201.156. Maryland 200.407. Washington 198.888. California 198.539. Michigan 196.60
10. Oregon 195.9811. Utah 193.9212. Iowa 191.8813. New Mexico 190.42I4. South Dakota 189.1115. Nevada 186.3316. Arizona 182.6717. Wisconsin 174.5(118. New Jersey 172.0719. Colorado 171.8520. Connecticut 169.58
UNITED STATES 167.15
21. Hawaii 165.6722. North Dakota 165.5823. Montana 163.4924. Nebraska 163.4125. Pennsylvania 161.7726. Indiana 160.4127. Illinois 160.1928. Florida 160.0729. Kansas 154.6330. Massachusetts 151.1631. Missouri 151.0632. Ohio 145.9933. Virginia 145.9234. Texas 145.8535. Vermont 143.8336. Louisiana 142.1437. Georgia 141.7838. Idaho 134.0539. Maine 131.8140. Rhode Island 131.5141. Oklahoma 128.7042. New Hampshire 127.0143. West Virginia 126.7344. Kentucky 125.1445. South Carolina 122.3846. North Carolina 121.2347. Tennessee 116.3848. N'ilabaina 112.9549. II:iIssissippi 112.0150. Aicansas 110.55
*The figu.-e for Alaska should be re-duced 30 ci,rcent to make the purchas-ing power comparable to figures forother areas of she United States.
Source: U.S. Department of Commerce,Bureau of the Census. Governmental Fi-nances in 1968-69. Series GF69 No. 5.Washington, D.C.: Government PrintingOffice, September 1970. p. 46.
108-ESTIMATED CURRENT EXPEN-DITURES FOR PUBLIC ELEMEN-TALY AND SECONDARY SCHOOLSPER PUPIL IN AVERAGE DAILY AT-TENDANCE, 1969-70 (REVISED)
1, New York*2. Alaska
3. New Jersey4. Connecticut5. Vermont6. Delaware7. Hawaii8. Maryland
S1,2501.141
993991969899891882
9. r Oregon 881Wyoming 881
11. Rhode Island 87912. Iowa 87213. Pennsylvania 87114. Wisconsin 86915. Illinois 85316. Michigan 84217. r Minnesota 810
I Montana 81019. Washington 777
UNITED STATES 773
20. Arizona 76821. Nevada 76122. California 74423. Florida 73824. Massachusetts 73625. r Kansas 726
L Ohio 72627. Colorado 71928. Missouri 71629. New Hampshire 70030. Indiana 69831. Virginia 69732. Louisiana 69033. Nebraska 67834. Maine 67735. New Mexico 65936. South Dakota 65637. North Dakota 65238. West Virginia 64039. Kentucky 61240. Utah 60941. South Carolina 59442. North Carolina 58443. Idaho 57344. Georgia 57245. r Oklahoma 565
L Tennessee 56547. Arkansas 54848. Texas 53749 Mississippi 50350. Alabama 461
'The figure for Alaska should be re-duced 30 percent to make the purchas-ing .wer comparable to figures forother areas of the United States.
Source: National Education Association,Research Division. Estimates of SchoolStatistics, 1970-71. Research Report1970-R15. Washington, D.C.: the Asso-ciation, 1970. p. 36.
6')it
Table 108
Average daily attendance: average of pu-pils attending when schools arc actuallyin session.
Current expenditures: all amounts spentat all levels of administration-state, in-termediate, and basic local -for publicelementary and secondary day schoolsfor administration, instructional services,plant operation and maintenance, fixedcharges, and other school services (atten-dance, heillth services, transportation,food services, etc.). Includes the cost ofoperating the state department of educa-tion and the intermediate (county) de-partments of education; employers'(state, intermediate, and iota;) contribu-tions to retirement systems and/or socialsecurity on behalf of public-school em-ployees: and federal, state, and localfunds expended to cover deficit (grossexpenditure less sales) of school lunchand milk programs.
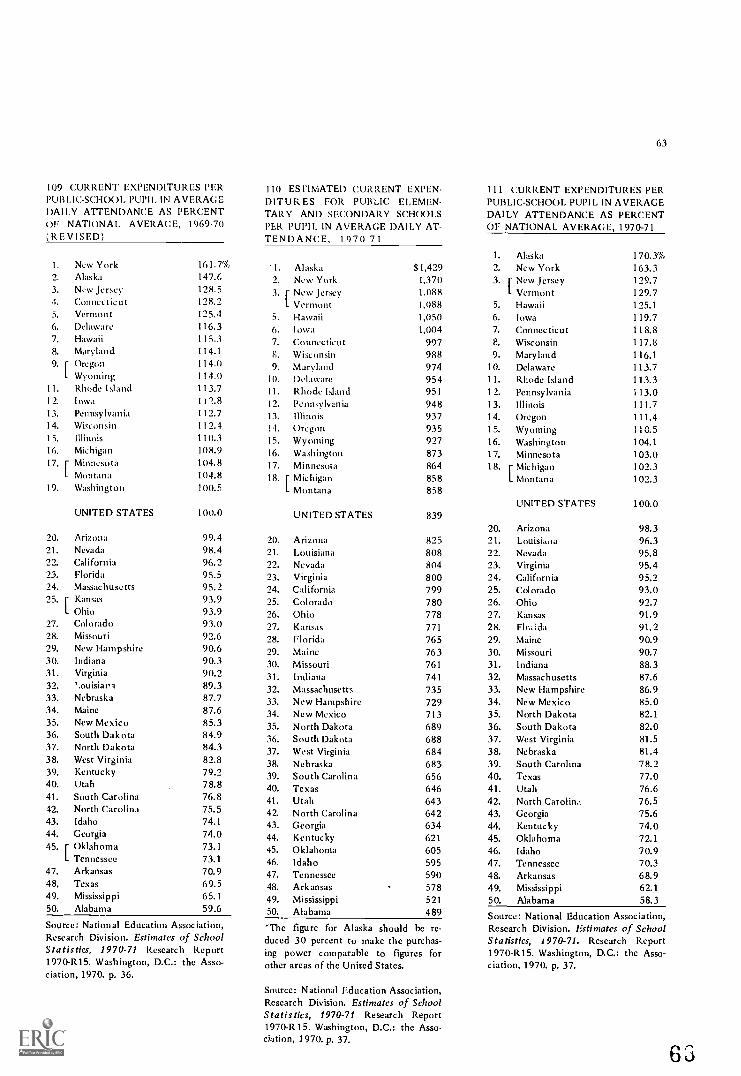
109 CURRENT EXPENDITURES PERPUBLIC-SCHOOL PUPIL IN AVERAGEDAILY ATTENDANCE AS PERCENTOF NATIONAL AVERAGE, 1969-70(REVISED)
1. New York2. Alaska3. New Jersey4. Connecticut5, Vermont6. Delaware7. Hawaii8. Maryland9. f Oregon
I. Wyoming11. Rhode Island12. Iowa13. Pennsylvania14. Wisconsin15. Illinois16. Michigan17. Minnesota
Montana19. Washington
20.21.
22,23.
24.25.
27.
28.
29.
30.31.
32.33.34.
35.36.
37.38.39.40.41.42.
43.44.45.
47.48,
49.50.
161.7%147.6128.5128.2125.4116.3115.3114.1
114.0114.0113.711'1.8112.7112.4110.3108.9104.8104.8100.5
UNITED STATES 100.0
ArizonaNevadaCaliforniaFloridaMassachusettsKansas
OhioColoradoMissouriNew HampshireIndianaVirginia'.ouisianaNebraskaMaineNew MexicoSouth DakotaNorth DakotaWest VirginiaKentuckyUtahSouth CarolinaNorth CarolinaIdahoGeorgiaOklahomaTennessee
ArkansasTexasMississippiAlabama
99.498.496.295.595.293.993.993.092.690.690.390.289.387.787.685.384.984.382.879.278.876.875.574.1
74.073.173.170.969.565.159.6
Source: National Education Association,Research Division. Estimates of SchoolStatistics, 1970-71 Research Report1970-R15. Washington, D.C.: the Asso-ciation, 1970. p. 36.
110 ESTIMATED CURRENT EXPEN-DITURES FOR PUBJC ELEMEN-TARY AND SECONDARY SCHOOLSPER PUPIL IN AVERAGE DAILY AT-TEND A NCE, 1970-71
'1. Alaska2. New York3. r New Jersey
L Vermont5. Hawaii6. Iowa7. ConnecticutS. Wisconsin9. Maryland
I 0. DelawareII. Rhode Island12. Pennsylvania13. Illinois11. Oregon15. Wyoming16. Washington17. Minnesota18. r Michigan
L Montana
63
1 1 l CURRENT EXI'ENDITURES PERPUBLIC-SCHOOL PUPIL IN AVERAGEDAILY ATTENDANCE AS PERCENTOF NATIONAL AVERAGE, 1970-71
1. AlaskaS 1,429 2. New York
1,370 3. r New Jersey1,088 L Vermont1.088 5. Hawaii1,050 6. Iowa1,004 7. Connecticut
997 8. Wisconsin988 9. Maryland974 10. Delaware954 11. Rhode Island951 12. Pennsylvania948 13. Illinois937 14. Oregon935 15. Wyoming927 16. Washington873 17. Minnesota864 18. r Michigan858 L Montana858
UNITED STATES 839
20. Arizona21. Louisiana22. Nevada23. Virginia24. California25. Colorado26. Ohio27. Kansas
28. Florida29. Maine30. Missouri31. Indiana32. Massachusetts33. New Hampshire34. New Mexico35. North Dakota36. South Dakota37. West Virginia38. Nebraska39. South Carolina40. Texas41. Utah42. North Carolina43. Georgia44. Kentucky45. Oklahoma46. Idaho47. Tennessee
48. Arkansas49. Mississippi50. Alabama
825808804800799780778771
765763761
741
735729713689688684683656646643642634621
605595590578521
489
*The figure for Alaska should be re-duced 30 percent to make the purchas-ing power comparable to figures forother areas of the United States.
Source: National Education Association,Research Division. Estimates of SchoolStatistics, 1970-71 Research Report1970-R15. Washington, D.C.: the Asso-ciation, 1970. p. 37.
170.3%163.3129.7129.7125.1119.7118.8117.8116.1113.7113.3113.0111.7111.4110.5104.1103.0102.3102.3
UNITED STATES 100.0
20. Arizona21. Louisixoa22. Nevada
23. Virginia24. California25. Colorado26. Ohio27. Kansas
28. FIG:Ida29. Maine30. Missouri31. Indiana32. Massachusetts33. New Hampshire34. New Mexico35. North Dakota36. South Dakota37. West Virginia38. Nebraska39. South Carolina40. Texas41. Utah42. North Carolina43. Georgia44. Kentucky45. Oklahoma46. Idaho47. Tennessee
48. Arkansas49. Mississippi50. Alabama
98.396.395.895.495.293.092.791.991.290.990.788.387.686.985.082.182.081.581.478.277.076.676.575.674.072.170.970.368.962.158.3
Source: National Education Association,Research Division. Estimates of SchoolStatistics, 1970-71. Research Report1970-R15. Washington, D.C.: the Asso-ciation, 1970. p. 37.
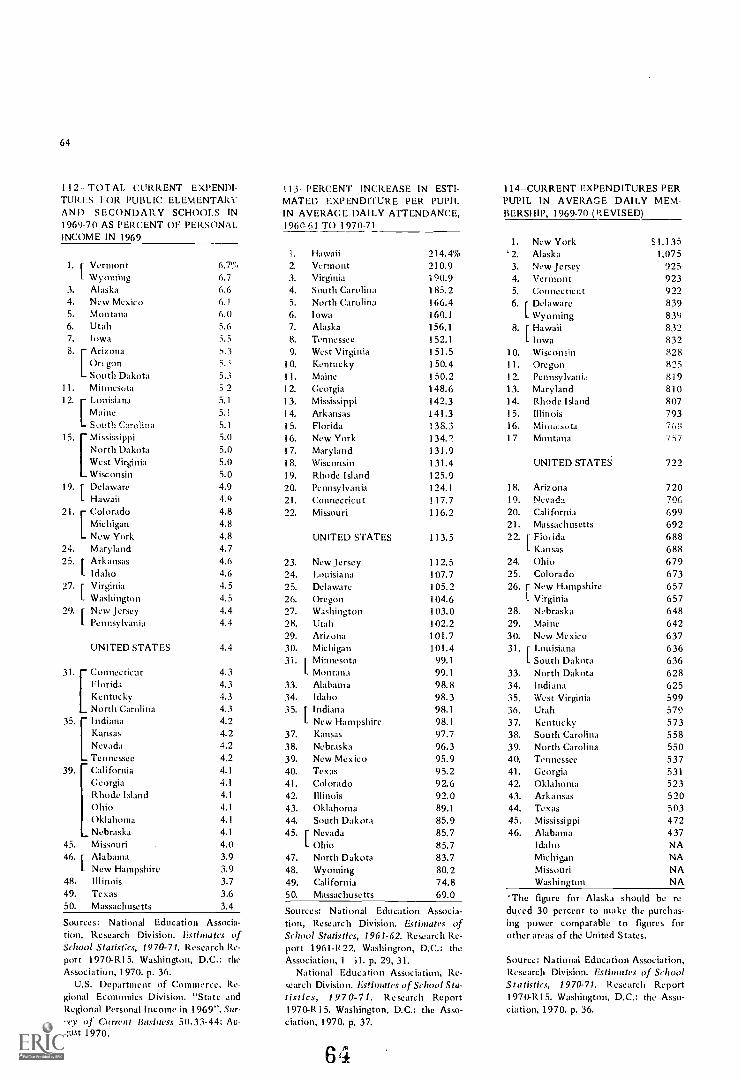
64
112 TOT AL CURRENT EXPENDI-TURES FOR PUBLIC ELEMENTARYAND SECONDARY SCHOOLS IN1969-70 AS PERCENT OF PERSONALINCOME IN 1969
113 PERCENT INCREASE IN ESTI-MATED EXPENDITURE PER PUPILIN AVERAGE DAILY ATTENDANCE,1960 61 TO 1970-71
I. Hawaii 214.4%1. r Vermont
l Wyoming6.7%6.7
2,
3.
VermontVirginia
210.9190.9
3. Alaska 6.6 4. South Carolina 185.24. New Mexico 6.1 5. North Carolina 166.45. Montana 6.0 6. Iowa 160.16. Utah 5.6 7, Alaska 156.17, Iowa 5.5 8. Tennessee 152.18. r Arizona 5.3 9, West Virginia 151.5
Oregon 5.., 10. Kentucky 150.4South Dakota 5.3 11. Maine 150.2
11. Minnesota 5 2 12. Georgia 148.612. Louisiana 5.1 13. Mississippi 142.3
Maine 5.1 14. Arkansas 141.3South Carolina 5.1 15. Florida 138.3
15. Mississippi 5.0 16. New York 134.2North Dakota 5.0 17. Maryland 131.9West Virginia 5.0 18. Wisconsin 131.4Wisconsin 5.0 19. Rhode Island 125.9
19. r Delaware 4.9 20. Pennsylvania 124.11- Hawaii 4.9 21. Connecticut 117.7
21. r Colorado 4.8 22. Missouri 116.2Michigan 4.8New York 4.8 UNITED STATES 113.5
24. Maryland 4.7
25. r Arkansas 4.6 23. New Jersey 112.5L Idaho 4.6 24. Louisiana 107.7
27.[Virginia 4.5 25. Delaware 105.2Washington 4.5 26. Oregon 104.6
29. r New Jersey 4.4 27. Washington 103.0L Pennsylvania 4.4 18, Utah 102.2
29. Arizona 101.7UNITED STATES 4.4 30. Michigan 101.4
31. r Minnesota 99.14.3 L Montana 99.1
Florida 4.3 33. Alabama 98.8[Connecticut
Kentucky 4.3 34. Idaho 98.3North Carolina 4.3 35. r Indiana 98.1
4.2 L New Hampshire 98.1[IndianaKansas 4.2 37. Kansas 97.7Nevada 4.2 38. Nebraska 96.3Tennessee
39. California4.24.1
39,40.
New MexicoTexas
95.995.2
Georgia 4.1 41. Colorado 92.6Rhode Island 4.1 42. Illinois 92.0Ohio 4.1 43. Oklahoma 89.1Oklahoma 4.1 44. South Dakota 85.9Nebraska 4.1 45. r Nevada 85.7
45. Missouri 4.0 L Ohio 85.746. [ Alabama 3.9 47. North Dakota 83.7
L New Hampshire 3.9 48. Wyoming 80.248. Illinois 3.7 49. California 74.849. Texas 3.6 50. Massachusetts 69.050. Massachusetts 3.4 Sources: National Education Associa-Sources: National Education Associa-tion, Research Division. Estimates ofSchool StatisCcs, 1970-71. Research Re-port 1970-R15. Washington, D.C.: theAssociation, 1970. p. 36.
U.S. Department of Commerce, Re-gional Economics Division. "State andRegional Personal Income in 1969". Sur-rey of Current Business 50.33-44: Au-gust 1970.
tion, Research Division. Estimates ofSchool Statistics, 1961 -62. Research Re-port 1961-R22. Washington, D.C.: theAssociation, 1 il. p. 29, 31.
National Education Association, Re-search Division. Estimates of School Sta-tistics, 1970-71. Research Report1970-R15. Washington, D.C.: the Asso-ciation, 1970. p. 37.
64
114-CURRENT EXPENDITURES PERPUPIL IN AVERAGE DAILY MEM-BERSHIP, 1969-70 (REVISED)
1. New York S1,135'2. Alaska 1,075
3. New Jersey 9254. Vermont 9235. Connecticut 9226. r Delaware 839
L Wyoming 8398. Hawaii 832
L Iowa 83210. Wisconsin 82811. Oregon 82512, Pennsylvania 81913. Maryland 81014. Rhode Island 80715. Illinois 79316. Minnesota 76If17 Montana 757
UNITED STATES 722
18. Arizona 72019. Nevada 70620. California 69921. Massachusetts 69222. r Florida 688
L Kansas 68824. Ohio 67925. Colorado 67326. r New Hampshire 657
Virginia 65728. Nebraska 64829. Maine 64230. New Mexico 63731. r Louisiana 636
L South Dakota 63633. North Dakota 62834. Indiana 62535. West Virginia 59936. Utah 57937. Kentucky 57338. South Carolina 55839. North Carolina 55040. Tennessee 53741. Georgia 53142. Oklahoma 52343. Arkansas 52044. Texas 50345. Mississippi 47246. Alabama 437
Idaho NAMichigan NAMissouri NAWashington NA
'The figure for Alaska should be re-duced 30 percent to make the purchas-ing power comparable to figures forother areas of the United States.
Source: National Education Association,Research Division. Estimates of SchoolStatistics, 1970-71. Research Report1970-R15. Washington, D.C.: the Asso-ciation, 1970. p. 36.
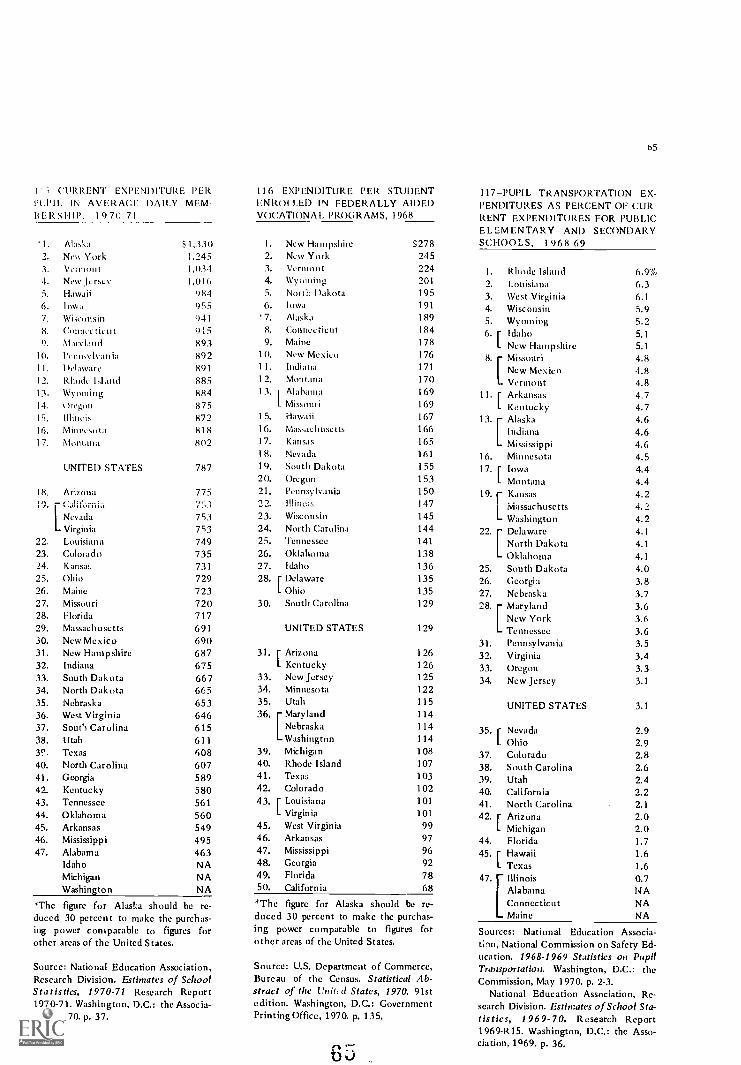
1' 5 CURRENT EXPENDITURE PERPUPIL IN AVERAGE DAILY MEM-BERSHIP, 1970-71
116 EXPENDITURE PER STUDENTENROL LED IN FEDERALLY AIDEDVOCATIONAL. PROGRAMS, 1968
1. Alaska 51,330 1. New Hampshire S2782. No% York 1,245 2. New York 245.3. Vermont 1,034 3. Vermont 2244. New Jersey 1,016 4. Wyoming 201
5. Hawaii 984 5. North Dakota 195
6. Iowa 955 6. Iowa 191
7. Wisconsin 941 7. Alaska 1898. Councelieut 915 8. Connecticut 1849. tom-viand 893 9. Maine 178
10. P, unsylvania 892 10. New Mexico 176
11. Delaware 891 11. Indiana 171
12. Rhode Island 885 1 2. Montana 17013. Wyoming 884 13, Alabama 169
14. Oregon 875 Missouri 169
15. Illinois 872 I5. Hawaii 167
16. Minnesota 818 16. Massachusetts 166
17. Montana 802 17. Kansas 165I 8. Nevada 161
UNITED STATES 787 19. South Dakota 15520. Oregon 153
18. Arizona 775 21. Pennsylvania 150California 751 22. Illinois 147Nevada 753 23. Wisconsin 145
L Virginia 753 24. North Carolina 14422. Louisiana 749 25. Tennessee 141
23. Colorado 735 26. Oklahoma 13824. Kansas 731 27. Idaho 13625. Ohio 729 28. r Delaware 13526. Maine 723 Ohio 13527. Missouri 720 30. South Carolina 12928. Florida 71729. Massachusetts 691 UNITED STATES 12930. New Mexico 69031. New Hampshire 687 31. r Arizona 12632. Indiana 675 I Kentucky 12633. South Dakota 667 33. New Jersey 125
34. North Dakota 665 34. Minnesota 12235. Nebraska 653 35. Utah 115
36. West Virginia 646 36. Maryland 114
37. South Carolina 615 Nebraska 114
38. Utah 611 Washington 114
39. Texas 608 39. Michigan 108
40. North Carolina 607 40. Rhode Island 107
41. Georgia 589 41. Texas 103
42. Kentucky 580 42. Colorado 102
43. Tennessee 561 43. r Louisiana 101
44. Oklahoma 560 I- Virginia 101
45. Arkansas 549 45. West Virginia 99
46. Mississippi 495 46. Arkansas 97
47. Alabama 463 47. Mississippi 96
Idaho NA 48. Georgia 92
Michigan NA 49. Florida 78Washington NA 50. California 68
*The figure for Alaska should be re-duced 30 percent to make the purchas-ing power comparable to figures forother areas of the United States.
Source: National Education Association,Research Division. Estimates of SchoolStatistics, 1970-71 Research Report1970-71. Washington, D.C.: the Associa-tion, 1970. p. 37.
*The figure for Alaska should be re-duced 30 percent to make the purchas-ing power comparable to figures forother areas of the United States.
Source: U.S. Department of Commerce,Bureau of the Census. Statistical Ab-stract of the United States, 1970. 91stedition. Washington, D.C.: GovernmentPrinting Office, 1970. p. 135.
04.1
65
117 -PUPI L TRANSPORTATION EX-PENDITURES AS PERCENT OF CUR-RENT EXPENDITURES FOR PUBLICELEMENTARY AND SECONDARYSCHOOLS, 1 968-69
1. Rhode Island2. Louisiana3. West Virginia4. Wisconsin5. Wyoming6.f Idaho
New Hampshire[MissouriNew MexicoVermont
11. r ArkansasI- Kentucky
[AlaskaIndianaMississippi
16. Minnesota17. r Iowa
1 Montana19. 1 Kansas
MassachusettsL Washington
[DelawareNorth DakotaOklahoma
25. South Dakota26. Georgia27. Nebraska28. r Maryland
New YorkTennessee
31.32.33.34.
PennsylvaniaVirginiaOregonNew Jersey
6.9%6.36.1
5.95.25.15.1
4.84.84.84.74.74.64.64.64.54.44.44.24.24.24.14.14.1
4.03.83.73.63.63.63.53.43.33.1
UNITED STATES 3.1
35. r NevadaL Ohio
37. Colorado38. South Carolina39. Utah40. California41. North Carolina42. Arizona
Michigan44. Florida45. f Hawaii
1. Texas[IllinoisAlabamaConnecticutMaine
2.92.92.82.62.42.22.1
2.02.01.71.61.60.7NANANA
Sources: National Education Associa-tion, National Commission on Safety Ed-ucation. 1968-1 969 Statistics on PupilTransportation. Washington, D.C.: theCommission, May 1970. p. 2-3.
National Education Association, Re-search Division. Estin:ates of School Sta-tistics, 1969-70. Research Report1969-R15. Washington, D.C.: the Asso-ciation, 1069. p. 36.
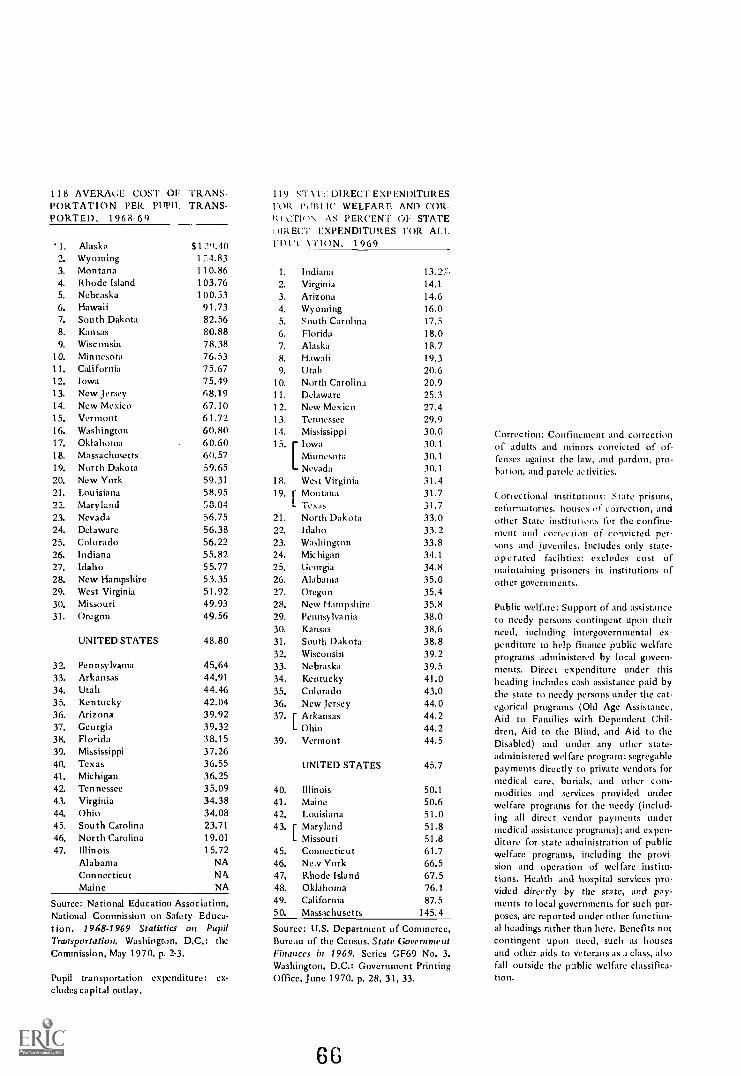
1 1 8 AVERAGE COST 01 TRANS-PORTATION PER PUPIL TRANS-PORTED, 1 968-6 9
'1. Alaska2. Wyoming3. Montana4. Rhode Island5. Nebraska6. Hawaii7. South Dakota8. Kansas9. Wisconsin
10. Minnesota11. California12. Iowa13. New Jersey14. New Mexico15. Vermont16. Washington17. Oklahoma18. Massachusetts19. North Dakota20. New York21. Louisiana21 Marylund23. Nevada24. Delaware25. Colorado26. Indiana27. Idaho28. New Hampshire29. West Virginia30. Missouri31. Oregon
32.33.34.35.36.37.38.39.40.41.42.43.44.45.46.47.
SI 20.401 2-4.831 10.86103.761 00. 3391.7382.5680.8878.3876.5375.6775.4968.1967.1061.7260.8060.6060.5759.6559.3158.9558.0456.7556.3856.2255.8255.7753.3551.9249.9349.56
UNITED STATES 48.80
PennsylvaniaArkansasUtahKentuckyArizonaGeorgiaFloridaMississippiTexasMichiganTennesseeVirginiaOhioSouth CarolinaNorth CarolinaIllinoisAlabamaConnecticutMaine
45.6444.9144.4642.0439.9239.3238.1537.2636.5536.2535.0934.3834.0823.7119.0115.72
NAN
NA
Source: National Education Association,National Commission on Safety Educa-tion. 1968-1969 Statistics on PupilTransportation. Washington, D.C.: theCommission, May 1970. p. 2-3.
Pupil transportation expenditure: ex-cludes capital outlay.
119 ST \'1T DIRECT EXPENDITURESFUR PUBLIC WELFARE AND COR-I:IV-1'10N AS PERCENT OF STATEDIRECT EXPENDITURES FOR ALT
\ rION, 1 969
1. Indiana I 3.
2. Virginia 14.1
3. Arizona 14.64. Wyoming 16.05. South Carolina 17.56. Florida 18.07. Alaska 18.78. Hawaii 19.39. Utah 20.6
10. North Carolina 20.911. Delaware 25.312. New Mexico 27.413. Tennessee 29.914. Mississippi 30.015. r Iowa 30.1
LMinnesota30.1
Nevada 30.118. West Virginia 31.419. f Montana 31.7
L 're X ah 31.721. North Dakota 33.022. Idaho 33.223. Washington 33.824. Michigan 34.125. Georgia 34.826. Alabama 35.027. Oregon 35.428. New Hampshire 35.829. Pennsylvania 38.030. Kansas 38.631. South Dakota 38.832. Wisconsin 39.233. Nebraska 39.534. Kentucky 41.035. Colorado 43.036. New Jersey 44.037. r Arkansas 44.2
L Ohio 44.239. Vermont 44.5
UNITED STATES 45.7
40. Illinois41. Maine42. Louisiana43. r Maryland
L Missouri45. Connecticut46. Nev York47. Rhode Island48, Oklahoma49. California50. Massachusetts
50.150.651.051.851.861.766.567.576.187.5
145.4
Source: U.S. Department of Commerce,Bureau of the Census. State GovernmentFinances in 1969. Series GF69 No. 3.Washington, D.C.: Government PrintingOffice, June 1970. p. 28, 31, 33.
86
Correction: Confinement and correctionof adults and minors convicted of of-fenses against the law, and pardon, pro-bation, and parole activities.
once tional institutions: State prisons,reformatories, houses el correction, andother State institutions for the confine-ment and correction of convicted per-sons and juveniles. Includes only stateoperated facilities: excludes cost ofmaintaining prisoners in institutions ofother governments.
Public welfare: Support of and assistanceto needy persons contingent upon theirneed, including intergovernmental ex-penditure to help finance public welfareprograms administered by local govern-ments. Direct expenditure under thisheading includes cash assistance paid bythe state to needy persons under the cat-egorical programs (Old Age Assistance,Aid to Families with Dependent Chil-dress, Aid to the Blind, and Aid to theDisabled) and under any other stateadministered welfare program: segregahlepayments directly to private vendors formedical care, burials, and other com-modities and services provided underwelfare programs for the needy (includ-ing all direct vendor payments undermedical assistance programs): and expen-diture for state administration of publicwelfare programs, including the provi-sion and operation of welfare institu-tions. Health and hospital services pro-vided directly by the state, and pay-ments to local governments for such pur-poses, are reported under other function-al headings rather than here. Benefits notcontingent upon need, such as housesand other aids to veterans as a class, alsofall outside the public welfare classifica-tion.
67
:MISCELLANEOUS
120-Estimated Per-Capita Retail Sales, 1969 68
121-Percent of State Land Owned by tne Federal Government, June 30, 1969 68
122 Number of Federal Civilian Government Employees (within the UnitedStates) per 1,000 Population, June 1969 68
123-Number of Government Employees Per 1,000 Population, June 1969 69
124-Government Employees as Percent of Employees in NonagriculturalEstablishments, 1969 69
125-Number of Physicians per 100,000 Population, 1969 69
126-Number of Dentists per 100.000 Population, 19'69 70
127-Number of Known Major Crimes per 100,000 Population, 1969 70
128-Change in Rate of Known Major Crimes, 1968 to 1969 70
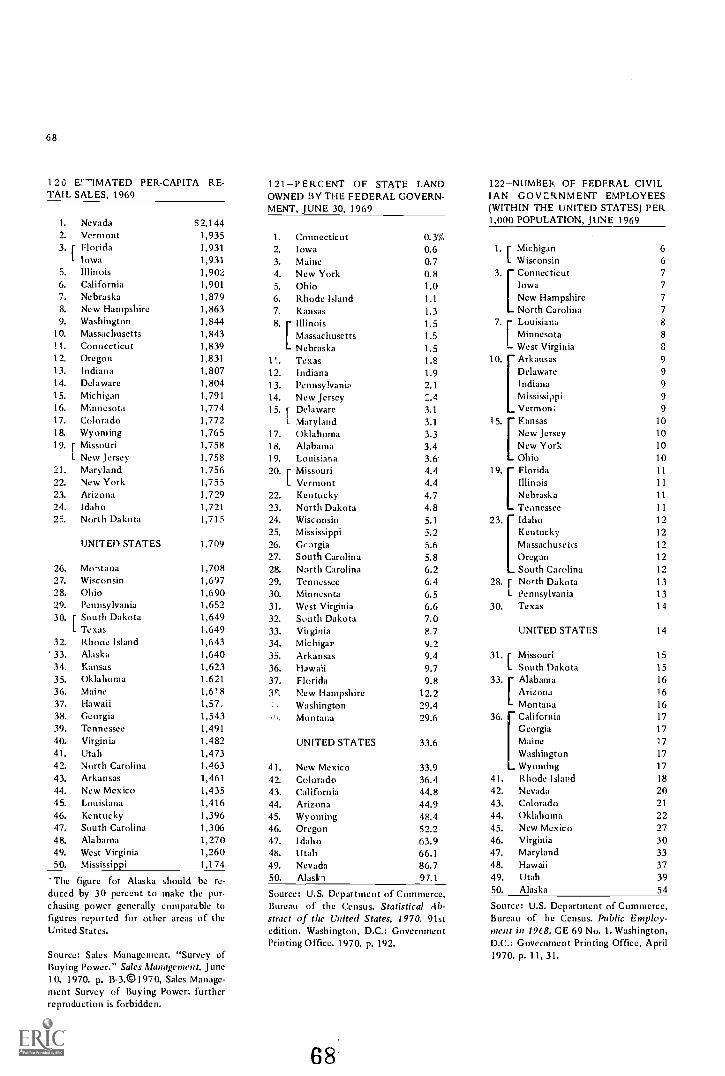
68
1 2G-EF-IMATED PER-CAPITA RE-TAIL SALES, 1969
121- PERCENT OF STATE LANDOWNED BY THE FEDERAL GOVERN-MENT, JUNE 30, 1969
122-NUMBER OF FEDERAL CIVILIAN GOVERNMENT EMPLOYEES(WITHIN THE UNITED STATES) PER
1. Nevada 52,144 1,000 POPULATION, JUNE 1969
2. Vermont 1,935 1. Connecticut 0.3%3. r Florida 1,931 2. Iowa 0.6 1. r Michigan 6
Iowa 1,931 3. Maine 0.7 1 Wisconsin 65. Illinois 1,902 4. New York 0.8 7
6. California 1,901 5. Ohio 1.0 Iowa 77. Nebraska 1,879 6. Rhode Island 1.1
[Connecticut
New Hampshire 7
8. New Hampshire 1,863 7. Kansas 1.3 North Carolina 79. Washington 1,844 8. Illinois 1.5 8
10. Massachusetts 1,843 Massachusetts 1.5
[LouisianaMinnesota 8
11. Connecticut 1,839 Nebraska 1.5 - West Virginia 8
12. Oregon 1,831 1... Texas 1.8 10. Arkansas 913. Indiana 1,807 12. Indiana 1.9 Delaware 914. Delaware 1,804 13. Pennsylvania 2.1 Indiana 915. Michigan 1,791 14. New Jersey 2.4 Mississippi 916. Minnesota 1,774 15. Delaware 3.1 Vermon.. 917. Colorado 1,772 Maryland 3.1 1018. Wyoming 1,765 17. Oklahoma 3.3
[KansasNew Jersey 10
19. Missouri 1,758 18. Alabama 3.4 New York 10L New Jersey 1,758 19. Louisiana 3.6' Ohio 10
21. Maryland 1,756 20. Missouri 4.4 11
22. New York 1,755 Vermont 4.4 Illinois 11
23. Arizona 1,729 22. Kentucky 4.7
[Florida
Nebraska 11
24. Idaho 1,721 23. North Dakota 4.8 Tennessee 11
25. North Dakota 1,715 24. Wisconsin 5.1 23. Idaho 1225. Mississippi 5.2 Kentucky 12
UNITED STATES 1,709 26. Georgia 5.6 Massachusetts 1227. South Carolina 5.8 Oregon 12
26. itana 1,708 28. North Carolina 6.2 South Carolina 1227. Wisconsin 1,697 29. Tennessee 6.4 28. r North Dakota 1328. Ohio 1,690 30. Minnesota 6.5 L Pennsylvania 1329. Pennsylvania 1,652 31. West Virginia 6.6 30. Texas 1430. r South Dakota 1,649 32. South Dakota 7.0
L Texas 1,649 33. Virginia P.7 UNITED STATES 1432. Rhode Island 1,643 34. Michigan 9.233. Alaska 1,640 35. Arkansas 9.4 31. r Missouri 1534. Kansas 1,623 36. Hawaii 9.7 L South Dakota 1535. Oklahoma 1.621 37. Florida 9.8 33. r Alabama 1636. Maine 1,618 3R New Hampshire 12.2 Arizona 16
37. Hawaii 1,57,38. Georgia 1,543
Washington 29.4Montana 29.6 36.
Montana 16
California 1739. Tennessee 1,491 Georgia 1740. Virginia 1,482 UNITED STATES 33.6 Maine 1741. Utah 1,473 Washington 1742. North Carolina 1,463 41. New Mexico 33.9 Wyoming 1743. Arkansas 1,461 42. Colorado 36.4 41. Rhode Island 18
44. New Mexico 1,435 43. California 44.8 42. Nevada 2045. Louisiana 1,416 44. Arizona 44.9 43. Colorado 21
46. Kentucky 1,396 45. Wyoming 48.4 44. Oklahoma 2'2
47. South Carolina 1,306 46. Oregon 52.2 45. New Mexico 2748. Alabama 1,270 47. Idaho 63.9 46. Virginia 3049. West Virginia 1,260 48. Utah 66.1 47. Maryland 3350. Mississippi 1,174 49. Nevada 86.7 48. Hawaii 37
'The figure for Alaska should be re- 50. Alask 97.1 49. Utah 39
duced by 30 percent to make the pur- Source: U.S. Department of Commerce, 50. Alaska 54
chasing power generally comparable to Bureau of the Census. Statistical Ab- Source: U.S. Department of Commerce,figures reported for other areas of the stract of the United States, 1970. 91st Bureau of he Census. Public Employ-United States. edition. Washington, D.C.: Government ment in 19E8. GE 69 No. 1. Washington,
Printing Office. 1970. p. 192. D.C.: Government Printing Office, AprilSource: Sales Management. "Survey of 1970. p. 11, 31.Buying Power." Sales Management, June10, 1970. p. B- 3.©1970, Sales Manage-ment Survey of Buying Power: furtherreproduction is forbidden.
68
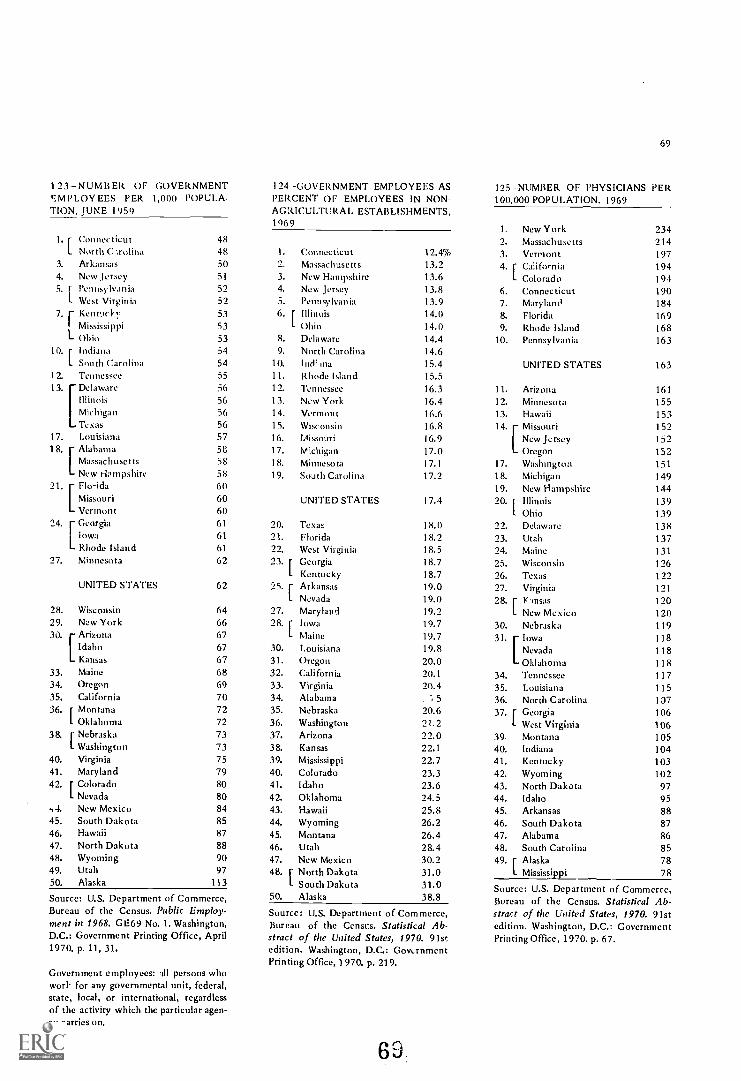
123-NUMBER OF GOVERNMENTEMPLOYEES PER 1,000 POPULA-TION, JUNE 1959
1. r ConnecticutL North C
3. Arkansas4. New Jersey5. [ Pennsylvania
L West Virginia7. Kentnck!,
! MississippiL Ohio
10. r IndianaL South Carolina
12. Tennessee
13. DelawareIllinoisMichiganTexas
17. Louisiana[AlabamaMassachusettsNew Hampshirerlo-ida
MissouriVermont
24. r Georgia1 IowaL Rhode Island
27. Minnesota
UNITED STATES
28. Wisconsin29. New York30. Arizona
IdahoKansas
33. Maine34. Oregon
35. California36. r Montana
1 Oklahoma38. r Nebraska
I- Washington
40. Virginia41. Maryland42. r Colorado
L Nevada
,4. New Mexico45. South Dakota46. Hawaii47. North Dakota48. Wyoming49. Utah50. Alaska
48485051
52
5253
5353
54
5455
56
5656
56
57
58
5860606061
61
61
62
62
646667
67
6768697072727373757980
80848587889097
113
Source: U.S. Department of Commerce,Bureau of the Census. Public Employ-ment in 1968. GE69 No. 1. Washington,D.C.: Government Printing Office, April1970. p. 11,31.
Government employees: all persons whowort- for any governmental unit, federal,state, local, or international, regardlessof the activity which the particular agen-cy carries on.
124 -GOVERNMENT EMPLOYEES ASPERCENT OF EMPLOYEES IN NON-AGRICULTURAL ESTABLISHMENTS,1969
1. ConnecticutMassachusetts
3. New Hampshire4. New Jersey5. Pennsylvania6. r Illinois
L Ohio8. Delaware9. North Carolina
10. Ind'ina11. Rhode Island12. Tennessee13. New York14. Vermont15. Wisconsin16. Missouri17. Michigan18. Minnesota19. South Carolina
12.4%13.213.613.813.914.014.014.414.615.415.516.316.416.6
16.816.917.017.1
17.2
UNITED STATES 17.4
20. Texas21. Florida22. West Virginia23. r Georgia
L Kentucky25. r Arkansas
L Nevada27. Maryland28. Iowa
L Maine30. Louisiana31. Oregon32. California33. Virginia34. Alabama35. Nebraska36. Washington37. Arizona38. Kansas39. Mississippi40. Colorado41. Idaho42. Oklahoma43. Hawaii44. Wyoming45. Montana46. Utah47. New Mexico48. r North Dakota
L South Dakota50. Alaska
18.018.218.518.718.719.019.019.219.719.719.820.020.120.4
5
20.621.222.022.1
22.723.323.624.525.826.226.428.430.231.031.038.8
Source: U.S. Department of Commerce,Bureau of the Censt-s. Statistical Ab-stract of the United States, 1970. 91stedition. Washington, D.C.: GovernmentPrinting Office, 1970. p. 219.
69
69
125 -NUMBER OF PHYSICIANS PER100,000 POPULATION, 1969
1. New York2. Massachusetts3. Vermont4. r California
234214197194
L Colorado 1946. Connecticut 1907. Maryland 1848. Florida 1699. Rhode Island 168
10. Pennsylvania 163
UNITED STATES 163
11. Arizona 161
12. Minnesota 15513. Hawaii 153
152[MissouriNew Jersey 152Oregon 152
17. Washington 151
18. Michigan 14919. New Hampshire 14420. [ Illinois 139
L Ohio 13922. Delaware 13823. Utah 13724. Maine 13125. Wisconsin 12626. Texas 12227. Virginia 121
28. r Vinsas 120L New Mexico 120
30. Nebraska 11931. Iowa 118
Nevada 118Oklahoma 118
34. Tennessee 11735. Louisiana 11536. North Carolina 10737. r Georgia 106
L West Virginia 10639, Montana 10540. Indiana 10441. Kentucky 10342. Wyoming 10243. North Dakota 9744. Idaho 9545. Arkansas 8846. South Dakota 8747. Alabama 8648. South Carolina 8549. r Alaska 78
Mississippi 78
Source: U.S. Department of Commerce,Bureau of the Census. Statistical Ab-stract of the United States, 1970. 91stedition. Washington, D.C.: GovernmentPrinting Office, 1970. p. 67.
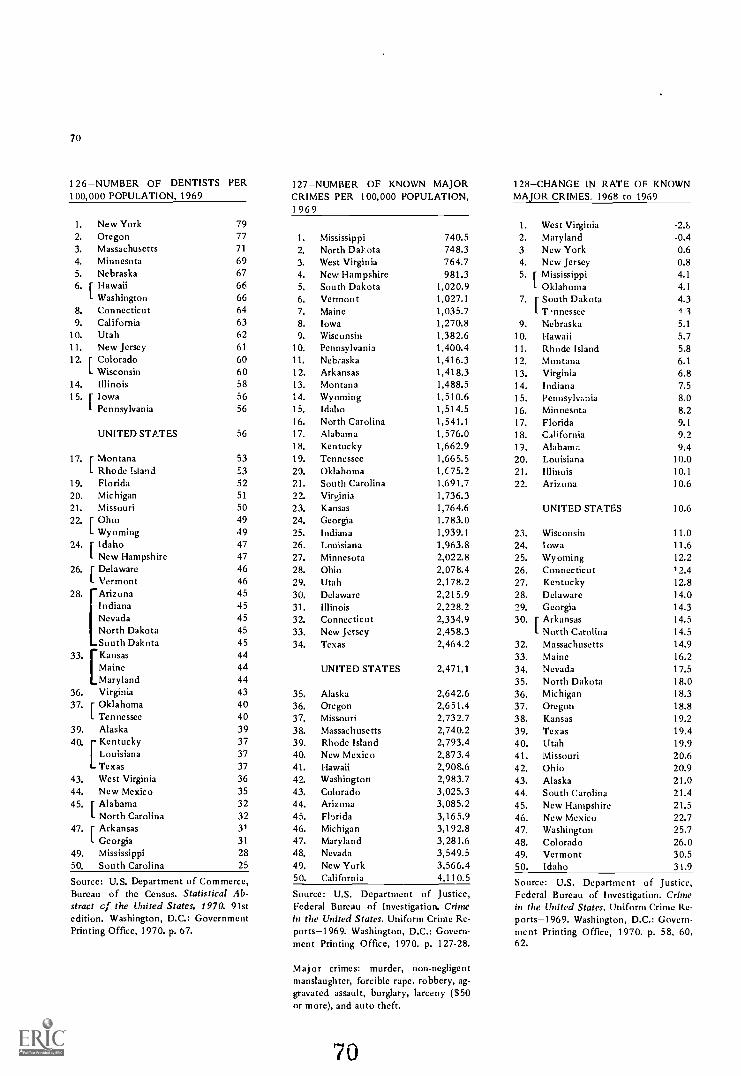
70
126- NUMBER OF DENTISTS100,000 POPULATION, 1969
PER
1. New York2. Oregon3. Massachusetts4. Minnesota5. Nebraska
797771
6967
6. r Hawaii 66L Washington 66
8. Connecticut 649. California 63
10. Utah 6211. New Jersey 61
12. r Colorado 60L Wisconsin 60
14. Illinois 5815. r Iowa 56
Pennsylvania 56
UNITED STATES 56
17. r Montana 53L Rhode Island 53
19. Florida 5220. Michigan 51
21. Missouri 5022. r Ohio 49
L Wyoming 4924. r Idaho 47
1 New Hampshire 4726. r Delaware 46
L Vermont 4628. Arizona 45
Indiana 45Nevada 45North Dakota 45South Dakota 45
33. Kansas 44Maine 44Maryland 44
36. Virginia 4337. r Oklahoma 40
L Tennessee 4039. Alaska 3940. Kentucky 37
Louisiana 37Texas 37
43. West Virginia 3644. New Mexico 3545. r Alabama 32
I North Carolina 3247. r Arkansas 31
I- Georgia 31
49. Mississippi 2850. South Carolina 25
Source: U.S. Department of Commerce,Bureau of the Census. Statistical Ab-stract cf the United States, 1970. 91stedition. Washington, D.C.: GovernmentPrinting Office, 1970. p. 67.
127-NUMBER OF KNOWN MAJORCRIMES PER 100,000 POPULATION,1969
1. Mississippi 740.52. North Dakota 748.33. West Virginia 764.74. New Hampshire 981.35. South Dakota 1,020.96. Vermont 1,027.17. Maine 1,035.78. Iowa 1,270.89. Wisconsin 1,382.6
10. Pennsylvania 1,400.411. Nebraska 1,416.312. Arkansas 1,418.313. Montana 1,488.514. Wyoming 1,510.615. Idaho 1,514.516. North Carolina 1,541.117. Alabama 1,576.018. Kentucky 1,662.919. Tennessee 1,665.520. Oklahoma 1,C75.221. South Carolina 1,691.722. Virginia 1,736.323. Kansas 1,764.624. Georgia 1,783.025. Indiana 1,939.126. Louisiana 1,963.827. Minnesota 2,022.828. Ohio 2,078.429. Utah 2,178.230. Delaware 2,215.931. Illinois 2,228.232. Connecticut 2,334.933. New Jersey 2,458.334. Texas 2,464.2
UNITED STATES 2,471.1
35. Alaska 2,642.636. Oregon 2,651.437. Missouri 2,732.738. Massachusetts 2,740.239. Rhode Island 2,793.440. New Mexico 2,873.441. Hawaii 2,908.642. Washington 2,983.743. Colorado 3,025.344. Arizona 3,085.245. Florida 3,165.946. Michigan 3,192.847. Maryland 3,281.648. Nevada 3,549.549. New York 3,566.450. California 4,110.5
Source: U.S. Department of Justice,Federal Bureau of Investigation. Crimein the United States. Uniform Crime Re-ports-1969. Washington, D.C.: Govern-ment Printing Office, 1970. p. 127.28.
Major crimes: murder, non-negligentmanslaughter, forcible rape, robbery, ag-gravated assault, burglary, larceny ($50or more), and auto theft.
70
128-CHANGE IN RATE OF KNOWNMAJOR CRIMES. 1968 to 1969
1. West Virginia2. Maryland3. New York4. New Jersey5. r Mississippi
Oklahoma
-2.1-0.40.60.84.14.1
7. f South Dakota 4.31 T messce 13
9. Nebraska 5.110. Hawaii 5.711. Rhode Island 5.812. Montana 6.113. Virginia 6.814. Indiana 7.515. Pennsylvania 8.016. Minnesota 8.217. Florida 9.118. California 9.219, Alabama 9.420. Louisiana 10.021. Illinois 10.122. Arizona 10.6
UNITED STATES 10.6
23, Wise onsin 11.024. Iowa 11.625. Wyoming 12.226. Connecticut 12.427. Kentucky 12.828. Delaware 14.029. Georgia 14.330. r Arkansas 14.5
North Carolina 14.532. Massachusetts 14.933. Maine 16.234. Nevada 17.535. North Dakota 18.036. Michigan 18.337. Oregon 18.838. Kansas 19.239. Texas 19.440. Utah 19.941. Missouri 20.642. Ohio 20.943. Alaska 21.044. South Carolina 21.445. New Hampshire 21.546. New Mexico 22.747. Washington 25.748. Colorado 26.049. Vermont 30.550. Idaho 31.9
Source: U.S. Department of Justice,Federal Bureau of Investigation. Crimein the United States. Uniform Crime Re-ports-1969. Washington, D.C.: Govern-ment Printing Office, 1970. p. 58, 60,62.
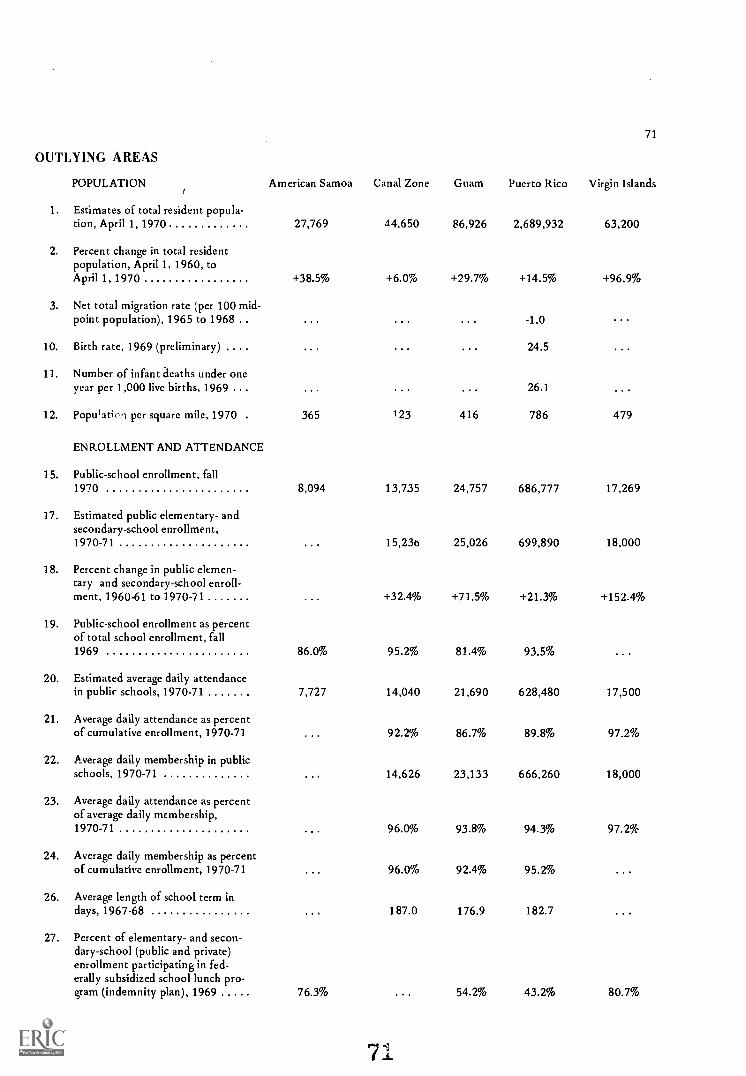
71
OUTLYING AREAS
POPULATION American Samoa Canal Zone Guam Puerto Rico Virgin Islands
1. Estimates of total resident popula-tion, April 1, 1970 27,769
2. Percent change in total residentpopulation, April 1. 1960, toApril 1, 1970 +38.5%
3. Net total migration rate (per 100 mid-point population), 1965 to 1968
10. Birth rate, 1969 (preliminary)
11. Number of infant -deaths under oneyear per 1,000 live births, 1969
12. Pop&ati, n per square mile, 1970 365
ENROLLMENT AND ATTENDANCE
15. Public-school enrollment, fall1970 8,094
17. Estimated public elementary- andsecondary-school enrollment,1970-71
18. Percent change in public elemen-tary and secondary-school enroll-ment, 1960-61 to 1970-71
19. Public-school enrollment as percentof total school enrollment, fall1969 86.0%
20. Estimated average daily attendancein public schools, 1970-71 7,727
21. Average daily attendance as percentof cumulative enrollment, 1970-71
22. Average daily membership in publicschools, 1970-71
23. Average daily attendance as percentof average daily membership,1970-71
24. Average daily membership as percentof cumulative enrollment, 1970-71
26. Average length of school term indays, 1967-68
27. Percent of elementary- and secon-dary-school (public and private)enrollment participating in fed-erally subsidized school lunch pro-gram (indemnity plan), 1969 76.3%
44,650 86,926 2,689,932 63,200
+6.0% +29.7% +14.5% +96.9%
-1.0
24.5
26.1
123 416 786 479
13,735 24,757 686,777 17,269
15,236 25,026 699,890 18,000
+32.4% +71.5% +21.3% +152.4%
95.2% 81.4% 93.5%
14,040 21,690 628,480 17,500
92.2% 86.7% 89.8% 97.2%
14,626 23,133 666,260 18,000
96.0% 93.8% 94.3% 97.2%
96.0% 92.4% 95.2%
187.0 176.9 182.7
54.2% 43.2% 80.7%
7 1
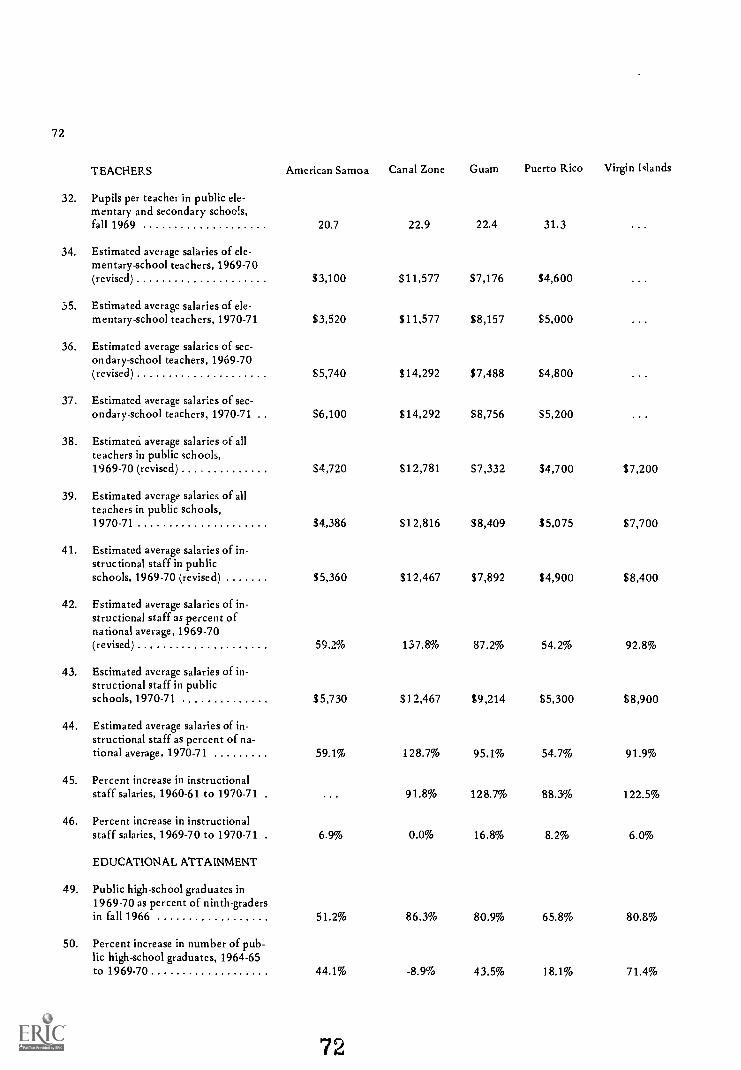
72
TEACHERS American Samoa Canal Zone Guam Puerto Rico Virgin Islands
32. Pupils per teacher in public ele-mentary and secondary schools,fall 1969 20.7 22.9 22.4 31.3
34. Estimated average salaries of ele-mentary-school teachers, 1969-70(revised) $3,100 $11,577 $7,176 $4,600
35. Estimated average salaries of ele-mentary-school teachers, 1970-71 $3,520 $11,577 $8,157 $5,000
36. Estimated average salaries of sec-ondary-school teachers, 1969-70(revised) $5,740 $14,292 $7,488 $4,800
37. Estimated average salaries of sec-ondary-school teachers, 1970-71 $6,100 $14,292 $8,756 $5,200
38. Estimated average salaries of allteachers in public schools,1969-70 (revised) $4,720 $12,781 $7,332 $4,700 $7,200
39. Estimated average salaries of allteachers in public schools,1970-71 $4,386 $12,816 $8,409 $5,075 $7,700
41. Estimated average salaries of in-structional staff in publicschools, 1969-70 (revised) $5,360 $12,467 $7,892 $4,900 $8,400
42. Estimated average salaries of in-structional staff as percent ofnational average, 1969-70(revised) 59.2% 137.8% 87.2% 54.2% 92.8%
43. Estimated average salaries of in-structional staff in publicschools, 1970-71 $5,730 $12,467 $9,214 $5,300 $8,900
44. Estimated average salaries of in-structional staff as percent of na-tional average, 1970-71 59.1% 128.7% 95.1% 54.7% 91.9%
45. Percent increase in instructionalstaff salaries, 1960-61 to 1970-71 . 91.8% 128.7% 88.3% 122.5%
46. Percent increase in instructionalstaff salaries, 1969-70 to 1970-71 . 6.9% 0.0% 16.8% 8.2% 6.0%
EDUCATIONAL ATTAINMENT
49. Public high-school graduates in1969-70 as percent of ninth-gradersin fall 1966 51.2% 86.3% 80.9% 65.8% 80.8%
50. Percent increase in number of pub-lic high-school graduates, 1964-65to 1969-70 44.1% -8.9% 43.5% 18.1% 71.4%
72
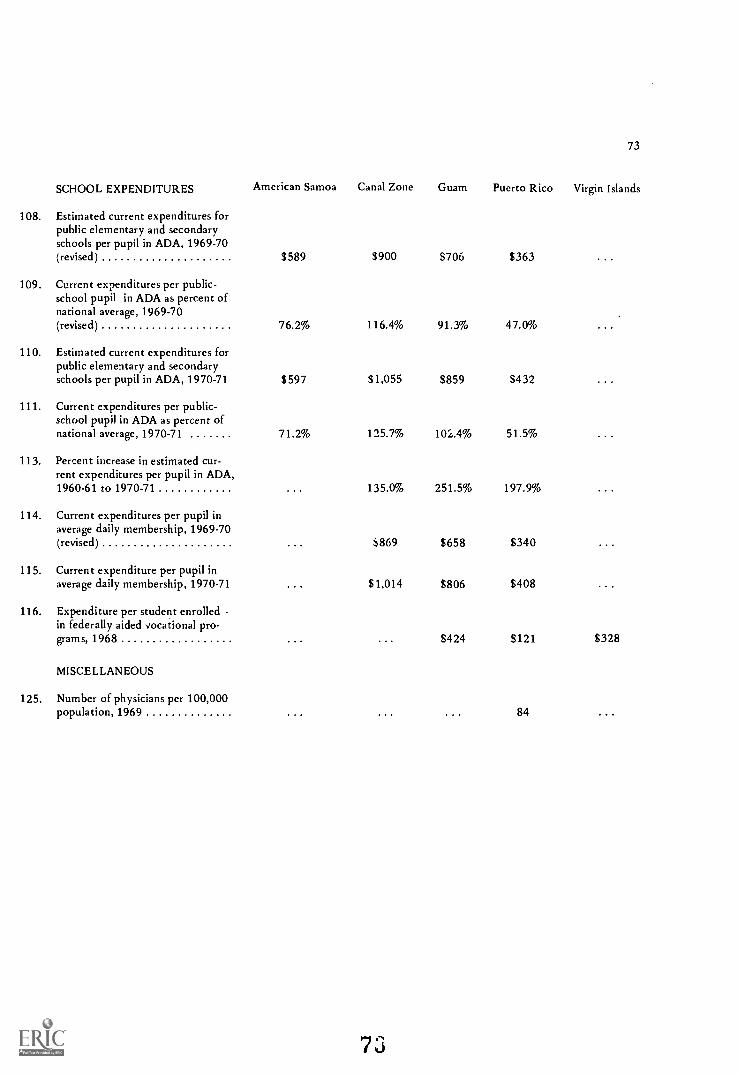
SCHOOL EXPENDITURES
108. Estimated current expenditures forpublic elementary and secondaryschools per pupil in ADA, 1969-70(revised)
109. Current expenditures per public-school pupil in ADA as percent ofnational average, 1969-70(revised)
110. Estimated current expenditures forpublic elementary and secondaryschools per pupil in ADA, 1970-71
111. Current expenditures per public-school pupil in ADA as percent ofnational average, 1970-71
113. Percent increase in estimated cur-rent expenditures per pupil in ADA,1960-61 to 1970-71
114. Current expenditures per pupil inaverage daily membership, 1969-70(revised)
115. Current expenditure per pupil inaverage daily membership, 1970-71
116. Expenditure per student enrolledin federally aided vocational pro-grams, 1968
MISCELLANEOUS
125. Number of physicians per 100,000population, 1969
73
American Samoa Canal Zone Guam Puerto Rico Virgin Islands
$589 $900 $706 $363
76.2% 116.4% 91.3% 47.0%
$597 $1,055 $859 $432
71.2% 125.7% 102.4% 51.5%
135.0% 251.5% 197.9%
869 S658 $340
$1,014 $806 $408
$424 $121 $328
84
73
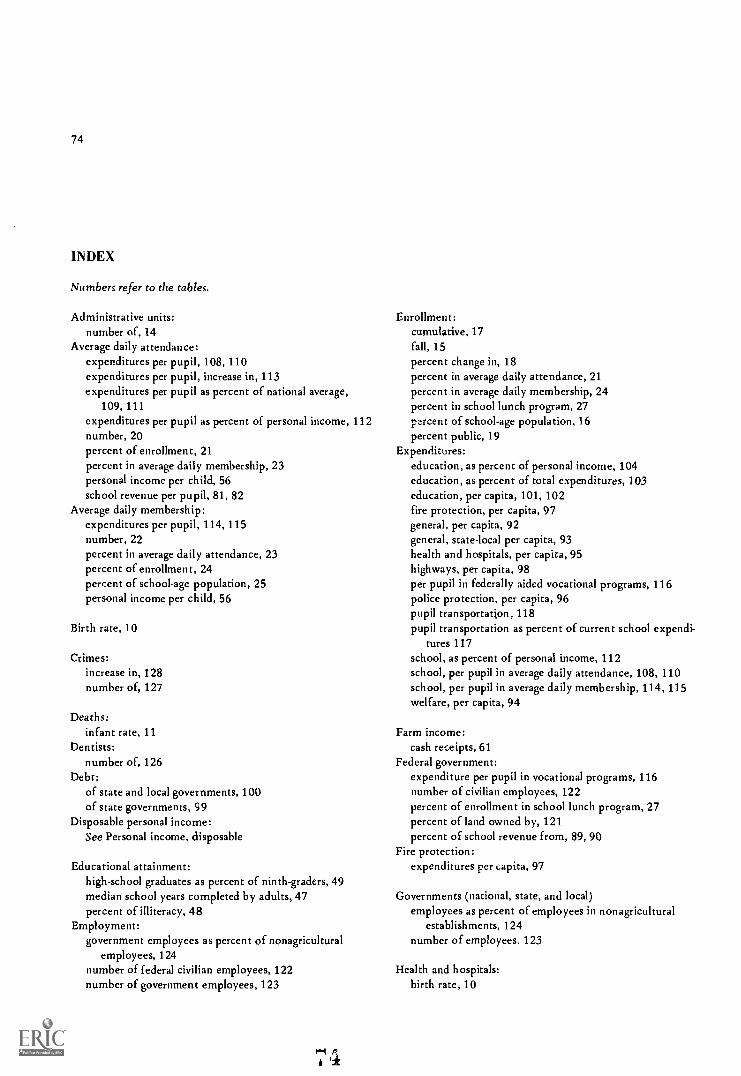
74
INDEX
Numbers refer to the tables.
Administrative units:number of, 14
Average daily attendance:expenditures per pupil, 108, 110expenditures per pupil, increase in, 113expenditures per pupil as percent of national average,
109, 111expenditures per pupil as percent of personal income, 112number, 20percent of enrollment, 21percent in average daily membership, 23personal income per child, 56school revenue per pupil, 81, 82
Average daily membership:expenditures per pupil, 114, 115number, 22percent in average daily attendance, 23percent of enrollment, 24percent of school-age population, 25personal income per child, 56
Birth rate, 10
Crimes:increase in, 128number of, 127
Deaths:infant rate, 11
Dentists:number of, 126
Debt:of state and local governments, 100of state governments, 99
Disposable personal income:See Personal income, disposable
Educational attainment:high-school graduates as percent of ninth-graders, 49median school years completed by adults, 47percent of illiteracy, 48
Employment:government employees as percent of nonagricultural
employees, 124number of federal civilian employees, 122number of government employees, 123
Enrollment:cumulative, 17fall, 15percent change in, 18percent in average daily attendance, 21percent in average daily membership, 24percent in school lunch program, 27percent of school-age population, 16percent public, 19
Expenditures:education, as percent of personal income, 104education, as percent of total expenditures, 103education, per capita, 101, 102fire protection, per capita, 97general, per capita, 92general, state-local per capita, 93health and hospitals, per capita, 95highways, per capita, 98per pupil in federally aided vocational programs, 116police protection, per capita, 96pupil transportation, 118pupil transportation as percent of current school expendi-
tures 117school, as percent of personal income, 112school, per pupil in average daily attendance, 108, 110school, per pupil in average daily membership, 114, 115welfare, per capita, 94
Farm income:cash receipts, 61
Federal government:expenditure per pupil in vocational programs, 116number of civilian employees, 122percent of enrollment in school lunch program, 27percent of land owned by, 121percent of school revenue from, 89, 90
Fire protection:expenditures per capita, 97
Governments (national, state, and local)employees as percent of employees in nonagricultural
establishments, 124number of employees, 123
Health and hospitals:birth rate, 10
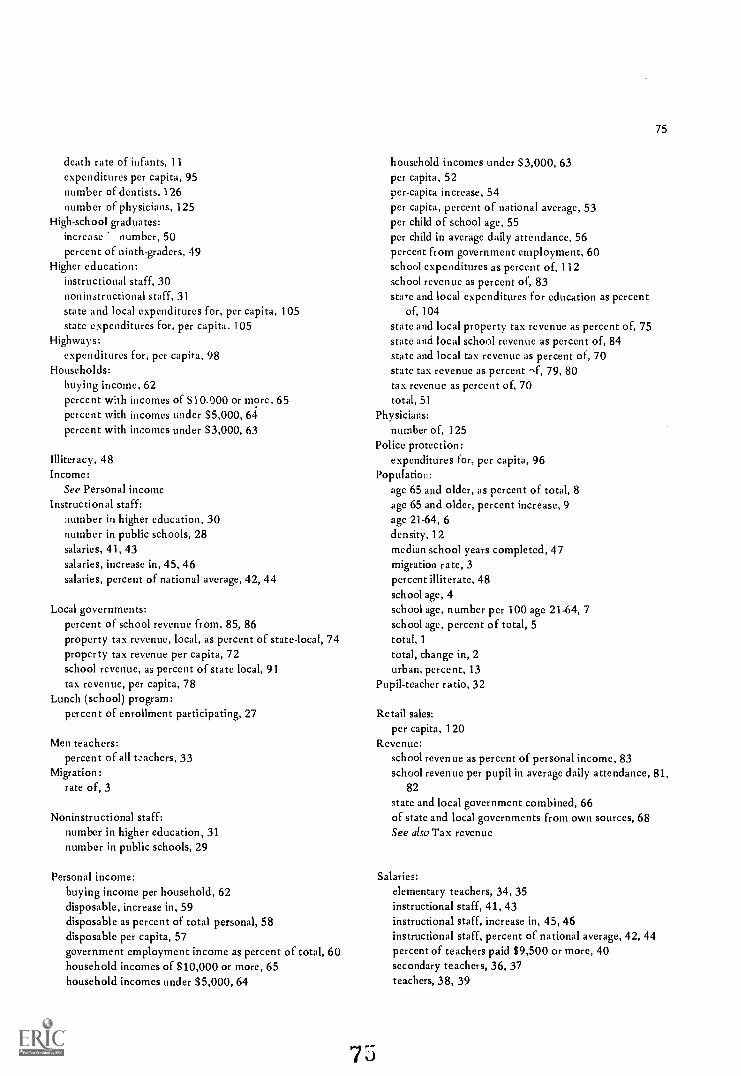
death rate of infants, 11expenditures per capita, 95number of dentists, 126number of physicians, 125
High-school graduates:increase number, 50percent of ninth-graders, 49
Higher education:instructional staff, 30noninstructional staff, 31state and local expenditures for, per capita, 105state expenditures for, per capita, 105
Highways:expenditures for, per capita, 98
Households:buying income, 62percent with incomes of 510.000 or more, 65percent with incomes under S5,000, 64percent with incomes under $3,000, 63
Illiteracy, 48Income:
See Personal incomeInstructional staff:
number in higher education, 30number in public schools, 28salaries, 41, 43salaries, increase in, 45, 46salaries, percent of national average, 42, 44
Local governments:percent of school revenue from, 85, 86property tax revenue, local, as percent of state-local, 74property tax revenue per capita, 72school revenue, as percent of state local, 91tax revenue, per capita, 78
Lunch (school) program:percent of enrollment participating, 27
Men teachers:percent of all teachers, 33
Migration:rate of, 3
Noninstructional staff:number in higher education, 31number in public schools, 29
Personal income:buying income per household, 62disposable, increase in, 59disposable as percent of total personal, 58disposable per capita, 57government employment income as percent of total, 60household incomes of $10,000 or more, 65household incomes under $5,000, 64
75
75
household incomes under $3,000, 63per capita, 52per-capita increase, 54per capita, percent of national average, 53per child of school age, 55per child in average daily attendance, 56percent from government employment, 60school expenditures as percent of, 112school revenue as percent of, 83stare and local expenditures for education as percent
of, 104state and local property tax revenue as percent of, 75state and local school revenue as percent of, 84state and local tax revenue as percent of, 70state tax revenue as percent -4, 79, 80tax revenue as percent of, 70total, 51
Physicians:
number of, 125Police protection:
expenditures for, per capita, 96Population:
age 65 and older, as percent of total, 8age 65 and older, percent increase, 9age 21-64, 6density, 12median school years completed, 47migration rate, 3Percent illiterate, 48school age, 4
school age, number per 100 age 21-64, 7school age, percent of total, 5total, 1total, change in, 2urban, percent, 13
Pupil-teacher ratio, 32
Retail sales:per capita, 120
Revenue:
school revenue as percent of personal income, 83school revenue per pupil in average daily attendance, 81,
82
state and local government combined, 66of state and local governments from own sources, 68See also Tax revenue
Salaries:
elementary teachers, 34, 35instructional staff, 41, 43instructional staff, increase in, 45, 46instructional staff, percent of national average, 42, 44percent of teachers paid $9,500 or more, 40secondary teachers, 36, 37teachers, 38, 39
76
School-age population:number, 4number per 100 agt 11-64, 7percent enrolled in school, 16percent in average daily membership, 25percent of total population, 5personal income per child, 55
School districts:number of, 14
School expenditures:per pupil in average daily attendance, 108, 110per pupil in average daily attendance as percent of
national average, 109, 111per pupil in average daily attendance, increase in, 113per pupil in average daily membership, 114, 115per pupil in federally aided vocational programs, 116as percent of personal income, 112for pupil transportation, 118for pupil transportation as percent of current school
expenditures, 117state, 101state and local. 102. 107state and local as percent of all expenditures, 103state and local as percent of personal income, 104state expenditure for welfare and correction as percent
of, 119School lunch program:
percent of enrollment participating, 27School revenue:
local as percent of state-local, 91per pupil in average daily attendance, 81, 82percent from federal government, 89, 90percent from local governments, 85, 86percent from state governments, 87, 884S percent of personal income, 83state and local, as percent of personal income, 84
School term:length of, 26
Staff, instructional:number in higher education, 30number in public schools, 28salaries, 41, 43salaries, increase in, 45, 46salaries, percent of national average, 42, 44
Staff, noninstructional:number in higher education, 31number in public schools, 29
State and local governments combined:debt, 100expenditures for education, 102expenditures for education as percent of all expendi-
tures, 103expenditures for education as percent of personal in-
come, 104expenditures for schools, 107expenditures for higher education, 106fire protection expenditures per capita, 97
76
general, per capita, 93general revenue per capita, 66health and hospital expenditures per capita, 95highway expenditures per capita, 98percent of revenue from own sources, 68police protection expenditures per capita, 96property tax revenue, 71property tax revenue, percent local, 74property tax revenue, percent of personal income, 75property tax revenue, percent of total tax revenue, 73school revenue, local as percent of state-local, 91school revenue, percent of personal income, 84tax revenue as percent of personal income, 70total tax revenue per capita, 69welfare expenditures per capita, 94
State governments:debt, 99expenditures for education, 101expenditures for higher education, 105general expenditures per capita, 92percent of school revenue from, 87, 88tax revenue per capita, 76 77tax revenue as percent of personal income, 79, 80for welfare and correction as percent of expenditures for
education, 119
Tax revenue:local, 78local property tax revenue as percent of state-local, 74property tax revenue, 71, 72property tax revenue as percent of personal income, 75property tax revenue as percent of total tax revenue, 73property tax revenue, local, as percent of state-local, 74state, as percent of personal income, 79, 80state, 76, 77total, as percent of personal income, 70total, 69
Teachers:percent men, 33percent paid $9,500 or more, 40pupil-teacher ratio, 32salaries, 38, 39
Teachers, elementary:salaries, 34, 35
Teachers, secondary:salaries, 36, 37
Term (school)length of, 26
Transportation, pupil:expenditures as percent of current school expenditures,
117expenditures per pupil, 118
Vocational programs:expenditures per pupil, 116
Welfare:expenditures per capita, 94