DOCUMENT RESUME - ERICDOCUMENT RESUME HE 020 657 El-Khawas, Elaine Campus Trends, 1987. Higher...
48
ED 286 402 AUTHOR TITLE INSTITUTION SPONS AGENCY PUB DATE NOTE AVAILABLE FROM PUB TYPE EDRS PRICE DESCRIPTORS DOCUMENT RESUME HE 020 657 El-Khawas, Elaine Campus Trends, 1987. Higher Education Panel Report Number 75. American Council on Education, Washington, D.C. Higher Education Panel. Lilly Endowment, Inc., Indianapolis, Ind. Aug 87 52p. American Council on Education, Division of Policy Analysis and Research, One Dupont Circle, NW, Washington, DC 30036-1193 ($8.00 per copy, nonmembers; $5.00 per copy, members; prepaid only). Reports - Research/Technical (143) -- Tests /Evaluation Instruments (160) MF01/PC03 Plus Postage. College Faculty; College Students; *Curriculum Development; Educational Change; *Educational Finance; *Enrollment Trends; *Higher Education; Outcomes of Education; Questionnaires; School Surveys; *Student Evaluation; *Teacher Employment; Trend Analysis ABSTRACT Results of a study on changes in campus policies and practices are presented, with the major focus on the issue of assessing student learning. Also considered are changes in faculty hiring and areas of curricular review, enrollment, and financial circumstances of colleges and universities. Results indicate that most administrators support the use of assessment, and many campuses have discussed possible assessment approaches. Ninety-five percent of administrators support assessment that is closely tied to instructional improvement efforts, and 7 in 10 administrators believe that assessment should be linked to institutional planning and budgeting. Almost all colleges have recently made changes in the curriculum or are currently doing so, especially to strengthen general education and to emphasize writing, mathematics, and other general competencies expected of college students. The overall budget, and the budget for educational and general expenses, increased for most institutions. However, 12% of colleges reported a decrease. Information was also collected on: types of information colleges collect, student retention efforts, changes in expenditures, tuition costs, and practices affecting faculty. The survey questionnaire is appended. (SW) *********************************************************************** Reproductions supplied by EDRS are the best that can be made from the original document. **********************************************************************
Transcript of DOCUMENT RESUME - ERICDOCUMENT RESUME HE 020 657 El-Khawas, Elaine Campus Trends, 1987. Higher...

ED 286 402
AUTHORTITLE
INSTITUTION
SPONS AGENCYPUB DATENOTEAVAILABLE FROM
PUB TYPE
EDRS PRICEDESCRIPTORS
DOCUMENT RESUME
HE 020 657
El-Khawas, ElaineCampus Trends, 1987. Higher Education Panel ReportNumber 75.American Council on Education, Washington, D.C.Higher Education Panel.Lilly Endowment, Inc., Indianapolis, Ind.Aug 8752p.American Council on Education, Division of PolicyAnalysis and Research, One Dupont Circle, NW,Washington, DC 30036-1193 ($8.00 per copy,nonmembers; $5.00 per copy, members; prepaidonly).Reports - Research/Technical (143) --Tests /Evaluation Instruments (160)
MF01/PC03 Plus Postage.College Faculty; College Students; *CurriculumDevelopment; Educational Change; *EducationalFinance; *Enrollment Trends; *Higher Education;Outcomes of Education; Questionnaires; SchoolSurveys; *Student Evaluation; *Teacher Employment;Trend Analysis
ABSTRACTResults of a study on changes in campus policies and
practices are presented, with the major focus on the issue ofassessing student learning. Also considered are changes in facultyhiring and areas of curricular review, enrollment, and financialcircumstances of colleges and universities. Results indicate thatmost administrators support the use of assessment, and many campuseshave discussed possible assessment approaches. Ninety-five percent ofadministrators support assessment that is closely tied toinstructional improvement efforts, and 7 in 10 administrators believethat assessment should be linked to institutional planning andbudgeting. Almost all colleges have recently made changes in thecurriculum or are currently doing so, especially to strengthengeneral education and to emphasize writing, mathematics, and othergeneral competencies expected of college students. The overallbudget, and the budget for educational and general expenses,increased for most institutions. However, 12% of colleges reported adecrease. Information was also collected on: types of informationcolleges collect, student retention efforts, changes in expenditures,tuition costs, and practices affecting faculty. The surveyquestionnaire is appended. (SW)
***********************************************************************
Reproductions supplied by EDRS are the best that can be madefrom the original document.
**********************************************************************

AMERICAN COUNCIL ON EDUCATION
Robert H. Atwell, President
The American Council on Education, founded in 1918, is a council of educational organizationsand institutions. Its purpose is to advance education and educational methods through comprehen-sive voluntary and cooperative action on the part of American educational associations, organiza-tions and institutions.
The Higher Education Panel is a survey research program established by the Council for thepurpose of securing policy-related information quickly from representative samples of colleges anduniversities. Higher Education Panel Reports are designed to expedite communication of thePanel's survey findings to policy-makers in government, in the associations, and in educational in-stitutions across the nation.
CAMPUS TRENDS ADVISORY COMMITTEE
James W. Firnberg, Chancellor, Louisiana State University at Alexandria
Robert T. Greene, Provost, J. Sargeant Reynolds Community College
L. Jackson Newell, Professor and Dean, University of Utah
Leroy Keith, Jr., Vice President for Policy & Planning, University of Maryland
David Payne, Dean, College of Social Sciences, Southeast Missouri State University
Rose Marie Beston, President, Nazareth College of Rochester
Donald Adams, Vice President for Enrollment Management and Student Life, Drake
University
Mary ly V. Peck, President, Polk Community College
Cassandra H. Courtney, Vice President for Academic Affairs, Wilberforce University
Sr. Magdalen Coughlin, President, Mount St. Mary's College (CA)
Jack E. Rossmann, Vice President for Academic Affairs, Macalester College
Helen Trimble, Academic Dean, Emmanuel College
This report is not copyrighted. It may be reproduced in whole or in part in the interest ofeducation.
To request copies, please send a check, payable to the American Council on Education, to:Division of Policy Analysis and Research, American Council on Education, One DupontCircle, N.W., Washington, D.C. 20036-1193.
$5.00/copy (ACE Members)$8.00/copy (Non-ACE Members)
Prepaid orders only. Sorry, we cannot accept purchase orders.
3

Campus Trends, 1987
Elaine El-Khawas
Higher Education Panel ReportsNumber 75 August 1987
American Council on EducationWashington, D.C. 20036
4

TABLE OF CONTENTSPage
Acknowledgements ivList of FiguresList of Detailed Statistical TablesHighlights viIntroduction viiiFindings
I. Student Assessment 1
II. Curriculum 3
III. Enrollment and Retention 6
IV. College Finances 7
V. Practices Affecting Faculty 10VI. Institutional Status 12
Summary 13
References 14Detailed Tables 15Appendix A: Survey Questionnaire 30Appendix B: Technical Notes 34
iii 5

ACKNOWLEDGEMENTS
This survey is part of a continuing ACE project to monitor and report on changing practices inhigher education. We are grateful to the Lilly Endowment for providing financial support for theCampus Trends surveys sinc3 1985.
The guidance of the Campus Trends Advisory Committee is especially important to the prepa-ration of this report. Their role in suggesting questions and in offering their own perspective onthe survey results has been very helpful.
Warm thanks are also extended to ACE staff for their cheerful and efficient contributions to thesurvey, especially Rosa Lott-Hawkins, Boichi San, and Charles Andersen.
We wish to express our special gratitude to the Panel's campus representatives and survey re-spondents for their assistance and cooperation.
6iv

LIST OF FIGURESPage
Figure 1. Administrator Views on Assessment 1
Figure 2. Outcomes Assessment Already in Use by Colleges and Universities 3Figure 3. Major Areas of Curriculum Change 5Figure 4. Attention to Outcome Measures: Colleges That Completed or Currently
Have a Curriculum Review 6Figure 5. College Expenses Requiring a Larger Share of the Budget 9Figure 6. Factors in Setting Tuition Levels 10Figure 7. Policies Affecting Faculty 11
LIST OF DETATr,ED STATISTICAL TABLESPage
Table 1. Curren'. Status of Student Assessment 16Table 2. Attitudes on Student Assessment 17Table 3. Assessment Procedures Now Used by Colleges and Universities 1
Table 4. Changes in the CurriculumTable 5. Changes Made in the Curriculum: All Colleges with a Current
or Recent Curriculum ReviewTable 6. Changes Made in the Curriculum: Colleges That Recently Completed
a Curriculum ReviewTable 7. Changes in the Curriculum That Are Currently Being DiscussedTable 8. Changes in Enrollment (1986-87 vs 1985-86)Table 9. Changes in College Finances, FY 1986 to FY 1987Table 10. Changes in the Share of Budget Required by Various ExpensesTable 11. College Actions c,.. College TuitionTable 12. Patterns of Faculty HiringTable 13. Administrator Views on Institutional StatusTable 14. Institutional Policies and Pract;cesTable 15. Competition between Public and Independent Institutions
v7
80
21
22232424252627282829
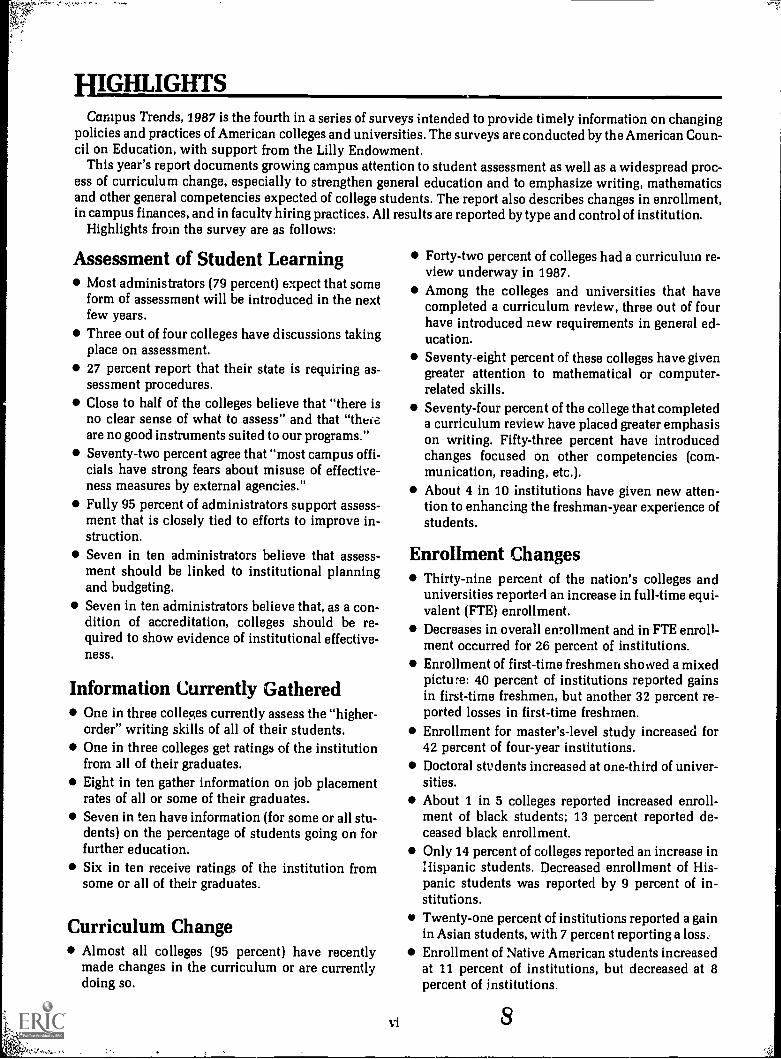
HIGHLIGHTSCampus Trends, 1987 is the fourth in a series of surveys intended to provide timely information on changing
policies and practices of American colleges and universities. The surveys are conducted by the American Coun-cil on Education, with support from the Lilly Endowment.
This year's report documents growing campus attention to student assessment as well as a widespread proc-ess of curriculum change, especially to strengthen general education and to emphasize writing, mathematicsand other general competencies expected of college students. The report also describes changes in enrollment,in campus finances, and in faculty hiring practices. All results are reported by type and control of institution.
Highlights from the survey are as follows:
Assessment of Student LearningMost administrators (79 percent) expect that someform of assessment will be introduced in the nextfew years.Three out of four colleges have discussions takingplace on assessment.27 percent report that their state is requiring as-sessment procedures.Close to half of the colleges believe that "there isno clear sense of what to assess" and that "theieare no good instruments suited to our programs."Seventy-two percent agree that "most campus offi-cials have strong fears about misuse of effective-ness measures by external agencies."Fully 95 percent of administrators support assess-ment that is closely tied to efforts to improve in-struction.Seven in ten administrators believe that assess-ment should be linked to institutional planningand budgeting.Seven in ten administrators believe that, as a con-dition of accreditation, colleges should be re-quired to show evidence of institutional effective-ness.
Information Currently GatheredOne in three colleges currently assess the "higher-order" writing skills of all of their students.One in three colleges get ratings of the institutionfrom all of their graduates.Eight in ten gather information on job placementrates of all or some of their graduates.Seven in ten have information (for some or all stu-dents) on the percentage of students going on forfurther education.Six in ten receive ratings of the institution fromsome or all of their graduates.
Curriculum ChangeAlmost all colleges (95 percent) have recentlymade changes in the curriculum or are currentlydoing so.
vi
Forty-two percent of colleges had a curriculum re-view underway in 1987.Among the colleges and universities that havecompleted a curriculum review, three out of fourhave introduced new requirements in general ed-ucation.Seventy-eight percent of these colleges have givengreater attention to mathematical or computer-related skills.Seventy-four percent of the college that completeda curriculum review have placed greater emphasison writing. Fifty-three percent have introducedchanges focused on other competencies (com-munication, reading, etc.).About 4 in 10 institutions have given new atten-tion to enhancing the freshman-year experience ofstudents.
Enrollment ChangesThirty-nine percent of the nation's colleges anduniversities reported an increase in full-time equi-valent (FTE) enrollment.Decreases in overall enrollment and in FTE enroll-ment occurred for 26 percent of institutions.Enrollment of first-time freshmen showed a mixedpicture: 40 percent of institutions reported gainsin first-time freshmen, but another 32 percent re-ported losses in first-time freshmen.Enrollment for master's-level study increased for42 percent of four-year institutions.Doctoral students increased at one-third of univer-sities.About 1 in 5 colleges reported increased enroll-ment of black students; 13 percent reported de-ceased black enrollment.Only 14 percent of colleges reported an increase inHispanic students. Decreased enrollment of His-panic students was reported by 9 percent of in-stitutions.Twenty-one percent of institutions reported a gainin Asian students, with 7 percent reporting a loss.Enrollment of Native American students increasedat 11 percent of institutions, but decreased at 8percent of institutions.
S

Student RetentionToday, almost all colleges and universities havespecial programs designed to increase studentretention.Twenty percent reported gains in rates of studentretention through to graduation; 11 percent re-ported gains in minority student retention.Twenty-seven percent reported that progress wasmade in reducing student attrition during the firstyear of college.Six in 10 institutions have special programs to in-crease minority student retention.
Financial StatusThe overall budget, and the budget for educationaland general expenses, increased for most institu-tions. However, 12 percent of colleges reported adecrease.One in 5 public institutions reported a decline inrevenues from state and local government.One in four institutions reported a decline in theiroverall indebtedness; 16 percent experienced anincreased debt level.Six in ten institutions reported gains in alumnigiving and/or gifts. This included 3 out of 4 inde-pendent institutions and one-half of the publicinstitutions.Four in ten colleges, including half in the publicsector, reported that the share of costs that must bepaid by students and their parents had increasedin the last few years.Only 40 percent of administrators rate their col-lege's overall financial condition as excellent orvery good.Only 3 in 10 administrators rate their levels of fac-ulty compensation as excellent or very good.
Changes in ExpendituresMore than 8 in 10 institutions reported that expen-ditures for computing equipment and operationsrequired a larger share of their budget.About 7 in 10 institutions reported that faculty sal-aries were taking an increased share of the budget.Institutionally-funded student aid re quired an in-creased share of the budget at 7 in 10 independentinstitutions and at 1 in 4 public institutions.Renovation and repair of existing facilities calledfor a larger share of the budget at 4 in 10 institu-tions.Construction of new facilities required a largershare of the budget for 3 in 10 institutions.
vii
Tuition CostsThe median category of likely change for 1987-88was 6 to 7 percent. However, for 1988-89, the me-dian increase was 4 to 5 percent.Eight in 10 independent institutions and 3 in 10public institutions now allow tuition to be paid ininstallments over a year's time.Among factors in setting tuition:
"Catch-up" increases in faculty salaries werementioned by 55 percent of all colleges.New or expanding academic programs werementioned by 43 percent of institutions.Expanded student aid was mentioned by 4 in 10institutions.State mandates about tuition levels or the shareof costs to be paid by students were cited by two-thirds of public institutions.Reduced state or local funding was mentionedby 4 in 10 institutions (and by 51 percent of pub-lic institutions).
Practices Affecting FacultyMost colleges and universities made new facultyappointments during 1986-87.Forty-two percent reported net gains in the num-ber of their full-time faculty.Twenty-five percent of institutions reportedgreater difficulty in the past year in getting top ap-plicants to accept faculty positions.Thirteen percent of institutions reported that thequality of applicants for full-time faculty positionshad declined in the past year.Twenty-two percent have retrenchment proce-dures underway.Procedures to retrain faculty were reported byclose to half of institutions.About 4 in 10 institutions offer incentives for earlyretirement of faculty.Annual awards for outstanding teaching were of-fered by 48 percent of institutions.
Other Trends3 in 10 institutions reported having a commissionor committee on the status of minorities.More than half reported that competition betweenthe public and independent sector had increasedin seeking support from corporations and founda-tions.About 4 in 10 institutions reported that competi-tion between the sectors had increased over finan-cial support from state tax funds.More than half of the colleges reported increasedcompetition between public and independent sec-tors for high-ability students.
9

INTRODUCTION
This report offers findings from the fourth in a seriesof surveys conducted by the American Council on Ed-ucation. These surveys, supported by the Lilly Endow-ment, are designed to provide timely information onchanges taking place in the policies and practices ofAmerican colleges and universities.
The survey was conducted through the HigherEducation Panel, a survey research program of theAmerican Council on Education. Administrators at anationally representative sample of 456 colleges anduniversities were mailed a four-page questionnaireon February 23, 1987. By mid-June, 372 responseswere received (82 percent). Responses are statisticallyadjusted to be generally representative of Americancolleges and universities that offer undergraduateinstruction.
Respondents, primarily academic administrators, in-cluded: presidents, 12 percent; academic vice presi-dents, 54 percent; assistant or associate deans/vicepresidents, 8 percent; and other, 25 percent. The re-sults describe how these administrators view their in-stitutions; as with all "self-report" studies, results aresubject to some variability in how questions wereinterpreted.
For this report, major attention was given to campusactions on assessment and to the curricular changesthat are prevalent today on the nation's campuses. Thereport also examined faculty hiring practices, percep-tions about institutional status, changes in enrollmentand finances, and factors in tuition-setting.
Several important themes emerge from the survey:
1. Curricular change is widespread during the1980's. About half of the colleges have recently
viii
completed a review of their curriculum, andmost of the others are currently reviewing theircurriculum.
2. Most colleges have focused on strengthening gen-eral education. This includes a new emphasis onwriting, on math and computer-related skills, andon other general competencies expected of col-lege students.
3. Most campuses expect to introduce some form ofstudent assessment over the next few years.Three-quarters of the campuses reported that dis-cussions about assessment are taking place.
4. Despite demographic predictions to the contrary,a substantial proportion of colleges reported in-creased enrollment last fall.
5. Only 40 percent of college administrators ratetheir college's financial condition as excellent orvery good. Only 3 in 10 rate their levels of facultycompensation this highly. Computing costs (forequipment and operations) and faculty salariesare taking an increasing share of most collegebudgets.
6. Most colleges continue to make new faculty ap-pointments. At the same time, 25 percent re-ported having greater difficulty in getting top ap-plicants to accept new appointments.
Findings are organized by subject matter. Detailedtables, with results shown by type of institution, followthe text. For about half of the questions asked in thisyear's survey, previous Campus Trends surveys ob-tained comparable information.
10
a

F
Student Assessment
INGS
Most Campuses are DiscussingAssessment, and Most Expect ToIntroduce Some Form of Assessment
In the view of campus administrators responding tothe survey, assessment seems to be an idea whose timehas come.
Most believe that college faculty would support theevelopment of assessment procedures, and most
79 percent) expect that some form of assessmentwill be introduced in the next few years. (Table 1).Three out of four have discussions taking place onthe subject. The discussions focus on "what" to as-sess more often than on "whether" to develop as-sessment procedures.Only 27 percent report that their state is requiringassessment procedures; thus, apart from the collegesfacing a state mandate for assessment, a good manyother colleges are also exploring approaches toassessment.
d(
Tie Assessment toInstruction
Include feedback tostudents
Accreditation shouldrequire effectivenessinformation
States should requireeffectiveness infonation
Campuses fear misuseby external agencies
Colleges should publisheffectiveness information
Administrator views about faculty support for as-sessment have shown some change since 1986. In1987, 69 percent of administrators, overall, thoughtthat faculty would support the concept, compared to58 percent a year ago. Support is thought to be quitehigh at two-year colleges: 76 percent of administratorsat two-year colleges felt that faculty would support thedevelopment of assessment.
Eight in ten institutil ns expect some form of assess-ment to be introduced in the next few years. This is avery high proportion, especially considering that someof those answering in the negative explained that theyalready have assessment methods in place.
Survey results also indicate that substantial prob-lems remain before assessment becomes a reality.
For 3 out of 4 institutions, discussions are takingplace on fundamental issues of what outcomesshould be assessed and what assessment methodsshould be used.
Close to half of the colleges believe that "there is noclear sense of what to assess" and that "there are nogood instruments suited to our programs."
Figure 1Administrator Views on Assessment
45
43
72
72
89
95
10 20 30 40 50 60 70 80 90 100
Percentage Agreeing with Each Statement
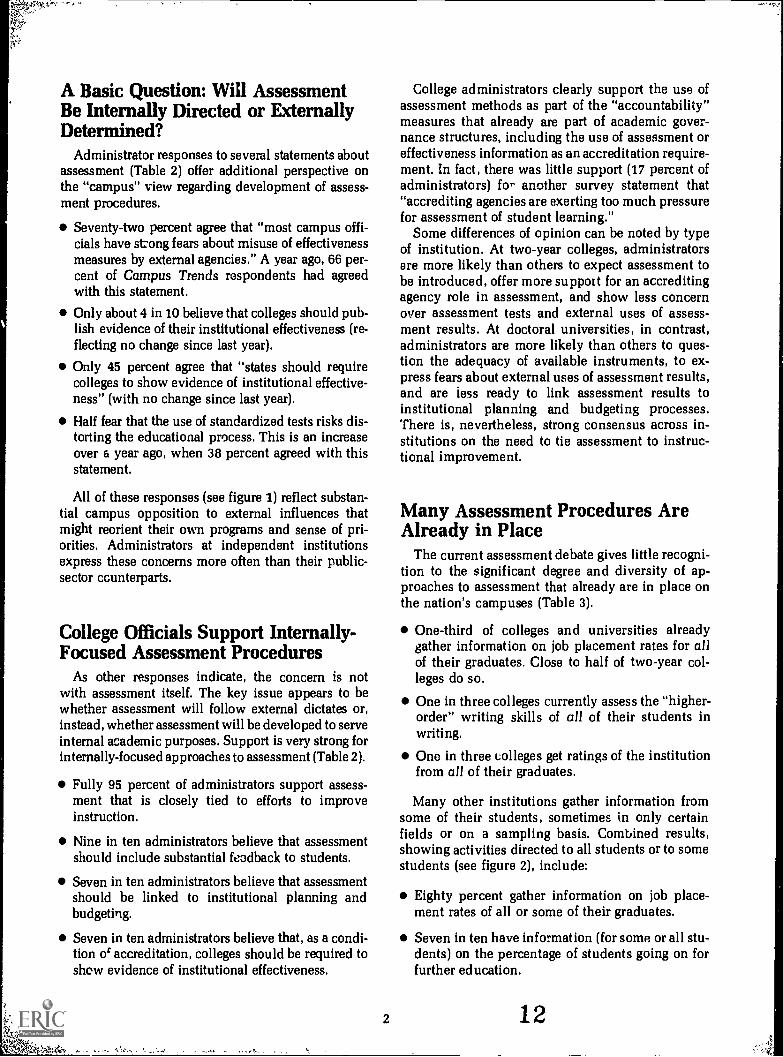
A Basic Question: Will AssessmentBe Internally Directed or ExternallyDetermined?
Administrator responses to several statements aboutassessment (Table 2) offer additional perspective onthe "campus" view regarding development of assess-ment procedures.
Seventy-two percent agree that "most campus offi-cials have strong fears about misuse of effectivenessmeasures by external agencies." A year ago, 66 per-cent of Campus Trends respondents had agreedwith this statement.
Only about 4 in 10 believe that colleges should pub-lish evidence of their institutional effectiveness (re-flecting no change since last year).
Only 45 percent agree that "states should requirecolleges to show evidence of institutional effective-ness" (with no change since last year).
Half fear that the use of standardized tests risks dis-torting the educational process. This is an increaseover a year ago, when 38 percent agreed with thisstatement.
All of these responses (see figure 1) reflect substan-tial campus opposition to external influences thatmight reorient their own programs and sense of pri-orities. Administrators at independent institutionsexpress these concerns more often than their public-sector counterparts.
College Officials Support Internally-Focused Assessment Procedures
As other responses indicate, the concern is notwith assessment itself. The key issue appears to bewhether assessment will follow external dictates or,instead, whether assessment will be developed to serveinternal academic purposes. Support is very strong forinternally-focused approaches to assessment (Table 2).
Fully 95 percent of administrators support assess-ment that is closely tied to efforts to improveinstruction.
Nine in ten administrators believe that assessmentshould include substantial feedback to students.
Seven in ten administrators believe that assessmentshould be linked to institutional planning andbudgeting.
Seven in ten administrators believe that, as a condi-tion ot accreditation, colleges should be required toshow evidence of institutional effectiveness.
2
College administrators clearly support the use ofassessment methods as part of the "accountability"measures that already are part of academic gover-nance structures, including the use of assessment oreffectiveness information as an accreditation require-ment. In fact, there was little support (17 percent ofadministrators) for another survey statement that"accrediting agencies are exerting too much pressurefor assessment of student learning."
Some differences of opinion can be noted by typeof institution. At two-year colleges, administratorsare more likely than others to expect assessment tobe introduced, offer more support for an accreditingagency role in assessment, and show less concernover assessment tests and external uses of assess-ment results. At doctoral universities, in contrast,administrators are more likely than others to ques-tion the adequacy of available instruments, to ex-press fears about external uses of assessment results,and are less ready to link assessment results toinstitutional planning and budgeting processes.There is, nevertheless, strong consensus across in-stitutions on the need to tie assessment to instruc-tional improvement.
Many Assessment Procedures AreAlready in Place
The current assessment debate gives little recogni-tion to the significant degree and diversity of ap-proaches to assessment that already are in place onthe nation's campuses (Table 3).
One-third of colleges and universities alreadygather information on job placement rates for allof their graduates. Close to half of two-year col-leges do so.
One in three colleges currently assess the "higher-order" writing skills of all of their students inwriting.
One in three colleges get ratings of the institutionfrom all of their graduates.
Many other institutions gather information fromsome of their students, sometimes in only certainfields or on a sampling basis. Combined results,showing activities directed to all students or to somestudents (see figure 2), include:
Eighty percent gather information on job place-ment rates of all or some of their graduates.
Seven in ten have information (for some or all stu-dents) on the percentage of students going on forfurther education.
12

Six in ten receive ratings of the institution fromsome or all of their graduates.Two-thirds require demonstrations of proficiencyin a major (apart from an exam) for some or allstudents.Six in ten require pre- and post-tests for studentstaking remedial courses.Six in ten assess the "higher-order" writing skillsof some or all students.Five in ten assess the oral communications skillsof some or all students.Five in ten gather information on the quality ofperformance on the job of some t,, all graduates.Five in ten obtain standardized test scores forgraduates in professional programs.Fhb in ten administer tests of basis: skills to someor all students.
Significant percentages of institutions gather otherinformation on the performance of their students.Close to half, for example, have information on thelong-term outcomes of (some or all) graduates. About3 in 10 (and more than 50 percent of doctoral univer-sities) administer comprehensive examinations tosome of their graduates.
Such variation points to a key question in present-day discussions on the need for more attention to as-sessment: is it better for a large number of collegesto offer the same approaches to assessment or, in-stead, is it better for colleges to develop a variety of
approaches according to differing circumstances? Atpresent, it appears that a good many procedures arein place to assess student performance, but withmuch variation in how such assessment takes place.
Curriculum
Curriculum Change Is WidespreadThe 1980s clearly have been a decade of curriculum
review for the nation's colleges and universities.
Almost all (95 percent) have recently made changesin the curriculum or are currently doing so. Thiscontinues a pattern reported in previous CampusTrends reports, beginning in 1984 (Table 4).
By 1987, half of the nation's colleges had completeda curriculum review; in miler surveys, about one-third had done so.Forty-five percent of colleges had a curriculum re-view underway in 1987, a smaller percentage thanfound in earlier surveys.A majority of four-year institutions had completeda curriculum review; among 2-year colleges, themajority were still actively engaged in curriculumreview.
Figure 2Outcomes Assessment Already in Use by Colleges and Universities
Job Placement rates ofgraduates
Rates that students go onfor further education
Ratings by graduates
Demonstrated Proficiencyin a major
Writing Skills
Pre & Post Tests forRemedial Courses
42 78
ling&IM*32
52 65
30 64
38 64
10 20 30
71
40 50 60 70 80
Percentage of Institutions
3 3
90
For SomeStudents
MI For AllStudents

New Requirements Have BeenIntroduced in General Education
A reaffirmation of requirements in general educationis the main theme of recent curriculum change.
Today, almost all four-year institutions (95 percentof baccalaureate colleges, 92 percent of comprehen-sive universities and 83 percent of doctoral uni,,er-sides) require that all students complete coursewurkin general education as part of their college study.Among two-year institutions, 7 in 10 have generaleducation requirements for all students; another 22percent have such requirements for some students.There has been only limited change in the propor-tion of colleges with general education requirementssince 1984: 76 percent of all institutions had generaleducation requirements for all students in 1984(Campus Trends 1984) compared to 82 percent in1987. This probably is a sizeable increase comparedto a decade ago, however.
Important changes have been made in what is re-quired to meet the general education component of col-lege study. For all colleges that are making curriculumchanges, 55 percent have already introduced new gen-eral education requirements (Table 5).
Among the colleges and universities that have com-pleted a curriculum review (Table 6), three out of fourhave introduced new general education requirements.There are a good number of common elements re-ported by these institutions (see figure 3):
Seventy-seven percent have given greater attentionto mathematical or computer-related skills.
Seventy-two percent have placed greater emphasison writing.
Sixty percent have introduced changes focused onother competencies (communication, reasoning,etc.).
More than half (54 percent) have increased theircourse requirements.
Several Other Curricular ThemesAre Receiving Attention
Colleges that are changing their curriculum reporteda diversity of other themes as well (Table 5). Betweenone-third and one -half of these institutions also re-ported nPw attention to:
The freshman year
Career preparation
Internships for students
Issues in science and technology.
4
Notably, close to half of the nation's four-year in-stitutions are introducing changes in their programs toprepare teachers, reflecting the attention and rec-ommendations that have been made on this subjectrecently.
Among the colleges that have completed a curricu-lum review (Table 6), other themes also emerge, eitheramong certain types of institutions or by small propor-tions of all colleges.
Almost half of the doctoral universities that havecompleted a curriculum review have introducedmore multidisciplinary or "theme" courses.
Close to half of these four-year institutions havegiven increased attention to international matters aspart of the curriculum.
Forty-two percent of these doctoral universities havegiven greater emphasis to the foreign language pro-ficiency of their students.
Forty-two percent of these baccalaureate collegesand 43 percent of these doctoral universities havegiven new attention to values or ethics.
Thirty-four percent of these two-year colleges haveintroduced changes offering flexibility for adultlearners.
Thirty-one percent of these two-year colleges haveintroduced new ways to enrich the major.
Current Reviews of CurriculumAre Taking Some New Directions
Other types of change can be expected in the fu-ture. Table 7 shows the areas being discussed bythose institutions that are currently engaged in a cur-riculum review. Although many of the same topicsappear, some interesting new areas are mentioned byat least 3 in 10 of these institutions. These "new"areas, not mentioned as frequently by those insti-tutions that have completed curriculum reviews,include:
Specifying desired outcomes for courses in themajor
Specifying desired outcomes for subject ir 'ter ingeneral education
Assessing "value-added"
New attention to values or ethics
More multidisciplinary or "theme" courses
Greater flexibility for adult learners
New ways to enrich the major.
14

Other "new" areas are receiving attention at cer-tain types of institutions (Table 7). Four in 10 of thesebaccalaureate colleges and comprehensive univer-sities are looking at possible changes in the senior-year experience of students, for example. Fifty-twopercent of these universities are looking at new waysto involve students in research.
Curricular Change and NationalReports: Some Common ThemesAre Evident
Many themes found in recent national reports canbe seen in some of these changes in curriculum.Among changes already made, the emphasis on thefreshman year, the focus on academic competencies
General Education
Math/Computer Skills
Writing
Other Competencies
Increased CourseRequirements
Freshman Year
Career Preparation
Internships
Science and Technology
and skills, new attention to teacher education, andgreater opportunities for student internships all re-flect recommendations of reports issued over the lastfew years.
So too, several of the "new" areas now receivingattentionmore emphasis on the major on multidis-ciplinary approaches, and on valueswere recom-mendations of the Carnegie Foundation study and ofthe report by the Association of American Colleges.Assessment of "value added," a major recommenda-tion of the NIE report, is receiving attention by 36percent of colleges currently reviewing their curricu-lum. Another recommendation of the NIE report,stressing the value of measuring actual "outcomes"for students, is reflected in several "new" areas cur-rently receiving attention.
Figure 3Major Areas of Curriculum Change*
76
38
37
42
46
54
60
72
77
10 20 30 40 50 60 70 80
Percentage of Institutions
'Colleges That Have Recently Completed Curriculum Review
155

Particularly striking is the new emphasis on "out-comes" or "value-added" approaches (see figure 4).
Among the institutions that have completed a curric-ulum review, only 9 percent gave attention to so-called "value-added" methods that look at changesin students over the college years. In contrast, amongthe institutions that are currently reviewing theircurriculum, 36 percent are looking at "value-added"approaches. The pattern is similar for changes thatemphasize desired outcomes of college study: about4 in 10 of the institutions currently reviewing theircurriculum are exploring such approaches; fewerhad done so in previous years. All of these responsesspeak to recommendations about the need for "as-sessment" of student learning found in sec ,tral recentnational reports, including the recommendations is-sued in 1986 by the National ..-;overnors Associationabout ways to increase college quality.
Enrollment and Retention
Some Enrollment Gains Continue butThere Are Important Decreases
A large number of colleges and universities reportedincreases (of two percent of more) in headcount enroll-ment in the last year. However, a number of collegeshad enrollment decreases, especially in full-time-equivalent enrollment and in enrollment of first-timefreshmen (Table 8).
Value-Added
Outcomes inthe major
Outcomes ingeneral education
Outcomes inacademiccompetencies
For 43 percent of institutions, headcount enrollmentincreased last year. In last year's report (CampusTrends 1986), 35 percent had reported an increase.
With FTE enrollment, 39 percent of institutionsreported an increase. Forty-one percent of two-yearinstitutions and baccalaureate colleges reportedincreases in full-time-equivalent enrollment.
Declines in overall enrollment and FTE enrollmentoccurred for 26 percent of institutions. Fewer than1 in 10 doctoral universities reported such de-creases, but 3 in 10 baccalaureate colleges had a de-cline in FTE enrollment.
Enrollment of first-time freshmen also showed amixed picture: fully 40 percent of institutions re-ported gains in first-time freshmen, but another 32percent reported losses in first-time freshmen.Among baccalaureate colleges, 36 percent reportedsuch a loss.
These resultsbased on institutional reports ratherthan student countssuggest that there are both "win-ners" and "losers" in the current enrollment picture.In aggregate terms, this picture has been considered tobe surprisingly strong, keeping ahead of predicteddemographic changes. Yet, despite overall gains andthe positive experience of 4 in 10 colleges, a significantnumber of other institutions are facing declining en-rollna.,at. The information from the one-third of in-stitutions reporting fewer first-time enrollments is par-ticularly troubling if it indicates the direction of futureenrollment change.
Figure 4Attention to Outcome Measures:
Colleges That Completed or Currently Have a Curriculum Review
'411t404
18
24
I
36
38
38
3540
5 10 15 20 25 30 35
Percentage of Institutions
b
40 45 50
16
Completed
MECurrentlyReviewingCurriculum
A
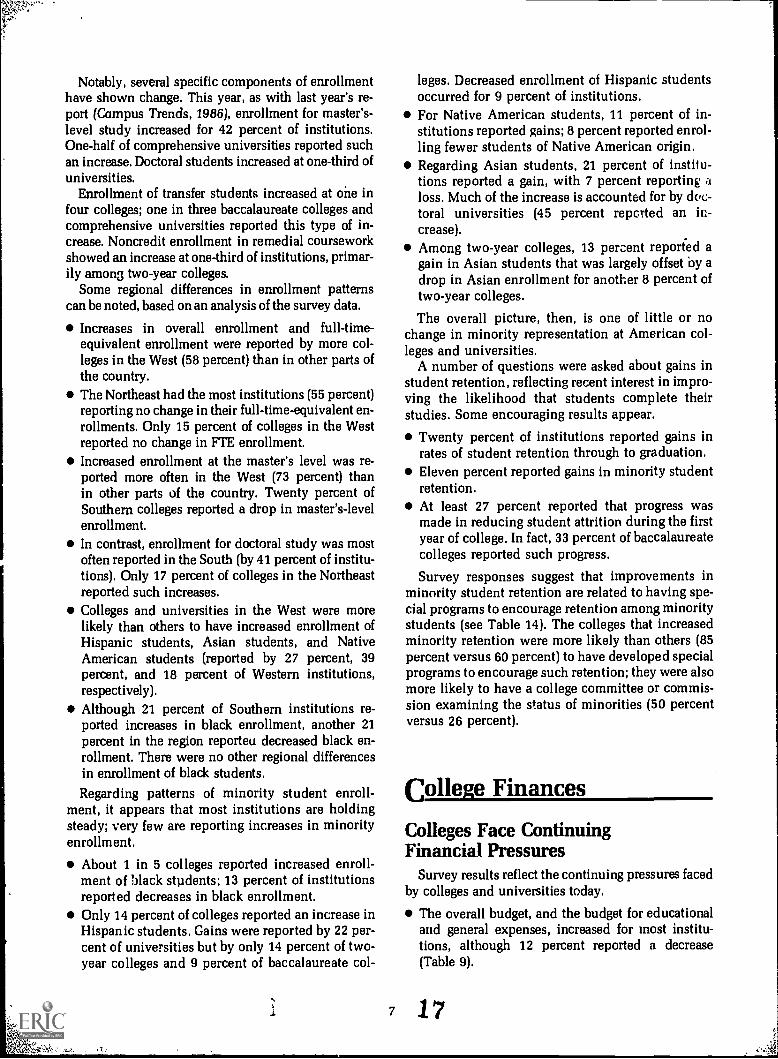
Notably, several specific components of enrollmenthave shown change. This year, as with last year's re-port (Campus Trends, 1986), enrollment for master's-level study increased for 42 percent of institutions.One-half of comprehensive universities reported suchan increase. Doctoral students increased at one-third ofuniversities.
Enrollment of transfer students increased at one infour colleges; one in three baccalaureate colleges andcomprehensive universities reported this type of in-crease. Noncredit enrollment in remedial courseworkshowed an increase at one-third of institutions, primar-ily among two-year colleges.
Some regional differences in enrollment patternscan be noted, based on an analysis of the survey data.
Increases in overall enrollment and full-time-equivalent enrollment were reported by more col-leges in the West (58 percent) than in other parts ofthe country.The Northeast had the most institutions (55 percent)reporting no change in their full-time-equivalent en-rollments. Only 15 percent of colleges in the Westreported no change in FTE enrollment.Increased enrollment at the master's level was re-ported more often in the West (73 percent) thanin other parts of the country. Twenty percent ofSouthern colleges reported a drop in master's-levelenrollment.In contrast, enrollment for doctoral study was mostoften reported in the South (by 41 percent of institu-tions). Only 17 percent of colleges in the Northeastreported such increases.Colleges and universities in the West were morelikely than others to have increased enrollment ofHispanic students, Asian students, and NativeAmerican students (reported by 27 percent, 39percent, and 18 percent of Western institutions,respectively).Although 21 percent of Southern institutions re-ported increases in black enrollment, another 21percent in the region reporteu decreased black en-rollment. There were no other regional differencesin enrollment of black students.
Regarding patterns of minority student enroll-ment, it appears that most institutions are holdingsteady; very few are reporting increases in minorityenrollment.
About 1 in 5 colleges reported increased enroll-ment of black students; 13 percent of institutionsreported decreases in black enrollment.Only 14 percent of colleges reported an increase inHispanic students. Gains were reported by 22 per-cent of universities but by only 14 percent of two-year colleges and 9 percent of baccalaureate col-
7
leges. Decreased enrollment of Hispanic studentsoccurred for 9 percent of institutions.For Native American students, 11 percent of in-stitutions reported gains; 8 percent reported enrol-ling fewer students of Native American origin.Regarding Asian students, 21 percent of institu-tions reported a gain, with 7 percent reporting aloss. Much of the increase is accounted for by dc.c-toral universities (45 percent reported an in-crease).Among two-year colleges, 13 percent reported again in Asian students that was largely offset by adrop in Asian enrollment for another 8 percent oftwo-year colleges.
The overall picture, then, is one of little or nochange in minority representation at American col-leges and universities.
A number of questions were asked about gains instudent retention, reflecting recent interest in impro-ving the likelihood that students complete theirstudies. Some encouraging results appear.
Twenty percent of institutions reported gains inrates of student retention through to graduation.Eleven percent reported gains in minority studentretention.At least 27 percent reported that progress wasmade in reducing student attrition during the firstyear of college. In fact, 33 percent of baccalaureatecolleges reported such progress.
Survey responses suggest that improvements inminority student retention are related to having spe-cial programs to encourage retention among minoritystudents (see Table 14). The colleges that increasedminority retention were more likely than others (85percent versus 60 percent) to have developed specialprograms to encourage such retention; they were alsomore likely to have a college committee or commis-sion examining the status of minorities (50 percentversus 26 percent).
College Finances
Colleges Face ContinuingFinancial Pressures
Survey results reflect the continuing pressures facedby colleges and universities today.
The overall budget, and the budget for educationaland general expenses, increased for most institu-tions, although 12 percent reported a decrease(Table 9).
17

Among public institutions, 17 percent reported a de-creased budget. In the independent sector, 6 percentof institutions reported a decreased budget.Just over half (55 percent) of public institutions re-ported an increase in revenues from state and localgovernment sources. Eighteen percent of public in-stitutions reported a decline in revenues from this,their primary source of revenue.Among independent institutions, I in 4 reported again in state or local funding, although 10 percenthad a loss in state or local funds.Three in ten institutions reported a gain in federalstudent aid funds. Conversely, one in six institu-tions reported a drop in such funds. Among com-prehensive universities, 23 percent had a loss infederal student aid funds.Increases continue in institutional funding of stu-dent aid. Three out of four independent institutionsand one-third of public institutions reported thatthey increased their budgets for student aid from theinstiiution's own funds.One in four institutions reported a decline in theiroverall indebtedness, a figure partly offset by the 16percent that experienced an increased debt level.Among independent institutions, 3 in 10 had de-creased their debt levels, although another 20 per-cent increased their indebtedness.
Income from two sourcesendowment and gifts/alumni givingprovided additional assistance formany institutions.
Close to half of the colleges reported gains in incomefrom endowment. This included 6 in 10 indepen-dent institutions and 4 in 10 public institutions.Six in ten institutions reported gains in alumnigiving and/or gifts. This included 3 out of 4 in-dependent institutions and one-half of the publicinstitutions.
One indication of the net result of these variouschanges is shown in responses to another question, re-garding the share of total costs for college study thatstudents and parents pay. Forty-four percent of col-leges, including half in the public sector, reported thatthe family's share of costs had increased.
Additional analysis of the survey data reveals somedistinctive regional differences in the financial statusof colleges:
Increases in the overall budget and in the budget foreducational and general expenses were reportedmore often in the Northeast and Midwest (87 per-cent and 77 percent, respectively) umn in the Southor West (65 percent and 67 percent, respectively).Increases in state or local funding were also reportedmore often by colleges in the Northeast and Midwest
8
(52 percent and 46 percent, respectively) than in theSouth or West (36 percent and 39 percent, respec-tively). Colleges in the South were the most likelyto report a drop in state or local funding (reportedby 31 percent of Southern institutions).Increases in endowment income were reported byonly 40 percent of institutions in the Northeast butby about half of institutions in other parts of thecountry.Increases in institutional indebtedness were moreoften reported by colleges in the Northeast and Mid-west (24 percent and 20 percent, respectively) thanby colleges in the South and West (11 percent and8 percent, respectively).
Computer Needs, Faculty Salaries,and Student Aid put Pressure onCollege Budgets
Table 10 shows responses on a question aboutwhether certain categories of expenditure were re-quiring a larger or smaller share of the college'sbudget, compared to a few years earlier. Responsesidentify both new and long-standing pressures onacademic institutions (see figure 5).
The most frequently cited expenditure involvedcomputing. More than 8 in 10 institutions reportedthat expenditures for computing equipment andoperations required a larger share of their budget.About 7 in 10 institutions reported that facultysalaries were taking an increased share of thebudget.Institutionally-funded student aid required an in-creased share of the budget at 46 percent of institu-tions. Seven in ten independent institutions re-ported this increase.Renovation and repair of existing facilities calledfor a larger share of the budget at 4 in 10institutions.Construction of new facilities required a largershare of the budget for 3 in 10 institutions. Con-versely, 2 in 10 reported that construction now re-quired a smaller share of their budget.Administrative and instructional programs werecalling for an expanded share of the budget for agood many colleges, including admissions (59 per-cent), development (43 percent), undergraduateprograms (36 percent), and student support ser-vices (33 percent).Support of graduate programs was reported as tak-ing a larger share of the budget by 31 percent of in-stitutions (including 36 percent of baccalaureatecolleges).
18

Relatively few institutions cited any of thesecategories as receiving a decreased share of thebudget. Assuming that the primary types of expendi-ture are reflected here, the lack of choices about de-creases may suggest that decreases have been gradualand "across the board," thus not creating a specificarea of cutback. It is also true that the question didnot distinguish the relative size of any increase ordecrease.
Paying for College: Rising Fees,Greater Flexibility
College tuition charges will outpace inflation forthe next year, according to the survey's respondents.The median category of change expected for 1987-88was 6 to 7 percent. For 1988-89, however, the me-dian change was 4 to 5 percent, a level that may beeven with changes in inflation.
Public institutions varied widely in their 1987-88estimates. Forty-six percentprimarily two-yearcollegesexpected increases of 3 percent or less.Thirteen percent of public institutions, however,expected that increases would be 10 percent ormore.Among independent institutions, most expectedtuition increases of 6 to 7 percent for 1986-87. Allbut 16 percent expected increases of between 4and 9 percent.For the 1986-89 academic year, public institutionsare anticipating modest tuition increases. More
Computing
Faculty Salaries
Admissions
Institutional Student Aid
Development
Renovations/Repairs
Academic Programs
than half estimated increases at 3 percent or less.Most others estimated a 4 to 5 percent increase tooccur.
For independent institutions, the 1988 -89 aca-demic year was expected to be much the same as1987-88. Most expected tuition increases of 6 to7 percent.
In view of such increases, them has been much de-bate over ways to help families pay for college costs.New slurces of loan funding, methods to prepay tui-tion or to stretch out payments, or new scholarshipresources have all been suggested in recent years.Survey results report on institutional experienceswith four types of innovative financing options.
Merit scholarships, awarded without regard to fi-nancial circumstances, are now prevalent inhigher education. Eight in 10 institutions havesuch scholarships, including athletic and otherspecial-purpose scholarships.
Eight in 10 independent institutions and 3 in 10public institutions now allow students (or parents)to pay tuition in installments over a year's time.Long-term, below-market loans for parents or stu-dents are offered by 1 in 4 independent institu-tions. Only 14 percent of public institutions offerloan programs of this type.
Prepayment of tuition at the start of college studyis an option offered by only a few u.stitutions (10percent, overall). Among independent institu-tions, 17 percent offer such an option.
Figure 5College Expenses Requiring a Larger Share of the Budget
..,
10 20 30
41
36
43
46
59
68
40 50 30 70 30
Percentage of Institutions
919
83
90

Factors in Setting TuitionVary by Type of Institution
A variety of factors affect decisions about tuitioncharges of colleges and universities. For public in-stitutions, key decisions about tuition are made bystate officials. For both public and independent in-stitutions, tuition charges cover only a portion of fulleducational costs. As Table 11 shows, no single fac-tor accounted for mcent decisions about tuitionlevels.
Several themes were cited:
"Catch up" increases in faculty salaries (men-tioned by 55 percent of all colleges anti by 8 in 10independent institutions)New or expanding academic programs (mentionedby 43 percent of institutions)Expanded student aid (mentioned by 4 in 10 in-stitutions and by 7 in 10 independent institutions)State mandates about tuition or share of costs to bepaid by students (mentioned by two-thirds of pub-lic institutions)Reduced state/local funding (mentioned by 4 in10 institutions and by 51 percent of publicinstitutions).
Faculty Salaries
New or ExpandedAcademic Programs
Expanded StudentAid Program
State Mandates
Reduced State/Local Funding
Computing
Fixed Costs andFewer Students
Public and independent institutions have very dif-ferent experiences in this matter (see figure 6). Forpublic institutions, the key factors were state man-dates and reduced levels of state or local funding.
Among independent institutions, the two primaryfactors in tuition setting were "catch-up" increases infaculty salaries and expanded student aid programs.
Practices Affecting FacultyFaculty Hiring Continues
Most colleges and universities made new faculty ap-pointments during 1986-87. A significant proportion-42 percentalso reported net gains in the number oftheir full-time faculty. Only one-third of two-year col-leges had a net gain (Table 13).
These figures on net gain in number of faculty repre-sent an increase from a year earlier. In Campus Trends1986, 37 percent of colleges had reported a net gain infull-time faculty. The most notable gain is foundamong baccalaureate colleges: in 1986, 40 percent hadincreased the number of their full-time faculty; in1987, 55 percent reported that they had such an in-crease. These gains may reflect the expansion of
Figure 6Factors in Setting Tuition Levels
14
WitUIRMWZCW:itTAA
51
10 20 30 40
46
50
Percentage of Institutions
10
71
66 70 80
20
81
90
PublicInstitutions
IndependentInstitutions

academic programs cited earlier as a factor in tuitionsetting.
In contrast, one in five institutions reported a netloss in full-time faculty. This proportion has remainedthe same over the last two years. Notably, 28 percentof public institutions reported a net loss in full-timefaculty.
As might be expected, enrollment losses are relatedto these faculty cutbacks. According to an analysis ofthe survey data, 42 percent of those with decreasedfull-time-equivalent enrollment last year also had a netloss in full-time faculty; a net loss in part-time facultywas reported by 39 percent of these institutions.
A potential new concern for colleges over the nextdecade arises from projections of a faculty shortage, atleast in certain academic specialities. Based on ques-tions asked for the first time in this year's CampusTrends survey, it appears that some campuses are al-ready experiencing difficulty in recruiting faculty(Table 12).
Twenty-five percent of institutions reported greaterdifficulty la the past year in getting top applicantsto accept faculty positions.
About 1 in 3 public institutions reported thisdifficulty.
Among independent institutions, 17 percent re-ported such problems.The colleges that experienced an enrollment declinein the last year were somewhat more likely than
Retrainingprocedures
Retrenchment
Incentivesfor earlyretirement
Annual awards,outstandingteaching
others (34 percent versus 25 percent) to report diffi-culty in recruiting faculty.Thirteen percent of institutions reported that thequality of applicants for full-time faculty positionshad declined in the past year. Hardly any doctoralinstitutions reported this difficulty. Most instancesappeared among two-year and baccalaureatecolleges.
These questions appear on the survey in order tooffer a baseline for comparisons with campus situa-tions over the next decade. If projections prove right,it 's expected that such problems will occur with in-creasing frequency over the next few years.
Other survey responses point to substantial differ-ences among colleges in their faculty personnelpolicies (see figure 7):
Twenty-two percent have retrenchment proceduresunderway to cut back on the number of faculty. Thisfigure is somewhat lower than the 28 percent thatwas reported by colleges in the Campus Trends1985 survey.
Procedures to retrain faculty were reported by closeto half of institutions. Two-year colleges were mostlikely to have such procedures. Responses to thisquestion probably reelect both formalized proce-dures and informal agreements for retraining.Close to half of colleges and universities offer incen-tives for early retirement of faculty. These incentiveswere reported most often by doctoral universities.
Figure 7Policies Affecting Faculty
22
f, .s' ' 'Vk',3.. *$N, ;,-$-;,..
............42
47
n'as....
10 15 20
4A 4..;.z4.`,A
Sy,
25 30 35 40
Percentage of Institutions
48
45 50

Annual awards for outstanding teaching were of-fered by 48 percent of institutions. Such awardswere offered by almost all doctoral universities.Salary increases linked to outstanding teaching werereported by 51 percent of institutions. Almost alldoctoral universities reported such policies. Re-sponses here might reflect formal evaluation criteriathat include teaching performance, rather than pro-cedures that exclusively focus on teaching.
Institutional Status
Enrollment, Finances and OtherProblems Continue To ConcernAdministrams
Responses shown in Table 13 offer a capsule view,perhaps, of some of the problems facing colleges anduniversities today.
Only 40 percent of administrators rate their college'soverall financial condition as excellent or very good.This figure shows some improvement over resultsgiven a year ago, when 36 percent gave such ratingsto their financial condition.Only 3 in 10 administrators rated their levels of fac-ulty compensation as excellent er very good. Only2 in 10 baccalaureate colleges gave this rating.Six in ten administrators gave their institutions goodmarks on their ability to attract and hold good facul-ty. Two-thirds of independent institutions ratedthemselves highly in this regard, compared to 53percent of public institutions.
Preparation levels of students continue to be seen astoo low. Only 22 percent of administrators felt thatpreparation levels were excellent or very good. Thisis a gain over last year, when 17 percent of adminis-trators felt that student preparation was excellent orvery good.
Relatively few administrators gave their institutionshigh ratings on their ability to attract good students.Responses differed considerably by type of institu-tion, with administrators at universities offering thehighest ratings of their students.Very few administrators (19 percent) consideredtheir institution's ability to attract minority studentsto be excellent or very good. There were very fewdifferences by type of institution.A favorable viewpoint emerged regarding job pros-pects for the college's degree recipients: 55 percentof administrators felt that job prospects were excel-
12
lent or very good. This is a gain over responses of ayear ago, when 49 percent offered this view.
Other responses underscore the fact that problems ofenrollment planning occupy considerable attention atmost campuses (Table 14).
About 8 in 10 institutions have conducted analysesof their projected enrollment over the next fewyears.
Almost all institutions have special programs de-signed to increase student retention.
Six in 10 institutions have special programs to in-crease minority student retention. Almost all doc-toral universities reported such programs.
The nature of the campus "climate" is increasinglyseen as relevant to issues of minority retention. Onelimited aspect of campus climate was raised on the sur-vey, whether campuses had a commission or commit-tee charged with giving attention to the status ofwomen or minorities on campus (Table 14).
Overall, very few institutions (about 3 in 10) re-ported having a commission or committee on thestatus of minorities.
Committees on the status of minorities appeared pri-marily at doctoral universities (74 percent).
In contrast, only one in five baccalaureate collegesand 4 in 10 of the comprehensive institutions havea committee looking at the status of minorities.
Results were similar regarding committees or com-missions on the status of women. Seven in ten doc-toral institutions had commissions, with muchlower percentages reported by other types ofinstitutions.
Table 14 also reflects a variety of pressures facingcolleges and universities today on problems that affectall of American society.
Most campuses today have formal policies on druguse. Eight in 10 independent institutions and 2 in3 public institutions have policies on drug use.
Even higher proportions-9 in 10 independent in-stitutions and 72 percent of public institutionshave policies about alcohol use.
More than half of doctoral universities have de-veloped policies on AIDS; most other types of in-stitutions do not currently have policies in place.
Policies governing treatment of hazardous wasteare in place among most universities, but are re-ported by only half of the two-year colleges and byabout 1 in 3 baccalaureate colleges.
22
Competition Between the Publicand Independent Sectors
Several signs are evident (Table 15) of continuingstrains between public and independent sectors inhigher education:
More than half reported that competition betweenthe public and independent sectors had in-creased in obtaining 'support from corporationsand foundations.About 4 in 10 institutions reported that competi-tion between the sectors had increased over finan-
SUMMARY
cial support from state tax funds. Two-year col-leges were especially likely to report this view.
More than half of the colleges reported increasedcompetition between public and independent co:-leges for high-ability students.
In contrast, hardly any respondents felt that com-petition between the sectors had decreased in thepast year. At best, only 10 percent of public-sector re-spondents (primarily at two-year institutions) re-ported a decrease in compet.tion over support fromstate tax funds.
This report points to a number of favorable trends af-fecting the nation's colleges and universities today. Awidespread process of curricular revitalization is tak-ing place. More attention is being paid to student ac-complishments in math skills, writing and other com-petencies. Systematic approaches to student assess-ment an, being discussed on many campuses.
Despite predictions of declining enrollment, a largepercentage of colleges reported an enrollment increasefor the last year. Some colleges have been able to in-crease their rates of student retention. There is evi-dence too that almost all colleges are preparing them-selves for the future by conducting analyses of likelyenrollment patterns for the next few years.
At the same time, three broad issues are revealed bythe survey's responses:
Many administrators are concerned that the present-day move toward more systematic assessmentprocedures will be shaped primarily by externalmandates. As survey responses clearly indicate, thecampus perspective toward assessment is one thatstresses its internal role in improving instruction.Whether an internal or an external view of assess-ment prevail is likely to have very different conse-quences for the academic community.A small but significant proportion of colleges appearto be facing hard times. Twenty-six percent reporteda decrease in full-time equivalent enrollment.Thirty-two percent had a decrease in their first-time
13
freshmen enrollment. One in five reported a loss inthe number of full-time faculty and twenty-two per-cent have retrenchment procedures underway.Twelve percent reported a decrease in their overallbudget. One in five public institutions received re-duced funding from state or local governmentsources.Close to half of all colleges reported an increase inthe share of costs that parents and students must payfor college study. As colleges face cuts from severalkey sources of revenues, other sources have notfilled the gap, leaving students to take on greaterburden. Fully half of the public institutionswhichenroll close to 80 percent of all studentscited re-duced state or local funding as a factor in recent tui-tion rates set for their institutions.
The 1980s appear to be a time of difficult manage-ment challenges for college administrators. There aresome positive signsin curriculum reform, enroll-ment management, gains in alumni giving, and prog-ress in adjusting faculty salariesbut numerous chal-ingges remain, both continuing and new. One in fourhave begun to have difficulty in recruiting well-qualified faculty, for example. Half of the collegesreported increased competition between public andindependent sectors for high-ability students and forcorporate or foundation support. In sum, the survey re-sults point to a diverse set of continuing pressuresfacing colleges and universities.
23

REFERENCESAssociation of American Colleges. Integrity in the
Classroom: A Report to the Academic Community.Washington, D.C.: Association of American Col-leges, 1985.
Boyer, Ernest L. College: The Undergraduate Experi-ence in America. New York: Harper and Row, 1987.
El-Khawas, Elaine. Campus Trends, 1984. Washing-ton, D.C.: American Council on Education, February1985.
Campus Trends, 1985. Washington. D.C.:
14
American Council on Education, February 1986.Campus Trends, 1986. Washington. D.C.:
American Council on Education, August 1986.National Institute of Education. Involvement in Learn-
ing: Realizing the Potential of American Higher Ed-ucation. Washington, D.C.: Department of Educa-tion, 1984. (The NIE Report)
National Governors Association. Time for Results: To-ward the Yedr 1991. Washington, D.C.: NationalGovernors Association, 1986.
24

DETAILED STATISTICAL TABLES
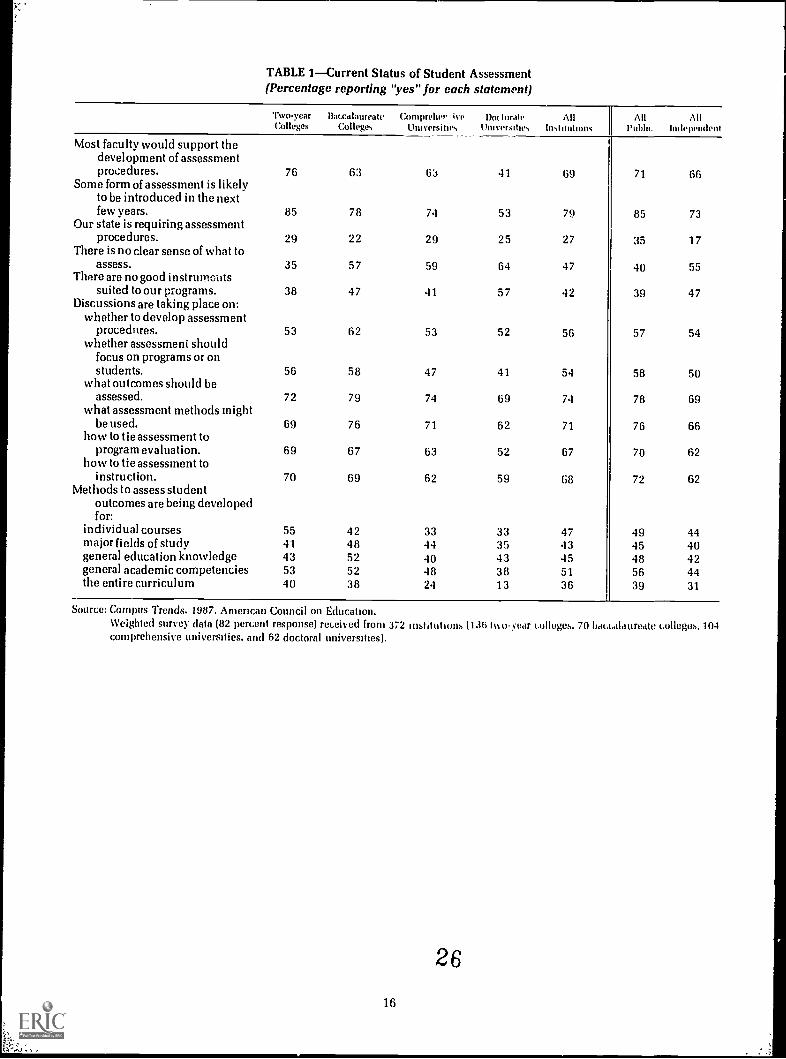
TABLE 1Current Status of Student Assessment(Percentage reporting "yes" for each statement)
l'woyearColleges
BacculaureateCollege,,
Compothr ivt.Uloversito,.
Dot torah.UniversOo.
Anlio,toutions
AllPublti,
AllIndependent
Most faculty would support thedevelopment of assessmentprocedures. 76 63 63 41 69 71 66
Some form of assessment is likelyto be introduced in the nextfew years. 85 78 74 53 79 85 73
Our state is requiring assessmentprocedures. 29 22 29 25 27 35 17
There is no clear sense of what toassess. 35 57 59 64 47 40 55
There are no good instrumentssuited to our programs. 38 47 41 57 42 39 47
Discussions are taking place on:whether to develop assessment
procedures.whether assessmeni should
focus on programs or onstudents.
what outcomes should beassessed.
what assessment methods mightbe used.
how to tie assessment toprogram evaluation.
how to tie assessment toinstruction.
53
56
72
69
69
70
62
58
79
76
67
69
53
47
74
71
63
62
52
41
69
62
52
59
56
54
74
71
67
68
57
58
78
76
70
72
54
50
69
66
62
62Methods to assess student
outcomes are being developedfor:
individual courses 55 42 33 33 47 49 44major fields of study 41 48 44 35 43 45 40general education knowledge 43 52 40 43 45 48 42general academic competencies 53 52 48 38 51 56 44the entire curriculum 40 38 24 13 36 39 31
Source: Campus 7'rends. 1987. American Council on Education.Weighted survey data (82 percent response) received from 372 institutions (136 t%o-year colleges. 70 bdcuildureate colleges. 104comprehensive universities. and 62 doctoral universities).
26
16

TABLE 2Attitudes on Student Assessment(Percentage agreeing with each statement)
Two-yearColleges
BaccalaureateColleges
ComprehensiveUniversities
DoctorateUniversities
AllInstitutions
AllPublic
AllIndependent
Use of nationally standardizedtests for purposes of studentassessment risks distortingthe educational process. 39 60 59 59 50 45 55
Student assessment should beclosely tied to efforts toimprove instruction. 96 96 94 91 95 96 94
Student assessment shouldinclude substantial feedbackto students. 90 90 89 79 89 90 89
Student assessment should belinked to institutionalplanning and budgeting. 74 73 68 56 72 77 65
All colleges and universitiesshould develop andpublish evidence of theirinstitutional effectiveness. 51 36 33 31 43 52 33
As a condition of accreditation,colleges should be requiredto show evidence ofinstitutional effectiveness. 79 67 61 62 72 79 64
States should require colleges toshow evidence of institutionaleffectiveness. 56 36 34 23 45 55 34
Most campus officials have strongfears about misuse ofeffectiveness measures bye,.cernal agencies. 71 72 71 87 72 72 72
Accrediting agencies are exertingtoo much pressure forassessment of studentlearning. 10 25 23 21 17 16 19
Source: Campus Trends, 1987, American Council on Education.Weighted survey data (82 percent response) received from 372 institutions (136 two-year colleges, 70 baccalaureate colleges, 104comprehensive universities, and 62 doctoral universities).
47

TABLE 3Assessment Procedures Now Used by Colleges and Universities(Percentages)
TwoyearColleges
BaccalaureateColleges
ComprehensiveUniversities
DoctorateUniversities
AllInstitutions
AllPublic
AllIndependent
For All Students:Tests of basic college-level skills
(e.g., minimum competencyor "rising junior" tests) 23 20 20 9 21 24 17
Knowledge testing on generaleducation subjects 19 14 10 5 15 16 15
Comprehensive exams in a major 8 9 8 4 8 6 11Other demonstrated proficiency
in a major (projects; thesis;performance) 14 14 6 8 13 5 22
Attainment of higher-order skillsin:
critical thinking 7 9 8 12 8 7 9quantitative problem-solving 11 11 11 16 11 11 12oral communication 20 22 14 12 19 16 23writing 30 41 35 27 34 29 40
"Value-added" measures ofstudent gains while in college 3 7 7 2 4 4 5
Standardized test scores ofgraduates in professionalprograms 6 6 11 14 / 10 5
Percent of students going on forfurther education 29 32 20 19 28 24 33
Job placement rates of graduates(by field) 44 32 27 16 36 31 43
Quality of graduates' performanceon the job 26 11 3 2 17 14 20
Ratings of the institution bygraduates 43 25 12 15 31 32 30
Long-term outcomes of graduates(e.g., 5, 10, or 15 years later) 17 18 9 9 16 13 19
Changes in student values andattitudes 13 13 16 5 13 13 13
Pre -and post-tests for:remedial courses 35 18 14 13 26 32 18general education outcomes 10 10 7 2 9 10 8knowledge in a major 7 6 4 0 6 5 6
Source: Campus Trends, 1987, American Council on Education.Weighted survey data (82 percent response) received from 372 institutions (136 two-year colleges, 70 baccalaureate colleges, 104comprehensive universities, and 62 doctoral universities).
28
18

TABLE 3 (continued)Assessment Procedures Now Used by Colleges and Universities(Percentages)
Two-yearColleges
BaccalaureateColleges
ComprehensiveUniversities
DoctorateUniversities
AllInstitutionl
AllPublic
AllIndependent
For Some Students:Tests of basic college-level skills
(e.g., minimum competencyor "rising junior" tests) 30 28 31 18 29 33 24
Knowledge testing on generaleducation subjects 17 29 27 15 22 25 18
Comprehensive exams in a major 18 35 49 58 30 28 32Other demonstrated proficiency
in a major (projects; thesis;performance) 28 70 82 75 52 46 58
Attainment of higher-order skillsin:
critical thinking 32 36 37 37 34 36 32quantitative problem-solving 35 42 42 36 38 39 37oral communication 30 38 37 38 34 30 38writing 30 26 35 39 30 33 26
"Value-added" measures ofstudent gains while in college 13 17 15 12 14 12 16
Standardized test scores ofgraduates in professionalprograms 29 50 62 58 43 43 44
Percent of students going on forfurther education 39 43 53 46 43 48 37
Job placement rates of graduates(by field) 37 45 48 62 42 47 ,7
Quality of graduates' performanceon the job 36 30 36 35 34 47 19
Ratings of the institution bygraduates 25 30 50 49 32 34 29
Long-term outcomes of graduates(e.g., 5,10, or 15 years later) 23 35 38 39 30 29 30
Changes in student values andattitudes 18 24 31 30 23 21 24
Pre- and post-test for:remedial courses 45 25 42 30 38 42 32general education outcomes 17 16 19 11 17 19 14knowledge in a major 22 24 33 18 24 25 23
Source: Campus Trends, 1987, American Council on Education.Weighted survey data (82 percent response) received from 372 institutions (136 two-year colleges, 70 baccalaureate colleges, 104comprehensive universities, and 62 doctoral universities).
129
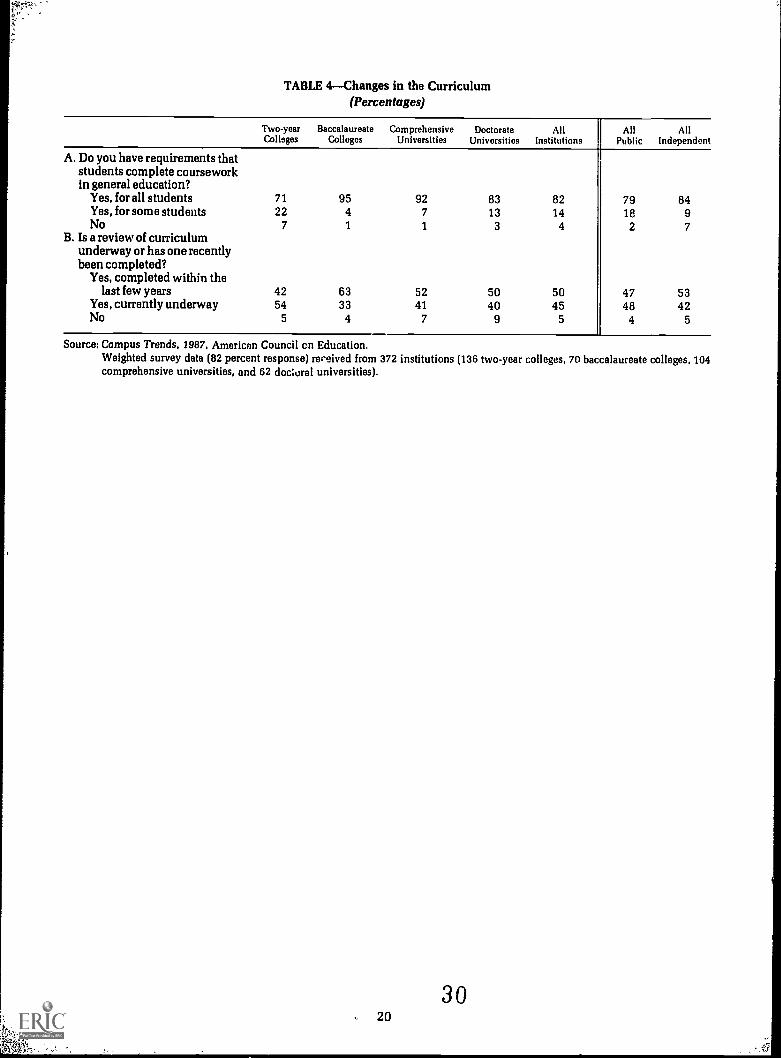
TABLE 4Changes in the Curriculum(Percentages)
Two-yearColleges
BaccalaureateColleges
ComprehensiveUniversities
DoctorateUniversities
AllInstitutions
AllPublic
AllIndependent
A. Do you have requirements thatstudents complete courseworkin general education?
Yes, for all students 71 95 92 83 82 79 84Yes, for some students 22 4 7 13 14 18 9No 7 1 1 3 4 2 7
B. Is a review of curriculumunderway or has one recentlybeen completed?
Yes, completed within thelast few years 42 63 52 50 50 47 53
Yes, currently underway 54 33 41 40 45 48 42No 5 4 7 9 5 4 5
Source: Campus Trends, 1987, American Council on Education.Weighted survey data (82 percent response) received from 372 institutions (136 two-year colleges, 70 baccalaureate colleges, 104comprehensive universities, and 62 doctoral universities).
3020

TABLE 5Changes Made in the Curriculum: All Colleges with a Current or Recent Curriculum Review(Percentages)
(n = 353)
Two-yearColleges
BaccalaureateColleges
ComprehensiveUniversities
DoctorateUniversities
AllInstitutions
AllPublic
AllIndependent
New general educationrequirements 50 60 59 58 55 55 55
Greater emphasis on writing 51 61 64 61 56 53 60Greater emphasis on other com-
petencies (communication,reasoning, etc.) 49 49 47 37 48 48 48
Increased course requirements 38 41 45 29 39 37 42Greater flexibility for adult
learners 28 23 14 14 24 27 20Increased attention to
international matters 11 37 39 44 25 18 33New attention to issues in science
and technology 27 30 38 30 30 31 28Greater attention to career
preparation 43 34 12 11 34 31 37Greater emphasis on mathematical
or computer-related skills 67 65 53 54 63 61 66More multidisciplinary or
"theme" courses 13 26 36 31 22 20 24New attention to values or ethics 10 36 25 24 20 10 33New approaches to teacher
education 12 47 48 36 29 20 39New ways to enrich the major 22 31 14 15 23 16 30New attention to:
the freshman year 29 47 52 30 37 31 46the senior year 0 15 10 7 8 4 14scholarship on women 6 8 11 18 8 6 11American history 1 5 6 5 3 1 6
World civilization 5 14 21 7 10 6 15Greater emphasis on foreign
language proficiency 14 21 25 34 19 18 19Methods of assessing "value-
added" 6 14 9 7 8 8 9New ways to involve students in:
research 4 28 25 29 15 8 24community service 15 21 12 19 16 9 25internships 22 48 39 40 33 22 47
Methods of specifying desiredoutcomes for:
courses in the major 13 19 15 7 14 14 15writing and other competenciessubject matter in general
education
29
18
32
21
33
23
22
20
30
19
31
16
29
23
Source: Campus Trends, 1987, American Council on Education.Weighted survey data (82 percent response) received from 372 institutions (136 two-year colleges, 70 baccalaureate colleges, 104comprehensive universities, and 62 doctoral universities).
" 31

TABLE 6Changes Made in the Curriculum: Colleges that Recently Completed a Curriculum Review(Percentages)
(n = 186)
New general educationrequirements
Greater emphasis on writingGreater emphasis on other com-
petencies (communication,reasoning, etc.)
Increased course requirementsGreater flexibility for adult
learnersIncreased attention to
international mattersNew attention to issues in science
and technologyGreater attention to career
preparationGreater emphasis on mathematical
or computer-related skillsMore multidisciplinary or
"theme" coursesNew attention to values or ethicsNew approaches to teacher
educationNew ways to enrich the majorNew attention to:
the freshman yearthe senior yearscholarship on womenAmerican historyWorld civilization
Greater emphasis on foreignlanguage proficiency
Methods of assessing "value-added"
New ways to involve students in:researchcommunity serviceinternships
Methods of specifying desiredoutcomes for:
courses in the majorwriting and other competenciessubject matter in general
education
Two-yearColleges
BaccalaureateColleges
ComprehensiveUniversities
DoctorateUniversities
AllInstitutions
AllPublic
AllIndependent
77 73 79 83 76 79 7369 72 76 80 72 70 74
61 58 62 56 60 66 5349 59 59 42 54 48 60
34 29 10 26 28 34 21
17 40 47 51 32 26 39
36 33 45 45 37 42 32
54 45 13 20 42 39 45
84 76 63 71 77 75 78
18 28 43 47 28 25 3115 42 28 43 28 13 45
17 44 48 37 33 26 4031 30 17 17 27 23 32
37 55 53 39 46 40 540 15 11 10 12 6 199 12 14 20 12 8 152 7 6 7 5 0 105 19 24 7 13 5 22
13 27 37 42 24 23 24
6 13 11 9 9 8 11
8 30 33 42 22 13 3211 26 15 29 18 10 2728 45 44 49 38 28 49
19 17 17 10 18 22 1335 32 40 36 35 41 29
26 20 27 30 24 26 23
Source: Campus Trends, 1987, American Council on Education.Weighted survey data (82 percent response) received from 372 institutions (136 two-year colleges, 70 baccalaureate colleges, 104comprehensive universities, and 62 doctoral universities).
32
22

TABLE 7Changes in the Curriculum that are Currently Being Discussed(Percentages)
(n = 167)
New general educationrequirements
Greater emphasis on writingGreater emphasis on other corn-
petencies (communication,reasoning, etc.)
Increased course requirementsGreater flexibility for adult
learnersIncreased attention to
international mattersNew attention to issues in science
and technologyGreater attention to career
preparationGreater emphasis on mathematical
or computer-related skillsMore multidisciplinary or
"theme" coursesNew attention to values or ethicsNew approaches to teacher
educationNew ways to enrich the majorNew attention to:
the freshman yearthe senior yearscholarship on womenAmerican historyWorld civilization
Greater emphasis on foreignlanguage proficiency
Methods of assessing "value-added"
New ways to involve students in:researchcommunity serviceinternships
Methods of specifying desiredoutcomes for:
courses in the majorwriting and other competenciessubject matter in general
education
Two-yearColleges
BaccalaureateColleges
ComprehensiveUniversities
DoctorateUniversities
AllInstitutions
AllPublic
AllIndependent
42 55 60 75 49 51 47
40 37 53 66 43 47 37
44 57 55 75 50 54 4535 49 37 62 39 40 38
37 34 36 26 36 38 32
24 38 47 44 31 37 23
20 40 47 55 30 34 25
27 31 39 21 29 30 27
29 41 49 59 36 39 33
26 44 41 51 33 33 3423 49 51 51 34 29 41
9 24 44 47 19 22 1426 33 45 35 30 28 34
15 34 29 58 23 21 220 40 40 11 16 11 23
11 36 22 32 19 17 21
10 30 18 11 15 10 2212 33 28 19 19 12 28
18 41 54 36 29 28 29
28 47 56 27 36 35 38
13 33 39 52 23 23 2415 39 31 33 23 22 2526 31 31 45 29 31 26
39 24 58 19 38 39 35
36 40 56 42 40 41 39
32 44 59 35 38 40 36
Source: Campus Trends, 1987, American Council on Education.Weilhted survey data (82 percent response) received from 372 institutions (136 two-year colleges, 70 baccalaureate colleges, 104comprehensive universities, and 62 doctoral universities).
23 33
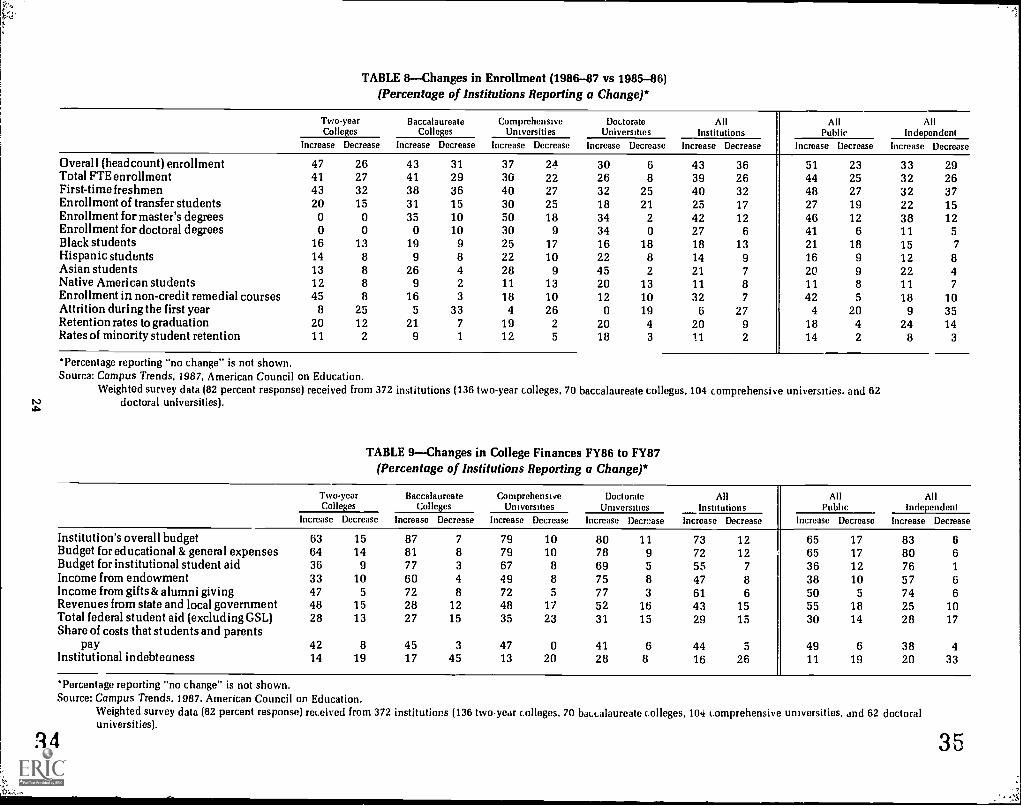
TABLE 8Changes in Enrollment (1986-87 vs 1985-86)(Percentage of Institutions Reporting a Change)*
Two-yearColleges
BaccalaureateColleges
ComprehensiveUniversities
DoctorateUniversities
AllInstitutions
AllPublic
AllIndependent
Increase Decrease Increase Decrease Increase Decrease Increase Decrease increase Decrease Increase Decrease Increase Decrease
Overall (headcount) enrollment 47 26 43 31 37 24 30 6 43 36 51 23 33 29Total FTE enrollment 41 27 41 29 30 22 26 8 39 26 44 25 32 26First-time freshmen 43 32 38 36 40 27 32 25 40 32 48 27 32 37Enrollment of transfer students 20 15 31 15 30 25 18 21 25 17 27 19 22 15Enrollment for master's degrees 0 0 35 10 50 18 34 2 42 12 46 12 38 12Enrollment for doctoral degrees 0 0 0 10 30 9 34 0 27 6 41 6 11 5Black students 16 13 19 9 25 17 16 18 18 13 21 18 15 7Hispanic students 14 8 9 8 22 10 22 8 14 9 16 9 12 8Asian students 13 8 26 4 28 9 45 2 21 7 20 9 22 4Native American students 12 8 9 2 11 13 20 13 11 8 11 8 11 7Enrollment in non-credit remedial courses 45 8 16 3 18 10 12 10 32 7 42 5 18 10Attrition during the first year 8 25 5 33 4 26 0 19 6 27 4 20 9 35Retention rates to graduation 20 12 21 7 19 2 20 4 20 9 18 4 24 14Rates of minority student retention 11 2 9 1 12 5 18 3 11 2 14 2 8 3
*Percentage reporting "no change" is not shown.Sourca: Campus Trends, 1987, American Council on Education.
Weighted survey data (82 percent response) received from 372 institutions (136 two-year colleges, 70 baccalaureate colleges, 104 comprehensive universities, and 62doctoral universities).
TABLE 9Changes in College Finances FY86 to FY87(Percentage of Institutions Reporting a Change)*
TwoyearColleges
BaccalaureateColleges
ComprehensiveUniversities
DoctorateUniversities
ABInstitutions
AllPublic
AllIndependent
Increase Decrease Increase Decrease Increase Decrease Increase Decmase Increase Decrease Increase Decrease Increase Decrease
Institution's overall budget 63 15 87 7 79 10 80 11 73 12 65 17 83 6Budget for educational & general expenses 64 14 81 8 79 10 78 9 72 12 65 17 80 6Budget for institutional student aid 36 9 77 3 67 8 69 5 55 7 36 12 76 1Income from endowment 33 10 60 4 49 8 75 8 47 8 38 10 57 6Income from gifts & alumni giving 47 5 72 8 72 5 77 3 61 6 50 5 74 6Revenues from state and local government 48 15 28 12 48 17 52 16 43 15 55 18 25 10Total federal student aid (excluding GSL) 28 13 27 15 35 23 31 15 29 15 30 14 28 17Share of costs that students and parents
pay 42 8 45 3 47 0 41 6 44 5 49 6 38 4Institutional indebteuness 14 19 17 45 13 20 28 8 16 26 11 19 20 33
*Percentage reporting "no change" is not shown.Source: Campus Trends, 1987, American Council on Education.
Weighted survey data (82 percent response) received from 372 institutions (136 two-year colleges, 70 baccalaureate colleges, 104 comprehensive universities, dnd 62 doctoraluniversities).
34 35

TABLE 10Changes in the Share of Budget Required by Various Expenses(Percentage of Institutions Reporting a Change)*
TwoyearColleges
BaccalaureateColleges
ComprehensiveUniversities
DoctorateUniversities
AllInstitutions
AllPublic
All:1opendent
Larger Smaller Larger Smaller Larger Smaller Larger Smatter Larger Smaller Larger Smaller Large' SmallerFaculty salaries 69 2 68 6 67 10 71 2 68 4 69 5 67 4Books and periodicals 21 15 32 15 36 19 38 11 27 15 24 16 31 14Computing equipment and operations 86 3 81 0 77 6 811 3 83 3 83 3 82 3Instructional & research equipment 30 13 17 13 35 14 43 11 28 13 33 13 22 14Construction of new facilities 28 23 32 15 36 13 40 17 31 19 24 21 40 16Renovation & repair of existing facilities 38 13 49 9 40 10 36 13 41 11 37 14 46 8Physicel plant operations 33 9 29 20 31 21 17 33 31 15 29 17 33 13Institutionally-funded student aid 33 12 66 5 47 9 45 10 46 9 26 13 68 6Academic programs, undergraduate 34 3 42 8 37 7 20 9 36 6 32 6 41 5Academic programs, graduate 0 0 36 0 29 8 24 4 31 4 26 5 35 3Student support services 35 5 35 5 31 9 16 16 33 7 26 7 42 6Admissions & recruitment 53 3 72 0 57 5 44 2 59 2 44 4 75 0Development 33 9 52 7 51 8 54 2 43 8 33 9 54 6
*percentage reporting "no change" is not shown.Source: Campus Trends, 1987, American Council on Education.
Weighted survey data (82 percent response) received from 372 institutions (136 two-year colleges, 70 baccalaureate colleges, 104 comprehensive universities, and 62 doctoraluniversities).
3637

TABLE 11College Actions on College Tuition(Percentages)
Two-yearColleges
BaccalaureateColleges
ComprehensiveUniversities
DoctorateUniversities
AllInstitutions
AllPublic
AllIndependent
The institution offers:Merit (no-need) scholarships. 72 89 86 76 79 77 81Long-term, below-market loans
for parents or students. 10 25 29 31 19 14 25Students and parents are allowed
to:Prepay several years' tuition at
a fixed price. 10 6 11 21 10 3 17Pay tuition in installments over
a year's time. 40 74 48 61 52 29 80Expected tuition increase for fall
1987:10 percent or higher 10 11 15 18 12 13 108-9 percent 10 27 15 12 15 7 256-7 percent 16 35 27 43 25 12 404-5 percent 22 19 20 15 20 22 193 percent or less 42 8 23 12 28 46 6
Expected tuition increase forfall 1988:
10 percent or higher 5 6 6 5 5 6 58-9 percent 12 10 14 11 12 6 196-7 percent 15 49 34 41 29 16 444-5 percent 22 19 20 27 21 21 213 percent or less 47 15 26 16 33 52 11
Important factors in tuitiondecisions:
Reduced state/local funding 37 39 39 42 38 51 23Costs for computer facilities &
services 37 38 45 48 39 30 50Stat mandates about tuition
levels and/or share of coststo be paid by students 60* 67* 73* 69* 64* 64 0
Need to pay for construction/renovation 29 31 33 33 31 15 48
"Catch-up" increases in facultysalaries 49 71 46 59 55 33 81
Expanded student aid program 28 61 45 42 41 14 71Need to support new or
expanding academicprograms 40 51 39 36 43 30 58
Fixed costs allocated acrossfewer students 43 41 25 9 37 30 46
*Public institutions only.Source: Campus Trends, 1987, American Council on Education.
Weighted survey data (82 perc... It response) received from 372 institutions (136 two year college,, 70 baccalaureate colleges, 104comprehensive universities, and 62 doctoral universities).
38
26
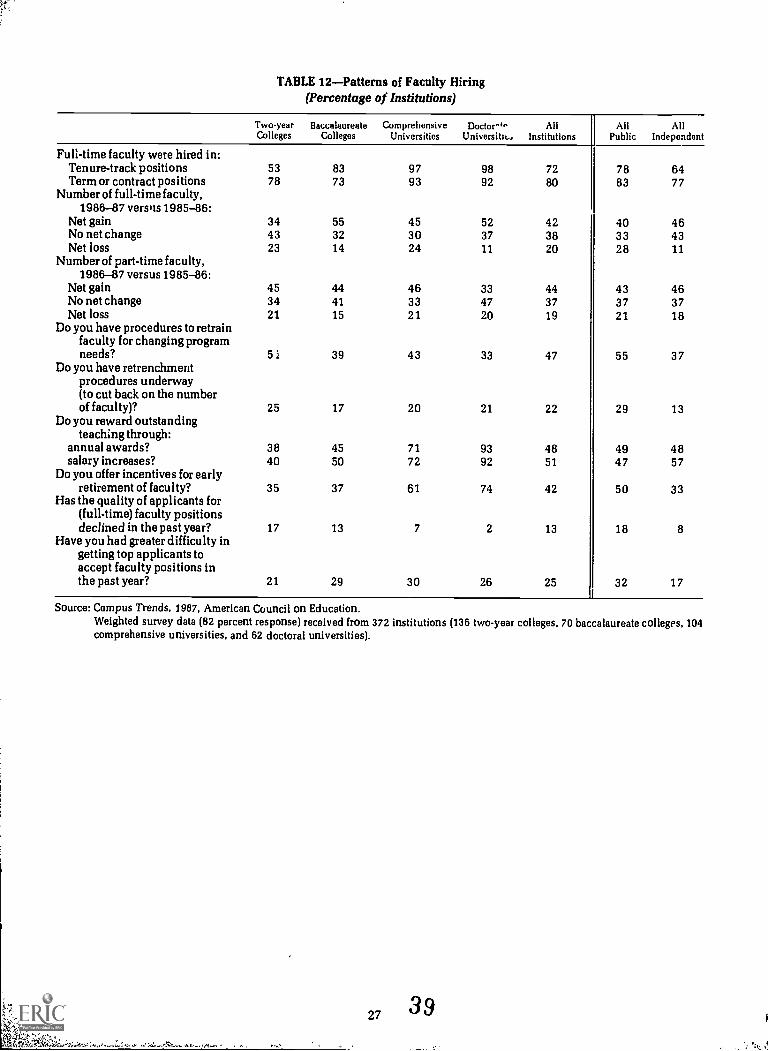
TABLE 12Patterns of Faculty Hiring(Percentage of Institutions)
Two-yearColleges
BaccalaureateColleges
ComprehensiveUniversities
Doctor-4"Universitit,
AllInstitutions
MIPublic
MIIndependent
Full-time faculty were hired in:Tenure-track positions 53 83 97 98 72 78 64Term or contract positions 78 73 93 92 80 83 77
Number of full-time faculty,1986-87 versus 1985-86:
Net gain 34 55 45 52 42 40 46No net change 43 32 30 37 38 33 43Net loss 23 14 24 11 20 28 11
Number of part-time faculty,1986-87 versus 1985-86:
Net gain 45 44 46 33 44 43 46No net change 34 41 33 47 37 37 37Net loss 21 15 21 20 19 21 18
Do you have procedures to retrainfaculty for changing programneeds? 51 39 43 33 47 55 37
Do you have retrenchmentprocedures underway(to cut back on the numberof faculty)? 25 17 20 21 22 29 13
Do you reward outstandingteaching through:
annual awards? 38 45 71 93 48 49 48salary increases? 40 50 72 92 51 47 57
Do you offer incentives for earlyretirement of faculty? 35 37 61 74 42 50 33
Has the quality of applicants for(full-time) faculty positionsdeclined in the past year? 17 13 7 2 13 18 8
Have you had greater difficulty ingetting top applicants toaccept faculty positions inthe past year? 21 29 30 26 25 32 17
Source: Campus Trends, 1987, American Council on Education.Weighted survey data (82 percent response) received from 372 institutions (136 two-year colleges, 70 baccalaureate colleges, 104comprehensive universities, and 62 doctoral universities).

TABLE 13Administrator Views on Institutional Status(Percentage rating own institution as excellent/very good)
Two-yearColleges
BaccalaureateColleges
ComprehensiveUniversities
DoctorateUniversities
AllInstitutions
AllPublic
AllIndependent
General level of preparation ofentering students 8 29 41 54 22 16 29
Job prospects for degree recipients 49 57 66 65 55 48 64Ability to attract and hold good
faculty 62 56 59 56 60 53 67Adequacy of faculty compensation 34 22 37 38 32 39 23Overall financial condition of the
institution 36 43 49 38 40 36 44Ability to attract good students 13 35 40 58 26 19 34Ability to attract minority students 20 18 18 22 19 20 19
Source: Campus Trends, 1987, American Council on Education.Weighted survey data (82 percent response) received from 372 institutions (136 two-year colleges, 70 baccalaureate colleges, 104comprehensive universities, and 62 doctoral universities).
TABLE 14Institutional Policies and Practices(Percentage of Institutions)
Two-yearColleges
BaccalaureateColleges
ComprehensiveUniversities
DoctorateUniversities
AllInstitutions
AllPublic
AllIndependent
This institution has:A formal policy on drug use/
abuse 65 79 84 78 73 66 80A formal policy on alcohol use/
abuse 70 88 91 84 79 72 88A formal policy on AIDS 8 18 40 55 19 19 19Guidelines for treatment of
hazardous waste 55 36 82 93 56 69 41Special program(s) to increase
student retention 91 84 81 84 87 89 85Special program(s) to increase
minority student retention 61 42 77 95 60 68 52Analyses of projected
enrollment over the next fewyears 70 85 86 93 78 75 83
A commission or committee onthe:
status of women 20 25 40 68 28 34 21status of minorities 22 19 49 74 28 35 21
Source: Campus Trends, 1987, American Council on Education.Weighted survey data (82 percent response) received from 372 institutions (136 two-year colleges, 70 baccalaureate colleges, 104comprehensive universities, and 62 doctoral universities).
40
28

co
TABLE 15Competition between Public and Independent Institutions(Percentage of Institutions Reporting a Change)*
TwoyearColleges
BaccalaureateColleges
ComprehensiveUniversities
DoctorateUniversities
AllInstitutions
AllPublic
AllIndependent
Increase Decrease Increase Decrease Increase Decrease Increase Decrease Increase Decrease Increase Decrease Increase Decrease
High ability studentsSupport from state tax fundsSupport from corporations and
foundations
5251
54
1
11
2
6641
59
1
1
0
4126
46
24
3
4330
49
02
0
54
4
1
6
1
5041
50
1
10
1
5845
59
1
1
2
*Percentage reporting "no change" is not shownSource: Campus Trends, 1987, American Council on Education.
Weighted survey data (82 percent response) received from 372 institutions (136 two-year colleges, 70 baccalaureate colleges, 104 comprehensive universities, and 62 doctoraluniversities).

APPENDIX A: SURVEY QUESTIONNAIRE
AMERICAN COUNCIL ON EDUCATIONHigher Education Panel
February 23, 1987
Dear Higher Education Panel Representative:
Attached is Higher Education Panel Survey No. 75 sponsored by theAmerican Council on Education and supported in part by a grant fromthe Lilly Endowment. This is the fourth in a series of annual surveysdesigned to obtain general information on campus trends.
This questionnaire asks questions about curricular changes andinstitutional practices, and seeks opinions on several academicissues. It should be completed by the academic vice president, if atall possible.
Please understand that your institution's responses will be heldin strict confidence. As with all of our surveys, the data youprovide will be reported in summary fashion only and will not beidentified with your institution.
Please return the completed quesionnaire by March 27, 1987. Apreaddressed envelope is enclosed for your convenience. If you haveany questions or problems, please do not hesitate to telephone uscollect at (202) 939-9445.
Sincerely yours,
Eick;kvi_. 5141ztvo?Elaine El -KhawasVice President forPolicy Analysis and Research
One Dupont Circle, Washington, D.C. 20036-1193 (202) 939-944530
43

AMERICANNO' ON
MON
Higher Education Panel Survey Number 75
CAMPUS TRENDS, 1987
This questionnaire asks a series of general questions and seeks your opinions r.rbouf policies and practices at your institution.
All questions refer to 1986-87.
Please circle an answer for each question, If not applicable, please write in N/A.
I. ENROLLMENT AND FINANCES
A. I. rw did your institution's enrollment change for 1986-87compared to 1985-86:
No
Increase Change Decrease
(Norm) (2% au))
Overall (headcount) enrollment 3 2 1
Total FTE enrollment 3 2 1
First-time freshmen 3 2 1
Enrollment of transfer students 3 2 1
Enrollment for master's degrees 3 2 1
Enrollment for doctoral degrees 3 2 1
Black students 3 2 1
Hispanic students 3 2 1
Asian students 3 2 1
Native American students 3 2 1
Enrollment in non-credit remedialcourses 3 2
Attrition during the first year 3 2
Retention rates to graduation 3 2
Rates of minority student retention 3 2
B. How did your institution's finances changefor 1986-87 compared to 1985-86:
Institution's overall budget 3 2 1
Budget for educational & generalexpenses 3 2 1
Budget for institutional student aid 3 2 1
Income from endowment 3 2 1
Income from gifts & alumni giving 3 2 1
Revenues from state and localgovernment 3 2 1
Total federal student aid (excludingGSL) 3 2 1
Share of costs that students andparents pay 3 2 1
Institutional indebtedness 3 2 1
C. Which of the following have taken a larger or a smaller share ofthe annual budget over the last few years?
Larger No Smeller
Share chi Share
Faculty salaries 3 2 1
Books and periodicals 3 2 1
Computing equipment and operations 3 2 1
Instructional & research equipment 3 2 1
Construction of new facilities 3 2 1
Renovation & repair of existing facilities 3 2 1
Physical plant operations 3 2 1
Institutionally-funded student aid 3 2 1
Academic programs, undergraduate 3 2 1
Academic programs, graduate 3 2 1
Student support services 3 2 1
Admissions & recruitment 3 2 1
Development 3 2 1
D. Does your institution offer: Yee No
Merit (no-need) scholarships 2 1
Long-term, below-market loans for parents or students 2 1
E. Do you allow students and parents to:
Prepay several years' tuition at a fixed price. 2 1
Pay tuition in installments over a year's time. 2 1
F. What is your best guess about your college's level of tuitionincrease for fall 1987 and 1988? (Circle one in each column.)
1981 1988
10 per nigher 5 5
8-9 percent 4 4
6-7 percent 3 3
4-5 percent 2 2
3 percent or less 1 1
G. Which of the following are important factors in recent decisionsabout your institution's tuition levels? Yu No
Reduced state/local funding 2 1
Costs for computer facilities & services 2 1
State mandates about tuition levels and/or share of coststo be paid by students 2 1
Need to pay for construction/renovation 2 1
"Catch-up" increases in faculty salaries 2 1
Expanded student aid program 2 1
Need to st'pport new or expanding academic programs 2 1
Fixed costs allocated across fewer students 2 1
H. FACULTY
A. Were any full-time faculty hired for academic year 1986-87 in:The No
Tenure-track positions 2 1
Term or contract positions 2 1
B. Compared to a year earlier, did your institution have any netchange in the number of: NONot
Net Gin Net Lou
Yes No
Full-time faculty 3 2 1
Part-time faculty 3 2 1
C. Do you have procedures to retrain faculty for changingprogram needs? 2 1
D. Do you have retrenchment procedures underway(to cut back on the number of faculty)? 2 1
E. Do you reward outstanding teaching through:annual awards? 2 1
salary increases? 2 1
F. Do you offer incentives for early retirement of faculty? 2 1
G. Has the quality of applicants for (full-time) facultypositions declined in the past year? 2 1
H. Have you had greater difficulty in getting top applicantsto accept faculty positions in the past year? 2 1
31 44

HI. INSTITUTIONAL STATUS
A. Please rate your institution on each of the following:Yer
Ensiled Goody
Good Fir Poor
B. Which of the following are now used at your institution to assess
students:
General level of preparation ofentering students 5 4 3
Job prospects for degree recipients 5 4 3
2 1
2 1
Foul Fake) Not
SUM% Students Used
Ability to attract and hold good faculty 5 4 3 2 1 Tests of basic college-level skills (e.g.,Adequacy of faculty compensation 5 4 3 2 1 minimum competency or "rising junior"Overall financial condition of the tests) 3 2 1
institution 5 4 3 2 1 Knowledge testing on general educationAbility to attract good students 5 4 3 2 1 subjects 3 2 1
Ability to attract minority students 5 4 3 2 1 Comprehensive exams in a major 3 2 1
Other demonstrated profic.ancy in a majorB. During the past year, has there been a change in the extent of
competition between public and independent institutions in your(projects; thesis; performance)
Attainment of higher-order skills in:
3 2 1
state for: No critical thinking 3 2 1Increesed Domed quantitative problem-solving 3 2 1
High ability students 3 2 1 oral communication 3 2 1
Support from state tax funds 3 2 1 writing 3 2 1
Support from corporations and "Value-added" measures of student gainsfoundations 3 2 1 while in college 3 2 1
Standardized test scores of graduates inC. Does your institution have: Yes No professional programs 3 2 1
A formal policy on drug use/abuse 2 1 Percent of students going on for furtherA formal policy on alcohol use/abuse 2 1 education 3 2 1
A formal policy on AIDS 2 1 Job placement rates of graduates (by field) 3 2 1
Guidelines for treatment of hazardous waste 2 1 Quality of graduates' performance on the job 3 2 1
Special program(s) to increase student reten ion 2 1 Ratings of the institution by graduates 3 2 1
Special program(s) to increase minority student retention 2 1 Long-term outcomes of graduates (e.g., 5,
Analyses of projected enrollment over the next few years 2 110, or 15 years later) 3 2 1
A commission or committee on the: Changes in student values and attitudes 3 2 1
status of women 2 1 Pre- and post-tests for:status of minorities 2 1 remedial courses
general education outcomesknowledge in a major
3 2 1
3 2 1
3 2 1
IV. STUDENT ASSESSMENT
A. New methods of assessing student learning (other than tradi-tional end-of-course grading) are being discussed currently.Which of the following is true of your institution's status onassessment of student learning:
Most faculty would support the development ofassessment procedures. 2 1
Some form of assessment is likely to be introducedin the next few years. 2 1
Our state is requiring assessment procedures. 2 1
There is no clear sense of what to assess. 2 1
There are no gc- i instruments suited to our programs 2 i
Discussions are taking place on:whether to develop assessment procedures. 2 1
whether assessment should focus on programsor on students 2 1
what outcomes should b a assessed. 2 1
what assessment methods might be used. 2 1
how to tie assessm ant to program evaluation. 2 1
how to tie assessment to instruction. 2 1
Methods to assess student outcomes are beingdeveloped for:
individual courses 2 1
major fields of study 2 1
general education knowledge 2 1
general academic competencies 2 1
the entire curriculum 2 1
Yes No
32
C. Please indicate your own views on each of the following:
Use of nationally standardized tests forpurposes of student assessment risksdistorting the educational process.
Student assessment should be closelytied to efforts to improve instruction
Student assessment should includesubstantial feedback to students.
Student assessment should be linked toinstitutional planning and budgeting.
All colleges and universities should developand publish evidence of their institutionaleffectiveness.
As a condition of accreditation, collegesshould be required to show evidence ofinstitutional effectiveness.
States should require colleges to showevidence of institutional effectiveness.
Most campus officials have strong fearsabout misuse of effectivenessmeasures by external agencies.
Accrediting agencies are exerting toomuch pressure for assessment ofstudent learning.
45
Agree Dissgree Uncertain
3 2 1
3 2 1
3 2 1
3 2 1
3 2 1
3 2 1
3 2 1
*. 2 1
3 2 1

V. CURRICULUM
A. Do you have requirements that students complete coursework ingeneral education?
3 Yes, for all students2 Yes, for some students1 No
B. Is a review of curriculum underway or has one recently been completed?
3 Yes, completed within the last few years2 Yes, currently underway
1 No
VI. EVALUATION
A. With support from the Lilly Endowment, the Campus Trends proj
ect has completed three years of operation (1984, 1985, 1986).To what extent are you familiar with the Campus Trends reports?
Yet No_2 1
2 1
I have read all the reports.
I have read at least one of the reports.
I have read summaries of or seen references to thereports (e.g., Chronicle).
I have seen none of the reports or summaries.
2 1
2 1
B. Please indicate your own views on each of the following state-ments.
If yes, what changes in curriculum have been made?What changes are being discussed?
(Please circle all that apply in each column.)
New general education requirements
Greater emphasis on writing
Greater emphasis on other competencies(communication, reasoning, etc.) 1
Increased course requirements 1
Greater flexibility for adult learners 1
Increased attention to international matters 1
New attention to issues in science andtechnology 1
Greater attention to career preparation 1
Greater emphasis on mathematical orcomputerrelated skills 1
More multidisciplinary or theme" courses 1
New attention to values or ethics 1
New approaches to teacher education 1
New ways to enrich the major 1
New attention to:the freshman year 1
the senior year 1
scholarship on women 1
American history 1
World civilization 1
Greater emphasis on foreign languageproficiency 1
Methods of assessing "value-added" 1
New ways to involve students in:research 1
community service 1
internships 1
Methods of specifying desired outcomes for:courses in the major 1
writing and other competencies 1
subject matter in general education 1
Being
Discussed
AD_LeeUmettlin
The Campus Trends reports:
offer a basic reference point for trendsin higher education. 3 2 1
are an effective way to monitor changingpolicies and practices on thenation's campuses. 3 2 1
are an effective way to determine therelative magnitude of a problem. 3 2 1
are an effective way to determine whattypes of institutions are mostaffected by certain changes. 3 2 1
have provided your campus with usefuldata for planning. 3 2 1
have been a source of new programideas for your campus. 3 2 1
have provided an early "alert" aboutproblems which might emergeon your campus. 3 2 1
have broadened the perspective offaculty members on your campus. 3 2 1
should be continued for theforeseeable future. 3 2 1
1
1
1
1
1
1
1
1
1
1
1
1
1
1
1
1
1
1
1
1
1
1
1
1
In the space below, please suggest ways in which the quality of infor-mation obtained from the Campus Trends project could be improved.
Thank you for your cooperation.
Please return this form by March 27, 1987, to:
Higher Education Panel
American Council on EducatirOne Dupont Circle, N.W.
Washington D.C. 20036
Please keep a copy of this survey for your records.
Name of Respondent
Title
Department
Telephone (
If you have any questions concerning this survey, piease call the HEP staff collect at (202) 939-9445.
33
46

APPENDIX B: TECHNICAL NOTESThis survey was conducted through the Higher Ed-
ucation Panel, which forms the basis of an ongoing sur-vey research program created in 1971 by the AmericanCouncil on Education. Its purpose is to conduct spe-cialized surveys on topics of current policy interest tothe higher education community.
The Panel is a disproportionate stratified sample of1,040 colleges and universities, divided into two half-samples of 520 institutions each. The sample wasdrawn from the more than 3,200 colleges and univer-sities listed in the Education Directory, Colleges andUniversities issued by the U.S. Department of Educa-tion. The Panel's stratification design is based primar-ily upon institution type, control, and size. For anygiven survey, either the entire Panel, a half-sample oran appropriate subgroup is used.
The survey operates through a network of campusrepresentatives who, through their presidents, haveagreed to participate. The representatives receive thePanel questionnaires and direct them to the most ap-propriate campus official for response.
The sample for this study consisted of 456 institu-tions in one of the half-samples, excluding specializedinstitutions (e.g., rabbinical seminaries and schools ofart) and those institutions that offer no undergraduateinstruction. The half-sample used for this survey hasalso been used in all previous Campus Trends surveys.
The questionnaire (see Appendix A) was mailed onFebruary 23,1987 with the request that it be completedby the academic vice-president. The questionnaire isdesigned to provide timely information on a broadrange of subjects, and does not cover any subject indepth. The survey questions, similarly, are designed tofacilitate quick turnaround, i.e., comprising itemswhere respondents can readily provide answers with-out stopping to look up information.
After mail and telephone followups, 372 responseswere received by mid-June (82 percent of those sur-veyed). Actual respondents included: provosts, deans,or academic vice presidents, 54 percent; associatedeans or provosts, 8 percent; presidents, 12 percent;and other, 25 percent.
Data from responding institutions were statisticallyadjusted to represent 2,618 colleges and universities.The stratification design is shown in Table B-1. Theweighting technique, used with all Panel surveys, ad-justs the data for institutional nonresponse within eachstratification cell. Institutional weights are applied tobring the Panel data up to estimates that are repre-sentative of the national population of colleges anduniversities.
TABLE B-1Stratification Design
Cell Type of Institution Enrollment Population Respondents
Total 2,618 3721 Large public doctorate-granting a 104 432 Large private doctorate-granting a 58 193 Large public comprehensive a 92 404 Large independent comprehensive a 26 87 Large public two-year a 43 178 Public comprehensive 5,500-8,999 56 169 Public comprehensive <5,500 108 19
10 Independent comprehensive <9,000 126 2111 Public baccalaureate <9,000 127 1912 Independent baccalaureate 1,350-8,999 166 2513 Independent baccalaureate <1,350 446 2617 Public 2-year academic/comprehensive 6,000-8,999 55 1718 Public 2-year academic/comprehensive 4,000-5,999 72 1719 Public 2-year academic/comprehensive 2,000-3,999 155 2020 Public 2-year academic/comprehensive <2,000 332 1821 Independent 2-year academic/comprehensive <9,000 129 1122 Public two-year occupational 2,500-8,999 63 1323 Public two-year occupational <2,500 221 1424 Independent two-year occupational <9,000 239 9
'Institutions that meet one or more of the three following criteria. (a) total full-time equivalent (FTE) 1981 enrollment greater than 8.999.(b) FTE 1981 graduate enrollment greater than 749: (c) FY 1979 educational and general expenditures of $35 million or more
34
47

3', a,
Table B-2 compares survey respondents and non-respondents on several variables. Response rates wereat least 65 percent for all types of institutions. Higher-than average response rates were recorded for publiccomprehensive universities and for public bacca-laureate institutions. Response rates for independentcolleges were lower than average; the lowest rate of re-sponse was for independent doctoral universities, at65.5 percent.
Data are reported for institutional categories de-veloped by the U.S. Department of Education. It shouldbe noted that comprehensive and doctoral institutionsare shown separately in this report; in previous reports,their combined results were shown under a singledesignation of "university."
TABLE B-2-Comparison of Respondents and Nonrespondents(In percentages)
Control and Type of InstitutionRespondents
(N = 372)Nonrespondents
(N = 84)Response
Rate
Total 100.0 100.0 81.6
ControlPublic 68.0 59.5 83.5Independent 32.0 40.5 77.8
Type and ControlPublic Doctoral University 11.6 10.7 82.7Independent Doctoral University 5.1 11.9 65.5Public Comprehensive University 20.2 13.1 87.2Independent Comprehensive University 7.8 8.3 80.6Public Baccalaureate 5.1 3.s 86.4Independent Baccalaureate 13.7 15.5 79.7Public Two-Year 31.2 32.1 81.1Independent Two-Year 5.4 4.7 83.3
Enrollment Size (FTE)Less than 1,000 15.6 29.8 69.91,000 to 4,999 40.9 33.3 84.45,000 to 9,999 23.1 16.7 86.010,000 + above 20.4 20.2 81.7
35 48

I'
ACE BOARD OF DIRECTORS 1986-1987
Executive CommitteeFrank H. T. Rhodes, President, Cornell
University, ChairJudith S. Eaton, President, Community College
of Philadelphia, Vice ChairPhilip H. Jordan, Jr., President, Kenyon College
Immediate Past Chair
Harold W. Eickhoff, President, Trenton StateCollege, Secretary
Robert H. Atwell, American Council on EducationPresident
Janet D. Greenwood, President, University of BridgeportEdward T. Foote II, President, University of MiamiAlfredo G. de los Santos Jr., Vice Chancellor
for Educational Development, MaricopaCommunity Colleges
Association RepresentativesR. Jan Le Croy, Chancellor, Dallas County
Community College District, AmericanAssociation of Community and junior Colleges
Stephen Horn, President, California State University,Long Beach, American Association of StateColleges and Universities
Arnold Thackray Director, Center for the History ofChemistry, University of Pennsylvania, AmericanCouncil of Learned Societies
James H. Daughdrill, Jr., President, Rhodes CollegeAssociation of American Colleges
John S. Toll, President, University of MarylandCentral Administration at Adelphi, Association ofAmerican Universities
Francis J. Kerins, President, Carroll College (Montana),Association of Catholic Colleges and Universities
The Rev. Michael G. Morrison, S.J., PresidentCreighton University, Association of JesuitColleges and Universities
Robert A. Reichley, Vice President, UniversityRelations, Brown University, Council forAdvancement and Support of Education
Robert V. Cramer, President, Carroll College (Wisconsin),Council of Independent Colleges
R. R. Reid, Treasurer, Whitman College, NationalAssociation of College and University BusinessOfficers
William P. Hytche, Chancellor, University of Maryland,Eastern Shore, National Association for EqualOpportunity in Higher Education
Joab M. Lesesne, Jr., President, Wofford College,National Association of Independent Colleges andUniversities
John A. DiBiaggio, President, Michigan State University,National Association of State Universities andLand-Grant Colleges
'36
Class of 1987Roscoe C. Brown, Jr., President, Bronx Community
College, City University of New YorkWilliam M. Fulkerson, Jr., President, Adams State
College
Janet D. Greenwood, President, University of BridgeportWilliam J. Maxwell, President, Jersey City
State College
Patsy H. Sampson, President, Stephens College
James J. Whalen, President, Ithaca College
Class of 1988Robert L. Albright, President, Johnson C. Smith
University
David W. Breneman, President, Kalamazoo CollegeEdward T. Foote II, President, University of MiamiWilliam P. Gerberding, President, University of
Washington
Bruce E. V 'hitaker, President, Chowan College
Brunetta R. Wolfman, President, RoxburyCommunity College
Class of 1989Sister Magdalen Coughlin, CS), President, Mount
St. Mary's College
Alfredo G. de los Santos Jr., Vice Chancellor forEducational Development, Maricopa CommunityColleges
James 0. Freedman, President, Dartmouth CollegeWilliam H. Harris, President, Paine CollegeStanley 0. Ikenberry, President, University of IllinoisBetty Lentz Siegel, President, Kennesaw College
49
7/6187

gustAMERICAN
Au
NC1L ONHighlights from 1987
AT1ON Campus Trends 1987
Campus Trends, 1987 is the fourth in a series of surveys intended to provide timely information on changingpolicies and practices of American colleges and universities. The surveys are conducted by the American Coun-cil on Education, with support from the Lilly Endowment.
This year's report documents growing campus attention to student assessment as well as a widespread proc-ess of curriculum change, especially to strengthen general education and to emphasize writing, mathematicsand other general competencies expected of college students. The report also describes changesin enrollment,in campus finances, and in faculty hiring practices. All results are reported by type and control of institution.
Highlights from the survey are as follows:
Assessment of Student LearningMost administrators (79 percent) expect that someform of assessment will be introduced in the nextfew years.Three out of four colleges have discussions takingplace on assessment.27 percent report that their state is requiring as-sessment procedures.Close to half of the colleges believe that "there isno clear sense of what to assess" and that "thereare no good instruments suited to our programs."Seventy-two percent agree that "most campus offi-cials have strong fears about misuse of effective-ness measures by external agencies."Fully 95 percent of administrators support assess-ment that is closely tied to efforts to improve in-struction.Seven in ten administrators believe that assess-ment should be linked to institutional planningand budgeting.Seven in ten administrators believe that, as a con-dition of accreditation, colleges should be re-quired to show evidence of institutional effective-ness.
Information Currently GatheredOne in three colleges currently assess the "higher-order" writing skills of all of their students.One in three colleges get ratings of the institutionfrom all of their graduates.Eight in ten gather information on job placementrates of all or some of their graduates.Seven in ten have information (for some or all stu-dents) on the percentage of students going on forfurther education.Six in ten receive ratings of the institution fromsome or all of their graduates.
Curriculum ChangeAlmost all colleges (95 percent) have recentlymade changes in the curriculum or are currentlydoing F. .
Forty-two percent of colleges had a curriculum re-view underway in 1987.Among the colleges and universities that havecompleted a curriculum review, three out of fourhave introduced new requirements in general ed-ucation.Seventy-eight percent of these colleges have givengreater attention to mathematical or computer-related skills.Seventy-four percent of the college that completeda curriculum review have placed greater emphasison writing. Fifty-three percent have introducedchanges focused on other competencies (com-munication, reading, etc.).About 4 in 10 institutions have given new atten-tion to enhancing the freshman-year experience ofstudents.
Enrollment ChangesThirty-nine percent of the nation's colleges anduniversities reported an increase in full-time equi-valent (FTE) enrollment.Decreases in overall enrollment and in FTE enroll-ment occurred for 26 percent of institutions.Enrollment of first-time freshmen showed a mixedpicture: 40 percent of institutions reported gainsin first-time freshmen, out another 32 percent re-ported tosses in first-time freshmen.Enrollment for master's-level study increased for42 percent of four-year institutions.Doctoral students increased at one-third of univer-sities.About 1 in 5 colleges reported increased enroll-ment of black students; 13 percent reported de-ceased black enrollment.Only 14 percent of colleges reported an increase inHispanic students. Decreased enrollment of His-panic students was reported by 9 percent of in-stitutions.Twenty-one percent of institutions reported a gainin Asian students, with 7 percent reporting a loss.
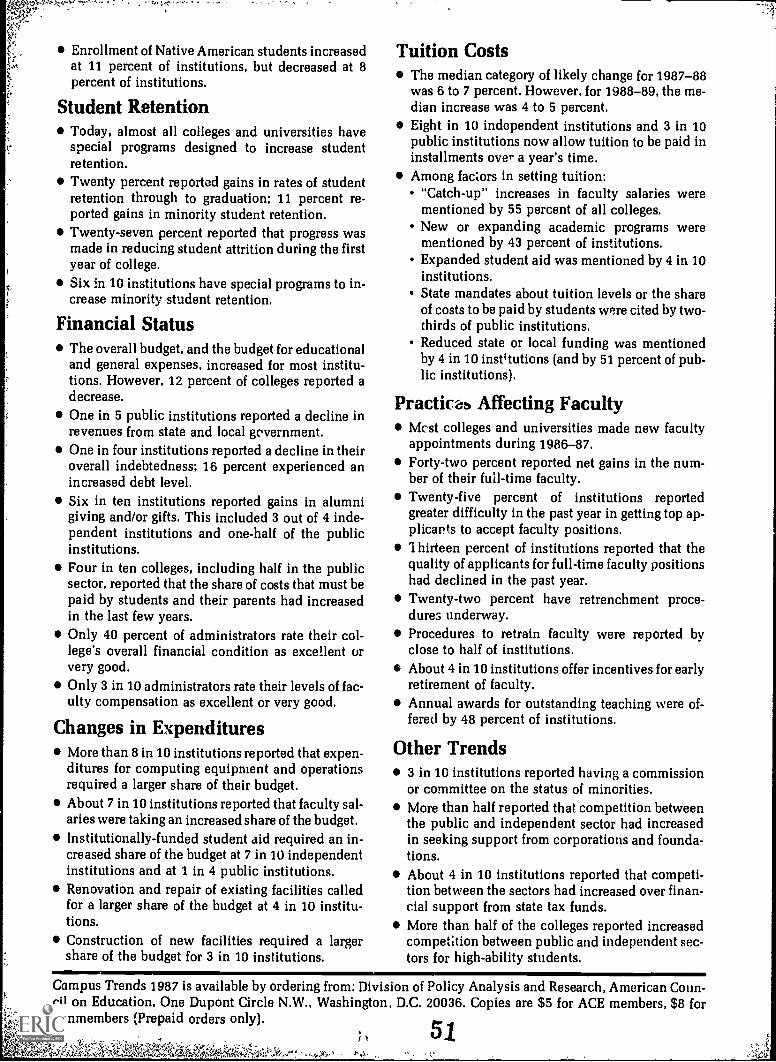
Enrollment of Native American students increasedat 11 percent of institutions, but decreased at 8percent of institutions.
Student RetentionToday, almost all colleges and universities havespecial programs designed to increase studentretention.Twenty percent reported gains in rates of studentretention through to graduation; 11 percent re-ported gains in minority student retention.Twenty-seven percent reported that progress wasmade in reducing student attrition during the firstyear of college.Six in 10 institutions have special programs to in-crease minority student retention.
Financial StatusThe overall budget, and the budget for educationaland general expenses, increased for most institu-tions. However, 12 percent of colleges reported adecrease.One in 5 public institutions reported a decline inrevenues from state and local government.One in four institutions reported a decline in theiroverall indebtedness; 16 percent experienced anincreased debt level.Six in ten institutions reported gains in alumnigiving and/or gifts. This included 3 out of 4 inde-pendent institutions and one-half of the publicinstitutions.Four in ten colleges, including half in the publicsector, reported that the share of costs that must bepaid by students and their parents had increasedin the last few years.Only 40 percent of administrators rate their col-lege's overall financial condition as excellent orvery good.Only 3 in 10 administrators rate their levels of fac-ulty compensation as excellent or very good.
Changes in ExpendituresMore than 8 in 10 institutions reported that expen-ditures for computing equipment and operationsrequired a larger share of their budget.About 7 in 10 institutions reported that faculty sal-aries were taking an increased share of the budget.Institutionally-funded student aid required an in-creased share of the budget at 7 in 10 independentinstitutions and at 1 in 4 public institutions.Renovation and repair of existing facilities calledfor a larger share of the budget at 4 in 10 institu-tions.Construction of new facilities required a largershare of the budget for 3 in 10 institutions.
Tuition CostsThe median category of likely change for 1987-88was 6 to 7 percent. However, for 1988-89, the me-dian increase was 4 to 5 percent.Eight in 10 independent institutions and 3 in 10public institutions now allow tuition to be paid ininstallments over a year's time.Among factors in setting tuition:
"Catch-up" increases in faculty salaries werementioned by 55 percent of all colleges.New or expanding academic programs werementioned by 43 percent of institutions.Expanded student aid was mentioned by 4 in 10institutions.State mandates about tuition levels or the shareof costs to be paid by students were cited by two-thirds of public institutions.Reduced state or local funding was mentionedby 4 in 10 institutions (and by 51 percent of pub-lic institutions).
Practices Affecting FacultyMcst colleges and universities made new facultyappointments during 1986-87.Forty-two percent reported net gains in the num-ber of their full-time faculty.Twenty-five percent of institutions reportedgreater difficulty in the past year in getting top ap-plicants to accept faculty positions.'I hirteen percent of institutions reported that thequality of applicants for full-time faculty positionshad declined in the past year.Twenty-two percent have retrenchment proce-dures underway.Procedures to retrain faculty were reported byclose to half of institutions.About 4 in 10 institutions offer incentives for earlyretirement of faculty.Annual awards for outstanding teaching were of-fered by 48 percent of institutions.
Other Trends3 in 10 institutions reported having a commissionor committee on the status of minorities.More than half reported that competition betweenthe public and independent sector had increasedin seeking support from corporations and founda-tions.About 4 in 10 institutions reported that competi-tion between the sectors had increased over finan-cial support from state tax funds.More than half of the colleges reported increasedcompetition between public and independent sec-tors for high-ability students.
Campus Trends 1987 is available by ordering from: Division of Policy Analysis and Research, American Coun-cil on Education, One Dupont Circle N.W., Washington, D.C. 20036. Copies are $5 for ACE members, $8 for
; 1nonmembers ;Prepaid orders only).
.14`,

Other Reports of the Higher Education PanelAmerican Council on Education
Gomberg, Irene L. and Atelsek, Frank J. The Institutional Share of Undergraduate Financial Assistance, 1976-77. Higher Educai. ,n PanelReport, No. 42, May, 1979
Atelsek, Frank J. and Gomberg, Irene L. Young Doctoral Faculty in Science and Engineering: Trends in Composition and ResearchActivity. Higher Education Panel Report, No. 43, February, 1979.
Atelsek, Frank J. and Gomberg, Irene L. Shared Use of Scientific Equipment at Colleges and Universities, Fall 1978. Higher EducationPanel Report, No 44, November, 1979.
Gomberg, Irene L. and Atelsek, Frank J. Newly Qualified Elementary and Secondary Scl,00l Teachers, 1977-78 and 1978-79. HigherEducation Panel Report, No. 45, February, 1980.
Atelsek, Frank J. and Gomberg, Irene L. Refund Policies and Practices of Colleges and Universities. i ligher Education Panel Report, No46, February, 1980.
Gomberg, Irene L. and Atelsek, Frank J. Expenditures for Scientific Research Equipment at Ph.D.-Granting Institutions, FY 1978.Higher Education Panel Report, No. 47, March, 1980.
Atelsek, Frank J. and Gomberg, Irene L Tenure Practices at Four-Year Colleges and Universities. Higher Education Panel Report. No48, July, 1980.
Gomberg, Irene L. and Atelsek, Frank J. Trends in Financial Indicators of Colleges and Universities. Higher Education Panel Report,No. 49, April. 1981.
Atelsek, Frank J. and Gomberg, Irene L. An Analysis of Travel by Academic Scientists and Engineers to International Scientific Meetingsin 1979-80. Higher Education Panel Report, No. 50, February. 1981.
Atelsek, Frank J. and Gomberg, Irene L. Selected Characteristics of Full-Time Humanities Faculty, Fall 1979. Higher Education PanelReport, No. 51, August, 1981
Atelsek, Frank J. and Gomberg, Irene L. Recruitment and Retention of Full-Time Engineering Faculty, Fall 1980. Higher EducationPanel Report, No. 52, October, 1981.
Andersen, Charles J. and Atelsek. Frank J. Sabbatical and Research Leaves in Colleges and Universities. Higher Education Panel Report.No. 53. February, 1982.
Atelsek, Frank J. and Andersen, Charles J. Undergraduate Student Credit Hours in Science, Engineering, and the Humanities, Fall1980. Higher Education Panel Report. No. 54, June, 1982.
Andersen, Charles J. and Atelsek, Frank J. An Assessment of College Student Housing and Physical Plant. Higher Education Panel Report,No. 55. October, 1982.
Gomberg, Irene L. and Atelsek, Frank J. Financial Support for the Humanities: A Special Methodological Report. Higher EducationPanel Report, No. 56, January, 1983.
Gomberg, Irene L. and Atelsek, Frank J. Neuroscience Personnel and Training. Higher Education Panel Report,. No 57, June, 1983.Atelsek, Frank J. Student Quality in the Sciences and Engineering: Opinions of Senior Academic Officials. Higher Education Panel Report.
No. 58, February, 1984.Andersen, Charles J. Student Quality in the Humanities: Opinions of Senior Academic Officials. Higher Education Panel Report, No
59, February, 1984.Andersen, Ciarles J Financial Aid For Full-Time Undergraduates. Higher Education Panel Report, No 60, April, 1984.Gomberg, Irene L. and Atelsek, Frank J. Full-time Humanities Faculty, Fall 1982. Higher Education Panel Report, No 61, August 1084Andersen, Charles J. Plant Biology Personnel and Training at Doctorate-granting Institutions. Higher Education Panel Report, No 62.
November, 1984.Andersen, Charles J Conditions Affecting College and University Financial Strength. Higher Education Panel Report No 63, October
1985.
Holmstrom, Engin Inel and Petrovich, Janice. Engineering Programs in Emerging Areas, 1983-84. Higher Education Panel Report No64, November 1985
El-Khawas, Elaine. Campus Trends, 1984. Higher Education Panel Report No. 65, February, 1985.Suniewick, Nancy and El-Khawas, Elaine. General Education Requirements in the Humanities. Higher Education Panel Report No 66,
October, 1985.Holmstrom. Engin Inel, Recent Changes in Teacher Education Programs. Higher Education Panel Report No 67, No.ember 1985Andersen. Charles J. Student Financial Aid to Full-time Undergraduates, Fall 1984. Hi jher Education Panel Report No 68, January 1986Holmstrom, Engin Inel. Access to Supercomputers. Higher Education Paid Report No. 69, January 1986Composition of Governing Boards, 1985. Higher Education Panel Report No. 70, January 1986EI-Khawas, Elaine. Campus Trends, 1985. Higher Education Panel Report No. 71, February 1986Hexter, Holly and Andersen, Charles J. Admission and Credit Policies for Adult Learners. Higher Education Panel Report No 72,
December 1986.El-Khawas, Elaine. Campus Trends, 1986. Higher Education Panel Report No. 73, August 1986.Andersen. Charles J. Survey of Accreditation IS: Rs, 1986. Higher Education Panel Report No. 74, April 1987
52