DOCUMENT RESUME ED 402 885 HE 029 828 … RESUME ED 402 885 HE 029 828 AUTHOR Jenny, Hans H. TITLE...
240
DOCUMENT RESUME ED 402 885 HE 029 828 AUTHOR Jenny, Hans H. TITLE Cost Accounting in Higher Education. Simplified Macro- and Micro-Costing Techniques. INSTITUTION National Association of Coll. and Univ. Business Officers, Washington, D.C. SPONS AGENCY Teachers Insurance and Annuity Association, New York, NY. College Retirement Equities Fund. REPORT NO ISBN-1-56972-006-1 PUB DATE 96 NOTE 263p.; Supported by a gift from Grant Thorton, CPAs, LLP, Denver, Colorado. AVAILABLE FROM National Association of College and University Business Officers, One Dupont Circle, Suite 500, Washington, DC 20036 ($49.95 members; $69.95 non-members). PUB TYPE Guides Non-Classroom Use (055) Books (010) EDRS PRICE MFO1 /PC11 Plus Postage. DESCRIPTORS *Accounting; Bookkeeping; Cost Effectiveness; *Costs; Educational Finance; Financial Audits; Financial Policy; *Higher Education; Money Management; *Nonprofit Organizations; Private Schools; *School Accounting; School Business Officials IDENTIFIERS *Cost Accounting; Financial Reports ABSTRACT This manual covers cost accounting applications and techniques as they apply to institutions of higher education, focusing mainly on the different methods of allocating costs. The manual covers four major costing topics: aggregate institution and systemwide costs; major academic and administrative program costs; academic and administrative activity-based costs; and indirect cost recovery. After an introductory chapter, individual chapters cover: (1) the four-tier full-cost matrix and institution-wide macro-costing; (2) cost centers and macro-cost charts of accounts used in higher education; (3) institution full costs of primary by-function programs under various allocation rules; (4) aggregate costing of major professional academic programs; (5) macro-costing of departments; (6) academic micro-costing and determining the full cost of a course; (7) costing of support activities (total-cost management, activity-based costing, and process-cost management); and (8) other costing topics and issues. There are approximately 100 figures throughout the text; some chapters have worksheet exercises; and most have notes. Appendixes A and B cover the range of precision in costing standards, and a hierarchy of primary and support activities. Appendix C summarizes provisions of Circular A-21, Office of Management and Budget, "Cost Principles for Educational Institutions." (CH) *********************************************************************** * * Reproductions supplied by EDRS are the best that can be made * from the original document. **********************************************************.*************
-
Upload
nguyenthuy -
Category
Documents
-
view
214 -
download
2
Transcript of DOCUMENT RESUME ED 402 885 HE 029 828 … RESUME ED 402 885 HE 029 828 AUTHOR Jenny, Hans H. TITLE...

DOCUMENT RESUME
ED 402 885 HE 029 828
AUTHOR Jenny, Hans H.TITLE Cost Accounting in Higher Education. Simplified
Macro- and Micro-Costing Techniques.INSTITUTION National Association of Coll. and Univ. Business
Officers, Washington, D.C.SPONS AGENCY Teachers Insurance and Annuity Association, New York,
NY. College Retirement Equities Fund.REPORT NO ISBN-1-56972-006-1PUB DATE 96
NOTE 263p.; Supported by a gift from Grant Thorton, CPAs,LLP, Denver, Colorado.
AVAILABLE FROM National Association of College and UniversityBusiness Officers, One Dupont Circle, Suite 500,Washington, DC 20036 ($49.95 members; $69.95non-members).
PUB TYPE Guides Non-Classroom Use (055) Books (010)
EDRS PRICE MFO1 /PC11 Plus Postage.DESCRIPTORS *Accounting; Bookkeeping; Cost Effectiveness; *Costs;
Educational Finance; Financial Audits; FinancialPolicy; *Higher Education; Money Management;*Nonprofit Organizations; Private Schools; *SchoolAccounting; School Business Officials
IDENTIFIERS *Cost Accounting; Financial Reports
ABSTRACTThis manual covers cost accounting applications and
techniques as they apply to institutions of higher education,focusing mainly on the different methods of allocating costs. Themanual covers four major costing topics: aggregate institution andsystemwide costs; major academic and administrative program costs;academic and administrative activity-based costs; and indirect costrecovery. After an introductory chapter, individual chapters cover:(1) the four-tier full-cost matrix and institution-widemacro-costing; (2) cost centers and macro-cost charts of accountsused in higher education; (3) institution full costs of primaryby-function programs under various allocation rules; (4) aggregatecosting of major professional academic programs; (5) macro-costing ofdepartments; (6) academic micro-costing and determining the full costof a course; (7) costing of support activities (total-costmanagement, activity-based costing, and process-cost management); and(8) other costing topics and issues. There are approximately 100figures throughout the text; some chapters have worksheet exercises;and most have notes. Appendixes A and B cover the range of precisionin costing standards, and a hierarchy of primary and supportactivities. Appendix C summarizes provisions of Circular A-21, Officeof Management and Budget, "Cost Principles for EducationalInstitutions." (CH)
************************************************************************ *Reproductions supplied by EDRS are the best that can be made* from the original document.**********************************************************.*************

I r)
r1
tc,:
PY AVAILABLF")
U S DEPARTMENT OF EDUCATIONOffice of Educahonal Research and improvement
EDUCATIONAL RESOURCES INFORMATIONCENTER (ERIC)
This document has been reproduced asreceived from the person or °mem/moonorigmatIng it
0 Minor changes have been made to improvereproduction qualm,
Po,nls of view or oponfons staled fn INS dOCumeat do not necessarily represent officiaiOERI Posaion or policy
"FFRMISSON TO REPRODUCE THISMATERIAL HAS BEEN GRANTED BY
NACUBO
TO THE EDUCATIONAL RESOURCESINFORMATION CENTER (ERIC)

Cost Accounting in Higher Education
Simplified Macro- and Micro-Costing Techniques
Hans H. Jenny
NACUBONatitmal association
of College and University
Business ( )fficcrs
3

Library of Congress Cataloging -in- Publication Data
Jenny, Hans H. (Hans Heinrich), 1922
Cost accounting in higher education: simplified macro- and micro-costing techniques / Hans H. Jenny.p. cm.
Includes bibliographical references.ISBN 1-56972-006-1
1. Universities and collegesUnited StatesAccounting. 2. Cost accountingUnited States. I. Title.LB2342.J397 1996379.1'18'09788dc20 CIP 96-19872
Copyright 1996 by the National Association of College and University Business OfficersOne Dupont Circle, Suite 500Washington, DC 20036
All rights reservedPrinted in the United States of America
4

Cost Accounting in Higher Education
was made possible in part by a gift from
TIAA-CREF
and
Grant Thornton CPAs LLPDenver, Colorado

Contents
Preface xv
Acknowledgments xviii
Introduction 1
Background 1
On the Scope of This Manual 2
The Objectives and Intended Audience 2
Modern Cost Accounting Needs Versus Indirect Cost Recovery 3
The Prevalence of Cost Pools: Pooled Costs Equal Unallocated Costs 3
Allocating Costs from Cost Pools Reduces Cost Precision 4
Costing Practices Differ Among Institutions 4
Chapter 1. The Four-Tier Full-Cost Matrix:Simplified Institutionwide Macro-Costing 7
What Are Full Costs? 7
The Institution as a Going Concern 8
The Original Three-Tier Cost Structure 8
The Four-Tier Full-Cost Matrix 9
Current Revenues or Cash Flow Available for Operations 11
The Expanded Four-Tier Long-Run Cost Matrix 11
Refinements and Complications 12
Alternative Presentations 14
Scholarships, Fellowships, and Prizes 14
Alternative A 14
Alternative B 14
Alternative C 15
Alternative D 15
Fully Expensed, Currently Acquired Assets 15
Alternative Order for the Four-Tier Cost Structure 16
Depreciation 16
Facilities-Use Charges 17
Exercises 18
Chapter 2. Cost Centers and Macro-Cost Charts of Accounts Used inHigher Education 21
What Is a Cost Center? 21
Basic Macro-Cost Charts of Accounts 22
Cost Accounts by Jurisdictions or by Major Administrative Functions 22
V
6

Primary or Core Program Cost Accounts 24Natural Costs 24
Uniform Charts of Accounts 25By-Function Accounts and Natural Costs 28
Other Dimensions for Macro-Cost Account Classification 29Primary Versus Support Programs 29Primary Academic Programs and Instruction 29Core Versus Noncore Programs 30Interdepartmental Administrative and Operational Costs 30Activity-Based Costs 31
Chapter 3. Institutionwide Full Costs of Primary By-Function Programs UnderVarying Allocation Rules 33
Research University's Board Requests Cost Information 33Institutionwide Full Costs 34
The Four-Tier Full-Cost Model 34Five Cost Models 34
Model One: Standard By-Function List of Program Costs 36Model Two: Standard By-Function Costs Distinguishing Primaryfrom Support Activities 36Model Three: Allocating Long-Term Debt and Depreciation Costs toFacilities in Primary and Support Activities 36Model Four: Allocating Selected Support Costs to Primary Activities 39Model Five: Allocating All Tier-One Support Costs to Primary Programs 40
Post-SFAS No. 117 Alternative Reporting Formats 40The By-Function Model with Explicit Indirect Support Costs 43The Simplified By-Function Format with Primary Full Costs Only 43
SFAS No. 117-Type Cost Report Formats Containing Support Costs 44Alternative Allocation Bases and Their Effects on Tier-One Costs 45
Allocating Pooled Costs on the Basis of Their Natural Costs 45Allocating Executive Administration Costs: A Comparative Analysis 47Allocating All Support Costs Only to Primary Cost Centers 51Alternative Allocation of Support Costs Using Multiple Allocation Bases 51
Allocating Tier-Two Through Tier-Four Costs After the Fact 51Long-Term Debt Costs 51One-Year Assets 56Depreciation 56Useful-Life Estimates 58
Exercises 60
Chapter 4. The Aggregate Full Costs of Major ProfessionalAcademic Programs 61
Summary of Academic Program Full-Cost Alternatives 61Definition of the Costing Tasks 61
vi
7

Research University's Choice of Allocation Bases for AcademicProgram Costs 62Model One: The Standard FTFC Model Allocating Tier-Two ThroughTier-Four Costs to Primary and Support Cost Centers 67
Model Two: Model One Modified by Allocating All Shared Tier-TwoThrough Tier-Four Costs Among Primary Cost Centers 67
Model Three: Allocating All Tier-One Support Costs to the PrimaryAcademic Programs 68
Model Four: Allocating All Support Costs to Primary Academic Programs 69
Summary Academic Program Cost Reports 70
Exercises 79
Chapter 5. Macro-Costing of Departments 81
Aggregate Full Costs of Physical and Mathematical Sciences 81
Natural Tier-One Costs of Physical and Mathematical Sciences 82
Limits to Transferring. Costs by Natural Classifications 85
Allocating Costs to Administrative Departments 86
Departmental Budgets Are the Basis for Total Institutional Costs 86
Exercises 88
Chapter 6. Academic Micro-Costing: The Full Cost of a Course 91
Introduction 91
The Meaning of Micro-Costing 92
Micro-Costing and the Cost Accounting System 93
Types and Purposes of Micro-Costing 93
The Four-Tier Full-Cost Model Applied to Course Costs 94
Course Cost Information at Liberal Arts College 94
The Full Costs of Economics 101-1 95
The Basic Data Modules 98
The Personnel Work-Load Compensation Module 98
Departmental Personnel Compensation Costs: Department of Economics 98
Faculty Course-Load Module 98
The Student Course-Load Module 98
The Student Net Revenue Module 102
Plant Value, Square Footage, and Other Potential Allocation Data 109
Course Depreciation Costs 109
Allocating Departmental Natural Costs to Courses 113
Formula-Based Prorating 113
Charging Direct and Indirect Departmental Costs to Courses 116
Simplified Course Full Costing Using Natural Costs 117
Multiple Allocation Bases 117
Allocating Support Costs 117
Shared Courses, Shared Staff, and Shared Facilities 124
Exercises 126
VII

Chapter 7. Costing of Support Activities: Total-Cost Management,Activity-Based Costing, and Process-Cost Management 129
Not-So-Novel Costing Innovations 129NACUBO's Benchmarking Project 130
Benchmarking: An Old Tool in New Clothing 130Emphasis on Activities Other Than Instruction and Research 130Common Features in Operational Support Costing 131The Meaning of Total Cost Management 132
Total Cost Management Means Understanding and Managing Entire,Sometimes Very Complex, Work Processes 132Total Cost Management Serves the Purpose of Performance Improvement 134How to Implement Total Cost Management 134
Description of a Typical Business Process 135The Materials Management Process 135The Process of Managing the Purchase Requisition and Order 137
The Ubiquitous Process Flow Chart 138The Costs of Processes and Activities: Some General Observations 140
Time As a Factor 140Total Process Costs 140Personnel Cost, Process-Time Studies, and Illusory Substitution Effects 141Costs and Revenue Dimensions in Process Costing 143Applying the FTFC Model to Process and Activity Costing 143
Materials Management Decisions and the Changing Cost Mix 143The Enrollment Management Process at Liberal Arts College 148
Major Subprocesses 150The Admissions Process 150
Process and Activity Scenarios 153Activity-Based Costing of the Enrollment Management Process atLiberal Arts College 154Alternative Off -Campus Recruitment Process Description 157
Summary and Conclusions 157Exercises 160
Chapter 8. Other Costing Topics and Issues on Developing a ComprehensiveCosting System 161
Multiple Allocation Bases 161Different Financial Policies 161Different Pooling Practices and Loss of Costing Precision 162The Cost of Costing 163Direct and Full Costing in a World of Computer Sophistication 164
The Meaning of Maximum Direct and Full Costing 164Capital-Cost Dimensions Other Than Depreciation and Facilities-Use Charges 164
The Time Value of Money 164Investment Payback 165
viii 9

Break-Even Time and Capital Costs 165
Investments with a Limited Time Horizon 165
Inflation and Capital Costs 165
Fixed, Variable, and Marginal Costs 166
Liberal Arts College and Marginal Costs 167
The Marginal-Cost Effect of Adding a Course Section 167
Marginal Costs for the Department and the Institution 170
Marginal Costs Equal Marginal Revenues or Optimum Revenues and Costs 171
The Effect on Marginal Costs of Changes in Support Activities and
Auxiliary Enterprises 171
Marginal Costs and Long-Range Planning 172
External Costing Mandates 174
An Alternative to Traditional Cost-Recovery Accounting 177
Costs and Total Quality Management 177
Total Quality Management Equals Total Cost Management 178
Conclusion 178
Who Is Responsible for Cost Analysis? 179
Questions With Financial Policy Implications 180
Appendix A. Basic Costing Concepts and Principles 183
Appendix B. Cost Allocation Bases and Procedures 195
Appendix C. Indirect-Cost Allocation Under Circular A-21 207
ix 10

Figures
Chapter 11.1: Reported Full Costs Before and After Depreciation 81.2: Three-Tier Full-Cost Structure 81.3: Four-Tier Full-Cost Matrix 91.4: FTFC Matrix for Two Institutions: Stages of Financial Condition 111.5: Simple Four-Tier Full-Cost Report 121.6: Comprehensive or Expanded FTFC Matrix 131.7: New Tier One for Alternative A: Scholarships, Fellowships, and Prizes 141.8: New Tier One After Alternative B: Scholarships, Fellowships, and Prizes 151.9: Long-Term Depreciation Costs Under Alternative Depreciation Rules 17
Chapter 22.1: Macro-Cost Account Structure with Aggregations by Selected
Administrative Functions 222.2: Macro-Cost Account Structure Showing Selected Academic
Jurisdiction Functions 242.3: Primary Academic Programs and Professional Disciplines 252.4: Primary Academic Programs and Support Activities 252.5: Natural-Cost Account Structure with Selected Object-Line Items 28
Chapter 33.1: Research University's Four-Tier Full Costs in the Aggregate 343.2: Comparison of Tier-Four or Full Costs for Major Administrative Functions
at Research University Using Different Cost Allocation Procedures 353.3: Model One Four-Tier Full Costs by Major Administrative Functions at
Research University 363.4: Model Two Four-Tier Full Costs at Research University, with
Primary and Support Programs Reclassified 383.5: Model Three Four-Tier Full Costs at Research University, with Long-Term
Debt and Depreciation Costs Allocated to Cost Centers as Direct Costs 403.6: Model Four Allocating Direct Support Costs at Research University to
Primary Programs 413.7: Model Five Four-Tier Full Costs at Research University, with Direct Support
Costs Allocated to Primary Cost Centers, Leaving Residual or IndirectSupport Program Costs 42
3.8: Summary Single-Column Presentation of Four-Tier Full Costs of Primary andSupport Programs at Research University 43
3.9: Four-Tier Full-Cost Report by Major Functions at Research University, with AllCosts Allocated to Primary and Support Activities 44

3.10: Four-Tier Summary Report for Research University Showing Primary
Programs Costs Only 44
3.11: Selected By-Function Accounts in Audit Format 45
3.12: Prorating Costs in Proportion to Natural-Cost Lines at Research University 46
3.13: Summary Comparison of Five Allocation Methods for Executive AdministrationCosts and the Effect on Auxiliary Enterprise Costs 47
3.14: Allocating 25 Percent of Executive Administration Costs at Research Universityto Auxiliary Enterprises 48
3.15: Allocating Executive Administration Costs at Research Universityto Auxiliary Enterprises on the Basis of Auxiliary Enterprises'Tier-One or Direct-Cost Share 49
3.16: Allocating Executive Administration Costs at Research University to All CostCenters on the Basis of Personnel Compensation Percentage Shares 49
3.17: Executive Administration Costs at Research University Allocated on theBasis of Tier-One or Direct Costs 50
3.18: Dividing Tier-One Costs at Research University on the Basis of PersonnelCompensation and Consumables or Natural Cost Categories 50
3.19: Comparing Post-Allocation Tier-One Costs at Research University 51
3.20: Allocating Remaining Support Costs at Research University to PrimaryPrograms on the Basis of Personnel Compensation 52
3.21: Allocating Support Costs at Research University Using MultipleAllocation Bases 53
3.22: Long-Term Debt Costs at Research University Allocated on the Basis ofPercentage Shares of Debt Dollar Values 54
3.23: Depreciation Schedule Based on Remaining Useful Life of Assets at
Research University 59
3.24: Average Versus Weighted Remaining-Life Years at Research University 60
Chapter 44.1: Research University's Pre-SFAS No. 117 Academic Program and
Administrative Support Centers 62
4.2: Research University's Academic Program Full-Cost Comparisons 63
4.3: Research University's Spreadsheet for Tier-One Costs Before Allocating DirectSupport Costs to Major Academic Programs 64
4.4: Research University's Spreadsheet for Allocating Tier-One ThroughTier-Four Costs 65
4.5: Allocating Research University's Support and Indirect Costs to PrimaryPrograms; Potential Allocation Bases 66
4.6: Research University's Model-One FTFC Matrix for Tier-One ThroughTier-Four Costs of Primary and Support Programs 68
4.7: Four Depreciation Methods for Research University 69
4.8: Research University's Model Two Academic Program Cost AllocatingTier-Two Through Tier-Four Costs Among Shared Facilities Only 70
xi 12

4.9: Research University's Model Three Academic Program Cost AllocatingTier-One Support Costs to Primary Academic Programs 71
4.10: Research University's Model Three Spreadsheet Showing Support-ProgramDetail and Support-Cost Allocation Bases 72
4.11: Research University's Model Three Tier-One Through Tier-Four Primaryand Support Program Costs 73
4.12: Research University's Model Four Spreadsheet Showing Full Allocation ofTier-Two Through Tier-Four Support Costs to Primary Programs 74
4.13: Research University's Model Spreadsheet Showing Allocation Detail forTier-Two Through Tier-Four Support Costs Remaining in Model Three 75
4.14: Research University's Spreadsheet of Cost Allocation Bases HighlightingMultiple Allocation Bases 76
4.15: Research University's FTFC Matrix for Primary Academic Programs 78
Chapter 55.1: Research University's Physical and Mathematical Sciences Program
Full Costs 825.2: Research University Department of Chemistry Costs by Natural Tier-One
Classifications 835.3: Allocating Tier-One Costs by Natural Costs for Physical and Mathematical
Sciences at Research University 845.4: Natural Cost Classification of Support Costs Allocated to Research
University's Department of Chemistry 85
Chapter 66.1: Costs by Function for Liberal Arts College Using the FTFC Model 966.2: Simplified Course Cost-and-Revenue Matrix Where Total Instructional Costs
Equal Sum of Course Costs 966.3: Natural Costs for Liberal Arts College Using the FTFC Model 976.4: Spreadsheet for Liberal Arts College's Personnel Work-Load
Compensation Module 996.5: Liberal Arts College's Compensation Costs for Economics 101-1 and the
Department of Economics Using the FTFC Model 1016.6: Faculty Course-Load Module for One Semester at Liberal Arts College,
Apportioning Total Compensation Costs from Figure 6.1 1016.7: Sample One, Semester Course-Load Module for a Typical Junior at
Liberal Arts College 1016.8: Annual Net Revenue Contribution of a Typical Junior at Liberal Arts College 1026.9: Student Revenues at Liberal Arts College Allocated to the
Course-Load Matrix 1036.10: Student Aid Grant Discount Ranking at Liberal Arts College 1036.11: Decile Distribution of Student Aid Discounts and Budgetable Revenues
from Student Charges at Liberal Arts College, Showing the Calculationof Budgetable Net Revenues Assigned to Instruction (Column 0) 104
xii

6.12: Decile Distribution of Student Aid Discounts and Budgetable Revenues
from Student Charges at Liberal Arts College, Showing Budgetable NetRevenues Assigned to the Department of Economics and Economics 101-1
(Columns 7 and L) 106
6.13: Liberal Arts College Department of Economics Course-RevenueMatrix With Credit-Hour Revenues 107
6.14: Selected Cost Elements and Cost Allocation Bases for Liberal Arts College 110
6.15: Liberal Arts College's Facilities Inventory, Remaining Asset, andUseful-Life Values Using Straight-Line Method of Depreciation 111
6.16: Liberal Arts College's Depreciation Allowance for Classroom Use in
Building S Based on 2,475 Square-Foot Hours for Economics 101-1 112
6.17: Support Costs by Natural Cost Classifications for Liberal Arts College 114
6.18: Primary Program Costs by Natural Cost Classification forLiberal Arts College 115
6.19: Natural Cost Structure of FTFC Model at Liberal Arts College Showing
Selected Cost Allocation Methods 116
6.20: Single Allocation Base: Student Credit Hours(Support Costs Not Yet Allocated) 118
6.21: Multiple Allocation Bases: Version A (Support Costs Not Yet Allocated) 119
6.22: Multiple Allocation Bases: Version B (Support Costs Not Yet Allocated) 120
6.23: Single Allocation Base: Student Credit Hours (Support Costs Allocated) 121
6.24: Multiple Allocation Bases: Version A (Support Costs Allocated) 122
6.25: Multiple Allocation Bases: Version B (Support Costs Allocated) 123
6.26: Comparison of Six Economics 101-1 Full Costs at Liberal Arts College 124
Chapter 77.1: Structure of a Broad-Based Business Process 135
7.2: Sample Flow Chart Sequence in Purchase Requisition and Order Process 138
7.3: Alternate Flow Chart Sequence in Purchase Requisition and Order Process 139
7.4: Selected Materials Process Activity Costs at Liberal Arts College Before
Change in Process 145
7.5: Selected Materials Process Activity Costs After Change in Process 145
7.6: Activity-Cost Worksheet 145
7.7: Summary Process Spreadsheet 146
7.8: Activity Spreadsheet 147
7.9: Participants in the Enrollment Management Process at Liberal Arts College 149
7.10: Activities in New-Student Enrollment Management Process at
Liberal Arts College 151
7.11: Segment of Student Admissions Application Process Flow atLiberal Arts College 152
7.12: Summary Comparison of the Traditional Admissions Department
Budget and the New Enrollment Management Budget 155
7.13: Liberal Arts College Total Activity-Based Costs for theEnrollment Management Process 155

7.14: Off -Campus Recruitment Program Budget at Liberal Arts College 1567.15: Activities Worksheet for Employee A, Off-Campus Activities (Trips) 1567.16: Activities Worksheet for Employee A Showing Cost Detail for Trip 1 1567.17: Itemizing Alternate Workscopes for Two Admissions
Counselors During Trip 1 1577.18: Allocation of $404.85 to Activities 158
Chapter 88.1: Liberal Arts College's Fixed, Variable, and Marginal Costs for
Economics 101-3 and 101-4 1688.2: Marginal-Cost Analysis for Liberal Arts College, Student by Student 1698.3: Departmental Marginal Costs for Liberal Arts College 1708.4: Institutional Marginal Costs for Liberal Arts College 1708.5: Alternative Marginal Cost Calculation 1738.6: Marginal Costs in an Academic Department Implementing a 15:1
Student/Faculty Ratio 1758.7: The Effects on Costs of Adding "Indivisibilities" Such as Lump-Sum
Prorated Support or Indirect Costs 176
Appendix AA.1: Range of Precision in Costing Standards with Examples of
Standard Descriptions 186
Appendix BB.1: Hierarchy of Primary and Support Activities 200
Appendix CC.1: Major Institutional Costing Tasks 208C.2: Institutional Versus Circular A-21 Costs 208C.3: The Place of Sponsored Grants and Contracts in the Structure of
Institutional Activities 210C.4: Circular A-21 Allowable Costs 211C.5: Allocation Rules for Library Costs Under Circular A-21, Section E.8 216
/5xiv

Preface
On May 19, 1995, the National Association of College and University Business Officers
(NACUBO) sponsored a seminar called "College and University Accounting and Reporting:
Meeting the Needs of 2000 and Beyond." The underlying topic was how higher education
financial reporting must change and might change in the future. Participants included many
professionals responsible for promulgating or significantly influencing current and future
accounting standards.The general sense of the seminar was that the recent revolutionary changes in financial
reporting standards exemplified by the Statement of Financial Accounting Standards (SFAS)
No. 1171 will enhance one's understanding of the college and university financial condition.
The remaining differences in standards that continue to apply to public rather thanindependent institutions were duly noted.
While the seminar did not focus directly on costing, several useful insights on higher
education costs were touched on. Most panelists saw a need for still better financial data,
particularly cost data. The importance of information about higher education segments and
sectors and about academic programs was mentioned. In addition, there were repeated
exhortations for cost information that distinguishes clearly between core and noncore higher
education activities.The term "cost" is used constantly in higher education and has many different meanings.
Cost information abounds, yet, as this book will show, it is seldom what it appears to be.
College and university costing is undergoing rapid and extensive change. As institutions try
to implement the SFAS No. 117 mandates, they find that their cost allocation practices must
change also. While higher education administrators experiment with new approaches, they
should remember that it is alright to be skeptical and to have a sense of humor. While most
discussions involving financial issues are imbued with a high degree of solemnity, at times
they often have their comical if not outright nonsensical overtones.This is especially true with respect to many costing tasks where prevailing practice and
standards remain highly subjective, or where the federal and state governments impose rules
that are not always in the best interest of those required to abide by them. Sometimes
individual institutions or entire segments of the industry will defend accounting practices that
are either obsolete or dysfunctional because of an alleged unique need or because it would
cost too much to change an existing cost accounting system.
xv 1 6

Cost Accounting in Higher Education
This book starts from the premise that there is no great mystery about costs and costing,that the mechanics of cost allocation and cost-crossover accounting are by now well known,and, yes, that much costing activity is unglamorous, often tedious, and never finished.
Colleges and universities engage in many different kinds of costing, which are describedherein, some in greater detail than others. The most important costing issues center on howeffectively an institution allocates its resources. At any given time, across the nation,thousands of unheralded costing tasks are undertaken by managers within institutions withoutanyone else even being aware of their effects. These types of costing have been singled outand recognized since 1976 by NACUBO through its Cost Reduction Incentive Awards andInnovative Minagement Achievement Awards (recently renamed Higher Education Awards).
But higher education has been preoccupied with another type of costing: costing forindirect cost recovery, especially with respect to grants and sponsored research financed bythe federal government under Office of Management and Budget Circular A-21 and itscompanion circulars that define the rules under which grant proposals must be submitted andcertain indirect costs can be recovered.
Circular A-21's indirect cost allocation procedures for indirect cost recovery are nowdominating much of higher education's interest in and practice of costing, especially whereindirect cost recovery plays a central role in determining the financial health of theinstitution. NACUBO continues to conduct well-attended indirect cost recovery workshopsthat extol the benefits of cost pooling, a central Circular A-21 feature. Indirect cost recoverycosting therefore consists of allocating these pooled costs to the academic and researchprograms for which federal support is sought.
Unfortunately, when institutions base their internal program costing on the after-the-factallocation of usually rather large cost pools, they will more often than not sacrifice a greatdeal of costing precision to the relative simplicity of the costing task proper. Moreover, asinstitutions have learned to refine their cost allocation expertise and methodologies, theyhave increased the number of interesting and potentially appropriate cost allocation bases forindividual costing situations. If they have paid attention, they will also have discovered thateach allocation base produces its distinct cost outcome. Sometimes the differences are verylarge. Then the question arises: Which allocation bases should one choose?
Under SFAS No. 117, institutions are encouraged to allocate more of their pooled costs toprimary programs than in the past. Although it may not be entirely clear at this writing whatis meant by primary programs, the requirement for more direct costing is not a unique highereducation invention. For-profit enterprises have been forced by competition and otherreasons to allocate their pooled and indirect costs to their many product and service costcenters in order to know whether or not the prices charged cover the products' and services'full costs.
This book focuses on full costs throughout and does not distinguish between one type offull cost for public institutions and another for independent institutions. If two institutions,one public and the other independent, use the same resources, they will have identical costsunder identical depreciation policies.
In spite of the influence of Circular A-21, many colleges and universities have broadenedtheir direct-costing expertise and made it part of their annual budgeting process. Especially
17xvi

Preface
among smaller institutions, direct costing may in fact be more advanced than in somelarger ones, especially if the latter do not subscribe to the practice of full-cost-centerbudgeting. One of the more peculiar legacies associated with (though not required by)Circular A-21 costing is the pooling of personnel benefits as an indirect cost when an eligibleemployee is hired. Perhaps it is easier for smaller institutions, rather than for complex ones,to charge personnel benefits directly to each department, although the crossover mechanics,once programmed, are rather elementary. Some institutions, public and independent, buildtheir annual budgets from the bottom up on a full-cost basis, and this book looks at this typeof costing also.
When the idea of this book was first discussed, for a brief moment the thought was tocreate a higher education costing textbook. Like similar works in the for-profit world of costaccounting for which the normal cost accounting textbook is written, this would have meantthe production of a very detailed and thick volume. Instead, it was decided to be moreselective and to leave out topics that would otherwise fall under the heading of costaccounting.
Specifically, this book focuses on costing illustrations that can assist institutions as theyimplement SFAS No. 117, and on certain costing innovationsactivity-based costing andprocess costingthat have been of particular interest to the NACUBO membership. In thislatter area, the objective is not so much to describe every cost accounting detail than tohighlight the nature of what is at stake and to offer some of the arguments for and against thecosting procedures involved.
With these thoughts in mind, this book is devoted to the following major topics:
1. After some introductory materials, it illustrates simplified costing techniques forinstitutions that continue to pool major costs before they assign or allocate them tokey cost centers; this is called here from-the-top-down, after-the-fact macro-costing.
2. It outlines the principles of maximum direct departmental full costing, whichimplicitly leads to maximum-direct-program and by-function costs; this is calledhere from-the-bottom-up-at-the-cost-origin micro-costing.
3. After summarizing the scope of operational costing, the book describes activity- andprocess-based costing tasks designed to enhance cost-effective resource allocation.It also includes some concluding comments pointing to future developments.
4. Finally, the book contains appendices summarizing some of the basic principles ofcosting. Appendix C reviews indirect cost allocation under Circular A-21.
Notes1. Statement of Financial Accounting Standards No. 117: Financial Statements of Not-for-
Profit Organizations, Financial Accounting Series No. 127-B (Norwalk, Conn.: FinancialAccounting Standards Board of the Financial Accounting Foundation, June 1993). Seealso SFAS No. 116.
xvii 18

Acknowledgments
Throughout my career, I have benefited from the wise counsel and example of others toonumerous to list here. I want them to know that I am very grateful for their past help and, inso many instances, for their friendship. I am only too aware that I have absorbed less thanthey have tried to impart.
I dedicate this book to four individualsall once associated with the College ofWoosterwho have influenced my career in substantial ways: the late William J. Pocock,chairman of the Board of Trustees, who supported and encouraged my external professionalwork; George Ingram, past chairman of the Finance Committee, whose sometimesnontraditional ideas about financial reporting and costing are partially reflected here; the lateArthur H. Compton, who as chairman of the Board of Trustees suggested college financialmanagement and planning to me as a career path; and G. Richard Wynn, vice president forfinance and business at Haverford College, who was with me from the start and who today isin a position to tell me when I am off the mark! I think of all these people with deepgratitude.
My sincere appreciation is offered to those, too numerous to list, who have madesubstantive contributions to this manual by providing data, suggestions, and at times pointedand even humorous criticism. Of course, I take full responsibility for the contents and claim,as is custom, all errors and shortcomings as my own.
Very special thanks go to Caspa Harris for standing behind this project, to Robin Jenkinsfor her unflagging support and patience, and to Donna Klinger and Dale Adams for theefficiency with which they guided this book through publication.
HHJ
19
xviii

Introduction
Background
This manual supplements and expands James A. Hyatt's A Cost Accounting Handbook forColleges and Universities! It expands the list of costing applications and modifies some of
the underlying cost concepts and cost allocation procedures.Prior to 1983, NACUBO and others had recognized the need for developing consistent
cost information and costing techniques that could be applied throughout higher education.
Several NACUBO committees made path-breaking contributions during the emergence ofcosting as a topic of vital importance to higher education. Of special interest, to this day, is
the joint work on costing performed by NACUBO and the National Center for Higher
Education Management Systems (NCHEMS) in 1977.2
The Carnegie Commission on Higher Education under the chairmanship of Clark Kerralso influenced higher education costing literature and practice. Its many publications helped
advance the understanding of higher education economics and finance. Bibliographies of
subsequent studies continue to testify to the commission's substantial contribution.
Noteworthy examples are the references in The Economics of American Universities, which
highlights a variety of important cost issues.3 The authors suggest that the higher education
"production function(s)" be studied more carefully, especially with respect to likely
differential effects on costs of alternative combinations of resources in instruction and
research. In another context, the volume recommends studies of the direct and indirect costs
of sponsored research, of the cost of depreciation and obsolescence, and of induced usages of
plant and equipment.4The literature on costing is vast, and much of it addresses for-profit cost accounting. The
writings on higher education costing are diverse and often respond to concerns of themoment. On balance, higher education, while having made much progress in costing, stilllacks the tools needed for a full understanding of how it allocates its scarce resources. One of
the chief reasons may well be that costing in higher education currently lacks sufficientuniformity and precision. It seems that costs are more or less in the eye of the beholder orthat they depend on who does the costing.
1
20

Cost Accounting in Higher Education
On the Scope of this Manual
This manual deals extensively with cost allocation issues and peripherally with otherprominent costing topics. Its main focus is on accounting costs from the institution'sperspective and on the many different ways costs can be allocated to cost centers. Eachallocation method tends to produce its distinct cost outcome. Therefore, before choosing aspecific mix of cost allocation procedures, it is important to know what the resulting costoutcomes are. But first, institutions must define the uses to which specific cost informationwill be put. This manual stresses various degrees of precision in the costing of academicprograms and administrative activities, whatever the level of cost aggregation.
From the institution's point of view, costs are an indicator of financial performance.Financial performance evaluation has many dimensions. The most important is not how, buthow well resources have been allocated. At a time of increasing competition, growingresistance to price increases, and static or declining budgets, costing is the fundamentalmanagement tool that should precede the allocation of resources. First, one must know howmuch a given activity or program costs. Second, one should try to understand whether andhow costs can be reduced without damage to the quality of the services involved.
This manual divides costing tasks into four distinct costing topics:
Aggregate institution- and systemwide costsMajor academic and administrative program costsAcademic and administrative activity-based costsIndirect cost recovery
All but topic 1 depend upon the application of and choices among several cost allocationmethods.
The Objectives and Intended Audience
This manual provides readers with a series of road maps for selected costing applications.It should be useful for all types of institutions, regardless of their differences with the twohypothetical institutions used as examples through the book. Many of the details may bemost suitable for institutions whose costing practices are not yet fully developed in the areascovered here. For expert institutions, the manual offers suggestions about costing alternativesthat may be more productive than some in current use.
This is both a how-to and an analytical book for professional managers engaged incosting. The book's focus on cost allocation alternatives raises questions of how appropriatespecific costing methods are. What is suitable in one situation may not be in another.
It is assumed that the staffs responsible for cost accounting possess the technical skills forimplementing cost crossover accounting and that they know cost accounting terminology.The decision was made early not to include mathematical models, since these are abundantin the generally available literature. Costing software is easy to find, and so is the expertiseof technical consultants.
2 21

Introduction
Others who may find this manual useful are governing boards, administrators, faculty, andothers within institutions whose decisions directly affect the cost of higher education. Itspotential audience also includes professors and students of higher education administration,as well as individuals and agencies outside of higher education proper who are interested inhow and how well colleges and universities allocate private and public resources, and howtheir management decisions affect the cost of higher education.
It is not the principal aim of this manual to break new ground on the higher educationcosting frontier. Nevertheless, the reader may discover a few methodological innovations orclarifications worth looking into. One of them, the four-tier full-cost (FTFC) matrix, is usedconsistently throughout the manual. On other topics, an effort has been made to be as up-to-date as possible. Differences in accounting principles that may apply to public andindependent institutions are not relevant here.
Finally, readers may concentrate on segments or chapters of the manual without needingto read every chapter, but chapter 1 is central to the entire manual.
Modern Cost Accounting Needs Versus Indirect Cost Recovery
Higher education cost accounting has been dominated by the costing procedures requiredunder the Office of Management and Budget's (OMB's) Circular A-21 and its companiondocuments that stipulate specific accounting procedures that colleges and universities mustadhere to when they submit their direct and indirect cost recovery requests.5 (A May 8, 1996,revision to Circular A-21 was released too close to press time to be addressed in this book.Other revisions are expected later in 1996.) These mandated accounting rules weredeveloped in joint efforts between the federal government and higher education, and theyhave a limited objective, however important it may be. Indirect cost recovery should be seenas a special case that must not overshadow the institution's overall costing needs.
The following quotation from an article in the "Portfolio" section of the NACUBOBusiness Officer supports this contention:
Historically, costing of college and university programs has been confined to analysis
required for the development and negotiation of indirect cost rates... That costing is
limited primarily to function and employs the traditional step-down allocation process
required by...Circular A-21. Although appropriate for the establishment of indirect cost
rates, the step-down allocation process does not provide the [cost] information necessary
to make decisions about possible modification or elimination of programs or services.6
The Prevalence of Cost Pools: Pooled Costs Equal Unallocated Costs
A prominent feature of Circular A-21 cost accounting is the prevalencethe veryinstitutionalizationof large cost pools. When NACUBO and others organize seminars onindirect cost recovery accounting, cost pools are extolled as a virtue, if not a requirement forallocating indirect costs in a reasonably simple and economical fashion. In the process,
3 22

Cost Accounting in Higher Education
indirect costs have come to mean any cost, direct or indirect, that have not been previouslyallocated to a cost centera rather mushy definition.
In fact, many pooled costs are unallocated direct costs. A similar tendency favoring largecost pools was observed in for-profit cost accounting until recently, when competitive forces,improved accounting technologies, and other influences led to much more extensive andprecise direct full costing.
Allocating Costs from Cost Pools Reduces Cost Precision
The allocation of pooled costs, whether through the step-down method or otherwise,almost always reduces precision in final costs. Enhanced precision in costing is of increasinginterest to those seeking cost information everywhere. In higher education, the long-established practice of pooling vast cost entities stands today in sharp contrast with modernfull-cost activity-, transaction-, and process-based costing, where the thrust is toward evermore precise direct and full-cost computation. Direct allocation and responsibility-centercosting are finding growing favor among higher education costing practitioners.'Increasingly, the tendency is toward showing the true full costs of activities and programs,information that is crucial when institutions plan ahead, change budget allocations, or addand eliminate educational programs and administrative activities.
Therefore, an institution's cost accounting system that is solely or principally based onCircular A-21 costing practices is incapable of satisfying higher education's modern costingneeds. This manual stresses direct program costing for maximum cost precision andillustrates the sometime enormous cost differences that result from implementing alternatecost allocation methods.
Costing Practices Differ Among Institutions
Institutions and the accounting profession have made considerable progress in fosteringmore nearly uniform approaches to costing. In spite of these worthwhile efforts, institutionalcosting preferences and know-how differ widely. This manual is not intended to point to asingle correct approach. Sometimes preferred and, in several instances, mandated costingprocedures are highlighted. In general, however, the emphasis is on costing alternatives,because institutional managers are normally the best judges when they seek the mostappropriate cost allocation procedures.
Costing practitioners have at their disposal both simple and complex costing applicationsthat now must be seen in the light of SFAS No. 117, in addition to Circular A-21. Unless aspecific cost allocation method is mandated, the practitioner normally can choose amongseveral costing alternatives. Sometimes the choices are so numerous as to be overwhelming.Many examples found in this book highlight the dilemma managers face when confrontedwith such situations.
Notes1. James A. Hyatt, A Cost Accounting Handbook for Colleges and Universities (Washington,
D.C.: NACUBO, 1983).
234

Introduction
2. NACUBO and NCHEMS, Procedures for Determining Historical Full Costs: The CostingComponent of the Information Exchange Procedures., 2nd ed., Technical Report 65(Washington, D.C.: NACUBO and Boulder, Colo.: NCHEMS, 1977). NACUBO andNCHEMS, Costing for Policy Analysis (Washington, D.C.: NACUBO, 1980). For moreon background, see NCHEMS, Program Measures, Technical Report 35 (Boulder, Colo.:1973), NCHEMS, Cost Analysis Manual, Technical Report 45 (Boulder, Colo.: 1974),and Hyatt, A Cost Accounting Handbook, ix.
3. Stephen A. Hoenack and E.J. Collins, eds., The Economics of American Universities:Management, Operations, and Fiscal Environment (Albany, N.Y.: State University ofNew York Press, 1990).
4. Hoenack and Collins, The Economics of American Universities, 11, 149. Also, David S.Hopkins, "The Higher Education Production Function: Theoretical Foundation andEmpirical Findings," in Hoenack and Collins, The Economics of American Universities,31
5. Office of Management and Budget, Cost Principles for Educational Institutions, OMBCircular A-21.
6. Cesidio G. Mancini and Ernest R. Goeres, "Direct Allocation Costing: InformedManagement Decisions in a Changing Environment," in Business Officer 28 (10): 40(April 1995).
7. Edward L. Whalen, Responsibility Center Budgeting: An Approach to DecentralizedManagement for Institutions of Higher Education (Bloomington, Ind.: Indiana UniversityPress, 1991). See the afterword by John R. Curry on the experience at the University ofSouthern California with responsibility-center budgeting.
524

1
The Four-Tier Full-Cost Matrix: Simplifiedlnstitutionwide Macro-Costing
This chapter answers the following questions:
What is the meaning of full costs?What are the four principal stages in full costing?What is the format of the four-tier full-cost (FTFC) matrix?What is the effect on full costs of alternate depreciation or facilities-use chargepolicies?How does the FTFC model relate to SFAS No. 117?
Computing a single institutionwide cost figure is the simplest of all higher educationcosting tasks. It is the one costing task every institution cannot escape.
With only a few modifications, this task can be carried out directly from most auditedyear-end financial statements or from the institution's annual operating budget. Nodistinction between direct and indirect costs is required, because all costs are direct for theinstitution as a whole. This realization, sometimes overlooked in higher education, simplifiesmacro-costing for the entire institution enormously.
What Are Full Costs?
Full costs are the sum of all variable and fixed resources used or used up in producing aproduct or in rendering a service, including an appropriate allowance for physical assetdepreciation and obsolescence, adjusted for any resale or salvage value. For the institution asa whole, the true meaning of full costs depends almost solely on how institutions account forcosts associated with long-lived physical assets. On the basis of this definition, debtrepayments are not a cost per se, although they will reduce cash flow.
7

Cost Accounting in Higher Education
The Institution as a Going Concern
In the aggregate, the issue is whether or not the institution is a going concern, anenterprise whose current sales and other current revenues cover the full cost of doingbusiness in the long run. The distinction between short-run (variable) and long-run (variableplus fixed) costs is illustrated in figure 1.1. In this simplified example, the fixed costs arerepresented by the depreciation charge, a proxy for the cost of physical capital. By omitting,as in A, or including, as in B, a depreciation charge, reported institutionwide aggregate costsare either lower (A) or higher (B). Obviously, if this depreciation cost has been ignored in thepast, say in a public institution's profit-and-loss report, suddenly recognizing it can be bothdramatic, even traumatic. Institutions are going concerns only when their full costs (B) arecovered by current revenues.
Figure 1.1: Reported Full Costs Before and After Depreciation ($ in 1,000s)
Cost CategoriesVariable Costs
(A)Variable Plus Fixed Costs
(B)
Personnel Compensation $150,750 $150,750
Consumables 79,250 79,250Total Variable 230,000 230,000Depreciation 0 22,250Full Costs 230,000 252,250
Depreciation as % of Full Costs 0% 8.82%
The Original Three-Tier Cost Structure
The original three-tier full-cost structure is described in figure 1.2.1 Its principle feature isthe distinction between direct, indirect, and capital costs, each cost tier representing thecumulative effect after each new cost type has been included.
Figure 1.2: Three-Tier Full-Cost Structure
Tier-One Costs (All Direct Costs Including Chargebacks)
+
+
All Indirect Costs
Depreciation or Equivalent =
Tier-Two Costs
Tier Three Costs
This is a valid model for many costing applications, and today it dominates highereducation macro-costing. Since this chapter is devoted to the institution as a whole, thedistinction between direct and indirect costs is not relevant. More useful might be
268

The Four-Tier Full-Cost Matrix: Simplified Institutionwide Macro-Costing
distinctions between variable and fixed, or short- and long-run costs; each of these cost typescan be either direct or indirect.
As pointed out in the introduction, indirect-cost pools have become the basis for mostmacro-cost allocation requirements. However, many so-called indirect cost pools are nothingmore than unallocated direct costs. To be precise, for the institution as a whole, aggregateindirect costs of tier two in the original three-tier cost model would comprise all unallocatedpooled costs, direct and indirect.
Because modern costing requirements and pooling practices are undergoing significantchanges, especially after the release of SFAS No. 117, a conceptual modification of thethree-tier cost model to a slightly expanded four-tier full-cost model may be appropriate.
The Four-Tier Full-Cost Matrix
The conceptual modification to the three-tier model is consistent with SFAS No. 117because it distinguishes between operating costs and those current costs represented bycurrent and past asset acquisitions. For aggregate costing, nothing more is needed.
Figure 1.3 summarizes the FTFC model. Operating costs are classified by natural costcategories, and costs related to capital are divided into three distinct groupings:
Net costs related to long-term plant debtCurrent physical assets with (or treated as if they had) a one-year useful lifereferred to as one-year assetsThe current cost of long-lived physical assets represented by either a depreciation or
a facilities-use charge
Figure 1.3: Four-Tier Full-Cost Matrix
Cost Stages Types of Costs
Tier-One Costs Personnel CompensationPlus ConsumablesPlus/Minus Adjustments to Eliminate Double CountingEquals Total Tier-One Costs*
Tier-Two Costs Plus Costs Related to Long-Term DebtPlus Ancillary Debt-Management CostsMinus Sinking Fund and/or Debt Reserve IncomeEquals Total Tier-Two Costs
Tier-Three Costs Plus Fully Expensed One-Year AssetsEquals Total Tier-Three Costs
Tier -Four Costs Plus Net Depreciation of Facilities-Use ChargeEquals Tier Four of Full Costs
* Net of scholarships, fellowships, and prizes.
927

Cost Accounting in Higher Education
Tier Definitions
Tier. OneTier one is composed of all natural noncapital
operating costs normally found in the object-line-itembudget:It has two principal components: totalpersonnel compensation and total noncapitalconsumables. All fully expensed physical-assetacquisitions, including those for libraries andlaboratories, facilities improvements; andmandatory and nonmandatory transfers have beeneliminated. Interest on short-term debt is included.A line has been added for adjustments to eliminateany double counting. Finally, scholarships,fellowships, and prizes have been netted out ofboth income and costs:,Thus, tier: one costs arepure operating costs:.
Tier TWo--At tier two,' only the total net cost associated
with' long-term.debt is added. Normally long-termdebt represents.the financing of physical assets,but in recent years some institutions have acquiredlong-term debt.for other than physical capitalpurposes. Long-term debt costs include interestand miscellaneous debt management costsadjusted for earnings from debt-sinking funds orreserves. Debt repayment, mandatory andnonmandatory, is excluded. While debt repaymentis a negative cash flow, it is not part of the costproper of capital. Any long-term debt cost related toaccumulated.operating deficits should be countedas a tier-one cost. For clarity, and especially if it islarge, it can be identified in a separate line.
Tier Three -Tier three includes all fully expensed
noncapitalized current-asset acquisition andimprovement costs with useful lives of one year orless.
Tier FourThis tier includes the annual cost equivalent of allnoncapitalized and capitalized depreciable long-lived assets with remaining useful lives of morethan one year, minus any salvage or resale value.All past and current long-lived library- andlaboratory-asset acquisitions are included here.Today, institutions use either a depreciation or afacilities-use charge.
One-year and long-lived physical-assetcosts could easily be combined. The modelidentifies each for greater clarity. Institutionscurrently expense many physical asset
acquisitionsmost current library acquisi-tions come to mindwhich have long usefullives. The /-TFC model depreciates all suchphysical assets over their useful lives, whetheror not the institution capitalizes them.
Like the three-tier model, the FTFC modelcan highlight the going-concern ideamentioned above. Each tier can be seen as astage at which current revenues are covering(or not covering) a particular level of the in-stitution's total current costs. Thus, by intro-ducing the current revenue dimension into the
FTFC matrix, the model incorporates a
bottom-line indicator as shown in figure 1.4.In conformity with SFAS No. 117, cash flowcan be substituted in a supplementary model.An institution meets the going-concern test ifthe remaining balance at stage four is eitherzero or positive. In the example, institution Ameets the test; institution B does not. In this,
as in most subsequent examples, scholarships,fellowships, and prizes have been netted out ofboth revenues and costs.
The four stages are as follows:
Tier one represents the traditionaloperating result before any costs re-lated to capital have been added; bothinstitutions earn enough income to fi-nance their current operating costs.
At tier two, both institutions also coverthe net cost of their long-term debt.At tier three, they also cover theirrespective costs of current one-yearasset acquisitions.At tier four, institution A remains agoing concern, whereas institution Bshows a deficit.
10 2 g

The Four-Tier Full-Cost Matrix: Simplified Institutionwide Macro-Costing
Figure 1.4: FTFC Matrix for Two Institutions: Stages of Financial Condition ($ in 1,000s)
Tiers Items ABalance
Remaining BBalance
RemainingGross Income, Net SAGs $37,250 $24,350
One Operating, Net $30,450 6,800 $21,750 2,600
Plus Debt-Related, Net 550 235
Two Equals 31,000 6,250 21,985 2,365
Plus One-Year Assets 1,050 285
Three Equals 32,050 5,200 22,270 2,080
Plus Depreciation 4,250 2,110
Four Equals 36,300 950 24,380 -30
Cash Flow Required forMandatory Debt Payment
675 275 385 -415
Note: "Balance Remaining" is not a "cash flow" balance.
Current Revenues or Cash Flow Available for Operations
Crucial to the meaning of the "bottom line" is what is and what is not included in thecurrent revenue line against which these stages are measured. Here, SFAS No. 117, and itscompanion SFAS No. 116, add complications that have not been resolved at this writing. Itcould be said that, with respect to current revenues, SFAS No. 117 loses sight of the
operating bottom line, and during field tests by a small sample of not-for-profit institutions,participants confessed to difficulties with the articulation of an operating measure.2
The Expanded Four-Tier Long-Run Cost Matrix
The most simple summary FTFC report has seven lines. It is suitable for all costing tasks
requiring a single full-cost figure. Figure 1.5 shows an example.At the other extreme, Figure 1.6 illustrates the most complex FTFC matrix. It incorporates
the -two types of distinctions: (1) direct and indirect costs, and (2) unrestricted, temporarilyrestricted, and permanently restricted costs. The second distinction conforms to the newSFAS No. 117 requirements for multicolumn presentations.
The expanded version of the matrix yields a cumbersome, though informative, report on
long-run costs. It highlights the important fact that pooled costs can derive from unrestricted,temporarily restricted, and restricted funds, and that in each of these categories there will be
both direct and indirect costs.For practical reporting purposes, however, it may be appropriate to think of several
distinct reports, each tailored to the needs of a specific audience. The distinction between
direct and indirect costs would be made in cost reports where the effects of direct and
11
29

Cost Accounting in Higher Education
indirect cost allocation procedures must be shown. The distinction between levels ofrestriction would be limited to the rare occasions when cost reports must contain a fiduciary
dimension. In all other instances, the focus would be either on total or on unrestricted costs.The demand for the type of report shown in Figure 1.6 is probably quite limited.
CYperatiligifievenuesl.ASB's.-Special Report did not say so, but the difficulty in articulating an operating result arises-precisely
because..SFASNo. 117 is not primarily designed to highlight an operations-based financial result! By.inceirporatinglhe-requirements'of SFAS No. 116 for reporting contributions and handling net asset appreciation,sFasNo:..1172-hecessitates anyone interested in an operating result to reconfigure current revenue&to exclude.
tho se:thatWould.not normally be part of the institution's operating budget:-Without an:operating result or operating measure, higher education lacks a fundamental indicator of
m'anagerialiin ancial. performance an indicator which many governing board members will want to see. For.
goingtconcern-purposes, absent a.SFAS No. 117 definition, institutions mustdefine their own operating measure.
Dhe.of..theAest institutions in the Special Report solved the problem by distinguishing between operating-and:.norkiperatinglrevenues, arriving at a "changes in net assets from operating activities," followed by several lines.of
nonoperating income and expenses. The most interesting aspect of this institution's approach is that:it lists
operating:experises and losses first; followed by the operating revenues.
Herbert K. Folpe, Susan E. Weiss, Special Report: Results of theField. Test of the Proposed Standardsor FinancialStitements of:Not-for-Profit Organizations and Accounting for Contributions, Financial Accounting Standards Board, Financial Accounting-;
Series No..144-A (Norwalk, Conn.; 1994).
Figure 1.5: Simple Four-Tier Full-Cost Report ($ in 1,000s)
Tiers Cost Elements
One Personnel + Consumables 5571,219
Plus Debt-Related 5,360
Two Equals - 576,579
Plus One -Year Assets 3,885
Three Equals 580,464
Plus Depreciation 24,250
Four Equals 604,714
Refinements and Complications
The version of the FTFC matrix shown above may appear to be overly simple in the
traditionally complicated world of higher education. Several issues might call for more
elaborate or different presentations. The most obvious issues are-
1230

Figu
re 1
.6: C
ompr
ehen
sive
or
Exp
ande
d FT
FC M
atri
x ($
in 1
,000
s)
Tie
rsC
ost E
lem
ents
Gra
ndT
otal
Tot
alD
irec
tT
otal
Indi
rect
Unr
est.
Dir
ect
Unr
est.
Indi
rect
Unr
est.
Tot
al
Tem
p.R
est.
Dir
ect
Tem
p.R
est.
Indi
rect
Tem
p.R
est.
Tot
al
Penn
.R
est.
Dir
ect
Penn
.R
est.
Indi
rect
Penn
.R
est.
Tot
al
One
Pers
onne
l Com
p.$3
3,25
9$2
2,26
4$1
0,99
5$1
7,25
9$5
,115
$22,
374
$1,2
60$2
55$1
,515
$3,7
45$1
,880
$5,6
25
Con
sum
able
s, N
et14
,301
11,5
982,
703
9,82
357
810
,401
225
120
345
1,55
045
52,
005
Tot
al47
,560
33,8
6213
,698
27,0
825,
693
32,7
751,
485
375
1,86
05,
295
2,33
57,
630
Plu
sL
.-T
. Deb
t-R
elat
ed57
552
055
465
046
50
00
550
55
Tw
oT
otal
48,1
3534
,382
13,7
5327
,547
5,69
333
,240
1,48
537
51,
860
5,35
02,
335
7,68
5
Plu
sN
onca
pita
lized
1,76
01,
110
650
785
250
1,03
550
050
275
125
400
Thr
eeT
otal
49,8
9535
,492
14,4
0328
,332
5,94
334
,275
1,53
537
51,
910
5,62
52,
460
8,80
5
Plu
sD
epre
ciat
ion
2,66
02,
005
655
1,72
523
51,
960
450
4523
518
542
0
Four
Tot
al52
,555
37,4
9715
,058
30,0
576,
178
36,2
351,
580
375
1,95
55,
860
2,64
58,
505
BE
ST
CO
PY
AV
AIL
AB
LE
32

Cost Accounting in Higher Education
how to treat scholarships, fellowships, and prizes,why to distinguish between one-year and long-lived asset costs,the merit of an alternative order of the four stages, andthe effect on full costs of different depreciation policies.
Alternative Presentations
Scholarships, Fellowships, and Prizes
In its most simple form, the FTFC model nets out all scholarships, fellowships, and prizes,and the entire component is treated as if it were a discount. Under SFAS No. 117,straightforward discounts will no longer be reported as an expense, but as a reduction incurrent revenues. At this writing an attempt is being made to reach a consensus on thoseelements of the component that eventually will remain classified as expenses and thus treatedas true costs. While awaiting the outcome of the debate, the following are alternative formsof presentation within the FTFC model after all beginning revenue balances have beenadjusted.
Alternative A
This option includes total scholarships, fellowships, and prizes as a separately itemizedtier-one cost. Figure 1.7 illustrates the relevant portion of the matrix, designated as totalstudent aid grants. It includes unrestricted as well as restricted funds. The gross revenue linehas been adjusted accordingly.
Alternative B
Figure 1.8 reports tier one as a separate line item consisting only of unrestricted costs ofstudent aid grants. Both figures 1.7 and 1.8 produce identical new tier-one remainingbalances. Again, the gross revenue line has been adjusted.
Figure 1.7: New Tier One for Alternative A:Scholarships, Fellowships, and Prizes ($ in 1,000s)
Tiers Items ABalance
Remaining BBalance
RemainingGross Revenues $47,960 $31,350
One Operating, Net $30,450 17,510 $21,750 9,600
Minus Total SAG Cost 10,710 6,800 7,000 2,600
NewTierOne
New Operating Net 19,740 6,800 7,000 2,600
14

The Four-Tier Full-Cost Matrix: Simplified Institutionwide Macro-Costing
Alternative C
This approach is identical to the simplified model in figures 1.3 and 1.4 and nets out theentire component, reporting the amount of scholarships, fellowships, and prizes at the bottomof the matrix as a note for general information purposes.
Figure 1.8: New Tier One After Alternative B:Scholarships, Fellowships, and Prizes ($ in 1,000s)
Tiers Items ABalance
Remaining BBalance
RemainingGross Revenues, Net ofRestricted Student AidGrants
$44,800 $29,225
One Operating, Net $30,450 14,350 $21,750 7,475
Minus Unrestricted Student AidGrants
7,550 6,800 4,875 2,600
NewTierOne
New Operating Net 22,900 6,800 4,875 2,600
Alternative D
The bulk of scholarships, fellowships, and prizes is normally represented by need-basedstudent aid grants. These are part of a student aid package that includes the cost of room andboard or its equivalent for nonresident students. Traditionally, even the portion of pricediscounts related to room-and-board costs has been charged against tuition revenues ratherthan, as would be more logical, against auxiliary enterprise revenues. This distinction doesnot affect the overall bottom line of the going concern. But net operating revenues availablefor educational and auxiliary activities would be better defined if student discounts weredirected to the cost centers to which they relate: the institution's academic and auxiliaryenterprise operations.
The simplified approach is used below throughout; unless otherwise indicated, the entirestudent aid grant component is netted out. When appropriate, student aid grants areproportionately deducted from tuition and fees and from auxiliary enterprise revenues.
Fully Expensed, Currently Acquired Assets
For costing purposes, currently expensing an asset acquisition means to depreciate it fullyin the current period. Under the methodology proposed and used here, asset acquisition costsare expressed only in terms of their annual depreciation equivalent.
Depreciation costs tend to be computed on the basis of an asset's estimated useful life.Most current fully expensed asset acquisitions have useful lives in excess of one year. Whencomputing their costs, institutions may have to reclassify their currently acquired and fullyexpensed library and laboratory assets, reflecting their true useful lives. Most libraryacquisitions have long useful lives, certainly longer than one year.
15
34

Cost Accounting in Higher Education
Institutions are not asked to change their asset capitalization policies, but ideally all long-lived physical assets should be capitalized. The depreciable asset pool would then exclude allcurrently acquired one-year assets. This approach enhances costing consistency amonginstitutions.
Another alternative is to generalize the Circular A-21 rule concerning short-lived assets.3Once the threshold for such assets has been raised from $500 to $5,000, fully expensed assetswill certainly include even more long-lived assets. The one-year asset depreciation rulesuggested here may be preferable, because it is both more logical and more precise.
As long as it is understood that the institution adheres to a useful-life costing policy, itmay not be necessary to use a separate tier-three cost level. Instead, one-year assets can belisted separately under or aggregated with depreciation costs.
Alternative Order for the Four-Tier Cost Structure
Some institutions may prefer to record one-year asset costs as either tier-one or tier-twocosts before debt-related costs. The current practice in expenditure reporting treats largeannual investments in library and certain laboratory acquisitions as if they were consumables.There may therefore be a natural inclination to continue this practice when computing costs.Some institutions might prefer to show such costs explicitly before long-term debt costs, butonly the depreciation equivalent should be shown lest costs (in contrast to expenses) beoverstated.
The format used here (figures 1.3 and 1.4) has two purposes: First, the FTFC modelacknowledges that such fully expensed acquisitions are assets, some with short useful livesand most with long ones. Second, it lists physical asset acquisitions and depreciation orfacilities-use costs contiguously, after long-term debt costs. In this way, it indicates an orderof priorities: A going concern is an institution that has sufficient revenues to first cover itsoperating costs, then its debt costs, and finally all costs related to its physical assets.Together, tiers two, three, and four represent the total current costs caused by the financing,using, and using up of physical capital.
Depreciation
When full costs as defined in this chapter are computed, all institutions, public andindependent, must include an annual charge for the cost of long-lived physical assets.Institutions differ enormously in how they calculate their depreciation charges. Comparingdepreciation costs among institutions often means comparing apples with oranges.
On balance, institutions appear to use Circular A-21 depreciation rules unless, in the viewof their governing boards, the federal government's depreciation rates do not reflect theinstitution's perception of the useful lives of its assets. Figure 1.9 illustrates the effect ofdifferent depreciation rules on costs. The exhibit contains all the information needed to makethe calculations.
3 5 16

The Four-Tier Full-Cost Matrix: Simplified Institutionwide Macro-Costing
Costing alternative E uses a replacement-value base for all physical assets, thus increasingthe depreciation charge dramatically to 19.33 percent of total costs. Replacement valuesincorporate an adjustment for inflation in the value of physical assets.
Alternative D illustrates a shortened version of the types of distinctions many institutionsmake in computing their internal and Circular A-21 depreciation allowances among assetclasses. Instead of only four classes of assets and useful life divisors, institutions are knownto list a dozen or more.
Figure 1.9: Long-Term Depreciation CostsUnder Alternative Depreciation Rules ($ in 1,000s)
Tiers Items A B C D EThree $93,250 $92,750 $93,250 $93,250 $93,250
Plus Depreciation 3,300 3,310 6,382 9,051 22,349
Four Equals 96,550 96,060 99,632 102,301 115,599
Note: Value of under-depreciated physical assets: $165 million. For alternative B, $500,000 of long-lived noncapitalized acquisitionswere added to the depreciable category. Total estimated replacement value equals $577,500,000. Depreciation policies follow:
A. 2 percent per year or 50 yearsB. 2 percent per year plus 2 percent of $500,000 of fully expensed acquisitionsC. 2 percent for plant and 6.67 percent for equipment (as in Circular A-21)D. Four classes of assets:
7-year assets, 15 percent of total; $3,536,00015 -year assets, 15 percent of total; $1,650,00025-year assets, 30 percent of total; $1,980,00035-year assets, 40 percent of total; $1,886,000
E. Average weighted rate of 3.87 percent of replacement value
The exercises at the end of this chapter let readers fill in their own cost data and maketheir own comparisons using these depreciation rules.
Facilities-Use Charges
Circular A-21 distinguishes between depreciation and facilities-use charges. Although itdoes not set a ceiling for the size of the depreciation charge, it imposes a cap on the size ofany facilities-use charge. Specifically, it permits a maximum annual rate of 2 percent forfacilities and 6.67 percent for equipment. Institutions using the simplified Circular A-21method are limited by this rule also.
Institutions with a general facilities-use-charge policy are compelled by Circular A-21 toapply the above rates in their indirect-cost-recovery requests. Since these rates normally donot reflect the real-world useful lives of assets, a facilities-use-charge policy may thereforenot be in the best financial interest of institutions. These prescribed rates help minimize thecost of depreciation to the federal government. While they also enhance cost comparabilityamong institutions using this approach, in general they tend to understate depreciation costs.Institutions need to weigh the advantages and disadvantages associated with a facilities-use-charge policy, especially if the resulting asset-depreciation cost is less than it would be undera depreciation method. Institutions with facilities-use charges sometimes use replacementcosts as an allocation base for internal cost reporting.
17
36ST COPY NAMABLE

Cost Accounting in Higher Education
Notes1. James A. Hyatt, A Cost Accounting Handbook for Colleges and Universities (Washington,
D.C.: NACUBO, 1983), 5.2. Doris M. Balsch, Herbert K. Folpe, Susan E. Weiss, Special Report: Results of the Field
Test of the Proposed Standards for Financial Statements of Not-for-Profit Organizationsand Accounting for Contributions, Financial Accounting Standards Board, FinancialAccounting Series No. 144-A (Norwalk, Conn., 1994), 9, 52, 62.
3. Office of Management and Budget, Cost Principles for Educational Institutions, OMBCircular A-21, section 16a(1).
Exercises
1. Fill out the attached four-tier cost matrix for your institution. In column A, use theapproach suggested by your latest audited SFAS No. 117 or prior year-end financialstatements. In column B, use the Circular A-21 approach for use allowances. In column C,use a depreciation rate that would be ideal for your institution if alternatives A and Bunderstate the type of depreciation rate your best useful-life estimates would produce. It ispossible that your A and C versions will be identical.
2. Using your current budget data, fill out worksheet 1.2 to determine your likely break-evenpoint before transfers. Include the total endowment payout if your institution uses a total-return payout formula. Ignore any transfer representing a drawdown of reserves. The focus ison current income.
37
18

The Four-Tier Full-Cost Matrix: Simplified Institutionwide Macro-Costing
Worksheet 1.1:Comparative Full or Long-Run Costs at Your Institution ($ in 1,000s)
Tiers Types of Costs A B C
Personnel Compensation
Total Consumables
Plus/Minus Bet Adjustments
One Total
L.-T. Debt-Related Costs
Two Total
Noncapitalized Assets
Three Total
Depreciation
Four Full Costs
Value of Depreciable Assets
Value of Noncapitalized Assetswith More Than One-Year Life
19 38

Cost Accounting in Higher Education
Worksheet 1.2: Object Line-Item Costs and Break-Even Point
Tiers Cost Elements Costs Revenues DifferenceAnticipated Total Revenues
Personnel CompensationSalaries, Faculty
Salaries, Officers, Other Exempt
Salaries, Other
Wages, Clerical, Custod., Maint.
Wages, Students
Subtotal
Social Security
Medical Plan .
Retirement Plan
Workers Compensation
Tuition Benefit
All Other
Subtotal
Total Compensation
Consumables .
Supplies and Materials
Utilities
Insurance
Travel, Entertainment, Publicity
Printing, Publications, Copying
Books, Subscr. Period. for Adm. Use
Food (Food Service)
Inventory Valuation Adjustment
All Other
Subtotal
Plus/Minus Adjustments to EliminateDuplication
One Total
Long-Term Debt-Related Costs
Two Total
Noncapitalized, Less Than One-Year LifeThree Total
Depreciation or Equivalent:
Equipment
Plant
Four Total Full Costs
Note: Please substitute your object line items if they differ from the above.
39

2
Cost Centers and Macro-Cost Chartsof Accounts Used in Higher Education
This chapter identifies the scope and diversity of frequently used macro-cost centers inhigher education and provides examples of the most basic macro-cost charts of accounts.
What Is a Cost Center?
A cost center, or cost objective, is any entity, program, service, or activity whose cost is tobe determined. Other terms used are profit center and cost-responsibility center. Here, theseterms are used interchangeably.
Well-established cost centers are identified by means of charts of accounts. When newcosting tasks arise, new cost accounts are created and may become part of the overall costaccounting system. Many costing tasks require the construction of ad hoc cost models thatrely on, but are not always best served by, established charts of accounts.
Each institution has its formal and informal arrays of cost models. The formal ones arerepresented by the official chart of accounts normally used in budgeting and for costing tasksthat rely on various combinations of the budget-based cost account structure. Informal costaccounts include all costing activities undertaken by individual managers for the benefit oftheir respective departments and managerial activities. They may not be part of the officialcost accounting system, but may belong to a divisional or departmental subsystem used by a
particular manager. The availability of personal computers facilitates departmental costing,and operational cost modeling at the departmental level is growing rapidly. In the finalanalysis, every individual cost account and cost model is a cost center.
21 40

Cost Accounting in Higher Education
Basic Macro-Cost Charts of Accounts
Macro-costing, as understood here, refers to the practice of determining aggregate costs ofeasily identifiable, but relatively broad, institutional entities. These range from multicampussystems to individual academic and administrative departments. At larger universities, theyinclude the traditional colleges and professional schools. The following types of charts ofaccounts serve as a basis for such costing.
Cost Accounts by Jurisdictions or by Major Administrative Functions
The by-administrative-function cost account is the traditional pre-SFAS No. 117 highereducation chart of accounts and calls attention to jurisdictional cost centers.' Each account isrepresented by a budget for which an individual is responsible (figures 2.1 and 2.2).
Figure 2.1: Macro-Cost Account Structure with Aggregationsby Selected Administrative Functions
Total Institution
Instruction
Research
IResearch Centers, Institutes
--I Individual Research Projects
Public Service
Community Service
Academic Support
Student Services
Institutional Support
Plant M aintenance
Auxiliary Enterprises & Independent Activities
Cost Related to Physical Capital
4122
ST COPY AVAILABLE

Cost Centers and Macro-Cost Charts of Accounts Used in Higher Education
Sample Program Chartof Accounts
InstructionGeneral academic administrationOccupational and vocational instructionSpecial session instructionCommunity educationPreparatory and adult basic education
Adult basic educationCompensatory educationEnglish for foreign studentsGeneral educational developmentManpower-development trainingRemedial instruction
ResearchInstitutes and research centers
Individual research projects
Public ServiceCommunity serviceConferences and institutesCooperative extension servicesPublic lecturesRadio, TV, cable service*Regional medical programsTesting services
Academic SupportStudent services administration
Student admissions and recordsAdmissions officeRegistrar's office
Financial aid administrationCounseling and career guidanceHealth and infirmary serviceAcademic computing*
Institutional SupportGeneral administration
General administrative servicesGoverning boardChief executive officeChief academic officeChief financial and business office*
AccountingPlanning and budgeting
Administrative computingPurchasing
Community relationsDevelopment
Alumni relationsPublic information
Insurance administration*
23
Operations and Maintenance of PlantPhysical plant administration
Custodial servicesLandscape and groundsmaintenanceRepairs and renovation*Vehicle maintenance
Scholarships, Fellowships, andPrizes
For costing purposes, include only thoseitems that do not represent either staffbenefits or discounts (or equivalents) thatreduce the student's invoice.
Mandatory TransfersInterest and other costs directly related to
long-term or physical plant debt. * Includedhere are only those transfers that representcosts as defined below in contrast toreported expense.
Auxiliary EnterprisesStudent housing*Faculty housing, minus staff benefitportion*Student food services*
Catering, special events*University stores
Textbooks management*Other books management*General merchandise management*
Rental housing*
HospitalsAppropriate accounts as needed.
Independent OperationsAppropriate accounts as needed.
* Detail has been added.
Sources: James A. Hyatt, A Cost AccountingHandbook for Colleges and Universities(Washington, D.C.: NACUBO, 1983), 11. Seealso NACUBO and NCHEMS, Procedures forDetermining Historical Full Costs: The CostingComponent of the Information ExchangeProcedures., 2nd ed. (Washington, D.C.:NACUBO and Boulder, Colo.: NCHEMS, 1977),2.5 and Hans H. Jenny, Managerial FinancialReporting, NACUBO, Financial ManagementGuidebook Series, no. 2 (Washington, D.C.,1993), 179.

Cost Accounting in Higher Education
Doctoral Programs
Figure 2.2: Macro-Cost Account Structure ShowingSelected Academic Jurisdiction Functions
Total Institution
Central Administration
Campus A
I School of Arts andScience
Campus B Campus C
Professional School A Professional SchoolB
IndependentInstitute
Graduate Division UndergraduateDivision
Separately BudgetedActivities
Academic DivisionA
Academic DivisionB
Academic Division
Department2
ProgramN
Master Program
Primary or Core Program Cost Accounts
Under SFAS No. 117, primary program accounts replace or at the very least modify thetraditional by-administrative-function chart of accounts.. SFAS No. 117 stipulates thatinstitutions report their expenses by major programs and requires that many pooled andformerly separately reported support and indirect costs be allocated to these programs.Figures 2.3 and 2.4 illustrate two among several alternatives for charts of accounts.
Natural Costs
Every cost center and budget normally identifies so-called natural cost elements, alsoknown as object-line-item costs. While the details may differ from institution to institution,figure 2.5 provides a generalized example.2
At present, institutions feel most comfortable with the by-administrative-function type ofmacro-cost accounts. Under SFAS No. 117, institutions are urged but not compelled to reporton the basis of natural-cost elements. Some may find it disappointing that natural-costreporting is not required, since natural costs are the principal basis for informing on the typesand proportions of resources used.
3
24
BEST COPY AVAILABLE

Cost Centers and Macro-Cost Charts of Accounts Used in Higher Education
Figure 2.3: Primary Academic Programs and Professional Disciplines
Total Institution
InstructionDept.
ResearchSponsoredResearch
PublicService
AuxiliaryEnterprises
TotalInstitution
ArchitectureArts & Science
-
Natural SciencesBusiness School
-
Law SchoolSocial StudiesPhysical EducationMedicineEngineering
-
All Other °
Note: This chart assumes that support costs are fully allocated to the four primary programs for each academic cost center.
Figure 2.4: Primary Academic Programs and Support Activities
Total Institution Instruction ResearchPublicService
AuxiliaryEnterprises
Admin.& Inst.
Support O&M
AllOther
SupportTotal
Institution
ArchitectureArts & ScienceNatural SciencesBusiness SchoolLaw SchoolSocial StudiesPhysical EducationMedicineEngineeringAll Other
Total
Note: This chart keeps certain by-function support cost centers, but otherwise allocates support costs to primary programs.
Uniform Charts of Accounts
Various accounting authoritative bodies have created lists of charts of accounts that guide
institutions toward a more or less common approach. The U.S. Department of Education in
_ The Blue Book provides a recommended chart of accounts.3 Examples were offered by
NACUBO and the National Center for Higher Education Management Systems (NCHEMS),
recommending subaccount categories based on definitions set forth in the Joint Accounting
Group guidelines.4 The earlier NACUBO and NCHEMS account structures are by now well
entrenched. Below the level of aggregations in these exhibits, cost center details differ
among institutions.

Cost Accounting in Higher Education
Sample Cost Classification Matrix
A consolidated macro-cost chart ofaccounts is normally presented as a matrix,with by-function or program costs shownhorizontally and natural costs shownvertically. The example below combinesadministrative functions, cost-decisionresponsiblities, and selected natural costs.
Horizontal DisplayInstruction
Dean of law schoolDean of business school
Associate dean of undergraduateprogram
Associate dean of graduate divisionDean of arts and science division
Associate dean or director ofhumanitiesChair, department of English
Director of remedial writing andreading program
Associate dean of social sciencesChair, department of economicsChair, department of political
science
Student servicesDean of students
Director of student housingDirector of student lifeDirector of student financial aidDean of graduate admissionsDean of undergraduate admissions
Director of enrollment managementteam
Director of admissionspublications and public relations
Director of admissions databasemanagement
Director of new student financialaid
General institutional supportPresident's office
Relations with governing boardVice president for academic affairs
Assistant provost's officeVice president for finance and business
TreasurerComptrollerChief accounting officer
Data processingCost accounting
26
General institutionalTelecommunicationsAdministrative computer servicesLegal, auditing, and insurance services
Operation and maintenance of plantPlant manager's office
Assistant manager, shopsAssistant manager, purchasing and
inventoryShop supervisors
Auxiliary enterprisesStudent housing
Assistant for student amenitiesAssistant for custodial services in housing
Director of food serviceAssistant director of food service,
dining hallsAssistant director of food service, catering
Manager of university storesAssistant manager, textbooksAssistant manager, general merchandise
Vertical Display
Personnel compensation andprofessional services
SalariesFaculty, full-timeFaculty, part-timeOfficersOther exempt staff
WagesClericalCrafts and maintenanceCustodialSecurityStudents, work studyStudents, other
Professional servicesAcademicAdministrativeAuxiliaries and other
Staff benefitsRetirement planHealth planSocial securityWorkers' compensationUnemploymentDisabilityTuition benefit, on campusTuition benefit, off campusFood, lodging, and transportationOther

Cost Centers and Macro-Cost Charts of Accounts Used in Higher Education
ConsumablesSupplies
OfficeMaintenance supplies and materialsCustodialMedicalPhotographicPrinting, duplicating
Travel and entertainmentTransportation
Airline ticketsBus, railCar rentals, externalCar rentals, from poolMileage allowances
Living costsOvernightMeals, beverages
University guestsTransportationRoom and meals
UtilitiesElectricity, produced in-houseElectricity, purchasedCoal, fuel oil for heating and coolingNatural gasOther heating and cooling
InsuranceProperty and general liabilityKey executive life insuranceSpecial hazards insuranceStudent health and accident insuranceEmployee accident insuranceEmployee professional liability
insuranceSpecial events insurance
Printing and publishingMerchandise for resale, inventory
changeTextbooksOther booksGeneral merchandiseFood
Other inventory valuation adjustmentsMaintenance supplies and materialsBuilding supplies, materialsCoal, fuel oil, other
Contract services other thanprofessionalCustodialFacilities maintenanceEquipment maintenance
Wear-and-tear and replacement costsrelated to capital items or to changes invaluations of physical assets
Increasingly represented bydepreciation or facility-use charges.Includes all long-lived assets (morethan one year).
New equipment
Equipment replacementLibrary and other educationalacquisitions
BooksPeriodicals, serialsSoftwareVisual aids
Laboratories, classroomsEquipmentInstallationsImprovements
Financing costsShort-term interestLong-term interestOther debt service costs
27 46

Cost Accounting in Higher Education
The costing procedures discussed later in this manual require no changes in aninstitution's by-administrative-function or major-program chart of accounts other than thosethat may come about as a result of implementing SFAS No. 117 financial reports.
Figure 2.5: Natural-Cost Account Structure with Selected Object-Line ItemsAccount Structure Object-Line Items
Personnel Compensation Faculty salariesAll other salariesSupport staff wagesStudent wagesStaff benefitsProfessional services
Consumables SuppliesTravel, entertainmentTransportationTelecommunicationsContractual services, rentalsUtilitiesAdvertisingPrinting, publicationsInsurancePostage, freight, otherAll other
Capital-Related InterestCurrent cost of short-lived (one-year) assetsCurrent cost of depreciable long-lived assets
Equipment, furnishingsPlant improvementsAll other physical
facilities and equipment
By-Function Accounts and Natural Costs
However, by-function and by-program types of accounts must be excluded from thenatural-cost structure. Institutional budgets frequently include, among the natural cost items,some costs that really belong on the by-function list. Even when shown in a lump sum, anyaccount whose costs represent a combination of personnel, consumables, and capital costsmust not be included in a natural-cost classification. Examples are natural or object-linecosts such as commencement, alumni weekend, and even summer school; all arecombinations of personnel compensation, consumables, and sometimes capital costs.
In other instances, natural costs appear on by-function lists. For instance, Hyatt andNCHEMS list utilities in the by-function classification.5 Figure 2.5 classifies utilities as anatural cost. Of course, there could be a functional account called "utilities administration"
28
47

Cost Centers and Macro-Cost Charts of Accounts Used in Higher Education
where the charge for utilities proper is a natural cost, supplemented by other costs forpersonnel compensation and whatever other resources it takes to manage the utilitydepartment. It is therefore important that institutions distinguish clearly between by-function
and natural costs. Charts of accounts devoted to costing as defined here should be reviewed
in order to correct any inconsistencies.
Other Dimensions for Macro-Cost Account Classification
The preceding charts of accounts form the basis for most macro-costing tasks, but theyhave one serious limitation: They do not zero in on most of the program-, activity-, and
process-cost questions that managers and others must answer each day. Therefore, these
most-used accounts constitute an inadequate basis for answering many of the truly interesting
costing questions that arise almost daily in higher education. The following additionalselected classification criteria supplement the traditional macro-cost accounts.
Primary Versus Support Programs
The important distinction between primary and support program costs is highlighted in
SFAS No. 117. The primary missions of colleges and universities are said to be
instruction,research,public service, andauxiliary enterprises, including hospitals and other independent operations.
Everything else is support. Instruction and research are normally viewed as the primary
academic missions. For some institutions, hospitals and independent operations haveacademic dimensions. For the large majority of independent colleges, public service is
minuscule and thus not a distinct mission.
Primary Academic Programs and Instruction
Instruction at most universities is carried out at several professional schools and colleges,
such as those of architecture, the natural and the social sciences, law, medicine, engineering,
the fine arts, and physical education. These are illustrated in figures 2.3 and 2.4. Instruction,
research, and public service can be subsets of the primary programs represented by schools
of business, law, architecture, and the fine arts. At principally undergraduate institutions,
divisional or departmental disciplines are normally substituted for, these professional
classifications.Instructional costs, in the narrow sense, are often classified according to a variety of other
programmatic dimensions:
The entire undergraduate componentLower level (freshman and sophomore years) and upper class (junior and senior
years) undergraduate program
29
48

Cost Accounting in Higher Education
The cost of common course requirements, such as a generally required freshman orsenior coursesThe cost of a majorThe cost of an honors or senior independent study programThe cost of the junior-year-abroad programThe cost of tutorial and remedial instructionTotal graduate program costsThe cost of specific graduate degrees at the master's and doctoral levels
These and many similar elements of the instructional program give rise to theirspecialized cost studies and require specialized charts of accounts when they are not alreadyrepresented by a budget account.
Core Versus Noncore Programs
The core versus noncore comparison is similar to the primary versus support programdistinction, but also has special academic connotations. How do institutions define their so-called core programs? Is the core what is required to obtain a degree, a major, a requiredacademic concentration? Professional schools and academic departments have studyrequirements that are central to their particular disciplines and offer courses and methods ofstudy that fulfill them. In addition, students may be required to take or can voluntarily choosecourses and study topics which are not directly related to their professional field ofconcentration. As institutions define their core programsif they canthey can also try todetermine their costs and distinguish them from the costs of noncore programs. Thetraditional by-function chart of accounts does not normally accommodate cost questions thatarise from the core/noncore program distinction.
Interdepartmental Administrative and Operational Costs
In recent years, college management has begun to identify certain costing issues that arenot addressed directly in existing charts of accounts, partly because they cut across manyjurisdictions and partly because institutions have novel ways of looking at costs. Amongthese, the following have become prominent:
Marketing costsStudent recruitment or enrollment management costsFund-raising (annual funds, capital campaigns) costsInstitutional advertising and public relations costs
Employee benefit costsHealth plan costsRetirement benefits costsGovernment-mandated employee benefits
Risk management costsAsset (insurance, prevention, security) protectionEmployee liability (insurance, training, prevention) costsPersonal security (personnel, students, visitors) costs
49

Cost Centers and Macro-Cost Charts of Accounts Used in Higher Education
Compliance costsEEOC hiring and employment compliance costsADA, OSHA, and other compliance costs
Transportation costsThe cost of maintaining the vehicle poolThe cost of transportation on and off campus of employees, students, supplies,
materials, etc.The cost of travel
Costs related to federal and state programsThe cost of grants management (federal, state)Reporting requirements costsRequired matching-funds program costs
This list could be expanded easily. In not a single instance can these types of costs be
ascertained simply by looking up the pertinent cost account or budget. By themselves, they
are not higher education program costs, they seldom fall neatly into a specific by-functionslot, they always cut across two or more jurisdictions, and they all are support costs.
Activity-Based Costs
Finally, most operational costing tasks tend to zero- in on discrete institutional anddepartmental activities. Few of these are addressed by established charts of accounts. Chapter
7 will discuss activity-based and process costing.
Notes1. Statement of Financial Accounting Standards No. 117: Financial Statements of Not-for
Profit Organizations, Financial Accounting Series No. 127-B (Norwalk, Conn.: Financial
Accounting Standards Board of the Financial Accounting Foundation, June 1993).
2. Hans H. Jenny, Managerial Financial Reporting, NACUBO, Financial Management
Guidebook Series, no. 2 (Washington, D.C., 1993), 179.3. U.S. Department of Education, The Blue Book (Washington, D.C., July 1995).
4. James A. Hyatt, A Cost Accounting Handbook for Colleges and Universities (Washington,
D.C.: NACUBO, 1983), 11. Douglas J. Collier and Richard H. Allen, Data Providers'Guide, vol. 1 of Higher Education Finance Manual (Denver, Colo.: NCHEMS, 1980), 68.
5. Hyatt, A Cost Accounting Handbook, 13. Collier and Allen, Data Providers' Guide, 69.
31
50

Institutionwide Full Costs of Primary By-FunctionPrograms Under Varying Allocation Rules
This chapter introduces the case of Research University, a hyphothetical independentresearch university. A sequence of exhibits highlights how "primary" program costs changeas more support costs are allocated to them.
Research University's Board Requests Cost Information
On June 30, 1995, Research University's governing board requested from the institution'spresident a draft proposal on how the university might henceforth report certain specifictypes of macro-costs in a supplement to the normal audited financial report. The gist of theboard's cost request is as follows:
1. An aggregate or macro-cost figure for the institution as a whole using the costdefinition of chapter 1
2. Macro-cost figures for the principal administrative functions traditionally identifiedby the university's audited year-end financial report, both before and after theallocation of support costs
3. Macro-cost figures for the university's principal professional schools and colleges4. Departmental costs within the natural and mathematical sciences program
All cost figures must include the cost of physical capital as a depreciation charge. Theboard asked specifically for realistic estimates of depreciation costs based on historical assetvaluations and useful-life estimates. The board stipulated that all cost models must make aclear distinction between operating costs and costs associated with the financing and use ofphysical assets. The board also indicated that, once agreement had been reached on how toimplement such costing in the future, funds would be appropriated to create any necessaryhistorical databases for these four types of costs.
33
51

Cost Accounting in Higher Eduction
[InstaaMennris Fun Cczb
Of the four basic costing assignments given by the board, the first two concerned thequestions of how macro-costs for the institution as a whole and by-function costs shouldhenceforth be reported. In view of the fact that financial reporting practices are changingunder SFAS No. 117, the university is offering a choice of by-function cost reportingmodels.'
The Four-Tier Full-Cost Model
The four-tier full-cost (FTFC) model described in chapter 1 distinguishes betweenoperating costs and the three types of costs that stem from the university's physical capitalinvestments. This model will serve as a basis for all macro-costing illustrations found in thischapter. Figure 3.1 summarizes Research University's full costs. Subsequent exhibits showhow different allocation procedures distribute specific types of costs among the majoradministrative functions. Each exhibit clearly identifies each cost tier and the respectiveallocation bases and parameters. What is important is how and why the cumulative by-function costs change for each cost model and after each cost allocation procedure.
Figure 3.1: Research University's Four-Tier Full Costs in the Aggregate ($ in 1,000s)
Tiers Items Costs by TiersGoing Concern
BalancesCurrent Revenues* $308,723
One Personnel $175,444Consumables 102,383
Total 277,827 30,896
Two' Debt Costs 4,238Total 282,065 26,658
Three One-Year Assets 2,446Total 284,511 24,212
Four Depreciation 19,256Total 303,767 4,956
* For current revenues definition, please see chapter I.
Five Casa
Figure 3.2 compares tier-four or full costs for each of the five costing alternativespresented below and makes clear that a program's full cost is definitely determined by howand to what degree various cost pools are being dispersed among a given list of cost centers.
34
52

Institutionwide Full Costs of Primary By-Function Programs Under Varying Allocation Rules
Figure 3.2: Comparison of Tier-Four or Full Costs for Major Administrative Functionsat Research University Using Different Cost Allocation Procedures ($ in 1,000s)
ProgramsBy Function
(Figs. 3.3 & 3.4)
Debt &Depreciation
Costs Allocated(Fig. 3.5)
Other PooledDirect Costs
Allocated(Fig. 3.6)
All Support toPrimary Program
(Fig. 3.7)Primary
Instruction $78,249 $87,931 $142,267 $164,673
Research 32,781 34,534 48,340 51,750
Public Support 6,384 6,427 8,003 8,682
Auxiliary Enterprises 59,106 59,106 72,366 78,663
Total Primary 176,520 187,998 270,976 303,768
SupportAcademic 21,356 21,737 696 0
Executive Administration 15,673 15,885 4,761 0
Public Relations 11,281 11,293 3,275 0
Student Services 20,515 20,673 8,452 0General Institutional 14,244 14,366 5,923 0
O&M 37,348 24,975 9,670 0
Other 6,830 6,840 15 0
Total Support 127,247 115,769 32,792 0
Total 303,767 303,767 303,767 303,767
Note: Because of rounding, figures may not add up exactly to totals.
This table shows the obvious: Primary program costs increase as more and more supportcosts are allocated to primary cost centers. The support cost component declines graduallyand disappears when all of its costs have been allocated to the primary programs. Costsamong institutions for like by-function programs often differ depending on how many pooleddirect and indirect support costs have been allocated to primary programs.
Each vertical full cost array represents a specific costing model, and each is in its ownright a correct representation of the university's costs. Throughout, the university's aggregatefull cost is $303,767,000. The principal difference is how and to what degree support costshave been allocated in each model.
First, the only changes in the pre-SFAS No. 117 audit data concern the elimination ofcertain noncost expenditures (i.e., debt reduction) and the identification of one-year assetacquisitions. Second, costs related to long-term debt and depreciation are charged directly tothe respective plant accounts of operations and maintenance (O&M) and auxiliaryenterprises. Third, equipment acquisitions and the associated depreciation costs are chargeddirectly to the acquiring academic or administrative departments. In general, the universityhas moved gradually toward less pooling in order to maximize direct costing within thetraditional by-function chart of accounts, in part anticipating the direct-costing opportunitiesinherent in SFAS No. 117.
Which of the five models summarized in figure 3.2 represents best the costing assignmentgiven to the university? Which model reflects best the post-SFAS No. 117 reporting
3553

Cost Accounting in Higher Eduction
requirement? What other allocation alternatives should be explored? Which model or modelswill the board choose as future cost-reporting vehicles for the university? To help answerthese questions, a look at each model is appropriate.
Model One: Standard By-Function List of Program Costs
Figure 3.3 describes the FTFC structure for the university's major by-function programsthat have been identified in the year-end audited financial report to date.
Figure 3.3: Model One-Four-Tier Full Costs by Major Administrative Functionsat Research University ($ in 1,000s)
Programs by Function Tier One
Long-Term
Debt Cost Tier Two
One-YearAssets
TierThree
Deprec.Cost
TierFour
(Audit)Instruction $77,425 $77,425 $824 $78,249 $78,249Research 32,520 32,520 261 32,781 32,781Public Service 6,330 6,330 54 6,384 6,384Academic Support 21,041 21,041 315 21,356 21,356Executive Administration 15,615 15,615 58 15,673 15,673Public Relations 11,255 11,255 26 11,281 11,281Student Services 20,447 20,447 68 20,515 20,515General Institutional 14,086 14,086 158 14,244 14,244O&M 22,025 $3,098 25,123 392 25,515 $11,833 37,348Education & General 220,744 3,098 223,842 2,156 225,998 11,833 237,831Auxiliary Enterprises 50,258 1,140 51,398 285 51,683 7,423 59,106Other 6,825 6,825 5 6,830 6,830
Total 277,827 4,238 282,065 2,446 284,511 19,256 303,767Notes: The University allocates one-year assets dime ly to each acquiring department. Long-term debt costs and depreciation are charged to facilities inoperations and maintenance (O&M) and auxiliary enterprises respectively.
Model Two: Standard By-Function Costs Distinguishing Primary from Support Activities
Figure 3.4 is identical to figure 3.3 in every respect, except that the primary programaccounts are listed separately from the support accounts. None of the four cost tiers change.This format could be an appropriate post-SFAS No. 117 cost-reporting option, provided theuniversity has implemented all outstanding direct-cost allocation and accounting changes.
Model Three: Allocating Long-Term Debt and Depreciation Costs to Facilities in Primaryand Support Activities
Figure 3.5 illustrates the effect on tier-two through tier-four costs when long-term debtand depreciation costs are distributed from O&M to the primary and support areas where theoriginal debt cost originated. Since the university charges these costs directly to each plantaccount with debt and does not pool them, they transfer relatively easily to each affectedfunction. In most instances, no special allocation procedure is needed. In the few instanceswhere plant with debt is shared by two or more primary and support functions, debt costs areallocated on the basis of assigned square footage.
36
54

Institutionwide Fuil Costs of Primary ay-Function Programs Under Varying Allocation Rules
After the allocation. $1,125,000 of long-term debt cost remains in the O&M account.
$3,090.000 was transferred to primary programs. and $23.000. was shifted to academic
support. Tier-two primary costs increase by $1,407.000 for instruction, by $528,000 for
research, and by $15,000 for public service. Debt cost for auxiliary enterprises does not
change.
Research University's'Accounting Practices.Since the pre-SFAS No. 117 starting point for cost allocation differs among institutions, some information on
how Research University has previously allocated costs is essential. Thsfollowing is a capsule summary of its
principal.pre-SFAS No..117 accounting policies:
. An extensivesystem of internal pricing and chargebacks exists for direct-cost transfers; first-among
support departments, and second from support to primary programs. All purchases from external.
vendors are charged directly to the appropriate natural-cost category of the acquiring department.Internally rendered services are sold to departments on a cost,of-labor-and-materials basis, with a
variety of markups for handling, incidentals, and overhead. Utility costs are charged directly to each
facility on either a metered basis (for facilities with meters) or prorated on a total-square-footage basis
(for facilities without meters). F6r some costing tasks, electricity costs are appropriately allocated on
the basis of student or staff usage.Y Personnel benefitsa direct costwere pooled by functions in the past; but are now charged directly
to each departmentShared staff-costs are apportioned among the affected departments. &en
benefits that do not run through the payroll system, such as.theluition benefit; staff travel benefit, and
research stipends, are no longer pooled and charged directly to the departments.
The net cost of long-term plant debt is charged directly to plant with debt.
The university has adopted a useful-life-based depreciation policy.. Plant and equipment depreciation is
charged directly to each facility and computed on the basis of the undepreciated historical value of
each facility. Equipment depreciation is charged directly to each acquiring department. Pooled or
shared depreciation costs are allocated on the basis of assigned or total square footage, whichever is
more logical.Scholarships, fellowships, and prizes were reported as an educational and general expense in the
past; they are now treated as a discount. Prizes and certain awards for merit are treated as a tier-one
cost.The costs contained in the university's by-function support accounts reported in the year-end audit
represent the remaining cost pools whose allocation is the subject of this chapter.
For internal financial reporting and costing, the university will henceforth deduct student aid grants
from tuition and fees, room and board, and other relevant auxiliary enterprise revenues in proportion to
their respective weights as they are reflected in the student's financial aid budget and package.
37 55

Cost Accounting in Higher Eduction
Selected.Principles.Governing Cost Allocation
The Affinity RequirementThe leading literature on costing, whether it applies to for- or not -for- profit organizations, stipulates that cost,:
allocation bases must have a high degree of affinity with the cost elem- ent-that-is to be-allocate&This-means
that there must be some logical or cause-and-effect connection. While,mosthigher education cost allocationpractices involve allocation bases that have such affinity, some do not:Someallocation procedures-areimposed upon institutions by Circular A-21 and similar federal government pronouncements-. Scimetimes these
external rules actually prescribe specific cost accounting details that.violate the affinity principle. Sometimesinstitutions choose allocation bases for their simplicity rather than their logical:affinity.
The Desired Degree of Precision in CostingCosts should be as precise as is possible under each institution's particularcircumstances::The-costing.
literature addresses this issue. by stipulating that costing should be carried.outwithin.a framework-Of economic :
feasibility. What may not be economically feasible in 1950, may be so:in the:year 2000. As accounting
technology and computer capabilities advance, more precision can:be.broughtto costing;This is.one reasonwhy direct costing is on the increase and will continue to expand. Cottpooling was introduced for-reasons of
economy and. simplicity, It also reflected, compared to today, a relatively primitive and-cumbersome. state. ofaccounting-technology. Modem computer-based cost accounting technology; on the other hand;:is versatile,
flexible, and. facilitates multiple.complex cost transfers. Simplicity in costing and percentage allocation-of costs
reduces costing precision. Several examples in this and subsequent-chapters demonstrate that.precision in
costing can be enhanced even within the framework of large cost pools...
Figure 3.4: Model Two-Four-Tier Full Costs at Research University, withPrimary and Support Programs Reclassified ($ in 1,000s)
Programs by Function Tier One
Long-Term Debt
Cost Tier Two
One-Year
AssetsTier
ThreeDeprec.
Cost
TierFour
(Audit)
Instruction $77.425 $77.425 $824 $78,249 $78,249
Research 32.520 32.520 261 32.781 32.781
Public Service 6,330 6.330 54 6.384 6.384
Auxiliary Enterprises 50,258 $1.140 51.398 285 51,683 $7,423 59,106
Total Primary 166.533 1,140 167.673 1,424 169.097 7,423 176,520
Academic Support 21,041 21.041 315 21.356 21.356
Executive Administration 15,615 15.615 58 15.673 15.673
Public Relations 11,255 11.255 26 11.281 11,281
Student Services 20.447 20.447 68 20.515 20.515
General Institutional 14.086 14.086 158 14,244 14,244
O&M 22.025 3.098 25,123 392 25,515 11,833 37,348 1
Other 6,825 6.825 5 6.830 6,830
Total Support 111,294 3.098 114,392 1,022 115,414 11,833 127,247
Total 277.827 4.238 282.065 2.446 284,511 19.256 303,767
38
56

Institutionwide Full Costs of Primary By-Function Programs Under Varying Allocation Rules
Depreciation costs appear in theuniversity's individual plant accounts,and because of detailed equipmentinventories, the university is able toassign equipment depreciation to
individual departments. The cost ofdepreciation in figure 3.5 is thusallocated precisely to each primary andsupport activity. As a result,$10,400,000 of depreciation costs movesfrom the O&M account to other primaryand support accounts.
Model Four: Allocating SelectedSupport Costs to Primary Activities
Some separately pooled support costsare actually direct costs when seen fromthe perspective of specific primaryprograms. Three obvious examples areacademic support, student admissions,and the registrar's and student recordsoffices. Even some or all costs of studentlife could be assigned directly to
instruction, but they are not allocatedthere in this model. Figure 3.6 illustratesthe effect of such cost transfers on tier-one and full costs. For instance,academic support ($21,041,000) is all-ocated to instruction (70.42 percent) andresearch (29.58 percent), and the ,
admissions and registrar's cost($20,447,000) is extracted from studentservices and allocated fully to instruc-tion. Without its primary instructionalmission, the university would have noacademic support, admission, or reg-istrar functions.
Other direct support costs wereallocated on the basis of the original tier-one cost structure, and the allocationbases used are total tier-one costs,personnel compensation costs, and
Fiequentiy Used.. Allocation Bases in::3y= Function. Costing
The listidentifiesIthe allocitiontases used..most.frequently in-highereducation.by-functionvooled.costallocation procedures::.:
Academic administration"Personnel compensationArbitrary prorating ruleTiMe or service studyStudent credit hours--Direct costs.- :
Ubraries..- .
Personnel compensation-Total hours open or used..
. Student credit hours.Circulation and-checkout:FTE faculty-sand.FTE-student-use:factor-Direct costs-...',.
Student servicesr,-,;Student credit hoursStudent applications and matriculations factor:Number of-degrees awarded .
Number of.coursesoffered..Personnel:compensation-- J."
Number of applications-processed:Number of student registrations probessed.,::-Number of student aid applications-processor:Ls.Number of matriculating students-with-student aid .
Academic computing ::-Number of work stations in use--
.. Hours-of usageNumber of projects processed,.FTEstudentt and.FTE faculty -use factor-.FTEstudent usage; time study.Direct costs-.
Executive managementPersonnel compensationArbitrary prorating rulesTime studyStudent credit hoursDirect costs:
Plant operationsSquare feet occupied or assignedValue of plantDirect costs::Technical anctother usage measures,,Personnel compensation
Staff benefits-.-..Salaries and wages-Number of personnel
Long-term debt costs:-Value of assets financedSquare footage
DepreciationSquare feet.of facilities.Value of facilities:.
39
57

Cost Accounting in Higher Eduction
square footage. The respective allocation percentages can be found in columns K,. L, and Mof the exhibit. Each dollar amount and the account to which it is transferred are shown. Theallocation bases are noted on the right for each category of costs.
Figure 3.5: Model Three-Four-Tier Full Costs at Research University, with Long-Term Debt andDepreciation Costs Allocated to Cost Centers as Direct Costs ($ in 1,000s)
Programs by Function Tier One
Long-Term Debt
Cost Tier Two
One-YearAssets
TierThree
Deprec.Cost
Tier Four(NewAudit)
Instruction $77,425 $1,407 $78,832 $824 $79,656 $8,275 $87,931Research 32,520 528 33,048 261 33,309 1,225 34,534Public Service 6,330 15 6,345 54 6,399 28 6,427Auxiliary Enterprises 50,258 1,140 51,398 285 51,683 7,423 59,106
Total Primary 166,533 3,090 169,623 1,424 171,047 16,951 187,998Academic Support 21,041 23 21,064 315 21,379 358 21,737Executive Administration 15,615 0 15,615 58 15,673 212 15,885Public Relations 11,255 0 11.255 26 11,281 12 11,293Student Services 20,447 0 20,447 68 20,515 158 20,673General Institutional 14,086 0 14,086 158 14,244 122 14,366O&M 22,025 1,125 23,150 392 23,542 1,433 24,975Other 6,825 0 6,825 5 6,830 10 6,840
Total Support 111,294 1,148 112,442 1,022 113,464 2,305 115,769
Total 277,827 4,238 282,065 2,446 284,511 19,256 303,767
Model Five: Allocating All Tier-One Support Costs to Primary Programs
The preceding model still leaves some indirect support costs unallocated. Figure 3.7illustrates the effects on tier-one and full costs when these remaining tier-one support costsare allocated to primary programs. The tier-one cost base (column B) reflects the figure 3.6adjustments. The allocation procedures are similar to those used in figure 3.6, except thatnew figure 3.6 primary program percentage allocation bases (columns K, L, and M) are used.Simultaneously, this model also allocates the remaining tier-two through tier-four costs.
Total support costs could also have been allocated to the four primary programs withoutusing the figure 3.6 intermediary step. But this would have changed the individual allocationsand the final tier-four costs and created still another primary fully allocated program costmodel (not shown here).
Post-SFAS No. 117 Alternative Reporting Formats
Although the program structure shown in these exhibits summarizes how higher educationhas traditionally looked at primary and support programs, many institutions have their ownideas and preferences. The following examples are presented to the Research Universitygoverning board as a basis for choosing the university's final reporting formats.
58 40

Figu
re 3
.6: M
odel
Fou
r-A
lloca
ting
Dir
ect S
uppo
rt C
osts
at R
esea
rch
Uni
vers
ity to
Pri
mar
y Pr
ogra
ms
($ in
1,0
00s)
Prog
ram
s(A
)
Tie
r O
neB
efor
e(B
)
Supp
ort
Cos
ts(C
)
New
Tie
r O
neC
osts
(D)
Lon
g-T
erm
Deb
tC
ost
(E)
Tie
rT
wo
(F)
One
-Y
ear
Ass
ets
(G)
Tie
rT
hree
(H)
Dep
rec.
Cos
t(I
)
Tie
rFo
ur(N
ewA
udit)
(J)
% o
fPe
rson
nel
(K)
% o
fT
ier
One (L)
%
Squa
reFe
et(M
)Pr
imar
yIn
stru
ctio
n$7
7,42
5$5
4,33
6$1
31,7
61$1
,407
$133
,168
$824
$133
,992
$8,2
75$1
42,2
6734
.55%
27.8
7%32
.98%
Res
earc
h32
,520
13,8
0646
,326
528
46,8
5426
147
,115
1,22
548
,340
12.8
511
.71
11.2
6
Publ
ic S
ervi
ce6,
330
1,57
67,
906
157,
921
547,
975
288,
003
2.58
2.28
2.55
Aux
iliar
y E
nter
pris
es50
,258
13,2
6063
,518
1,14
064
,658
285
64,9
437,
423
72,3
6621
.26
18.0
922
.70
Tot
al P
rim
ary
166,
533
82,9
7824
9,51
13,
090
252,
601
1,42
425
4,02
516
,951
270,
976
71.2
459
.94
69.4
9
Supp
ort
Aca
dem
ic S
uppo
rt21
,041
-21,
041
023
2331
533
835
869
65.
257.
574.
58E
xecu
tive
Adm
inis
trat
ion
15,6
15-1
1,12
44,
491
04,
491
584,
549
212
4,76
16.
755.
623.
55
Publ
ic R
elat
ions
11,2
55-8
,018
3,23
70
3,23
726
3,26
312
3,27
51.
554.
052.
60St
uden
t Ser
vice
s20
,447
-12,
221
8,22
60
8,22
668
8,29
415
88,
452
3.21
7.36
3.55
Gen
eral
Ins
titut
iona
l14
,086
-8,4
435,
643
05,
643
158
5,80
112
25,
923
4.42
5.07
2.38
O&
M22
,025
-15,
305
6,72
01,
125
7,84
539
28,
237
1,43
39,
670
6.80
7.93
12.3
5
Oth
er6,
825
-6,8
250
00
55
1015
0.78
2.46
1.50
Tot
al S
uppo
rt11
1,29
4-8
2,97
728
,317
1,14
829
,465
1,02
230
,487
2,30
532
,792
28.7
640
.06
30.5
1
Tot
al27
7,82
71
27,8
284,
238
282,
066
2,44
628
4,51
219
,256
303,
767
100.
0010
0.00
100.
00
5 Cl) ;4: 0 11 C 0 C
l)0 0 3 C C) z
Not
es: A
dded
to:
Inst
ruct
ion
Res
earc
hPu
blic
Serv
ice
Aux
iliar
yE
nter
pris
esT
otal
0 co ST)
C)
From
Aca
dem
ic S
uppo
rt$1
4,81
7$6
,224
$0$0
$21,
041
Dir
ect
Col
umn
LC
From
Exe
cutiv
e A
dmin
istr
atio
n5,
395
2,00
740
33,
320
11,1
24Pe
rson
nel C
ompe
nsat
ion
Col
umn
KFr
om P
ublic
Rel
atio
ns3,
889
1,44
629
02,
393
8,01
8Pe
rson
nel C
ompe
nsat
ion
Col
umn
KFr
om S
tude
nt S
ervi
ce12
,221
00
012
,221
Dir
ect t
o In
stru
ctio
n$1
2,22
1Fr
om G
ener
al I
nstit
utio
nal
3,92
51,
649
321
2,54
88,
443
Dir
ect T
ier
One
Col
umn
LFr
om O
&M
7,26
42,
480
562
5,00
015
,305
% o
f Sq
uare
Fee
tC
olum
n M
co
From
Oth
er6,
825
00
06,
825
Dir
ect
Col
umn
LT
otal
54,3
3613
,806
1,57
613
,260
82,9
780
Com
puta
tions
for
Exe
cutiv
eA
dmin
istr
atio
nFr
om E
xecu
tive
Adm
inis
trat
ion
of$1
5,61
5, a
lloca
te to
:34
.55%
12.8
5%2.
58%
21.2
6%10
0.00
From
Col
umn
KC cm cn
Equ
als
$5,3
95$2
,007
$403
$3,3
20$1
1,12
4Se
e ab
ove
59B
ES
T C
OP
Y A
VA
ILA
BLE
60

Figu
re 3
.7: M
odel
Fiv
e-Fo
ur-T
ier
Full
Cos
ts a
t Res
earc
h U
nive
rsity
, with
Dir
ect S
uppo
rt C
osts
Allo
cate
d to
Pri
mar
y C
ost
Cen
ters
, Lea
ving
Res
idua
l or
Indi
rect
Sup
port
Pro
gram
Cos
ts (
$ in
1,0
00s)
Prog
ram
s(A
)
Figu
re 3
.6T
ier
One
(B)
Supp
ort
Cos
ts(C
)
New
Tie
rO
ne C
osts
(D)
Lon
g-T
erm
Deb
t Cos
t(E
)T
ier
Tw
o(F
)
One
-Yea
rA
sset
s(G
)
Tie
rT
hree
(H)
Dep
rec.
Cos
t(I
)
Tie
r Fo
ur(N
ewA
udit)
(J)
% o
fPe
rson
nel
(K)
% o
f T
ier
One (L)
% S
quar
eFe
et(M)
Prim
ary
Inst
ruct
ion
$131
,761
$19,
404
$151
,165
$2,1
19$1
53,2
84$1
,522
$154
,806
- $9
,867
$164
,673
52.8
2%52
.81%
61.2
5%R
esea
rch
46,3
263,
110
49,4
3659
850
,034
378
50,4
121,
338
51,7
5021
.25
18.5
76.
25Pu
blic
Ser
vice
7,90
658
78,
493
288,
521
100
8,62
161
8,68
24.
283.
171.
15
Aux
iliar
y E
nter
pris
es63
,518
5,21
668
,734
1,49
370
,227
446
70,6
737,
990
78,6
6321
.65
25.4
631
.35
Tot
al P
rim
ary
249,
511
28,3
1727
7,82
84,
238
282,
066
2,44
628
4,51
219
,256
303,
767
100.
0010
0.00
100.
00Su
ppor
tA
cade
mic
Sup
port
00
Exe
cutiv
e A
dmin
istr
atio
n4,
491
-4,4
910
00
00
00
Publ
ic R
elat
ions
3,23
7-3
,237
00
00
00
0
Stud
ent S
ervi
ces
8,22
6-8
,226
00
00
00
0
Gen
eral
Ins
titut
iona
l5,
643
-5,6
430
00
00
00
O&
M6,
720
-6,7
200
00
00
00
Oth
er0
00
00
00
00
Tot
al S
uppo
rt28
,317
-28,
317
Tot
al27
7,82
80
277,
828
4,23
828
2,06
72,
446
284,
513
19,2
5630
3,76
710
0.00
100.
0010
0.00
Not
es:
81
Inst
ruct
ion
Res
earc
hPu
blic
Serv
ice
Aux
iliar
yE
nter
pris
es T
ier
Tot
alA
dded
to:
Tie
r O
neT
ier
One
Tie
r O
neO
neT
ier
One
From
Aca
dem
ic S
uppo
rt$0
$0$0
$0$0
Dir
ect
From
Exe
cutiv
e A
dmin
istr
atio
n2,
372
954
192
972
4,49
1%
Per
sonn
el C
ompe
nsat
ion
Col
umn
KFr
om P
ublic
Rel
atio
ns1,
710
688
139
701
3,23
7%
Per
sonn
el C
ompe
nsat
ion
Col
umn
KFr
om S
tude
nt S
ervi
ce8,
226
00
08,
226
Dir
ect
$8,2
26Fr
om G
ener
al I
nstit
utio
nal
2,98
01,
048
179
1,43
75,
643
% D
irec
t Tie
r O
neC
olum
n L
From
O&
M4,
116
420
772,
107
6,72
0%
of
Squa
re F
eet
Col
umn
MFr
om O
ther
00
00
0D
irec
tT
otal
Tie
r O
ne19
,404
3,11
058
75,
216
28,3
17T
otal
Tie
r T
wo
$1,1
4823
23D
irec
t68
970
1335
31,
125
% o
f Sq
uare
Fee
tC
olum
n M
Tot
al T
ier
Thr
ee$1
,022
365
2639
1D
irec
t33
311
720
161
631
% o
f D
irec
t Tie
r O
neC
olum
n L
Tot
al T
ier
Four
$2,3
0548
512
497
Dir
ect
1,10
711
321
567
1,80
8%
of
Squa
re F
eet
Col
umn
MT
otal
Allo
cate
d4,
475
Sam
ple
Com
puta
tion
for
Tie
r T
wo
Allo
cate
Tie
r T
wo
on B
asis
of
Squa
re61
.25%
6.25
%1.
15%
31.3
5%10
0.00
%Fr
om C
olum
n M
Feet
fro
m C
olum
n M
To
Be
Allo
cate
d: $
1,14
8D
irec
t = $
23; P
erce
ntag
e =
$1,
125
Equ
als
($1,
125
x pe
rcen
tage
sha
re)
$689
$70
$13
$353
$1,1
25

Institutionwide Full Costs of Primary By-Function Programs Under Varying Allocation Rules
The By-Function Model with Explicit Indirect Support Costs
The by-function model with explicit indirect support costs preserves the traditional by-function support accounts, isolates only true indirect costs, and thus ensures considerablehistorical trend continuity. The remaining indirect support costs ($28,317,000) areconsiderably smaller than those encountered in the pre-SFAS No. 117 version($111,294,000, from figures 3.3 and 3.4) because primary programs now reflect supportcosts, which had been pooled.
The following summary single-column cost statement, figure 3.8, uses figure 3.6 data. Inthis version, tier-two through tier-four costs have not been allocated. Total Tier One showsthe operating result, and Total Tier Four highlights the excess of current revenues overcosts, excluding certain transfers to and from funds.
Figure 3.8: Summary Single-Column Presentation of Four-Tier Full Costsof Primary and Support Programs at esearch University ($ in 1,000s)
Tiers Items and Programs Cost Tiers P&L BalanceCurrent Revenues $308,723
One Instruction $131,761Research 46,326Public Service 7,906Auxiliary Enterprises 63,518
Total Primary Programs 249,511 59,212Executive Administration 4,491Public Relations and Development 3,237Student Services 8,226General Institutional 5,643O&M 6,720
Total Support 28,317 30,895Total Tier One 277,828 30,895
Two Long-Term Debt Cost 4,238Total Tier Two 282,066 26,657
Three One-Year Assets 2,446Total Tier Three 284,512 24,211
Four Depreciation 19,256Total Tier Four 303,767 4,956
Note: Because of rounding, figures may not add up exactly to totals.
Figure 3.9, also based on figure 3.6 data, shows the same result after tier-two through tier-four costs have been allocated to primary and support activities. The multicolumn formatprovides a clearer picture of where tier-two through tier-four costs are being allocated. Inboth figures 3.8 and 3.9 the issue is how much, if any, support cost should be reportedseparately.
The Simplified y-Function Format With Primary Full Costs Only
Figure 3.10 is a summary report of model five (figure 3.7). Like figure 3.9, it is an FTFCmodel. In this format the four primary programs absorb all support costs.
43
63

Cost Accounting in Higher Eduction
Figure 3.9: Four-Tier Full-Cost Report by Major Functions at Research University,with All Costs Allocated to Primary and Support Activities ($ in 1,000s)
Programs Tier One Tier TwoTier
Three Tier Four Full CostsP&L
BalanceCurrent Revenues $308,723Instruction $131,761 $1,407 $824 $8,275 $142,267 166,456Research 46,326 528 261 1,225 48,340 118,116Public Service 7,906 15 54 28 8,003 110,113Auxiliary Enterprises 63,518 1,140 285 7,423 72,366 37,747
Total Primary 249,511 3,090 1,424 16,951 270,976 37,747Academic Support 0 23 315 358 696 37,051Executive Administration 4,491 0 58 212 4,761 32,290Public Relations and Development 3,237 0 26 12 3,275 29,015Student Services 8,226 0 68 158 8,452 20,563General Institutional 5,643 0 158 122 5,923 14,640O&M 6,720 1,125 392 1,433 9,670 4,970Other 0 0 5 10 15 4,955
Total Support 28,317 1,148 1,022 2,305 32,792 4,955Total 277,828 4,238 2,446 19,256 303,767 4,956
Note: Because of rounding, figures may not add up exactly to totals.
Figure 3.10: Four-Tier Summary Report for Research University Showing PrimaryPrograms Costs Only ($ in 1,000s)
Programs Tier One Tier TwoTier
Three Tier Four Full CostsP&L
BalanceCurrent Revenues $308,723Instruction $151,165 $2,119 $1,522 $9,867 $164,673 144,050Research 49,436 598 378 1,338 51,750 92,300Public Service 8,493 28 100 61 8,682 83,618Auxiliary Enterprises 68,734 1,493 446 7,990 78,663 4,955
Total Primary 277,828 4,238 2,446 19,256 303,767 4,956
Note: Because of rounding, figures may not add up exactly to totals.
SFAS No. 117-Type Cost Report Formats Containing SupportCosts
SFAS No. 117 does not prescribe a specific primary program chart of accounts. To date,all the sample reports offered by institutions use a mix of primary programs and a limited butvarying number of support activities. Some institutions view some support activities, such ascertain types of student services (e.g., advisement, student activities management), asprimary activities. Whether the intent of SFAS No. 117 is to follow the example of figure 3.9or figure 3.10 is not clear. If the latter, it may be some time before institutions comply fullywith such a truncated primary program list.
64 44

Institutionwide Full Costs of Primary By-Function Programs Under Varying Allocation Rules
If, over time, cost reports based on SFAS No. 117 contain fewer or no support-costcategories, differences in cost allocation practices will continue to haunt inter-institutionalcost comparisons. Even if a future list of cost accounts resembles that shown in figure 3.10, itis not certain which specific costs will be reflected in each cost center in a post-SFAS No.117 world.
Figure 3.11 suggests an alternative primary and support program cost report structure thatwould be acceptable under SFAS No. 117.
Figure 3.11: Selected By-Function Accounts in Audit Format
Function
Primary Programs Instruction, departmental research, other educationalSponsored research and contractsLibrariesEducational functions of hospitals and other independent operations
Support Activities Operations and maintenance of educational plantGeneral administration and institutionalStudent services
Other Auxiliary enterprisesHospitalsAll other
Note: Each account would have its tier-one through tier-four columns.
In the post-SFAS No. 117 world, each institution starts not only from its uniqueaccounting base, but also from its own cost allocation tradition. To date, figures 3.9 and 3.11reflect tradition, whereas figure 3.10 points to some future ideal where costs are reportedstrictly for an institution's primary programs.
Alternative Allocation Bases and Their Effectson Tier-One Costs
Simplicity and economy are powerful incentives when colleges and universities allocatepooled costs. As shown above, simple percentage allocation of pooled costs always sacrificessome costing precision. It is relatively simple to enhance costing precision withoutabandoning percentage allocation of pooled costs.
Allocating Pooled Costs on the Basis of Their Natural Costs
Support costs normally represent cost combinations for personnel, consumables, andsometimes long-term debt costs and asset depreciation. Percentage allocation can transfersuch costs in two ways:
45
65

Cost Accounting in Higher Eduction
First, the most simple type of percentage cost transfer, used in the preceding exhibits,prorates a support cost to one or several other accounts in lump sums without payingattention to their natural-cost structures. This method is also used to prevent the doublecounting of costs. For certain costing purposes, it is also the least precise cost allocationapproach.
Second, costing precision is maximized when costs are allocated to cost centers in directproportion to their natural-cost structure. This is called kind-for-kind cost allocation. Ideally,this means that indirect or support travel costs are allocated to direct travel costs, thatindirect utility costs are allocated to direct utility costs, and that indirect or support personnelcosts are allocated to direct personnel costs. In other words, the cost pool is transferred, lineby line, on the basis of percentage shares of each type of natural costs identified by thebudget. This way, the natural cost structure is not distorted.
But such precision in transferring costs may be asking too much, and there is a simplerway that at least reduces the cost structure distortion resulting from the most commonindirect-cost allocation practices. Figure 3.12 divides natural direct costs into two broadcategories: total personnel costs and total consumables costs. The objective is to allocate$22,025,000 of O&M costs.
Figure 3.12: Prorating Costs in Proportion to Natural-Cost Linesat Research University ($ in 1,000s)
Cost Center Personnel Consumable Tier One
Instruction $56,133 $21,292 $77,425O&M Allocation 11,288 10,737 22,025
Total 67,421 32,029 99,450Percentage Shares 67.79% 32.21% 100.00%O&M Allocation % 51.25% 48.75% 100.00%O&M Allocation $22,025
In this example, the pre-allocation shares of instructional personnel and consumables are72.50 and 27.50 percent, respectively. Because the shares for O&M personnel andconsumables are different-51.25 and 48.75 percentthe final post-allocation percentagesfor instruction are 67.79 and 32.21. This kind-for-kind natural-cost allocation procedurereflects accurately the final percentage shares of total tier-one personnel and consumablesresources.
When, as in figures 3.6 and 3.7, an entire support department's cost is transferred to aprimary programacademic support, admissions, and registrar's officenatural kind-for-kind cost transfers can be accomplished easily. When only a portion of a supportdepartment's costs are transferred, this more complicated approach would transfer naturalcosts the appropriate proportions.
How much costing precision should one strive for? Whenever support costs aretransferred to primary programs without kind-for-kind natural-cost distinctionsforinstance, through a lump-sum prorating mechanismthe percentage weights for personnel
46
66

Institutionwide Full Costs of Primary By-Function Programs Under Varying Allocation Rules
compensation and consumables are changed. Worse, if the full cost being transferredincludes tier-two through tier-four cost elements, the percentage transfer obscures thestructure of costs even more. The virtue of the FTFC model is precisely that it can keep suchlump-sum distortions to a minimum.
Only a few of the examples which follow employ this type of kind-for-kind natural-costallocation procedure. Research University may consider this alternative in the interest ofpreserving the integrity of the natural-cost structure when it reports the full natural costs ofits primary programs.
Allocating Executive Administration Costs: A Comparative Analysis
Cost distortions for inter-institutional cost comparisons can originate innocently enoughand early in the cost allocation process. The allocation of executive administration costs is acase in point.
How executive administration costs are allocated may not be the most pressing costallocation problem faced by institutions, but it highlights well the post-allocation costdifferences that result when there is a choice among allocation bases for one type of cost.Executive administration costs are a subset of institutional support costs. Institutions havealways charged a certain percentage of their executive administration costs to various by-function cost centers. The most common practice is to charge a significant portion of thesecosts to auxiliary enterprises. Institutions differ in how they allocate these costs. Figure 3.13shows how five different allocation procedures affect the costs of auxiliary enterprises. Threebroad types of executive administration cost allocations are used:
A portion of executive administration costs is allocated only to auxiliary enterprises.Executive administration costs are allocated to all by-function cost centers.Executive administration costs are allocated to primary cost centers only.
The six allocation examples shown produce five different executive administration coststhat must be allocated.
Figure 3.13: Summary Comparison of Five Allocation Methods for ExecutiveAdministration Costs and the Effect on Auxiliary Enterprise Costs ($ in 1,000s)
To Auxiliary Enterprises Only A Arbitrary 25 percent of executiveadministration costs shift to auxiliaryenterprises
$3,904
B Auxiliary enterprises direct-costpercentage
$2,825
To All Cost Centers C Percentage shares of personnelcompensation
$2,767
D Direct or tier-one costs $2,993
E Same as C with personnel/consumablesdistinction
$2,545
To Primary Cost Centers Only F Same as C $3,381
47 6 7

Cost Accounting in Higher Eduction
Figure 3.14 stipulates that 25 percent of total executive administration costs be allocatedsolely to auxiliary enterprises. This practice is simple and direct. In this example, $3,904,000of total executive administration costs shifts to auxiliary enterprises. Educational and general(E&G) tier-one costs decline to $216,840,000, and executive administration costs decline to$11,711,000.
Figure 3.14: Allocating 25 Percent of Executive Administration Costsat Research University to Auxiliary Enterprises ($ in 1,000s)
Cost CentersTier-One Costs
Before Allocation
Allocating 25% ofExecutive
AdministrationTier-One Costs
After Allocation
Instruction $77,425 $77,425Research 32,520 32,520Public Service 6,330 6,330Academic Support 21,041 21,041Student Services 20,447 20,447Public Relations and Development 11,255 11,255Executive Administration 15,615 -$3,904 11,711Other Institutional Support 14,086 14,086O&M 22,025 22,025Total E&G Direct Costs 220,744 216,840Auxiliary Enterprises 50,258 3,904 54,162All Other 6,825 6,825
Total 277,827 277,827
Note: Because of rounding, figures may not add up exactly to totals.
Figure 3.15 allocates executive administration costs on the basis of auxiliary enterprise'stier-one or direct cost percentage share. The executive administration share allocated is$2,825,000, or $1,079,000 less than in figure 3.15. Total E&G tier-one costs rise to$217,919,000.
Figure 3.16 illustrates the effect on final tier-one costs when total personnel compensationis the allocation base. The auxiliary enterprises share of executive administration costschanges again to $2,767,000, the executive administration account ends up with a zerobalance because the entire component has been allocated to all the other cost centers, andE&G tier-one costs are now $217,855,000.
Figure 3.17 uses tier-one or direct costs as an allocation base for executive administrationcosts, since direct costs are stipulated in Office of Management and Budget Circular A-21 as anappropriate allocation base.2 The amount allocated to auxiliary enterprises is now $2,993,000.
Finally, figure 3.18 allocates executive administration costs on the basis of the percentageshares of personnel compensation and consumables. The amount of executive administrationcosts allocated to auxiliary enterprises is $2,137,000 for personnel compensation costs and$408,000 for consumables costs, for a total of $2,545,000, reflecting the precise percentageof total executive administration for personnel compensation and consumables.
48
68

Institutionwide Full Costs of Primary By-Function Programs Under Varying Allocation Rules
Figure 3.15: Allocating Executive Administration Costs at Research Universityto Auxiliary Enterprises on the Basis of Auxiliary Enterprises'
Tier-One or Direct-Cost Share ($ in 1,000s)
Cost CentersTier-One Costs
Before Allocation
Allocating % ofAuxiliary
Enterprises'Direct Costs
Tier-One CostsAfter Allocation
Instruction $77,425 $77,425Research 32,520 32,520Public Service 6,330 6,330Academic Support 21,041 21,041Student Services 20,447 20,447Public Relations and Development 11,255 11,255Executive Administration 15,615 -$2,825 12,790Other Institutional Support 14,086 14,086O&M 22,025 22,025Total E&G Direct Costs 220,744 217,919Auxiliary Enterprises 50,258 2,825 53,083All Other 6,825 6,825
Total 277,827 277,827Auxiliaries as a % of Total DirectCosts
22.77%
Note: Because of rounding, figures may not add up exactly to totals.
Figure 3.16: Allocating Executive Administration Costs at Research Universityto All Cost Centers on the Basis of Personnel Compensation Percentage Shares
($ in 1,000s)
Cost CentersDirect Costs
BeforeAllocation
Allocating by% of PersonnelCompensation
Allocating % ofAll PersonnelCompensation
Direct CostsAfter Allocation
Instruction $77,425 36.52% $5,703 $83,128Research 32,520 13.85 2,163 34,683Public Service 6,330 6.91 1,078 7,408Academic Support 21,041 5.25 820 21,861Student Services 20,447 6.78 1,059 21,506Public Relations and Development 11,255 3.07 479 11,734Executive Administration 15,615 0.00 -15,615 0Other Institutional Support 14,086 3.27 511 14,597O&M 22,025 5.85 913 22,938Total E&G Direct Costs 220,744 81.50 -2,889 217,855Auxiliary Enterprises 50,258 17.72 2,767 53,025All Other 6,825 0.78 122 6,947
Total 277,827 100.00 0 277,827
Note: Because of rounding, figures may not add up exactly to totals.
4969

Cost Accounting in Higher Eduction
Figure 3.17: Executive Administration Costs at Research University Allocatedon the Basis of Tier-One or Direct Costs ($ in 1,000s)
Cost CentersTier-One Costs
Before Allocation% of Tier-One Costs
AllocatingAmounts
Tier-One CostsAfter Allocation
Instruction $77,425 29.53% $4,611 $82,036Research 32,520 12.40 1,937 34,457Public Service 6,330 2.41 377 6,707Academic Support 21,041 8.02 1,253 22,294Student Services 20,447 9.78 1,527 21,974Public Relations 11,255 2.31 361 11,616Executive Administration 15,615 0.00 -15,615 0Other Institutional Support 14,086 5.37 839 14,925O&M 22,025 8.40 1,312 23,337Total E&G Direct Costs 220,744 78.23 -3,399 217,345Auxiliary Enterprises 50,258 19.17 2,993 53,251All Other 6,825 2.60 406 7,231
Total 277,827 100.00 0 277,827
Note: Because of rounding, figures may not add up exactly to totals.
Figure 3.18: Dividing Tier-One Costs at Research University on the Basis of PersonnelCompensation and Consumables or Natural Cost Categories ($ in 1,000s)
Cost Centers Personnel Consumables
ExecutiveAdministration
Personnel
ExecutiveAdministrationConsumables Tier One
Instruction $56,133 $21,292 $4,872 $339 $82,636Research 26,505 6,015 2,300 96 34,916Public Service 4,495 1,835 390 29 6,749Academic Support 7,175 13,866 623 221 21,885Student Services 13,802 6,645 1,198 106 21,751Executive Administration 14,011 1,604 -14,011 -1,604 0Institutional Support 3,215 10,871 279 173 14,538Public Relations and Development 8,779 2,476 762 38 12,055O&M 14,315 7,710 1,242 123 23,390Total E&G 148,430 72,314 -2,345 -480 217,920Auxiliary Enterprises 24,625 25,633 2,137 408 52,803All Other 2,389 4,436 208 71 7,104
Total 175,444 102,383 0 0 277,827
Note: Executive administration costs are allocated to all cost centers on the basis of their percentage shares of personnel compensation and consumables.
Figure 3.19 compares the five sets of tier-one costs that result from these cost allocationapproaches. Even though executive administration costs represent a relatively smallpercentage of total operating costs (5.62 percent), the significant post-allocation tier-one costdifferences should give any cost allocation theorist pause: Which of the allocated costs-and,therefore, of the resulting tier-one costs-is the correct one?
50
70

Institutionwide Full Costs of Primary By-Function Programs Under Varying Allocation Rules
Figure 3.19: Comparing Post-Allocation Tier-One Costs at Research University($ in 1,000s)
Cost Centers Figure 3.14 Figure 3.15 Figure 3.16 Figure 3.17 Figure 3.18
Instruction $77,425 $77,425 $83,128 $82,036 $82,636Research 32,520 32,520 34,683 34,457 34,916Public Service 6,330 6,330 7,409 6,707 6,749Academic Support 21,041 21,041 21,861 22,294 21,885Student Services 20,447 20,447 21,506 21,974 21,751Public Relations and Development 11,255 11,255 11,734 11,616 0Executive Administration 11,711 12,790 0 0 14,538Other Institutional Support 14,086 14,086 14,597 14,925 12,055
O&M 22,025 22,025 22,938 23,337 23,390E&G Direct Costs 216,840 217,919 217,856 217,346 217,920Auxiliary Enterprises 54,162 53,083 53,025 53,251 52,803All Other 6,825 6,825 6,947 7,231 7,104
Total 277,827 277,827 277,827 277,827 277,827
Note: Because of rounding, figures may not add up exactly to totals.
Allocating All Support Costs Only to Primary Cost Centers
Figure 3.20 uses tier-one primary program costs that result after executive administrationcosts have been allocated only to primary programs. The remaining total support costs of$95,679,000 are allocated on the basis of personnel compensation. However, since theremaining support costs are transferred without regard to each cost component's properaffinity-based allocation base, the resulting post-allocation tier-one costs are quite arbitrary.Figure 3.20 is an example of quick-and-dirty costing where precision is not required.
Alternative Allocation of Support Costs Using Multiple Allocation Bases
Figure 3.21 illustrates one possible alternative, with program cost outcomes that aredifferent from those shown before. This iterative model uses multiple allocation bases.
Allocating Tier-Two Through Tier-Four Costs After the Fact
Long-Term Debt Costs
The most logical allocation base for aggregate plant-debt costs is the value of the debt inquestion, as illustrated in figure 3.22. For instance, if a dormitory has been debt-financed infull or in part, the total net debt cost must be charged to it. If debt encompasses more thanone facility, the debt cost should be shared in proportion to each facility's percentage of thetotal (shared) debt.
Costs caused by plant debt are direct costs even if they are pooled. Under SFAS No. 117,this cost could be charged directly to cost centers which have debt-financed plant. Debt costsof instructional plant will be charged to instruction rather than to O&M, and debt costs of
51
71

Cost Accounting in Higher Eduction
Figure 3.20: Allocating Remaining Support Costs at Research University to PrimaryPrograms on the Basis of Personnel Compensation ($ in 1,000s)
Functions
Tier-OneCosts BeforeAllocation
% ofPersonnel
CompensationCosts
AllocatingAmounts
Tier-OneCosts AfterAllocation
Instruction $85,673 52.82% $50,538 $136,211Research 35,838 21.25 20,332 56,170Public Service 6,998 4.28 4,095 11,093Auxiliary Enterprises 53,639 21.65 20,715 74,354
Total Primary 182,148 100.00 95,679 277,827Academic Support 21,041 -21,041 0Executive Administration 15,615 -15,615 0Public Relations and Development 11,255 -11,255 0Student Services 20,447 -20,447 0Institutional Support 14,086 -14,086 0O&M 22,025 -22,025 0All Other 6,825 -6,825 0
Total Support 111,294 -111,294 0Total 293,442 -15,615 277,827
research facilities will be charged to research. Only direct O&M plant debt costs will becharged to the O&M account.
Normally, the plant in question is identified by the debt instruments drawn up at the timeof debt acquisition. Each debt instrument clearly identifies the financing of the constructionproject that is the basis for the debt costs. Assigning debt costs is straightforward until onehas to divide such costs among more than one facility or project.
Because the debt costs of long-term facilities normally relate to specific facilities projects,normally this cost should not be charged to or averaged out over. plant that is debt-free. Thepercentage shares of total or assigned square footage among the various functional accountsare completely independent of the value of any plant debt. Figure 3.22 shows the percentage-share differences. When the same cost aggregate is distributed on the basis of each column,the allocated costs will differ in each case.
If the cost of long-term debt must be reflected in the activities costs of services renderedwithin a given debt-financed facility, then square footage, credit hours, and other suitablecost allocation bases can be used.
Not all long-term debt is acquired to finance physical facilities. Long-term debt costs thatare not related to physical assets should be charged to the activities supported by the debt.For instance, if long-term debt supports an ongoing institutionally financed student loanprogram, debt costs are uniquely related to this program.Debt costs derive from debt of different vintages with different interest rates. In figure 3.22,non-auxiliary-enterprise debt is listed by vintages. There are four different groupings ofinstruction-related debt. For instance, the O&M account was initially charged interest of$207,000 (5.51 percent) for $3,755,000 of debt issued to finance renovation of an
52
72

Institutionwide Full Costs of Primary By-Function Programs Under Varying Allocation Rules
instructional facility. It was also charged $348,000 (6.57 percent) of interest for anotherinstructional facility's debt of $5,295,000. Of the two debt vintages, the smaller debt
Figure 3.21: Allocating Support Costs at Research University Using MultipleAllocation Bases ($ in 1,000s)
Step Action Cost Centers Primary ProgramsTier-One
Cumulative% ofBase
TotalAllocated
Tier-One
CostsPreviously Allocated ExecutiveAdministration Costs
$15,615
First Allocate Student Services + Academic SupportBasis: Direct
41,488
Instruction 85,673 $41,488 $127,161Research 35,838 35,838Public Service 6,998 6,998Auxiliary Enterprises 53,639 53,639
Cumulative Subtotal 182,148 41,488 223,636Second Allocate Public Relations and Development
Basis: Total Tier-One Costs11,255
Instruction 127,161 52.82% 5,945 133,106Research 35,838 21.25 2,392 38,230Public Service 6,998 4.28 482 7,480Auxiliary Enterprises 53,639 21.65 2,437 56,076
Cumulative Subtotal 223,636 100.00 11,256 234,892Third Allocate Institutional Support
Basis: Total PersonnelCompensation
14,086
Instruction 133,106 52.82 7,440 140,546Research 38,230 21.25 2,993 41,223Public Service 7,480 4.28 603 8,083Auxiliary Enterprises 56,076 21.65 3,050 59,126
Cumulative Subtotal 234,892 100.00 14,086 248,978
Fourth Allocate O&MBasis: Total Square Feet Occupied
22,025
Instruction 140,546 61.25 13,490 154,036Research 41,223 6.25 1,377 42,600Public Service 8,083 1.15 253 8,336Auxiliary Enterprises 59,126 31.35 6,905 66,031
Cumulative Subtotal 248,978 100.00 22,025 271,003Fifth Allocate All Other
Basis: To Instruction6,825
Instruction 154,036 6,825 160,861
Research 42,600 42,600Public Service 8,336 8,336Auxiliary Enterprises 66,031 66,031
Cumulative Subtotal 271,003 6,825 277,828
53'7 3

Cost Accounting in Higher Eduction
Figure 3.22: Long-Term Debt Costs at Research University Allocated on the Basisof Percentage Shares of Debt Dollar Values ($ in 1,000s)
Plant with Debt byFunction
Amount ofDebt O&M
% Share ofDebt
Amount ofDebt Cost
To Share ofNet Debt
Costs
% SquareFeet Plantwith Debt
Instruction $3,755 5.38% $207 4.88% 5.10%O&M 355 0.51 29 0.68 1.30Instruction 5,295 7.59 348 8.21 3.95Instruction 2,985 4.28 202 4.77 9.50Academic Support 725 1.04 49 1.16 2.60Instruction 1,515 2.17 95 2.24 3.75Research 2,215 3.18 138 3.26 4.25Institutional Support 1,055 1.51 72 1.70 3.20
Subtotal 17,900 25.66 1,140 26.90 33.65Student Housing 25,825 37.03 1,625 38.34 35.25Food Services 14,805 21.23 775 18.29 24.55Other 3,015 4.32 205 4.84 1.85
Subtotal 43,645 62.58 2,605 61.47 61.65All Other 8,200 11.76 493 11.63 4.70
Total 69,745 100.00 4,238 100.00 0.00
Public Service* 225 0.37 16 3.80 1.35
* $225 should be charged to public service.
represented a larger share of the total square footage with debt (5.10 percent), whereas thelarger debt related to a smaller debt-encumbered square footage (3.95 percent). Similardifferences are shown in the exhibit for the other debt vintages.
Therefore, when square footage is the allocation base, the ensuing cost allocation nolonger emphasizes the dollar value of the debt in question, but the size of the facilities towhich debt costs are allocated. Square footage often is an appropriate allocation base forcosts that must be distributed within a debt-financed structure; it is a less appropriate base forallocating debt costs among structures and large by-function programs. Thus, if an institutionhas decided to pool debt and its related costs, and then later allocates these costs on a basisother than the debt's dollar value, the resulting primary or support program costs will bedistorted.The step-down cost allocation method charges debt cost first to each debt-financed facility.When debt costs are allocated to primary by-function programs, most of the cost willnormally be divided between instruction and auxiliary enterprises. For the portion of debtcost that spills over into research and public service, institutions should first be guided by theterms of the original financing, which normally identifies the values of the projects coveredby debt. If the documentation provides insufficient or no clues to the value distribution of thedebt in question, the square footage method is appropriate, though less desirable, forallocating any debt segments not assigned to instruction. Research University assigns debtcosts directly to each project and facility originally financed with debt.
7454

Institutionwide Full Costs of Primary By-Function Programs Under Varying Allocation Rules
Hierarchies-Ainong-Cost Categories
Ftill costs alwaysCOrTlEirrclusters::TYlese clustersexistattlifferent-levelsotcost aggregatienwittrr,...institutionwide.costs7embracing-everything .and departmentatcosts.concentrating.on relativelyinarrqw,qost.
-Concerns.
If instruction'and-sponsored.research-are the:primary-activities;.thefollowincrare.sources:offsUpport---costs:
Public service.Academicsupport-Libraries-:.Academic. computer servicesStudent 'servicesInstitutional supportOperations-and maintenance
If student recruitment is the primary activity,- the following may contribute:support.coits:-.7.
Undergraduate and graduate admissionsStudent records; registrarStudent financial aid administrationFaculty' involved in recruitingPublications. and printing departmentOffice services'Custodial., services.Catering-Alumni (recruiting) relationsSpecialized professional servicesComputer services
If a three-yearfund-raising effort is the primary activity, the following provide support.: .
Trustee- and alumni - relations department'Development departmentPublic relations and publicitySpecialized professional servicesComputer servicesFinancial administration
The true art in costing is to dissect the types of support-cost pools illustrated here and to allocate them.to the
activities in question in a logical manner. Most of the support costs in these illustrations are direct costs for the
costing task involved, and relatively few will actually prove to be indirect costs per se.
The simplified cost allocation examples shown earlier are essentially of the after-the-fact variety. Inter-account
cost transfers taking place prior to pooling are a given. Many institutions already have elaborate from-the- bottom -up
allocation systems where pooled and indirect cost transfers are ongoing or current so that full or nearly full costs
are achieved at the end of each accounting interval.Here, the issue is how, once an institution reports its by-function or major program-costs in its year-end audit
report. specific support and common costs can be allocated to its primary programs without the need for
reorganizing its entire accounting system. This is exactly the assignment given by Research University's Board of
Trustees, and the approaches illustrated above apply to all institutions that.might face .a similar.costing task.
Smaller institutions may have less difficulty assigning debt costs directly to primary
programs than do large and complex institutions with very diverse facilities debt and
complex plant usage. Nevertheless, for maximum costing precision, even in those much
5575

Cost Accounting in Higher Eduction
more complicated situations, all debt costs should be allocated directly, first on the basis ofthe actual dollar value of the debt and second, perhaps as a last resort, on the basis of squarefootage.
One-Year Assets
Separating one-year assets from both consumables and long-lived assets may seem like anarbitrary and overly pedantic distinction. However, it derives directly from the differencebetween expenses and costs. Fully expensed asset acquisitions represent an expense ofcapital or an investment. Most fully expensed asset acquisitions have useful lives in excess ofone year. The true explicit cost of the original capital investment is most simply andconventionally expressed through an appropriate depreciation charge; depreciation chargesare a function of an asset's undepreciated value and its useful life.
Thus, rather than focusing on whether or not an asset acquisition was fully expensed andwhether or not it was capitalized, the approach taken here is that, for costing purposes, allasset acquisitions should be depreciated on the basis of their respective original costs anduseful livesthus the distinction between one-year and longer-lived assets. If a group of peerinstitutions decides to compare full costs, this distinction enhances cost comparability amongthem by neutralizing differences in certain key financial policies.
For practical purposes, many fully expensed capital asset acquisitions have a very smalldollar value. There are many of them, and tracking them all is onerous, to say the least. Asindicated earlier, the Circular A-21 rule might be substituted here: All assets acquiredcurrently that fall within the circular's cutoff point would constitute tier-three costs. But theOffice of Management and Budget proposes to raise the cutoff from $500 to $5,000, at whichpoint the range of covered equipment increases dramatically. The inventory of such itemswill then include personal computers, high-tech equipment, and large pools of equipmentacquisitions whose useful lives dearly exceed one year.
Institutions may resist the extra work required to make the appropriate useful-lifedistinctions, but at the expense of precision in costing. Library, laboratory, and officeequipment acquisitions are typical examples where useful lives normally vary and exceedone year. Changing to a $5,000 cutoff would also have the immediate effect of increasingcurrent costs. For costing purposes, it does not seem to be necessary or appropriate to speedup the write-off of equipment with a useful life in excess of one year. When ResearchUniversity computes its costs on the basis of the FITC concept, all asset acquisitions withlong useful lives are assumed to be depreciated.
Depreciation
Nevertheless, the complexity of tracking all such assets is recognized here. Figure 3.23illustrates Research University's aggregate asset classification for determining depreciationallowances. The computation is based on a statistically representative sample of equipment,and it recognizes library and similar asset acquisitions with long useful lives and classifiesplant assets into four major groups. Group A represents administrative and O&M plant,group B encompasses all auxiliary enterprises plant, and groups C and D are academic andresearch facilities. The equipment sample can be disaggregated to departments.
7 656

Institutionwide Full Costs of Primary By-Function Programs Under Varying Allocation Rules
The computation of depreciationcosts presents several challenges.Depreciation is a direct cost of doingbusiness. If an institution pools itsdepreciation costs. the latter is an
unallocated direct cost. If SFAS No.117 intends to allocate all direct coststo primary programs or cost centers.depreciation costs must eventually becharged directly to each affected costcenter. Until now, many institutions
allocated depreciation costs re-
spectively within the O&M andauxiliary enterprises accounts, if they
were allocated at all. As indicated
earlier, Research University chargesthese costs directly to the appropriatefacilities and departments. If andwhen primary programs must reflectfull costs, depreciation will have tobe allocated directly to these
programs.Normally, the immediate cost
center for equipment is a department.
If an institution knows how to keep
track of asset acquisitions by depart-
ments, departmental equipment
depreciation costs win eventuallyaggregate into total equipment de-preciation costs for each primary pro-gram. An allocation problem arises.however, when support activity de-
preciation costs must be allocated toprimary cost centers. For instance, onwhat basis should Research Univer-
sity's depreciation costs in academic
support, institutional support, public
relations and development, studentservices, and O&M be allocated toprimary programs at the macro-levelshown in the preceding exhibits?Figures 3.5 through 3.7 illustrated the
step-by-step process that shifts
BEST COPY AVAILABLE
Phony Net Revenues. and Depreciation:.
For-profit enterprises have learned to their profound
chagrin thatdepreciation rates-permitted by tax laws and-
othergovemmentregulations-all too-irequently understate the
rate at which physical capital.. deteriorates in-usei--.Many for-
profit businesses are forcedby regulators to report what
Forbes magazine'calls: "phony" earnings:. man article titled
"Honesty Isn't-Such a Bad.POlicy," author Riva-Atlaspoints
out.that when lower depreciation rates are imposed by
regulators (and tax authorities) they will increase reported
pre-tax profits and thereforsincrease.taxes" She-points out
the-obvious, thatdrawrKwt depreciation schedules- reduce
current reported costs because-they:hide the fact that true
profits are less than they would be with faster; usually more
realistic, depreciation-schedules.Vis-à-vis higher education and indirect cost.recovery, the
government has an incentive to reimburse less rather than
more.- Stingy depreciation-rates allowed under.Circular A-21
for those using the simplified method or a facilities-use
charge accomplish the governments-purpose; but may short
change-colleges and universities.. Unfortunately, manyinstitutions.also.prefer to report low costs; and thus believe
they are.well served.by low-depreciation charges-....
A financially sound-approach-would stress realisticdepreciation-chargeS.Manydepieciable assetswearout
faster.than:the authoritiesSWMore-honest.annual:::depreciation charges may reduce net profits-in the:short-Tun,
but-they also will call.attention to the need for-more--
appropriate pricing, revenue, and operating-cost policies. The
cash-flow report,Tnandated by SFAS No. 117, highlightsdepreciation as a reduction in cash flow at the-very top of the
list:of deductions...Thus keeping depreciation low eats up
less-cash flow. By reporting honest depreciation costs,
college and.university cash-flow reports will impart more
realistic message about an institution's financial.condition
and help ensure that in the future there are adequate current
revenues to cover full 'costs**
RiVa Atlas, "Honesty Isn't Such a Bad Policy," in Forbes,
4 July 1994, 118.-
**See also Hans H. Jenny and a...Richard:Minn; The,Ttiming-Point A Study of Income and Eipenditure-Growth
and Distribution of 48 Four-Year Liberal Arts Colleges, 1960-
1970 (Wooster, Ohio: The College of Wooster; -1972): Hans
H.-Jenny, Geoffrey C. Hughes, and.Richard-EVNivine, Hang-
Gliding or Looking for an Updraft:-A Study of College and
University Finance in the 1980s The Capital Margin(Wooster; Ohio:-The College of Wooster;-BOUlder,.-Colo.: .
John Minter Associates,.1981). These studieS;.preceding the
requirement thatindependent institutions acCoUrit.fordepreciation, made clear that even modest depreciation
charges against current revenues_would engulf, higher
education-in a sea of red ink.
57

Cost Accounting in Higher Eduction
depreciation costs to primary programs.Beyond square-footage allocation, depreciation costs can also be allocated on the basis of
employee and student usage. The last two bases, allowed under Circular A-21, are especiallyuseful when the full cost of a course or of a research project is at stake, and when the focus ison a primary academic program.
Useful-Life Estimates
Useful-life estimates should be realistic and not overly long. Long useful lives aresometimes preferred because they reduce the size of the depreciation charge. Figure 3.23.estimates what the administration of Research University believes are realistic remaininguseful lives. Circular A-21, on the other hand, imposes arbitrary and overly long useful-lifeparameters for institutions using either the simplified indirect costing method or a facilities-use charge in lieu of a depreciation charge. While uniform across-the-board rates may beappealing because of their simplicity, they may result in too high or too low a depreciationcost when the full cost of specific programs and activities must be determined.
Depreciation rates are determined chiefly by
the original dollar value of the assets that are being depreciated andthe remaining useful life of each asset.
The two most prominent macro-cost allocation bases for depreciation arethe dollar value of the assets andthe square footage of plant.
For some costing tasks, credit hours and the number of personnel may be appropriate. Thechoice of allocation base and the useful-life estimates together determine how precise theeventual depreciation cost will be.
Institutions looking for simplicity in costing prefer average, across-the-board,depreciation rates. But which average rates? Figure 3.23 uses data from the preceding tableand calculates two types of useful-life averages. Each results in a different depreciation cost.Using a $514,208 historical undepreciated asset value as a base, the . annual averagedepreciation cost could be $19,947,000 or $19,256,000. The difference of $691,000, or 3.59percent, between these two methods might be construed as significant by the institution.
Research University uses a useful-life-weighted average which produces an aggregateaverage useful life of 26.70 years (total plant value divided by $19,256,000), whereas thearithmetic average is 25.78 years (see figure 3.24). This method is consistent with theuniversity's Circular A-21 depreciation computations. Under SFAS No. 117 and withresponsibility or cost-center costing (and budgeting), depreciation cost pools becomeprogram-specific.
768

Institutionwide Full Costs of Primary By-Function Programs Under Varying Allocation Rules
Figure 3.23: epreciation Schedule Based on Remaining Useful Life of Assetsat Research University ($ and sq. ft. in 1,000s)
Asset Type and ClassAssets
(Number)Value ofSample
RemainingLife Years
UndepreciatedValue
Year-Weighted
Depreciation
Equipment SampleMicrocomputers 621 $2,739 4.88 $5,895 $1,208
Computers Other 187 2,337 6.59 6,220 944
Other Data Processors 403 1,702 6.79 3,286 484
Vehicles, A 35 266 7.51 798 106
Vehicles, B 17 42 9.25 185 20
Office Equipment 110 566 8.56 1,132 132
Classrooms 118 524 7.53 1,457 193
Office Furniture 51 305 11.82 2,875 243
Lab Furnishings 23 145 14.82 1,875 127
Dormitory Lounge 33 400 6.76 2,153 318
Broadcast 134 407 9.33 998 107
Scientific 67 253 12.84 1,872 146
Engineering 266 611 12.88 2,385 185
Printing, Copying 72 367 7.93 785 99
Printing Instruments 38 38 7.93 298 38
Specialty 11 77 5.35 355 66
Maintenance 108 295 9.03 1,256 139
Musical Instruments 10 13 7.10 215 30
PBX Switching 20 184 4.20 184 44
All Other 462 1,727 6.44 3,582 558
Total Equipment 2,786 12,998 8.38 37,816 5,188
LibrariesAdministrative Computers 12 527 7.21 527 73
Work Stations 89 896 5.26 1,475 280
Periodicals NA 5,687 12.23 5,687 465
Book Collection NA 11,923 15.65 11,923 762
Rare Books NA 785 25.00 785 31
Special Installations 3 395 11.25 395 35
Total 104 20,213 12.77 20,792 1,647
Plant SquareFeet
Parking 13,650 11,702 9.87 11,702 1,186
Group A 75,450 52,575 35.25 52,575 1,491
Group B 102,124 99,050 37.52 99,050 2,640
Group C 112,355 145,150 42.25 145,150 3,436
Group D 101,125 147,125 40.10 147,125 3,669
Total 404,704 455,602 33.00 455,602 12,421
Grand Total 407,594 488,813 25.78 514,208 19,256
Note: Because of rounding, figures may not add up exactly to totals
59 7 9

Cost Accounting in Higher Eduction
Figure 3.24: Average Versus Weighted Remaining-Life Years at Research University
Asset Type ValueArithmetic
Average YearsAverage
DepreciationWeighted
Average YearsAverage
DepreciationEquipment $37,816 8.38 $4,513 7.29 $5,188Libraries 20,792 12.77 1,628 12.62 1,647Plant 455,602 33.00 13,806 36.68 12,421
Total 514,210 25.78 19,947 26.70 19,256
Notes1. Statement of Financial Accounting Standards No. 117: Financial Statements of Not-for-
Profit Organizations, Financial Accounting Series No. 127-B (Norwalk, Conn.: FinancialAccounting Standards Board of the Financial Accounting Foundation, June 1993).
2. Office of Management and Budget, Cost Principles for Educational Institutions, OMBCircular A-21. Reprinted in James L. Feldesman, Jacqueline C. Leifer, and Michael B.Glomb, eds., Federal Auditing Information Service for Higher Education (Washington,D.C.: NACUBO, 1994).
Exercises
The worksheet below allows the reader to emulate the allocation rules discussed in thischapter. If an institution has developed a chart of accounts compatible with SFAS No. 117, itcan be substituted for the nomenclature provided here.
If your institution's internal financial policies are less or more expensive than the mostgenerous options permitted under Circular A-21, you may wish to compute full costs usingvarious depreciation rules.
Worksheet 3.1: Allocating Selected Costs to Your Major Programs Under SFAS No. 117
Cost CentersTier One
AddTwo
TierTwo
AddDifference.
TierThree Add
TierFour
InstructionResearchPublic ServiceAcademic SupportStudent ServicesExecutive SupportOther SupportO&MTotal E&GAuxiliary EnterprisesOther
TotalCurrent Revenue or Cashflow
Balance
60

4
The Aggregate Full Costs ofMajor Professional Academic Programs
This chapter continues to examine the case of Research University, addressing pooled cost
allocation alternatives to major academic programs. The chapter begins by presenting the
university's summary report to the board.
Summary of Academic Program Full-Cost Alternatives
This report presents several academic program cost models, one or several of which the
university may use in the future for reporting its academic program costs.A university can define its academic programs in several ways. Research University chooses its
professional schools and programs because its chart of accounts, expenditure budgets, other accounting
information, and nonfinancial records are organized on behalf of theseprofessional entities.
Figure 4.1 identifies Research University's primary professional program and support costs
as reported in the pre-SFAS No. 117 audit, with which the board is familiar. Figure 4.2
compares the full costs of four cost models. The models allocate support and other common
costs progressively to the primary academic programs shown in figure 4.1. Each cost modelselects specific cost allocation bases, and each sets the stage for the next costing iteration. Ifother allocation bases than those used are chosen, the cost outcomes will be different.
Definition of the Costing Tasks
Under its practice of responsibility-center, or cost-center, budgeting, the university allocates
support and other costs fully in the annual operating budget of each primary program.Responsibility budgeting or the full costing of primary academic programs implies that there
are no "free" resources. Academic programs, as defined in figure 4.1, must account or pay for
the university's total costs on the theory that without its academic mission and programs theinstitution would not exist. Thus, there are no institutional resources or costs per se.
Figure 4.3 presents a spreadsheet for tier-one costs and identifies total support costs that
must be allocated in some manner to each academic program. Figure 4.4 illustrates a similar
preadsheet for allocating tier-two through tier-four costs. The eventual cost allocations are
identified by question marks.
61

Cost Accounting in Higher Education
Figure 4.1: Research University's Pre-SFAS No. 117 Academic Program andAdministrative Support Centers ($ in 1,000s)
Cost CentersTier-One
CostsTier-One
% Shares E>ier-One
% Shares TotalPrimary Programs
Architecture $5,925 3.56% 2.13%Arts and Sciences 18,975 11.39 6.83Business and Economics 14,985 9.00 5.39Education 9,885 5.94 3.56Environmental Sciences 3,035 1.82 1.09International Studies 3,725 2.24 1.34Law and Public Affairs 8,380 5.03 3.02Performing Arts 7,790 4.68 2.80Nursing, Paramedical 7,875 4.73 2.83Physical and Mathematical Sciences 6,367 3.82 2.29Physical Education and Sports Medicine 10,253 6.16 3.69Social and Behavioral Sciences 12,750 7.66 4.59
Total E&G 109,945 66.02 39.57Auxiliary Enterprises 50,258 30.18 18.09Other 6,330 3.80 2.28
Total Primary 166,533 100.00 59.94Support Activities
Academic Support 3,984 1.43Libraries 11,807 4.25Academic Computer Services 5,250 1.89Executive Administration 15,615 5.62General Institutional 14,086 5.07Student Services 20,447 7.36Public Relations and Development 11,255 4.05O&M 22,025 7.93Other 6,825 2.46
Total Support 111,294 40.06Total Program Costs 277,827 100.00
Capital CostsLong-Term Debt Costs 4,238One-Year Assets 2,446Depreciation 19,256
Total Capital 25,940Total Full Costs 303,767
Note: Because of rounding, figures may not add up exactly to totals.
Research University's Choice of Allocation Bases for Academic Program Costs
Within the four-tier full-cost (FTFC) model and under SFAS No. 117, most cost allocationissues pertain to tier one or operating costs. Some of these are pooled or unallocated direct costsof the various support functions, while others are truly indirect pooled support costs. On whatbasis should these direct and indirect costs be allocated to the primary academic programs?Figure 4.5 presents an expanded list of cost types and their respective allocation bases.
82 62

The Aggregate Full Costs of Major Professional Academic Programs
Figure 4.2: Research University's Academic Program Full-Cost Comparisons ($ in 1,000s)
Cost CentersModel One
Fig. 4.6Model Two
Fig. 4.8Model Three
Fig. 4.9Model Four
Fig. 4.10
Primary ProgramsArchitecture $6,448 $6,448 $13,917 $14,316
Arts and Sciences 24,432 23,925 55,126 56,815
Business and Economics 16,486 16,486 30,242 30,834
Education 9,903 10,058 16,487 16,737
Environmental Sciences 3,051 3,135 6,549 6,669
International Studies 3,732 3,792 6,593 6,681
Law and Public Affairs 9,085 9,085 18,721 18,972
Performing Arts 8,626 8,739 14,528 14,693
Nursing, Paramedical 7,952 8,008 11,690 11,838
Physical and Mathematical Sciences 7,568 7,482 14,600 14,799
Physical Education and Sports Medicine 11,139 11,139 18,443 18,715
Social and Behavioral Sciences 13,026 13,151 21,941 22,236
Total 121,448 121,448 228,837 233,305
Auxiliary Enterprises 60,222 60,222 64,126 64,126
Other 6,336 6,336 6,336 6,336
Total 188,006 188,006 299,300 303,767
Support ActivitiesAcademic Support 4,002 4,097 113 0
Libraries 13,005 13,549 1,742 0
Academic Computer Services 5,557 5,624 374 0
Executive Administration 16,621 15,695 80 0
General Institutional 14,631 14,629 543 0
Student Services 20,510 20,564 117 0
Public Relations and Development 11,273 11,298 43 0
O&M 23,324 23,468 1,443 0
Other 6,838 6,837 12 0
Total 115,761 115,761 4,467 0
Total Costs 303,767 303,767 303,767 303,767
This exhibit suggests that allocating support and other costs to primary academic programs can
be considerably more complicated than allocating them to the major administrative functions,
especially when a high degree of costing precision is required. Many more allocation-base
alternatives exist. For practical purposes, this report cannot show the effects on full costs of
every possible combination of allocation bases and therefore is limited to four costing models.
The general principles and constraints underlying the allocation of pooled direct and indirect
costs are the same as for by-function macro-costing. To a large extent, the widening choice
among increasing numbers and types of allocation bases is related, first, to the acknowledged
need for more direct and less indirect costing, and second, to the desire for more costing
precision. Both tendencies call attention to allocation bases that have a high-not merely areasonable-degree of affinity with the cost center to which costs must be allocated. The
allocation bases of the cost models in this report were chosen because they tend to enhance
costing precision.
63 83
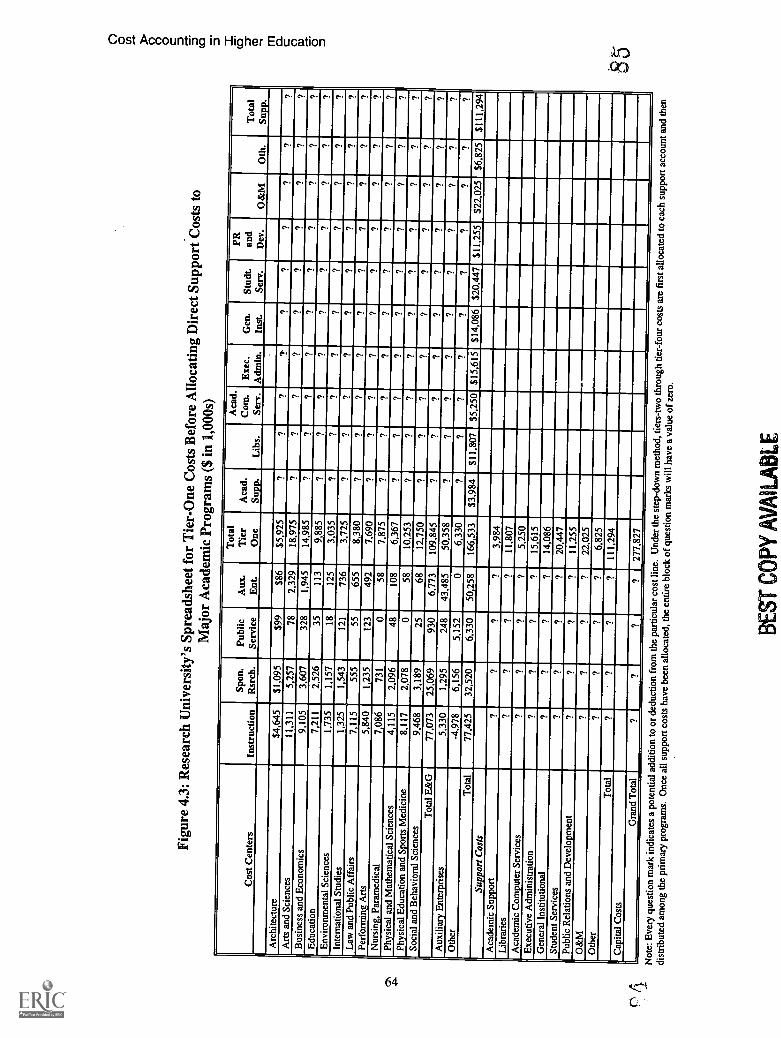
Figu
re 4
.3: R
esea
rch
Uni
vers
ity's
Spr
eads
heet
for
Tie
r-O
ne C
osts
Bef
ore
Allo
catin
g D
irec
t Sup
port
Cos
ts to
Maj
or A
cade
mic
Pro
gram
s ($
in 1
,000
s)
Cos
t Cen
ters
Inst
ruct
ion
Spon
.R
srch
.Pu
blic
Serv
ice
Arc
hite
ctur
e$4
,645
$1,0
95$9
9A
rts
and
Scie
nces
11,3
115,
257
78B
usin
ess
and
Eco
nom
ics
9,10
53,
607
328
Edu
catio
n7,
211
2,52
635
Env
iron
men
tal S
cien
ces
1,73
51,
157
18In
tern
atio
nal S
tudi
es1,
325
1,54
312
1L
aw a
nd P
ublic
Aff
airs
7,11
555
555
Perf
orm
ing
Art
s5,
840
1,23
512
3N
ursi
ng, P
aram
edic
al7,
086
731
0Ph
ysic
al a
nd M
athe
mat
ical
Sci
ence
s4,
115
2.09
648
Phys
ical
Edu
catio
n an
d Sp
orts
Med
icin
e8,
117
2,07
80
Soci
al a
nd B
ehav
iora
l Sci
ence
s9,
468
3,18
925
Tot
al E
&G
77,0
7325
,069
930
Aux
iliar
y E
nter
pris
es5,
330
1,29
524
8O
ther
-4,9
786,
156
5,15
2T
otal
77,4
2532
,520
6,33
0Su
ppor
t Cos
tsA
cade
mic
Sup
port
9L
ibra
ries
Aca
dem
ic C
ompu
ter
Serv
ices
99
Exe
cutiv
e A
dmin
istr
atio
n9
99
Gen
eral
Ins
titut
iona
l9
9
Stud
ent S
ervi
ces
99
Publ
ic R
elat
ions
and
Dev
elop
men
t9
9
O&
MO
ther
79
Tot
al9
9C
apita
l Cos
tsG
rand
Tot
al9
9
Aux
.E
nt.
Tot
alT
ier
One
Aca
d.Su
pp.
Lib
s.
Aca
d.C
om.
Serv
.E
xec.
Adm
in.
Gen
.In
st.
Stud
t.Se
rv.
PR and
Dev
.O
&M
Oth
.T
otal
Supp
.
$86
$5,9
25?
??
??
??
??
2,32
918
,975
??
??
??
?1,
945
14,9
85?
??
??
??
??
?11
39,
885
??
??
??
??
??
125
3,03
5?
??
??
??
??
736
3,72
5?
??
??
??
??
655
8,38
0?
??
??
??
??
?49
27,
690
??
??
??
??
??
587,
875
??
??
??
??
108
6,36
7?
??
??
??
?58
10,2
53?
??
??
??
??
6812
,750
??
??
??
??
?6,
773
109,
845
??
??
??
??
43,4
8550
,358
??
??
??
??
06,
330
??
??
??
??
?50
,258
166,
533
$3,9
84$1
1,80
7$5
,250
$15,
615
$14,
086
$20,
447
$11,
255
$22,
025
$6,8
25$1
11,2
94
?3,
984
?11
,807
?5,
250
?15
,615
?14
,086
?20
,447
?11
,255
?22
,025
?6,
825
?11
1,29
4
?27
7,82
7N
ote:
Eve
ry q
uest
ion
mar
k in
dica
tes
a po
tent
ial a
dditi
on to
or d
educ
tion
from
the
part
icul
ar c
ost l
ine.
Und
er th
est
ep-d
own
met
hod,
tier
s-tw
o th
roug
h tie
r-fo
ur c
osts
are
fir
st a
lloca
ted
to e
ach
supp
ort a
ccou
nt a
nd th
endi
stri
bute
d am
ong
the
prim
ary
prog
ram
s. O
nce
all
supp
ort c
osts
hav
e be
en a
lloca
ted,
the
entir
e bl
ock
of q
uest
ion
mar
ks w
ill h
ave
a va
lue
of z
ero.
BE
ST C
OPY
AV
AIL
AB
LE

Figu
re 4
.4: R
esea
rch
Uni
vers
ity's
Spr
eads
heet
for
Allo
catin
g T
ier-
One
Thr
ough
Tie
r-Fo
ur C
osts
($
in 1
,000
s)
Cos
t Cen
ters
Tie
r-O
neD
irec
t Cos
ts
Tie
r-O
neA
lloca
ted
Cos
tsT
ier-
One
Tot
al C
osts
Lon
g-T
erm
Deb
t Cos
tsT
ier-
Tw
oT
otal
Cos
tsO
ne-Y
ear
Ass
ets
Tie
r-T
hree
Tot
al C
osts
Dep
reci
atio
n
Tie
r-Fo
urT
otal
Cos
ts
Arc
hite
ctur
e$5
,925
??
??
?
Art
s an
d Sc
ienc
es18
,975
??
??
??
??
Bus
ines
s an
d E
cono
mic
s14
,985
??
??
??
?
Edu
catio
n9,
885
??
??
??
?
Env
iron
men
tal S
cien
ces
3,03
5?
??
??
?
Inte
rnat
iona
l Stu
dies
3,72
5?
??
??
?
Law
and
Pub
lic A
ffai
rs8,
380
??
??
?
Perf
orm
ing
Art
s7,
690
??
??
??
?
Nur
sing
, Par
amed
ical
7,87
5?
??
??
??
?
Phys
ical
and
Mat
hem
atic
al S
cien
ces
6,36
7?
??
??
?
Phys
ical
Edu
catio
n an
d Sp
orts
Med
icin
e10
,253
??
??
??
Soci
al a
nd B
ehav
iora
l Sci
ence
s12
,750
??
??
??
?
Tot
al E
&G
109,
945
??
??
7?
??
Aux
iliar
y E
nter
pris
es50
,258
??
??
??
?
Oth
er6,
330
??
??
??
??
Tot
al16
6,53
3$1
11,2
94$2
77,8
27$4
,238
?$2
,446
?$1
9,25
6?
Supp
ort C
osts
Aca
dem
ic S
uppo
rt3,
984
-3,9
840
??
??
??
Lib
rari
es11
,807
-11,
807
0?
??
Aca
dem
ic C
ompu
ter
Serv
ices
5,25
0-5
,250
0?
??
??
Exe
cutiv
e A
dmin
istr
atio
n15
,615
-15,
615
0?
??
??
?
Gen
eral
Ins
titut
iona
l14
,086
-14,
086
0?
??
??
?
Stud
ent S
ervi
ces
20,4
47-2
0,44
70
?7
??
??
Publ
ic R
elat
ions
and
Dev
elop
men
t11
,255
-11,
255
0?
??
??
O&
M22
,025
-22,
025
0?
??
??
Oth
er6,
825
-6,8
250
??
??
??
Tot
al11
1,29
4-1
11,2
940
??
??
??
Cap
ital C
osts
25,9
40-2
5,94
00
??
??
??
Gra
nd T
otal
303,
767
-25,
940
277,
827
4,23
828
2,06
52,
446
284,
511
19,2
5630
3,76
7
Not
e: E
very
que
stio
n m
ark
indi
cate
s a
pote
ntia
l add
ition
to o
r de
duct
ion
from
the
part
icul
ar c
ost
line.
Und
er th
e st
ep-d
own
met
hod,
ier-
two
thro
ugh
tier-
four
cos
ts a
re f
irst
allo
cate
d to
eac
h su
ppor
t
acco
unt a
nd th
en d
istr
ibut
ed a
mon
g th
e pr
imar
y pr
ogra
ms.
Onc
e al
l sup
port
cos
tsha
ve b
een
allo
cate
d, th
e en
tire
bloc
k of
que
stio
n m
arks
will
hav
e a
valu
e of
zer
o.
87
86

Cost Accounting in Higher Education
Figure 4.5: Allocating Research University's Support and Indirect Costs toPrimary Programs; Potential Allocation Bases
Cost Centers Allocation BasesAcademic Support General Personnel compensation
Libraries Student credit hoursFactor combining student/faculty usage
Computer Support Automated or other usage measureFactor combining student/faculty usage
Executive Administration Personnel compensationPublic Relations andDevelopment
Public Relations Personnel compensation
Direct or tier-one costDevelopment Personnel compensation
Percentage of gifts received by each programStudent Services General Personnel compensation
Head count enrollment per programAdmissions Matriculation percentage shares
FTE EnrollmentRegistrar, Student Records Head count enrollment
Student credit hoursPercentage of degrees granted
Student Financial Aid Percentage of students on aidPercentage of student aid applications handledPercentage of matriculating studentsStudent credit hoursPersonnel compensation
Operations and Maintenance Total or assigned square footageFib b student enrollmentCredit hours generated
Auxiliary Enterprises (Room-and-Board-Related only)
Percentage share of revenue generated
Percentage of students housed and/or studentswith food service contracts
Net Long-Term Debt Costs Direct to plant with debtPer student credit hourPercentage of FIB E studentsPercentage of 1- I E. student and staff factorPer square foot of total or assigned space
One-Year Assets Direct to plant account or acquiring programPer student credit hourPercentage of FTE studentsPercentage of FIB b student and staff factorPer square foot of total or assigned space
Depreciation (HistoricalUndepreciated Asset Value ofPlant and Equipment)
Direct to plant for plant assets (includingequipment) and direct to programs forequipment and other acquisitionsTotal or assigned square footageCombination of above two optionsDirect as percentage of student credit hoursDirect as percentage of 1- 1 b students
Note: Some of these allocation bases are best suited for micro-costing, others are most appropriate for macro-costing.
66
88

The Aggregate Full Costs of Major Professional Academic Programs
Model One: The Standard FTFC Model Allocating Tier-Two Through Tier-Four Coststo Primary and Support Cost Centers
This model (figure 4.6) illustrates a pre-SFAS No. 117 cost condition in that it displays both
primary and support program costs. It constitutes the basis for all subsequent models in thisreport and focuses principally on where the step-down method originally allocates tier-two
through tier-four costs. The note in the exhibit identifies the allocation bases used.
In general, all tier-two through tier-four costs are allocated directly to the respective primary
academic and support cost centers. Some academic programs do not have their own facilities
and thus should absorb a share of the capital costs which this model charges only to the primary
programs that have such facilities.The issue of how to allocate shared capital costs is best illustrated by the many different
ways depreciation costs can be computed. Figure 4.5 identified several depreciation costallocation bases. Figure 4.7 illustrates four depreciation cost alternatives (columns B through
E). The cost differences are striking.Research University is a large institution with a diverse inventory of plant and equipment.
Some facilities are very old, but have been renovated periodically. Historical facility values
range from modest to high, and most important, some academic programs enjoy conspicuously
more modern facilities than others. Which of the costing approaches shown provides the most
accurate picture of the distribution of depreciation costs?Square footage is the most popular base and yields the most precise allocated costs when the
allocation takes place within rather than among programs and facilities. The two square footage
illustrations (columns D and E) bear little relationship to the actual asset values that must be
depreciated, but when separate square footage bases are used for the educational and general,
auxiliary enterprises, and support accounts, and all shared facilities costs are properlydistributed, distortions are somewhat smaller. Any averaging of support depreciation costs, as
in the example of the libraries, understates the direct depreciation cost and can force other
functions to absorb unrealistic amounts of depreciation. The four examples suggest that the
combined base for value plus square footage for shared facilities appears to be the most
accurate. Since Research University maintains a detailed equipment and facilities inventory, its
accounting and budgeting system routinely allocates tier-two through tier-four costs directly to
each facility and to each department. Thus, little or no averaging of depreciation costs occurs
among groups of accounts.
Model Two: Model One Modified by Allocating All Shared Tier-Two Through Tier-FourCosts Among Primary Cost Centers
Relying in part on data from figure 4.7, figure 4.8 presents primary academic and support
program costs after shared tier-two through tier-four costs have been allocated among primary
academic program cost centers. The depreciation cost equivalent of the share of program space
occupied is transferred from the host to the sharing program. Tier-two through tier-four support
costs are not yet affected in this alternative.
67 89

Cost Accounting in Higher Education
Model Three: Allocating All Tier-One Support Costs to the Primary Academic Programs
This model (Figure 4.9) allocates support costs using a mixture of allocation bases. Theunallocated support-cost balances are much smaller in this example. Figure 4.10 presents theallocations and identifies the allocation bases used. The exhibit lists each support cost accountand shows how the total cost of each support function is allocated to the various academicprograms. Only tier-one costs are being allocated here. Figure 4.11 provides the tier-twothrough tier-four allocation details.
Figure 4.6: Research University's Model-One IFTFC Matrix for Tier-One ThroughTier-Four Costs of Primary and Support Programs ($ in 1,000s)
Cost Centers
Tier-OneDirectCosts
Long-TermDebtCosts
One-YearAssets
DepreciationCosts
TotalTier-Four
CostsPrimary Programs
Architecture $5,925 $185 $23 $315 $6,448Arts and Sciences 18,975 815 225 4,417 24,432Business and Economics 14,985 892 185 424 16,486Education 9,885 0 15 3 9,903Environmental Sciences 3,035 0 15 1 3,051International Studies 3,725 0 5 2 3,732Law and Public Affairs 8,380 0 26 679 9,085Performing Arts 7,790 135 125 576 8,626Nursing, Paramedical 7,875 0 55 22 7,952Physical and Mathematical Sciences 6,367 250 42 909 7,568Physical Education and Sports Medicine 10,253 0 95 791 11,139Social and Behavioral Sciences 12,750 0 76 200 13,026
Total E&G 109,945 2,277 887 8,339 121,448Auxiliary Enterprises 50,258 1,493 475 7,996 60,222Other 6,330 0 5 1 6,336
Total Primary 166,533 3,770 1,367 16,336 188,006Support Activities
Academic Support 3,984 0 15 3 4,002Libraries 11,807 35 125 1,038 13,005Academic Computer Services 5,250 150 146 11 5,557Executive Administration 15,615 0 15 991 16,621General Institutional 14,086 0 320 225 14,631Student Services 20,447 0 55 8 20,510Public Relations and Development 11,255 0 15 3 11,273O&M 22,025 283 376 640 23,324Other 6,825 0 12 1 6,838
Total Support 111,294 468 1,079 2,920 115,761Total Costs 277,827 4,238 2,446 19,256 303,767
Note: Long-term debt costs are allocated directly to plant and equipment financed with deb . One-year assets are charged directly to the acquiringdepartments. Depreciation is allocated on the basis of the actual depreciation rates for each asset class and charged directly to each department. Sharedfacilities costs have not yet been allocated.
68

The Aggregate Full Costs of Major Professional Academic Programs
Figure 4.7: Four Depreciation Methods for Research University ($ in 1,000s)
Cost Centers(A)
Model OneValue Base
(B)
Model TwoValue Plus
Square Feetfor SharedFacilities
(C)
Square FootMethod for
PooledDepreciation
Costs(D)
Square FootMethod
SeparatingKey Functions
(E)Primary Programs
Architecture $315 $315 $818 $749Arts and Sciences 4,417 3,910 2,551 2,334Business and Economics 424 424 1,007 921
Education 3 158 485 444Environmental Sciences 1 85 439 402International Studies 2 62 381 349Law and Public Affairs 679 679 678 620Performing Arts 576 689 625 571
Nursing, Paramedical 22 78 24 22
Physical and Mathematical Sciences 909 823 620 567
Physical Education and Sports Medicine 791 791 815 745
Social and Behavioral Sciences 200 325 674 616Total E&G 8,339 8,339 9,117 8,340
Auxiliary Enterprises 7,996 7,996 3,091 7,996Other 1 1 175 1
Total Primary 16,336 16,336 12,383 16,337
Support ActivitiesAcademic Support 4 98 722 307
Libraries 1,636 1,582 1,026 436Academic Computer Services 11 78 570 242
Executive Administration 3 65 497 211
General Institutional 265 223 786 334
Student Services 3 62 813 345
Public Relations and Development 3 28 491 209
O&M 995 784 1,781 757
Other 0 0 187 79
Total Support 2,920 2,920 6,873 2,920Total Costs 19,256 19,256 19,256 19,256
Note: Column B: Facilities sharing programs show only equipment depreciation.Column C: Sharing programs show depreciation costs in direct proportion to square feet they occupy.
Column D: Prorates depreciation costs in proportion to total square feet.Column E: Does the same thing but within each "functional" group.
Model Two shows the most precise method
Model Four: Allocating All Support Costs to Primary Academic Programs
One conceivable post-SFAS No. 117 full-cost version is depicted in figure 4.12, where allsupport costs have been fully allocated to the primary academic programs. There remain noresidual support costs. Figure 4.13 supplies the allocation detail for the remaining tier-twothrough tier-four costs.
9169

Cost Accounting in Higher Education
Figure 4.8: Research University's Model Two Academic Program Cost AllocatingTier-Two Through Tier-Four Costs Among Shared Facilities Only ($ in 1,000s)
Cost Centers
Tier-OneTotalCosts
Long-TermDebtCosts
One-YearAssets
l epreciationCosts
TotalTier-Four
CostsPrimary Programs
Architecture $5,925 $185 $23 $315 $6,448Arts and Sciences 18,975 815 225 3,910 23,925Business and Economics 14,985 892 185 424 16,486Education 9,885 0 15 158 10,058Environmental Sciences 3,035 0 15 85 3,135International Studies 3,725 0 5 62 3,792Law and Public Affairs 8,380 0 26 679 9,085Performing Arts 7,790 135 125 689 8,739Nursing, Paramedical 7,875 0 55 78 8,008Physical and Mathematical Sciences 6,367 250 42 823 7,482Physical Education and Sports Medicine 10,253 0 95 791 11,139Social and Behavioral Sciences 12,750 0 76 325 13,151
Total E&G 109,945 2,277 887 8,339 121,448Auxiliary Enterprises 50,258 1,493 475 7,996 60,222Other 6,330 0 5 1 6,336
Total Primary 166,534 3,770 1,367 16,336 188,006Support Activities
Academic Support 3,984 0 15 98 4,097Libraries 11,807 35 125 1,582 13,549Academic Computer Services 5,250 150 146 78 5,624Executive Administration 15,615 0 15 65 15,695General Institutional 14,086 0 320 223 14,629Student Services 20,447 0 55 62 20,564Public Relations and Development 11,255 0 15 28 11,298O&M 22,025 283 376 784 23,468Other 6,825 0 12 0 6,837
Total Support 111,294 468 1,079 2,920 115,761Total Costs 277,827 4,238 2,446 19,256 303,767
Note: Only depreciation costs are affected in this example. Square foot costs are transfened from host to sharing facility. Because of rounding, figuresmay not add up exactly to totals.
Figure 4.14 is a spreadsheet showing an array of percentage distributions for variousallocation bases used in models one through four.
Summary Academic Program Cost Reports
Research University's administration recommends that the governing board consider the FTFCmodels illustrated in figures 4.9 through 4.13 as a basis for future discussions of how theuniversity should eventually report its full academic program costs. If all support and formerlypooled costs must be integrated into each academic program, figure 4.12 may represent theappropriate example. If the university must continue to provide support cost details byfunctions, a decision must be made concerning the extent of indirect versus direct or pooledversus allocated costing. A spreadsheet of the type shown in figure 4.11 would appear to be
70
92

The Aggregate Full Costs of Major Professional Academic Programs
suitable and would ensure time series continuity between pre- and post-SFAS No. 117reporting.
Figure 4.9: esearch University's Model Three Academic Program Cost AllocatingTier-One Support Costs to Primary Academic Programs ($ in 1,000s)
Cost Centers
Tier-OneTotalCosts
Long-TermDebtCosts
One-YearAssets
DepreciationCosts
TotalTier-Four
CostsPrimary Programs
Architecture $13,394 $185 $23 $315 $13,917
Arts and Sciences 50,176 815 225 3,910 55,126
Business and Economics 28,741 892 185 424 30,242
Education 16,314 0 15 158 16,487
Environmental Sciences 6,449 0 15 85 6,549
International Studies 6,526 0 5 62 6,593
Law and Public Affairs 18,016 0 26 679 18,721
Performing Arts 13,579 135 125 689 14,528
Nursing, Paramedical 11,557 0 55 78 11,690
Physical and Mathematical Sciences 13,485 250 42 823 14,600
Physical Education and Sports Medicine 17,557 0 95 791 18,443
Social and Behavioral Sciences 21,540 0 76 325 21,941
Total E&G 217,334 2,277 887 8,339 228,837
Auxiliary Enterprises 54,162 1,493 475 7,996 64,126
Other 6,330 0 5 1 6,336
Total Primary 277,827 3,770 1,367 16,336 299,300
Support ActivitiesAcademic Support 0 0 15 98 113
Libraries 0 35 125 1,582 1,742
Academic Computer Services 0 150 146 78 374
Executive Administration 0 0 15 65 80
General Institutional 0 0 320 223 543
Student Services 0 0 55 62 117
Public Relations and Development 0 0 15 28 43
O&M 0 283 376 784 1,443
Other 0 0 12 0 12
Total Support 0 468 1,079 2,920 4,467
Total Costs 277,827 4,238 2,446 19,256 303,767
Note: Because of rounding, figures may not add up exactly to totals.
719 3

Figu
re 4
.10:
Res
earc
h U
nive
rsity
's M
odel
Thr
ee S
prea
dshe
et S
how
ing
Supp
ort-
Prog
ram
Det
ail a
nd S
uppo
rt-C
ost A
lloca
tion
Bas
es($
in 1
,000
s)
Cos
t Cen
ters
Inst
ruct
ion
Spon
.R
srch
.Pu
blic
Serv
ice
Aux
.E
nt.
Tie
r-O
neD
irec
tC
osts
Aca
d.Su
pp.
Lib
s.
Aca
d.C
om.
Serv
.E
xec.
Adm
in.
Gen
.In
st.
Stud
t.Se
rv.
PR and
Dev
.O
&M
Oth
erSu
pp.
Tot
alSu
pp.
Tot
alT
ier
One
Prim
ary
Prog
ram
sA
rchi
tect
ure
$4,6
45$1
,095
$99
$86
$5,9
25$3
27$1
,006
$447
$711
$1,1
55$8
83$5
95$1
,977
$368
$7,4
69$1
3,39
4A
rts
and
Scie
nces
11,3
115,
257
782,
329
18,9
751,
537
1,61
972
02,
276
5,43
6.7
,521
4,75
16,
164
1,17
831
,201
50,1
76B
usin
ess
and
Eco
nom
ics
9,10
53,
607
328
1,94
514
,985
408
1,39
962
21,
773
1,44
42,
625
2,12
22,
433
930
13,7
5628
,741
Edu
catio
n7,
211
2,52
635
113
9,88
529
266
829
782
61,
031
1,46
762
1,17
261
46,
429
16,3
14E
nvir
onm
enta
l Sci
ence
s1,
735
1,15
718
125
3,03
514
054
124
028
349
439
968
1,06
118
83,
414
6,44
9In
tern
atio
nal S
tudi
es1,
325
1,54
312
173
63,
725
102
416
185
266
361
320
092
123
12,
801
6,52
6L
aw a
nd P
ublic
Aff
airs
7,11
555
555
655
8,38
089
1,51
267
31,
656
314
1,82
21,
413
1,63
752
09,
636
18,0
16Pe
rfor
min
g A
rts
5,84
01,
235
123
492
7,69
012
985
638
153
845
882
561
01,
509
484
5,78
913
,579
Nur
sing
, Par
amed
ical
7,08
673
10
587,
875
170
616
274
557
600
918
058
489
3,68
211
,557
Phys
ical
and
Mat
hem
atic
al S
cien
ces
4,11
52,
096
4810
86,
367
169
1,43
863
983
659
996
058
41,
498
395
7,11
813
,485
Phys
ical
Edu
catio
n an
d Sp
orts
Med
icin
e8,
117
2,07
80
5810
,253
281
629
280
764
994
1,05
170
01,
968
636
7,30
417
,557
Soci
al a
nd B
ehav
iora
l Sci
ence
s9,
468
3,18
925
6812
,750
339
1,10
649
21,
226
1,20
01,
656
351
1,62
879
18,
790
21,5
40T
otal
E&
G77
,073
25,0
6993
06,
773
109,
845
3,98
411
,807
5,25
011
,711
14,8
0620
,447
11,2
5522
,025
6,82
510
7,39
021
7,33
5A
uxili
ary
Ent
erpr
ises
5,33
01,
295
248
43,4
8550
,358
00
03,
904
00
00
03,
904
54,1
62O
ther
-4,9
786,
156
5,15
20
6,33
00
00
00
00
00
06,
330
Tot
al. P
rim
ary
77,4
2532
,520
6.33
050
,258
166,
533
3,98
411
,807
5,25
015
,615
14,0
8620
,447
11,2
5522
,025
6,82
511
1,29
427
7,82
7Su
ppor
t Act
iviti
esA
cade
mic
Sup
port
3,15
283
20
03,
984
Lib
rari
es6;
798
4,99
415
011
,807
Aca
dem
ic C
ompu
ter
Serv
ices
2,73
52,
515
00
5,25
0E
xecu
tive
Adm
inis
trat
ion
10,1
501,
465
565
3,43
515
,615
Gen
eral
Ins
titut
iona
l12
,575
1,38
512
60
14,0
86St
uden
t Ser
vice
s20
,447
00
020
,447
Publ
ic R
elat
ions
and
Dev
elop
men
t6,
128
3,82
61,
301
011
,255
O&
M14
,686
5,23
22,
107
022
,025
Oth
er6,
825
00
06,
825
Tot
al S
uppo
rt83
,496
20,2
494,
114
3,43
511
1,29
4-'
Gra
nd T
otal
160,
921
52,7
6910
,444
53,6
9327
7,82
7
Not
e: E
ach
supp
ort c
ost c
ateg
ory
has
its d
istin
ct a
lloca
tion
base
:A
cade
mic
Sup
port
: Stu
dent
cre
dit h
ours
, E&
G o
nly.
Stud
ent S
ervi
ces:
Stu
dent
cre
dit h
our
shar
es a
nd o
ther
.L
ibra
ries
: Sha
res
of w
eigh
ted
stud
ent/f
acul
ty r
atio
, sha
res
of E
&G
onl
y.Pu
blic
Rel
atio
ns a
id D
evel
opm
ent:
Perc
ent o
f gi
fts
rais
ed o
n be
half
of
prog
ram
.A
cade
mic
Com
pute
r Se
rvic
es: S
hare
s of
wei
ghte
d st
uden
t/fac
ulty
rat
io, s
hare
s of
E&
G o
nly.
O&
M: P
erce
nt o
f sq
uare
fee
t of
E&
G.
Exe
cutiv
e A
dmin
istr
atio
n: 2
5 pe
rcen
t bal
ance
to a
uxili
ary
ente
rpri
ses,
bal
ance
to p
erso
nnel
com
pens
atio
n of
E&
G.
Oth
er: T
ier-
one
dire
ct c
osts
of
E&
G.
Gen
eral
Ins
titut
iona
l: St
uden
t cre
dit h
our
shar
es.
The
per
cent
age
dist
ribu
tions
can
be
foun
d in
Fig
ure
4.14
. Stu
dent
ser
vice
s co
sts
are
a co
mpo
site
of
the
four
cos
t cen
ters
iden
tifie
d be
low
on
the
righ
t sid
e of
this
tabl
e. P
leas
e no
te th
at d
irec
t cos
t sha
res
have
bee
n us
edon
ly f
or O
ther
Sup
port
.
95

Figu
re 4
.11:
Res
earc
h U
nive
rsity
's M
odel
Thr
eeT
ier-
One
Thr
ough
Tie
r-Fo
ur P
rim
ary
and
Supp
ort P
rogr
am C
osts
($
in 1
,000
s)
Cos
t Cen
ters
Inst
ruct
ion
Spo
n.R
srch
.P
ublic
Ser
vice
Aux
.E
nt.
Tie
r-O
neD
irect
Cos
ts
Allo
cate
dS
uppo
rtC
osts
Fin
alT
ier-
One
Cos
ts
Long
-T
erm
Deb
tC
osts
Tie
r-T
wo
Cos
ts
One
-Y
ear
Ass
ets
Tie
r-T
hree
Cos
ts
Dep
rec.
Cos
ts
Val
Sq.
Ft.
Tie
r-F
our
Cos
ts
Prim
ary
Prog
ram
sA
rchi
tect
ure
$4,6
45$1
,095
$99
$86
$5,9
25$7
,469
$13,
394
$185
$13,
579
$23
$13,
602
$315
$13,
917
Art
s an
d S
cien
ces
11,3
115,
257
782,
329
18,9
7531
,201
50,1
7681
550
,991
225
51,2
163,
910
55,1
26
Bus
ines
s an
d E
cono
mic
s9,
105
3,60
732
81,
945
14,9
8513
,756
28,7
4189
229
,633
185
29,8
1842
430
,242
Edu
catio
n7,
211
2,52
635
113
9,88
56,
429
16,3
140
16,3
1415
16,3
2915
816
,487
Env
ironm
enta
l Sci
ence
s1,
735
1,15
718
125
3,03
53,
414
6,44
90
6,44
915
6,46
485
6,54
9
Inte
rnat
iona
l Stu
dies
1,32
51,
543
121
736
3,72
52,
801
6,52
60
6,52
65
6,53
162
6,59
3
Law
and
Pub
lic A
ffairs
7,11
555
555
655
8,38
09,
636
18,0
160
18,0
1626
18,0
4267
918
,721
Per
form
ing
Art
s5,
840
1,23
512
349
27,
790
5,78
913
,579
135
13,7
1412
513
,839
689
14,5
28
Nur
sing
, Par
amed
ical
7,08
673
10
587,
875
3,68
211
,557
011
,557
5511
,612
7811
,690
Phy
sica
l and
Mat
hem
atic
al S
cien
ces
4,11
52,
096
4810
86,
367
7,11
813
,485
250
13,7
3542
13,7
7782
314
,600
Phy
sica
l Edu
catio
n an
d S
port
s M
edic
ine
8,11
72,
078
058
10,2
537,
304
17,5
570
17,5
5795
17,6
5279
118
,443
Soc
ial a
nd B
ehav
iora
l Sci
ence
s9,
468
3,18
925
6812
,750
8,79
021
,540
021
,540
7621
,616
325
21,9
41
Tot
al E
&G
77,0
7325
,069
930
6,77
310
9,94
510
7,38
921
7,33
42,
277
219,
611
887
220,
498
8,33
922
8,83
7
Aux
iliar
y E
nter
pris
es5,
330
1,29
524
843
,485
50,2
583,
904
54,1
621,
493
55,6
5547
556
,130
7,99
664
,126
Oth
er-4
,978
6,15
65,
152
06,
330
06,
330
06,
330
56,
335
16,
336
Tot
al P
rimar
y77
,425
32,5
206,
330
50,2
5816
6,53
311
1,29
427
7,82
73,
770
281,
597
1,36
728
2,96
316
,336
299,
300
Supp
ort A
ctiv
ities
Aca
dem
ic S
uppo
rt3,
152
832
00
3,98
4-3
,984
00
015
1598
113
Libr
arie
s6,
798
4,99
415
011
,807
-11,
807
035
3512
516
01,
582
1,74
2
Aca
dem
ic C
ompu
ter
Ser
vice
s2,
735
2,51
50
05,
250
-5,2
500
150
150
146
296
7837
4
Exe
cutiv
e A
dmin
istr
atio
n10
,150
1,46
556
53,
435
15,6
15-1
5,61
50
00
1515
6580
Gen
eral
Inst
itutio
nal
12,5
751,
385
126
014
,086
-14,
086
00
032
032
022
354
3
Stu
dent
Ser
vice
s20
,447
00
020
,447
-20,
447
00
055
5562
117
Pub
lic R
elat
ions
and
Dev
elop
men
t6,
128
3,82
61,
301
011
,255
-11,
255
00
015
1528
43
O&
M14
,686
5,23
22,
107
022
,025
-22,
025
028
328
337
665
978
41,
443
Oth
er6,
825
00
06,
825
-6,8
250
00
1212
012
Tot
al S
uppo
rt83
,496
20,2
494,
114
3,43
511
1,29
4-1
11,2
940
468
468
1,07
91,
547
2,92
04,
467
Gra
nd T
otal
160,
921
52,7
6910
,444
53,6
9327
7,82
70
04,
238
282,
065
2,44
628
4,51
019
,256
303,
767
Not
e: B
ecau
se o
f rou
ndin
g, fi
gure
s m
ay n
ot a
dd u
p ex
actly
to to
tals
.
9697

Figu
re 4
.12:
Res
earc
h U
nive
rsity
's M
odel
Fou
r Sp
read
shee
t Sho
win
g Fu
ll A
lloca
tion
of T
ier-
Tw
o T
hrou
ghT
ier-
Four
Sup
port
Cos
ts to
Pri
mar
y Pr
ogra
ms
($ in
1,0
00s)
Cos
t Cen
ters
Inst
r.S
pon.
Rsr
ch.
Pub
licS
ervi
ceA
ux.
Ent
.
Tie
r-O
neD
irect
Cos
ts
Tie
r-O
ne
Sup
port
Cos
ts
Tot
alT
ier-
One
Cos
ts
Dire
ctLo
ng-
Ter
mD
ebt
Cos
ts
Sup
port
Long
-T
erm
Deb
tC
osts
Tie
r-T
wo
Cos
ts
Dire
ctO
ne-
Yea
rA
sset
s
Sup
p.O
ne-
Yea
rA
sset
s
Tie
r-T
hree
Cos
ts
Dire
ctD
epre
c.C
osts
Val
./Sq.
Ft.
Sup
p.D
epre
c.C
osts
Val
./Sq.
Ft.
Tie
r- F
our
Cos
tsP
rimar
y P
rogr
ams
Arc
hite
ctur
e$4
,645
$1,0
95$9
9$8
6$5
,925
$7,4
69$1
3,39
4$1
85$2
3$1
3,60
2$2
3$5
7$1
3,68
2$3
15$3
19$1
4,31
6A
rts
and
Sci
ence
s11
,311
5,25
778
2,32
918
,975
31,2
0150
,176
815
208
51,1
9922
542
751
,851
3,91
01,
054
56,8
15B
usin
ess
and
Eco
nom
ics
9,10
53,
607
328
1,94
514
,985
13,7
5628
,741
892
189
29,8
2218
512
230
,129
424
281
30,8
34E
duca
tion
7,21
12,
526
3511
39,
885
6,42
916
,314
00
16,3
1415
5116
,380
158
199
16,7
37-E
nviro
nmen
tal S
cien
ces
1,73
51,
157
1812
53,
035
3,41
46,
449
00
6,44
915
246,
488
8596
6,67
0In
tern
atio
nal S
tudi
es1,
325
1,54
312
173
63,
725
2,80
16,
526
00
6,52
65
186,
459
6270
6,68
1La
w a
nd P
ublic
Affa
irs7,
115
555
5565
58,
380
9,63
618
,016
00
18,0
1626
156
18,1
9867
995
18,9
71P
erfo
rmin
g A
rts
5,84
01,
235
123
492
7,79
05,
789
13,5
7913
517
13,7
3112
557
13,9
1368
991
14,6
92N
ursi
ng, P
aram
edic
al7,
086
731
058
7,87
53,
682
11,5
570
011
,557
5530
11,6
4278
118
11,8
37P
hysi
cal a
nd M
athe
mat
ical
Sci
ence
s4,
115
2,09
648
108
6,36
77,
118
13,4
8525
031
13,7
6642
3013
,838
823
138
14,7
99
Phy
sica
l Edu
catio
n an
dS
port
s M
edic
ine
8,11
72,
078
058
10,2
537,
304
17,5
570
017
,557
9549
17,7
0179
122
318
,715
Soc
ial a
nd B
ehav
iora
lS
cien
ces
9,46
83,
189
2568
12,7
508,
790
21,5
400
021
,540
7659
21,6
7532
523
622
,237
Tot
al E
&G
77,0
7325
,069
930
6,77
310
9,94
510
7,38
921
7,33
42,
277
468
220,
079
887
1,07
922
2,04
58,
339
2,92
023
3,30
4A
uxili
ary
Ent
erpr
ises
5,33
01,
295
248
43,4
8550
,258
3,90
454
,162
1,49
30
55,6
5547
50
56,1
307,
996
064
,126
Oth
er-4
,978
6,15
65,
152
06,
330
06,
330
00
6,33
05
06,
335
10
6,33
6T
otal
Prim
ary
77,4
2532
,520
6,33
050
,258
166,
533
111,
294
277,
827
3,77
046
828
2,06
51,
367
1,07
928
4,51
116
,336
2,92
030
3,76
7
Not
e: A
ll su
ppor
t cos
ts a
re n
ow z
eroe
d ou
t. T
ier-
one
thro
ugh
tier
four
sup
port
(or
indi
rect
) co
sts
are
show
n in
thei
r se
para
te r
espe
ctiv
e co
lum
ns. B
ecau
se o
fro
undi
ng, f
igur
es m
ay n
ot a
dd u
p ex
actly
to to
tals
.
98
BE
ST
CO
PY
AV
AIL
AB
LE
99

The Aggregate Full Costs of Major Professional Academic Programs
Figure 4.13: Research University's Model Spreadsheet Showing Allocation Detail forTier-Two Through Tier-Four Support Costs Remaining in Model Three ($ in 1,000s)
DepreciationAcad.Supp. Libs.
Acad.Corn.Serv.
Exec.Admin.
Gen.Inst.
Studt.Serv.
PRandDev. O&M Other Total
Architecture $38 $130 $6 $0 $18 $62 $0 $64 $0 $319Arts and Sciences 10 610 30 15 86 0 0 303 0 1,054Business and Economics 7 162 8 0 23 0 0 80 0 281
Education 3 116 6 0 16 0 0 57 0 199
Environmental Sciences 3 56 3 0 8 0 0 28 0 96International Studies 2 40 2 0 6 0 0 20 0 70Law and Public Affairs 3 35 2 32 5 0 0 17 0 95
Performing Arts 4 51 3 0 7 0 0 25 0 91
Nursing, Paramedical 4 67 3 0 9 0 0 33 0 118
Physical and Mathematical Sciences 7 67 3 18 9 0 0 33 0 138
Physical Education and SportsMedicine
7 112 6 0 16 0 28 55 0 223
Social and Behavioral Sciences 9 135 7 0 19 0 0 67 0 236Total E&G 98 1,582 78 65 223 62 28 784 0 2,920
Allocation Bases Std.CreditHours
Std.CreditHours
Std.CreditHours
Direct Std.CreditHours
Direct Direct Std.CreditHours
One-Year AssetsAcad.Supp. Libs.
Acad.Corn.Serv.
Exec.Admin.
Gen.Inst.
Studt.Serv.
PRandDev. O&M Other Total
Architecture $0 $0 $0 $0 $26 $0 $0 $31 $0 $57
Arts and Sciences 15 0 61 15 123 55 0 145 12 427
Business and Economics 0 0 50 0 33 0 0 39 0 122
Education 0 0 0 0 23 0 0 28 0 51
Environmental Sciences 0 0 0 0 11 0 0 13 0 24
International Studies 0 0 0 0 8 0 0 10 0 18
Law and Public Affairs 0 125 0 0 7 0 15 8 0 156
Performing Arts 0 0 34 0 10 0 0 12 0 57
Nursing, Paramedical 0 0 0 0 14 0 0 16 0 30
Physical and Mathematical Sciences 0 0 0 0 14 0 0 16 0 30
Physical Education and Sports Medicine 0 0 0 0 23 0 0 27 0 49
Social and Behavioral Sciences 0 0 0 0 27 0 0 32 0 59
Total E&G 15 125 146 15 320 55 15 376 0 1,079
Allocation Bases Direct Direct % Shareto Users
Direct Std.CreditHours
Direct Direct Std.CreditHours
Direct
Long-Term Debt CostsAcad.Supp. Libs.
Acad.Corn.Serv.
Exec.Admin.
Gen.Inst.
Studt.Serv.
PRandDev. O&M Other Total
Architecture $0 $0 $0 $0 $0 $0 $0 $23 $0 $23
Arts and Sciences 0 35 72 0 0 0 0 101 0 208
Business and Economics 0 0 79 0 0 0 0 111 0 189
Education 0 0 0 0 0 0 0 0 0 0
Environmental Sciences 0 0 0 0 0 0 0 0 0 0
International Studies () 0 () 0 0 0 0 0 0 0
Law and Public Affairs 0 0 0 0 0 0 0 0 0 0
Performing Arts 0 0 0 0 0 0 0 17 0 17
Nursing, Paramedical 0 0 0 0 0 0 0 0 0 0
Physical and Mathematical Sciences 0 0 0 0 0 0 0 31 0 31
Physical Education and Sports Medicine 0 0 0 0 0 0 0 0 0 0
Social and Behavioral Sciences 0 0 0 0 0 0 0 0 0 0
Total E&G 0 35 150 0 0 0 0 283 0 468
Allocation Bases Direct % Shareto
Borrowers
%Share
of Debt
75101)

Figu
re 4
.14:
Res
earc
h U
nive
rsity
's S
prea
dshe
et o
f C
ost A
lloca
tion
Bas
es H
ighl
ight
ing
Mul
tiple
Allo
catio
n B
ases
Cos
t Cen
ters
Tie
r-O
neD
irec
tC
osts
Tot
alD
epr.
Ass
etV
alue
s
Tot
alSq
uare
Feet
Squa
reFe
et %
Act
ual
Dep
r.R
ate
Stud
ent
Cre
dit
Hou
rs
Wei
ghte
dSt
uden
t/Fa
culty
Fact
or
% S
hare
sof
FIT
Stud
ents
% S
hare
sof
New
Mat
ricu
.
% S
hare
sof
Deg
rees
Prod
uced
% S
hare
sof
Stud
ents
with
Aid
Num
ber
of F
TE
Facu
lty
Num
ber
of F
TE
Stud
ents
Prim
ary
Prog
ram
sA
rchi
tect
ure
$5,9
25$8
,825
18,7
304.
25%
4.02
8%8.
20%
12.5
1%2.
55%
1.85
%2.
15%
3.55
%25
02,
934
Art
s an
d Sc
ienc
es18
.975
132,
040
58,3
9313
.25
3.72
538
.59
37.0
845
.16
45.1
846
.52
40.3
24,
419
32,2
32B
usin
ess
and
Eco
nom
ics
14,9
8511
,475
23,0
495.
233.
765
10.2
59.
1512
.28
13.0
213
.22
11.0
61,
202
10,1
43E
duca
tion
9,88
535
11,1
062.
527.
541
7.32
6.82
5.26
7.04
6.22
7.81
515
9,09
9E
nvir
onm
enta
l Sci
ence
s3,
035
1810
,048
2.28
6.95
43.
513.
111.
211.
230.
951.
1011
82,
576
Inte
rnat
iona
l Stu
dies
3,72
521
8,72
61.
987.
213
2.56
2.40
1.85
0.85
0.83
1.12
181
5,14
2L
aw a
nd P
ublic
Aff
airs
8,38
017
,625
15,5
133.
524.
025
2.23
4.29
8.55
9.12
8.92
7.22
837
6,53
4Pe
rfor
min
g A
rts
7,79
014
,295
14,2
953.
244.
102
3.25
5.26
3.29
4.34
2.95
2.75
322
4,44
1N
ursi
ng, P
aram
edic
al7,
875
545
545
0.12
4.01
24.
263.
984.
264.
283.
285.
1541
67,
969
Phys
ical
and
Mat
hem
atic
al S
cien
ces
6,36
722
,698
14,1
913.
224.
005
4.25
3.85
4.75
3.08
3.82
6.38
465
3,81
8Ph
ysic
al E
duca
tion
and
Spor
tsM
edic
ine
10,2
5321
,525
18,6
424.
233.
675
7.06
4.27
4.29
3.26
3.29
6.29
419
7,86
1
Soci
al a
nd B
ehav
iora
l Sci
ence
s12
,750
5,28
515
,425
3.50
3.77
58.
527.
286.
556.
757.
857.
2564
16,
841
Tot
al E
&G
109,
945
234,
387
208,
662
47.3
510
0.00
100.
0010
0.00
100.
0010
0.00
100.
009,
785
99,5
92A
uxili
ary
Ent
erpr
ises
50,3
5822
3,52
570
,733
16.0
53.
585
Oth
er6,
330
114,
010
0.91
7.15
3T
otal
Pri
mar
y16
6,53
345
7,92
328
3,40
564
.31
100.
0010
0.00
100.
0010
0.00
100.
0010
0.00
Supp
ort A
ctiv
ities
Aca
dem
ic S
uppo
rt3,
984
4916
,526
3.75
6.82
0L
ibra
ries
11,8
0722
,819
23,4
905.
335.
001
Aca
dem
ic C
ompu
ter
Serv
ices
5,25
012
913
,045
2.96
8.51
0E
xecu
tive
Adm
inis
trat
ion
15,6
1535
11,3
702.
587.
001
Gen
eral
Ins
titut
iona
l14
,086
6,56
917
,981
4.08
3.42
1St
uden
t Ser
vice
s20
,447
4818
,598
4.22
6.80
2Pu
blic
Rel
atio
ns a
nd D
evel
opm
ent
11,2
5542
11,2
382.
556.
721
O&
M22
,025
26,5
8740
,765
9.25
3.53
4O
ther
6,82
57
4,27
50.
976.
922
Tot
al S
uppo
rtr
111,
294
56,2
8515
7,28
735
.69
Cap
ital C
osts
25,9
40G
rand
Tot
al30
3,76
751
4,20
844
0,70
410
0.00
3.75
2
Not
e: B
ecau
se o
f ro
undi
ng, f
igur
es m
ay n
o ad
d up
exa
ctly
to to
tals
.
102

Figu
re 4
.14
(con
tinue
d): R
esea
rch
Uni
vers
ity's
Spr
eads
heet
of C
ost A
lloca
tion
Bas
es H
ighl
ight
ing
Mul
tiple
Allo
catio
n B
ases
Cos
t Cen
ters
Stud
ent /
Facu
ltyR
atio
% S
hare
s of
FTE
Facu
lty
% S
hare
s of
Tie
r-O
neC
osts
% S
hare
s of
Tie
r-O
neC
osts
% S
hare
sT
ier-
One
Pers
onne
lC
omp.
% S
hare
sT
ier-
One
Pers
onne
lC
omp.
% S
hare
sE
&G
Pers
onne
lC
omp.
% S
hare
s of
Gif
tsPr
oduc
ed
% S
hare
s of
Tot
alE
mpl
oyee
s
% S
hare
s of
Tot
alE
mpl
oyee
s
Prim
ary
Prog
ram
sA
rchi
tect
ure
8.52
%41
7.87
%1.
95%
3.56
%2.
85%
4.95
%6.
07%
5.29
%2.
25%
4.11
%
Art
s an
d Sc
ienc
es13
.71
4,59
0.14
6.25
11.3
98.
2315
.85
19.4
342
.21
7.35
14.2
6
Bus
ines
s an
d E
cono
mic
s11
.85
1,44
4.53
4.93
9.00
7.01
12.3
515
.14
18.8
56.
3511
.15
Edu
catio
n5.
661,
295.
783.
255.
943.
115.
757.
050.
553.
754.
92
Env
iron
men
tal S
cien
ces
4.58
366.
911.
001.
821.
151.
972.
420.
601.
351.
95
Inte
rnat
iona
l Stu
dies
3.52
732.
281.
232.
241.
231.
852.
270.
001.
671.
65
Law
and
Pub
lic A
ffai
rs12
.81
930.
502.
765.
036.
4511
.53
14.1
412
.55
5.11
10.1
5
Perf
orm
ing
Art
s7.
2563
2.49
2.56
4.68
3.22
3.75
4.60
5.42
3.01
4.25
Nur
sing
, Par
amed
ical
5.22
1,13
4.91
2.59
4.73
3.55
3.88
4.76
0.00
3.12
3.95
Phys
ical
and
Mat
hem
atic
al S
cien
ces
12.1
854
3.68
2.10
3.82
6.05
5.82
7.14
5.19
4.25
6.29
Phys
ical
Edu
catio
n an
d Sp
orts
Med
icin
e5.
331,
119.
503.
386.
163.
355.
326.
526.
223.
226.
74
Soci
al a
nd B
ehav
iora
l Sci
ence
s9.
3797
4.22
4.20
7.66
4.25
8.54
10.4
73.
124.
867.
55
Tot
al E
&G
100.
0010
0.00
36.1
966
.02
50.4
581
.56
100.
0010
0.00
46.2
976
.97
Aux
iliar
y E
nter
pris
es16
.54
30.1
811
.52
16.9
214
.85
21.9
8
Oth
er2.
083.
800.
951.
521.
251.
05
Tot
al P
rim
ary
54.8
210
0.00
62.9
210
0.00
62.3
910
0.00
Supp
ort A
ctiv
ities
Aca
dem
ic S
uppo
rt1.
314.
493.
75
Lib
rari
es3.
895.
224.
58
Aca
dem
ic C
ompu
ter
Serv
ices
1.73
3.45
2.52
Exe
cutiv
e A
dmin
istr
atio
n5.
145.
255.
75
Gen
eral
Ins
titut
iona
l4.
643.
394.
05
Stud
ent S
ervi
ces
6.73
5.72
6.55
Publ
ic R
elat
ions
and
Dev
elop
men
t3.
713.
994.
11
O&
M7.
254.
825.
15
Oth
er2.
250.
751.
15
Tot
al S
uppo
rt36
.64
37.0
837
.61
Cap
ital C
osts
8.54
0.00
0.00
Gra
nd T
otal
100.
0010
0.00
100.
00
103
BE
ST C
OPY
AV
AIL
AB
LE
104
CD
CC
)
CT
)
11)
C) 0 Co
Co 0 Co O 13 -a rA 5 0> n.
tD 3 ci O-a co

Cost Accounting in Higher Education
Meeting:lhe Affinity-Test
In general, models three-and four use allocation bases that have a veryhigh.degreeof -affinity,: whereasthe:alternative:relies heavily on tier-one percentageshares :as anallocation base. Unless-tier -one costscatiiiispecific:.types of support-costs and. indirect costs;. there is no realaffinity: ThiS illustration.was.chosen
becaUstitheNACUBO.literature cites tier -one or directscostsms.arrappropriate,allocationibasaand because
thiSibasaispart-of the Circular:A-21- allocation base.package.. .
:::A;u3delsAhree,and four.useieveral enrollment-centered.allocation.baseS.:.Erirollmerits 'directly:affectacademic-support program-costs:-.0f Specialinterest isthe-combined student credit -hour; FTE1aculty-
febtor::-ThiSis-a weighted percentage of.student-faculty-usage .andia suitable for distribUting:yarious typesotadadeMic.support costs.Thisfactor is calculated by-assigning weights:respectivelytocredit hours
gerierated:andto faculty size:.The weighted number is then expressed.asa-percentageotthe totalweightedmumbers; and this percentage is finally used to allocate the cost in question: SUch-weighted
numberware:used in modem-responsibility-center budgeting:!..
.FPT:exampleif a program.(e.g.-,- architecture) engenders 35,20aCredit-hours peryearandlibrary usage
giVAS:thiSsprograma weight-of 1.5 for thesecredit.hours; the,weightedInumber is 52;812::Thesecredit hours
areTelatedlo 250 FTEfaculty who, given their professional. assignments'with'respect to-library:use; have a
weight-of 1.25,-.:for a weighted number of 3,125:.The weighted total. is 38,333-or 12.51 percant.of the total
weighted-number of 306,419._
.*.SeeZdivard L. Whalen, Responsibility CenterBudgeting:AnApproachto-Decentralized Management for
InstitutiOnsf Higher EdUcation (Bloomington, Ind.: Indiana UniversityPress; 1991), chapters5and
Figure 4.15 illustrates a simplified summary cost report that identifies only the primary
academic programs and is based on figure 4.12.
Figure 4.15: Research University's FTFC Matrix for Primary Academic Programs ($ in 1,000s)
Cost CentersTier-One
Costs
Long-Term Debt
CostsOne-Year
Asset CostsDepreciation
Costs
TotalTier-Four
Costs
Primary ProgramsArchitecture $13,394 $208 $80 $634 $14,316
Arts and Sciences 50.176 1.023 652 4,964 56.815
Business and Economics 28,741 1,081 307 705 30.834
Education 16,314 0 66 357 16,737
Environmental Sciences 6,449 0 39 181 6.669
International Studies 6.526 0 23 132 6,681
Law and Public Affairs 18.016 0 182 774 18.972
Performing Arts 13.579 152 182 780 14,693
Nursing. Paramedical 11,557 0 85 196 11.838
Physical and Mathematical Sciences 13.485 281 72 961 14,799
Physical Education and Sports Medicine 17,557 0 144 1,014 18,715
Social and Behavioral Sciences 21,540 0 135 561 22.236
Total E&G 217.334 2,745 1,967 11.259 233.305
Auxiliary Enterprises 54,162 1.493 475 7,996 64.126
Other 6,330 0 5 I 6,336
Total Primary 277,827 4,238 2.446 19.256 303.767
Note: Because of rounding. figures may not add up exactly to totals.
78 105

The Aggregate Full Costs of Major Professional Academic Programs
Figure 4.15 is limited to cost information. Columns for assigned budgeted current revenuesand for net revenues or losses before transfers could be added, but are not shown here.
Exercises
This exercise applies to institutions whose instructional and research program is divided intoprofessional academic programs, similar to the ones used in the foregoing examples. It requiresyou to identify your institution's major academic program cost centers, compute your four-tierfull costs for each of them, and allocate all support costs to these primary cost centers.(Institutions with principally undergraduate programs, please go to chapter 6).
1. Identify your primary and support cost centers and, for each cost center, define yourpreferred allocation base.
Worksheet 4.1: Primary and Support Cost Centers
79 106

Cost Accounting in Higher Education
2. Allocate all support costs to primary academic programs and allocate tier-two throughtier-four costs using your SFAS No. 117 chart of accounts.
Worksheet 4.2: Allocating Support Costs to Primary Academic Programs ($ in 1,000s)
Cost Centers
Tier-One
DirectCosts
Tier-OneAllocatedSupport
Costs
FinalTier-OneCosts
Long-TermDebtCosts
Tier-TwoCosts
One-Year
Assets
Tier-ThreeCosts
Deprec.Costs
Tier-FourCosts
Primary Programs
Support Activities
80
107

Macro-Costing of Departments
This chapter illustrates Research University's approach to departmental full costingbefore and after the allocation of support costs. The example used is how the physical andmathematical sciences program allocates support and indirect costs to the Department ofChemistry. Because the allocation procedures are similar to those already illustrated, only thehighlights of the process are mentioned. The principal source of information is the pre-SFASNo. 117 post-audit budget report before support costs have been allocated to primaryprograms.
Departmental costing represents the dividing line between from-the-top-down macro-costing and from-the-bottom-up micro-costing. The scope of support-cost allocation dependsalmost entirely on how much direct costing has already taken place. As noted earlier,Research University's current cost accounting system combines maximum direct costingwith after-the-fact allocation of pooled direct and indirect costs.
Aggregate Full Costs of Physical and Mathematical Sciences
Figure 5.1 summarizes the full cost of the physical and mathematical sciences programusing the four-tier full-cost (FTFC) model. Percentage Share in Program identifies theDepartment of Chemistry's percentage shares for the respective allocation bases. Forinstance, the department is responsible for 11.64 percent of the program's total credit hours.When this figure is multiplied by the program's total academic support cost of $169,000, thedepartment is charged $20,000, and the remaining departments absorb the balance of$149,000. Tier-two and tier-three costs were charged directly, and tier-four costsdepreciationwere originally allocated on the basis of the department's share of assigned (ortotal) square feet.
This illustration is based on models three and four from chapter 4. The allocation bases
81
108

Cost Accounting in Higher Education
Figure 5.1: Research University's Physical and Mathematical Sciences Program FullCosts ($ in 1,000s)
Cost Centers
TotalProgram
Costs Allocation Base
%Share in
Prog.
Departmentof
ChemistryAll Other
DepartmentsPrimary Program Costs
Personnel Compensation $4,392 Direct from departmentalbudget
$392 $4,000
Consumables 1,975 Direct from departmentalbudget
229 1,746
Total Primary Tier One 6,367 621 5,746Support Costs
Academic Support 169 Student credit hours 11.64% 20 149Libraries 1,438 Student/faculty factor 12.53 180 1,258Academic ComputerServices
639 Student/faculty factor 13.89 89 550
Executive Administration 836 Personnel compensation 8.34 70 766General Institutional 599 Student credit hours 11.64 70 529Student Services 960 Student credit hours 11.64 112 848Public Relations andDevelopment
584 Gifts raised 25.85 151 433
O&M 1,498 Assigned square feet 12.28 184 1,314Other 395 Personnel compensation 8.34 33 362
Total Support Tier One 7,118 908 6,210Total Tier One 13,485 1,529 11,956
Long-Term Debt Costs 250 Direct from departmentalbudget
84 166
Total Tier Two 13,735 1,613 12,122One-Year Assets 42 Direct from departmental
budget11 31
Total Tier Three 13,777 1,624 12,153Depreciation 823 Assigned square feet 12.28 101 722
Total Tier Four 14,600 1,725 12,875
Note: Column Department of Chemistry equals percentage in column % Share in Program times amount in column Total Program Costs.
for departmental cost allocation must be the same as or very similar to those used whenpooled support costs in the aggregate are allocated to primary academic programs as shownin chapter 4.
Nature] lIev-ens Cosfts Physicag andMathe aUcM Sciences
Figure 5.2 disaggregates tier-one costs by natural or object-type costs. The exhibit showsthe corresponding natural costs for the program as a whole, for the Department of Chemistry,and for the remaining departments not otherwise identified.
82
109

Macro-Costing of Departments
Figure 5.2: Research University Department of Chemistry Costs byNatural Tier-One Classifications ($ in 1,000s)
Cost CentersNatural Costs
Physical andMathematical
SciencesDepartment of
ChemistryAll Other
DepartmentsChemistry as% of Program
PersonnelSalaries and Wages $3,111 $285 $2,826 9.16%
Staff Benefits 996 83 913 8.30
Professional Services 285 24 261 8.42
Subtotal 4,392 392 4,000 8.92
Travel, Entertainment 199 27 172 13.57
Supplies, Academic 209 15 194 7.18
Supplies, Other 202 12 190 5.94
Repair and Replacement 226 32 194 14.16
Insurance 18 2 16 11.11
Printing 121 23 98 19.01
Computer Services 351 55 296 15.67
Postage, Freight 18 5 13 27.78
Coal, Other 0 0 0 0.00
Utilities Purchased 94 15 79 15.96
Telecommunication Services 189 40 149 21.16
Food Purchased 325 2 323 0.62
All Other 23 1 22 4.35
Subtotal 1,975 229 1,746 11.59
Total Direct Tier One 6,367 621 5,746 9.75
Support 7,118 908 6,210 12.76
Total Tier One 13,485 1,529 11,956 11.34
Long-Term Debt Costs 250 84 166 33.60
Total Tier Two 13,735 1,613 12,122 11.74
One-Year Assets 42 11 31 26.19
Total Tier Three 13,777 1,624 12,153 11.79
Depreciation 823 101 722 12.27
Total Tier Four 14,600 1,725 12,875 11.81
Note: Column Department of Chemistry equals column Chemistry as % of Program times column Physical and Mathematical Sciences.Column All Other Departments equals Physical and Mathematical Sciences minus Department of Chemistry. Natural costs come frompost-audit budget report.
Normally, pooled and support costs are allocated to academic departments in a lump sumas shown in figure 5.1 (Total Program Costs). In figures 5.2 and 5.3, they are allocated, line
by line, in direct proportion to each support activity's natural cost.Figure 5.4, Total Support Allocated, shows the aggregate Department of Chemistry
natural support-cost allocations. A matrix like that in figure 5.3 would yield details similar tothose shown in figure 5.3. Total Support Allocated would correspond to Total Support offigure 5.3, except that the data would be for the Department of Chemistry only.
11083

00
Figu
re 5
.3: A
lloca
ting
Tie
r-O
ne C
osts
by
Nat
ural
Cos
ts f
or P
hysi
cal a
nd M
athe
mat
ical
Sci
ence
s at
Res
earc
h U
nive
rsity
($
in1,
000s
)
Cos
t Cen
ters
Nat
ural
Cos
tsIn
stru
c.Sp
on.
Rsr
ch.
Publ
icSe
rvic
eA
ux.
Ent
.
Phys
.&
Mat
h.Sc
i..C
osts
Aca
d.Su
pp.
Lib
s.
Mad
.C
om.
Serv
.E
xec.
Adm
in.
Gen
.In
st.
Stud
t.Se
rv.
PR and
Dev
.O
&M
Oth
erT
otal
Supp
.
Tot
alT
ier
One
Pers
onne
lSa
lari
es a
nd W
ages
$1,4
67$1
,394
$58
$192
$3,1
11$7
1 '
$258
$95
$132
$118
$127
$39
$131
$0$9
71$4
,082
Staf
f B
enef
its46
846
217
4999
618
7227
4229
2811
290
256
1,25
2Pr
ofes
sion
al S
ervi
ces
217
230
4528
53
1510
2565
2114
313
169
454
Subt
otal
2,15
21,
879
7528
64,
392
9234
513
219
921
217
664
163
131,
396
5,78
8T
rave
l, E
nter
tain
men
t15
115
1023
199
2435
4285
4816
815
728
2361
080
9Su
pplie
s, A
cade
mic
183
260
020
97
055
00
00
00
6227
1Su
pplie
s, O
ther
9254
1244
202
515
3538
2748
4138
1526
246
4R
epai
r an
d R
epla
cem
ent
118
732
3322
615
2865
4775
158
686
327
553
Insu
ranc
e8
20
818
112
113
118
312
061
79Pr
intin
g96
152
812
13
118
2365
1216
652
2112
472
593
Com
pute
r Se
rvic
es18
116
22
635
15
528
118
161
7612
346
3433
1,12
41,
475
Post
age,
Fre
ight
65
25
182
155
1452
3642
7969
1846
748
5C
oal,
Oth
er0
00
00
00
00
00
071
40
714
714
Util
ities
Pur
chas
ed28
193
4494
099
4818
2636
2822
59
489
583
Tel
ecom
mun
icat
ion
Serv
ices
112
365
3618
910
8287
116
5813
661
7524
649
838
Food
Pur
chas
ed6
23
314
325
510
639
1139
4328
1819
952
4A
ll O
ther
126
23
230
113
137
32
2322
428
630
9Su
btot
al99
341
543
524
1,97
577
1,09
350
763
738
778
452
01,
335
382
5,72
27,
697
Tot
al T
ier
One
3,14
52,
294
118
810
6,36
716
91,
438
639
836
599
960
584
1,49
839
57,
118
13,4
85
111
BE
ST C
OPY
AV
ML
E
112

Macro-Costing of Departments
Figure 5.4: Natural Cost Classification of Support Costs Allocated to ResearchUniversity's Department of Chemistry ($ in 1,000s)
Cost CentersNatural Costs
Physical andMathematical
SciencesDepartment of
ChemistryTotal Support
Allocated
TotalDepartment of
Chemistry
PersonnelSalaries and Wages $3,111 $285 $198 $483
Staff Benefits 996 83 65 148
Professional Services 285 24 18 42
Subtotal 4,392 392 281 673
Travel, Entertainment 199 27 53 80
Supplies, Academic 209 15 38 53
Supplies, Other 202 12 47 59
Repair and Replacement 226 32 79 111
Insurance 18 2 12 14
Printing 121 23 63 86
Computer Services 351 55 99 154
Postage, Freight 18 5 46 51
Coal, Other 0 0 0 0
Utilities Purchased 94 15 68 83
Telecommunication Services 189 40 89 129
Food Purchased 325 2 28 30
All Other 23 1 5 6
Subtotal 1,975 229 627 856
Total Direct Tier One 6,367 621 908 1,529
Support 7,118 0
Total Tier One-
13,485 1,529
Long-Term Debt Costs 250 0
Total Tier Two 13,735 1,529
One-Year Assets 42 0
Total Tier Three 13,777 1,529
Depreciation 823 0
Total Tier Four 14,600 1,529
Note: $908,000 of support costs are distributed among the natural cost categories. Source of natural costs is the post-audit budget
report.
Limits to Transferring Costs by Natural Classifications
Normally, when institutions charge indirect and support costs to cost centers, they do not
distinguish among natural cost categories. Instead, the charges take the form of internal
prices, chargebacks, and proratings, all of which embody combinations of personnel,consumables, and capital-cost elements. More often than not, these charges appear as
consumables, unless they are clearly identified as a personnel or capital-cost charge. Lump-
sum prorating tends to overload the consumables or a prorating line of the natural-cost
structure.Allocation procedures of the type illustrated in figures 5.3 and 5.4 will preserve the
integrity of the natural-cost structure. Ratios of personnel compensation to consumables costs
1813

Cost Accounting in Higher Education
are useful indicators of financial stability over time. Each cost center has its unique personnelcompensation and consumables ratio and tends to show a high degree of consistency overtime.
ThaFtiill Cost of-AcademicDiVisionsr
Many, especially:Smaller institutions;may preferto determine the costs..of the types of academic :divisions, which neither the budget nor the costaccountind:Systerninaiidentify specifically;following listsidentifielSeViiral frequently mentionedcost dentersi7.
NatUrit ands mathematical sciences:',"Humanities_.:::.Social sciences- -?Edildation-end.phisieareducationSPeciatacademia.programs:.
Required.freshman-courses--. 4unior-senior. tutorials::.Upper '. and.lower-division programs--
. , Graduate.studiesBien when:college and university catalogs:::
identify theSe,typeslotentities;the:accountingsystem Will:only.recognize.them-specifically. when-someonehas:been given specific budget or cost--control responsibility for them or when ad hoc cost:-studies are-undertaken.: .
:In practical teriniall of these academic costcenters are:Oindosites.of departmental.costs and:-more precisely, composites.-of specific course-offerings or activities for which students.earn creditsor some other. recognition (i.e., audit, diploma; orother certifibation). It may be.most practical toapproichSUch costing-by defining clearly thecourses, course credits,-or other certification-evidence that.circumscribe.these types of programs, .
since departments oftenshare courses, personnel,and facilities.
mentioned and illustrated earlier, for certaprecision, cost prorating can be accomplishe
Tracking natural costs over time is helpfulin budgeting and long-range planning. Interms of who has cost control responsibilities,the department is normally considered to bethe grassroots cost center. While thediscussion so far has focused on from-the-top-down allocation of pooled costs, thedepartment is actually the cost center fromwhich aggregate institutional costs evolve:The institution's total cost is the sum of alldepartmental costs.
Allocating Costs toAdministrative Departments
There is no fundamental difference inallocating pooled costs between academicand administrative departments. The keydifference is that, at some point, some or alladministrative and other support costs will beallocated to the primary programs. Thus,these costs will appear in an academicdepartment's cost-center account.
If precision in costing is not an issue,lump sum prorating is very appropriate.Precision is enhanced when proratings aredistributed among the affected departments,and it is lessened when they are accumulatedin and charged as a large pooled cost. As was
in costing tasks that require a high degree ofd on the basis of broad natural-cost distinctions.
Departmental Budgets Are the Basis for Total Institutional Costs
The departmental budget is the foundation on which the entire institutional budget isbuilt. If a department's costs reflect all appropriate support costs, as well as the costsengendered by the financing and using up of capital resources, the sum of departmental costs
86114

Macro-Costing of Departments
equals the institution's full costs. Therefore, this is an appropriate point in this discussion for
turning to from-the-bottom-up costing, which follows in chapters 6 and 7.
Staff-BenefitsStaff benefits always.a direct cost, specifically associated with-agiven-employee and his-or her
employer.::yetmany inStitutions.continue to-pool.staff.benefits..Moreover;. staff benefit pooling practices.
themselves differ amcing.institutions: .
These benefits fall.into three broad categories: those that arepart-of the payroll system, thosathat..
may be accounted for separately (such as tuition, professional travel, and.research support benefits),
and those where the institution provides facilities and supplies without Ihe need for reimbursement. The
first two are accounted for easily, and no technical reasons prevent them from being charged directly to
the employing department. The third is often ignored, but for costing purposes can be estimated:_.
Pooling of benefits is preferred for several. reasons. It is argued that.benefit pools facilitate the,,
computation of benefit rates when budgets -are prepared and for indirect-costrecovery. Sometimes_ .
pooling is preferred because a given benefit is managed by an executive other than the one whose
budget would be affected by a direct charge. For instance, a provost or dean may wish to control the
faculty professional travel benefit. In both instances, budget control should not be confused with-
accuracy in costing. When centrally controlled benefits are used up and the cost incurred, a charge .
against the user department clears the pooled budget white the user department is being charged the
actual cost'.....
One point to.remember is thateach person entitled to a given staff..benefit as well as the benefit-
propercan be.identified precisely. Obstacles to charging staff benefits-directly to user departments-are...
institutional and not generic to staff benefit costs as. such. if institutions are interested in full direct:-
costing, they, should develop a plan to allocate staff benefits directly to each department.
Unless the employee-specific information is made available to the cost analyst, pooled staff benefits
will have to be allocated on some percentage basis to all academic departments:. Thus, the cost will be
spread to departments that may have no employees eligible for a particular.benefit. such as the-tuition.
benefit. Such cost averaging may be appropriate in some circumstances, but not when the objective is to .
determine precise departmental costs.The tuition benefit may be a special case, and it takes two forms: a grant to the employee for tuition at
another institution, normally paid directly to that institution, or apercentage discount (100 percent or
ess) for courses taken at the employing institution. In the first case, the institution actually spends
money, whereas in the second it forgoes income. Institutions can treat internal tuition benefits as forgone
income or a discount and get around the allocation issue while understating its costs. If a new definition
of tuition discounts is implemented, it may address this issue directly.
87 115

Cost Accounting in Higher Education
Exercises
1. Using the FTFC model provided below, determine the full cost by tiers of one of yourundergraduate academic divisions.
Worksheet 5.1: Your Institution's Full Costs for Undergraduate Academic Division X
TiersCost CentersNatural Costs Direct Costs
IndirectCosts Total Costs
AllocationBase /
MethodPersonnel
Salaries and WagesStaff BenefitsProfessional Services.Other
SubtotalConsumables
Travel, EntertainmentSupplies, ClassroomsSupplies, Office .Supplies, MaintenanceRepair and ReplacementPrintingComputer ServicesPrintingUtilities_
Telephone
All OtherSubtotal
Adjustment for DuplicationOne Total Tier One
Debt-Related CostsTwo Total Tier Two
Fully Expensed Short-Lived AssetsThree Total Tier Three
Depreciation or Facilities-Use ChargeFour Total Tier Four
(I
Please explain how you calculate the depreciation or facilities use charge:
88
116

Macro-Costing of Departments
2. Using the FTFC matrix provided below, determine the full cost by tiers of one of your
undergraduate academic departments.
Worksheet 5.2: Your Institution's Full Costs forUndergraduate Academic Department X
TiersCost CentersNatural Costs Direct Costs
IndirectCosts Total Costs
AllocationBase /
MethodPersonnel
Salaries and Wages .
Staff BenefitsProfessional ServicesOther
Subtotal .
ConsumablesTravel, EntertainmentSupplies, ClassroomSupplies, OfficeSupplies, MaintenanceRepair and ReplacementPrintingComputer ServicesPrintingUtilitiesTelephone
All OtherSubtotal
Adjustment for DuplicationOne Total Tier One
Debt-Related CostsTwo Total Tier Two
Fully-Expensed Short-Lived AssetsThree Total Tier Three
Depreciation or Facilities-Use ChargeFour Total Tier Four
89
117

Cost Accounting in Higher Education
3. Please itemize, by department, for one academic division, the full cost by tiers, usingthe FTFC matrix provided below. Add columns as needed to encompass alldepartments in the division.
Worksheet 5.3: Your Institution's Full Costs for All Undergraduate AcademicDepartments in Division X
TiersCost Centers
Natural CostsDept.
ADept.
BDept.
CDept.
DDept.
NTotal
DivisionPersonnel
Salaries and WagesStaff BenefitsProfessional ServicesOther
SubtotalConsumables
Travel, EntertainmentSupplies, ClassroomSupplies, OfficeSupplies, MaintenanceRepair and ReplacementPrintingComputer ServicesPrintingUtilitiesTelephone
All OtherSubtotal
Adjustment for DuplicationOne Total Tier One
Debt-Related CostsTwo Total Tier Two
Fully-Expensed Short-Lived AssetsThree Total Tier Three
Depreciation or Facilities-Use ChargeFour Total Tier Four
Please explain your allocation bases and methods:
90 8

Academic Micro-CostingThe Full Cost f Course
Chapter 6 concentrates on course costs and illustrates through the case of Liberal Arts
College how net tuition and fees revenues can be apportioned to departments and courses.
Introduction
This chapter and the next describe procedures that produce full-cost information for
specific educational and administrative activities. The intent is to highlight relatively simple
approaches to direct full instructional costing, to illustrate how current revenues can beallocated to departments and courses, to define some recent innovations in activities and
process costing, and to comment briefly and in general terms on a variety of administrative
and operational costing tasks.So far, costing has been described as an exercise in allocating several types of pooled
direct and indirect costs to specified cost centers after the institution's official year-end audit
has been completed. The preceding illustrations focused on the allocation of these cost pools
to traditional administrative functions, to broad academic disciplines and professionalschools, and to academic and administrative operating departments. The costing tasks that
were described assumed that cost accounting policies were a given and that, after the audit
work had been done, a variety of program costs would be computed. The exampleshighlighted the distribution among primary cost centers of traditional by-function support
and identified three types of capital costs. This type of macro-costing is useful, especially
when peer groups try to compare costs among their members.
91 119

Cost Accounting in Higher Education
The Meaning of Micro-Costing
From the institution's operating perspective, however, it is more practical to look atcosting from the ground up by focusing on all the cost elements that must be assembled at thegrassroots level if one is to end up with full-cost information for a particular cost center.Micro-costing accomplishes this type of costing objective.
The term "micro-costing," as used here, refers to the determination of the full costs of themany discrete academic and administrative activities and processes that epitomize aninstitution's daily work, including provisions for the current costs associated with the uses,financing, and consumption of physical capital resources. Micro-costing includes so-calledactivity-based costing and, depending upon the activity, process costing.
It is important to understand that full costing of activities and processes is not alwaysnecessary or appropriate. Often it is most practical to focus on direct costs only.Unfortunately, many institutions continue to pooland therefore do not allocate directlysignificant amounts of what by any definition clearly are direct costs. Therefore, an importantfirst task for institutions is to maximize direct departmental costing. When institutions mustknow the long-term impact on their activities of capital investments and of support costs,full-activities costing is necessary. All cost analyses that relate in one way or another to theinstitution's future budgets and long-range plans must be cast in terms of total and marginalfull costs.
Should institutions fully automate their costing process if they want to report activitiescosts? The answer is a qualified no. If they have not already done so, institutions shouldbegin to develop specialized activities models that integrate key financial and nonfinancialdata best suited to describe the activities whose costs are to be determined. Most of thesemodels can be displayed in the spreadsheet mode and do not require complex mathematicalformulations. The following examples use the spreadsheet format and, with few exceptions,contain all the information needed to compute the costs in question.
Even in full micro-costing, ways must be found to assign support and common cost poolsto individual activities and processes. As will be shown, some of these allocations can beimplemented more simply than others. For instance, it may be less complicated to allocatedepreciation than admissions costs to a given instructional activity.
The normal source of financial information for activities costs is the departmental budgetand sometimes special program budgets. The activities and processes whose costs must bedetermined are either subsets of these budgets or combinations of portions of two or moredepartmental budgets. This means that micro-costing tasks involve both the disassemblingand the reassembling of departmental cost information. A large portion of the highereducation costing literature is devoted to how this disaggregation and reassembling mighttake place and how institutions should or can determine the true full cost of their myriadactivities. A large part of the original costing effort by the National Center for HigherEducation Management Systems was devoted to this type of micro-costing, especially in theacademic program area.'
In addition to budgetary data, micro-costing almost always requires specific nonfinancialinformation on enrollment, staff size, square footage, miles driven, kilowatt-hours consumed,
92
120

Academic Micro-Costing: The Full Cost of a Course
and, when usage is the costing base, the number of transactions. A properly constructedcosting model integrates this type of information with the appropriate financial data. Inmicro-costing, this figure is frequently a unit-cost measure that serves as a basis for chargingand allocating specific costs through transfer pricing, chargebacks, or formula-basedproratings.
Economists like to say that prices serve the purpose of clearing the shelves. Inadministrative micro-costing, the shelves are represented by individual, budgets. Internalprices and charges clear these budgets by transferring costs to those who purchaseadministrative services or who must absorb a portion of various common costs. Internalprice- or unit-cost-based allocation tends to be more direct and more precise than the types ofbroad, even crude, percentage-cost allocations of macro- costing.
Micro-Costing and the Cost Accounting System
Even in the post-SFAS No. 117 era, higher education accounting is not organized toanswer questions concerning the full costs of teaching a conventional course, conducting aseminar, admitting a freshman class, or managing the institution's heating and coolingsystem.2
Most administrative micro-costing tasks are based on unique mini-cost-accountingsystems created for each distinct costing task. Sometimes the normal accounting system is so
far removed from what is needed that elaborate new stand-alone costing models must be
constructed.
Types and Purposes of Micro-Costing
This chapter and the next are devoted to three broad types of micro-costing situations:
1. Academic-activities costing, principally including the costing ofinstructional activities and, if they can be measured, instructional outcomes,individual research projects, andacademic degrees and other forms of certification.
2. Administrative-activities costing, includingoperational activities undertaken by administrative departments andnumerous specialized administrative processes involving sequential, repetitive, and
often complex human and departmental interactions.3. Unit full costs where the emphasis is on computing average and marginal costs of
educational administrative services.
Activities and process costing are broadly defined here, and their cost models have twopurposes: First, they are descriptive, telling administrators how much a given activity orprocess costs, and second, they can be prescriptive, suggesting how resources ought to becombined in the future for cost-effective results. Before one can make a judgment about the
second purpose, one must understand the first.The following discussion is essentially descriptive and assumes that institutions are by
now familiar with the cost-crossover technology and software that is basic to most micro-costing. Here, the emphasis is not on the programming and numbering instructions, but ratheron illustrations of the information, pricing, and cost allocation aspects for support activities
93
121

Cost Accounting in Higher Education
and of physical capital resources costs. As in the preceding chapters, a key issue is howdifferent combinations of allocation bases affect micro-cost-center costs.
The Four-Tier Full-Cost Model Applied to Course Costs
Responsibility or cost center full costing means that at some point the sum of activitiesand process costs will reflect the institution's annual support and capital costs. Theindividual course is the quintessential collegiate activity whose full costs can be determinedquite precisely with the appropriate underlying information.
In general, the following must be identified:
The course's direct costsThe indirect and support costs which the course must supportThe costs represented by the capital resources which the course uses or consumesThe net student and other budgeted revenues generated by each course's enrollment
Two costing and revenue-allocation approaches must be considered. The first derivesfrom the discussion in chapters 3 to 5 and requires that full departmental costs, for instance,for Research University's chemistry department, be distributed on the basis of some sort ofallocation procedure among the courses currently offered by the department.
The second approach, used here, illustrates a course-centered cost- and revenue-allocationsystem that focuses on affinity-based transfer prices for allocating support and capital costs.Prominent among these are standard cost measures per student credit hour, per square feet ofassigned space, or for personnel compensation.
Course Cost Information at Liberal Arts College
Liberal Arts College is a hypothetical four-year undergraduate liberal arts institution. Thedata for the college are a composite of data drawn from several actual colleges with similaracademic offerings and enrollment.
Over the years, since the inception of program costing inspired by the National Center forHigher Education Management Systems and NACUBO, Liberal Arts College has graduallyevolved an accounting system and costing models that allow it to track each employee'scontribution to personnel compensation costs and each student's course load and net revenuecontribution on the basis of the following types of modules for cost accounting managementinformation systems:
1. A personnel (faculty and staff) compensation cost module identifies, employee byemployee, total personnel compensation costs that will be assigned to eachindividual course or certification unit (see figure 6.4). This module's data will becrossed over to the course-load matrix.
2. The course-load matrix tracks, course by course, the credits generated by eachstudent during each academic term. This module's companion is the net-revenue
94
122

Academic Micro-Costing: The Full Cost of a Course
module. When this module is crossed over to the personnel compensation costmodule and other cost modules, it is called a course-cost-load matrix.
3. The net student revenue module identifies precisely, student by student, how muchdirect net tuition and fees income is generated by each course or certification unit. Acertification unit or cost objective is defined as any institutional entity or budget thatreflects costs engendered in order to produce a credit hour, a diploma, or certificate
or some other measure of student achievement.
Each module contains the requisite supplementary data elements that permit the completeassignment of direct, indirect, and support costs to individual academic courses and course-like activities. Together, these modules for cost accounting management information systems
constitute a multidimensional student-based course cost-and-revenue matrix, which
computes the full cost of and identifies the net tuition and fee revenues available to every
course offered during a given business year.Variations of these three modules are in wide use today, but the degree of refinement,
sophistication, and depth of the underlying databases differ. Normally, course costs arereported on the basis of direct departmental costs, and neither support costs nor capital costs
are allocated to courses. In addition, the module 3 information is not always configured asprecisely as will be illustrated in this Liberal Arts College application.
Ideally, and under SFAS No. 117, it can be argued that total instructional costs are the
sum of full course costs plus the full costs of all other academic activities within the purviewof the instructional account. Among others, this would include the full cost of departmental
research. This means that course and activity costs will reflect all direct and indirect costs,
including all support and capital costs that were formerly reported separately.Other information essential for the full costing of instructional activities includes
consumables budgets that serve as a basis for allocating direct nonpersonneloperating costs andformulas for allocating support and capital costs directly to instructional activities.
The Full Costs of EconomIcs101-1
The following examples describe procedures for computing the full costs of Economics
101-1 at Liberal Arts College. Figure 6.1 illustrates the college's by-function post-audit
financial condition and fully integrated chart of accounts in the four-tier full-cost (FTFC)
format. The vertical display identifies the college's primary and support functions. The
horizontal display, also used in subsequent exhibits, calls attention to three levels of costaggregation: the college as a whole, an individual department (economics), and a single
course section (Economics 101-1).Where normally a college would identify departmental budgets, the simplified course
cost-and-revenue matrix (figure 6.2) arrays, horizontally under instruction, every course from
1 through n. A more complex matrix would include the costs of all departmental research
projects and any other distinct activities within the department that must be charged to
instruction.
95
123

Cost Accounting in Higher Education
Figure 6.1: Costs by Function for Liberal Arts College Using the FTFC Model
Cost Centers Total CollegeDepartment of
Economics Economics 101.1Direct
Instruction $23,882 ? ?Research 1,008 ? ?All Other 293 ? ?
Total E&G 25,183 ? ?Auxiliary Enterprises 14,510 ? ?All Other 357 ? ?
Subtotal 40,050 ? ?Indirect
Academic Support 615 ? ?Libraries 2,099 ? ?Academic Computer Services 1,015 ? ?Executive Administration 1,179 ? ?General Institutional 2,396 ? ?Student Services 3,876 ? ?Public Relations and Development 1,806 ? ?O&M 4,605 ? ?
Subtotal 17,591 ? ?Total Tier One 57,641 ? ?
Long-Term Debt Costs 695 ? ?Total Tier Two 58,336 ? ?
One-Year Assets 413 ? ?Total Tier Three 58,749 ? ?
Depreciation 2,870 ? ?Total Tier Four 61,619 ? ?
Figure 6.2: Simplified Course Cost-and-Revenue Matrix Where Total Instructional CostsEqual Sum of Course Costs
Cost TiersCourse
1Course
2Course
3Course
4Course
5Course
6Course
N
Instr.Sum(1-N)
PersonnelConsumables
Tier OneLong-Term Debt Costs
Total Tier TwoOne-Year Assets
Total Tier ThreeDepreciation
Total Tier FourNet Tuition RevenueOther Revenue
Total RevenuesSurplus/Deficit
96 124

Academic Micro-Costing: The Full Cost of a Course
Figure 6.3 arranges functional cost information of figure 6.1 on the basis of natural costs.For certain presentations, a direct and an indirect cost column should be added for eachfunction (figure 6.1) and course (figure 6.2). Similar layouts can be constructed for the otherprimary and support functions and their underlying activities.
Figure 6.3: Natural Costs for Liberal Arts College Using the IFTFC Model ($ in 1,000s)
Cost CentersTotal
College Instruction
Departmentof
EconomicsEconomics
101-1
Personnel CompensationSalaries, Faculty $12,755 ? ? ?
All Other Salaries and Wages 10,001 ? ? ?
Student Wages 1,751 ? ? ?
Subtotal 24,507 ? ? ?
Staff Benefits 8,769 ? ? ?
Tuition Benefit 1,160 ? ? ?
Room and Board, Etc. 735 ? ? ?
Total Benefits 10,664 ? ? ?
Professional Services 1,585 ? ? ?
Total Compensation 36,756 ? ? ?
ConsumablesTravel, Entertainment 1,495 ? ? ?
Supplies 1,655 ? ? ?
Telecommunications 1,102 ? ? ?
Computer Services 756 ? ? ?
Printing, Publications 1,050 ? ? ?
Property/Casualty Insurance 865 ? ? ?
Dues, Subscriptions 317 ? ? ?
Postage, Freight 709 ? ? ?
Repair, Replacement, Contr. 4,464 ? ? ?
Utilities Purchased 1,092 ? ? ?
Food, Students 1,929 ? ? ?
Food, Other 555 ? ? ?
Goods for Resale 3,065 ? ? ?
Miscellaneous 1,831 ? ? ?
Subtotal 20,885 ? ? ?
Total Tier One 57,641 ? ? ?
Long-Term Debt Costs 695 ? ? ?
Total Tier Two 58,336 ? ? ?
One-Year Assets 413 ? ? ?
Total Tier Three 58,749 ? ? ?
Depreciation 2,870 ? ? ?
Total Tier Four 61,619 ? ? ?
In macro-costing (from-the-top-down costing), these three matrices (figures 6.1 to 6.3) fill
in from left to right. In micro-costing (from-the-bottom-up costing), personnel, consumables,
support, and capital costs are allocated first to courses and activities, then from right to left to
departments and, eventually, instruction.
97 125

Cost Accounting in Higher Education
The Basic Data Modules
The Personnel Work-Load Compensation Module
Figure 6.4 is a spreadsheet that provides the personnel compensation details,distinguishing between salaries and wages on the one hand and staff benefits on the other.Total compensation for the Department of Economics is $821,569salaries and wagesamount to $604,827, and benefits total $216,742. The spreadsheet contains basic workloadindicators and other important data elements.
The exhibit arranges faculty by rank and includes several, but not necessarily all, usefulindicators that normally are part of a personnel classification. The work-load factor is thedivisor by which an individual faculty member's total compensation cost will be allocated tocourses and other work assignments.
Departmental Personnel Compensation Costs: Department of Economics
Figure 6.5 displays the direct personnel compensation costs left blank in the last twocolumns of figure 6.3, choosing for the latter one-sixth of the direct compensation cost($12,561) for the Economics 101-1 professor (figure 6.4). The course has an enrollment of 48students for 144 credit hours.
The faculty work-load factor dissects each faculty member's total compensation andassigns it to each work-load segment (for instance, Economics 101-1).
Faculty Course-Load Module
Figure 6.6 describes how the department chair's compensation can be allocated. A portionof the cost is for her administrative work and is distributed to all departmental activities.Liberal Arts College allows a fourth of the compensation for this duty per semester; otherinstitutions might allow less or have a different overall work load. For instance, AlternateAllocation assumes a 10 percent administrative work load, thus increasing the direct coursecosts. Because the illustration is for one semester, only half of the total compensation isdistributed here.
When research or other duties are part of the work load, compensation-cost shares will beassigned proportionately.
The Student Course-Load Module
The student course-load module tracks each student's course or certification unit load andenables administrators to construct a variety of course credit-cost classifications: bydepartments, by major and nonmajor courses, by core and noncore groupings, by lower- andupper-division status, by different groupings of graduate credits.
Figure 6.7 illustrates a typical student's semester course load, identifying course numbers,instructor codes, credits earned, faculty compensation assigned, and other essential cost-crossover information. The instructor code locates the appropriate compensationcost and theroom code accesses a variety of cost allocation bases.
98 1 .15

Figu
re 6
4: S
prea
dshe
et f
or L
iber
al A
rts
Col
lege
'sPe
rson
nel W
ork-
Loa
d C
ompe
nsat
ion
Mod
ule
Pers
onne
lD
epar
tmen
t of
Eco
nom
ics
Ran
kH
ire
Yea
rsT
enur
eSt
atus
Lea
veSt
atus
Wor
k-L
oad
Fact
or
Ann
ual
Sala
ryor
Wag
esFI
CA
(0.0
765)
Pens
ion
Plan
(0.1
200)
Med
ical
Plan
Lif
eIn
sur.
(0.0
095)
Wor
kers
Com
p.(0
.012
99)
Une
mpl
oy.
Facu
ltyE
cono
mic
s 10
1-1
Prof
esso
r1
1964
31T
3$5
9,90
0$4
,582
$7,1
88$8
84$5
69$7
73$0
Facu
lty 2
119
6134
T1
Yr.
4
(1 u
nit
chai
r)_
64,5
004,
934
7,74
088
461
383
20
Facu
lty 3
119
7124
T1
Qtr
.3
72,6
005,
554
8,71
288
469
093
70
Facu
lty 4
119
6827
T3
64,7
504,
953
7,77
088
461
583
50
Subt
otal
261,
750
20,0
2431
,410
3,53
62,
487
3,37
70
Perc
enta
ge1%
0%0%
0%0%
0%0%
Facu
lty 5
219
7520
T3
$45,
000
$3,4
43$5
,440
$884
$428
$581
$0
Facu
lty 6
219
7619
T3
45,5
003,
485
5,46
688
4r
433
588
0
Subt
otal
90,5
506,
927
10,8
661,
768
860
1,16
80
Perc
enta
ge1%
0%0%
0%0%
0%0%
Facu
lty 7
319
932
NT
4$3
4,75
7$2
,659
$4,1
71$8
84$3
30$4
48$0
Facu
lty 8
319
887
NT
437
,000
2,83
14,
440
884
352
477
0
Facu
lty 9
319
896
NT
334
,500
2,63
94,
140
884
328
445
0
Facu
lty 1
03
1987
8N
T1
Qtr
.4
38,5
252,
947
4,62
388
436
649
70
Subt
otal
144,
782
11,0
7617
,374
3,53
61,
375
1,86
80
Perc
enta
ge78
.33%
5.99
%9.
40%
1.91
%0.
74%
1.01
%0.
00%
Facu
lty T
otal
$497
,082
$38,
027
$59,
650
$8,8
40$4
,722
$6,4
12$0
Perc
enta
ge74
.62%
5.71
%8.
95%
1.33
%0.
71%
0.96
%0.
00%
Prof
essi
onal
sPr
ofes
sion
al 1
119
941
Vis
it.2
$12,
500
$956
$1,5
00$8
84$0
$161
$0
Prof
essi
onal
23
1992
3V
isit.
323
,850
1,82
52,
862
00
308
0
Subt
otal
36,3
502,
781
4,36
288
40
469
0
Perc
enta
ge77
.36%
5.92
%9.
28%
1.88
%0.
00%
1.00
%0.
00%
Cle
rica
lC
leri
cal 1
1968
27$3
2,55
0$2
,490
$3,9
06$8
84$3
09$4
20$0
Cle
rica
l 219
8114
25,8
451,
977
3,10
188
424
633
30
Cle
rica
l 319
943,
500
Subt
otal
58,3
954,
467
7,00
71,
768
555
753
3,50
0
Perc
enta
ge63
.62%
4.87
%7.
63%
1.93
%0.
60%
0.82
%3.
81%
Cle
rica
l 419
923
$7,5
00$5
74$0
$0$0
$97
$0
Cle
rica
l 519
932
5,50
042
10
00
710
Subt
otal
13,0
0099
50
00
168
0
Perc
enta
ge78
.30%
5.99
%0.
00%
0.00
%0.
00%
1.01
%0.
00%
Tot
al P
erso
nnel
$604
,827
$46,
269
$71,
019
$11,
492
$5,2
77$7
,802
$3,5
00
Perc
enta
ge73
.62%
5.63
%8.
64%
1.40
%0.
64%
0.95
%0.
43%
127
CO
PY A
VA
IL B
LE
128

Figu
re 6
.4 (
cont
inue
d): S
prea
dshe
et f
or L
iber
al A
rts
Col
lege
's P
erso
nnel
Wor
k-L
oad
Com
pens
atio
n M
odel
Pers
onne
lD
epar
tmen
t of
Eco
nom
ics
Lon
g-T
erm
Dis
ab.
(0.0
041)
Tui
tion
Ben
efit
Prof
.T
rave
lO
ver-
Tim
eSu
b-to
tal
Sick
Pay
Wag
es
Hol
iday
Pay
Wag
esSu
b-to
tal
Ben
efits
Tot
alG
roup
Tot
alC
omp.
Gro
upT
otal
All
Gro
ups
Facu
ltyE
cono
mic
s 10
1-1
Prof
esso
r$2
46$0
$1,2
28$0
$15,
470
$0$0
$0$1
5,47
017
.99%
$75,
370
21.6
7%9.
17%
Facu
lty 2
264
01,
385
016
,653
00
016
,653
19.3
781
,153
23.3
49.
88Fa
culty
329
80
675
017
,749
00
017
,749
20.6
490
,349
25.9
811
.00
Facu
lty 4
265
19,5
551,
229
036
,107
00
036
,107
42.0
010
0,85
729
.00
12.2
8Su
btot
al1,
073
19,5
554,
517
085
,978
00
085
,978
100.
0034
7,72
810
0.00
42.3
2Pe
rcen
tage
0.31
%5.
62%
1.30
%0.
00%
24.7
3%0.
00%
0.00
%0.
00%
24.7
3%10
0.00
%Fa
culty
5$1
85$0
$758
$0$1
1,67
7$0
$0$0
$11,
677
27.1
2$5
6,67
742
.42
6.90
Facu
lty 6
187
19,5
5578
70
31,3
840
00
31,3
8472
.88
76,9
3457
.58
9.36
Subt
otal
371
19,5
551,
545
043
,061
00
043
,061
100.
0013
3,61
110
0.00
16.2
6Pe
rcen
tage
0.28
%14
.64%
1.16
%0.
00%
32.2
3%0.
00%
0.00
%0.
00%
32.2
3%10
0.00
%Fa
culty
7$1
43$0
$723
$0$9
,358
$0$0
$0$9
,358
23.3
5$4
4,11
523
.86
5.37
Facu
lty 8
152
078
90
9,92
40
00
9,92
424
.77
46,9
2425
.38
5.71
Facu
lty 9
141
01,
511
010
,089
00
010
,089
25.1
844
,589
24.1
25.
43Fa
culty
10
158
01,
226
010
,701
00
010
,701
26.7
049
,226
26.6
35.
99Su
btot
al59
40
4,24
90
40,0
710
00
40,0
7110
0.00
184,
853
100.
0022
.50
Perc
enta
ge0.
32%
0.00
%2.
30%
0.00
%21
.68%
0.00
%0.
00%
0.00
%21
.68%
100.
01%
Facu
lty T
otal
$2,0
38$3
9,11
0$1
0,31
1$0
$169
,110
$0$0
$0$1
69,1
10$6
66,1
9281
.09
Perc
enta
ge0.
31%
5.87
%1.
55%
0.00
%25
.38%
0.00
%0.
00%
0.00
%25
.38%
0.00
100.
00%
Prof
essi
onal
sPr
ofes
sion
al 1
$0$0
$925
$0$4
,427
$0$0
$ 0
$4,4
2741
.60
$16,
927
36.0
22.
06Pr
ofes
sion
al 2
00
1,22
00
6,21
40
00
6,21
458
.40
30,0
6463
.98
3.66
Subt
otal
00
2,14
50
10,6
410
00
10,6
4110
0.00
46,9
9110
0.00
5.72
Perc
enta
ge0.
00%
0.00
%4.
56%
0.00
%22
.64%
0.00
%0.
00%
0.00
%22
.64%
100.
00%
Cle
rica
lC
leri
cal 1
$133
$6,5
18$1
,220
$579
$16,
460
$355
$290
$645
$17,
105
51.2
3$4
9,65
554
.10
6.04
Cle
rica
l 210
62,
444
1,22
01,
223
11,5
34'
855
395
1,25
012
,784
38.2
938
,629
42.0
94.
70C
leri
cal 3
00
00
3,50
00
00
3,50
010
.48
3,50
03.
810.
43Su
btot
al23
98,
962
2,44
01,
802
31,4
941,
210
685
1,89
533
,389
100.
0091
,784
100.
0011
.17
Perc
enta
ge0.
26%
9.76
%2.
66%
1.96
%34
.31%
1.32
%0.
75%
2.06
%36
.38%
100.
00%
Cle
rica
l 4$0
$0$1
,220
$0$1
,891
$0$0
$0$1
,891
52.4
8$9
,391
56.5
61.
14C
leri
cal 5
00
1,22
00
1,71
20
00
1,71
247
.52
7,21
243
.44
0.88
Subt
otal
00
2,44
00
3,60
20
00
3,60
310
0.00
16,6
0310
0.00
2.02
Perc
enta
ge0.
00%
0.00
%14
.70%
0.00
%21
.70%
0.00
%0.
00%
0.00
%21
.70%
100.
00%
Tot
al P
erso
nnel
$2,2
77$4
8,07
2$1
7,33
6$1
,802
$214
,847
$1,2
10$6
85$1
,895
$216
,742
$821
,569
100.
00Pe
rcen
tage
0.28
%5.
85%
2.11
%0.
22%
26.1
5%0.
15%
0.08
%0.
23%
26.3
8%10
0.00
%
BE
ST
CO
PY
AV
AIL
AB
LE

Academic Micro-Costing: The Full Cost of a Course
Figure 6.5: Liberal Arts College's Compensation Costs for Economics 101-1 and theDepartment of Economics Using the FTFC Model
Cost Centers
TotalCollege
($ in1,000s)
Instruction($ in
1,000s)
I epartmentof
EconomicsDirect
Economics101-1Direct
Personnel CompensationSalaries, Faculty $12,755 $11,564 $497,082 $9,983Salaries, Officers 1,906 395 0 0All Other Salaries and Wages 8,095 1,334 58,395 0
Student Wages 1,751 253 13,000 0Subtotal 24,507 13,546 568,477 9,983
Staff Benefits 8,769 5,283 164,973 2,578Tuition Benefit 1,160 518 48,072 0Room and Board, Etc. 735 116 3,697 0
Total Benefits 10,664 5,917 216,742 2,578Professional Services 1,585 834 36,350 0
Total Compensation 36,756 20,297 821,569 12,561
Figure 6.6: Faculty Course-Load Module for One Semester at Liberal Arts College,Apportioning Total Compensation Costs from Figure 6.1.
Department ChairWork Assignment
To Be AllocatedAnnually$81,153
Alternate Allocation$81,153
Department Chair $10,144 $4,058
Economics 101-3 10,144 12,173
Economics 244 10,144 12,173
Interdepartmental 100 10,144 12,173Semester Total 40,576 40,577
Note: Column B equals $81,153 + 2 + 4Column C ($4,058) equals 1/10 of $81,153Rest of Column C equals $81,153 - 4,058 + 2 + 3
Figure 6.7: Sample One, Semester Course-Load Module for a Typical Juniorat Liberal Arts College
A Typical Junior, First SemesterCourses Department
InstructorCode Credits
StaffCompensation
RoomCode
201-3 English EG 522 3 $8,194 122-10
334 Psychology PSY 321 3 10,732 122-25
334L Psychology PSY 321 1 3,577 122-30
338 Art History AH 112 2 5,821 114-15
356 Tutorial Psychology PSY 101 3 11,224 122-31
Total 12 39,549
Note: (Compensation + 2) + Total Teaching Load) x Course Credits
101 31

Cost Accounting in Higher Education
The Student Net Revenue Module
This module is based on the understanding that individual revenue contributions forgroups of students will differ because (1) some students receive student aid grants and othersdo not, (2) the individual net revenue contributions differ widely among those receivingstudent aid grants, and (3) course loads differ among students. Figure 6.8 illustrates theunderlying information for a typical junior, taken from his billing file.
Figure 6.8: Annual Net Revenue Contribution of a Typical Junior atLiberal Arts College
Items RevenuesShare ofInvoice
Student AidGrant
PortionsNet
RevenuesTypical Junior
Tuition and Fees $19,555 76.54% $6,506 $13,049Laboratory Fees 385 1.51 128 257Room and Board 5,450 21.33 1,813 3,637Supplies Provided 158 0.62 53 105
Total Charges 25,548 100.00 8,500 17,048Student Aid Grant 8,500 33.27
Net Invoice 17,048Guaranteed Loan 4,500 17.61Institutional Loan 1,250 4.89
Required Payment 17,048Paid Last Term 5,649Due Now 5,649
Note: For internal financial planning and reporting, Liberal Arts College allocates student aid grants in proportion to the fee structureof the gross invoice.
The typical junior falls into the 30-39 percent decile discount bracket for student aidgrants. Her total current net contribution to revenues will be $17,048 ($6,750 paid from loanfunds) rather than the $25,548 she would have to pay without student aid grants.
How much of the net invoice should be allocated to instruction? The student aid grantsportions are for the four basic charges listed in the invoice. Liberal Arts College allocates allbut the net invoice for room and board to instruction, or $13,411 ($17,048 minus $3,637).This is contrary to general current practice where no discounts for student aid grants areapplied to auxiliary enterprises. In contrast to the traditional method, the college's practiceincreases the current-net-revenue allocation to instruction and reduces the net amount goingto auxiliary enterprises. The overall institutional operating result is not affected. Figure 6.9illustrates how the $13,411 net revenues are assigned to the typical junior's courses. All nettuition and fees revenues can be allocated in this manner, first directly to individual coursesand, through them, to the various departments.
A useful analysis of net student revenues is to rank them by the size of the student aidgrants discount. The underlying information layout is shown in figure 6.10.
1 3 2102

Academic Micro-Costing: The Full Cost of a Course
The student billing file can be ranked, student by student, by the discount percentage(student aid grant as a percentage of total invoice). Figure 6.10 shows a sample bracket ofeight students where the case student occupies the 33.27 percentile rank.
Figures 6.11 and 6.12 summarize Liberal Arts College's overall discount structure,grouping the individual student invoices by decile discount cohorts. Figure 6.11 calculatesthe budgetable net revenues produced by each cohort and shows the cohort revenueassignments to instruction (column 0). Figure 6.12 shows the by-cohort budgetable revenueassignments to the Department of Economics and to a single course, Economics 101-1.
In figures 6.11 and 6.12 revenue assignments are made on the basis of the course credits
Figure 6.9: Student Revenues at Liberal Arts College Allocated to theCourse-Load Matrix
A Typical Junior, First SemesterCourses Department
InstructorCode Credits Net Invoice
RoomCode
Net Invoice to Institution $13,411
201-3 English EG 522 3 1,490 122-10
334 Psychology PSY 321 3 1,490 122-25
334L Psychology PSY 321 1 497 122-30
338 Art History AH 112 2 993 114-15
356 Tutorial Psychology PSY 101 3 1,490 122-31
Total Semester I 12 5,960
202-3 English RG 522 3 1,490 122-10
335 Psychology PSY 321 3 1,490 122-25
335L Psychology PSY 321 1 497 122-30
324 French FR 85 2 993 118-05
357 Tutorial Psychology PSY 101 3 1,490 122-31
202 PoliticalScience
PSC 213 3 1,490 118-16
Total Semester II 15 7,451Total 27 13,411
Note: Figure 6.8 allocates $13,411 to instruction and $3,637 to auxiliary enterprises.
Figure 6.10: Student Aid Grant Discount Ranking at Liberal Arts College
PercentileBracket Name Invoice
StudentAid Grant Net
AuxiliaryEnterprises Instruction
30-39%
38.75 Student A37.21 Student B36.01 Student C35.22 Student E33.27 Junior A $25,548 $8,500 $17,048 $3,637 $13,411
32.18 Student G31.05 Student H30.28 Student I
103

Figu
re 6
.11:
Dec
ile D
istr
ibut
ion
of S
tude
nt A
id D
isco
unts
and
Bud
geta
ble
Rev
enue
s fr
om S
tude
nt C
harg
es a
t Lib
eral
Art
sC
olle
ge,
Show
ing
the
Cal
cula
tion
of B
udge
tabl
e N
et R
even
ues
Ass
igne
d to
Ins
truc
tion
(Col
umn
0)
Perc
entil
e R
anks
Tot
al D
isco
unts
(A)
Num
ber
of S
tude
nts
(B)
% o
f St
uden
ts(C
)
Tot
al I
nvoi
ceA
vera
ge(D
)
Avg
. Stu
dent
Aid
Gra
nt f
orE
ach
Coh
ort
(E)
Avg
. %D
isco
unt
Bra
cket
(F)
Avg
. Rev
enue
sB
efor
eR
estr
icte
dSt
uden
t Aid
Gra
nt R
even
ue(G
)
Tot
al G
ross
Rev
enue
sB
efor
e St
uden
tA
id G
rant
Dis
coun
ts(H
)
Tot
al S
tude
ntA
id G
rant
Dis
coun
ts(I
)D
ata
Sour
ces
% o
f B
Tot
alB
illin
g Fi
leB
illin
g Fi
leE
as
% o
f D
D E
B x
GB
x E
100+
110.
50%
$25,
578
$28,
714
112.
26%
-$3,
136
$281
,358
$315
,852
90 to
99
120.
5425
,256
24,8
0698
.22
450
303,
072
297,
677
80 to
89
261.
1825
,364
22,1
2087
.21
3,24
465
9,46
457
5,11
970
to 7
935
1.59
25,2
7819
,674
77.8
35,
604
884,
730
688,
585
60 to
69
873.
9525
,238
16,7
8866
.52
8,45
02,
195,
706
1,46
0,58
450
to 5
911
35.
1325
,185
13,6
4554
.18
11,5
402,
845,
905
1,54
1,91
140
to 4
910
54.
7719
,985
9,69
748
.52
10,2
882,
098,
425
1,01
8,15
630
to 3
911
35.
1320
,086
7,81
738
.92
12,2
692,
269,
718
883,
374
20 to
29
214
9.72
21,5
985,
993
27.7
515
,605
4,62
1,97
21,
282,
603
10 to
19
278
12.6
225
,614
4,23
116
.52
21,3
837,
120,
692
1,17
6,33
81
to 9
312
14.1
722
,356
1,91
18.
5520
,445
6,97
5,07
259
6,36
9T
otal
with
Dis
coun
ts1,
306
59.3
123
,168
7,53
232
.51
15,6
3530
,256
,114
9,83
6,56
9N
o D
isco
unts
896
40.6
922
,558
00.
0022
,558
20,2
11,9
680
Tot
al.
2,20
210
0.00
22,9
184,
467
19.4
918
,452
50,4
68,0
82-
9,83
6,56
9
Wei
ghte
d A
vera
ges
With
Stu
dent
Aid
Gra
nts
23,1
687,
532
32.5
115
,635
30,2
56,1
149,
836,
569
or T
otal
s pe
r C
olum
nW
ithou
t22
,558
00.
0022
,558
20,2
11,9
680
Tot
al22
,918
4,46
719
.49
18,4
5250
,468
,082
9,83
6,56
9
Not
e: T
his
illus
trat
ion
uses
ave
rage
per
cent
age
deci
le c
ohor
t per
cent
age
shar
es f
or a
lloca
ting
reve
nues
to a
uxili
ary
ente
rpri
ses
and
inst
ruct
ion.
Sin
ce a
ll st
uden
t inv
oice
sar
e fi
rst r
anke
din
divi
dual
ly, t
he a
uxili
ary
ente
rpri
ses
allo
catio
n ca
n be
acc
ompl
ishe
d st
uden
t by
stud
ent.
Lib
eral
Art
s C
olle
ge c
harg
es a
com
preh
ensi
ve f
ee o
f $2
5,54
8. C
olum
n D
show
s th
e av
erag
e in
voic
e fo
rea
ch c
ohor
t. T
he a
vera
ge d
isco
unt f
or s
tude
nts
with
dis
coun
ts is
32.
51 p
erce
nt. T
he a
vera
ge d
isco
unt f
or a
ll st
uden
ts is
19.
49 p
erce
nt. C
olum
n M
sho
ws
the
perc
enta
ge a
lloca
tion
of b
udge
tabl
ere
venu
es (
colu
mn
L)
to a
uxili
ary
ente
rpri
ses.
Col
umn
0 sh
ows
the
budg
etab
le r
even
ue a
lloca
tion
to in
stru
ctio
n. T
he in
stitu
tion
prod
uced
50,
670
cred
it ho
urs
for
the
year
inqu
estio
n (c
olum
n P)
.C
olum
n Q
list
s th
e av
erag
e cr
edit
hour
s pe
r se
mes
ter
for
each
coh
ort.
Bec
ause
of
roun
ding
, fig
ures
may
not
add
up
exac
tly to
tota
ls.
BE
ST C
OPY
AV
AIL
AB
LE
135

Figu
re 6
.11
(con
tinue
d): D
ecile
Dis
trib
utio
n of
Stu
dent
Aid
Dis
coun
ts a
nd B
udge
tabl
e R
even
ues
from
Stu
dent
Cha
rges
at L
iber
alA
rts
Col
lege
, Sho
win
g th
e C
alcu
latio
n of
Bud
geta
ble
Net
Rev
enue
s A
ssig
ned
to I
nstr
uctio
n (C
olum
n 0)
Perc
entil
e R
anks
Tot
al D
isco
unts
(A)
Tot
al B
udge
tabl
eR
even
ues
befo
reR
estr
icte
d St
uden
t Aid
Gra
nts
(J)
Tot
alR
estr
icte
dSt
uden
t Aid
Gra
ntR
even
ues
(K)
Tot
alB
udge
tabl
eR
even
ues
(L)
Perc
ent o
fR
even
ues
Ass
igne
d to
Aux
iliar
yE
nter
pris
es(M
)
Tot
al R
even
ues
Ass
igne
d to
Aux
iliar
yE
nter
pris
es(N
)
Tot
al R
even
ues
Ass
igne
d to
Inst
ruct
ion
(0)
Tot
al A
nnua
lC
redi
ts(P
)
Ave
rage
Sem
este
rC
redi
t Loa
d(Q
)D
ata
Sou
rces
Invo
ices
J +
KIn
voic
esK
x M
L -
NC
ours
e-L
oad
Mat
ix(P
+ B
) +
210
0+-$
34,4
94$4
13,6
55$3
79,1
6123
.46%
$88,
951
$290
,210
330
15.0
0090
to 9
95,
395
328,
920
334,
315
23.4
678
,430
255,
885
396
16.5
0080
to 8
984
,345
332,
850
417,
195
21.5
289
,780
327,
415
845
16.2
5070
to 7
919
6,14
536
5,22
556
1,37
019
.75
110,
871
450,
499
1,22
517
.500
60 to
69
735,
122
388,
925
1,12
4,04
718
.52
208,
174
915,
873
3,04
517
.500
50 to
59
1,30
3,99
436
8,28
51,
672,
279
19.2
332
1,57
91,
350,
700
2,82
512
.500
40 to
49
1,08
0,26
935
8,55
01,
438,
819
20.2
529
1,36
11,
147,
458
2,56
212
.200
30 to
39
1,38
6,34
434
5,22
51,
731,
569
18.3
731
8,08
91,
413,
480
2,79
112
.350
20 to
29
3,33
9,36
920
2,50
53,
541,
874
17.2
260
9,91
12,
931,
963
7,27
617
.000
10 to
19
5,94
4,35
410
1,22
56,
045,
579
18.5
21,
119,
641
4,92
5,93
87,
395
13.3
001
to 9
6,37
8,70
398
,520
6,47
7,22
315
.33
992,
958
5,48
4,26
58,
580
13.7
50T
otal
with
Dis
coun
ts20
,419
,545
3,30
3,88
523
,723
,430
17.8
34,
229,
745
19,4
93,6
8637
,270
14.2
69N
o D
isco
unts
20,2
11,9
6850
9,15
520
,721
,123
20.2
24,
189,
811
16,5
31,3
1222
,400
12.5
00T
otal
40,6
31,5
133,
813,
040
44,4
44,5
5418
.94
8,41
9,55
736
,024
,997
59,6
7013
.549
Wei
ghte
d A
vera
ges
20,4
19,5
453,
303,
885
23,7
23,4
3020
.14
4,22
9,74
519
,493
,686
37,2
7014
.269
or T
otal
s pe
r C
olum
n20
,211
,968
509,
155
20,7
21,1
2320
.22
4,18
9,81
116
,531
,312
22,4
0012
.500
40,6
31,5
133,
813,
040
44,4
44,5
5420
.52
8,41
9,55
736
,024
,997
59,6
7013
.549
Not
e: B
ecau
se o
f ro
undi
ng, f
igur
es m
ay n
ot a
dd u
p ex
actly
to to
tals
.
136
BE
ST C
OPY
AV
MB
LE
137

Figu
re 6
.12:
Dec
ile D
istr
ibut
ion
of S
tude
nt A
id D
isco
unts
and
Bud
geta
ble
Rev
enue
s fr
om S
tude
nt C
harg
es a
t Lib
eral
Art
s C
olle
ge,
Show
ing
Bud
geta
ble
Net
Rev
enue
s A
ssig
ned
to th
e D
epar
tmen
t of
Eco
nom
ics
and
Eco
nom
ics
101-
1 (C
olum
ns J
and
L)
Perc
entil
e R
anks
Tot
al D
isco
unts
(A)
Num
ber
ofSt
uden
ts(B
)
% o
fSt
uden
ts(C
)
Tot
alB
udge
tabl
eR
even
ues
(D)
% R
even
ues
Ass
igne
d to
Aux
iliar
yE
nter
pris
es(E
)
Tot
alR
even
ues
toA
uxili
ary
Ent
erpr
ises
(F)
Tot
alR
even
ues
toIn
stru
ctio
n(G
)
Tot
alA
nnua
lC
redi
tH
ours
(H)
Ann
ual
Cre
dits
inE
cono
mic
sD
epar
tmen
t(I
)
Tot
alR
even
ues
Ass
igne
d to
Eco
nom
ics
Dep
artm
ent
(J)
Ann
ual
Cre
dits
inE
cono
mic
s10
1-1
(K)
Rev
enue
sA
ssig
ned
toE
cono
mic
s10
1-1
(L)
Dat
a So
urce
sB
illin
g Fi
le%
of
BT
otal
Col
umn
LFi
g. 6
.11
D x
ED
- F
Cou
rse-
Loa
dM
atri
xC
ours
e-L
oad
Mat
rix
(G -
I- H
) x
IFi
gure
6.1
3(G
+ H
) x
K
100+
110.
50%
$379
,161
23.4
6%$8
8,95
1$2
90,2
1033
015
$13,
191
00
90 to
99
120.
5433
4,31
523
.46
78,4
3025
5,88
539
621
13,5
703
1,93
980
to 8
926
1.18
417,
195
21.5
289
,780
327,
415
845
3513
,562
31,
162
70 to
79
351.
5956
1,37
019
.75
110,
871
450,
499
1,22
542
15,4
460
060
to 6
987
3.95
1,12
4,04
718
.52
208,
174
915,
873
3,04
536
10,8
283
902
50 to
59
113
5.13
1,67
2,27
919
.23
321,
579
1,35
0,70
02,
825
3617
,212
125,
737
40 to
49
105
4.77
1,43
8,81
920
.25
291,
361
1,14
7,45
82,
562
135
60,4
6315
6,71
830
to 3
911
35.
131,
731,
569
18.3
731
8,08
91,
413,
480
2,79
114
171
,408
189,
116
20 to
29
214
9.72
3,54
1,87
417
.22
609,
911
2,93
1,96
37,
276
210
84,6
2212
4,83
610
to 1
927
812
.62
6,04
5,57
918
.52
1,11
9,64
14,
925,
938
7,39
530
620
3,83
26
3,99
7I
to 9
312
14.1
76,
477,
223
15.3
399
2,95
85,
484,
265
8,58
028
218
0,25
29
5,75
3T
otal
1&
E D
isco
unts
1,30
659
.31
23,7
23,4
3117
.83
4,22
9,74
519
,493
,686
37,2
701,
259
684,
387
8140
,160
No
Dis
coun
ts89
640
.69
20,7
21,1
2320
.22
4,18
9,81
116
,531
,312
22,4
0087
164
2,80
263
46,4
94T
otal
2,20
210
0.00
44,4
44,5
5418
.94
8,41
9,55
736
,024
,997
59,6
702,
130
1,32
7,18
914
486
,654
Not
e: T
his
illus
trat
ion
uses
ave
rage
per
cent
age
deci
le c
ohor
t per
cent
age
shar
es f
or a
lloca
ting
reve
nues
to th
e D
epar
tmen
t of
Eco
nom
ics
and
o E
cono
mic
s 10
1-1.
Sin
ce a
ll st
uden
t inv
oice
s ar
e fi
rst r
anke
din
divi
dual
ly, t
hese
allo
catio
ns c
an b
e ac
com
plis
hed
stud
ent b
y st
uden
t. A
lthou
gh th
is e
xhib
it is
cal
cula
ted
from
left
to r
ight
, in
from
-the
-bot
tom
-up
mic
ro-c
ostin
g co
lum
n is
act
ually
the
sum
of
all i
ndiv
idua
lco
urse
-bud
geta
ble
reve
nue
acco
unts
(se
e co
lum
n L
).
138
13L
i

Figu
re 6
.13:
Lib
eral
Art
s C
olle
ge D
epar
tmen
tof
Eco
nom
ics
Cou
rse-
Rev
enue
Mat
rix
With
Cre
dit-
Hou
r R
even
ues
Perc
entil
e R
ank
Tot
al D
isco
unts
(A)
Num
ber
ofSt
uden
ts(B
)
Tot
alC
redi
tH
ours
(C)
Eco
nom
ics
101-
1C
redi
ts0:
9_
Eco
nom
ics
101-
2C
redi
ts(E
)
Eco
nom
ics
102.
1C
redi
ts(F
)
Eco
nom
ics
102-
2C
redi
ts(G
)
Eco
nom
ics
220
Cre
dits
(H)
Eco
nom
ics
223
Cre
dits
(1)
Eco
nom
ics
235
Cre
dits
(J)
Eco
nom
ics
351
Cre
dits
(K)
Eco
nom
ics
300
Cre
dits
(L)
Eco
nom
ics
400
Cre
dits
(M)
Eco
nom
ics
All
Oth
er(N
)
Tot
alD
epar
tmen
tof
Eco
nom
ics
Cre
dits
(0)
Dat
a So
urce
sB
illin
gFi
leC
ours
e-L
oad
Mat
rix
100+
1133
00
03
30
30
03
03
15
90 to
99
1239
63
00
00
33
00
39
21
80 to
89
2684
53
06
36
30
03
38
35
70 to
79
351,
225
00
00
03
63
69
1542
60 to
69
873,
045
30
63
00
00
63
1536
50 to
59
113
2,82
512
66
33
00
03
03
36
40 to
49
105
2,56
215
129
63
69
129
945
135
30 to
39
113
2,79
118
1515
126
39
615
636
141
20 to
29
214
7,27
612
1215
123
612
921
1593
210
10 to
19
278
7,39
56
912
1215
918
1518
2117
130
6
1 to
931
28,
580
912
159
216
1215
1215
156
282
Tot
al l
&E
Dis
coun
ts1,
306
37,2
7081
6687
6357
4269
6096
8455
41,
259
No
Dis
coun
ts89
622
,400
6354
5148
2735
3624
3336
464
871
Tot
al2,
202
59,6
7014
412
013
811
184
7710
584
129
120
1,01
82,
130
Rev
enue
sA
ssig
ned
toIn
stru
ctio
n
Tot
alIn
stru
ctio
nC
redi
tH
ours
Rev
enue
s A
ssig
ned
to E
ach
Cou
rse
100+
$290
,210
330
$0$0
$2,6
38$2
,638
$0$2
,638
$0$0
$2,6
38$0
$2,6
38$1
3,19
1
90 to
99
255,
885
396
1,93
90
00
01,
939
1,93
90
01,
939
5,81
613
,570
80 to
89
327,
415
845
1,16
20
2,32
51,
162
2,32
51,
162
00
1,16
21,
162
3,10
013
,562
70 to
79
450,
499
1,22
50
00
00
1,10
32,
207
1,10
32,
207
3,31
05,
516
15,4
46
60 to
69
915,
873
3,04
590
20
1,80
590
20
00
01,
805
902
4,51
210
,828
50 to
59
1,35
0,70
02,
825
5,73
72,
869
2,86
91,
434
1,43
40
00
1,43
40
1,43
417
,212
40 to
49
1,14
7,45
82,
562
6,71
85,
375
4,03
12,
687
1,34
42,
687
4,03
15,
375
4,03
14,
031
20,1
5460
,463
30 to
39
1,41
3,48
02,
791
9,11
67,
597
7,59
76,
077
3,03
91,
519
4,55
83,
039
7,59
73,
039
18,2
3271
,408
20 to
29
2,93
1,96
37,
276
4,83
64,
836
6,04
44,
836
1,20
92,
418
4,83
63,
627
8,46
26,
044
37,4
7684
,622
10 to
19
4,92
5,93
87,
395
3,99
75,
995
7,99
37,
993
9,99
25,
995
11,9
909,
992
11,9
9013
,988
113,
906
-20
3,83
2
1 to
95,
484,
265
8,58
05,
753
7,67
09,
588
5,75
313
,423
3,83
57,
670
9,58
87,
670
9,58
899
,714
180,
252
Tot
al I
&E
Dis
coun
ts19
,493
,686
37,2
7040
,160
34,3
4144
,890
33,4
8432
,765
23,2
9737
,230
32,7
2348
,996
44,0
0331
2,49
868
4,38
7
No
Dis
coun
ts16
,531
,312
22,4
0046
,494
39,8
5237
,638
35,4
2419
,928
25,8
3026
,568
17,7
1224
,354
26,5
6834
2,43
464
2,80
2
Tot
al36
,024
,997
59,6
7086
,654
74,1
9382
,528
68,9
0852
,691
49,1
2763
,798
50,4
3573
,351
70,5
7265
4,93
21,
327,
189
Not
e: W
hen
the
cour
se-l
oad
mat
rix
is c
ombi
ned
with
the
rank
ed s
tude
nt b
illin
g fi
le, i
nstr
uctio
nal r
even
ues
can
be a
ssig
ned
dire
ctly
to e
ach
cour
se.
141
140
0 a tD 3 ci
!
C) 3 0 O ro C 0 Cl) O 0 O C CD

Cost Accounting in Higher Education
SelectediAlltication:Bases
The. table. lists several. and support-cost allocation bases that could have been used in theexamples in this chapter:it is.safe to say that each:substitute.would have.produced different cost thatv,i
theroneschoiem.Selected. IndirectandSupport Costs and Their Allocation Bases for Liberal:Arts College -_
Clerical and supportsalaries,.wages, and benefitsPercentage of personnel 'compensation
-Credit hours.7.,Studies of.staff time. spent on activity
Eitecutive administration::Activity's.percent-Ottotaldirect.costs.Percentage.of perion' nei,compensationStUdiee.of time devoted to activity
HUman resources Management; payroll, etc:.Number of employeee:servedTOtal.employee heid-countErriployees eligible fot servicesPercentage of compensation. or payroll
Computing;:academicz .
Measured use. Prorated:on basis of student/facuity use factor
Computing, administrative.-Measured use..Prbrated.on-basis.of ad hOC.use study.
Library; library maintenancef,Student/faculty use-factor:','Square.foOtage
Admissions-.Percentage of matriculating studentsCredit hours . .
Registrar.:Head countCredit hours earned:Degrees conferred .
Student advisement-Head. countCredit hours
Financial aldaApplications proceseed.....HeadcoUntof students-with aid
Logistical services (mail service, work orders, accounts receivable, etc.)
Number. of documents processedNumber of. stations served .TiMe,studies-:
Repairs, replacements.Square footageTithe studies-....
UtilitiesMetered ---
Square.footager..iUse studies
Depreciation..Total or assigned square footageCredit hours :
1 4 2

Academic Micro-Costing: The Full Cost of a Course
earned during the year by each student. For two semesters, the average annual FTEenrollment of 2,202 students generates 59,670 credits at an average 13.549 semester creditsper student. Of these credits, 2,130 are in the department of economics, and 144 arerepresented by Economics 101-1. Therefore, revenues of $86,654 are assigned to this course.Total revenues assigned to the Department of Economics are $1,327,189.
Figure 6.13 illustrates a partial listing of Department of Economics courses and theirrespective net revenues. The top half of the figure lists the credits earned, and the bottom halfcomputes the decile group revenues generated for each course. The column marked "AllOther" reports the unidentified credit hours and course revenues.
Plant Value, Square Footage, and Other Potential Allocation Data
Full costs for individual courses include several elements that will be allocated on the basisof total or assigned square feet of space used in instruction. Depreciation cost allocation tocourses also requires information on the undepreciated historical value and the remaininguseful life of facilities and equipment. This and any other information needed for allocatingcosts can be incorporated easily into the cost-course-load matrix.
Figure 6.14 identifies the allocation bases used in the subsequent illustrations in this chapter.
Course Depveciation Cogs
The computation of depreciation costs that are to be allocated to courses requires detailedfacilities and equipment inventories. Figure 6.15 summarizes the scope of plant andequipment depreciation for Liberal Arts College. It lists each facility and identifies theremaining asset values as well as the average useful-life years. Educational and general planthas been separated from auxiliary enterprises plant and from formal parking facilities.
Figure 6.16 addresses the issue of time- or use-weighted depreciation for classroom use.The exhibit identifies weekly classroom usage for one semester of building S. The building'stotal space is 72,304 square feet, of which 33,491 is classroom space.
Economics 101-1 occupies 825 square feet (room 1 in building S). By translating thissquare footage into square-foot hours, the time-weighted percentage of 1.6472 can be appliedto the building's total depreciation for a precise use-weighted depreciation allowance of $522for the room and $58 for Economics 101-1 (522 ÷ total room square-foot hours x Economics101-1 square-foot hours, or 522 22,275 x 2,475). This formula and figure 6.16 only addressthe direct course depreciation costs. The same use factor would be used for computingindirect and support depreciation-cost allocations.
Equipment depreciation costs depend in part on how much new equipment is added in agiven year. When calculating plant depreciation costs, one should also make a distinctionbetween the plant itself and the equipment and other installations in it that tend to wear outfaster than the physical facility proper. Today, many colleges and universities do not makethis distinction and therefore write off plant and equipment at too slow a pace. The dataprovided in figure 6.15 reflect these types of distinctions. The equipment componentembodies sizable periodic equipment replacements.
109
143

Cost Accounting in Higher Education
Figure 6.14: Selected Cost Elements and Cost Allocation ases forLiberal Arts College
Data ElementsEnrollment
Total Credit Hours 59,670Department of Economics Credit Hours 2,130Economics 101-1 Credit Hours 144
Total Head Count 2,202Total FTE Enrollment 2,011Department of Economics Head Count 355Department of Economics FIE h Enrollment 352Economics 101-1 1- 1 b Enrollment 48
Undepreciated Facilities Total Plant EquipmentFrom Figure 6.15 (Column B-E)
Total Square Feet 1,819,178 $43,331,250 $19,813,085 $23,518,165E&G 773,534 22,635,642 9,342,131 13,293,511Auxiliary Enterprises 641,382 17,824,251 7,599,596 10,224,655Other 404,262 2,871,357 2,871,357 0
Depreciation 2,870,171 858,322 2,011,849E&G 1,536,893 373,261 1,163,632Auxiliary Enterprises 1,093,998 245,782 846,216Other 238,280 238,280 0Building S 72,304 63,416 11,191 52,225Support Activities 123,498 219,771 105,974 113,797
Building S Usage (Figure 6.16)Total Square Foot Hours 1,352,264 $63,416*Room S1 22,275 1,586Economics 101-1, Room 51 2,475 85**Usage Factor, Economics 101-1 0.001830Economics 101-1 Support Usage 0.001066
Depreciation by Credit HoursTotal Credit Hours, E&G 59,670 $1,536,893Average Depreciation per Credit Hour 25.7565Average Depreciation per Three-Hour Course 77.2696Building S, Credit Hours 28,391 63,416Department of Economics, Credit Hours 2,130 4,757.7077Economics 101-1, Total Credit Hours 144 321.6478Economics 101-1, per Credit Hour 2.2337Economics 101-1, per Three-Credit Hours 6.7010
* Annual weighted depreciation cost.
** Semester equivalent weighted depreciation cost.
iitt 4 4

Academic Micro-Costing: The Full Cost of a Course
Figure 6.15: Liberal Arts College's Facilities Inventory emaining Asset, and Useful-Life Values Using Straight-Line Method of Depreciation
E&G Plant(A)
SquareFeet(B)
Undeprec.Value
(C)
Equipment& Furnish.
(D)
Plant(E)
Deprec.Equip.
&Furnish.
(F)
Deprec.Plant(G)
TotalDeprec.
(II)
Equip.Furnish.Avg. Yrs.
fromInventory
(I)
PlantAverage
(J)
TotalAverage
(K)
Data Source Inventory Inventory Inventory Inventory D + I E + J F + G Inventory Inventory C + H
B 7,257 $8,001 $6,224 $1,777 $1,245 $148 $1,393 5 12 6
C 8,203 4,742,532 2,347,553 2,394,979 156,504 49,895 206,399 15 48 23
D 37,126 338,091 219,759 118,332 19,978 9,861 29,839 11 12 I1
E 23,248 462,439 305,210 157,229 25,434 10,482 35,916 12 15 13
F 16,020 170,32; 123,483 46,839 15,435 3,903 19,339 8 12 9
G 8,642 190,992 16,616 174,376 3,323 21,797 25,120 5 8 8
H 42,517 2,631,908 1,207,783 1,424,125 75,486 52,745 128,232 16 27 21
I 26,244 296,557 192,762 103,795 24,095 7,414 31,509 8 14 9
J 20,115 859,179 573,072 286,107 52,097 15,895 67,992 11 18 13
K 33,396 555,769 405,711 150,058 45,079 11,543 56,622 9 13 10
L 33,550 370,890 252,205 118,685 22,928 8,477 31,405 11 14 12
M 26,109 160,601 139,723 20,878 19,960 1,606 21,566 7 13 7
N 35,847 1,729,461 1,003,087 726,374 83,591 34,589 118,180 12 21 15
0 7,918 628,383 490,139 138,244 61,267 11,520 72,788 8 12 9
P 6,714 121,484 106,906 14,578 26,726 1,822 28,549 4 8 4
Q 34,145 1,091,445 829,498 261,947 92,166 11,907 104,073 9 22 10
R 50,413 898,652 790,814 107,838 71,892 5,676 77,568 11 19 12
S 72,304 626,701 470,026 156,675 52,225 11,191 63,416 9 14 10
T 11,568 45,497 30,028 15,469 4,290 1,289 5,579 7 12 8
U 23,294 97,421 76,963 20,458 12,827 1,860 14,687 6 11 7
V 19,043 58,231 44,256 13,975 11,064 1,553 12,617 4 9 5
W 33,997 1,181,573 732,575 448,998 61,048 16,036 77,084 12 28 15
X 106,512 2,379,841 1,475,501 904,340 98,367 25,121 123,487 15 36 19
Y 76,264 1,503,822 721,835 781,987 65,621 27,928 93,549 I I 28 16
Z 9,563 1,485,85Q 731,781 754,069 60,982 29,003 89,984 12 26 17
Other 3,525 20,840 11,462 9,378 1,910 1,340 3,250 6 7 6
Total E&G 773,534 22,635,642 13,293,511 9,342,131 1,163,632 373,261 1,536,893 11 25 15
AA 38,813 4,579,582 2,266,893 2,312,689 151,126 49,206 200,332 15 47 23
BB 27,775 418,800 314,100 104,700 26,175 4,986 31,161 12 21 13
CC 34,652 413,100 309,825 103,275 28,166 5,436 33,601 I I 19 12
DD 45,963 195,241 160,098 35,143 20,012 2,703 22,716 8 13 9
EE 34,652 433,335 312,001 121,334 31,200 6,741 37,941 10 18 11
FF 41,032 559,609 380,534 179,075 42,282 8,140 50,421 9 22 11
GG 41,358 172,42 125,870 46,555 17,981 2,910 20,891 7 16 8
HH 9,062 16,447 14,802 1,645 1,850 164 2,015 8 10 8
II 44,680 131,031 113,997 17,034 11,400 1,217 12,616 10 14 10
JJ 25,769 1,368,365 793,652 574,713 56,689 30,248 86,937 14 19 16
KK 44,580 4,369,639 2,272,212 2,097,427 151,481 42,805 194,285 15 49 22
LL 24,291 438,897 359,896 79,001 32,718 4,389 37,107 11 18 12
MM 63,011 2,869,318 1,520,739 1,348,579 108,624 51,868 160,493 14 26 18
NN 27,745 703,553` 506,558 196,995 63,320 9,381 72,700 8 21 10
00 23,282 349,924 251,945 97,979 27,994 5,443 33,437 9 18 10
PP 8,629 5,222 2,872 2,350 479 261 740 6 9 7
QQ 10,350 39,516 24,500 15,016 6,125 2,145 8,270 4 7 5
Misc. Small Houses 95,738 760,247 494,161 266,086 70,594 17,739 88,333 7 15 9
Total AuxiliaryEnterprises
641,382 17,824,251 10,224,655 7,599,596 848,216 245,782 1,093,998 12 31 16
Dedicated Parking 404,262 2,871,357 0 2,871,357 0 239,280 239,280 0 12 12
Total Facilities 1,819,178 43,331,250 23,518,165 19,813,085 2,011,849 858,322 2,870,171 12 23 15
145
BEST COPY AVALABLE

Figu
re 6
.16:
Lib
eral
Art
s C
olle
ge's
Dep
reci
atio
n A
llow
ance
for
Cla
ssro
om U
se in
Bui
ldin
g S
Bas
ed o
n 2,
475
Squa
re-F
oot H
ours
for
Eco
nom
ics
101-
1
Bui
ldin
g S
Cla
ssro
oms
Ann
ual
Dep
reci
atio
n=$6
3,41
6(S
emes
ter=
$31
,708
)Sq
uare
Feet
Hou
rs:
Mon
day,
Wed
nesd
ay,
Frid
aySq
uare
-Fo
ot H
ours
Hou
rs:
Tue
sday
,T
hurs
day
Squa
re-
Foot
Hou
rs
Tot
alSq
uare
-Fo
otH
ours
Usa
geFa
ctor
:M
onda
y,W
edne
sday
,Fr
iday
Usa
geFa
ctor
:T
uesd
ay,
Thu
rsda
y
Dep
reci
atio
n:M
onda
y,W
edne
sday
,Fr
iday
Dep
reci
atio
n:T
uesd
ay,
Thu
rsda
yT
otal
Dep
reci
atio
nR
oom
I82
59
22,2
757
11,5
5033
,825
1.64
72%
0.85
41%
$522
$271
$793
Roo
m 2
1,16
68
27,9
845
11,6
6039
,644
2.06
940.
8623
656
273
930
Roo
m 3
926
925
,002
814
,816
39,8
181.
8489
1.09
5658
634
793
4R
oom
478
29
21,1
149
14,0
7635
,190
1.56
141.
0409
495
330
825
Roo
m 5
1,25
57
26,3
558
20,0
8046
,435
1.94
901.
4849
618
471
1,08
9R
oom
696
89
26,1
369
17,4
2443
,560
1.93
281.
2885
613
409
1,02
1R
oom
71,
488
940
,176
720
,832
61,0
082.
9710
1.54
0594
248
81,
431
Roo
m 8
1,29
29
34,8
847
18,0
8852
,972
2.57
971.
3376
818
424
1,24
2R
oom
989
66
24,1
929
16,1
2840
,320
1.78
901.
1927
567
378
945
Roo
m 1
092
89
25,0
569
16,7
0441
,760
1.85
291.
2353
588
392
979
Roo
m I
I1,
192
828
,608
819
,072
47,6
802.
1156
1.41
0467
144
71,
118
Roo
m 1
21,
321
831
,704
821
,136
52,8
402.
3445
1.56
3074
349
61,
239
Roo
m 1
31,
105
929
,835
715
,470
45,3
052.
2063
1.14
4070
036
31,
062
Roo
m 1
41,
102
929
,754
613
,224
42,9
782.
2003
0.97
7969
831
01,
008
Roo
m 1
598
59
26,5
959
17,7
3044
,325
1.96
671.
3111
624
416
1,03
9R
oom
16
1,35
59
36,5
856
16,2
6052
,845
2.70
551.
2024
858
381
1,23
9R
oom
17
1,15
69
31,2
128
18,4
9649
,708
2.30
811.
3678
732
434
1,16
6R
oom
18
956
925
,812
917
,208
43,0
201.
9088
1.27
2560
540
31,
009
Roo
m 1
91,
226
725
,746
819
,616
45,3
621.
9039
1.45
0660
446
01,
064
Roo
m 2
01,
685
840
,440
620
,220
60,6
602.
9905
1.49
5394
847
41,
422
Roo
m 2
11,
524
836
,578
721
,336
57,9
122.
7048
1.57
7885
850
01,
358
Roo
m 2
21,
382
937
,314
822
,112
59,4
262.
7594
1.63
5287
551
81,
393
Roo
m 2
31,
286
934
,722
820
,576
55,2
982.
5677
1.52
1681
448
21,
297
Roo
m 2
494
49
25,4
886
11,3
2836
,816
1.88
480.
8377
598
266
863
Roo
m 2
51,
592
942
,984
619
,104
62,0
883.
1787
1.41
271,
008
448
1,45
6R
oom
26
1,62
18
38,9
045
16,2
1055
,114
2.87
701.
1987
912
380
1,29
2R
oom
27
1,25
19
33,7
778
20,0
1653
,793
2.49
781.
4802
792
469
1,26
1R
oom
28
1,28
29
34,6
147
17,9
4852
,562
2.55
971.
3273
812
421
1,23
2T
otal
33,4
9125
.79
863,
844
14.5
848
8,42
01,
352,
264
63.8
813
36.1
187
20,2
5511
,453
31,7
08
Not
e:
Roo
m I
Usa
ge F
acto
r:M
onda
y, W
edne
sday
, Fri
day
Eco
nom
ics
101-
1 U
sage
:M
onda
y, W
edne
sday
, Fri
day
0.01
647
The
tota
l dep
reci
atio
n fo
r B
uild
ing
S is
$63
,416
or
$31,
708
for
one
sem
este
r. T
he r
oom
s lis
ted
abov
e ex
clud
eal
l but
cla
ssro
om a
nd la
bora
tory
spa
ces.
The
tota
l squ
are
foot
age
is 7
2,30
4. T
he s
quar
e fo
otag
e fo
r th
e ro
oms
0.00
183
liste
d is
33,
491.
The
refo
re, t
he to
tal d
epre
ciat
ion
cost
for
Bui
ldin
g S
is c
arri
ed b
y th
is s
mal
ler
squa
re f
oota
ge.
Bui
ldin
g S
Ann
ual D
epre
ciat
ion
$63,
416
Sem
este
r E
quiv
alen
t$3
1,70
8Se
mes
ter
Dep
reci
atio
n R
oom
1$3
97
C) 0 cn 0 co0 co C
D m 0 C)
147

Academic Micro-Costing: The Full Cost of a Course
Allocating Departmental N t ral Costs to Courses
The natural cost chart of accounts is the best indicator of how institutions invest theiroperating funds. Figures 6.17 and 6.18 display Liberal Arts Colleges natural costs. Figure 6.17focuses on support costs. Figure 6.18 shows primary by-function costs and includes totalsupport costs from figure 6.17.
Normally, natural tier-one direct operating costs are charged to the appropriate departmentalnatural cost lines and not directly to individual courses and activities. Figure 6.19 identifies thenatural costs for the economics department reported in the year-end audit report. AllocationMethod lists generally accepted methods for distributing departmental natural costs toindividual courses. Institutions have discretion in how precisely and where they allocate coststo departments and from there to courses. In the context of figure 6.19, the term "direct" meansthat departmental charges are natural-cost specific. The term "formula" in figure 6.19 refers tothe fact that some direct costs are charged on the basis of a specific prorating formula.
Formula- ased Prorating
Liberal Arts College tries to allocate costs as precisely as possible for each natural-costaccount. Standard cost-prorating formulas are used to allocate the following types of tier-onecosts for consumables: general institutional telecommunications costs, a portion of computerservices costs, property and casualty insurance costs, purchased utilities costs, the cost ofinternally generated heating and cooling, and all tier-two through tier-four costs.
Until recently, Liberal Arts College did not allocate support costs to primary programs,departments, or courses and activities. Under SFAS No. 117, Liberal Arts College isexperimenting with several course and academic full-cost approaches. All traditional andnew allocation formulas used are based on historical trend-and-ratio studies of the costs thatare being allocated. Management will review and, when necessary, modify the standard costallocation models and at the end of each year will adjust any differences between standardand actual costs charged during the year.
The approach illustrated here stresses kind-for-kind prorating. In practice, many institutionswill prorate costs without identifying specific natural costs: The supplying or selling departmentdeducts the prorated-out costs from its total costs, and the user department receives thesechanges as prorated-in lump-sum costs. Normally, both in- and out-prorating occur on the samenet-prorating line, thus obscuring further what actually happens to specific natural costs.
Kind-for-kind natural-cost allocation may appear to be, but is not necessarily, morecomplicated than lump-sum prorating. Even for the latter, internal prices or some sort offormula-based costs must be determined before a charge can occur. Thus, each charge mightas well be shown at its appropriate natural cost site. Institutions will want to substitute theirnatural cost categories for those shown here. For summary presentations, personnelcompensation and consumables cost totals can be combined, as shown in figures 1.3 and 1.5.The use of natural-cost allocation bases enhances costing precision since natural costs clearlymeet the affinity test. With sufficient experience, institutions should be able to develop
113
148

149
Figu
re 6
.17:
Sup
port
Cos
ts b
y N
atur
al C
ost C
lass
ific
atio
ns f
or L
iber
al A
rts
Col
lege
($
in 1
,000
s)
Nat
ural
Cos
tsT
ypes
of
Supp
ort C
osts
Aca
dem
icSu
ppor
tL
ibra
ry
Aca
dem
icC
ompu
ter
Supp
ort
Exe
cutiv
eA
dmin
istr
atio
n
24.5
0% to
Aux
iliar
yE
nter
pris
es
Exe
cutiv
eA
dmin
istr
atio
nN
etG
ener
alIn
stitu
tiona
lSt
uden
tSe
rvic
es
Publ
icR
elat
ions
and
Dev
elop
men
tO
&M
Tot
alSu
ppor
tPe
rson
nel C
ompe
nsat
ion
Sala
ries
, Fac
ulty
$32
$329
$119
$0$0
$0$0
$128
$0$0
$608
Sala
ries
, Off
icer
s0
192
129
532
-130
402
6816
197
115
1,16
4O
ther
Sal
arie
s an
d W
ages
2847
195
186
-46
140
385
895
576
1,55
34,
143
Stud
ent W
ages
1298
3522
-517
4528
510
138
640
Subt
otal
721,
090
378
740
-181
559
498
14,6
968
31,
806
6.55
5St
aff
Ben
efits
2529
511
624
2-5
918
314
649
326
757
22,
097
Tui
tion
Ben
efit
035
2575
-18
5713
885
9378
511
Roo
m a
nd B
oard
Allo
wed
618
158
-26
185
6918
4135
8T
otal
Ben
efits
3134
815
632
5-7
924
646
964
737
869
12,
966
Prof
essi
onal
Ser
vice
s0
155
10-2
845
285
5215
632
Tot
al C
ompe
nsat
ion
103
1,45
353
91,
075
-262
813
1,41
92,
201
1,11
32,
512
10,1
53C
onsu
mab
les
Tra
vel,
Ent
erta
inm
ent
124
2516
45-1
134
2140
889
5276
9Su
pplie
s11
650
9529
-722
6815
935
123
668
Tel
ecom
mun
icat
ions
,M
easu
red
1835
3133
-825
5279
8133
354
Tel
ecom
mun
icat
ions
, Pro
rate
d9
2721
22-5
1715
886
3422
374
Com
pute
r Se
rvic
es, M
easu
red
1231
2212
-39
1514
1112
126
Com
pute
r Se
rvic
es, P
rora
ted
2232
7223
-617
5355
2319
293
Prin
ting,
Pub
licat
ions
1212
3281
-20
6162
305
115
1161
0Pr
oper
ty/C
asua
lty I
nsur
ance
816
1412
-39
5218
1715
149
Due
s, S
ubsc
ript
ions
812
1218
-414
1821
288
121
Post
age,
Fre
ight
1538
832
-824
8621
592
4852
6R
epai
r, R
epla
cem
ent,
Etc
.86
237
111
58-1
444
248
122
231,
607
2,47
8U
tiliti
es20
8621
18-4
1449
3215
4528
2Fo
od, S
tude
nts
00
00
00
00
00
0Fo
od, O
ther
58
545
-11
3412
7555
1220
6G
oods
for
Res
ale
00
00
00
00
00
Mis
cella
neou
s57
3716
55-1
342
8386
7586
482
Subt
otal
512
646
476
483
-117
366
977
1,67
569
32,
093
7,43
8T
otal
Tie
r O
ne61
52,
099
1,01
51,
558
-379
1,17
92,
396
3,87
61,
806
4,60
517
,591
Lon
g-T
erm
Deb
t Cos
ts0
00
00
00
00
3333
Tot
al T
ier
Tw
o61
52,
099
1,01
51,
558
-382
1,17
92,
396
3,87
61,
806
4,63
817
,624
One
-Yea
r A
sset
s17
2115
27-7
2038
1912
4919
1T
otal
Tie
r T
hree
632
2,12
01,
030
1,58
5-3
891,
199
2,43
43,
895
1,81
84,
687
17,8
15D
epre
ciat
ion
394
33
03
24
9026
246
1T
otal
Tie
r Fo
ur63
52,
214
1,03
31,
588
-389
1,20
22,
436
3,89
91,
908
4,94
918
,276
BE
ST C
OPY
WU
L B
LE

Figu
re 6
.18:
Pri
mar
y Pr
ogra
m C
osts
by
Nat
ural
Cos
t Cla
ssif
icat
ion
for
Lib
eral
Art
s C
olle
ge (
$ in
1,0
00s)
Nat
ural
Cos
tsT
ypes
of
Supp
ort C
osts
Inst
ruct
ion
Res
earc
hO
ther
E&
GA
uxili
ary
Ent
erpr
ises
From
Exe
cutiv
eA
dmin
istr
atio
nC
osts
Tot
alA
uxili
ary
Ent
erpr
ises
All
Oth
erT
otal
Pri
mar
yT
otal
Supp
ort
Tot
alC
olle
geC
osts
Pers
onne
l Com
pens
atio
nSa
lari
es, F
acul
ty$1
1,56
4$5
83$0
$12,
147
$0$0
$0$0
$12,
147
$608
$12,
755
Sala
ries
, Off
icer
s39
50
039
521
713
034
70
742
1,16
41,
906
Oth
er S
alar
ies
and
Wag
es1,
334
3814
81,
520
2,35
246
2,39
834
3,95
24,
143
8,09
5
Stud
ent W
ages
253
255
283
781
578
642
1,11
164
01,
751
Subt
otal
13,5
4664
615
314
,345
3,35
018
13,
531
7617
,952
6,55
524
,507
Staf
f B
enef
its5,
283
226
445,
553
1,03
959
1,09
821
6,67
22,
097
8,76
9
Tui
tion
Ben
efits
518
180
536
9518
113
064
951
11,
160
Roo
m a
nd B
oard
Alo
wed
116
112
129
246
224
80
377
358
735
Tot
al B
enef
its5,
917
255
466,
218
1,38
079
1,45
921
7,69
82,
966
10,6
64
Prof
essi
onal
Ser
vice
s83
40
083
411
72
119
095
363
21,
585
Tot
al C
ompe
nsat
ion
20,2
9790
119
921
,397
4,84
726
25,
109
9726
,603
10,1
5336
,756
Con
sum
able
sT
rave
l, E
nter
tain
men
t46
64
847
821
611
227
2172
676
91,
495
Supp
lies
679
128
699
268
727
513
987
668
1,65
5
Tel
ecom
mun
icat
ions
,M
easu
red
862
391
588
6614
171
354
525
Tel
ecom
mun
icat
ions
, Pro
rate
d54
12
5712
95
134
1220
337
457
7
Com
pute
r Se
rvic
es, M
easu
red
8619
110
633
336
2716
912
629
5
Com
pute
r Se
rvic
es, P
rora
ted
7527
110
345
651
1416
829
346
1
Prin
ting,
Pub
licat
ions
353
115
369
3820
5813
440
610
1,05
0
Prop
erty
/Cas
ualty
Ins
uran
ce28
62
229
042
13
424
271
614
986
5
Due
s, S
ubsc
ript
ions
185
11
187
44
81
196
121
317
Post
age,
Fre
ight
122
113
136
388
461
183
526
709
Rep
air,
Rep
lace
men
t, E
tc.
471
128
491
1,46
914
1,48
312
1,98
62,
478
4,46
4
Util
ities
381
126
399
402
440
65
810
282
1,09
2
Food
, Stu
dent
s0
00
01,
929
01,
929
01,
929
01,
929
Food
, Oth
er58
02
6027
711
288
134
920
655
5
Goo
ds f
or R
esal
e0
00
03,
065
03,
065
03,
065
03,
065
Mis
cella
neou
s28
33
3432
089
213
905
124
1,34
948
21,
831
Subt
otal
3,58
510
794
3,78
69,
284
117
9,40
126
013
,447
7,43
820
,885
Tot
al T
ier
One
23,8
821,
008
293
25,1
8314
,131
379
14,5
1035
740
,050
17,5
9157
,641
Lon
g-T
erm
Deb
t Cos
ts38
27
038
927
30
273
066
233
695
Tot
al T
ier
Tw
o24
,246
1,01
529
325
,572
14,4
0437
917
,783
357
40,7
1217
,624
58,3
36
One
-Yea
r A
sset
s12
1'5
312
982
789
1122
219
141
3
Tot
al T
ier
Thr
ee24
,385
1,02
029
625
,701
14,4
8638
614
,872
368
40,9
3417
,815
58,7
49
Dep
reci
atio
n1,
255
3511
1,30
11,
094
31,
097
142,
409
461
2,87
0
Tot
al T
ier
Four
25,6
401,
055
307
27,0
2215
,580
389
15,9
6938
243
,343
18,2
7661
,619
151
152

Cost Accounting in Higher Education
Figure 6.19: Natural Cost Structure of FTFC Model at Liberal Arts College ShowingSelected Cost Allocation Methods
Cost Center
TotalCollege
($ in 1,000s)Instruction($ in 1,000s)
Departmentof Economics
Economics101-1 Allocation Method
ConsumablesTravel, Entertainment $1,495 $466 $16,634 ? DirectSupplies 1,655 679 24,238 ? DirectTelecommunications, Measured 525 86 4,025 ? DirectTelecommunications, Prorated 577 54 1,928 ? FormulaComputer Services 295 86 3,070 ? DirectComputer Services, Prorated 461 75 2,677 ? FormulaPrinting, Publications 1,050 353 12,601 ? DirectProperty/Casualty Insurance 865 286 10,209 ? FormulaDues, Subscriptions . 317 185 6,604 ? DirectPostage, Freight 709 122 4,355 ? DirectRepair, Replacement, Contr. 4,464 371 13,243 ? Direct & FormulaUtilities Purchased 1,092 481 17,170 ? Direct & FormulaFood, Students 1,929 0 0 ? Not ApplicableFood, Other 555 58 2,070 ? DirectGoods for Resale 3,065 0 0 ? Not ApplicableMiscellaneous 1,831 283 10,102 ? Direct & Formula
Subtotal 20,885 3,585 128,926 ?
costing parameters that charge not only direct, but indirect and support natural costs toindividual course and activities.
Charging Direct and Indirect Departmental Costs to Courses
First, it must be remembered that departmental budgets already reflect which costs aninstitution normally allocates or charges to departments and how it allocates them. Second,courses and other institutional activities have their own direct and indirect costs. Forinstance, each semester, one-sixth of the Economics 101-1 professor's compensation is adirect Economics 101-1 cost, whereas portions of clerical costs and the department chair'scompensation are among the course's indirect costs. How should these indirect costs beallocated?
Indirect departmental personnel compensation and consumables costs by and large are afunction of the size of the staff employed, of course enrollments, or of the size of thefacilities used. The corresponding allocation bases are the percentage of personnel or ofemployee compensation, of FTE enrollments or student credit hours, and of the value and theassigned square footage of classrooms and laboratories.
For the sake of this discussion, it is appropriate to look at course costs as if each coursehad its own full cost budget. If a cost, for instance, travel and entertainment, can be traced toa specific individual (i.e., the Economics 101-1 professor) and if it is of direct benefit to thecourse taught by that individual, the expense could be charged as a direct cost to the course'stravel and entertainment line. On the other hand, if the travel and entertainment in questionbenefits the department as a whole, the cost could then be allocated as an indirect cost to all
163

Academic Micro-Costing: The Full Cost of a Course
courses on some basis. Such distinctions, however, are usually lost, in the absence of coursebudgets, once specific costs have been charged to the department. The direct connection of a
cost to an employee or to a course must be established early in the course-cost-load matrix so
that the first direct-cost allocation occurs at the course or activity level and not at thedepartment level.
Some consumables costs are a function of usage, a popular type of allocation base. Usage-
based cost allocations can become overly complicated and may not be cost-effective in their
own right. On the other hand, usage clearly describes how some administrative offices andpersonnel spend their time. Determining the cost-effectiveness of these activities is
sometimes essential.
Simplified Course Full Costing Using Natural Costs
In computing course costs, it is often desirable to make the allocation of departmental
costs as simple as possible. Figures 6.20, 6.21, and 6.22 show increasingly complexallocation patterns and illustrate the effects on Economics 101-1 natural costs when threedifferent combinations of allocation methods are implemented prior to allocating support
costs to Economics 101-1.When allocating costs to courses, credit hours can serve as a useful across-the-board
allocation base.
Multiple Allocation Bases
In practice, however, multiple allocation bases are in widespread use. Figures 6.21 and
6.22 show two multiple allocation base models for Liberal Arts College. In figure 6.21,
square footage is added for a few natural-cost categories, and figure 6.22 adds a fewrefinements to the allocation of personnel costs. The three exhibits (figures 6.20 through
6.22) do not yet include allocated support costs.
Allocating Support Costs
Figures 6.23 through 6.25 add a column for support costs. The same three allocation
alternatives are used as in the preceding exhibits. Total Support in figure 6.17 is used as adeparture point for all calculations in the support costs column of the three exhibits. Support
costs moderately increase costs for Economics 101-1.Figure 6.26 compares the Economics 101-1 costs for the six examples. On balance, the
cost differences between the six versions are not trivial. The difference between the smallest
and the largest cost, excluding support, is worth noting. Figure 6.21 shows the smallest total
tier-four cost of $14,240 versus a high of $18,478 for figure 6.22. The difference of $4,238 is
29.76 percent. For tier-four costs that include allocations for support, the difference between
the lowest and the highest is $4,910 or 34.38 percent.If the choice of different combinations of cost allocation bases and methods can produce
such large differences in the total cost of a single course, it stands to reason that when all
courses of an institution are taken into account, such large potential differentials raise aserious credibility issue when institutions compare such costs. These illustrations suggest at
the very least that inter-institutional micro-cost comparisons be carried out on the basis of
uniform or near-uniform allocation methods.
11715 4

Cost Accounting in Higher Education
Figure 6.20: Single Allocation Base: Student Credit Hours(Support Costs Not Yet Allocated)
Cost(A)
TotalCollege
($ in 1,000s)(B)
Instruction($ in 1,000s)
(C)
Departmentof
Economics(D)
Economics101-1
Direct**(E)
Economics101-1
Indirect(F)
Economics101-1Total(G)
AllocationMethod or Base
(H)Data Source Fig. 6.18 Fig. 6.18 Audit or
BudgetFig. 6.4& CLM
Calculated Calculated
Personnel CompensationSalaries, Faculty $12,755 $11,564 $497,082 $9,983 $39 $10,022 Credit HoursAll Other Salaries and Wages 10,001 1,729 58,395 0 141 141 Credit HoursStudent Wages 1,751 253 13,000 0 31 31 Credit Hours
Subtotal 24,507 13,546 568,477 9,983 211 10,194Staff Benefits 8,769 5,283 164,973 2,578 11 2,589 Credit HoursTuition Benefit 1,160 518 48,072 0 0 22 Credit Hours
ClericalRoom and Board, Etc. 735 116 3,697 0 11 11 Credit Hours
Total Benefits 10,664 5,917 216,742 2,578 21 2,621Professional Services 1,585 834 36,350 0 0 0 Direct Only
Total Compensation 36,756 20,297 821,569 12,561 233 12,815Consumables
Travel, Entertainment 1,495 466 16,634 78 40 118 Credit HoursSupplies 1,655 679 24,238 194 58 252 Credit HoursTelecommunications, Measured 525 86 4,025 0 10 10 Credit HoursTelecommunications, Prorated 577 54 1,928 0 5 5 Credit HoursComputer Services 295 86 3,070 185 7 192 Credit HoursComputer Services, Prorated 461 75 2,677 0 6 6 Credit HoursPrinting, Publications 1,050 353 12,601 223 30 253 Credit HoursProperty/Casualty Insurance 865 286 10,209 0 25 25 Credit HoursDues, Subscriptions 317 185 6,604 75 16 91 Credit HoursPostage, Freight 709 122 4,355 32 10 42 Credit HoursRepair & Replacement, Plant 4,464 471 13,243 0 32 32 Credit HoursUtilities Purchased 1,092 381 17,170 0 41 41 Credit HoursFood, Students 1,929 0 0 0 0 0Food, Other 555 58 2,070 25 5 30 Credit HoursGoods for Resale 3,065 0 0 0 0 0Miscellaneous 1,831 283 10,102 126 24 150 Credit Hours
Total Consumables 20,885 3,585 128,926 938 309 1,247 Credit HoursTotal Tier One 57,641 23,882 950,495 13,499 541 14,062 Credit Hours
Long-Term Debt Costs 695 382 1,452 0 4 4 Credit HoursTotal Tier Two 58,336 24,264 951,947 13,499 545 14,066
One-Year Assets 413 121 5,500 155 13 168 Credit HoursTotal Tier Three 58,749 24,385 957,447 13,654 558 14,234
Depreciation 2,870 1,255 4,598 58 11 69 Credit HoursTotal Tier Four 61,619 25,640 962,045 13,712 569 14,302
Net Student Revenues 44,445 36,025 1,327,189 86,654Surplus/Deficit* -17,174 10,385 365,144 72,352
* Before all non-student-related revenues and transfers.
** Direct course costs other than personnel compensation are identified by means of invoice references when they are charged to departmentalnatural costs.
Note: In from-the-bottom-up costing, the sum of course costs equals departmental costs, the sum of departmental costs equals the cost of instruction, andthe sum of all primary program costs equals total institutional costs. This illustration ignores departmental research and other departmental activitiesthat constitute functional subheadings under instruction. Some of the indirect costs would be charged to activities ignored here.
Credit hour allocation = (column D column E) 59,670 x 144
118 1 55
APPT nnpV MOAIUARLE

Academic Micro-Costing: The Full Cost of a Course
Figure 6.21: Multiple Allocation Bases: Version A (Support Costs Not Yet Allocated)
Cost(A)
TotalCollege
($ in 1,000s)(B)
Instruction($ in 1,000s)
(C)
Departmentof
Economics(D)
Economics101-1
Direct"(E)
Economics101-1
Indirect(F)
Economics101-1Total(G)
AllocationMethod or Base
(H)
Data Source Fig. 6.18 Fig. 6.18 Audit orBudget
Fig. 6.4& CLM
Calculated Calculated
Personnel CompensationSalaries, Faculty $12,755 $11,564 $497,082 $9,983 $39 $10,022 Credit Hours
All Other Salaries and Wages 10,001 1,729 58,395 0 141 141 Credit Hours
Student Wages 1,751 253 13,000 0 31 31 Credit Hours
Subtotal 24,507 13,546 568,477 9,983 211 10,194
Staff Benefits 8,769 5,283 164,973 2,578 11 2,589 Credit Hours
Tuition Benefit 1,160 518 48,072 0 0 0 Credit HoursClerical
Room and Board, Etc. 735 116 3,697 0 0 0 Credit Hours
Total Benefits 10,664 5,917 216,742 2,578 11 2,589
Professional Services 1,585 834 36,350 0 0 0 Direct Only
Total Compensation 36,756 20,297 821,569 12,561 222 12,783
ConsumablesTravel, Entertainment 1,495 466 16,634 78 40 118 Credit Hours
Supplies 1,655 679 24,238 194 58 252 Credit Hours
Telecommunications, Measured 525 86 4,025 0 10 10 Credit Hours
Telecommunications, Prorated 577 54 1,928 0 5 5 Credit Hours
Computer Services 295 86 3,070 185 7 192 Credit Hours
Computer Services, Prorated 461 75 2,677 0 6 6 Credit Hours
Printing, Publications 1,050 353 12,601 223 30 253 Credit Hours
Property/Casualty Insurance 865 286 10,209 0 19 19 Square Feet
Dues, Subscriptions 317 185 6,604 75 16 91 Credit Hours
Postage, Freight 709 122 4,355 32 10 42 Credit Hours
Repair & Replacement, Plant 4,464 471 13,243 0 24 24 Square Feet
Utilities Purchased 1,092 381 17,170 0 31 31 Square Feet
Food, Students 1,929 0 0 0 0 0
Food, Other 555 58 2,070 25 5 30 Credit Hours
Goods for Resale 3,065 0 0 0 0 0
Miscellaneous 1,831 283 10,102 126 24 150 Credit Hours
Total Consumables 20,885 3,585 128,926 938 285 1,223 Credit Hours
Total Tier One 57,641 23,882 950,495 13,499 507 14,006 Credit Hours
Long-Term Debt Costs 695 382 1,452 0 3 3 Square Feet
Total Tier Two 58,336 24,264 951,947 13,499 510 14,009
One-Year Assets 413 121 5,500 155 10 165 Square Feet
Total Tier Three 58,749 24,385 957,447 13,654 520 14,174
Depreciation 2,870 1,255 4,598 58 8 66 Square Feet
Total Tier Four 61,619 25,640 962,045 13,712 528 14,240
Net Student Revenues 44,445 36,025 1,327,189 86,654
Surplus/Deficit* -17,174 10,385 365,144 72,414
* Before all non-student-related revenues and transfers.
** Direct course costs other than personnel compensation are identified by means of invoice references when they are charged to
departmental natural costs.
Note: In from-the-bottom-up costing, the sum of course costs equals departmental costs, the sum of departmental costs equals the cost of
instruction, and the sum of all primary program costs equals total institutional costs. This illustration ignores departmental research
and other departmental activities that constitute functional subheadings under instruction. Some of the indirect costs would be
charged to activities ignored here.
Credit hour allocation = (column D - coulmn E) + 59,670 x 144
Square foot allocation = (column D - column E) x .00183
119 156
PM? enrov AWA110 F

Cost Accounting in Higher Education
Figure 6.22: Multiple Allocation Bases: Version B (Support Costs Not Yet Allocated)
Cost(A)
TotalCollege
($ in 1,000s)(B)
Instruction($ in 1,000s)
(C)
Departmentof
Economics(D)
Economics101-1
Direct**(E)
Economics101-1
Indirect(F)
Economics101-1Total(G)
Allocation Method orBase(H)
Data Source Fig. 6.18 Fig. 6.18 Audit orBudget
Fig. 6.4& CLM
Calculated Calculated
Personnel CompensationSalaries, Faculty $12,755 $11,564 $497,082 $9,983 $413 $10,396 2.56% Faculty LoadAll Other Salaries and Wages 10,001 1,729 58,395 0 1,495 1,495 2.56% Faculty LoadStudent Wages 1,751 253 13,000 0 156 156 1.23% Time on Course
Subtotal 24,507 13,546 568,477 9,983 2,064 12,047Staff Benefits 8,769 5,283 164,973 2,578 1,962 4,540 % of BenefitsTuition Benefit 1,160 518 48,072 0 371 371 % Benefits Clerical OnlyRoom and Board, Etc. 735 116 3,697 0 63 63 % of Benefits
Total Benefits 10,664 5,917 216,742 2,578 2,396 4,974Professional Services 1,585 834 36,350 0 0 0 Direct Only
Total Compensation 36,756 20,297 821,569 12,561 4,460 17,021Consumables
Travel, Entertainment 1,495 466 16,634 78 40 118 Credit HoursSupplies 1,655 679 24,238 194 58 252 Credit HoursTelecommunications, Measured 525 86 4,025 0 10 10 Credit HoursTelecommunications, Prorated 577 54 1,928 0 5 5 Credit HoursComputer Services 295 86 3,070 185 7 192 Credit HoursComputer Services, Prorated 461 75 2,677 0 6 6 Credit HoursPrinting, Publications 1,050 353 12,601 223 30 253 Credit HoursProperty/Casualty Insurance 865 286 10,209 0 19 19 Square FeetDues, Subscriptions 317 185 6,604 75 16 91 Credit HoursPostage, Freight 709 122 4,355 32 10 42 Credit HoursRepair & Replacement, Plant 4,464 471 13,243 0 24 24 Square FeetUtilities Purchased 1,092 381 17,170 0 31 31 Square FeetFood, Students 1,929 0 0 0 0 0Food, Other 555 58 2,070 25 5 30 Credit HoursGoods for Resale 3,065 0 0 0 0 0Miscellaneous 1,831 283 10,102 126 24 150 Credit Hours
Total Consumables 20,885 3,585 128,926 938 285 1,223 Credit HoursTotal Tier One 57,641 23,882 950,495 13,499 4,745 18,244 Credit Hours
Long -Term Debt Costs 695 382 1,452 0 3 3 Square FeetTotal Tier Two 58,336 24,264 951,947 13,499 4,747 18,246
One-Year Assets 413 121 5,500 155 10 165 Square FeetTotal Tier Three 58,749 24,385 957,447 13,654 4,757 18,411
Depreciation 2,870 1,255 4,598 58 8 66 Square FeetTotal Tier Four 61,619 25,640 962,045 13,712 4,766 18,478
Net Student Revenues 44,445 36,025 1,327,189 86,654Surplus/Deficit* -17,174 10,385 365,144 68,176
* Before all non-student-related revenues and transfers.
** Direct course costs other than personnel compensation are identified by means of invoice references when they are charged to departmentalnatural costs.
Note: In from-the-bottom-up costing, the sum of course costs equals departmental costs, the sum of departmental costs equals the cost of instruction,and the sum of all primary program costs equals total institutional costs. This illustration ignores departmental research and otherdepartmental activities that constitute functional subheadings under instruction.
Credit hour allocation = (column D - column E) 59,670 x 144
Square foot allocation = (column D - column E) x .00183
BEST COPY AVAI BLE
157120

Academic Micro-Costing: The Full Cost of a Course
Figure 6.23: Single Allocation Base: Student Credit Hours (Support Costs Allocated)
Cost(A)
TotalCollege
($ in1,000s)
(B)
Instruction($ in 1,000s)
(C)
Departmentof
Economics(D)
Economics101-1
Direct**(E)
Economics101-1
Indirect(F)
Economics101.1
SupportCosts(G)
Economics101-1Total(H)
AllocationMethod or
Base(I)
Data Source Fig. 6.18 Fig. 6.18 Audit orBudget
Fig. 6.4 &CLM
Calculated Fig. 6.17Calculated
Calculated
Personnel CompensationSalaries, Faculty $12,755 $11,564 $497,082 $9,983 $39 $1 $10,023 Credit Hours
All Other Salaries and Wages 10,001 1,729 58,395 0 141 13 154 Credit Hours
Student Wages 1,751 253 13,000 0 31 2 33 Credit Hours
Subtotal 24,507 13,546 568,477 9,983 211 16 10,210
Staff Benefits 8,769 5,283 164,973 2,578 11 5 2,594 Credit Hours
Tuition Benefit 1,160 518 48,072 0 0 1 1 Credit HoursClerical
Room and Board, Etc. 735 116 3,697 0 11 1 12 Credit Hours
Total Benefits 10,664 5,917 216,742 2,578 21 7 2,607
Professional Services 1,585 834 36,350 0 0 2 2
Total Compensation 36,756 20,297 821,569 12,561 233 25 12,818
ConsumablesTravel, Entertainment 1,495 466 16,634 78 40 2 120 Credit Hours
Supplies 1,655 679 24,238 194 58 2 254 Credit Hours
Telecommunications, Measured 525 86 4,025 0 10 1 11 Credit Hours
Telecommunications, Prorated 577 54 1,928 0 5 1 6 Credit Hours
Computer Services 295 86 3,070 185 7 0 192 Credit Hours
Computer Services, Prorated 461 75 2,677 0 6 1 7 Credit Hours
Printing, Publications 1,050 353 12,601 223 30 1 254 Credit Hours
Property/Casualty Insurance 865 286 10,209 0 25 0 25 Credit Hours
Dues, Subscriptions 317 185 6,604 75 16 0 91 Credit Hours
Postage, Freight 709 122 4,355 32 10 1 44 Credit Hours
Repair & Replacement, Plant 4,464 471 13,243 0 32 6 38 Credit Hours
Utilities Purchased 1,092 381 17,170 0 41 1 42 Credit Hours
Food, Students 1,929 0 0 0 0 0 0
Food, Other 555 58 2,070 25 5 I 30 Credit Hours
Goods for Resale 3,065 0 0 0 0 0 0
Miscellaneous 1,831 283 10,102 126 24 I 151 Credit Hours
Total Consumables 20,885 3,585 128,926 938 309 18 1,265 Credit Hours
Total Tier One 57,641 23,882 950,495 13,499 541 42 14,083 Credit Hours
Long-Term Debt Costs 695 382 1,452 0 4 0 4 Credit Hours
Total Tier Two 58,336 24,264 951,947 13,499 545 43 14,087
One-Year Assets 413 121 5,500 155 13 0 168 Credit Hours
Total Tier Three 58,749 24,385 957,447 13,654 558 43 14,255
Depreciation 2,870 1,255 4,598 58 11 1 70 Credit Hours
Total Tier Four 61,619 25,640 962,045 13,712 569 44 14,326
Net Student Revenues 44,445 36,025 1,327,189 86,654
Surplus/Deficit* -17,174 10,385 365,144 72,328
* Before all non-student-related revenues and tran fers.
** Direct course costs other than personnel compensation are identified by means of invoice references when they are charged to departmental
natural costs.
Note: In from-the-bottom-up costing, the sum of course costs equals departmental costs, the sum of departmental costs equals the cost of
instruction, and the sum of all primary program costs equals total institutional costs. This illustration ignores departmental research
and other departmental activities that constitute functional subheadings under instruction. Some of the indirect costs would be
charged to activities ignored here.
Credit hour allocation = (column D - column E) + 59,670 x 144
121 15 8

Cost Accounting in Higher Education
Figure 6.24: Multiple Allocation Bases: Version A (Support Costs Allocated)
Cost(A)
TotalCollege
($ in1,000s)
(B)
Instruction($ in 1,000s)
(C)
Departmentof
Economics(D)
Economics101-1
Direct**(E)
Economics101-1
Indirect(F)
Economics101-1
SupportCosts(G)
Economics101-1Total(H)
AllocationMethod or
Base(I)Data Source Fig. 6.18 Fig. 6.18 Audit or
BudgetFig. 6.4 &
CLMCalculated Fig. 6.17
CalculatedCalculated
Personnel CompensationSalaries, Faculty $12,755 $11,564 $497,082 $9,983 $39 $1 $10,023 Credit HoursAll Other Salaries and Wages 10,001 1,729 58,395 0 141 13 154 Credit HoursStudent Wages 1,751 253 13,000 0 31 2 33 Credit Hours
Subtotal 24,507 13,546 568,477 9,983 211 16 10,210Staff Benefits 8,769 5,283 164,973 2,578 11 5 2,594 Credit HoursTuition Benefit 1,160 518 48,072 0 0 I 1 Credit Hours
ClericalRoom and Board, Etc. 735 116 3,697 0 0 I 1 Credit HoursTotal Benefits 10,664 5,917 216,742 2,578 11 7 2,596
Professional Services 1,585 834 36,350 0 0 2 2 Direct OnlyTotal Compensation 36,756 20,297 821,569 12,561 222 25 12,808
ConsumablesTravel, Entertainment 1,495 466 16,634 78 40 2 120 Credit HoursSupplies 1,655 679 24,238 194 58 2 254 Credit HoursTelecommunications, Measured 525 86 4,025 0 10 I 11 Credit HoursTelecommunications, Prorated 577 54 1,928 0 5 1 6 Credit HoursComputer Services 295 86 3,070 185 7 0 192 Credit HoursComputer Services, Prorated 461 75 2,677 0 6 1 7 Credit HoursPrinting, Publications 1,050 353 12,601 223 30 I 254 Credit HoursProperty/Casualty Insurance 865 286 10,209 0 19 0 19 Square FeetDues, Subscriptions 317 185 6,604 75 16 0 91 Credit HoursPostage, Freight 709 122 4,355 32 10 1 43 Credit HoursRepair & Replacement, Plant 4,464 471 13,243 0 24 5 29 Square FeetUtilities Purchased 1,092 381 17,170 0 31 1 32 Square FeetFood, Students 1,929 0 0 0 0 0 0Food, Other 555 58 2,070 25 5 1 31 Credit HoursGoods for Resale 3,065 0 0 0 0 0 0Miscellaneous 1,831 283 10,102 126 24 1 151 Credit Hours
Total Consumables 20,885 3,585 128,926 938 285 16 1,239 Credit HoursTotal Tier One 57,641 23,882 950,495 13,499 507 41 14,047 Credit Hours
Long-Term Debt Costs 695 382 1,452 0 3 0 3 Square FeetTotal Tier Two 58,336 24,264 951,947 13,499 510 41 14,050
One-Year Assets 413 121 5,500 155 10 0 165 Square FeetTotal Tier Three 58,749 24,385 957,447 13,654 520 41 14,215
Depreciation 2,870 1,255 4,598 58 8 1 67 Square FeetTotal Tier Four 61,619 25,640 962,045 13,712 528 42 14,282
Net Student Revenues 44,445 36,025 1,327,189 86,654Surplus/Deficit* -17,174 10,385 365,144 72,372
* Before all non-student-related revenues and transfers.
** Direct course costs other than personnel compensation are identified by means of invoice references when they are charged to departmental naturalcosts.
Note: In from-the-bottom-up costing, the sum ofcourse costs equals departmental costs, the sum of departmental costs equals thecost of instruction, andthe sum of all primary program costs equals total institutional costs. This illustration ignores departmental research and other departmentalactivities that constitute functional subheadings under instruction. Some of the indirect costs would be charged to activities ignored here.
Credit hour allocation = (column D - column E) + 59,670 x 144
Square foot allocation = (column D - column E) x .00183
159122
BE ) COPY AVA1 BILE

Academic Micro-Costing: The Full Cost of a Course
Figure 6.25: Multiple Allocation ,eases: Version 13 (Support Costs Allocated)
Cost(A)
TotalCollege
($ in 1,000s)(B)
Instruction($ in 1,000s)
(C)
Departmentof
EconomicsMO
Economics101-1
Direct"(E)
Economics101-1
Indirect(F)
Economics101-1
SupportCosts(G)
Economics101-1Total(II)
AllocationMethod or
Base(I)
Data Source Fig. 6.18 Fig. 6.18 Audit orBudget
Fig. 6.4 &CLM
Calculated Fig. 6.17Calculated
Calculated
Personnel CompensationSalaries, Faculty $12,755 $11,564 $497,082 $9,983 $413 $16 $10,412 2.56% Faculty Loac
All Other Salaries and Wages 10,001 1,729 58,395 0 1,495 136 1,631 2.56% Faculty Loac
Student Wages 1,751 253 13,000 0 156 8 164 1.23% Time onCourse
Subtotal 24,507 13,546 568,477 9,983 2,064 160 12,206
Staff Benefits 8,769 5,283 164,973 2,578 1,962 511 5,051 % of Benefits
Tuition Benefit 1,160 518 48,072 0 371 21 392 % Benefits ClericalOnly
Room and Board, Etc. 735 116 3,697 0 63 6 69 % of Benefits
Total Benefits 10,664 5,917 216,742 2,578 2,396 538 5,512
Professional Services 1,585 834 36,350 0 0 0 0 Direct Only
Total Compensation 36,756 20,297 821,569 12,561 4,460 698 17,718
ConsumablesTravel, Entertainment 1,495 466 16,634 78 40 2 120 Credit Hours
Supplies 1,655 679 24,238 194 58 2 254 Credit Hours
Telecommunications, Measured 525 86 4,025 0 10 1 11 Credit Hours
Telecommunications, Pror 577 54 1,928 0 5 1 6 Credit Hours
Computer Services, Measured 295 86 3,070 185 7 0 192 Credit Hours
Computer Services, Pror 461 75 2,677 0 6 1 7 Credit Hours
Printing, Publications 1,050 353 12,601 223 30 1 254 Credit Hours
Property/Casualty Insurance 865 286 10,209 0 19 0 19 Square Feet
Dues, Subscriptions 317 185 6,604 75 16 0 91 Credit Hours
Postage, Freight 709 122 4,355 32 10 1 43 Credit Hours
Repair, Replacement, Contr. 4,464 471 13,243 0 24 5 29 Square Feet
Utilities Purchased 1,092 381 17,170 0 31 1 32 Square Feet
Food, Students 1,929 0 0 0 0 0 0
Food, Other 555 58 2,070 25 5 1 31 Credit Hours
Goods for Resale 3,065 0 0 0 0 0 0
Miscellaneous 1,831 283 10,102 126 24 1 151 Credit Hours
Total Consumables 20,885 3,585 128,926 938 285 17 1,240 Credit Hours
Total Tier One 57,641 23,882 950,495 13,499 4,745 715 18,959 Credit Hours
Long-Term Debt Costs 695 382 1,452 0 3 0 3 Square Feet
Total Tier Two 58,336 24,264 951,947 13,499 4,747 0 18,246
One-Year Assets 413 121 5,500 155 10 0 165 Square Feet
Total Tier Three 58,749 24,385 957,447 13,654 4,757 0 18,411
Depreciation 2,870 1,255 4,598 58 8 0 66 Square Feet
Total Tier Four 61,619 25,640 962,045 13,712 4,766 0 18,478
Net Student Revenues 44,445 36,025 1,327,189 86,654
Surplus/Deficit* -17,174 10,385 365,144 68,176
* Before all non-student-related revenues and transfers.
** Direct course costs other than personnel compensation are identified by means of invoice references when they are charged to departmental natural costs.
Note: In from-the-bottom-up costing, the sum of course costs equals departmental costs, the sum of departmental costs equals the cost of instruction, and the
sum of all primary program costs equals total institutional costs. This illustration ignores departmental research and other departmental activities
that constitute functional subheadings under instruction.
Credit hour allocation = (column D - column E) 59,670 x 144
Square foot allocation = (column D - column E) x .00183
123 160
BEST COPY AVAI_ABLE

Cost Accounting in Higher Education
Figure 6.26: Comparison of Six Economics 101-1 Full Costs at Liberal Arts College
Cost CentersFigure
6.20Figure
6.21Figure6.22
Figure6.23
Figure6.24
Figure6.25
Personnel Compensation $12,815 $12,783 $17,021 $12,817 $12,806 $17,718Consumables 1,247 1,223 1,223 1,265 1,239 1,240
Total Tier One 14,062 14,006 18,244 14,082 14,045 18,958Long-Term Debt Costs 4 3 3 4 3 3
Total Tier Two 14,066 14,009 18,247 14,086 14,048 18,961One-Year Assets 168 165 165 168 165 165
Total Tier Three 14,234 14,174 18,412 14,254 14,213 19,126Depreciation 69 66 66 70 67 66
Total Tier Four 14,303 14,240 18,478 14,324 14,280 19,192Net Student Revenues 86,654 86,654 86,654 86,654 86,654 86,654
Surplus/Deficit 72,351 72,414 68,176 72,330 72,374 67,462Cost Difference from Lowest to Highest 4,238
29.76%4,912
34.40%
The important reason why different allocation methods often produce large differences incosts is simple: There is no connection whatsoever between credit hours, time-weightedsquare footage, faculty work loads, or personnel compensation shares. Each allocation baseproduces its own divisors and allocation factors, and each mixture of allocation bases willproduce its distinct course cost result.
Institutions with an established course and activity full-cost track record should have littledifficulty assembling future annual budgets and cost reports from the ground up rather thanfrom the top down. With practice, they should be able to develop suitable indirect natural-cost-crossover factors of the types illustrated in the three costing versions shown here. Sincethere is no absolutely correct allocation base mix, institutions might eventually settle on thecredit-hour model whose principal merit lies in its simplicity. The credit-hour approach alsofacilitates inter-institutional comparability and may enhance the credibility of industrywidecourse and activity-cost information. Perhaps the next best solution is to use the allocationbases and factors mandated by Office of Management and Budget Circular A-21 and relateddocuments.3
Shared Courses, Shared Staff, and Shared Facilities
Finally, it may be appropriate to call attention to aspects of costing not illustrated here.All institutions offer courses taught by two or more persons. Many courses generate studentcredits in two or more departments. Courses are taught wherever there is space, andclassroom facilities are less often dedicated to a single department or discipline than theymay have been in the past.
This sharing of personnel and facilities and joint course credits create complications in thecosting of courses which can be overcome once the respective data modules have identifiedthe underlying variables. It is important to always define clearly which portion of aninstructor's work load is to be assigned to which course. When two individuals teach onecourse and each is credited with a full course load, the compensation cost of such a courseincreases dramatically. Students do not earn multiple course credits merely because more
124
161

Academic Micro-Costing: The Full Cost of a Course
than one faculty member is involved. If the work-load credits are reduced for each teacher,
the cost of the course will be less.
Effect on Allocated Costs of Various Allocation Bases
Chapter 6 illustrates indirect- and support-cost allocations based on credit hours earned and on
time-weighted square footage. On balance, the credit-hour allocation base yields higher allocated
costs. The figure below shows the effects on allocated costs when an identical cost is distributed in
terms of completely unrelated allocation bases, each displaying a reasonable affinity with the cost
objective.
Alternative Allocation Bases and Their Effects on Allocated Costs at Liberal Arts College
Allocation Method Allocation Factor or Number Allocated Cost
Allocation Method
Credit Hours (50,000 + 59,670) x 144 $120.66
Four Credits Equivalent 160.88
FTE Enrollment (50,000 + 2,202) x 48 1,089.92
Square Feet, Room 1 (50,000 + 33,491) x 825 1,231.67
Square-Foot Hours, Room 1 (50,000 x .00183) 91.50
Unless institutions use the same allocation bases for specific indirect and support costs within a
peer group, these cost differences suggest that the resulting comparative course costs are not very
meaningful. The difference between the credit-hour and the FTE-enrollment allocation bases is
striking because each base represents the same enrollment. The 144 credit hours and 48 students
represent the same enrollment effect, but entirely different cost-recovery effects. It is not surprising,
then, that institutions prefer the FTE approach under Circular A-21.
If a given course generates academic credits in more than one department, the costs
should be shared among the departments. This means that under certain circumstances
administrative and clerical support of two or more departments will be assigned to the course
125 162
ne.m/ Mal r

Cost Accounting in Higher Education
or courses in question. Institutions should develop clear costing guidelines whenevermultiple personnel or two or more departments are involved in a course.
Finally, most classroom space is fungible in that it can be used more or less withoutregard to individual academic disciplines. In practice, territorial habits develop so thatfacilities may remain unused. Many specialized facilities, particularly laboratories, can onlybe used for certain types of instruction. Most institutions maintain detailed facilitiesinventories, permitting very precise, even time-use-weighted, allocations of space costs.Whether or not certain facilities are shared by two or more disciplines, departments, orprofessional schools is therefore not a material issue in the costing of courses and otheractivities.
Notes
1. NACUBO and NCHEMS, Procedures for Determining Historical Full Costs: The CostingComponent of the Information Exchange Procedures., 2nd ed., Technical Report 65(Washington, D.C.: NACUBO and Boulder, Colo.: NCHEMS, 1977). NACUBO andNCHEMS, Costing for Policy Analysis (Washington, D.C.: NACUBO, 1980).
2. Statement of Financial Accounting Standards No. 117: Financial Statements of Not-for-Profit Organizations, Financial Accounting Series No. 127-B (Norwalk, Conn.: FinancialAccounting Standards Board of the Financial Accounting Foundation, June 1993).
3. Office of Management and Budget, Cost Principles for Educational Institutions, OMBCircular A-21; reprinted in James L. Feldesman, Jacqueline C. Leifer, and Michael B.Glomb, eds., Federal Auditing Information Service for Higher Education (Washington,D.C.: NACUBO, 1994).
Exercises
Using the following spreadsheet, indicate how you would determine the cost of a courseof your choice and, specifically, how you would allocate the types of natural costs listed(substituting your own natural-cost classification).
12 61 6 3

Academic Micro-Costing: The Full Cost of a Course
Worksheet 6.1: Allocating Indirect and Support Costs to Course X at Your Institution
Cost CentersTotal
Institution Instruction
DepartmentX
Direct
DepartmentX
Indirect
DepartmentX
SupportCosts
AllocationBases
Personnel CompensationSalaries, FacultySalaries, OtherAll Other Salaries and WagesStudent Wages
SubtotalBenefitsProfessional Services
Total CompensationConsumables
Travel, EntertainmentSuppliesTelecommunicationsComputer Services,Printing, PublicationsProperty/Casualty InsuranceDues, SubscriptionsPostage, FreightRepair, Replacement, Contr.Utilities PurchasedFuel, Gas, CoalFoodGoods for ResaleAnnuitiesMiscellaneous
SubtotalAdjustments
Total Tier OneLong-Term Debt Costs
Total Tier TwoOne-Year AssetsLibrary AcquisitionsAll Other
Total Tier ThreeDepreciation
Total Tier FourSupport Before
Allocation to CourseAcademic SupportAdministrative SupportStudent ServicesDevelopmentO&R of Plant
Total Support
127 164

MI=111=1
Costing of Support Activities: Total CostManagement, Activity-Based Costing, and
Process-Cost Management
This chapter answers the following questions:
What types of operational costing tasks, affecting support services, preoccupycolleges and universities?What is the meaning of total cost management, and how can activity-basedcosting and process-cost management be implemented in higher education?
How might institutions begin to implement total cost management, activity-basedcosting, and process-cost management, and what pitfalls would they face?
Not-So-Novel Costing Innovations
Novel costing concepts proffered from time to time by management theorists andconsultants arise in part when new insights convince managers that existing cost accounting
systems no longer meet an enterprise's current and long-term needs. Others are not really
new, but only older theories and practices that have been given new names. This chapter
deals with both.Historically, new cost accounting theories have emerged primarily in for-profit
manufacturing and less frequently in the service sector. Gradually, many costing innovations
will be adapted to higher education costing. Total cost management, activity-based costing,
and process-cost management are typical examples.1
129
165

Cost Accounting in Higher Education
NACUBO's Benchmarking Project
In 1994, NACUBO, in cooperation with Coopers & Lybrand and Barbara S. Shafer &Associates, published the Process Costing Workbook FY 1994, which was part of theassociation's ongoing Benchmarking Project, started in 1991.2 This project, involving some240 colleges and universities, encourages institutions to work together, to identifymanagement areas where performance can or should be improved, and to highlightmanagement techniques that help them set performance objectives based on comparativecost data and other performance information. The workbook is only available toBenchmarking Project participants.
Benchmarking: An Old Tool in New Clothing
Today, the term "benchmarking" is everywhere, from CNBC advertisements to politicalspeeches. In its modern guise, benchmarking implies that an institution will select bestcompetitive performance indicators as target objectives in an attempt to meet or surpassthem. Of course, looking at peer institutions for guidance on many different aspects ofinstitutional performance is an honorable and long-standing tradition in higher education.Few if any institutional decisions occur in the absence of comparative information, andindicators of performance are featured in numerous studies and continue to be disseminatedby government agencies and private groups.
Emphasis on Activities Other Than Instruction and Research
Most of the interesting costing tasks in higher education relate to an institution's dailysupport operations. In practice, operating an institution of higher education means that manydistinct activities are combined to render specific services that cut across jurisdictional andmanagerial settings. Higher education activities management is quite decentralized, andmany managerial objectives are more or less narrowly circumscribed and seldom focus onthe enterprise as a whole. In practice, managers at colleges and universities pay primaryattention to their particular areas of influence, some of them quite limited in scope.
The preceding chapters make clear that neither higher education financial accounting norprogram-cost accounting are designed to highlight the costs of the products and servicesnormally rendered by colleges and universities. In contrast, the accounting concepts whichare the subject of this chapter are service-specific. It is therefore important to choose anddefine carefully those college and university services that might be amenable to total costmanagement and that will entail a fundamental change in the organization of the underlyingcost and cost-related information.
The costing of courses and research projects is well developed in higher education,although there are differences of opinion and practice concerning specific details and onwhether or not, or how, full costing should be carried out. The preceding discussion did notrelate to total cost management accounting requirements, nor did it take into account the
130
186

Costing of Support Activities: Total Cost Management Activity-Based Costing, and Process-Cost Management
special features of activity-based costing and process-cost management, which are morereadily associated with activities other than instruction and research. Specifically, total costmanagement, activity-based costing, and process-cost management are best implemented inthe numerous support services of colleges and universities.
Common Features in Operational Support Costing
Several common features of operational support costing can be summed up in thefollowing questions:
How much net profit or net loss does a service or activity contribute currently to theinstitution's bottom line?What is the level of quality of the specific service or activity?What quantity of this activity is provided and how often?How many persons are directly involved in this activity?What specific nonpersonnel resources are directly involved?What specific indirect personnel and material resources are involved?How can the production or service-rendering process be described?Do alternate processes exist and is there a best choice? If so, what is it?What specific activity or process changes are needed to implement a better or bestresources mix?What is the estimated or actual net contribution to the bottom line of the activity afterthe implementation of specific changes?
If total cost management in higher education focuses principally on activities other thaninstruction and research, the net contribution to the bottom line will be mostly in the form oflarger or smaller net support costs. For some types of activities (e.g., fund raising, enrollmentmanagement, and accounts receivable management), emphasis on costs alone may beinappropriate and the activities' net revenue or net rate of return must be considered instead.
Each college and university is involved in work processes that have their counterpartselsewhere. Higher education managerial networks are very much tuned in to how institutionscan improve their management techniques and performance. NACUBO's BenchmarkingProject and the work of NACUBO's regional associations play important roles in theseefforts. In general, colleges and universities are very generous in sharing their cost-reductionexperiences and are normally willing to assist others in implementing procedures they havefound profitable.
Most total cost management-related cost-analysis and cost-cutting efforts lead to ordepend upon the creation of specialized cost models, many of them unique to a particularinstitution. One's study of these cost-reduction and management-improvement projectsreveals how individual institutions and managers implement the latest cost-reduction know-how gleaned from other institutions, the professional literature, specialized seminars, andscientific and applied research.
167131

Cost Accounting in Higher Education
The Meaning of Total Cost Management
Total cost management is the practice of analyzing and improving an institution'sfinancial and qualitative performance when it produces a particular product or when itrenders a specific service. Total cost management pays attention to the complete workprocesses and to all related activities through which the product or service comes about.
A work process is defined as any set of interrelated institutional or managerial activitiesthat results in an identifiable or measurable service or product for a particular clientele. Awork process is seen as adding value for which a client might be willing to or should pay aprice. At the very least, each work process engenders direct costs because it consumesfinancial, human, and material resources.
At issue is, first, how efficiently the process is executed and, second, how inexpensively itis carried out. Costs represent one dimension of the added value; client or user satisfactionthrough an evaluation of the quality of service is the other.
In higher education, the most practical approach may be for an institution to selectspecific, though not necessarily related, work processes and to evaluate them from theperspective of total cost management. Any service chosen may consume resources frommany parts of the institution. Process analysis should lead to both improved processoutcomes and reduced costs.
Total Cost Management Means Understanding and Managing Entire, Sometimes VeryComplex, Work Processes
Employee-centered work processes are at the heart of total cost management. Mostcollege and university support activities represent work processes where individualemployees and groups of employees perform specific tasks in specific ways within a giventime span. They collect funds, fill out forms, distribute mail, repair or install equipment,paint walls, clean floors, construct bookshelves or entire structures, conduct interviews withprospective students, package financial aid, spend time in committee or staff meetings, travelto see prospective students and donors, and go to seminars and professional meetings to learnnew ways of doing their job, to expand their peer networks, and to make a mark for theirinstitution and for themselves in other ways. In carrying out their professional endeavors,they consume all manner of resources and affect, in each person's special way, the fate andperformance of their immediate responsibilities, their department, and of the institutionoverall. Understanding work processes means understanding what individual employees andgroups of employees do, how they do it, and how long it takes them to do it.
Many of the most complex college and university process costs arise in the production ofcurrent revenues and capital resources (e.g., tuition, gifts, and research grants). Other processcosts occur because direct services are rendered to students and other institutional clienteles(student invoices, student aid applications, applications of new students). Still other processcosts derive from the periodic cycles of administrative work or involve routine logisticaltasks (e.g., monthly budget reports; work- and purchase-order initiation, routing, and
132 1 6

Costing of Support Activities: Total Cost Management, Activity-Based Costing, and Process-Cost Management
implementation; financial audits; and accounts receivable and payable execution). Often,these types of processes intertwine.
The following is a selective list of more or less complex processes within colleges anduniversities:
The process of developing new financial resourcesOperating gifts -and grants
Private sector gifts and grants developmentPublic sector gifts, grants, and contracts development
Federal research grants developmentState and local government grants development
Student aid grants and loan fundsNew capital resources development
New plant funds developmentNew endowment funds developmentBequests development
The process of developing new customersUndergraduate and graduate enrollment managementNew course and other curricular developmentNew academic program development and strategic positioningNew research program development
Operational processesMaterials handling and inventory controlStudent billing and collections process or, more generally, accounts receivable process
managementStudent financial aid applications processingAccounts payable processing.Student records processing
Grades processingRoom schedulingDegree requirements processing and.control
Work- and job-order processing and schedulingGift and grant tracking and processing
Executive, supervision, control processesExecutive decision processesPersonnel, financial, and budget control processes
User and customer support proCessesStudent relations processesAlumni and donor relations processesGovernment relations processes
169133

Cost Accounting in Higher Education
Total Cost Management Serves the Purpose of Performance Improvement
Few, if any, work processes exist whose outcome cannot be improved and whose costs. Icannot be reduced. Since the entire idea for total cost management, activity-based costing,
and process-cost management originated in manufacturing, it may not always be obvioushow to apply it to a college or university. What products are involved? Which specificservices should be totally cost-managed? Because enhancing even a minor activity'sperformancemproves the condition of the institution as a whole, analysis of selected, evenunrelated, work processes can be valuable, as long as the institution's total mission is kept inmind.
To improve a process's or an activity's performance, one must know the appropriateperformance measures. Sometimes the measure is the cost per se. If reducing the cost doesnot affect the quality of the service adversely or to an unacceptable degree, reduced costsmean improved performance. Many higher education activity- and process-performanceissues are complex and involve intangibles and quality issues that are not always easy toquantify. When activities and processes have both a cost and a revenue dimensionforinstance, the process of achieving or exceeding the budgeted annual alumni operating giftgoallower activity or processing costs should not result in fewer than the budgeted giftsfrom alumni. It is therefore essential that each total cost management task be based first on aprecise definition of the objectives each process is expected to achieve; the definition of theprocess itself is a subordinate issue.
Most of the processes listed above are conceived broadly. More often than not theyinvolve numerous independently managed entities within the institution. In sharp contrast,NACUBO' s Process Costing Workbook exclusively singles out such narrowly definedactivities as student applications processing, grade reporting, purchase requisitioning andordering, invoice paying, new employee hiring, and grant seeking. Total cost managementembraces both narrow and broad-based approaches. The for-profit literature on total costmanagement, activity-based costing, and process costing, highlighted for example in theErnst & Young Guide to Total Cost Management increasingly takes the broader view.3Below, both dimensions will be explored.
How to Implement Total Cost Management
Unless managers are familiar with activity and process costing, it is probably best if aninstitution begins with a pilot demonstration project. Complex pilot projects may require theuse of an expert consultant. When in-house expertise is available, several projects might bestarted at once in different departments or decision areas. At some point, an institutionshould consider developing a long-range total cost management plan. Even if highereducation will not soon adapt total cost management on an institutionwide basis, especiallyin very large and complex institutions and in university systems, the virtue of any total costmanagement plan is that it articulates where its costing tools could be valuable. Even case-by-case applications in key areas can contribute to significantly improved financial or qualityresults.
134 170

Costing of Support Activities: Total Cost Management, Activity-Based Costing, and Process-Cost Management
Description of a Typical Business Process
Normal full-scale business processes involve managerial and costing decisions that can bedescribed by arranging them in the form of an inverted pyramid, where one's understandingof the basic or highest-level process depends upon a clear grasp of the underlyingsubprocesses as shown in figure 7.1. The inverted pyramid can be seen as a funnel wheresuccessive sub-processes converge and eventually flow together, becoming the primary orhighest-level process. In the Ernst & Young guide, Michael R. Ostrenga and his co-authorsprovide what they call "the high-level process of managing materials" as an example of a fullbusiness process.4 The example is germane for higher education, since materials andmaterials management generate significant costs throughout the industry.
Figure 7.1: Structure of a Broad-Based Business Process
Subprocesses 1 Through N
Highest Level Processes
Note: This inverted pyramid should be viewed as a funnel that allows activities and subprocess costs to flow down and accumulateinto the total costs of the highest level processes.
For any given process, the number and sequence of subprocesses and, within eachprocess, of distinct activities, is usually unique (e.g., institution-specific). There may not be abest solution, but in all likelihood there is a better one.
The Materials Management Process
Processes tend to cut across administrative functions. Sometimes processes are sodecentralized that it may be difficult to grasp their interconnectedness. The very purpose ofprocess and activity analysis is for managers to visualize the flow, from beginning to end, ofinterconnected activities. This is accomplished best by creating a process map that identifieseach distinct activity as a chain of activity points. In a process as complex as materialsmanagement, several key subprocesses exist whose proper reciprocal integration is
fundamental in total cost management.If materials management is the principal or high-level process, what are these
subprocesses? The following list, suggested in the Ernst & Young guide, provides at least apartial answer:5
131 71

Cost Accounting in Higher Education
Choosing of the material to be acquiredWho makes the decision, and how is the choice made among competing materials?
Vendor identificationPtirchasing-contract term negotiationMaterials orderingMaterials receiving
To these can be added subsequently the following:
Materials inventory management
Maintenance, security, and control (perishable materials require special attention andfacilities; inventories shrink as a result of theft, weather-caused damage, etc.)Materials disposition (sale, scrapping, disposal of unused or damaged materials,
returns to vendors)
As the guide notes, all of these subprocesses or activities cut across functions.Additional subprocesses are materials inspection, materials acceptance or rejection,
materials storage, materials inventory reporting (today normally in the form of computer-based materials catalogs), materials scrapping or liquidation, and for used materials,materials removal from storage or, under just-in-time production or servicing, bringingmaterials to user sites, followed by materials usage monitoring.
Each process has inputs and outputs. Materials ordering has such inputs as materialsrequisitioning and lists of approved vendors. The department of production planning maysupply the materials requisition, and the purchasing department may provide the list ofvendors. The purchase order is the subprocess's output. The Ernst & Young guide concludesits description of the materials management process by citing five so-called transformingactivities that translate the inputs into outputs:
Materials and purchaser specificationsVendor bidsVendor selectionPurchase order issuanceFollow-up activities with vendors
At large universities, and especially for all institutions in the public sector, each one ofthese activities may tend to be a complex undertaking. For instance, materials specificationmay involve negotiations among several departments or individuals, and input from expertsinside or outside the institution may be required for technically sophisticated materials. Theremay exist a general or detailed description of the vendor bidding and selection processes thatis imposed by law or government regulation, and the purchase order issuance process all toooften may be enmeshed in red tape. While the often complex procedures impart a sense that"things are under control," they also testify to the specific mind set within the institution thatgoverns operational decision making.
Managerial personalities and styles aside, however, the Ernst & Young guide clearlyemphasizes the fact that even relatively mundane processes tend to be complex in their ownright.
1361 7 2

Costing of Support Activities: Total Cost Management, Activity-Based Costing, and Process-Cost Management
The Process of Managing the Purchase Requisition and Order
Now compare the preceding comprehensive or high-level process description with howNACUBO's Process Costing Workbook approaches the issue.6 Here, the purchase-requisitionprocess is seen as the principal process rather than as a subprocess in a more comprehensivetotal cost management situation.
The workbook offers the following definition for the purchase requisitionpurchase orderprocess:
The purchase requisition and order process encompasses all the activitiesnecessary to request and order an item(s). Depending upon the institution and thevalue of the item, the process may include approvals of the requisition and order,and competitive bidding. The...process leads to (but does not include) thereceipt, delivery, and payment processes.7
This is clearly a subprocess of materials processing. The purchase requisition andpurchase order process is described as going through the following extensive, somewhatbureaucratic, steps:
Collect supporting information (in the Ernst & Young guide, a subprocess in its ownright)Complete, type, and review purchase requisition (in some institutions this is a sub-process)Approve purchase requisition and again verify accuracy (the approval process mayinvolve several such sign-off steps depending on complexity of organization)Review accounting codes, correct errors, and enter into appropriate accountingsystemPrepare and issue bid package and specificationsReceive and review bids, notify biddersCreate purchase orderPlace orderUpdate purchase requisition form, enter data in accounting system, print hard copy ofpurchase orderFile all documents related to the purchase requisition and purchase order, file bidpackage, file reasons for choice of vendor, etc.
This example demonstrates well that one can look at the purchase order process in morethan one way. For routine purchases of supplies and even equipment, the item'sspecifications, accepted vendors, and bidding processes will have been established wellbefore a purchase requisition will ever be produced. The specific sequence of steps in aprocess where nonroutine purchases are contemplated (the acquisition of an electron-microscope, a new boiler for the power plant, the creation of a personal computer networkfor administrators) is more in the nature of sets of ad hoc processes designed clearly for suchspecific purposes.
173137

Cost Accounting in Higher Education
The Ubiquitous Process Flow Chart
The workbook, like most texts on the subject, recommends that managers describe eachprocess by means of an activities flowchart. Figures 7.2 and 7.3 illustrate this concept bychoosing arbitrarily a few steps in the process that ends with the purchase order. Of course, asimple truly sequential listing of the steps will serve just as well.
Figure 7.2: Sample Flow Chart Sequence in Purchase Requisition and Order Process
IdentifyEquipment andWrite TechnicalSpecifications
CompletePurchase
Requisition Form
Seek Approval byAcademic Vice
President
Route toComptroller for
BudgetaryApproval
Receive Bids(Business Office)
CoordinateBidding
Procedures(Business Office)
Route to BusinessOffice for
CompetitiveBidding
Select Bid(Business Office,Academic Vice
President,Department Chair,
Comptroller)
CompletePurchase Order
(Business Office)
Mail PurchaseOrder to Approved
Vendor(Business Office)
Note: This example assumes that the purchase requisition and the purchase order are two distinct documents.
174138

Costing of Support Activities: Total Cost Management Activity-Based Costing, and Process-Cost Management
Figure 7.3: Alternate Flow Chart Sequence in Purchase Requisition and Order Process
Identify Types of Complete Seek Department Route toPaper Supplies Purchase Order Chair's Signature Purchasing
Ordered Form Department
PurchasingDepartment
Delivers Suppliesto OrderingSecretary
PurchasingDepartment Issues
Invoice toDepartment and
DebitsAppropriate
Account
PurchasingDepartment Fills
Order fromInventory and
Makes Adjustmentto Inventory
Records
PurchasingDepartment
Receives PurchaseOrder
Note: If paper supplies are not in inventory, placing an order with an external vendor can add several additional process steps.
The first illustration assumes that the institution uses a separate purchase requisition formbefore it creates the related purchase order. Figure 7.3 assumes that no separate requisitionform is needed. Thus there is an immediate difference in the costs involved. Once therequisition has been approved, it becomes the official purchase order. Liberal Arts Collegeuses both approaches depending upon the type of item ordered.
Both illustrations make another point: Depending upon the type or dollar amount of agiven purchase, the signing-off authority may be lower or higher up on the organizationchart. Purchase requisition sign-off may reach as high as the chief executive office or mayend with a department head. There is absolutely no uniformity either within an institution oramong institutions on how the process is organized.
The key is to determine, first, how many separate activities there are in a given process;second, who is carrying out each activity; third, how long it takes to accomplish the task inquestion; and fourth, what other than personnel resources are required in each case. Processand activity analyses are almost always linked with costing, and in this context, cost analysiswill always inquire into alternative uses of resources. The flowchart or sequential list ofactivities within a given process is, therefore, the foundation on which process costing mustbe built.
The workbook's and the guide's descriptions of a single business process havesimilarities and differences. In both, each process is made up of two or more separateactivities. In some institutions, and for some materials acquisitions, a single individual maybe responsible for several activities; in more complex situations, several employees,departments, and jurisdictions may be involved. But, the guide takes a more enterprise-
139 175

Cost Accounting in Higher Education
centered view, whereas the workbook focuses mainly on the subprocess. From theperspective of today's literature on total cost management, the guide provides a state-of-the-art description of the concept; for higher education, the workbook suggests applications thatmay appeal to colleges and universities that have not already studied and streamlined theirmost costly bureaucratic processes.
The Costs of Processes and Activities:Some General Observations
Process and activity costing in higher education impose on practitioners from other thanan educational environment the responsibility to understand some of the special constraintsthat managing colleges and universities entail. Since the overall management effort(monetary constraints aside) is focused on qualitative issues, those who advocate the use of amethodology inherited and imported from manufacturing carry the burden of proof. At thesame time, it is reasonable to suggest to those who apply process-cost analysis in highereducation that, with proper care and adaptation, many industrial models can be used in theirfield. In addition to these cautions, a few pitfalls and concerns of a general nature are worthmentioning here.
Time As a Factor
Normally, an important objective is to reduce the time a process takes. This considerationmust be distinguished from the time a given employee is involved in an activity. Anotherperspective is that of those who ask how long one has to wait for results, services, andreports, and how well they are executed. An activity map or flowchart is in effect a picture ofa queuing situation. By itself, it does not address time that may be wasted on and betweenactivities. Queues imply that activities are ordered sequentially. Long and complex queuescan lead to bottlenecks where activities accumulate, thus lengthening the waiting time atsubsequent activity points. Reducing the complexity of the chain of activity points mayreduce costs as bottlenecks are eliminated. It is almost always sound practice to reducebottlenecks, eliminate backups, and speed up activity delivery, unless these result in sharpcost increases. Sometimes the benefit reaped from high customer satisfaction may outweighincreases in the cost of the activity that produces the favorable service result. Thus, time is amost important factor affecting process and activity costs.
Total Process Costs
The literature on process and activity costing does not always focus on their total or fullcost, but tends to single out labor costs as most important. On this subject, the ProcessCosting Workbook emphasizes labor costs at the exclusion of other costs. This is unfortunate,since all processes involve a combination of personnel or labor, consumables, and capital
1 140

Costing of Support Activities: Total Cost Management, Activity-Based Costing, and Process-Cost Management
costs. Moreover, when process- and activity-cost analysis calls for a reduction in labor costs,often a substitution of non-labor costs results.
Materials requisition and purchase order processing is a case in point. This and othersimilar activities were essentially centered on sending pieces of paper from one point toanother on the process assembly line (requiring multiple-copy, color-coded forms to berecorded, filed, mailed or hand-carried from one office to the next or, in complex systems,from one campus to another, and then often returned to the originators, sometimes withstopovers in between). Today, many processes are becoming essentially paperless. From thepoint of view of costing, this means a change in the composition of the factors of productionand thus of the cost elements proper. Today, every process and activity described in theProcess Costing Workbook is being transformed from a paper-centered system into anincreasingly paperless system, a transformation which is sometimes a direct outcome ofprocess- and activity-cost analysis.
Therefore, it is essential that those interested in and charged with process and activitycosting focus on total costs: personnel, consumables, and capital costs. In many modern,increasingly paperless processes, the share of direct labor costs will tend to decline, whereasthe share of nonlabor costs may rise.
For instance, in a highly streamlined and essentially paperless purchase requisition andorder system, labor costs may in fact be less than the combined materials, inventory, recordstorage, and computer (or capital) costs. In terms of the changing cost structure, this meansthat by moving to a paperless system or as a result of process- and activity-cost analysisgenerally, variable costs may be replaced by fixed costs.
Process streamlining, simplification, and outright optimization require changing theprocess- and activity-cost mix. Without a change in the structure of a process, cost reductionsmay be modest. Significant and lasting cost reductions require significant changes in theprocess proper, that is, in the way business is done. The changes that will have the heaviestimpact on costs (e.g., those that reduce them the most) are also perceived frequently as toorevolutionary, and this brings up the next general issue.
Personnel Cost, Process-Time Studies, andIllusory Substitution Effects
A central feature of process-cost analysis is the quantification of the time spent byemployees on the specific tasks or activities highlighted in process- and activity-costworksheets. Unless a computer-based time analysis exists that records log-on and log-offtimes when a process transaction takes place, the time-elapsed record must be assembled bysuch means as surveys or interviews, employee logs or diaries, or time cards.
Anyone familiar with the history of time-and-motion studies knows of their unpopularitywith employees. Experience with early faculty work-load studies also suggests that, unlessspecial care is taken, hours of work claimed by employees may not be the same as hours ofwork actually done. Time-elapsed reports must not only be credible to managers, but also to
141
177

Cost Accounting in Higher Education
employees. Since one of the objectives in process-cost studies is to reduce both the timespent on a task and the number of tasks, employees may be inclined to perceive process-costanalysis as a threat. They may have strong incentives to slant time reports in their favor byunderestimating how much time a specific activity consumes. This is especially true in thetypes of bureaucratic processes to which the Process Costing Workbook is devoted.
It is also worth asking what kinds of specific time-in-the-process inquiries make sense.Since higher education processes are often quite complex, does it make sense to ask ordetermine for everyone involved how much time, minus meal- and break-times, they spendon a given task, as the Process Costing Workbook suggests? It is, of course true, that, ideally,one cannot determine the full and true cost of a process or activity without considering totallabor or personnel costs. On the other hand, almost every process, even the relatively simpleones described in the workbook, will involve individuals who will not be fired, even if thewhole process is eliminated. For instance, how important is the inclusion of the universitycomptroller's time-weighted compensation cost in the determination of the purchaserequisition and order processing cost? Or, how should the personnel compensation cost of anadmissions officer with multiple duties be treated in the processing of a prospective student'sapplication for admission? Or, still more fascinating, what about the chief executive's timewhen he or she attends enrollment management meetings or must resolve disputedadmissions decisionsactivities which in most colleges and universities are part of thebroader admissions process?
The point of these questions is to suggest that the costing of many processes and activitiesshould not be carried to extremes, but might focus principally on the cost and processelements that can actually be changed. In addition, it is worth considering in advance ofdesigning a process-cost system the kinds of cost substitutions that are politically feasible.Certain processes involve tenured faculty and other permanent staff positions, and the cost oftheir time involvement in the process can be significant and could exceed the direct cost ofthe type of nontenured personnel involved in the process.
Many primary and support academic processes could exist at less cost if cost actuallydetermined their existence. Even if process and activity costing leads to a new process thatcosts less, there is no guarantee that the institution's total costs will be affected in any way.Once a particular process-cost analysis suggests that labor-based activities and other costsshould be eliminated or their scope reduced, what happens next? It cannot be assumed thattotal institutional costs would now be reduced, however desirable this might be. Even if afaculty-based process, of which there are many, is streamlined, does this mean that fewerfaculty will be hired? In the more complex processes, especially those requiring governingboard and faculty participation and decisions, process costs embrace a spectrum of processparticipants who seem to be especially immune to retrenchments induced by process-costanalysis. It is not surprising that colleges and universities will be more interested in analyzingfirst the more mechanical processes before they institute a comprehensive system of costanalysis involving the types of complex processes listed above.
142
178

Costing of Support Activities: Total Cost Management, Activity-Based Costing, and Process-Cost Management
Cost and Revenue Dimensions in Process Costing
Finally, it is worth noting that the expression "process costing" is misleading incircumstances where the process involves the production of current and long-term revenuesand capital. Here, higher education differs the most from a normal for-profit enterprise,where the overwhelming source of current revenue is through the sale of a product or serviceand where the creation of capital depends upon the enterprise's long-range profit outlook.
College and university processes where the production of revenues is the primaryobjective include the following:
All work processes and activities devoted to the production of student tuition andfees, room and board, and other student-based revenuesProcesses designed to produce revenues and capital for the subsidization of studentsthrough fellowships, scholarships, and prize grants, as well as for assisting studentsby providing loan fundsProcesses and activities designed to raise operating gifts and grants, as well as newcapital for physical facilities and endowmentAll formal processes intended to generate gifts, grants, and indirect-cost-recoveryrevenues for the institutions formal research efforts
All of these processes are quite complex and encompass numerous subprocesses andmany different types of specific activities. While costs matter, the principal objective is therevenue target which the process is expected to achieve. Therefore, for process managementto be successful, process costs must always be weighed against the institution's short- andlong-term revenue targets.
These caveats not withstanding, managers can benefit from knowing about the costs ofboth complex and simple processes. Even full process costs (tier four in the FTFC model)may be useful if management wants to know how processes consume the institution's totalresources. But the greatest benefit may lie in discovering the direct costs of sequentialprocesses that are repetitive and consume significant amounts of an institution's time andresources. The remainder of this chapter will illustrate process costing and describe summaryreport formats readers may find useful.
Applying the FTFC Model to Process and Activity Costing
As in all management and resource allocation issues, asking the right questions goes along way toward finding the most appropriate answers. Costing is no exception to this rule.
Materials Management Decisions and the Changing Cost Mix
Materials management offers a classic example of how computer technology has changedthe way business is done. Point-of-sale inventory control, ordering, and delivery are taken forgranted in for-profit enterprises. Point-of-use inventory control, ordering, and delivery are
143
179

Cost Accounting in Higher Education
increasingly being used in higher education, but are not nearly as well developed as they arein the for-profit sector. Materials handling at most colleges and universities, especially whenit is highly decentralized, remains rather primitive when compared to practices in the for-profit sector.
In its most simplistic form, materials handling involves what must be ordered, when, bywhom, and on whose approval. Managers must ask the following questions:
What materials are being requested?Are they the right kinds of materials?Are they acquired at the best prices?Are there different processes for different types of materials?Are specific activities directly related to the value of acquisitions?How automated is the acquisitions process?Are materials management and purchase requisitionpurchase order processes basedon an optimal materials acquisition model, highlighting the trade-off between costsand materials and service quality?What are the natural costs of each activity shown in the process flowchart? in thematerials management process? in the purchase requisitionpurchase order process?Is the purchase requisitionpurchase order process properly integrated with thebroader materials-acquisition process?Are materials available to users when they need them?What are the lead times between placing an order and materials delivery?Is there a just-in-time methodology underlying the materials process?Does the institution have formal optimal inventory cost policies? How are theseintegrated into materials management and, more specifically, into the purchaserequisitionpurchase order process?How are inventories financed?8
The importance for cost management is that the answers to these types of questions willeventually determine the nature and scope of the materials handling process and thus willalso determine its costs.
Liberal Arts College has developed a process- and activity-cost matrix that mirrors thenatural cost chart of accounts shown in chapter 6. Figure 7.4 shows a hypothetical costconfiguration before the process analysis. Figure 7.5 shows the configuration after asignificant change in the process. The difference between the two cost setups is the shift froma paper-intensive to a paperless process, which shifts costs principally from personnel toconsumables and capital cost lines. Figure 7.6 illustrates how activity cost can be recorded.Costs in figure 7.5 are lower than those in figure 7.4.
In order to come up with the data in the two exhibits, pre- and post-change activity-costworksheets had to be prepared. While these worksheets are conceptually similar to thoseoffered in the Process Costing Workbook, their format is different in that it emulates a typicalcomputer spreadsheet. This way, the activity-cost worksheets are fully integrated with thecost accounting system and all costs can be downloaded from the appropriate accounts to theworksheets. Figures 7.7 and 7.8 provide an example.
144
ISO

Costing of Support Activities: Total Cost Management Activity-Based Costing, and Process-Cost Management
Figure 7.4: Selected Materials Process Activity Costs at Liberal Arts College BeforeChange In Process
Activity in Process
TotalPersonnel
Compensation
TotalConsumables
Costs
TotalTier-One
Costs
Tier-TwoThroughTier-Four
Costs Total CostsType Purchase RequisitionForm
$3.25 $0.85 $4.10 $0.00 $4.10
OK by Department Chair 0.25 0.00 0.25 0.00 0.25Send to Academic VicePresident
1.75 0.00 1.75 0.00 1.75
Academic Vice PresidentApproval
2.75 0.00 2.75 0.00 2.75
Send to Comptroller 1.75 0.00 1.75 0.00 1.75
Comptroller Approval 1.10 0.0 1.10 1.15 2.25
Send to Business Office 1.75 0.00 1.75 0.00 1.75
Business Office InitiatesBidding
5.85 1.01 6.86 0.00 6.86
Total This Phase 18.45 1.87 20.32 1.15 21.47
Figure 7.5: Selected Materials Process Activity Costs After Change in Process
Activity in Paper lessProcess
TotalPersonnel
Compensation
TotalConsumables
Costs(Computer)
Total Tier-One Costs
Tier-TwoThrough
Tier-FourCosts
TotalCosts
Enter Purchase RequisitionComputer
$2.95 $0.55 $3.50 $0.00 $3.50
Enter Approval by VicePresident
0.25 0.05 0.30 0.00 0.30
Enter Approval byComptroller
0.25 0.05 0.30 0.00 0.30
Initiate Bidding 5.85 0.00 5.85 0.00 5.85
Depreciation Allowance 0.00 0.00 0.00 1.25 1.25
Total This Phase 9.30 0.65 9.95 1.25 11.20
Note: The dollar figures are arbitrary. The computer-based purchase requisition form has special fields for the required approvals.
Figure 7.6: Activity-Cost Worksheet
Activity Employee and PositionTime Used
(Hours)
HourlyEquivalent ofCompensation
Cost ofActivity
Write Specification Assistant Business Manager 0.50 $8.56 $4.28
Fill Out Requisition Clerical Employee 0.07 2.23 0.16Type Purchase Order Clerical Employee 0.08 2.38 0.19
Total Activity 4.63
Note: This illustration focuses on payroll costs only.
181145

Figu
re 7
7: S
umm
ary
Proc
ess
Spre
adsh
eet
Cos
t Cen
ters
Act
ivity
One
Act
ivity
Tw
oA
ctiv
ityT
hree
Act
ivity
Four
Act
ivity
Five
Act
ivity
Six
Act
iviti
esA
ctiv
ityN
Sum
of
Act
iviti
esPe
rson
nel C
ompe
nsat
ion
Sala
ries
or
Wag
esSt
aff
Ben
efits
Prof
essi
onal
Ser
vice
s Subt
otal
Con
sum
able
sT
rave
lT
rans
port
atio
nM
eals
Lod
ging
Oth
erE
nter
tain
men
tSu
pplie
sU
tiliti
esR
epai
r an
d R
epla
cem
ent
Com
pute
r Se
rvic
es P
rora
ted
All
Oth
erSu
btot
alT
otal
Tie
r O
neL
ong-
Ter
m D
ebt
Tot
al T
ier
Tw
oO
ne-Y
ear
Ass
ets
Tot
al T
ier
Thr
eeD
epre
ciat
ion T
otal
Tie
r Fo
ur*
* B
efor
e tr
ansf
ers
and
othe
r ch
ange
s.
182
I c'

Figu
re 7
.8: A
ctiv
ity S
prea
dshe
et
Cos
t Cen
ters
Em
ploy
eeO
neE
mpl
oyee
Tw
oE
mpl
oyee
Thr
eeE
mpl
oyee
Four
Em
ploy
eeFi
veE
mpl
oyee
Six
Em
ploy
ees
Em
ploy
eeN
Sum
of
Em
ploy
ees
Pers
onne
l Com
pens
atio
nSa
lari
es o
r W
ages
Staf
f B
enef
itsPr
ofes
sion
al S
ervi
ces Su
btot
alC
onsu
mab
les
Tra
vel
Tra
nspo
rtat
ion
Mea
lsL
odgi
ngO
ther
Ent
erta
inm
ent
Supp
lies
Util
ities
Rep
air
and
Rep
lace
men
tC
ompu
ter
Serv
ices
Pro
rate
dA
ll O
ther
Subt
otal
Tot
al T
ier
One
Lon
g-T
erm
Deb
tT
otal
Tie
r T
wo
One
-Yea
r A
sset
sT
otal
Tie
r T
hree
Dep
reci
atio
n Tot
al T
ier
Four
*
* B
efor
e tr
ansf
ers
and
othe
r ch
ange
s.
184
185

Cost Accounting in Higher Education
The activity spreadsheet accounts for the costs generated by each employee involved inthe activity. The process spreadsheet represents the sum of the costs of all the activities. Theemphasis in these and subsequent illustrations is not on the accuracy of the process properand its underlying activities, but on how process and activity costs might be reported.
The Enrollment Management Process at Liberal Arts Co Rego
Liberal Arts College chose the expression "enrollment management" deliberately: Itperceives that admitting new students is more than an admissions issue, but alsoencompasses the production of student revenues, managing student aid, and creating acurriculum and teaching activities that ensure a continuing demand from prospective studentsfor the institution's services. While Liberal Arts College continues to operate withinestablished administrative functions, most of its decisions about new-student admissionsinvolve significant human and material resources that are not part of the decision purview ofthe admissions department proper.
The enrollment management process is inter-departmental, and its costs are not limited toone department's budget. Figure 7.9 lists many of the principal participants. The diagramfocuses on participants who either spend most of their professional time and resources in acomplex set of subprocesses, or who, while spending less time, are involved in crucialdecisions at key points in the process.
Enrollment management at Liberal Arts College is under the co-direction of the vicepresidents for academic affairs and for finance and business. They jointly chair amanagement team composed of the dean of undergraduate admissions, the dean of students,the director of student financial aid, the faculty chair of the curriculum committee, thedirector of off-campus programs, and a high-ranking employee responsible for maintainingaccurate statistics pertaining to the team's operating-data requirements.
The management team meets at least once a month to determine admissions managementpolicies and targets, and during the applications influx, meets every two weeks. Normally,the meetings last 30 minutes to an hour. When the need calls for it, other members of theadministration attend. The vice president for academic affairs is the liaison to the faculty'sAdmissions Committee, which approves all final admissions offers, and the faculty's StudentGrants and Fellowships Committee, which must approve all student aid packages.
From time to time, the faculty's Curriculum and Admissions Committees discusscurricular matters, admissions, and graduation requirements, and they may makerecommendations to the faculty for changes that would affect the volume of matriculations.The faculty as a whole formulates broad academic admissions criteria and controls the SATand ACT cutoff points.
The principal task of the enrollment management team is to supervise the admissions andstudent aid efforts, to monitor their progress, and to propose and implement short-rangechanges when necessary. The team also recommends admissions goals to the president andfaculty and suggests changes in admissions and student aid policies to the appropriate bodies.
148

Costing of Support Activities: Total Cost Management, Activity-Based Costing, and Process-Cost Management
Figure 7.9: Participants in the Enrollment Management Process at Liberal Arts College
Vice President for Academic Affairsand
Vice President for Finance and BusinessCo-Chairs Enrollment Management Team
L
Dean of Admissions
Admissions Directors and Counselors
Department Secretary andClerical/Statistical Support
Faculty Advisors
Local and/or Regional Alumni Advisors
Faculty Committees with JurisdictionOver Admissions Policies
Director of Financial Aid
1Departmental Secretary
Packaging and Interview Assistants
Faculty Committee with JurisdictionOver Student Aid Policies
Trustee Signoff
The periodic meetings of the team are structured in the following manner:
1. A statistical status report is presented.2. The dean of admissions presents a forecast of likely matriculations.3. The dean of students reports on prospective housing occupancies under this forecast.4. The director of financial aid presents an updated report on how financial aid,
especially grants, are distributed and the effect this may have on net tuitionrevenues, if the admissions forecast is correct, and on the SAT and ACT distribution
of admitted students.5. The vice president for finance and business evaluates these forecasts from the
institution's overall budget perspective, specifically updating the new-student netrevenue model, which arrays the financial data on an SAT and ACT quality scale.
6. A discussion follows: If corrective actions are needed, they are put forth, discussed,and decided (unless other groups or individuals must sign off first), and specificwork assignments may be made.
The president of the college attends these meetings on occasion and whenever especiallytroublesome developments require the chief executive's presence, input, or sign off. Thus,rather than serving only to brief another committee, this is a true management team with
149187

Cost Accounting in Higher Education
decision-making authority. Obviously, the process is complex and in certain phases, verycumbersome.
Major Subprocesses
In terms of total cost management, and management team meetings aside, this enrollmentmanagement effort distinguishes among the following major subprocesses:
The admissions process (figure 7.10)The student aid processThe curriculum development process
The Admissions Process
The normal admissions process at Liberal Arts College is divided into four majorsegments:
Planning: planning and trustee approvalOperations: preparationOperations: responding to inquiries and creating an applicant poolOperations: creating a pool of matriculants
Figure 7.10 sketches many of the activities that are an integral part of this process. Thechain of activities highlighted applies to an institution with modified rolling admissions, butcan be adapted easily to other admissions modes. Admissions processes are seldom if everlinear, as an activities map might imply. Instead, they are back-and-forth iterations asindividual applications are received, the numbers change, and management adjustsadmissions activities in response to changing market events. Within the admissionsdepartment, admissions counselors are assigned to individual applicants and stay with theapplicant through matriculation and often beyond.
Liberal Arts College likes to be known for the personal touch its staff brings to the totaladmissions task. This means that the total enrollment management process is not easilyamenable to the types of quantitative analyses and changes implied in the simpler, moremechanistic new-student admissions process illustrated in the Process Costing Workbook.
This can be shown by means of an abbreviated adaptation of the workbook's originalflowchart in figure 7.11.
The workbook's flowchart includes several activity points that are full-fledgedsubprocesses in their own right. At Liberal Arts College, applicant interviews, evaluations,and the official decision to admit or to reject involve more than one decision maker andinputs from multiple institutional sources and include feedback loops where the employeesinvolved must re-communicate with applicants repeatedly (figure 7.11) Until an admittedapplicant is actually on campus registering for courses, the process is not truly complete.Institutions may differ in how intensively they cultivate (or, must cultivate) potentialmatriculants, but all enrollment management processes have in common their lack oflinearity.
188 150

Figu
re 7
.10:
Act
iviti
es in
New
-Stu
dent
Enr
ollm
ent M
anag
emen
tPro
cess
at L
iber
al A
rts
Col
lege
Plan
ning
Pha
se a
nd T
rust
ee A
ppro
val
Prep
arat
ory
Act
iviti
es: L
ong-
Ran
gean
d C
urre
nt E
nrol
lmen
t Pla
ns f
rom
Vic
e Pr
esid
ent f
or A
cade
mic
Aff
airs
and
Vic
e Pr
esid
ent f
or F
inan
ce a
ndB
usin
ess
to P
resi
dent
Pres
iden
tial R
evie
w M
ay I
nclu
deC
hang
es; P
lans
Go
to T
rust
ees
Firs
t Sta
ge A
ppro
vals
:T
rust
ee B
udge
t Com
mitt
ee,
Tru
stee
Fin
ance
C6m
mitt
ee,
Tru
stee
Aca
dem
ic C
omm
ittee
4,
Seco
nd S
tage
App
rova
l by
Boa
rd o
fT
rust
ees
Ope
ratio
ns: C
reat
e M
atri
cula
nt P
ool
Rec
eive
Acc
epta
nces
; Cre
ate
Pote
ntia
lM
atri
cula
nt F
ile
Ope
ratin
g Ph
ase:
Pre
para
tion
Enr
ollm
ent M
anag
emen
t Tea
m A
ppro
vals
and
Supe
rvis
ion
Rec
ruitm
ent P
lan
Adv
ertis
ing
Plan
Com
pute
rize
d M
ailin
gL
ists
Adm
issi
ons
and
Stud
ent
Aid
Mat
eria
ls
Exe
cute
d by
Adm
issi
ons
Staf
f,D
epar
tmen
tof
Pub
licR
elat
ions
,an
d St
uden
tA
id O
ffic
e
Enr
ollm
ent M
anag
emen
t Tea
m: E
stim
ate
Fina
l Siz
e of
Mat
ricu
lant
Poo
l;T
ake
Cor
rect
ive
Act
ion;
Rep
eat P
hase
s of
Pro
cess
as
Nee
ded;
Rev
ise
Goa
l if
Nec
essa
ry
Re-
esta
blis
h C
onta
ct w
ith N
o-Sh
ows
in F
ile I
4C
ontin
ue I
nter
view
s
4C
ontin
ue P
roce
ss U
ntil
Fina
l Dea
dlin
e
4
Facu
lty A
ppro
vals
of
New
App
lican
ts
Fina
l Enr
ollm
ent M
anag
emen
t Tea
m R
epor
t to
Pres
iden
t and
fro
mPr
esid
ent A
fter
Rev
iew
to
Boa
rd o
f T
rust
ees;
Con
tain
s E
stim
ate
of P
oten
tial M
atri
cula
nts
and
Oth
er C
hara
cter
istic
s of
Acc
eptin
g A
pplic
ants
Ope
ratin
g Ph
ase:
Im
plem
enta
tion
Mai
l "In
quir
y" S
eeki
ngPr
e-A
pplic
atio
n In
terv
iew
sM
ater
ials
; Pos
t on
Com
p.w
ith W
alk-
ins
as N
eede
dB
ulle
tin B
oard
Cre
ate
and
Upd
ate
Inqu
iry
File
; Res
pond
to I
nqui
ries
by L
ette
r or
on
Lin
e
Ass
ign
Adm
. Cou
nsel
ors
toR
egio
ns a
nd A
pplic
ants
Rec
eive
App
licat
ions
and
Cre
ate
and
Upd
ate
App
lican
t File
s
Cou
nsel
ors
Follo
w u
p w
ithL
ette
r an
d Sc
hedu
le
Tel
epho
ne, C
ompu
ter,
or
Cam
pus
Inte
rvie
w
Initi
ate
Tri
age
Proc
ess
for
Rej
ecte
d A
pplic
ants
;C
reat
e R
eser
ve G
roup
for
Lat
er D
ecis
ion;
Inf
orm
App
lican
ts; F
acul
ty in
Loo
p
Inte
rvie
w a
nd F
ollo
w-u
pL
ette
r, F
ax, T
elep
hone
,E
tc.
Follo
w-u
p C
onta
ct b
ySt
uden
t Aid
Off
ice
for
Tho
se R
eque
stin
g A
id
Facu
lty in
Loo
p
Eva
luat
e A
pplic
ants
for
Fir
st N
otif
icat
ion
Dea
dlin
e
Seek
Fac
ulty
App
rova
l; Se
nd N
otif
icat
ion
190

Cost Accounting in Higher Education
Figure 7.11: Segment of Student Admissions Application Process Flowat Liberal Arts College
Application ReceivedVia Modem or on
Hard Copy
Determination ofStudent Aid Eligibility
Begins
Application Assignedto Counselor
Admitted and WaitingList Applicant Files
Transmitted toStudent Aid Office
Counselor NotifiesApplicant; Requests
Any MissingInformation
Counselor'sRecommendations
Enter Admission orRejection Decision-
Making Phase
Counselor Fills OutComparative
Information Form*
Counselor RecommendsStatus Placement of
Applicant: Recommendto Admit,
Recommend to Reject,Recommend Waiting
List
* A special form exists that lists horizontally the name of each student for whom the counselor is responsible, and vertically a lengthyseries of demographic and quality indicators for which points are given, summing to a total admissions profile score.
Neither the workbook's nor Liberal Arts College's admissions processes are paperless.Liberal Arts College, however, has recently instituted several major changes wherebyapplicants can access an Internet site, download important information and application formsfor admission and student aid, and submit basic applicant data electronically, via modem orby fax directly to the college's admissions office. All prospective students are encouraged touse the computer-centered service, and the application fee is waived for those who do. Butthe institution remains sensitive to those who prefer the old-fashioned method.
Eliminating activity points in the activities chain of a process is an obvious way to reducetotal processing costs. For instance, in the case of Liberal Arts College, eliminating thebatch-processing phase of periodic faculty committee approvals would reduce both the timeconsumed and the direct faculty costs that would be assigned to process costs. Of course, thechange would not reduce the institution's total cost, since in all likelihood no facultypersonnel would be fired. Liberal Arts College's move toward a more computer-centeredapplications approach changes the cost structure, since the cost of capital must now be takeninto account. Even here it is doubtful that total costs will be less in the short-run; any newcapital investment could increase costs. The major point made here is that changes can orwill take place in the process-cost structure when the process proper is changed.
Perhaps the most serious weakness inherent in process costing is the fact that, at least inthe case of such processes as admissions, student aid packaging, and employee hiring, thepurely mechanistic chain of activities (e.g., the routing of the relevant forms or information)is but a minor aspect of the work that needs to be performed. The time- and cost-consumingelements concern the many human, often-convoluted interactions without which the finaloutcome is not possible. Enrollment process analysis must take into account the zigzag
1St 152

Costing of Support Activities: Total Cost Management Activity-Based Costing, and Process-Cost Management
nature of the sequence of interactions between institutional personnel and individual
applicants.Even within the limits of the more mechanistic aspects of the admissions process, where
the focus is on describing and streamlining the paperwork and information flow, it is safe to
assume that some applications take longer to process than others for a variety of reasons(e.g., degrees of completeness, accuracy, differences in legibility, a student's qualifications,and the required reviews by staff). More to the point, the time it takes to process anapplication cannot be known in advance. Processing student applications is not like posting
checks to an account by a bank clerk. Over time, managers may acquire a statistical profile of
their institution's time-weighted admissions information flow, a profile which then becomes
part of the process analysis.A case could be made that processes which depend on repeated qualitative decisions, such
as the new-student admissions process, are inappropriate subjects for meaningful process-and activity-cost analysis. Too many activity points, even in relatively mechanistic processes,
are complex subprocesses in their own right. And because many activities cut across severaljurisdictions, measuring and assigning the myriad personnel costs involved can become very
problematic. The Liberal Arts College flowcharts (figure 7.10 and 7.11) should make this
quite clear.Nevertheless, there is great potential benefit in persevering. First, process analysis helps
bring into focus who is engaged in what specific activities and for what purpose. The mere
fact that such self-study takes place may disclose unnecessary or overlooked activities, and
may subsequently lead to a more effective process. Second, however difficult or problematicspecific process- and activity-costing aspects may be, understanding at least the direct costs
of simple and complex processes will assist in bringing about a better allocation of future
resources. As will be shown next, relatively simple techniques make possible anunderstanding of the costs of such complex processes as that of new-student admissions.
Process and Activity Scenarios
Before any given process and activities map can be created, it is necessary to describe the
activities scenario. This is akin to constructing a storyboard of what the employees involved
are and have been doing (historical activities costs) or will be expected to do (planned ornormative activities costs). In a general sense, an employee's job description is supposed to
define the workscope, but what happens during a day, minute by minute, is seldom part ofanyone's job description. The Process Costing Workbook illustrates time-worksheets for
many types of activities within processes that employees are engaged in, suggesting that a
proper process scenario and cost analysis depends on a minute-by-minute accounting ofone's time spent on a high diversity of tasks (after deducting meals and work breaks). This
time spent in an activity will be expressed as a percentage of the employee's total work load,
and this percentage is then multiplied by the average wage, salary, or total compensation to
calculate the labor cost equivalent of the activity.At Liberal Arts College a significant percentage of an admissions counselor's work
involves off-campus recruiting trips where he or she meets prospective applicants at home, in
their schools, or at other designated points. This gives rise to large travel budgets, and there
153 192

Cost Accounting in Higher Education
exists a vast management science literature that gives advice on managing the logistics oftravel in cost-effective ways. Liberal Arts College also tries to train its staff to project aspecific user-friendly style for communicating with potential applicants. The workscope forindividual counselors falls short of dictating minute-by-minute tasks and behavior; theinstitution prefers to leave much to a counselor's initiative and intelligence. Thus, scenariosand storyboards are able to sketch out in detail the tasks that must be performed, but may notnecessarily prescribe every detail of how an employee will spend his or her time.
How does one measure the success of enrollment management efforts? There is a cost-benefit dimension to enrollment management in general and to specific employees' tasks.The true cost-benefit dimension depends on asking the appropriate question concerning thebenefits, and the answers may differ depending on which activity's performance is beingevaluated. How many completed applications have been produced and can be attributed to aspecific employee? How many of these applicants have been admitted? How manymatriculations will eventually result from either an individual's, a team's, or the process'sefforts? And how much budgetable cash flow will result from matriculating new students?Which type of question is the correct one? In the final analysis, only the last one highlightsthe ultimate financial payoff.
Finally, a last caveat: Institutions should guard against engaging in time-study overkill, inpart for reasons mentioned earlier, and in part because process and activity costing engendertheir own costs. Some costing trips and costs they cause just may not be worth the trouble.
Activity-Based Costing of the Enrollment Management Process at Liberal Arts College
The following discussion centers on how Liberal Arts College accounts for its entireenrollment management process. In contrast to the conventional Admissions Departmentbudget, an enrollment management responsibility center budget has been developed. Theentire process has been subdivided further into a series of subprogram or responsibilitybudgets, each under the control of a specific manager. These budgets underwrite the new-student admissions process described in figure 7.10 and 7.11, give or take some activities.For instance, while there is a budget account for the applications approval process, there isno budget allocation at this time for individual faculty and faculty committee roles inenrollment management.
Figure 7.12 illustrates the difference between the conventional Admissions Departmentbudget and the more comprehensive enrollment management budget.
The last column combines resources from several departments (admissions, student aidadministration, public relations, registrar, computer center, business office, etc.) andsummarizes a comprehensive and complex program budget.
Figure 7.13 dissects the last column of figure 7.12 and identifies major steps orsubprograms in the overall enrollment management process. The designations in the firstcolumn are somewhat arbitrary and sum up activities that have common features. For thesake of this illustration, only broad activity categories are shown. Subsequent exhibits ferretout details. Horizontally, Figure 7.13 adheres to the FTFC model used throughout this book.
154
193

Costing of Support Activities: Total Cost Management Activity-Based Costing, and Process-Cost Management
These data come from analyses (percentage distribution of tasks) of how individualemployees spend their professional or work time and what kinds and amounts of other
resources they use in the process.
Figure 7.12: Summary Comparison of the Traditional Admissions Department Budgetand the New Enrollment Management Budget
Natural Costs Admissions Department Enrollment Management Program
Personnel $708,039 $1,295,383
Consumables 1,180,101 1,008,252
Total Tier One 1,888,140 2,303,635
Long-Term Debt Costs 0 985
Total Tier Two 1,888,140 2,304,620
One-Year Assets 5,513 7,875
Total Tier Three 1,893,653 2,312,495
Depreciation 6,015 9,862
Total Tier Four 1,899,668 2,322,357
Figure 7.13: Liberal Arts College Total Activity-Based Costs for the EnrollmentManagement Process
Processes and Activities Personnel Consumables Tier One All Capital Tier Four
AdmissionsRecruitment $328,625 $915,621 $1,244,246 $0 $1,244,246
Applicant File 68,251 27,823 96,074 7,582 103,656
Approvals 32,247 6,258 38,505 116 38,621
Correspondence 92,521 26,299 118,820 2,274 121,094
Other 268,255 123,548 391,803 1,108 392,911
Subtotal 789,899 1,099,549 1,889,448 11,080 1,900,528
Financial AidApplication 16,922 11,298 28,220 4,228 32,448
Packaging 37,841 1,206 39,047 2,116 41,163
Approvals 18,922 521 19,443 89 19,532
Other 131,223 1,895 133,118 682 133,800
All Other 191,378 2,981 194,359 527 194,886
Subtotal 396,286 17,901 414,187 7,642 421,829
Total 1,186,185 1,117,450 2,303,635 18,722 2,322,357
Figure 7.14 concentrates on off-campus recruitment and provides cost details associated
with this function. Here the emphasis is on tier-one consumables costs only, since capital
costs had a value of zero in figure 7.13. Liberal Arts College's off-campus recruitment
program is extensive and expensive.The major cost components are personnel compensation and employee travel and
entertainment. The remaining costs would spread across the natural-cost categories within
the consumables group of costs described in detail in chapter 6. Not every employee engaged
in enrollment management is involved in recruitment proper, and all employees involved in
recruitment have other duties. The $48,275 of compensation for off -campus recruitment
represents 61.24 percent of employee A's total compensation. The objective for figure 7.14 is
155 1 9 4

Cost Accounting in Higher Education
to show the recruitment contribution to process costs of employees and certain otheractivities. Among consumables costs, only supplies and other costs are shown. Because thecharge for computer services represents a mix of personnel and consumables costs, it isshown as an activity in the first column.
Figure 7.14: Off -Campus Recruitment Program Budget at Liberal Arts College
Employee or Activity Compensation Travel
Supplies,Telephone,
Etc. OtherTotal
ConsumablesTotal Tier
OneEmployee A $49,257 $119,655 $3,181 $11,362 $134,198 $183,455Employee B 32,692 92,485 2,873 9,985 105,343 138,035Employee C 27,522 117,522 2,151 12,725 132,398 159,920Employee D 49,221 128,586 2,892 11,922 143,400 192,621Computer 23,185 596 38,122 8,828 47,549 70,731All Other 146,748 263,749 10,009 78,978 352,736 499,484
Total 328,625 722,593 59,228 133,800 915,621 1,244,246
Figure 7.15 looks at employee A's off-campus recruitment costs in greater detail andfocuses on per-trip costs. The basis for the allocation of employee A's total compensationcost is the percentage of full or fractional days (365 days equals 100 percent) spent on eachtrip. A one-day trip would represent 0.2736 percent of the total compensation represented byoff -campus recruitment. A three-day trip would consume 0.8219 percent of $49,275 ofcompensation, or $404.85.
Figure 7.15: Activities Worksheet for Employee A, Off Campus Activities (Trips)
Activity Compensation Travel
Supplies,Telephone,
Etc. OtherTotal
ConsumablesTotal Tier
OneTrip 1 $2,106 $3,798 $211 $582 $4,591 $6,697Trip 2 2,892 4,182 172 421 4,775 7,667Trip 3 1,857 2,171 151 306 2,628 4,485All Other 42,402 109,504 2,647 10,053 122,204 164,606
Total 49,257 119,655 3,181 11,362 134,198 183,455
Figure 7.16 gives key details of trip 1 costs.
Figure 7.16: Activities Worksheet for Employee A Showing Cost Detail for Trip 1
Activity Compensation Travel
Supplies,Telephone,
Etc. OtherTotal
ConsumablesTotal Tier
OneTransportation $884 $2,152 $0 $0 $2,152 $3,036Dinner Meeting 85 1,108 0 322 1,430 1,515Interviews 1,009 185 185 108 478 1,487Review of Day 65 0 15 0 15 80Other 63 353 11 152 516 579
Total 2,106 3,798 211 582 4,591 6,697
195 156

Costing of Support Activities: Total Cost Management, Activity-Based Costing, and Process-Cost Management
Returning to the inverted pyramid or funnel concept of figure 7.1, and assuming that per-
trip costs summarize all recruitment activities taking place during a given trip, the sum of the
costs of all trips can be seen as funneling into the inverted pyramid, creating the cost totalshown in figure 7.15 for employee A, and from there for all employees to figure 7.14, and so
on.
Alternative Off-Campus Recruitment Process Description
For the preceding discussion, the off-campus trip is the basic cost-center or activity. Each
trip may involve more than one admissions counselor. During each trip, individual
counselors will be engaged in a variety of different tasks. Some of these will be common to
all counselors involved, while other activities may differ for some individuals. In this sense,
each trip can be seen as a process in its own right, and institutions might wish to create cost-
effective work assignments.Figure 7.17 compares two activities lists, A and B, for two admissions counselors on the
same trip, spending some of their time in identical activities and some on specialized duties.
If it is assumed that the two individuals receive identical total compensation that, whenallocated to this trip equals $404.85, then the cost allocation of this amount will result in very
different activity costs, as shown in 7.18.
Figure 7.17: Itemizing Alternate Workscopes for Two Admissions CounselorsDuring Trip 1
Employee A Employee B
Meeting with Students at Hotel 21 hours Meeting with Students at Hotel 20 hours
Meeting with High SchoolCounselor, School I
1 hour Meeting with Students at HighSchools
15 hours
Meeting with High SchoolCounselor, School II
2 hours Logistics 5 hours
Attend Three Dinner Meetings 5 hours
Meeting with AlumniRepresentatives Involved inRecruitment
2 hours
Meeting at One Applicant's Home 1 hour
Staff Meetings 3 hours
Miscellaneous 2 hoursTotal 37 hours Total 40 hours
Note: Each counselor maintains a record of the time spent with prospective students and with high school counselors.
SEUUMEGT and Conclusions
Process and activity costs are described in the Process Costing Workbook for thefollowing processes: student applications, grade reports, purchase requisitions and orders,
invoice payments, hiring of new employees, and grant proposals and awards. In thenarrowest sense, these processes focus on the paperwork or information flow, but one cannot
ignore the various decision points on the respective activities maps that describe the
157
196

Cost Accounting in Higher Education
processes proper. In the broader sense, even the most paper-intensive among these processesinvolve numerous human interactions that often lack the one-directional linearity that thesimplified process flowcharts imply.
Figure 7.18: Allocation of $404.85 to Activities
Activities Employee A Hours Employee B Hours Employee A Costs Employee B CostsActivity 1 21 20 $229.78 $202.43Activity 2 1 15 10.94 151.82Activity 3 2 5 21.88 50.61Activity 4 5 54.71Activity 5 2 21.88Activity 6 1 10.94Activity 7 3 32.83Activity 8 2 21.88
Total 37 40 404.85 404.85
The preceding discussion focused on two managerial processes where decision making isa primary feature. The materials acquisition and handling process involves one type ofmanagement decision, centering on acquiring the right materials at the best price whilekeeping handling and inventory costs to a minimum. The enrollment management process-cost examples highlight subprocesses and subactivities where many different types of humaninteractions lead to decisions over which the institution has only limited control. Together,these distinct activities costs constitute the total cost of the entire enrollment managementprocess. The revenue dimension was not included here since it was discussed in detail inchapter 6.
While the workscopes of individual employees may recognize some diary type time-uselogs, the methodology shown here does not depend upon complex interviews and timesheets. Rather, each person's workscope is divided into percentage time segments that can beplugged directly into the payroll data that is downloaded from the payroll ledgers to thevarious worksheets and spreadsheets. The consumables natural-cost information is chargeddirectly on the basis of purchase orders that identify the person originating them or areprorated to each individual on some percentage allocation basis. In the case of off -campusrecruiting trips, most consumables costs can be identified with the traveling individuals.
There is merit in both the narrow, more or less mechanistic view of information flow-process and activity-cost analysis and the conceptually broader managerial processesdiscussed in this chapter. Whichever view is preferred, process and activity costing isincomplete if it focuses solely on personnel compensation costs. The FTFC model lendsitself well to process and activity costing, as shown in the few examples shown above.
Conceptually, every administrative process, narrow or broad, is amenable to the kinds ofanalyses discussed here. Practically, several obstacles may have to be overcome. Foremostperhaps is the need to train the institution's personnel and to make palatable to employeesthe virtues of process and activity costing. Important also is the inevitable changes that willtake place in the cost accounting system proper, since basic established accounting systems
19 7 158

Costing of Support Activities: Total Cost Management, Activity-Based Costing, and Process-Cost Management
do not lend themselves to process- and activity-cost accounting. Thus, institutions interestedin process and activity costing must be prepared to invest adequate resources to this effect.
Liberal Arts College's automated admissions and student aid inquiry systems, its
increasingly paperless applications and student aid forms information system, and itsadvanced file maintenance and communications systems define key aspects of the entireenrollment management effort that will not be found elsewhere in exactly the same form anddetail. All materials management and other software, while adapted from generalizedmodels, reflect the institution's needs, preferences, and characteristics. Anyone involved inprocess and activity costing will soon discover that, general features notwithstanding,processes and activities are always institution-specific and therefore unique.
To what extent can a costing method invented primarily for manufacturing be applied toeducation activities? Obviously, Ernst & Young, Coopers & Lybrand, and the authorsBrimson and Antos believe total cost management, activity-based costing, and process-costmanagement can and should be used by colleges and university.9
Notes1. The following sources may be helpful introductions to the subjects:
Michael R. Ostrenga, et al., The Ernst & Young Guide to Total Cost Management (NewYork: John Wiley & Sons, Inc., 1992).
James A. Brimson, Activity Accounting: An Activity-Based Costing Approach (NewYork: John Wiley & Sons, Inc., 1991)
James A. Brimson and John Antos, Activity-Based Management for Service Industries,Government Entities, and Nonprofit Organizations (New York: John Wiley & Sons,Inc., 1994).Douglas T. Hicks, Activity-Based Costing for Small and Mid-Sized Businesses (NewYork: John Wiley & Sons, Inc., 1992).
2. Coopers & Lybrand with Barbara S. Shafer Associates, Benchmarking for ProcessImprovement in Higher Education: Process Costing Workbook FY 1994 (Washington,D.C.: NACUBO, 1995), chapter 2. The workbook is only available to BenchmarkingProject participants.
3. Ostrenga et al., The Ernst & Young Guide.4. Ibid., 61, 75.5. Ibid., 87.6. Process Costing Workbook, 17 .7. Process Costing Workbook, 72.8. One of the seminal achievements in management science was the development of optimal
cost-inventory and transportation cost models, which have had a far-reaching effect notonly on an enterprise's costs but on the behavior of the business cycle. Inventory models inparticular are early examples of inventory-process costing and have many applications inhigher education. Inventories are often financed by means of short-term debt inanticipation of future revenues from sales. Such borrowing entails interest costs that shouldbe charged to the cost centers that engender the inventories and the debt. The "efficienttransportation" model was backed for many years by a prize incentive to encourage asolution.
159 198

Cost Accounting in Higher Education
9. Brimson and Antos, Activity-Based Management, 221. The step-two exhibit lists manynatural-cost elements, including different types of personnel costs. Frequently, accountantsdevelop overhead charges that represent the natural costs. See also Hicks, Activity-BasedCosting, 59, for a lucid and detailed presentation of the most important types of naturalactivity costs.
Exercises
1. Prepare flowcharts for the processes listed below as they apply at your institution. Ifyour activities differ from any indicated here, please substitute them.
A. Materials management:
Identification of materials and supplies to be acquiredReceiving, storing, distributing, and liquidating materials acquired. (Considerinventory policies for operating versus plant construction and improvementmaterials. Do you have a point-of-use, or point-of-sale, acquisitions policy? Do youuse inventory cost optimization models?)Originating, tracking, and filing of purchase requisitionpurchase order documents(Is your system paperless, paper-intensive, or a mixture?)
B. Personnel requisition and hiring process: Develop a flowchart of this process at yourinstitution. Please identify points on the chart where a managerial decision occurs.
C. Gift-receiving and recording process. Distinguish throughout between simple routing,clerical, and nondecision activities and those that require managerial decisions. If thelatter are subprocesses with more than one step, sketch these as well.
2. Construct an admissions-process flowchart that begins at the moment an admissionscounselor is assigned to an individual applicant and continues through this counselor'sactivities to matriculation. Develop a process-cost worksheet (similar to figures startingat figure 7.11) for the activities the counselor is engaged in.
3. Develop a flowchart and accompanying process-cost worksheet for the annual alumnigift solicitation, receiving, and recording process (involving all the human activities,resources, etc., not merely the tracking of a gift form) following NACUBO's ProcessCosting Workbook.
199160

Other sto g To cs E s involved inDeveloping a C mprehensive
Costing System
Among the topics covered in this chapter are
the cost of costing,capital cost issues,marginal costs,how institutions can deal with costing mandates that may not be in their best long-
range financial interest, andtotal quality management.
Multiple Allocation Bases
Even if one adheres closely to the affinity principle, it is likely that more than oneallocation base will be available for allocating most types of costs. This fact is made clear by
the several lists of available allocation bases shown earlier. Sometimes, the use of alternateallocation bases will show small differences in the resulting costs; sometimes the costdifferences are very large.
Different Financial Policies
An important financial policy concern is how capital costs are determined. Full costingrequires that operating costs be supplemented by capital costs. If the cost of capital isrepresented by depreciation, the particular depreciation method and the specific capital
161 200

Cost Accounting in Higher Education
valuations used will determine the size of the depreciation charge. If the cost of capital isrepresented by a facilities-use charge, its underlying composition and method of calculationdetermine the actual capital cost.
Many depreciation charges reported by some colleges and universities are far fromaccurate. Many institutions make no distinction between plant and equipment, and write offdepreciable plant and equipment assets on a straight-line 50-year useful-life basis. Althoughthe practice is simple and keeps the depreciation charge and the ensuing full costs low, it alsoproduces superficial and unrealistic results.
Compare this practice to that of many institutions where depreciation costs are based on acareful and detailed analysis of the differential useful lives of their classes of assets. Otherthings being equal, depreciation rates that do not overstate the remaining useful life ofdepreciable assets are preferable.
Even if all institutions computed their capital or depreciation costs on the basis of carefuldistinctions of the remaining useful lives of all depreciable assets, identical total asset valueswould still result in different depreciation costs because the useful-life mix of depreciableassets is not identical among institutions.
Another cause for capital cost differentials arises among institutions that prefer afacilities-use charge. Such charges can be based on historical asset costs and resemble atraditional depreciation charge with or without a surcharge, or they can be based on assetreplacement values. Obviously a replacement costbased capital charge will be significantlyhigher than one that focuses on historical asset values.
For these and other reasons, capital costs will always differ among institutions, even whenthe capital charge is calculated on the basis of similar, generally accepted, principles.
Once a given capital cost has been calculated, how this cost is allocated to the variouscost centers becomes a major factor determining costs. For instance, the square-footageallocation method produces different results than either the per-FTE-student or per-credit-hour allocation method, and the total-square-footage method results in different allocatedcosts than the assigned-square-footage method.
Different Pooling Practices and Loss of Costing Precision
Pooling practices and the desired degree of cost precision are also matters that both defineand are influenced by financial policy. Institutional pooling practices affect operating and fullcosts. Pooling allegedly is a virtue because it simplifies cost allocation. Pooling is a majorfeature in indirect-cost-recovery accounting under Office of Management and BudgetCircular A-21.1 Many simplified cost allocation practices, including pooling, can be majorcauses of reduced costing precision. Less precision is achieved when pooled direct costs arelater distributed among cost centers on some percentage basis or when pooled costs areprorated to cost centers in large lump sums without regard to the natural-cost structure. Theexamples shown in the preceding chapters demonstrated this tendency. While lump-sum costallocation will be more than adequate in many costing applications, many situations requireattention to detail that is lost in lump-sum cost allocations.
201162

Other Costing Topics and Issues Involved in Developing a Comprehensive Costing System
The Cost of Cos ng
Another financial concern is the cost of costing. Many current costing practices have beenintroduced because they help contain this particular cost. It is therefore useful for institutionsto make a judgment about the cost/benefit tradeoffs associated with the desire for greatercosting precision. In macro-costing tasks, such as the costing of broad academic programs orof major administrative functions, a considerable loss of precision can be tolerated.Heightened precision in costing may matter most in micro- and activity costing of the typesdescribed in chapter 7.
Specifically, managers must decide when it is important for them to know how naturalcosts are affected when support and other indirect costs are finally allocated to primaryprograms. Every budget has a natural cost structure, yet a large portion of costing practiceignores the cost allocation effects on natural costs. This is not to suggest that all costing musttake natural-cost effects into account, but that a concern with these effects might be evidentmore often than is now the case.
Ideally, when support and indirect personnel costs are allocated to cost centers, theyshould be added to direct personnel costs. Operating costs for support and indirectconsumables should be allocated to direct consumables operating costs. Finally, support andindirect capital costs should be added to direct capital costs. Much of the current practice insupport and indirect-cost allocation and cost prorating skips over such niceties as anexpensive inconvenience. But when managers are confronted with budget cutbacks andcompetitive reversals, they discover that any ensuing cost cutting eventually takes place firstin the real world of their natural costs and only by inference in some artificial indirect- oroverhead-cost pool.
If cost pooling simplifies indirect-cost recovery, so be it; indirect costs are not the primaryconcern in costing. The overriding reason for costing in any enterprise is to help managersimprove the allocation of scarce resources. However large the amount of indirect-costrecovery may be, cost-recovery accounting is only one dimension of an institution's totalcosting effort. In many institutions, it is actually of small consequence. The other costingissues are far more significant. Cost pooling or other cost-saving costing methods must notbecome a panacea for all costing efforts.
Ever since the initial NACUBO and National Center for Higher Education ManagementSystems (NCHEMS) efforts to refine academic-program and instructional costing, interesthas been growing in the costs of institutional activities that are not captured well by thetraditional functional cost accounts.2 Increasingly, institutions and others are trying to cometo grips with the costs of specific institutional services. Most, if not all, institutional services
involve more than one department and more than one jurisdiction. This has always been thecase to some extent, but it may be of greater significance today than in the past.
Modern collegiate management requires an appropriate managerial cost accounting pointof view. A cost accounting system dominated by indirect-cost recovery and by-function costaccounting concerns simply does not address adequately the interdepartmental andinterservice aspects of modern cost deployment and cost management. Thus, when
163
202,

Cost Accounting in Higher Education
institutions are confronted with the costing needs implicit in novel ways of looking at costmanagement, they cannot and should not avoid the new approaches simply because theymight be unsettling or involve startup costs.
Direct and Full Costing in a Wm id of Computer SoplgOcaREon
Many of today's macro-costing practices predate modern personal computer and softwaretechnology. Early program and activity costing inaugurated the more advanced costingmodels found in modem, commercially available software. The diverse costing models in useat colleges and universities enable managers to maximize direct macro- and micro-costing.
If precision in costing is a goal, transfer pricing and chargebacks are desirable ways forinstitutions to maximize direct costing. By maximizing direct costing, the true indirectoverhead and support costs emerge. Direct costing reduces the number and size of theremaining unallocated cost pools. What remains are the costs of key support services.Pooling also obliterates key distinctions between direct and indirect costs and betweenvariable and fixed costs. Appropriate cost-crossover algorithms and modern computertechnology can help keep these distinctions clear.
The Meaning of Maximum Direct and Full Costing
Maximum direct costing occurs when an institutional user is charged for the full costsassociated with a service. The four cost tiers embodied in the four-tier full-cost (FTFC)natural-cost model assume that the full cost of each activity can be determined. In thenatural-cost structure, there is an object line for each type of cost. An allocation factor orprice can be predetermined for each natural-cost element so that it can be charged to aspecific activity. The more internal pricing there is, the less percentage allocation will benecessary. Internal pricing and chargebacks depend on or can be derided standard costs andstandard-cost ratios, and serve as useful cost allocation bases between suppliers and users.
Capital-Cost Dimensions Other Than Depreciationand Facilities-Use Charges
Colleges and universities periodically face major capital investment decisions when theyacquire new plant and equipment. Historical costs defined through a depreciation or capitaluse charge are not always very useful capital-cost measures. Instead project lifecycle costingand methodologies and concepts used in capital budgeting may be more appropriate.3
The Time Value of Money
In planning capital projects and large equipment acquisitions, institutions need to focus onthe time value of money. Although not-for-profit enterprises may not see a financial rate ofreturn when they invest in new plant and equipment, there usually is some measurable
164
203

Other Costing Topics and Issues Involved in Developing a Comprehensive Costing System
payoff. For instance, modern computer equipment may increase productivity and reducelabor costs or render services faster or with greater accuracy.
One or more of the following concepts may be relevant:
o Discounted cash flow compares cash inflows with cash outflows at specified rates ofinterest (the cost of borrowing or forgone income had the money been invested).
® Internal rate of return is the rate of return at which the present value of future cashinflows equals the present value of future cash outflowsnormally expressed as apercentage.Net present value discounts expected future cash inflows and outflows at a specificrate of returnnormally expressed as a dollar value.
These three capital concepts are closely related and are used routinely in capitalbudgeting. They all ignore conventional accrual accounting methodologies.
Investment Payback
If plant and equipment decisions are viewed as investment decisions by colleges anduniversities, a payback analysis can be part of the costing or budgeting decision. Payback isexpressed as the number of years it takes to recoup the original investment with estimatedfuture consecutive identical or varying annual cash inflows directly ascribed to the newinvestment. Payback analysis can also be based on estimated future general revenues if thereis no direct link between the acquisition and future revenues. Housing facility financing isoften viewed in this light.
Break-Even Time and Capital Costs
Most new capital investments tend to increase the need for new working capital. At theend of the cycle, the new working capital will have been fully recouped, but the new capitalinvestment may be recovered only in part. Break-even-time analysis goes beyond discounted-cash-flow analysis and estimates the time it would take to recoup the entire investment.
Investments With a Limited Time Horizon
Colleges and universities have learned that some new projects do not succeed or that theycan be funded only for a limited time, after which they have to be canceled. Most new highereducation ventures represent combinations of human and physical capital. If an unsuccessfulproject must be terminated, the human capital it uses may or may not be eliminated. If it isnot, other programs must absorb the remaining costs. Facilities and equipment, on the otherhand, may have significant terminal value for other uses at the institution or uses for othersoutside the institution. In the worst case, they have salvage value. By figuring the terminal orsalvage value into any time-value calculation, the number of payback or break-even yearscan be shortened significantly. These elements tend to reduce costs.
Inflation and Capital Costs
Time-value analysis of capital costs focuses on nominal interest and discount rates. Realreturn, on the other hand, calls attention to the investment return after inflation-related costs
165 9 0 4

Cost Accounting in Higher Education
have been eliminated. Over long periods of time, the expected real rate of return on capitalhas been somewhere between 2.5 and 3.5 percent. In recent years, the expected real rate ofreturn has often exceeded 4 percent.
Since the inflation rate varies over time, a constant present-value discount rate may not bethe right capital cost measure, since it tends to reflect a constant current inflation rate. Assoon as inflation rises, the discount rate rises; and when inflation falls, the discount rate falls.In contrast, the normal real rate of return changes less than the inflation rate. It may be moreappropriate to view the cost of capital in after-inflation or real-rate-of-return terms. This,again, is a cost accounting concept that is not captured by accrual accounting.
Textbooks on cost accounting always spend considerable space on these and relatedcapital cost concepts, normally in a for-profit setting. These concepts should be appliedbefore investment decisions are made in nonprofit situations as well.
Fixed, Variable, and Marginal Costs
Instead of concentrating on the distinction between direct and indirect costs, dynamic costanalysis distinguishes between fixed, variable, and marginal costs:
Fixed costs do not change with changes in output.Variable costs change in some proportion to output.Marginal costs are defined as the change in total costs resulting from a change(addition or reduction) of a unit of output. For instance, if total costs increase by$5,000 and output increases by 1,000 units, the resulting marginal cost is $5 per newunit of output.
Unfortunately it is not always easy to compute marginal costs in higher education. First,one has to agree on which are the fixed costs and which are the variable costs. Most studiesinvolving marginal costs have centered on the cost of instruction, and researchers have foundthat instructional costs do not necessarily respond to enrollment fluctuations unless theenrollment change is relatively large and the trend holds over several terms. How responsiveis faculty personnel compensation to changes in enrollment? How do nonfaculty personneland consumables costs respond to changes in student demand? Does it make a difference ifmarginal costs are studied on an institutionwide basis by primary programs only or at thedepartmental level? What is the difference between the marginal economic costs ofinstruction and marginal accounting costs?
A number of studies have addressed these and related questions, and the answers are oftenlengthy and involved. Two studies examine the issue of marginal costs directly and in quitedifferent ways. The first is described in Costing for Policy Analysis in a chapter entitled"Drake: Instructional Capacity,"4 and the second was published in Research in HigherEducation under the title, "The Marginal Costs of Instruction."5 The first study, undertakenat Drake University, focuses on accounting costs, whereas the second emphasizes theeconomic costs of instruction. Here, the discussion is limited to marginal accounting costs.
205 166

Other Costing Topics and Issues Involved in Developing a Comprehensive Costing System
The Drake study focuses on cost differences that arise when course enrollments are lessthan classroom capacity would allow. Marginal cost computations are derived from a set oflinear equations where marginal costs are always equal to average variable costs (MC equalsAVC). The Drake study also performs a regression analysis of the departmental cost data inquestion and the related student credit hours and computes the marginal cost or slope of thecost curve at the fixed cost intercept for each department. The various computations and R-square values led the analysts to conclude that "faculty costs do not respond directly tochanges in enrollments, even over several years."6
In contrast, the authors of "The Marginal Costs of Instruction" analyze economic costswhich include opportunity costs rather than accounting costs. Opportunity costs are the costsof forgone activities. This study defines marginal costs as "the economic costs of incrementalenrollments" and analyzes the faculty and administrative incentives that are associated withmarginal costs when resource allocation choices are made. This is a seminal study in theeconomics of higher education, primarily focusing on graduate enrollments at a largeresearch university.
Liberal Arts College and Marginal Costs
Here, the discussion is limited to accounting costs in their simplest manifestation.Marginal instructional costs are normally associated with incremental enrollments or withthe variations in the production of academic credits. Enrollments in courses may exceed thecredits finally certified. Changes in marginal instructional costs can occur withindepartments for each course, among departments where courses involve interdepartmentalfaculty and staff, within entire academic programs, such as architecture, within an entireprofessional school or division, such as a law school, within a single campus, and within amulticampus system. In each case, the analysis will involve different cost composites andwill become more difficult and complex as the cost center studied becomes more complexand comprehensive.
The Marginal-Cost Effect of Adding a Course Section
Within the institution, marginal accounting costs can be studied for well-definedoperational entities. Two examples from Liberal Arts College will be used.
Figure 8.1 identifies fixed and variable costs for a single course offered in more than onesection before and after a change in enrollment. Enrollment is measured in terms of credithours. An enrollment over-subscription requires the net addition of a course section whichcauses, among other costs, an overload payment to one of the instructors and some newvariable costs. Figure 8.2 explores these same costs on the basis of incremental credit hours,six hours at a time.
Since the instructor's teaching load is now increased, the total compensationwhich doesnot changeis divided among five, rather than four, work-load units in the course-loadmatrix, each unit amounting to $11,400. This reduces the cost of section 101-3 by $2,850, or$17.27 per credit hour. The total cost base is now $13,212.
For section 101-4 (figure 8.1), the instructor agreed to teach the additional course sectionfor an overload stipend of $35 per credit hour. After adding direct clerical and consumables
16720 6

Cost Accounting in Higher Education
costs of $789, the cost of section 101-4 comes to $16,999, for a new total combined cost of$30,211.
Figure 8.1: Liberal Arts College's Fixed, Variable, and Marginal Costsfor Economics 101-3 and 101-4
Types of CostsTier One
FixedCosts
VariableCosts
TotalCosts
CreditHours
AverageCosts
MarginalCosts
Section 101-3One-fourth ofCompensation, Faculty
$14,250 $14,250 $165 $86.36
Clerical Support $895 895 165 5.42Consumables 792 792 165 4.80
Subtotal 14,250 1,687 15,937 165 96.59Minus CompensationAdjustment
-2,850 -2,850 165 -17.27
New Total 11,400 1,687 13,087 165 79.32Tiers 2 through 4 125 125 165 0.76
Total 11,525 1,687 13,212 165 80.07 Not ApplicableSection 101-4
One-fifth ofCompensation
11,400 11,400 135 84.44
Overload 4,725 4,725 135 35.00Clerical Support 357 357 135 2.64Consumables 432 432 135 3.20
Subtotal 16,125 789 16,914 135 125.29Tiers 2 through 4 85 85 135 0.63
Total 16,210 789 16,999 135 125.92 $125.92Combined Total 27,735 2,476 30,211 300 206 125.92
Note: Marginal costs equal change in total costs divided by change in credit hours.
In figure 8.2, the new combined fixed cost of $29,585 kicks in at 170 credit hours andvariable costs rise to the combined $2,476 level at 300 credit hours. The fixed cost column offigure 8.2 has been adjusted to reflect the new one-fifth compensation of $11,400. Each timea course section (or a new course) is added or eliminated, a step-function increase ordecrease similar to that at 170 credit hours takes place.
In figure 8.1, average and marginal costs are identical because there is only oneincrement. Figure 8.2 shows nonlinear increments as credit hours rise; it resembles thetypical marginal-cost curve normally found in introductory economics texts.
The examples also assume that section 101-3 is filled to capacity before section 101-4 isadded. In reality, both course sections may have unused capacity, in the sense that not allseats are filled or that class size is less than optimal. When institutions plan the number ofsections that a course may need or that available staff are able or willing to accommodate,they always should base their estimates on historical or probable class occupancy and not onoptimal rates. Therefore, the credit-hour or output transition from section to section will notbe as smooth as in the figure 8.2 illustration.
207
168

Other Costing Topics and Issues Involved in Developing a Comprehensive Costing System
Figure 8.2: Marginal-Cost Analysis for Liberal Arts College, Student by Student
Credit Hours Fixed Costs Variable Costs Total CostsMarginal Costs(per credit hour)
6 $11,400 $560 $11,960 $0.0012 11,400 580 11,980 3.33
18 11,400 600 12,000 3.3324 11,400 620 12,020 3.33
30 11,400 680 12,080 10.00
36 11,400 740 12,140 10.00
42 11,400 800 12,200 10.00
48 11,400 850 12,250 8.3354 11,400 900 12,300 8.33
60 11,400 950 12,350 8.33
66 11,400 1,000 12,400 8.33
72 11,400 1,050 12,450 8.33
78 11,400 1,100 12,500 8.33
84 11,400 1,150 12,550 8.33
90 11,400 1,200 12,600 8.33
96 11,400 1,250 12,650 8.33
102 11,400 1,300 12,700 8.33
108 11,400 1,350 12,750 8.33
114 11,400 1,400 12,800 8.33
120 11,400 1,430 12,830 5.00126 11,400 1,470 12,870 6.67
132 11,400 1,500 12,900 5.00138 11,400 1,530 12,930 5.00
144 11,400 1,560 12,960 5.00
150 11,400 1,590 12,990 5.00
156 11,400 1,620 13,020 5.00162 11,400 1,657 13,057 6.17
165 11,400 1,687 13,087 10.00
170 27,735 1,850 29,585 3,299.60175 27,735 1,900 29,635 10.00
180 27,735 1,950 29,685 10.00
185 27,735 2,000 29,735 10.00
190 27,735 2,050 29,785 10.00
195 27,735 2,100 29,835 10.00
200 27,735 2,150 29,885 10.00
210 27,735 2,200 29,935 5.00225 27,735 2,250 29,985 3.33
240 27,735 2,300 30,035 3.33
255 27,735 2,350 30,085 3.33
270 27,735 2,400 30,135 3.33
285 27,735 2,440 30,175 2.67
300 27,735 2,476 30,211 2.40
Note: Change in variable costs is hypothetical.
169 "'208

Cost Accounting in Higher Education
Marginal Costs for the epartment and the Institution
The preceding illustration focuses on marginal costs in a strictly limited sense as theincremental costs caused by a change in enrollment after the addition of a course section.This is not the true marginal accounting cost for either the department in question or for theinstitution as a whole. Figure 8.3 looks at the effects on total departmental costs when section101-4 is added to the department's offerings. For the department as a whole, totalincremental costs are $5,429, and marginal per-credit-hour costs equal $2.37.
Figure 8.3: Departmental Marginal Costs for Liberal Arts College
Types of Costs Data SourceTotal Marginal
CostsCredit Hour
Marginal CostsTotal Costs Without 101-4 $1,012,308New Section 101-4 Costs
A. Overload Compensation 4,725 From 8.1B. New Clerical 298 From 8.1*C. New Consumables 321 From 8.1*D. Total New Tier One . 5,344E. New Tiers 2-4 Costs 85 From 8.1*F. Total New Costs 5,429
Total Costs With 101-4 1,017,737 $5,429 $2.37
* Minus allocated costs.
Figure 8.4 shows how much of this incremental departmental cost is also incremental costto the institution as a whole. Some departmental costs are allocated institutional costs andtherefore not incremental for the institution as a whole. For instance, only $106 of clericalcosts were the result of additional hours worked, and the $156 of consumables costs are netof all allocated costs and thus truly incremental. For the institution as a whole, the addition ofsection 101-4 resulted in a per-credit-hour incremental cost of 8.29 cents.
Figure 8.4: Institutional Marginal Costs for Liberal Arts College
Types of Costs Data SourceTotal Marginal
CostsCredit Hour
Marginal CostsTotal Costs Without 101-4 $25,640,000New Section 101-4 Costs
A. Overload Compensation 4,725 From 8.3*B. New Clerical 106 From 8.3*C. New Consumables 156 From 8.3*D. Total Tier One 4,987E. New Tiers 2-4 Costs 15 From 8.3*F. Total New Costs 5,002
Total Costs With 101-4 25,645,002 $5,002 $0.0829* Figure 8.3 data minus allocated costs.Note: Total credit hours are increased from 59,670 to 60,314.
The example assumes that the increase in departmental enrollment was caused by anincrease in overall enrollment. The enrollment increase would raise costs throughout the
2 0 9 170

Other Costing Topics and Issues Involved in Developing a Comprehensive Costing System
institution, but would also increase revenues. On the other hand, the increase in departmentaldemand that led to the addition of section 101-4 could have been caused by an internal shiftof enrollments among all departments, changing the internal distribution of departmentalcredit-hour costs and revenues without affecting total institutional revenues.
The preceding illustrations make the following important point: The actual meaning andsize of marginal costs depend entirely on the cost center or cost objective being analyzed. Ateach level of cost aggregationa course, a department, the institution as a wholea givenchange in activity costs will produce different marginal costs, as shown above in figures 8.1through 8.4.
Marginal Costs Equal Marginal Revenues or Optimum Revenues and Costs
The ultimate use of marginal-cost analysis centers on how marginal costs relate tomarginal revenues. As in the for-profit sector, the optimum or profit-maximizing situation forinstruction is achieved at the enrollment level where marginal revenues equal marginal costs.
The preceding examples do not account for support costs that might be allocated todepartments and courses. If an institutionwide enrollment increase results in higher supportcosts, whether or not these are allocated to departments and courses, additional marginalcosts arise for the institution as a whole and for any affected activities. Such costs wouldhave to be added to the above illustrations. It is not always easy to track all of the inducedsupport-cost changes caused by enrollment fluctuations.
The Effect on Marginal Costs of Changes in Support Activities and Auxiliary Enterprises
Marginal-cost analysis is useful in the management of support services per se, preferablybefore new budgets are approved and especially when institutions plan changes inoperational activities.
Many support activitieslibraries, for instanceare experiencing significant tech-nological change, in particular the more pervasive use of computers, CD-ROM technology,and computer-based telecommunications. In part, this means that library operations arebecoming more capital intensive. This increases fixed cost. One interesting fallout is thatstudent and faculty uses of library facilities can be more readily measured: Every computerand telecommunications use can be logged automatically, and theoretically a related cost canbe charged to appropriate user accounts. Institutions can develop appropriate full-costalgorithms, and telecommunications costs are easy to identify. The changing structure oflibrary operating costs can be analyzed profitably by means of marginal-cost studies.
Auxiliary enterprises are another area where marginal-cost analysis is appropriate, sincechanges in marginal costs are an indicator of any necessary future price change. If pricesmust cover costs or help achieve a specific revenue target, changes in marginal costs can tellmanagers what kinds of price changes will accomplish the desired results under specificservice-demand and service-cost assumptions.
In general, marginal-cost analysis is appropriate before any external or internal pricingdecisions are made. Future changes in internal transfer prices and chargebacks aredocumented most convincingly by means of appropriate marginal-cost analysis.
171 210

Cost Accounting in Higher Education
Changes in marginal costs depend not only on how total costs change, but on how fixedand variable costs interact. Marginal fixed costs decline with rising output until (as shown infigures 8.1 and 8.2) a new layer of fixed costs is added. After this step-function increase,marginal fixed costs begin to decline again, but only to a certain point. Variable costs, on theother hand, may increase slower or faster than output or at a constant rate. Marginal costsbegin to increase when variable costs rise at an accelerating rate. When managers understandhow a change in the mix of fixed and variable costs will affect marginal costs, they will makemore intelligent pricing and cost allocation decisions. The more traditional focus on indirectcosts produces very little useful information for pricing decisions.
Marginal Costs and Long-Range Planning
Marginal-cost analysis is especially useful when institutions develop their long-rangeplans, particularly when these plans include the elimination or addition of programs. Theanalysis will prove fruitful even if these eliminations and additions are not monumental andoccur within academic divisions and academic or administrative departments. Regardless ofthe total dollar amount involved, institutions should develop future plans on the basis ofmarginal cost models that permit managers to simulate alternative scenarios with differentfixed- and variable-cost mixes.
In the Drake University case mentioned earlier, the authors concluded that marginal-costanalysis was less useful than what they called "capacity analysis." One reason was that eachdepartment's marginal costs were assumed to be linear and thus identical with average costs.In the real world, marginal costs are seldom linear, although colleges and universities mayfind it difficult to determine precisely how variable costs behave for different levels ofstudent demand. The smooth progression of variable costs shown in figure 8.2 may bedifficult if not impossible to replicate. Also, the 50-50 split between fixed and variable costsassumed in the Drake University example does seem to be an oversimplification, if oneconsiders the normal relationship between personnel compensation, consumables, and capitalcosts.
If it is true that faculty size does not respond very well to changes in enrollment, as boththe Drake University case and the Hoenack study suggest, maybe it is appropriate to considermost personnel compensation costs as fixed, rather than variable, even in the short run. In thelong run, all costs are variable, but higher education in particular is afflicted with the verynonvariable fixed cost of its tenured staff. The size of the maintenance payroll is not at allrelated to short-term fluctuationsespecially minor onesin enrollment, and even an in-house food service department will have a core staff that does not change in direct proportionto the volume of meal contracts.
Colleges and universities probably do not have a clear idea of their fixed and variablecosts. If they have a direct/indirect cost preoccupation, institutions may not pay enoughattention to the nature of their fixed/variable cost mix. Thus, they do not know where, interms of prices and revenues, their most efficient output levels might be. Optimal ormaximum class sizes are normally determined by factors other than costs. For instance, atLiberal Arts College, with few exceptions, faculty members on their own decide the optimalor maximum size of their classes, advisement sections, and tutorial arrangements. This is fine
172
211

Other Costing Topics and Issues Involved in Developing a Comprehensive Costing System
if it can be afforded. Perhaps especially for analyzing alternative cost effects of this type ofbehavior, marginal-cost analysis is indispensable for long-range planning.
Figure 8.5: Alternative Marginal Cost CalculationPart A: Variable Costs Increase With Output, Fixed Costs Remain Unchanged
QuantityProduced
(A)
TotalFixedCosts
(B)
TotalVariable
Costs(C)
TotalCosts
(D)
AverageFixedCosts(E)
AverageVariable
Costs(F)
AverageTotalCosts(G)
MarginalCosts(H)
100 $10,000 $500 $10,500 $100.00 $5.00 $105.00 $0.00200 10,000 750 10,750 50.00 3.75 53.75 2.50300 10,000 1,000 11,000 33.33 3.33 36.67 2.50400 10,000 1,250 11,250 25.00 3.13 28.13 2.50500 10,000 1,500 11,500 20.00 3.00 23.00 2.50600 10,000 1,750 11,750 16.67 2.92 19.58 2.50700 10,000 2,000 12,000 14.29 2.86 17.14 2.50800 10,000 2,250 12,250 12.50 2.81 15.31 2.50900 10,000 2,500 12,500 11.11 2.78 13.89 2.50
1,000 10,000 2,750 12,750 10.00 2.75 12.75 2.50
Notable Columns: B: Fixed costs remain constant throughout.
C: Variable costs increase by $250 at each level of quantity produced.
D: Total costs increase at rate of variable costs.
H: Marginal costs are constant.
Part B: Fixed Costs Increase Periodically as Output Increases
QuantityProduced
(A)
TotalFixedCosts
(B)
TotalVariable
Costs(C)
TotalCosts
(D)
AverageFixedCosts(E)
AverageVariable
Costs(F)
AverageTotalCosts
(G)
MarginalCosts(H)
100 $10,000 $500 $10,500 $100.00 $5.00 $105.00 $0.00200 10,000 750 10,750 50.00 3.75 53.75 2.50300 10,500 1,000 11,500 35.00 3.33 38.33 7.50400 10,500 1,250 11,750 26.25 3.13 29.38 2.50500 11,000 1,500 12,500 22.00 3.00 25.00 7.50600 11,000 1,750 12,750 18.33 2.92 21.25 2.50700 11,500 2,000 13,500 16.43 2.86 19.29 7.50800 11,500 2,250 13,750 14.38 2.81 17.19 2.50900 12,000 2,500 14,500 13.33 2.78 16.11 7.50
1,000 12,000 2,750 14,750 12.00 2.75 14.75 2.50
Notable Columns: B: Fixed costs increase at every second interval of quantity produced.
C: Variable costs as in Part A.
H: Marginal costs rise when fixed costs rise.
173 212

Cost Accounting in Higher Education
Part C: Fixed Costs Increase Significantly at Intervals of Output;Variable Costs Increase at Declining Rate
QuantityProduced
(A)
TotalFixedCosts
(B)
TotalVariable
Costs(C)
TotalCosts
(D)
AverageFixedCosts(E)
AverageVariable
Costs(F)
AverageTotalCosts(G)
MarginalCosts(H)
100 $10,000 $500 $10,500 $100.00 $5.00 $105.00 $0.00200 10,000 850 10,850 50.00 4.25 54.25 3.50300 10,000 1,125 11,125 33.33 3.75 37.08 2.75400 20,000 1,355 21,355 50.00 3.39 53.39 102.30500 20,000 1,535 21,535 40.00 3.07 43.07 1.80600 20,000 1,660 21,660 33.33 2.77 36.10 1.25700 30,000 1,725 31,725 42.86 2.46 45.32 100.65800 30,000 1,730 31,730 37.50 2.16 39.66 0.05900 30,000 1,735 31,735 33.33 1.93 35.26 0.05
1,000 40,000 1,740 41,740 40.00 1.74 41.74 100.05
Notable Columns: C: Fixed costs increase significantly at 400, 700, and 1,000 units of output; more dramatic than Part 13.
H: Marginal costs rise, then fall, then rise, etc., as fixed costs are added.
Conclusions
When fixed costs remain the same over increasing levels of output, marginal costs are a function of or vary withvariable costs.
When fixed costs increase periodically with rising output, economists see this phenomenon as a change in the productionfunction or a change in long-run costs.
The column H behavior is typical for instructional costs in higher education; please see Figure 8.6, following.
If column H were plotted as a curve, it would be called a planning curve.
In conclusion, the following three exhibits provide some additional insights into theconditions under which the slope of marginal costs change. Figure 8.5 illustrates threedifferent cost scenarios, each leading to its particular marginal costs. Figure 8.6 traces adepartment's costs over time as staff is added under rising enrollments. Figure 8.7 comparesa limited cost scenario with the related changes in marginal revenues.
External Costing Mandates
External costing mandates are not always in the best financial interest of institutions, most notablywhen the mandates favor the external agencies that provide the funds. Office of Management andBudget Circular A-21 and similar government regulations are the clearest examples. Anotherexample is the imposition of Cost Accounting Standards Board (CASB) rules on certainuniversities whose federally funded research grants and contracts meet certain requirements.
Every extra layer of rules complicates internal costing, especially if the imposed rules aredifferent from the ones the institution would choose for its most sophisticated internal costaccounting needs. The preceding chapters contained numerous examples where the cost resultschanged when different cost allocation rules were implemented. While external mandates can beperceived as financially harmless, there is a near-unanimous consensus that Circular A-21 and
213 174

Other Costing Topics and Issues Involved in Developing a Comprehensive Costing System
CASB may not affect revenues adversely, but may require excessively burdensome proceduresand thus may increase costs.
Figure 8.6: Marginal Costs in an Academic Department Implementing a 15:1Student/Faculty Ratio
FTEsRatio
FTEs/Faculty Activity
Additionto Fixed
CostFixed CostsCumulative
VariableCosts
TotalCosts
Change inTotal
Costs/Changein FTEs
1 1 to 1 HireAssistant
$32,000 $32,000 $5,000 $37,000 $ 0
2 2 to 1 0 32,000 5,030 37,030 30
3 3 to 1 0 32,000 5,060 37,060 30
4 4 to 1 0 32,000 5,090 37,090 305 5 to 1 0 32,000 5,110 37,110 206 6 to 1 0 32,000 5,130 37,130 207 7 to 1 0 32,000 5,150 37,150 20
8 8 to 1 0 32,000 5,170 37,170 209 9 to 1 0 32,000 5,190 37,190 20
10 10 to 1 0 32,000 5,210 37,210 2011 11 to 1 0 32,000 5,220 37,220 10
12 12 to 1 0 32,000 5,230 37,230 10
13 13 to 1 0 32,000 5,240 37,240 10
14 14 to 1 0 32,000 5,250 37,250 10
15 15 to 1 0 32,000 5,260 37,260 10
16 16 to 2 HireAssociate
42,000 74,000 8,350 82,350 45,090
17 17 to 2 0 74,000 8,400 82,400 50
18 18 to 2 0 74,000 8,450 82,450 50
19 19 to 2 0 74,000 8,500 82,500 50
20 20 to 2 0 74,000 8,550 82,550 50
25 25 to 2 0 74,000 8,750 82,750 4030 30 to 2 0 74,000 8,950 82,950 4035 35 to 3 Hire
Assistant31,000 105,000 12,550 117,550 6,920
40 40 to 3 0 105,000 13,550 118,550 20045 45 to 3 0 105,000 14,600 119,600 210
50 50 to 4 HireAssistant
38,000 139,000 27,950 166,950 9,470
60 60 to 4 0 139,000 29,900 168,900 195
70 70 to 4 0 139,000 32,800 171,800 290
80 80 to 5 HireAssistant
35,000 174,000 34,700 208,700 3,690
90 90 to 6 HireAssistant
32,000 206,000 36,600 242,600 3,390
100 100 to 6 Hire Teach 12,500 218,500 38,400 256,900 1,430
110 110 to 7 Hire Teach 15,000 233,500 40,000 273,500 1,660
Note: This table illustrates several interesting facts about marginal cost behavior: Firs , marginal costs increase whenever fixed costs take aleap. Second, marginal costs also increase whenever the growth of variable costs accelerates. Third, the average revenue requirement or pricedecreases with rising enrollment, but jumps when fixed costs increase. Conclusion: For long-range planning, it is important to know how totalfixed costs and total variable costs behave and why they behave as they do.
175 214
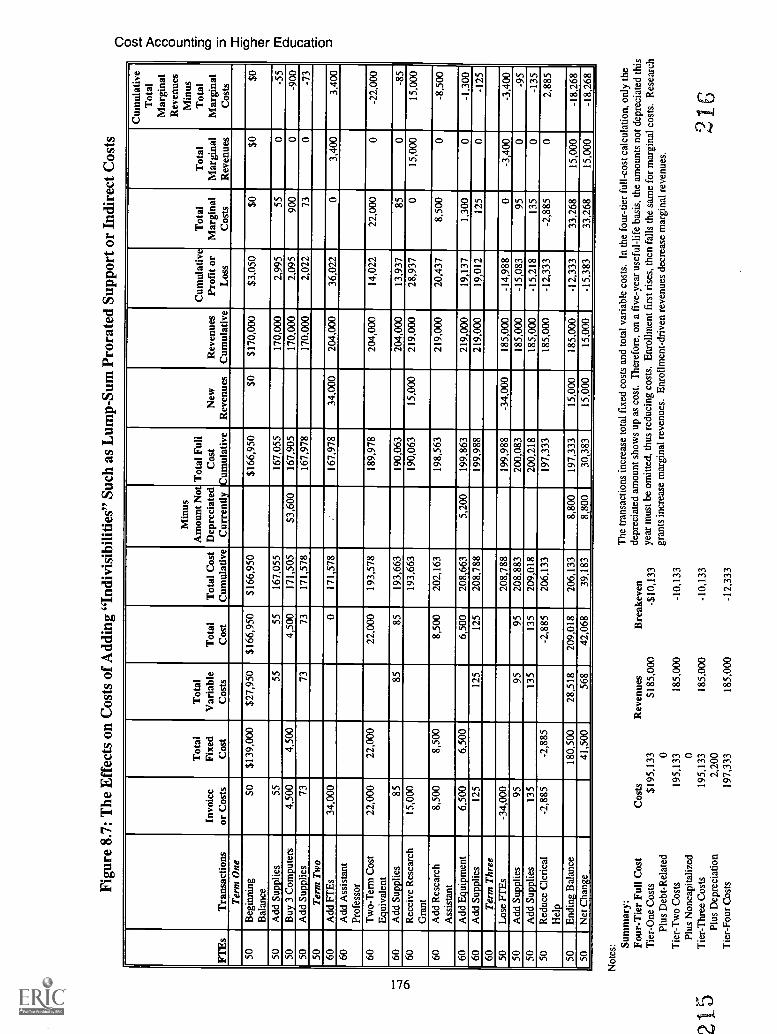
Figu
re 8
.7: T
he E
ffec
ts o
n C
osts
of
Add
ing
"Ind
ivis
ibili
ties"
Suc
h as
Lum
p-Su
m P
rora
ted
Supp
ort o
r In
dire
ct C
osts
FTE
sT
rans
actio
nsIn
voic
eor
Cos
ts
Tot
alFi
xed
Cos
t
Tot
alV
aria
ble
Cos
tsT
otal
Cos
tT
otal
Cos
tC
umul
ativ
e
Min
usA
mou
nt N
otD
epre
ciat
edC
urre
ntly
Tot
al F
ull
Cos
tC
umul
ativ
eN
ewR
even
ues
Rev
enue
sC
umul
ativ
e
Cum
ulat
ive
Prof
it or
Los
s
Tot
alM
argi
nal
Cos
ts
Tot
alM
argi
nal
Rev
enue
s
Cum
ulat
ive
Tot
alM
argi
nal
Rev
enue
sM
inus
Tot
alM
argi
nal
Cos
tsT
erm
One
50B
egin
ning
Bal
ance
$0$1
39,0
00$2
7,95
0$1
66,9
50$1
66,9
50$1
66,9
50$0
$170
,000
$3,0
50$0
$0$0
50A
dd S
uppl
ies
5555
5516
7,05
516
7,05
517
0,00
02,
995
550
-55
50B
uy 3
Com
pute
rs4,
500
4,50
04,
500
171,
505
$3,6
0016
7,90
517
0,00
02,
095
900
0-9
0050
Add
Sup
plie
s73
7373
171,
578
167,
978
170,
000
2,02
273
0-7
350
Ter
m T
wo
60A
dd F
TE
s34
,000
017
1,57
816
7,97
834
,000
204,
000
36,0
220
3,40
03,
400
60A
dd A
ssis
tant
Prof
esso
r60
Tw
o-T
erm
Cos
tE
quiv
alen
t22
,000
22,0
0022
,000
193,
578
189,
978
204,
000
14,0
2222
,000
0-2
2,00
0
60A
dd S
uppl
ies
8585
8519
3,66
319
0,06
320
4,00
013
,937
850
-85
60R
ecei
ve R
esea
rch
Gra
nt15
,000
193,
663
190,
063
15,0
0021
9,00
028
,937
015
,000
15,0
00
60A
dd R
esea
rch
Ass
ista
nt8,
500
8,50
08,
500
202,
163
198,
563
219,
000
20,4
378,
500
0-8
,500
60A
dd E
quip
men
t6,
500
6,50
06,
500
208,
663
5,20
019
9,86
321
9,00
019
,137
1,30
00
-1,3
0060
Add
Sup
plie
s12
512
512
520
8,78
819
9,98
821
9,00
019
,012
125
0-1
2560
Ter
m T
hree
50L
ose
I-1.
Es
-34,
000
208,
788
199,
988
-34,
000
185,
000
-14,
988
0-3
,400
-3,4
0050
Add
Sup
plie
s95
9595
208,
883
200,
083
185,
000
-15,
083
950
-95
50A
dd S
uppl
ies
135
135
135
209,
018
200,
218
185,
000
-15,
218
135
0-1
3550
Red
uce
Cle
rica
lH
elp
-2,8
85-2
,885
-2,8
8520
6,13
319
7,33
318
5,00
0-1
2,33
3-2
,885
02,
885
50E
ndin
g B
alan
ce18
0,50
028
,518
209,
018
206,
133
8,80
019
7,33
315
,000
185,
000
-12,
333
33,2
6815
,000
-18,
268
50N
et C
hang
e41
,500
568
42,0
6839
,183
8,80
030
,383
15,0
0015
,000
-15,
383
33,2
6815
,000
-18,
268
Not
es: Su
mm
ary:
Four
-Tie
r Fu
ll C
ost
Cos
tsR
even
ues
Bre
akev
enT
ier-
One
Cos
ts$1
95,1
33$1
85,0
00-$
10,1
33Pl
us D
ebt-
Rel
ated
0T
ier-
Tw
o C
osts
195,
133
185,
000
-10,
133
Plus
Non
capi
taliz
ed0
Tie
r-T
hree
Cos
ts19
5,13
318
5,00
0-1
0,13
3Pl
us D
epre
ciat
ion
2,20
0T
ier-
Four
Cos
ts19
7,33
318
5,00
0-1
2,33
3
The
tran
sact
ions
incr
ease
tota
l fix
ed c
osts
and
tota
l var
iabl
e co
sts.
In
the
four
-tie
r fu
ll-co
st c
alcu
latio
n, o
nly
the
depr
ecia
ted
amou
nt s
how
s up
as
cost
. The
refo
re, o
n a
five
-yea
r us
eful
-lif
e ba
sis,
the
amou
nts
not d
epre
ciat
ed th
isye
ar m
ust b
e om
itted
, thu
s re
duci
ng c
osts
. Enr
ollm
ent f
irst
ris
es, t
hen
falls
the
sam
e fo
r m
argi
nal c
osts
. Res
earc
hgr
ants
incr
ease
mar
gina
l rev
enue
s. E
nrol
lmen
t-dr
iven
rev
enue
s de
crea
se m
argi
nal r
even
ues.
2 1
G

Other Costing Topics and Issues Involved in Developing a Comprehensive Costing System
An Alternative to Traditional Cost-Recovery Accounting
An interesting response to the Circular A-21 dilemma is the Phoenix plan, a proposedindirect-cost-recovery procedure that would replace the present cumbersome negotiatedreimbursement system with one that uses fixed-rate cost allowances.? These cost-allowancerates would of course depend on certain key cost definitions. The quite revolutionaryPhoenix plan would simplify cost-recovery accounting and relegate it to the special-casestatus it deserves. Above all else, it or any similar simplified system of cost recovery wouldeliminate the need for what in many universities is now a second full-fledged cost accountingsystem. At this writing, the Phoenix plan is very much in the exploratory and developmentalstage and, like any new idea, has already received criticism from institutions that prefer thestatus quo.
Costs and Total Quality Management
As organizations become larger and more complex, it is more difficult to ensure uniformquality in the products and services offered for sale. The concept of statistical quality controlarose to a large extent as a means of minimizing the number of defective products and thecommensurate costs resulting from scrapping them. As production processes became morefully automated, the danger increased for design flaws to be multiplied manifold, often atenormous cost. Massive product recalls in the automobile industry are a classic illustration ofthis phenomenon.
Every generation of managers, management consultants, and organization theorists feelsthat it must put its own unique stamp on the world around it. The emergence in the 1980s ofthe concept of total quality management (TQM) in business and higher education may be acase in point, since the ideas of quality control and of managing for quality were certainly notentirely new at the time.8 The new focus in TQM was on at least four factors:
Customer satisfaction and customer relationsTeamworkMeasurement of resultsContinuing efforts at quality maintenance and improvement
Customer satisfaction is central to TQM. In all highly competitive situations, customerscan be lost even if product or service quality is unimpaired. How and how timely productsreach customers are important concerns. Is product or service differentiation real or only afigment of the institution's imagination? In TQM, the concept of the customer is expanded tomean external as well as any internal users of an organization's services. The term "total" inTQM means that every activity within an organization must be touched by the managementof quality.
Since colleges and universities incessantly maintain that they manage quality, TQMshould not really be all that novel. But since quality in education is difficult to measure,maximizing service quality within the context of optimal costs may be especially difficult in
177
217

Cost Accounting in Higher Education
higher education. Another obstacle to fully implemented TQM is the very decentralizednature of executive decision making.
Most service-rendering activities are based on teamwork, and ensuring service qualityrequires that one pay attention to how well teams perform. TQM could just as well be called"team quality management." But how do you determine whether or not a team performswell? A vast and growing literature is devoted to this and related questions. One recurringtheme is that one must set objectives and develop performance indicators and measures. As aresult, TQM is becoming highly quantitative, a fact that can create difficulties in serviceorganizations where service quality is often intangible. Nevertheless, the focus must be onperformance measures, and costing is a major measurement technique in TQM.
Total Quality Management Equals Total Cost Management
The types of costing most relevant here are those described in chapters 6 and 7, especiallycosting tasks designed to achieve cost-effective management results throughout theorganization. TQM equals total cost management. The emphasis is on cost-effectiveness andnot necessarily on minimizing costs per se. The goal is to reach the cost level that best helpsachieve the organization's objectives and mission.
Therefore, how costs are managed throughout the organization is central to TQM inhigher education and elsewhere. It is not sufficient that a few segments within an institutionpay attention to cost-effective and customer-centered management of service quality,although that might be a start. The principal objective is that such management permeate theentire enterprise. If not, there is no TQM or total cost management.
Finally, TQM, like total cost management, must not only be a systemwide effort, but mustbe a continuous effort, unless the point of perfection has been reached. Absent such an ideal,TQM, like total cost management, requires detailed and dynamic planning. If total costmanagement is to take place within a TQM environment, every department, every manager,and every work team must know what it is supposed to accomplish, how specific objectivesare to be achieved, how goal achievement will be measured, and perhaps most important,how individual and team efforts will be rewarded.
Conclusion
This manual focuses exclusively on different aspects of descriptive costing and on themany different answers that are possible when institutions try to determine the cost of aparticular activity. Every organization must first learn to identify the costs of rendering itsservices, but it dare not stop there. It must continually ask itself what are the right costs. Andthere is no single answer to this question.
An extensive literature and numerous networks of professional expertise exist within andoutside of higher education that can assist institutions in how to improve their total cost
1918

Other Costing Topics and Issues Involved in Developing a Comprehensive Costing System
management efforts. The many costing examples mentioned testify to the fact that collegesand universities are well into aggregate and activity costing. The literature also makes clearthat many useful costing concepts do not originate in higher education. Whenever this is thecase, adaptation to higher education may be neither easy nor always possible.
It is rather trite to say that institutions should develop a total cost management plan, butwithout a plan it may be difficult to know whether the various costing efforts permeate theentire institution and whether they have a common objective. At a certain level, many highereducation costing efforts seem to concentrate on nothing more than on staying withinapproved budgets. Most college and university budgets probably represent less the result of aTQM-driven total cost management effort than they do the result of a sometimesoverwhelmingly political process. For better or worse, budgets represent an institution'sbusiness plan that tells all involved what costs will be. To the extent to which institutions canbring a TQM dimension to budgeting, they will also enhance the quality of total costmanagement.
Who Is Responsible for Cost Analysis?
Even the most highly sophisticated, whiz-bang, multiple-algorithm, cost-crossover marvelof an accounting system tells us nothing about how well, but only how, resources are beingused. The design of a sound cost accounting system that furthers the cost-effectivedeployment of resources requires, among other things, a comprehensive activities-costingplan. Such a plan originates with an inventory of existing costing tasks and models. Fromsuch an inventory, the plan expands to include any missing costing endeavors and setspriorities of when and how these will be added to the overall system. This may bring us backto total cost management and TQM and to how each institution weaves the fabric of all of its
myriad costing tasks. Regardless of their quantitative importance, how one allocates indirectcosts is a secondary issue, but obviously included in the plan.
Depending upon the nature, size, and complexity of the institution, the professionals incharge of costing and planning the design of cost accounting may be the chief executive,academic or financial vice presidents, the provost, an academic dean, or some team chargedwith the task. When one studies the literature, some of the best thoughts have come from theacademic side and from persons engaged in institutional research.
Because so much costing occurs at the operational level, non-academic department headsand their staffs carry out many of the most substantive and effective costing tasks. Often verylittle is known within the institution about these projects. Institutions place a lot of faith intheir personnel, expecting that the "right" things will be done and that good cost decisionswill be made. In planning a comprehensive cost accounting system, these discrete costingprojects are often the most difficult to identify.
Finally, the solution may not lie in a grand scheme, but in a plan that embodies incentivesfor managers to identify and undertake the costing tasks that support the institution's moststrategic and tactical current and near-term decisions. Strategic decisions point to where theinstitution is heading; tactical decisions indicate how it gets there. Cost accounting shouldserve both dimensions, but without overburdening the institution. Therefore, a practical plan
179
2 9

Cost Accounting in Higher Education
will select key costing thrusts and will not try to do so much that in the end nothing getsaccomplished.
Questions With Financial Policy Implications
Some of the financial policy considerations involving the costing of any institutional sub-component are the following:
How to distinguish between, variable, fixed, and marginal costsHow to distinguish between operating and capital costsWhen defining capital costs, how to formulate realistic depreciation or capital-useallowance policiesHow far to go in promoting full costing and when not to do itWhen allocating direct and indirect costs, which allocation bases to chooseWhich and how fully to allocate support costs to primary programs, in specificapplications and in the aggregate, under the new SFAS No. 117 rulesWhich activities to subject to continuing cost-effectiveness analysisHow to monitor those who are charged with the cost-effective allocation of resources
This manual has touched on most of these issues. One principal aim has been to show thatthere are different ways in which the cost of a given cost center can be determined and thateach way usually results in a different cost outcome. The manual also suggests that the term"activity" can have different meanings and that "activity costing" can have either a verynarrow meaning or can involve very complex daily operations. Today we know more aboutthe costs of very narrowly defined activities and less about those involving complexinteractions among academic and administrative support departments. Increasingly, the moreinteresting costing tasks concern the latter.
Among the financial policy questions listed above, one could have included thedistinction between direct and indirect costs. From the point of view of cost-effectiveresource allocation, knowing which are direct and which are indirect is not very helpful,however preoccupied colleges and universities have been with this distinction. What mattersis how much personnel is being used in an activity and which departments contribute thepersonnel and at what cost. Beyond personnel, what matters also is the cost of allnonpersonnel resources needed. And finally, what matters is the nature and amount of thecapital resources that come into play for each activity.
At present, macro-cost accounting, rather than activity costing, dominates college anduniversity costing practice. This has made a virtue out of cost pooling, which is essentially aneconomy measure. Massive cost pooling makes the full costing of activities imprecise andrather more complicated than it needs to be. While macro-costing is where the budget gamesare played, micro-costing is where one can determine whether resources are used well.Micro- and activity costing are the future of college and university costing, because macro-costing and cost pooling reveal little about how cost-effectively resources are being used.Ideally, governing board members would like to be assured that activities are managed in acost-effective manner so that the descriptive macro-cost reports indeed reflect the cost-effective use of the institution's resources at the grass roots.
180
220

Other Costing Topics and Issues Involved in Developing a Comprehensive Costing System
Notes1. Office of Management and Budget, Cost Principles for Educational Institutions, OMB
Circular A-21. Reprinted in James L. Feldesman, Jacqueline C. Leifer, and Michael B.Glomb, eds., Federal Auditing Information Service for Higher Education (Washington,D.C.: NACUBO, 1994).
2. NACUBO and NCHEMS, Procedures for Determining Historical Full Costs: The CostingComponent of the Information Exchange Procedures., 2nd ed., Technical Report 65(Washington, D.C.: NACUBO and Boulder, Colo.: NCHEMS, 1977). NACUBO andNCHEMS, Costing for Policy Analysis (Washington, D.C.: NACUBO, 1980).
3. Charles T. Horngren and George Foster, Cost Accounting: A Managerial Emphasis(Englewood Cliffs, N.J.: Prentice Hall), chapter 21.
4. NACUBO and NCHEMS, "Drake: Instructional Capacity," chapter 5 in NACUBO andNCHEMS, Costing for Policy Analysis.
5. Stephen A. Hoenack et al., "The Marginal Costs of Instruction" in Research in HigherEducation 24:335.
6. NACUBO and NCHEMS, Costing for Policy Analysis, 43.7. "Progress Report on the Phoenix Project," internal memorandum for Council on
Governmental Relations, September 28, 1995. "A New Concept in Indirect Costs: ThePhoenix plan," draft memorandum for Ad Hoc Group of University Business Officers,May 21, 1995.
8. See Dennis C. Kinlaw, Continuous Improvement and Measurement for Total Quality (SanDiego, Calif.: Pfeiffer & Co., 1992).
181
221

Appendix A ---
Basic Costing Concepts and Principles
The literature on costing is vast, and college and university administrators and managersare by and large well-acquainted with those of its elements directly related to their areas ofresponsibility. A summary of basic concepts and principles are presented in this appendixand may be of interest to less expert readers.
Types of Costs in Cost Accounting
Hyatt's A Cost Accounting Handbook for Colleges and Universities and College andUniversity Business Administration defines several cost concepts in use in higher education.'The first distinction is between "economic" and "accounting" or "explicit" costs.
Economic Costs
Economic costs are defined as the dollar value of the resources used in the production ofgoods or the rendering of services plus the value of the alternative outcomes given up, calledopportunity costs. Opportunity costs are also associated with forgone profits, forgoneinvestment return, or forgone revenues. In higher education, they often refer to income notrealized, as well as to educational programs (i.e., courses, research projects) not undertaken.
Higher education opportunity costs are not easily quantified. In the face of competinginvestment alternatives, it may be difficult to identify which specific opportunity has beensacrificed. It may be more practical to see opportunity costs as a forgone return oninvestment, which can be quantified. On the whole, the topic of opportunity costs for highereducation activities is not only complex but, for practical costing purposes, quite intractable.In spite of numerous references to the subject, an authoritative theory does not exist on howto apply the opportunity cost concept systematically to higher education.2
183
222

Cost Accounting in Higher Education
Explicit Accounting Costs
Economists like to think that their definition of costs is the most precise, with or withoutopportunity costs. In practice, however, even their explicit-cost concept--resources actuallyused and/or used upcan have diverse meanings within higher education. A final economiccost figure depends on management's choice of definitions, on the values given to differenttypes of assets used in the production process, on the specific costing conventions adopted,and on the ever-changing cost accounting requirements imposed by laws, regulatoryagencies, providers of funds, and cost accounting standard-setting bodies.
The costing applications described in this manual are limited to the explicit costsidentified by the institution's cost accounting management information system (MIS). Ingeneral, these costs equal the historical values of the resources used or used up in therendering of the institution's services.
Inflation introduces one of many complications to costing. Historical values of long-livedphysical resources are less than the cost of replacing them. Some institutions are usingreplacement values instead of historical values for some of their costing applications. Othersare including provisions for inflation in long-range purchasing and employment contractswhen future costs must be reflected in current costing applications. While the historical costaccounting MIS database predominates in higher education costing, some applications mayhave to take into account the cost of inflation.
The Most Commonly Used Explicit-Cost Typesin Higher Education
Among the many different types of explicit accounting costs, the following are usedthroughout this manual:
Variable costs are costs that vary with changes in enrollment, sales, or output.
Fixed costs are costs that do not change with changes in enrollment, sales, or output.
Total costs (TC) are the sum of variable plus fixed costs.
Average costs (AVC) are total costs divided by some measure of output q; normallyexpressed by the equation AVC = TC/q. Also called mean or unit costs.
Marginal costs (MC) represent the change in total costs resulting from a correspondingchange in output; normally expressed by the equation MC = dTC/dq, where d standsfor change.
Direct costs are costs clearly caused by or associated with a specific cost objective oractivity.
Common or shared costs are costs associated with somethinga piece of equipment, aclassroomused by two or more cost centers. Sometimes called indirect costs.
184
223

Appendix A
Pooled costs are costs which the accounting system records in one account or poolrather than allocating them to individual cost centers. Both direct and indirect costs canbe pooled.
Indirect costs are all institutional costs not directly caused by or associated with aspecific activity or program.
Overhead costs are costs such as utilities, custodial services, certain types of insurance,supplies, and general maintenance without which a specific activity or program couldnot be carried out properly. Some overhead costs are direct and others are indirect.
Cost center or cost objective is an entity, program, or activity whose cost is to bedetermined.
Joint costs result when a given cost input or process yields two or more outcomes.
Costing as Art Rather Than Science
In spite of a near general consensus on basic cost concepts and costing standards, collegeand university costing practices still are more art than science. Behind the veil ofpromulgated standards and mandates, a lively costing practice exists that is distinguished byits lack of uniformity. This is not an indictment. On the contrary, the current state of costingtestifies to a dynamic search within higher education for ever more-precise answers to a vastlist of cost questions. In their costing practices as well as in the pursuit of their missions,institutions tend to look out for their own interests. They should not be blamed when they gotheir own way, where they are permitted to do so, if their financial policy preferences requirea unique approach.
Costing practice is highly developed at many colleges and universities, especially amongthose who depend in significant ways on current revenues from indirect cost recovery. Forsuch institutions, cost recovery is more than a financial indicator. It is a proxy for their verycharacter, the image of quality they project, and the special role some of that research playsin the fortunes of the nation.
Prowess in cost-recovery accounting is no guarantee that other costing endeavors arehandled well. Institutions that are deeply absorbed in research-related indirect-cost-recoverycosting may still be limited in how far sound costing practices reach into the remainder oftheir enterprise: the cost-effective allocation of resources. Even more fundamental is thatsome cost-recovery costing standards and mandates are not an appropriate basis for aninstitution's overall costing efforts.
Institutions should have a clear financial policy basis for their costing efforts. In thissense, many institutions admit openly to a lack of costing expertise. Actually, very little isknown about how well colleges and universities carry out their costing tasks. Moreimportant, perhaps, even less is known of any beneficial effects costing has on how collegesand universities allocate their resources.
185
224

Cost Accounting in Higher Education
Limited Suitability of the By-FunctionChart of Accounts in Costing
It is no secret that the by-function financial accounting system that colleges anduniversities use for budgeting and financial reporting has never been suitable by itself forcosting tasks that assist in the cost-effective allocation of resources. Such costing tasksrequire a highly developed and often specialized micro-cost accounting MIS.
Macro-costing is essentially descriptive and was never intended to reveal whether or notresources are used efficiently. The by-function accounting system, even if modified by SFASNo. 117, is inadequate for this purpose. A major challenge is to choose the best among thenumerous cost allocation possibilities, and the appropriate choice is closely related to thedegree of precision one expects from a particular costing task.
Degrees of Precision in Macro-Costing
In computing the types of macro-costs implied by the charts of accounts shown in chapter1, even the most highly developed cost accounting MIS leaves ample room for doubtconcerning the degree of costing precision that can or should be achieved. Even generallyaccepted or mandated costing standards offer no guarantee of uniform or consistent costresults.
Other things being equal, mandated costing standards--those promulgated in OMBCircular A-21, for exampleshould theoretically lead to uniform costs. But this is not thecase in most current applications. Generally accepted costing standards, often vaguer thanmandated ones, tend to leave much to the costing practitioner's imagination and discretion.Vagueness in costing standards is a natural phenomenon and should not come as a surprise.
Figure A.1 illustrates varying degrees of vagueness and precision in the formulation of agiven costing standard.
4
Figure A.1: Range of Precision in Costing Standards with Examples ofStandard Descriptions
A
Full costs must includea provision for the costof physical facilities.
B
The full cost of capitalshould distinguishbetween the useful lifeof equipment and thatof buildings.
225186
C
The useful life ofequipment should beno more than X and noless than Y years; andthe useful life ofbuildings should be noless than Z and nomore than W years.
D
The useful life ofequipment should be6.67 percent ofhistorical cost per year,and 2 percent per yearfor plant (50 years ofuseful life).

Appendix A
At one extreme, A is a relatively benign and an obviously flexible requirement. At theother extreme, D, the standard is explicit and non-negotiable. In many costing applications,costing practitioners must invent their own rules or standards.
Allocation practices are fertile ground for differences in approaches that cause differencesin costs. If one wants precision in costs, one first needs precision in the decision rules thatguide the costing effort. And if one wishes to compare costs among institutions, the costingrules used by the participants must be as nearly identical as possible.
In cost accounting for both business and higher education, precision comes at a price.Costing in general should be carried out in an economically feasible or reasonable manner.The idea of cost pools was invented for this reason. Rather than detailed tracking,accountants long ago looked for methods that help distribute portions of a pooled stream ofcosts to the numerous cost centers.
Rather than settling for a free-for-all, the profession began to favor the adoption ofallocation standards. So it is within these standards that one must look for the highestprecision in costs. But data processing has advanced rapidly during the last two decades, andthe pace of change is accelerating. Therefore what was economically onerous only a fewyears ago may now be well within an institution's technical and financial capabilities. Costallocation principles discussed in chapters 4 through 7 illustrate this point.
In Whose Interest Are Costing Standards Promulgated?
Externally imposed standards are not always in an institution's best financial interest. Forinstance, Circular A-21's rules are intended not so much to help maximize institutional costrecovery, as to help contain the government's reimbursement costs. Many federal agencies
that promulgate cost-recovery rules for colleges and universities often apply moregenerousfinancially more rewardingstandards to for-profit enterprises. Private funders ofresearch and sponsored college and university activities may also have more liberal standardsthat safeguard institutional financial integrity.
Other external standards are designed to enhance cost comparability among institutions. A
lack of precision or consistency in the inter-institutional application of standards and costdefinitions can defeat this objective. For meaningful intercollegiate cost comparisons,standard uniformity may not be enough: The underlying financial policy directives may alsohave to be the same. Depreciation cost accounting is a prime area where the absence of aprecise standard may make cost comparison meaningless or at least less useful.
While costing standards serve higher education as a whole, institutions should apply themwithout sacrificing their most enlightened self-interest.
226187

Cost Accounting in Higher Education
The Difference BetweenFor-Profit and Not-For-Profit Cost Accounting
Textbooks on cost accounting are written principally from the perspective of for-profitmanufacturing enterprises and increasingly from that of for-profit service enterprises. Beyondthe sources mentioned here, no comprehensive formal textbooks exist on college anduniversity costing. Moreover, formal cost accounting textbooks tend to be lengthy tomes,touching on many intricate details. While taking at least a moderate textbook approach, thismanual is quite selective.
Not-for-profit accounting is in some respects different from business accounting.Noteworthy are the different perspectives public and independent institutions bring to thetask of accounting in general and to cost accounting in particular. A major deviation fromfor-profit accounting is the absence of a clear bottom-line concept that acts as a financialperformance measure. SFAS No. 117 corrects this deficiency significantly, but still does notachieve a clear bottom line. The requirement by governing boards on management to balancethe budget is obviously not a very precise financial goal. Yet, whatever real or imagineddifferences there may be, not-for-profit cost accounting is fundamentally the same as for-profit cost accounting. The same basic cost concepts and costing principles discussed in textson for-profit business cost accounting apply to not-for-profit activities in general and tocolleges and universities in particular.
Sometimes, applying for-profit costing principles to higher education will prove to bemore difficult if not controversial. The chief difficulty lies in how one defines highereducation products and outcomes, but this is not of concern in macro-costing.
From Where Do Costs Get Their Meanings?
Costs derive their meanings from the law, from evolving industry consensus, and throughexperimentation.
Costs Are Legal Fictions
In practice, every costing endeavor is based on arbitrary, more or less precise, andfrequently discretionary definitions and interpretations. A basic reason is that all economicfacts are first and foremost legal "fictions." In modern society, no economic event existswithout an underlying legal context. This context changes continuously. Higher educationhas experienced several such changes in recent years. Three of the most striking recentexamples are (1) the requirement for the independent not-for-profit sector to accountformally for the depreciation of long-lived assets, (2) the recent changes in SFAS No. 117,and (3) the latest changes for Circular A-21.3 One of the most famous (or infamous) legalfiction examples is, of course, Circular A-21 itself.
Among those promulgating "legal accounting and cost fictions," the following stand out:the Government Accounting Standards Board (GASB), the Financial Accounting Standards
lb 7

Appendix A
Board (FASB), the Cost Accounting Standards Board (CASB), the American Institute ofCertified Public Accountants (AICPA), the Department of Defense (DOD), the Departmentof Health and Human Services (DHHS), the Internal Revenue Service (IRS), and many otherfederal, state, and private entities that issue definitions of what they mean by costs. It is notsurprising when uniformity is not always evident in the pronouncements of these bodies andthe resulting applications.
Costs As Political Tools
Legal definitions aside, many types of costs have political connotations. The underlyingcost definitions and models are not always the result of objective, logical, or scientificanalysis. And, perhaps more interesting, some costs are used as political tools.
Specific costing outcomes depend on who undertakes or supervises a given costing task.Most, if not all, costing standards are preceded by consensus-making. Consensus-making is apolitical process whose success depends on compromises and accommodation. Institutions attimes undertake cost studies that must undergo internal political accommodation. This is thecase when cost models need employee or other constituent support.
Cost data must not only be accurate in legal and mathematical terms, it must be crediblein the eyes of those affected. This means that at times managers may have to create costmodels that are not completely in tune with what other institutions are doing. Ideally,generally accepted or mandated costing methods should not be sacrificed to internal politics.In internal or external political terms, the purposes for which costing tasks are carried outmatter.
What Are the Purposes of Cost Accounting?
The following purposes, highlighted in current literature and in the original Hyatthandbook, are among the most noteworthy:
Pricing
Colleges and universities set external and internal prices. The best-known external pricesare tuition and charges for room and board. Internal prices, sometimes called "transferprices," include the various charge-backs, proratings, and transfers of costs amongdepartments. The cost information needed for a tuition pricing decision is obviously quitedifferent from that required by the plant maintenance department when it prices the repair ofa broken dormitory window.
Budgeting
Annual operating and capital budgets represent the institution's financial plans for humanand material resources to be deployed during the academic or business year. These budgetsreflect, but are not entirely identical with, the institution's current costs. Budget decisionsplay a fundamental role in whether or not available resources will be allocated in a cost-
2a&
Cost Accounting in Higher Education
effective manner. Some budgeted expendituresdebt repayment, for instanceare not costsper se. Therefore, budgets alone do not give an accurate picture of institutional costs.
Indirect Cost Recovery
Indirect costs play several roles in higher education cost accounting. The most strikingderives from the fact that indirect cost recovery is a major revenue source for an importantsegment of higher education.
Determining a research program's indirect costs is essentially a pricing decision: Howmuch should or can a project sponsor be charged for the use of personnel and facilities? Forthe nation's major research and doctorate-granting universities, indirect-cost-recovery costinghas a very high profile among the various costing purposes listed here. In the large number ofundergraduate institutions, indirect costing for cost recovery plays a minor if any role.
Cost Control and Cost Management
Cost control is a universal role of costing. This involves, among other things, acomparison of incurred costs with budgeted costs, an analyses of the causes of variancebetween the two, and decisions about likely corrective actions. In all probability, resourceallocation can always be improved, and the management of costs can reasonably beconsidered an essential and never-finished managerial task.
Long-Range Planning
Cost information is central to how institutions allocate their resources over time, changeprograms and facilities, and implement long-term missions. Strategic costing enters thepicture when institutions study alternative resource combinations and their long-termcost/benefit implications. Where current pricing and budgeting looks at costs in historicalterms, long-range planning looks at costs in terms of future and strategic consequences.
Managerial or Institutional Performance Evaluation
Costing plays an important role in testing not only how management has deployedresources, but in assessing what this deployment has accomplished. Because theeffectiveness of academic programs is not always easily quantified, academic performanceevaluation may entail complex, sometimes lengthy, and at times controversial cost studies.Whether directed toward academic or nonacademic activities, costing is one of the principaltools for corrective action. Such action, in turn, has its own future cost implications.
Total Quality Control and Total Quality Management
College and university missions are essentially qualitative endeavors. A key question ishow an institution can best use its human, material, and financial resources. On paper atleast, a given educational mission can be achieved through a variety of resource mixes. Inpractice, one must start with the mix at hand. Higher education is frequently criticized foralleged inflexibility in how it allocates resources. Examples include static faculty-to-studentratios and inflexible academic calendars.
190
229

Appendix A
Ideally, institutions will want to articulate and quantify their preferred outcomes. Theprincipal ones will be educational, but many can be expressed in financial or otherquantitative terms. Managers will try to determine the current and future costs of theseoutcomes. Then they will determine whether or not these outcomes might be achieved at lesscost. Ultimately, they must decide whether and when to implement a specific lower-costalternative. Maintaining and enhancing service quality without raising costs is a perennialchallenge. The complex task of managing both quality and costs is the concern of totalquality management.
Costing and Productivity
It has been alleged that higher education productivity has remained essentially static, thatthe relationship between resource input (costs) and institutional outcomes (benefits) has beenconstant. If this is true, has there been no change in the quality of either higher educationinputs or outputs? Are we teaching the same way today as 50 years ago? Are we teaching thesame things? Difficulties in measuring higher education productivity notwithstanding,costing can help answer important policy question that relate to educational productivity.
What Is the Difference Between Cost Accounting and CostManagement?
The overarching purpose of a sound cost accounting system is to facilitate costmanagement. Cost management requires management's understanding of what causes, agiven cost's particular level and long-range tendency. This understanding comes fromappropriate historical, structural, and substantive analyses of costs. Historical cost analysishelps identify cost indicators which are useful by-products of a sound cost accountingsystem. Managers routinely use, update, and apply them in budgeting and long-rangeplanning.
The Need for Historical Cost Data
In order to manage costs effectively, it is normally necessary to have a sense of historicalcost trends. The historical cost accounting MIS provides the data that shows changes in costsand cost structures over time, giving management a sound foundation for its decisionsaffecting current and future costs. Good data analysis of causes and effects is the basis forrational resource allocation decisions.
When accounting and costing practices undergo significant change, time series areinterrupted. When this happens, past cost data must be adjusted to show consistent andaccurate long-range cost trends.
Costing applications that center on cost-effective resource deployment are directed towardoperational micro-cost, rather than macro-cost, issues. When institutions begin detailedoperational cost studies, they do not always have at hand the financial resources toimmediately develop adequate historical cost benchmarks. Over time, consistent periodic
191
230

Cost Accounting in Higher Education
cost studies create their own cumulative historical database. Expensive studies of past costsare .not always necessary and may, in the short-term, waste scarce financial and humanresources.
Cost Management and Budget Control
There is some confusion in higher education and in other nonprofit institutions about thedifference between cost management and budget control. Budget control is cost control onlywhen the many individual budget allocations are the result of prior careful costing studiesthat directly lead to a more cost-effective allocation of resources.
Management is expected to implement a least-cost or a most-cost-effective allocation of,resources. Normal budgeting processes offer no guarantee that this will be so. NACUBO'sannual awards for cost-effective resource reallocation testify to the fact that certain costingefforts can affect budgets dramatically. Nevertheless, an institution's claim that it operatescost-effectively because it meets its budget target should be accepted skeptically; there isprobably ample room for improvement. Many higher education budgeting practices resemblethose of governments and thus do not always inspire confidence when it comes tominimizing costs.
Therefore, controlling the budget is cost management to a limited degree only. Costmanagement means making the best resource allocation decisions before appropriating thenuMerous. object line item budgets. Once budgets have been agreed upon, costs areessentially "in the bag." Institutions which are preoccupied with budget control may misscrucial opportunities for cost management.
Cost Accounting, Cost Management, and the Organization Chart
Cost accounting is normally seen as a subset of an institution's general accounting work.In higher education, the accounting function tends to be the responsibility of the chiefbusineSs or finance officer. In contrast, the cost management function is normallydecentralized across all operating departments and budgets. While the accounting office mayplay a role in most cost studies, many are the responsibility of and originate with the variousoperating and academic units. Provosts, academic vice presidents, and deans manage andcontrol an enormous range of human and physical resources and thus determine and controlcosts. How cost- effective are their management decisions?
Higher education traditionally distinguishes between two broad cost management areas:academic programs and services and all nonacademic activities. The normal collegiate
'organizaticin chart divides' these two realms into several administrative domains, anddepending upon institutional size and complexity, may further subdivided them. A chart ofaccounts-gives at least an idea of the proliferation of costing responsibilities. In recent years,the number of individuals responsible for budget and cost management has multiplied in bothareas.
If ,one compares budget control staffing at two organizations, one a small institution andthe other a university of moderate size, the small institution, with a smaller staff and budget,has a potentially less ardimus task defining and controlling these responsibilities. Theuniversity must supervise the cost management responsibilities of many more individuals. It
192
2 31

Appendix A
is much easier to define an individual's cost management responsibilities than to ensureproper cost management in every budget responsibility center. How does one know that anindividual is qualified to manage costs beyond the relatively mundane task of staying withinbudget? A cost accounting system is not complete without safeguards that not only guaranteeproper cost controls, but also place a high value on the cost-effective allocation of resourcesthroughout the organization.
Summary
An institution's cost accounting MIS is one, if not the most important, element of its totalfinancial management information system. The cost accounting MIS is a subset of thefinancial management information system.
A sound cost accounting MIS tells management
how resources have been allocated,whether the allocation is cost-effective,what the costs of alternative resource-allocation schemes are, andhow its costs compare to those of other institutions.
Such a cost accounting MIS should be flexible. It should accommodate a variety of coststudies and costing approaches.
Cost accounting should not be undertaken for its own sake, but for the benefit ofmanagers who need decision-specific cost information. Cost accounting and costing are notdiscretionary, except perhaps in whether they ought to be developed.
While costing practice may differ between colleges and universities, between large andsmall institutions, or between public and private institutions, the ultimate test is in howaccurate costing outcomes are and in how an understanding of costs helps institutionsachieve their objectives.
Notes1. James A. Hyatt, A Cost Accounting Handbook for Colleges and Universities (Washington,
D.C.: NACUBO, 1983). Deirdre McDonald Greene, ed., College and University BusinessAdministration, 5th ed. (Washington, D.C.: NACUBO, 1992).
2. Stephen A. Hoenack and E.J. Collins, eds., The Economics of American Universities:Management, Operations, and Fiscal Environment (Albany, N.Y.: State University of NewYork Press, 1990), chapters 1, 5, and 7.
3. Statement of Financial Accounting Standards No. 117: Financial Statements of Not-for-Profit
Organizations, Financial Accounting Series No. 127-B (Norwalk, Conn.: Financial
Accounting Standards Board of the Financial Accounting Foundation, June 1993). Office ofManagement and Budget, Cost Principles for Educational Institutions, OMB Circular A-21;reprinted in James L. Feldesman, Jacqueline C. Leifer, and Michael. B. Glomb, eds., FederalAuditing Information Service for Higher Education (Washington, D.C.: NACUBO, 1994).
193
232

Appendix B
Cost Allocation Bases and Procedures
This appendix elaborates on several allocation issues discussed in the body of thismanual. Cost allocation has been defined as procedures used when pooled costs aredistributed to individual cost centers. Pooled costs are either direct or indirect costs. Highereducation and general costing literature acknowledge that many so-called indirect costs arein fact unallocated direct costs. As a result, there is increasing talk about and movementtoward maximizing the direct costing of all pooled costs.
When cost centers trade with one another, the resulting debits and credits transfer costsamong them. When two or more cost centers benefit from common services, they have toshare these costs in some proportion to the services each receives. Whenever an institutioncreates cost pools, many costing tasks require that these pooled costs be eventuallydistributed among cost centers in some fashion.
Allocation Procedures for Pooled Costs
The two principal types of cost allocation procedures are
internal pricing, charge-backs, and similar procedures, andpercentage allocation or lump-sum prorating procedures applied to pooled costs.
Variations of internal pricing are used in both direct and indirect costing. Percentageallocation and lump-sum prorating are the principal methods for allocating pooled costs.
The Market Price Base
External market prices tend to be perceived as the most equitable and most practical basisfor direct and indirect costing. They have several advantages, especially when the institutioncan negotiate discounts for large orders or can pay wholesale prices. Other advantages arethat the costs charged are credible and that managers are discouraged from bypassing thesystem in search of lower external prices.
195
233

Cost Accounting in Higher Education
One serious disadvantage is that internal suppliersnormally, purchasing departmentscannot pass on at the market price their other costs that derive directly from managing theservices or materials provided. As a result, much internal pricing tends to be markup, or cost-plus, pricing. The supplier transfers not only a cost equal to the market price of a product orservice, but adds a supplemental charge for such things as freight, handling, departmentaloverhead, and whatever else the supplier is able or permitted to charge. Without a clearpolicy for calculating markups, cost-plus pricing can easily acquire a bad reputation.
Market pricing can be carried out on a per order (or per delivery) basis or by the batch,often in the form of monthly charges. The first method, where the price of each delivery ortransaction is charged when it occurs, is preferred. In the batch method, the charges arepooled during each accounting periodnormally a monthand then charged out in onesingle accounting transaction as a lump sum. By-the-batch cost transfers will reflect averageprices. Individual transactions are recorded in supporting ledgers that may not always beavailable to affected managers.
The Cost Basis
This, method of transfer pricing is used most frequently when one department providesservices or produces a product for another. Three approaches can be found in college anduniversity costing and budgeting:
Direct costs onlyDirect costs plus a surcharge for a portion of indirect costsDirect costs plus a surcharge for a department's full costs
The last two methods are variations of cost-plus pricing, but with considerably largersurcharges. These come about when the surcharges include all administrative overhead, debtservice, and other capital costs not directly associated with the activity in question, but stillpart of the charging department's total cost. Surcharges must be logical and credible.
Ideally, institutions should let service departments charge their total costs, leaving themwith a zero cost balance at the end of the year. In practice, many service departments chargeout less than their total direct costs. A perennial tug-of-war exists between academic andsupport departments in the competition for funding. When institutions succumb to internalpolitical pressures and routinely let support departments charge academic users only aportion of the total costs associated with supplies, materials, and services, it should come asno surprise when the long-term funding of support activities suffers, as many institutionsclaim is more and more the case.'
The Negotiated Price Base
Negotiated prices are determined jointly by the selling and acquiring departments or,more broadly, on the basis of an administrative decision. This allocation base is used whenthere are no competitive market prices with which to compare internal charges. It is also anappropriate base when there are legitimate questions about how a cost-based price should beset.
234196

Appendix ,B
Arbitrary Cost Price Base
This frequently used base should have logic to it and not be pulled out of thin air. Forinstance, deciding on a 2 percent plant depreciation rate is arbitrary, but could be defendedbecause a textbook mentioned it or because everyone agrees that physical plant has a 50-yearlife before major renovations are needed.
Although internal or transfer pricing in any of the forms described above can beeoniecumbersome, its conceptual simplicity is its principal advantage: If a service or product' canbe priced, the internal buyer should be charged that price directly. Theoretically, everyinternal transaction can be priced. So, if prices are set high enough, direct and indirect costs,variable and fixed coststotal full or long-run costscan be charged to users.
A going concern must sell enough output at a price that covers total costs. Servicedepartments can be seen as internal going concerns. Therefore, why should they not earnenough income to defray their total costs? Under this rule, service deimrtments will sell touser departments enough services at prices that cover their total costs.
Once colleges and universities have mastered the art of internal full-cost pricing, they arefreed from the complications that cost averaging and the near-endless permutationsassociated with most non-price-based indirect-cost allocation procedures entail.
The Affinity Principle
The affinity principle implies that there should exist a cause-and-effect relationshipbetween the cost being allocated and a particular allocation base. The following examplesimply such a logical relationship:
A department purchases supplies whose cost is charged directly to it. Direct costingalways demonstrates affinity.Pooled travel costs are allocated in proportion to either personnel compensation orthe percentage of staff who incurred the travel costs. Personnel compensation, unlesslimited to staff who travel, is a less precise allocation base than the percentage ofpersonnel causing the travel costwithout travel by staff there is no travel cost.Plant custodial services costs are a function of the time it takes to clean a specific,facility. Both the square footage cleaned and a factor combining the length of timeand the square footage cleaned will demonstrate affinity. Because some spaces takelonger to clean than others, a time-weighted square-footage allocation base willproduce a more precise cost result.The cost of plant depreciation is charged to a department on the basis of square.footage occupied. Again there is a logical relationship between the physical spaceand its depreciation cost.
Some allocation methods in use in higher education and elSewhere violate the affinityprinciple. The most glaring example cited in nonhigher education accounting literature isthe use of direct costs as an allocation base. Seldom, if ever, are pooled costs related in alogical or cause-and-effect manner to direct costs, especially when the latter comprise, asthey normally do, a mixture of personnel, consumables, and even capital cost elements.
197
235

Cost Accounting in Higher Education
For instance, Circular A-21 and the original Hyatt handbook cite direct costs as alegitimate allocation base.2 Hyatt checks off direct costs as appropriate for almost everyoccasion, but then questions the degree of accuracy of the resulting cost allocations. Here,institutions are urged not to use direct costs as an allocation base unless mandated by anoutside agency.
What is a suitable allocation procedure in one instance may not be appropriate in another.The choice must be based on the institution's underlying financial policies and on the degreeof cost precision sought. The affinity requirement is critical for support-cost allocation whereit is often tempting to use simplified methods that do not always meet the affinity test.
Many indirect cost allocation practices result in questionable cost data. Precise costinformation is important in competitive situations, and thanks to improved computer-basedcost allocation accounting technologies, for-profit and not-for-profit organizations use directcosting more frequently than in the past. The predominance of indirect-cost-recovery costingbased on extensive cost pooling has discouraged more comprehensive direct costing in somesegments of higher education. The compelling need for better cost data is pushing institutionsinto new directions. One result is that in both the for-profit and the higher education sectors,the number of affinity-based cost allocation procedures is increasing.
Economic Feasibility
The traditional reason for cost pooling has been the fear that direct costing is tooexpensive and too complicated. The idea was to simplify costing: Instead of allocating vastmultitudes of small accounting transactions in a complex scheme of cost crossovers, poolingis supposed to make possible a more economical cost dispersal among cost centers.
There is considerable historical justification for this position. However, the dramaticadvances in computer technology makes the economic-feasibility constraint a less validargument today than in the past. Nevertheless, economic feasibility remains a consideration.A comprehensive cost accounting management information system (MIS) plan must includecost estimates for the system's implementation. Such a plan would indicate the point atwhich an economic constraint will kick in, indicating when the institution should shift fromdirect costing techniques to percentage or rule-of-thumb allocation procedures.
On occasion, institutions may exaggerate the difficulties and estimated costs of installinga comprehensive system of direct costing. Although there are fewer technical obstaclestoday, a change to comprehensive direct costing presents institutions with programming andphasing-in costs. This can be a serious short-term cost issue, especially for very large andcomplex institutions, but the short-term pain will be minor compared to the long-termrewards: Subsequent costing outcomes become more precise, simpler to implement, and mayalso be more consistent for comparative costing.
Who Has Control Over Costs?
Ideally, a cost accounting system should enable managers to precisely identify everydirect cost element associated with a given cost center. Managers are responsible for thecosts of their activities, they understand direct costs best, and they are aware that these arethe costs they must control.
X36198

Appendix B
But this control is not complete. When a manager buys services from other departments,who determines the prices these departments charge for their services and how these pricesare set? Can a manager go outside and buy for less? If a manager must buy internally, whatassurance is there that the services bought are rendered in a cost-effective manner?
And then there are the truly indirect and support costs over which a manager has nocontrol at all. Who determines the amounts of such costs that are to be charged to a givencourse, research project, department, academic division, school, or campus? Is this decisionmade by the auditors, by a single individual at the institution, by a committee? Once oneknows who makes the decision, how are these charges computed?
Figure B.1 dramatically shows the number of costs that may affect the cost of a givenactivity but are the responsibility of other persons. Managers are more likely to accept evenexorbitant-looking cost charges if they know that all other managers are doing their best tominimize their costs. The institution's top management may also want to impress uponothers in the organization that significant general administrative and operational costs existthat must be covered by the institution's cash flow and current revenues. When such indirectcosts, over which a manager has no direct control, are allocated, even simplified allocationprocedures must be understood and made credible.
Primary and Support, Core and Non-Core Costs
Figure B.1 also illustrates that there is a hierarchical order among costs in the sense thateach primary cost center has its distinct support costs. It also illustrates the complexity of theprimarysupport cost interdependence among institutional activities. Cost allocationprocedures should help clarify rather than obscure this interdependence. Managers must bemade to understand how and which types of common and support costs are being allocated totheir activities.
In one of its more significant innovations, SFAS No. 117 stipulates that institutions musthenceforth report their expenseshere, costsby primary programs.3 At this writing there isno clear consensus on what this means. Institutions will have considerable freedom inidentifying their primary programs.
Institutions must focus on their primary programs because it is important that they knowwhich of these cover their full costs and which do not. Assuming that an equitable processexists for allocating current revenues to primary cost centers, going-concern costing underthe four-tier full-cost model and within the SFAS No. 117 framework of reporting will showwhich primary cost centers are going concerns in their own right.4
Allocation Bases for Pooled Costs
The allocation of pooled costs requires (1) a definition of the type of cost to be allocated,(2) a decision on how precise the resulting cost information must be, and (3) a choice amongappropriate allocation bases.
199 237

Cost Accounting in Higher Education
There are four generic types of allocation bases:
Personnel, personnel compensationFacilities or spaceEquipment, technology, machineryServices or usage
Figure B.1: Hierarchy of Primary and Support Activities
If instruction and sponsored research are the primaryactivities, the following are sources of support costs:
Public ServiceAcademic support
LibrariesAcademic computer services
Student servicesInstitutional support
Operations and maintenance
If student recruitment is the primary activity, thefollowing may contribute support costs:Undergraduate and graduate admissions
Student records, registrarStudent financial aid administration
Faculty involved in recruitingPublications and printing department
Office servicesCustodial services
CateringAlumni (recruiting) relations
Specialized professional servicesComputer services
If a three-year fund-raising effort is the primaryactivity, the following provide support:Trustees and alumni relations department
Development departmentPublic relations and publicity
Specialized professional servicesComputer services
Financial administration
Every type of pooled cost can be allocated to cost centers on the basis of one or the otherof these categories. One allocation base may be used for more than one type of cost, andsome costs may use more than one allocation base. Figure 4.5 provides a partial overview ofthe types of allocation bases in use in higher education today.
Most-for- profit accounting manuals stress only input measures as cost allocation bases.Higher education seems to favor the use of both input and output measures, in particular
200
238

Appendix 13
certain FTE and other student measures. Credit hours, degrees earned, and number ofstudents graduating are all output measures. Circular A-21 mandated allocation bases arediscussed in appendix C.
Mixing input with output measures confuses cost allocation bases with unit cost measuresand constitutes a major lapse in methodological integrity. However, higher education doesnot seem to be troubled by such inconsistency.
Generalized Percentage Allocation Procedure
Most costing procedures that are not part of an internal pricing system rely on some formof percentage allocation mechanism. Normally, percentage cost allocation proceeds throughthe following steps:
1. Define the allocation taskfor instance, allocating the cost of capital depreciationamong specific cost centers.
2. Identify the fiscal policy constraintfor instance, the exact formula for calculatingdepreciation.
3. Choose the most appropriate, or externally mandated, allocation basefor instance,total or assignable square footage.
4. Determine each cost center's percentage share of the cost to be allocatedforinstance, the percentage of square footage assigned to each cost center.
5. Multiply the dollar value of the total cost to be allocated by each percentage share.For instance, if the total cost is $2 million and one cost center's share of squarefootage is 75 percent, the allocation amount to that center is $1.5 million.
Chapters 4 through 7 provide numerous illustrations of how costs can be allocated and ofhow different allocation methods yield different cost results.
Major Allocation Bases for Pooled Costs
All the examples in this section start from the premise that interservice department tier-one costsdirect costs plus indirect personnel compensation plus consumables costshavebeen fully allocated to support cost centers by means of appropriate micro-costing processes.The examples show how each of the major allocation bases can be used in non-price-basedcosting. In general, the objective is to allocate pooled costs to primary and support costcenters.
Theoretically, the use of a given allocation base indicates affinity. This means theallocation base best describes the relationship between the class of cost being allocated andthe base proper, which is the predominant cause or source of that cost.
201
239

Cost Accounting in Higher Education
Personnel and Personnel Compensation as an Allocation Base
Personnel and personnel compensationsometimes salaries and wages onlyare logicalallocation bases in all situations where there is a clear relationship between personnel orpersonnel compensation and the costs that must be allocated.
The distinction between personnel and personnel compensation is deliberate. Sometimesthe number of employees affects a given support cost; this is the case in personneladministration and in a few logistical situations. Other costs, for instance staff benefits,depend at least in part on the size of the payroll. Sometimes the percentage of employeesmay be the most appropriate allocation base.
For many institutions, staff benefits are a cost that is pooled either by major function or asa single aggregate. A staff benefits factor, as a percentage of total salaries and wages, is atraditional higher education indicator used in budget planning. This factor is not identicalacross all functions, although it may be similar. Because staff benefits are a large costcomponent, small percentage differences in this factor may mean large benefit differences. Asingle average staff benefit factor applied indiscriminately to all functions will overstatesome by-function post-allocation costs and understate others. Only direct costing of staffbenefits yields precise personnel compensation cost data.
At the very least, institutions that continue to pool staff benefits should do so by functionrather than in the aggregate, and the less aggregative that distinct functions are, the better.
On balance, and in the absence of external mandates, personnel and personnelcompensation may be more useful allocation bases in activity costing than in macro-costing.Which support and indirect costs are truly a function of employment? The Hyatt handbookidentified only three uses: executive management, fiscal operations, and generaladministrative services. Whether or not these functions are employee- or enrollment-drivenor more precisely, a combination of the twois a legitimate question. Whenprecision is not a paramount requirement in macro-costing and clear employee-drivensupport costs exist, the percentage allocation of support costs on the basis of either totalcompensation, salary and wages, or employee percentage shares seems to be justified.
Square Footage as an Allocation Base
Square footage is a versatile cost allocation base for most costs associated with themanagement of the institution's physical facilities.
A significant percentage of an institution's support cost is caused by physical facilities.The entire operations and maintenance (O&M) component of the educational and general(E&G) account and its equivalent for all auxiliary enterprises, hospitals, and independentoperations may be subject to allocation on the basis of square footage. Another importantexample is the cost of depreciation. Two per-square-footage allocation bases exist: totalsquare footage (TSF) and assignable (or usable) square footage (ASF). ASF requires a morecomplex space inventory than TSF. ASF refers to spaces actually occupied by faculty,students, administrators, and other employees, excluding circulation, custodial, mechanical,other common areas, and rest room facilities. The ASF approach is favored in Circular A-21and similar, mostly micro- and activity-based costing situations. When the institution
202
:240

Appendix B
computes physical facilities costs for its own macro-costing purposes, the TSF base may bethe most suitable. Since students have to reach their classrooms, staff must walk to theirwork spaces, and both will use rest rooms and common rooms, plant related costs shouldtake into account these common areas.
Both the TSF and the ASF allocation bases normally produce different post-allocationcosts. Aggregate ASF is always smaller than TSF. This does not mean that costs allocated onan ASF basis will also be lower, but they will always be different from those produced underthe TSF base.
If the total value of depreciation to be allocated is identical for the TSF and ASF bases,not only is the total depreciation cost fully allocated under each base, but the ASF methodactually imputes the depreciation costs of the "unassigned" square footage.
Since there is a difference between TSF and ASF, a situation may arise when a portion ofdepreciation cost will remain unallocated. This is the case when, in a building that isdedicated entirely to a science discipline, depreciation costs can only be computed on thebasis of ASF after a percentage of depreciable value, equal to the difference between ASFand TSF, has been eliminated from the calculation of the depreciation charge. In other words,the TSF method would account for all depreciable assets, whereas the ASF method wouldallow for a lesser amount.
As simple as the square-footage allocation base may look at first blush, institutions needto be aware of the post-allocation cost differences implicit in the TSF and ASF allocationbases.
Perhaps the conventional wisdom, according to which square footage is an appropriatebase for allocating depreciation costs, is an aberration. The truest measure for allocatingdepreciation costs may well be the relative percentage shares of the value of depreciableassets, especially when depreciation costs are allocated to the major functions. Squarefootage and asset values are completely independent variables. The square footage method isbetter suited to micro-cost allocations of depreciation costs.
Service and Usage as Allocation Bases
Most costs appear in the cost accounting MIS as transaction records. Processing andmaintaining these recordsstudent invoices, travel charges, course registrations, purchaseorders, student applications and matriculations, records of meals consumedengender theirown operating costs. Especially in a paper-intensive operation, it might be assumed thatcounting purchase orders processed or measuring the value of the purchase orders mightpoint to how the engendered costs could be allocated. As a result, there is an extensivepractice whereby the costs of certain departmentsthe purchasing department, forexampleare now allocated on the basis of the volume of the transactions in question, theirvalue, or a combination of the two.
But, is counting invoices, purchase orders, and other transaction documents really aconstructive use of employee time, especially when the transactions in question areincreasingly paperless? For example, an institution might decide to allocate the full cost ofthe purchasing department to other activities in direct proportion to the volume or value ofthe transactions it executed on their behalf. Perhaps it would make more sense to develop a
203 2 49

Cost Accounting in Higher Education
transaction-value-based "handling" charge of the type seen commonly on invoices today.This handling charge would be added in cost-plus fashion to the total cost of each purchaseorder when debited to the purchaser's account. Actually, many institutions prefer the direct-service-charge method, although the charge itself may be derived from standard costinformation that relies on estimates of the historical volume of transactions.
What used to be seen as usage-based costing is increasingly known as process and activitycosting, and is discussed in chapter 7. However, other usage measures exist which are verylogical and useful bases for allocating costs to users. They include the following:
Kilowatt hoursMiles per hourBritish thermal unitsLibrary book and other circulation unitsComputer center usage measuresSquare feet of paving, of floor covering, or of paintingJob orders for printing, copying, and mail handling
In addition to serving as allocation bases for pooled support costs, these measures areeven better suited for direct costing through internal or transfer pricing.
Other usage indicators focus on employee and student use of facilities or student-basedoutput measures. They include FTE faculty, FIE personnel, personnel hours (or moresimply, number of personnel), student contact hours, student credit hours, degree completionunits, and FTE students. Such measures translate costs well for internal pricing and directcosting, but many are output rather than input measures and may not always be appropriatebases for cost allocation purposes. In contrast, they are excellent measures for determiningunit costs.
When support costs are first pooled and later allocated to the appropriate cost centers onthe basis of usage, the choice of the most appropriate batch allocation method depends on therequired degree of cost precision. All usage-based batch or percentage cost allocationmethods sacrifice precision for expediency by averaging support costs across cost centers. Asthe institutional cost accounting MIS develops, internal pricing and direct charging ofsupport costs may be preferable. Counting the number of transactions and then allocating thecosts they represent in proportion to these numbers does seem somewhat primitive. Severaluniversities and colleges are experimenting today with more complex formulas fordetermining certain types of usage. Of particular interest are newer models used to measurethe usage of computer centers and libraries.
2°242

Appendix B
Allocating Costs Among Support Activities and Other CostAllocation Concepts
Step-Down and Cross-Allocation of Pooled Costs
Most cost accounting textbooks recommend that institutions use the so-called step-downmethod when allocating costs, and Circular A-21 requires it. This method defines howpooled costs must be allocated to primary and support programs. According to therecommended sequence, pooled direct and indirect costs are first allocated to the affectedsupport and primary programs. Subsequently, all fully costed support program costs areallocated to primary cost centers.
In its most advanced stage, this method is also referred to as the cross-allocation methodand is preferred in for-profit enterprises and increasingly in higher education. It should comeinto its own under SFAS No.117. It acknowledges costs not only between primary andservice departments, but also among service departments. The underlying cost accountingMIS incorporates the appropriate crossover mechanisms which shuttle interservice costsfrom supplying to consuming service departments. At the end of the interservice allocationprocess, support cost centers are left with their own direct costs. The stage is then set toallocate the remaining support costs to the primary cost centers.
Notes1. During the preparation of this manual, several representatives from the public sector raised
this issue with the author. One concern was the degree to which less pooling of costsmight make certain direct costs more visible to academic user departments. Anotherconcern was that, absent definitive full-cost principles applied to budgeting, institutionsmay reach the point where too much budget authority is being relinquished by the centraladministration so that others within the institution have the power to decide how muchsupport to budget.
2. Office of Management and Budget, Cost Principles for Educational Institutions, OMBCircular A-21; reprinted in James L. Feldesman, Jacqueline C. Leifer, and Michael B.Glomb, eds., Federal Auditing Information Service for Higher Education (Washington,D.C.: NACUBO, 1994). James A. Hyatt, A Cost Accounting Handbook for Colleges andUniversities (Washington, D.C.: NACUBO, 1983).
3. Statement of Financial Accounting Standards No. 117: Financial Statements of Not-for-Profit Organizations, Financial Accounting Series No. 127-B (Norwalk, Conn.: FinancialAccounting Standards Board of the Financial Accounting Foundation, June 1993).4. Many colleges and universities assign specific revenue streams to specific educational
programs and departments. A potential drawback is that some managers may assume that theassigned revenues are actually theirs rather than the institution's. If revenues are allocateddirectly to departments or activitiessay, tuition revenues in some proportion toenrollmentthe respective departmental or activities budgets should reflect full, not merelydirect, costs.
205
243

-- Appendix C
Indirect-Cost AllocationUnder Circular A-21
This summary of Circular A-21 provisions is based on the July 26, 1993, revision, which
went into effect on January 1, 1994.1 At the time this manual was ready to go to press, theOffice of Management and Budget (OMB) had published proposals for yet another revision
of Circular A-21 with changes which could on balance have a significant impact in further
limiting indirect-cost recovery.2
This appendix answers the following questions:1. What is the purpose of Circular A-21?2. What is the difference between total, allocable, and allowable costs?
3. How does Circular A-21 define direct and indirect costs?4. How is an institution's indirect-cost rate determined (a) under the normal method
and (b) under the simplified method?5. Which principal allocation bases are stipulated?6. What other rules must institutions be aware of?7. How is Circular A-21 influencing institutional accounting practices?
The following discussion is not intended to be comprehensive and is in part based on
materials used by NACUBO' s Professional Development Department in its periodicworkshops on indirect-cost recovery accounting.
Circular A-21 Is a Special Case
Figure C.1 illustrates where Circular A-21 fits into an institution's overall program and
account structure. Figure C.2 focuses on the difference between an institution's true costsand those allowed under the circular. Thus, it is easy to see (1) that the circular relates to a
207
244

Cost Accounting in Higher Education
fraction of an institution's total activities and (2) that for the activities involved, it addressesless than their full costs.
Figure C.1: Major Institutional Costing Tasks
Institution's FullCosts
Program Costs
Academic Activity Costs 9Instruction
All Government- Circular A-21 CostResearchSponsored RecoveryAgreements
Other
Cost perDegree
Cost perCourse
Figure C.2: Institutional Versus Circular A-21 Costs
Institution'sFull Costs
Minus UnallocableCosts
Minus UnallowableCosts
Equals CircularA-21 Allowable
Costs
May Lead toInstitutional Cost
"Deficit"
20
Administrative orOperations
1Utilities
Management
RiskManagement
FacilitiesManagement
EnrollmentManagement

Appendix C
Both exhibits highlight the fact that the circular embodies the inherent contest betweenthe federal government and the institution: While attempting to reach a fair result, thegovernment's interest lies in minimizing its costs, whereas the institution's interest rests inmaximizing indirect-cost recovery. When adhering to the circular's rules, the institution mustnot subordinate its interests to those of the government, especially when it comes toimplementing institutional cost accounting procedures.
Figure C.2 highlights the potential for a cost-recovery deficit, a potential which is greatertoday under more restrictive reimbursement rules, such as the 26 percent limit onadministrative-cost recovery. David H. Douglas estimates that at the University of Rochesterthis deficit, amounting to a subsidy to the government, may be as high as 15 percent, and hethinks that it may be much larger at institutions with a large sponsored-activities exposure.
How Important Are Circular A-21 Covered Activities?
Unless institutions are careful, the circular's rules can adversely influence the institution'sfinancial policies and outcomes. For instance, the cost deficit highlighted in figure C.2 isreminiscent of below-cost reimbursements in the health care industry. Since there is no freelunch, if the government does not pay the entire tab, tip included, someone else must bynecessity pay the difference. This difference is called "cost sharing" and is fundamental tomost government grants. Sponsored projects at colleges and universities are no exception:The government expects the institution to fund a portion of each project.
How important is sponsored-activity cost recovery in higher education? Figure C.3 showsits place within the hierarchy of institutional costing tasks. However, this exhibit tells usnothing about the dollar scope of the underlying institutional activity. John Minter Associatesestimated the federal government's sponsored grants and contracts contribution for 1993 fora national sample of public and private research and doctoral universities.3 The medianrevenue share was 13.8 percent for public institutions and 14 percent for independentinstitutions; the corresponding expenditure share was 12.2 percent and 12.1 percent,respectively. The upper quartile median values for revenues were 24.6 percent for publicinstitutions and 29.3 percent for independent universities; for expenditures, they were 21.1percent and 24.3 percent, respectively. This is without a doubt significant. For institutions inthis sponsored-activities bracket, Circular A-21 becomes a major preoccupation. Forinstitutions with negligible indirect-cost-recovery exposure, the circular's effect may be thatof a minor nuisance, but one that could still be expensive if not managed properly.
Institutions with large exposure are compelled to create at least a supplemental CircularA-21related system of cost accounting. In this way, the circular influences how costaccounting in general is carried out at many universities and colleges, and helps explainsome of the inadequacies of these systems.
209
246

Cost Accounting in Higher Education
Figure C.3: The Place of Sponsored Grants and Contracts in the Structure ofInstitutional Activities
SFAS No. 117Financial Reporting
Standard
Institution'sFinancial PoliciesPromulgated by
Governing Board
Major ProgramCosts
Institution's FullCosts
Support ProgramCosts
Program A Program 1
Program B Circular A-21 CostsProgram 2
Program C Circular A-21 Costs Program N
On the Purpose of Circular A-21
The circular defines its purpose as follows:
[To establish] principles for determining the costs applicable to research anddevelopment, training, and other sponsored work performed by colleges anduniversities under grants, contracts, and other agreements with the federalgovernment. These agreements are referred to as sponsored agreements.4
The practical and ultimate objective of the circular is to help institutions determine theirindirect-cost-recovery rate. A secondary objective is to define the accounting constraints fordetermining this rate. Computing an indirect-cost rate that is acceptable to the government is
210
247

Appendix C
a tedious and time-consuming undertaking at universities that are required to use themodified total direct-cost method, described below.
Total, Allocable, and Allowable Costs
The total cost of a sponsored agreement or project is the sum of all allowable direct costs,
plus that portion among allocable costs represented by the allowable indirect costs, minus
any credits explicitly designed for or resulting in a reduction of these combined costs. Figure
C.4 summarizes the relationship among these elements.
Figure C.4: Circular A-21 Allowable Costs
Total Direct ProjectCosts
Circular A-21 AllowableDirect Project Costs
Total ProjectCosts
0 Minus Credits, Discounts,Refunds, Etc.
4
Total Indirect ProjectCosts
Circular A-21 AllowableIndirect Costs
1
Direct costs are those caused by the sponsored agreement. Institutions have manydifferent types of pooled costs that are allocable to major and support cost centers as either
direct or indirect costs. However, only allowable allocable indirect costs can be charged to
sponsored agreements. Therefore, from the institution's point of view, the total cost of asponsored agreement is always larger than the total cost allowed under Circular A-21
constraints.
Allowable Costs
In order to be allowed, direct and indirect costs must be
reasonable,allocable to projects under the circular's standards,consistent with accepted accounting principles appropriate to the circumstances, and
consistent with the circular's or a sponsored agreement's limitations.
Allocable Costs
Costs are allocable to sponsored activities if they
are incurred solely to fulfill the terms of the sponsored agreement,benefit the project and the institution and can be prorated in a reasonable or logical
manner, or
211 248

Cost Accounting in Higher Education
are necessary for the operation of the institution and can be apportioned to the projectin a reasonable mannerthe affinity requirement.
Applicable Credits
Applicable credits include
purchase discounts and rebates, including educational discounts,allowances in purchase contracts or in professional service agreements,insurance and other indemnifications and recoveries for losses, andadjustments in the project agreement for erroneous charges, unallowed costs,overpayments, and unused funds.
Direct and Indirect Costs
Once costs have been organized as either direct or indirect, they must be treatedconsistently as such under identical circumstances. Furthermore, once a sponsored agreementcost has been treated as a direct cost, it must be so treated for all institutional activities. Someinstitutions use this requirement as a reason why they cannot or will not change the existingcost accounting practices.
Direct Costs
Typical direct-cost pools include the so-called primary programs and encompass theinstitution's academic activities (i.e., instruction, research, public service, and auxiliaryactivities, including hospitals and other independent operations and professional academicschools and divisions). The sponsored component may be subdivided into sponsoredinstruction, organized sponsored research, other sponsored activities, and departmental oruniversity research.
Costs that can be linked logically or assigned with relative ease to a sponsored project aredirect costs. Examples of typical direct costs are salaries, wages, and staff benefits forpersonnel involved in sponsored projects; costs for materials and supplies used directly insuch projects; the direct costs of telecommunications, travel, and even extraordinary utilityconsumption; and equipment used principally for the sponsored project.
The circular insists that if the institution treats some of these types of expenses as indirectcosts, it must use them as indirect costs also for sponsored projects. Conversely, if theinstitution consistently treats these expenses as direct costs and adheres to accepted andconsistent cost accounting practice, the expenses can be classified as direct costs forsponsored projects.
Indirect Costs
Indirect costs are those common institutional or joint costs that cannot be identifiedreadily or easily with a sponsored project. Indirect-cost pools normally include academicsupport, facilities operations and maintenance, general administrative support, departmental
21

Appendix C
and sponsored-activities administration, student services, and facilities-use allowances ordepreciation. These major groupings may have their respective subpools, including libraries,utilities, and transportation.
Circular A-21 establishes criteria for cost pooling. Some of the factors in separate costpooling are the following:
o Cost elements that pertain to a separate institutional activity or to less than the entire
institutiono Cost elements that are susceptible to usage measurement (e.g., workload and
enrollment)o Common costs (e.g., general and departmental administration) that are charged
directly to a sponsored project and must be eliminated from indirect-cost poolso Institutional activities that provide their own administrative, logistical, and
maintenance supporto An institution's decision to pool certain costs such as staff benefits
The purpose of the indirect-cost allocation process under Circular A-21 is to distribute the
allowable shares of these pooled costs in a reasonable manner to the sponsored projects.
Indirect-Cost Distribution Methods
The circular affirms the affinity principle. Below are the reasons for allocating indirect or
pooled costs to a sponsored project:
The project or cost center derives the greatest benefits from this method.There is a traceable cause-and-effect relationship.It is logical or reasonable.The allocation results from a special cost study.
Requirements for Cost-Analysis Studies
The latest proposed revision would eliminate cost-analysis studies and replace them with
other, government-proposed (or -imposed) benchmarks. If the proposed change does not
materialize, which is unlikely, the requirements are as follows:
o Adequate documentation must exist.o Costs must be allocated on the basis of benefits derived by sponsored projects.
Cost measurements and allocation must be statistically sound.o Studies must be institution-specific.o Periodical reviews must occur at least every two years.
If cost studies are not performed, section F of the circular stipulates appropriate indirect-
cost allocation bases. Bases other than section F are permitted if
o a different base is demonstrably more equitable,o a more readily available base does not increase the sponsored project's cost, and
o the institution elects and qualifies for the simplified indirect-costing method.
All cost groupings that can be identified directly with a sponsored project or with abenefiting cost objective must be allocated directly.
2132 5 0

Cost Accounting in Higher Education
Order of Distribution
The following indirect-cost categories must be allocated in the following order:
1. Depreciation and use allowance2. Operation and maintenance3. General administration and general expense4. Departmental administration5. Sponsored-projects administration6. Libraries7. Student administration and services
Items 1 through 3 should be allocated in that order to the remaining indirect categories 4through 7 and to all major institutional functions and specialized service facilities. Categoriesother than those listed may be allocated in the order deemed most appropriate by theinstitution.
If an institution uses the cross-allocation method, the preceding order does not apply.Otherwise, once a given category of indirect costs has been allocated, that category isconsidered to be closed. This means that costs cannot subsequently be allocated to it.
Indirect Facilities Costs
Facilities costs include the following:
Depreciation or use allowancesInterest on debt associated with specific facilitiesEquipment and capital improvementsOperations and maintenance expensesLibrary expenses
This combination of facilities costs became effective on January 1, 1994.
Depreciation and Use Allowances: Common Principles
Depreciation and use allowances are similar, yet quite different, indirect costs underCircular A-21. However, there are several common allocation principles governingdepreciation and use allowances:
If they apply to a single function or activity, they should be allocated to that functionor activity only (thus being seen as a direct cost).If they apply to more than one function or activity, they must be allocated on thebasis of usable square feet, excluding common areas such as hallways, stairwells, andrest rooms.
If they apply to jointly used functions, they must be allocated to the benefiting
functions either-
214
251

Appendix C
on the basis of employee full-time equivalents (FTEs) or on the respectivepercentage shares of the salaries and wages of the functions that benefit from theuse of the particular spaces, oron the basis of institutionwide employee FTEs or salaries and wages of thebenefiting major functions of the institution as defined by the circular.
If they apply to improvements of land (but not buildings)parking lots, fences,sidewalks, etc.they must be allocated on the basis of user categories, such as FTEstudents or FTE employees. More specifically, the cost allocated on the basis ofstudent FTEs must be charged to instruction; that allocated on the basis of employeeFTEs must be charged to major functions of the institution as a percentage of eachfunction's total salaries and wages.
Interest
The circular treats interest as a direct cost to the facility, equipment, and improvementsthat caused it. Beyond that, it stipulates that interest will be allocated in the same manner asdepreciation and use allowances.
Operations and Maintenance Expenses
This category normally includes the following:
Janitorial and utility servicesUtilities properRepairs and normal alterations of buildingsFurniture and equipmentMaintenance and operation of all kinds of facilitiesEarthquake and disaster preparednessEnvironmental safetyHazardous waste disposalAll types of insurance relating to propertySpace and capital leasingCentral receivingFacilities planning and managementAllocable share of staff benefits, if not charged directly alreadyAllocable share of depreciation or use allowancesAllocable share of interest
These types of costs should be allocated either on the basis of the rules summarized insection E.2.d or F.2.b of the circular.
Libraries
Library costs include expenses for
operations (i.e., salaries, staff benefits, supplies),any direct facilities maintenance and repairs,
215
252

Cost Accounting in Higher Education
books and specialized library materials,an appropriate share of general'administrative costs, andthe allocable share of depreciation or use-allowance expense.
Deducted from these costs must be any revenues collected by the libraries. Theacquisition of rare books with no value to sponsored projects is expressly excluded.
In the absence of the circular's section E.2.d allocation alternatives, the rules for theallocation of library costs are summarized in figure C.5. According to the circular, andillustrated in the exhibit, library costs are to be allocated on the basis of three user categories:
FTE studentsFTE professionals (faculty and other professional users)Other users
The FTE student number does not depend on whether or not students earn credits towarda degree.
Figure C.5: Allocation Rules for Library Costs Under Circular A-21, Section E.8
Library CostAllocation Bases
1.1EStudents
FTE ProfessionalEmployees
OtherUsers
To Major Functions asPercentage of Salaries and
Wages of ProfessionalEmployees in Those
Functions
Costs for Administration
To "Other" InstitutionalActivities Function
Since January 1, 1995, these include
General administration and general expensesDepartmental administrationSponsored projects administrationStudent administration and servicesAll other categories of expenses not listed specifically
216
253

Appendix C
General Administration and General Expenses
Included here are costs that do not pertain solely to one major institutional function. Theyinclude all expenses for administrative tasks that serve an entire institution or an entireuniversity system, including the appropriate and allocable shares of staff benefits, operationand maintenance expense, and depreciation or use allowances.
Chancellor's or president's officeInstitutionwide financial managementBusiness officeBudget and planningPersonnel servicesLegal servicesRisk, safety, and compliance managementData processing and administrative computer servicesCentral management information servicesAll other institutionwide management services
In the absence of the allocation alternatives of section E.2.d of the circular, these generalcosts must first be allocated to the major institutional functions to which they render services
or provide benefits on the basis of the so-called modified total direct-cost method. Costs ofthis general nature that are rendered to other institutions or agencies must be excluded.
Departmental Administrative Costs
These strictly limited costs include the following:
Academic deans' officesAcademic division deans' or chairs' officesAcademic department offices
Bid and proposal preparationOrganized research institutesStudy centersResearch centers
The following limitations apply: For academic deans' offices, salaries, staff benefits, andoperating costs are limited to the portions attributable to administrative services. Fordepartments, salaries and staff benefits for department heads, faculty, and other professionalsconducting instruction and research shall be allowed at a rate of 3.6 percent of modified totaldirect cost. This allowance will be added to the computation of the institution's indirect-costrate. Professional business and administrative officers are not included in this cost category.
Departmental salaries, wages, and staff benefits for clerical and secretarial personnel,administrative officers, and assistants; travel; supplies, materials, and stock room expenses;and other costs are allowable, but must be treated consistently in like circumstances.
On January 1, 1994, a new section (F.6.b) was added that stipulates how certain costsshould be treated. It defines how the departmental administration cost pool should becreated. The section addresses not so much the costing of sponsored projects as how the

Cost Accounting in Higher Education
institution should set up its cost accounting system. But if the stated requirements are to betaken literally, the following will apply:
Direct charges are appropriate for salaries and wages for technical staff, laboratoryand other supplies, telephone toll charges, animals, animal care, computers, travel,specialized shop costs, and salaries, wages, and benefitsif they are not pooled.Direct charges are also appropriate for salaries, wages, and benefits of administrativepersonnel, provided that the costs can be clearly identified with a specific activity orproject; otherwise, they should be treated as indirect costs.Indirect charges are appropriate for office supplies, postage, local telephone costs,memberships, etc.
These recommendations or requirements obviously depend on how precisely aninstitution costs and budgets its various activities.
In the absence of the section E.2.d alternatives, the expenses shall be allocated as follows:Administrative expenses for the departmental dean's office shall be allocated withina college or school on the basis of the modified total direct cost.Administrative expenses for a department and any allocated share of theadministrative expense of the academic dean's office shall be allocated toappropriate functions of the department on the modified total-direct-cost basis.
Appropriate allowances are permitted for operation and maintenance expenses, anddepreciation or use allowances.
Sponsored-Projects Administration
The sponsored-projects administration is a separate organization specifically created toadminister sponsored activities. This entity may administer nonfederal programs and mayinclude expenses for the following:
Grants and contracts administrationPurchasing and inventory managementPersonnel administrationPublishing and printingSpecial security arrangementsStaff benefitsOperations and maintenanceDepreciation or use allowance
Absent section E.2.d alternatives, these costs will be allocated on the modified total-direct-cost basis, after adjustments for any duplicate charges to sponsored projects, for costscharged to others, and for revenues received.
Student Administration and Services
This category of costs includes expenses for the following:
Dean or office of admissionsDean or office of student affairs
218

Appendix C
Student counseling and placementStudent advisementInfirmary and student health servicesCatalogsCommencement, convocations, and other normal student-related public eventsSalaries, wages, and benefits for academic personnel whose administrativeresponsibilities to the institution benefit sponsored projectsAppropriate shares of operations and maintenance, and depreciation or use allowanceexpenses
In the absence of section E.2.d alternatives, these costs must be allocated to instructionand subsequently to sponsored projects within instruction.
Offsets
If the federal government reimburses an institution outside the terms of a sponsoredagreement for any facilities or administration costs, such reimbursement must be treated ascredit to the specific individual indirect-cost category before any costs within that categorycan be allocated to the benefiting function.
The Modified Total Direct-Cost Base
The circular's section G.2. defines the composition of the modified total direct-cost baseas follows:
Salaries and wagesStaff benefits (called fringe benefits by the circular)Materials and suppliesServicesTravelSubgrants and subcontracts up to the first $25,000
Excluded are the following:
EquipmentCapital expendituresCharges for patient careTuition remissionRental costsScholarships and fellowshipsSubgrants and subcontracts in excess of $25,000
Other cost elements cannot be excluded unless an inequity in the distribution of indirectcosts would occur if they were included. The modified total direct cost corresponds, with theexception of the excluded rental costs, to the consumables cost aggregate defined in chapter3. However, all unallowable consumables must first be eliminated.
219
256

Cost Accounting in Higher Education
The Indirect-Cost Rate
The following formula calculates the indirect-cost rate:
Total value of a given indirect-cost pool ÷ modified total direct cost =indirect-cost rate
Institutions have either one or multiple indirect-cost rates. According to the circular, eachmajor function has its own aggregate indirect-cost pool. The amount in each of these poolsthat must be divided by the corresponding modified total direct cost to arrive at a singleindirect-cost rate for each function.
Sometimes single indirect-cost rates may not be appropriate. When significantly differentenvironmental and other conditions prevail, more than one indirect-cost rate may beindicated. Environmental factors include facilities, the nature and extent of administrativesupport, the scientific disciplines involved, and organizational arrangements.
The circular permits other cost-recovery arrangements:
A Negotiated Indirect-Cost Lump Sum. This may be appropriate for self-containedsponsored projects or off-campus or primarily subcontracted activities where it maybe difficult to determine indirect costs with sufficient precision.
A Predetermined Fixed Indirect-Cost Rate. This approach is permitted by Public Law87-638 (76 Stat. 437). The purpose of the provision was to simplify grantadministration, to facilitate project budget preparation, and to speed up sponsoredproject contract close-out.
Negotiated Fixed Indirect-Cost Rate. A fixed rate may be negotiated in advance for agiven fiscal year or any other period. Any over- or under-recovery may be carriedforward as an adjustment to the indirect cost of the next rate negotiation.
Provisional and Final Indirect-Cost Rates. Under certain circumstances, aprovisional indirect-cost rate can be established. This rate can be adjusted by thecognizant agency to prevent under- or overpayment. If a provisional rate is notreplaced by a fixed or predetermined rate, it can be replaced by a final rate.
Limitation on Reimbursement of Administrative Costs
The reimbursement of administrative costs is limited to 26 percent of modified total directcosts for the total value of the following:
General administration and general expenseDepartmental administrationSponsored-projects administrationStudent administration and services and their allocable share of depreciation or useallowance, interest, operation and maintenance, and staff benefit costsAll other types of expenses not listed specifically under one of the subcategories offacilities in the circular's section F
220
257

Appendix C
Alternative Method for Administrative Costs
An institution may claim a fixed allowance for the administration portion of indirectcosts. This allowance can be either 24 percent of modified total direct costs or 95 percent ofthe most recently negotiated fixed or predetermined rate, whichever is less. No cost proposalneed be prepared for this portion of indirect costs, nor is documentation of these costsrequired. No further charges for expenses incurred by the subcategories under"Administration" are permitted if this method is used.
The Simplified Method for Small Institutions
The simplified method may be used when the total direct cost of work covered byCircular A-21 does not exceed $10 million in a fiscal year. The simplified method involvesthe following steps:
A. Determine the total amount of salaries and wages paid to all employees.B. Create an indirect-cost pool composed of the following (not counting capital and
unallowable items):General administration and general expensesOperation and maintenance expensesLibrariesDepartmental administration expenses, computed at 20 percent of the salariesand expenses of deans and/or department heads
Note that student administration and services, student activities, and student aidand scholarship expenses are excluded.
C. Create a salary-and-wage distribution base by deducting salaries and wages under Bfrom A.
D. Calculate the indirect-cost rate (equal to C B).
E. Multiply the indirect-cost rate percentage of D by the total value of the directsalaries and wages of each sponsored project. This figure represents the indirectcosts that can be allocated to each sponsored project.
Examples of Unallowable Expenses
Section J of the circular lists 50 categories of costs. For each it identifies the unallowablecosts. The accounting system must find a way to eliminate these costs from the modifiedtotal-direct-cost base as well as from all direct costs. In general, costs are unallowable if theyare not directly related to the nature and scope of the sponsored project. They are allowableonly within the specifications published in section J of the circular. A general exception isthe general administration and support costs that can be allocated to sponsored projects. Thefollowing list is not complete, but it gives an idea of the kinds of costs that must be
221
258

Cost Accounting in Higher Education
eliminated from the modified total-direct-cost base and from any direct and pooled indirectcosts.
Expenses for convocations or other special events, including those for materials,salaries, wages, and facilitiesExpenses for promoting the institutionAlcoholic beverage expensesExpenses in support of alumni activitiesLosses from uncollectibles and any related legal and other collection expensesCivil defense costs for premises and capital expenditures for civil defense purposesCommencement and convocation expenses other than those permitted in F.7Increases in pension costs not funded 30 days after each calendar quarterLate payment charges for pension plan termination insurance premiums, excise taxeson funding deficiencies, and prohibited pension plan transactions by fiduciariesExpenses related to personal use of institution-owned vehiclesAny contingency provisions for future eventsExpenses concerning lobbying activities as listed in J.24.agAny excess of cost over income from other sponsored projectsMembership expenses for civic or community organizations and country, social, ordining clubsPre-sponsored-agreement costs unless permitted by a cognizant agencyProfessional services expenses that have no material relationship to the sponsoredprojectCertain losses from sale or disposition of facilities and equipment"Help wanted" advertising in color or of excessive sizeExpenses pertaining to special recruitment inducementsCertain rental costs (J.38)Marketing expenses for institutional products and servicesSeverance pay in excess of institution's normal severance pay policyExpenses involving certain legal proceedingsDonations, contributions, and entertainment costsTrustee travel and subsistence costs
This long and incomplete list may in part be subject to interpretation. The potential dollaramount of expenses that must be deducted from the institution's total direct and indirectcosts can be quite substantial.
Depreciation and Use Allowances
Rules governing the accounting for depreciation costs seems to be more generous thanthose covering use-allowance accounting.
2 5222

Appendix C
Depreciation Costs
Depreciation costs are based on the acquisition cost of assets and their useful lives.Excluded from the asset base are
cost of land (which would be changed in the newly proposed revision),cost of equipment and plant donated by the government, andany portion of cost of plant and equipment where the law prohibits recovery.
Useful-life estimates must take into account
type of construction,nature of equipment,technological developments in the area in question, andthe institution's renewal and replacement policies.
The particular depreciation method used must reflect the pattern of consumption of eachasset during its useful life. Normally, the straight-line method of depreciation is required. Forassets whose depreciation is highest in the early years of use, declining-balance or similaraccelerated depreciation may be allowed by the cognizant agency.
Under the depreciation method, a building shell may be treated separately from suchcomponents as plumbing, air-conditioning, heating, or other installations with shorter usefullives. These may then be depreciated separately. Assets which have outlived their useful livescannot be depreciated.
The Use-Allowance Method
The following rules must be observed:
The use allowance for buildings and improvements is 2 percent of acquisition costsper year.The allowance for equipment is 6.67 percent of acquisition cost per year.The entire building must be treated as a single depreciable asset.The 2 percent limit need not be applied to movable installations that are notpermanently affixed to the building (furnishings, decorations, or specialized itemssuch as dentist chairs, counters, dishwashers, and carpeting). The use charge for suchinstallations can be based on the 6.67 percent rule.For fully depreciated assets that come into sponsored-project use, a reasonable useallowance may be negotiated.
Combinations of depreciation and use allowance for the same asset class is not permitted,unless specifically allowed.
Charges for depreciation and use allowances must be properly documented on the basis ofphysical inventories taken at least every two years. Statistical sampling techniques may beused in estimating these inventories. For the depreciation method, records of depreciation forprior years must be maintained.
The largest college and university recipients of sponsored projects must furthermore abideby the following:
223 280

Cost Accounting in Higher Education
For federal full-negotiated-rate sponsored projects, indirect-cost payments made fordepreciation or use allowances must be spent immediately or reserved forexpenditure within five years on the acquisition or improvement of research facilities.These amounts can be spent to reduce debt on old assets, acquire new assets, orimprove existing ones.Recipient institutions of such reimbursement for depreciation or use allowance mustreport to the cognizant agency that fact and how they implement the aboverequirement.
Conclusion
Circular A-21 contains other provisions that center on the enforcement of its rules andincludes a listing of institutions that fall under section J.9 F. The preceding summary of thecircular focused on the principal indirect-costing definitions and rules. An early reading ofthe latest forthcoming revision indicates that several significant changes in these rules arebeing considered seriously. Most of these will tend to reduce, rather than increase, indirect-cost recovery. Some also improve and sharpen institutional cost accounting practices,particularly for so-called cost accounting standards (CAS) institutions, those subject to CostAccounting Standards Board rules.
The current Circular A-21 recognizes at least two types of institutions:
A. Those with contracts in excess of $10 million whose cost recovery represents asubstantial percentage of total revenues, and who must implement the modifiedtotal direct-cost base for computing the indirect-cost rate
B. Those who can avail themselves of the simplified method for computing theirindirect-cost rate
Thus, it is not surprising that the incentives to shape one's internal cost accounting systemdiffer significantly for these two groups. In group A, there may be legitimate reasons and anatural incentive to shape the basic cost accounting system in terms of the Circular A-21requirements. Actually, under proposed revisions, these institutions are CAS institutions.
The circular is a good illustration of the legal fiction of costing: Many of the imposed costallocation ruleswhile developed with the help of institutionsare arbitrary and, oncecodified, difficult to modernize. Even the many revisions have not contributed much tomaking costing more precise or easier. The circular's allocation constraints and its poolingrequirements or assumptions may help freeze the system in place. Otherwise, it might evolvemore rationally as institutions see the need for new approaches.
Circular A-21 describes a system of cost allocation designed to control and, increasingly,to minimize the government's support of colleges and universities through indirect-costrecovery. The circular has helped develop, with the clear consent of higher education, asystem of cost-recovery accounting that puts almost extreme emphasis on alleged indirectcosts.
224
26.E

Appendix C
This is interesting, since there is nothing in Circular A-21 that prevents institutions frommaximizing direct costing. The only requirement is that they be consistent. The moreallowable direct costs they can claim, the less indirect-cost reimbursement they may need.But there is the rub: How will institutions allocate their direct and indirect-cost recoveries?Who has the right to spend indirect-cost-recovery revenues? Although these are internalfinancial policy matters which governing boards and administrations could and must resolve,current budget allocation practices should not prevent institutions from adopting rational costaccounting procedures.
Finally, it may be appropriate to suggest that the circular does not always make a cleardistinction between expenses and costs, treating them as synonyms when they are not. Aclassic example of this is afforded by how library expenses are treated. First, to list librariesas a facilities-type cost is amusing, to say the least. Second, to identify fully expensedlibrary-asset acquisitions as a cost, rather than only treating the depreciable portion as a cost,is inconsistent with almost everything else in the circular. Of course, the combined effecttends to produce larger cost recoveries than would otherwise be possible.
Notes1. Office of Management and Budget, Cost Principles for Educational Institutions, OMB
Circular A-21; reprinted in James L. Feldesman, Jacqueline C. Leifer, and Michael B.Glomb, eds., Federal Auditing Information Service for Higher Education (Washington,D.C.: NACUBO, 1994).
2. Office of Management and Budget, "Cost Principles for Educational Institutions, " FederalRegister 60:7104 (Feb. 6, 1995).
3. Data provided author by John Minter Associates, Boulder, Colo., Oct.Dec., 1995.4. Feldesman, Leifer, and Glomb, Federal Auditing Information Service, p. 1005:2.
2 62225

NACUBO Board of Directors
John A. Palmucci, Chair, Loyola College in Maryland
Jerry B. Farley, Vice Chair, University of Oklahoma
Janet Hamilton, Secretary, University of California, Davis
Karla Chappelle Howard, Treasurer
Mernoy E. Harrison, Immediate Past Chair, California State University, SacramentoR.W. "Pete" Denton, University of South Carolina
William M. Dixon, Wytheville Community College
James M. Dodson, McPherson College
Dennis F. Dougherty, University of Southern California
Nancy B. Eddy, Holyoke Community College
Thomas G. Estes, Mercer University
Emerson H. Fly, University of Tennessee
J. Peyton Fuller, Duke University
George F. Keane, The Common Fund
Katharine J. Kral, University of Illinois, Urbana-Champaign
Gina Kranitz,-Paradise Valley Community College
William E. Lavery, Virginia Polytechnic Institute and State University
Edward R. MacKay, University System of New HampshireDiane Oakley, TIAA-CREF
Jerry N. Wallace, University of Idaho
Wayne A. Warnecke, Lakeland College
James E. Morley Jr., NACUBO President
263

U.S. DEPARTMENT OF EDUCATIONOffice of Educational Research and Improvement (OERI)
Educational Resources information Center (ERIC)
NOTICE
REPRODUCTION BASIS
O
ERIC
This document is covered by a signed "Reproduction Release(Blanket)" form (on file within the ERIC system), encompassing allor classes of documents from its source organization and, therefore,does not require a "Specific Document" Release form.
This document is Federally-funded, or carries its own permission toreproduce, or is otherwise in the public domain and, therefore, maybe reproduced by ERIC without a signed Reproduction Releaseform (either "Specific Document" or "Blanket").