![[Shinobi] Claymore 097](https://static.fdocuments.net/doc/165x107/568bef901a28ab89338c9a2d/shinobi-claymore-097.jpg)
DOCUMENT RESUME ED 381 744 CS 012 097 - ERIC · DOCUMENT RESUME ED 381 744 CS 012 097...
54
DOCUMENT RESUME ED 381 744 CS 012 097 AUTHOR ?ennington, Debora TITLE A Study of the Effects of Structured Practice and Feedback on Spelling Achievement in Second Graders. PUB DATE May 95 NOTE 54p.; Exit Research Project, Sam Houston State University. PUB TYPE Reports Research/Technical (143) Dissertations /Theses Undetermined (040) EDRS PRICE DESCRIPTORS TDENTIFTERS ABSTRACT MF01/PC03 Plus Postage. Comparative Analysis; Feedback; Grade'2; *Instructional Effectiveness; Primary Education; *Spelling Instruction; Study Skills; Teacher. Attitudes; Teaching Methods Grapeland Independent School District TX A study explored the effectiveness of adding a daily, structured practice session of weekly spelling words to the traditional pattern of pretesting on Monday, posttesting on Friday. Subjects, 28 second graders from the Grapeland Independent School District (Texas), were divided into control and experimental groups. The experimental group paired up each Tuesday, Wednesday, and Thursday for students to quiz each other on misspelled spelling words. The control group was permitted to devise their own study plan with no in-class time allocated for studying. Averages of all pretest and posttest scores were compared after a 6--week period. After administering a t-test, the scores were found to be similar on the pretest scores and not statistically significant. However, a statistically significant difference was observed on the posttest scores. There was a positive effect on the posttest scores of the experimental group. Findings concur with the opinions of more than half of 20 elementary school teachers who answered a survey of students' spelling habits. Thirteen (65l) of the respondents said they believed students who were allowed a daily, structured class time for studying would score higher than students who studied on thc;r own time. (Lontains 12 references, and 15 tables and six figures of data. Appendixes present the cover letter and questionnaire, the spelling word list, and additional tables and figures of data.! (Author/RS' Reprodo(1 ,nns Lwpplied by ELMS are the best that can be made from the original document.
Transcript of DOCUMENT RESUME ED 381 744 CS 012 097 - ERIC · DOCUMENT RESUME ED 381 744 CS 012 097...
DOCUMENT RESUME
ED 381 744 CS 012 097
AUTHOR ?ennington, DeboraTITLE A Study of the Effects of Structured Practice and
Feedback on Spelling Achievement in SecondGraders.
PUB DATE May 95NOTE 54p.; Exit Research Project, Sam Houston State
University.PUB TYPE Reports Research/Technical (143)
Dissertations /Theses Undetermined (040)
EDRS PRICEDESCRIPTORS
TDENTIFTERS
ABSTRACT
MF01/PC03 Plus Postage.Comparative Analysis; Feedback; Grade'2;*Instructional Effectiveness; Primary Education;*Spelling Instruction; Study Skills; Teacher.Attitudes; Teaching MethodsGrapeland Independent School District TX
A study explored the effectiveness of adding a daily,
structured practice session of weekly spelling words to thetraditional pattern of pretesting on Monday, posttesting on Friday.
Subjects, 28 second graders from the Grapeland Independent SchoolDistrict (Texas), were divided into control and experimental groups.The experimental group paired up each Tuesday, Wednesday, andThursday for students to quiz each other on misspelled spelling
words. The control group was permitted to devise their own study plan
with no in-class time allocated for studying. Averages of all pretestand posttest scores were compared after a 6--week period. Afteradministering a t-test, the scores were found to be similar on thepretest scores and not statistically significant. However, astatistically significant difference was observed on the posttest
scores. There was a positive effect on the posttest scores of theexperimental group. Findings concur with the opinions of more thanhalf of 20 elementary school teachers who answered a survey of
students' spelling habits. Thirteen (65l) of the respondents said
they believed students who were allowed a daily, structured class
time for studying would score higher than students who studied onthc;r own time. (Lontains 12 references, and 15 tables and six
figures of data. Appendixes present the cover letter andquestionnaire, the spelling word list, and additional tables and
figures of data.! (Author/RS'
Reprodo(1 ,nns Lwpplied by ELMS are the best that can be madefrom the original document.

C'
0
A STUDY OF THE EFFECTS OF STRUCTURED PRACTICE
AND FEEDBACK ON SPELLING ACHIEVEMENT
IN SECOND GRADERS
by
Debora Pennington
"PERMISSION TO REPRODUCE THIS
MATERIAL HAS BEEN GRANTED BY
et.41./207.-
TO THE EDUCATIONAL F. OURCES
INI:ORMATION CENTER (ERIC).-
U.S. DEPARTMENTOf EDUCATION
Office o1 EducationalReaeorch and Improvement
EDUCATIONALRESOURCES
ERIC)INFORMATION
CENTER (
Vihrs documentNO been rePtodu<od as
favored (torn the person or organacarOn
Ofarn Wing a en made to improve
CI Minor COIngeStion oua lithYave tre
reproduc
o Pants of view Or OprolOnSstated in thts docu al
ment do not necessarilyrepresent °Riv
OERI posttanor polay
A research paper
submitted in partial fulfillment
of the requirement for the course
Methods of Research
Sam Houston State University
May 1995
der

Abstract
This study explores the effectiveness of adding a daily, structured practice
session of weekly spelling words to the traditional pattern of pretesting on Monday,
posttesting on Friday. Twenty-eight second graders participated with 14 children in
each group. The control group added a 20-minute daily practice schedule to study
words misspelled on the pretest while the control group did not. The experimental
group paired up each Tuesday, Wednesday and Thursday for students to quiz each
other on misspelled spelling words. The control group was permitted to devise their
own study plan with no in-class time allocated for studying. Averages of all pretest and
posttest scores were compared after a six-week period. After administering a t-test,
using an alpha level of .05, the scores were found to be similar on the pretest scores
and not statistically significant. However, a statistically significant difference was
observed on the post-test scores. There was a positive effect on the post-test scores of
the treatment group and the null hypothesis was rejected. The conclusions seemed to
concur with the opinions of more than half of twenty elementary school teachers who
answered a survey of students' spelling habits. Thirteen (65%) of the respondents said
they believed students who were allowed a daily, structured class-time for studying
we ild score higher than students who studied on their own time.
TABLE OF CONTENTS
Page
List of Tables iv
List of Figures V
Chapter
1. INTRODUCTION
General Information
Statement of the Problem
Purpose
Importance of Study
Definition of Terms
Null Hypothesis
Limitations and Delimitations
Assumptions
2. REVIEW OF RELATED LITERATURE AND RESEARCH
3. METHODS AND PROCEDURES
Participants
Apparatus
Procedures
1
1
1
1
2
2
2
3
3
4
7
7
7
7
ii
4. PRESENTATION AND ANALYSIS OF DATA
5. SUMMARY, CONCLUSIONS and RECOMMENDATIONS 15
Summary 15
Conclusions 15
Recommendations 15
REFERENCES 17
APPENDIXES 19
A. Cover Letter and Questionnaire 20
B. Frequency and Percentage Tables 23
C. Additional Tables 32
D. Additional Figures 39
E. Spelling Word List 46
iii
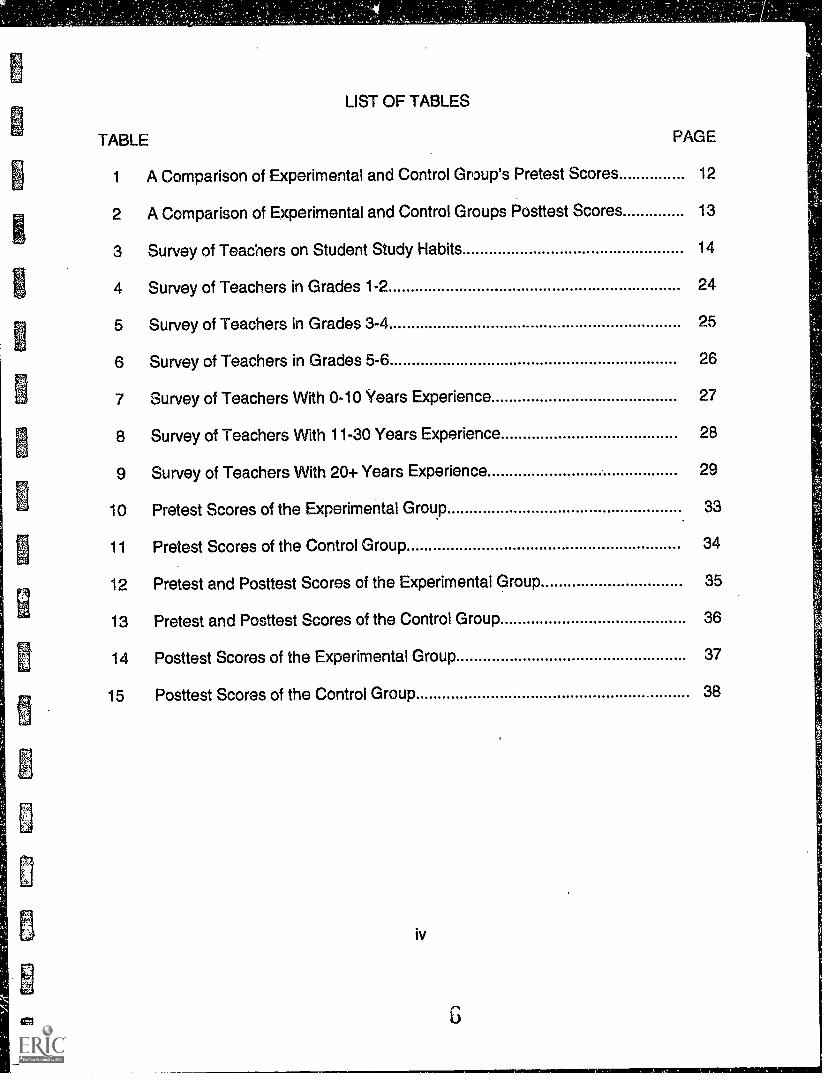
LIST OF TABLES
TABLE PAGE
1 A Comparison of Experimental and Control Group's Pretest Scores 12
2 A Comparison of Experimental and Control Groups Posttest Scores 13
3 Survey of Teachers on Student Study Habits 14
4 Survey of Teachers in Grades 1-2 24
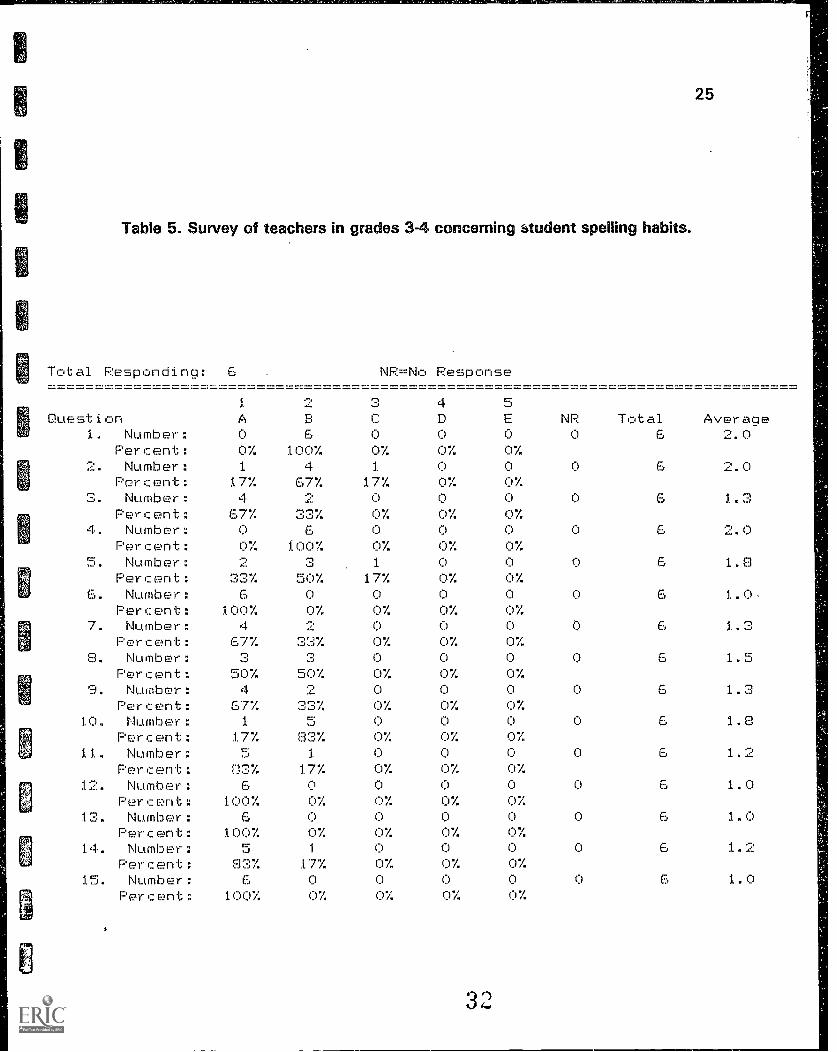
5 Survey of Teachers in Grades 3-4 25
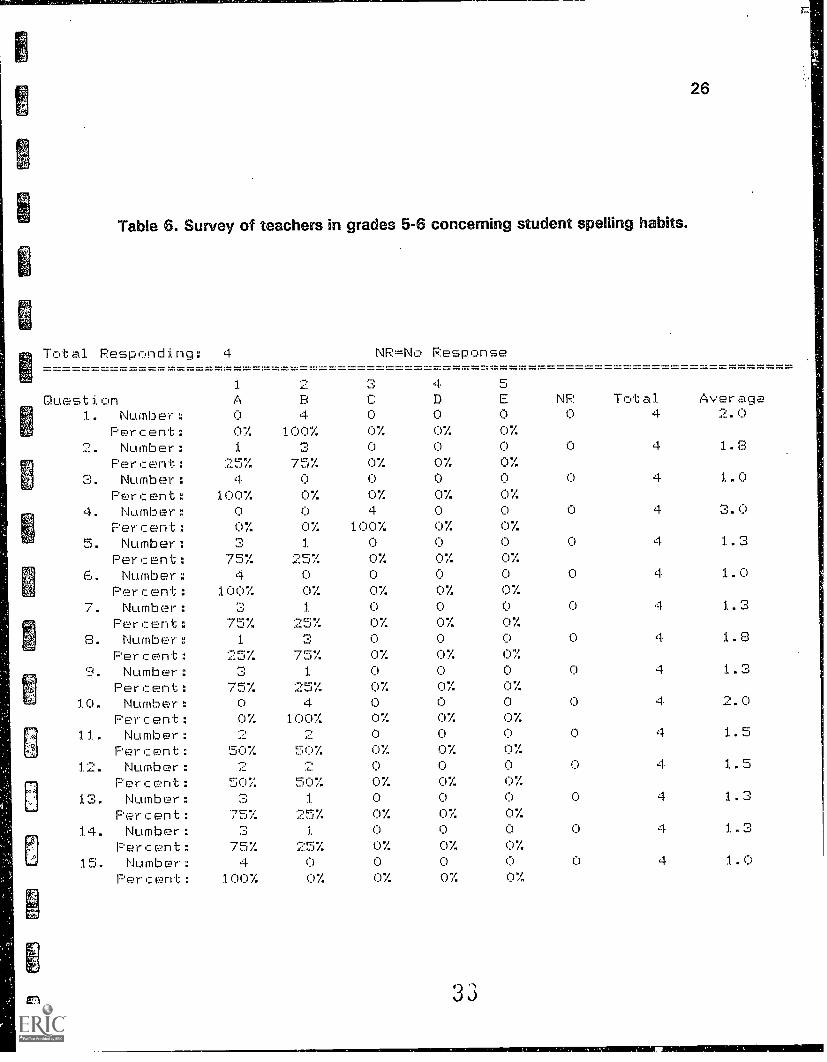
6 Survey of Teachers in Grades 5-6 26
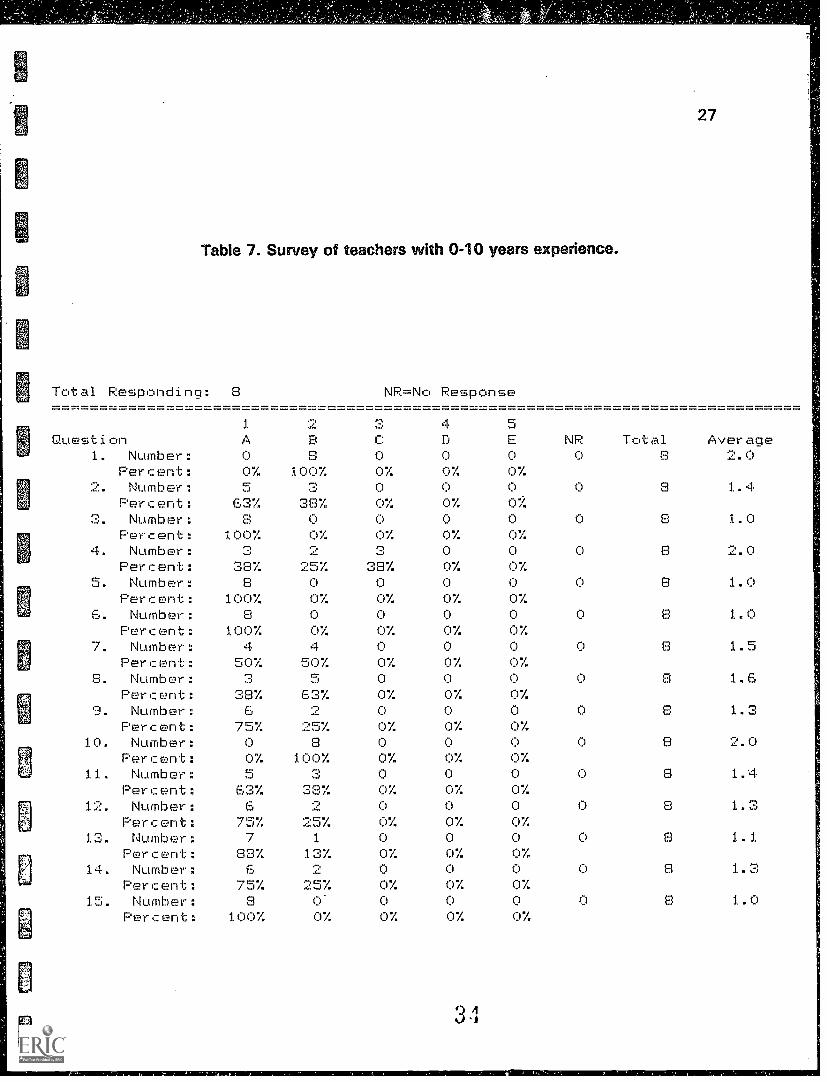
7 Survey of Teachers With 0-10 Years Experience 27
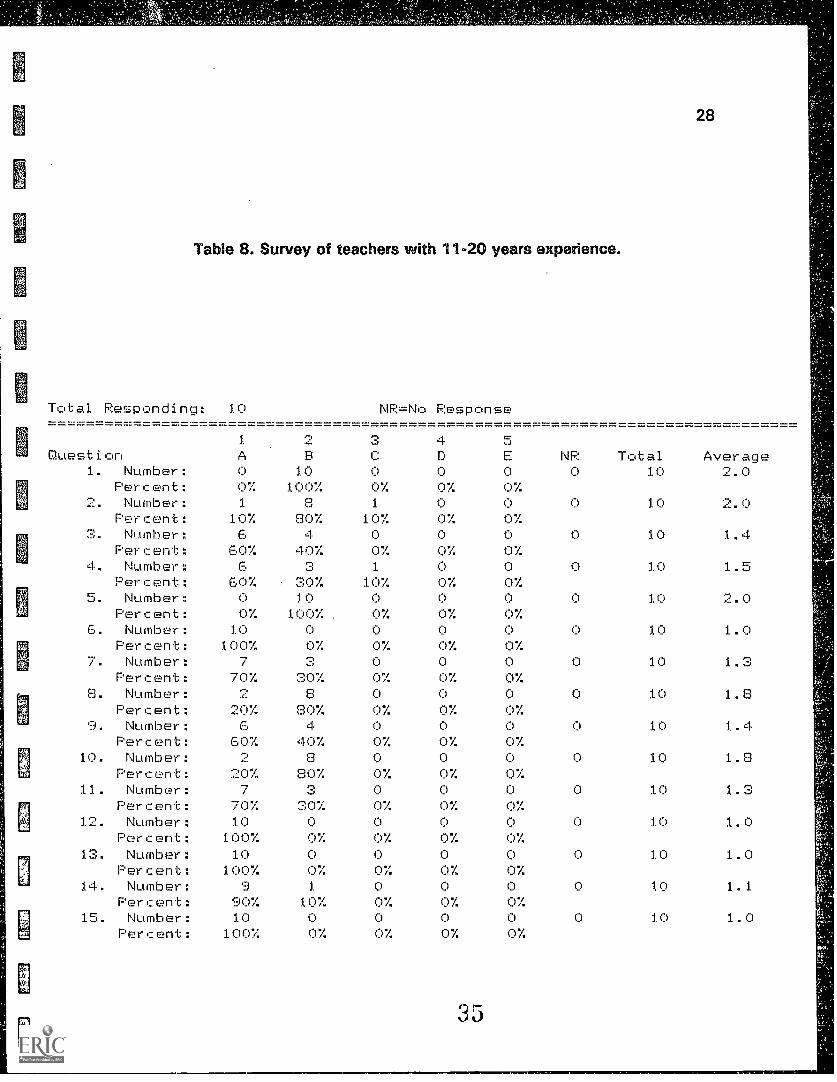
8 Survey of Teachers With 11-30 Years Experience 28
9 Survey of Teachers With 20+ Years Experience 29
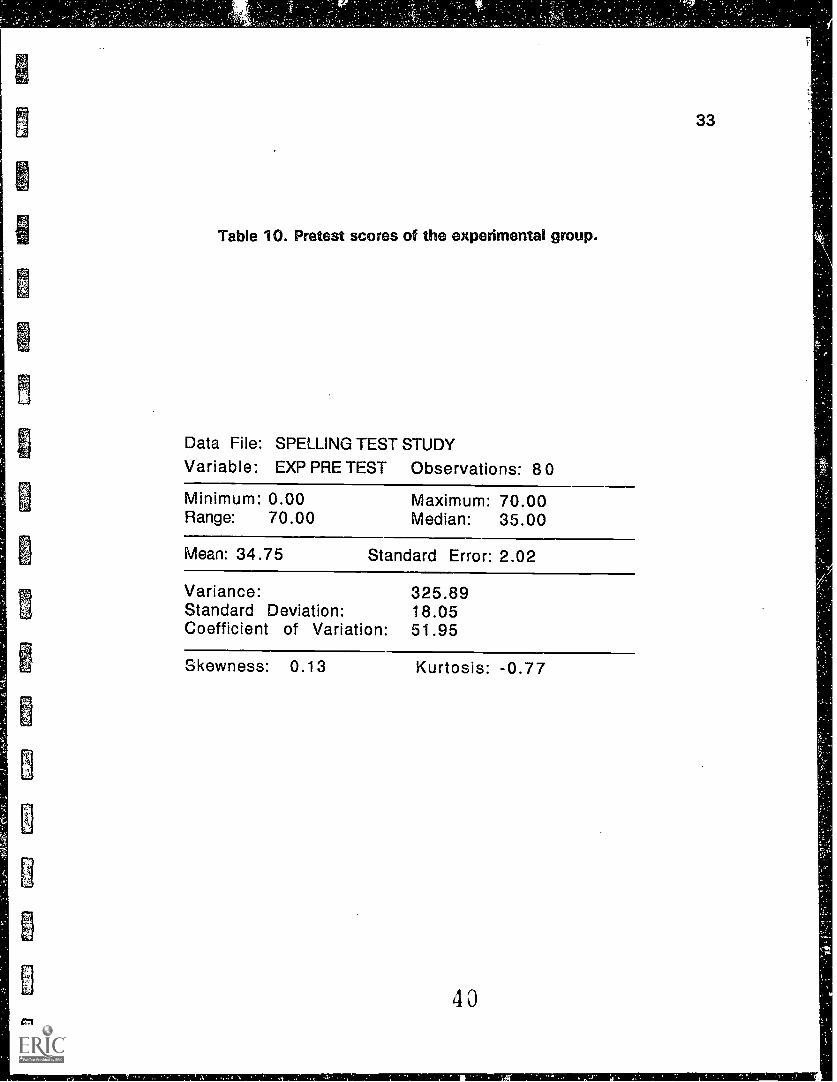
10 Pretest Scores of the Experimental Group 33
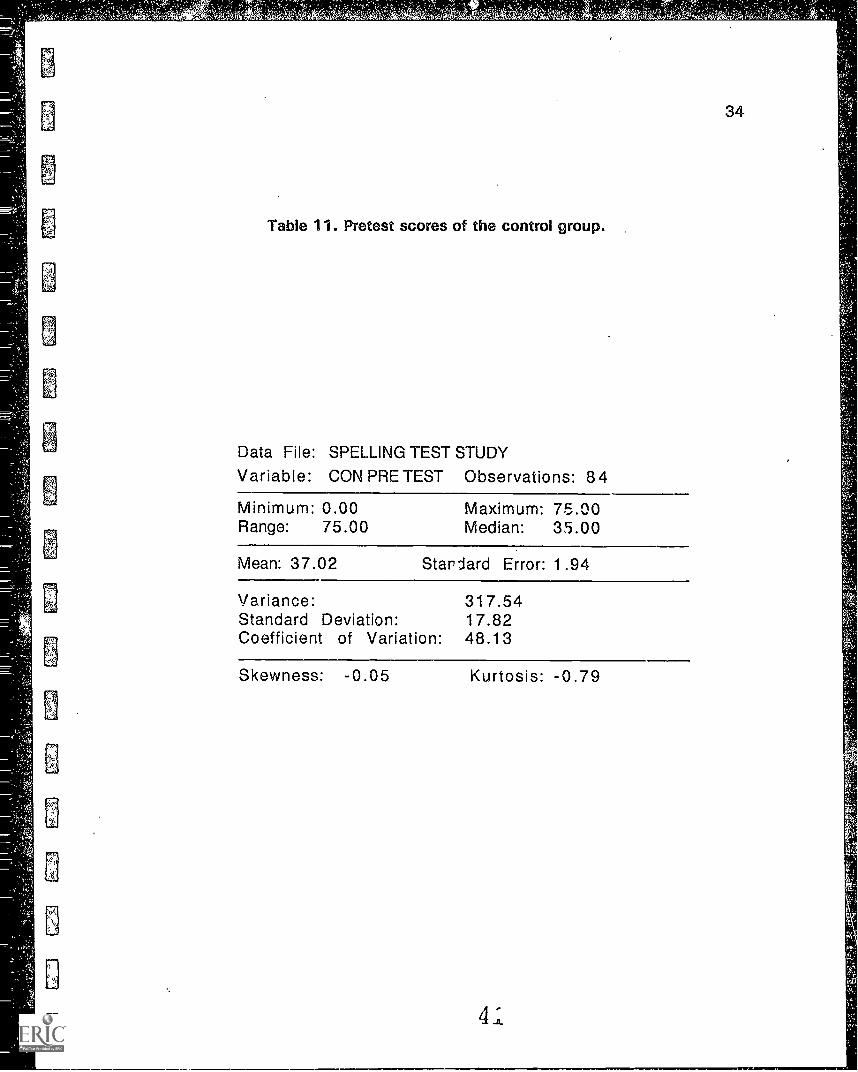
11 Pretest Scores of the Control Group 34
12 Pretest and Posttest Scores of the Experimental Group 35
13 Pretest and Posttest Scores of the Control Group 36
14 Posttest Scores of the Experimental Group 37
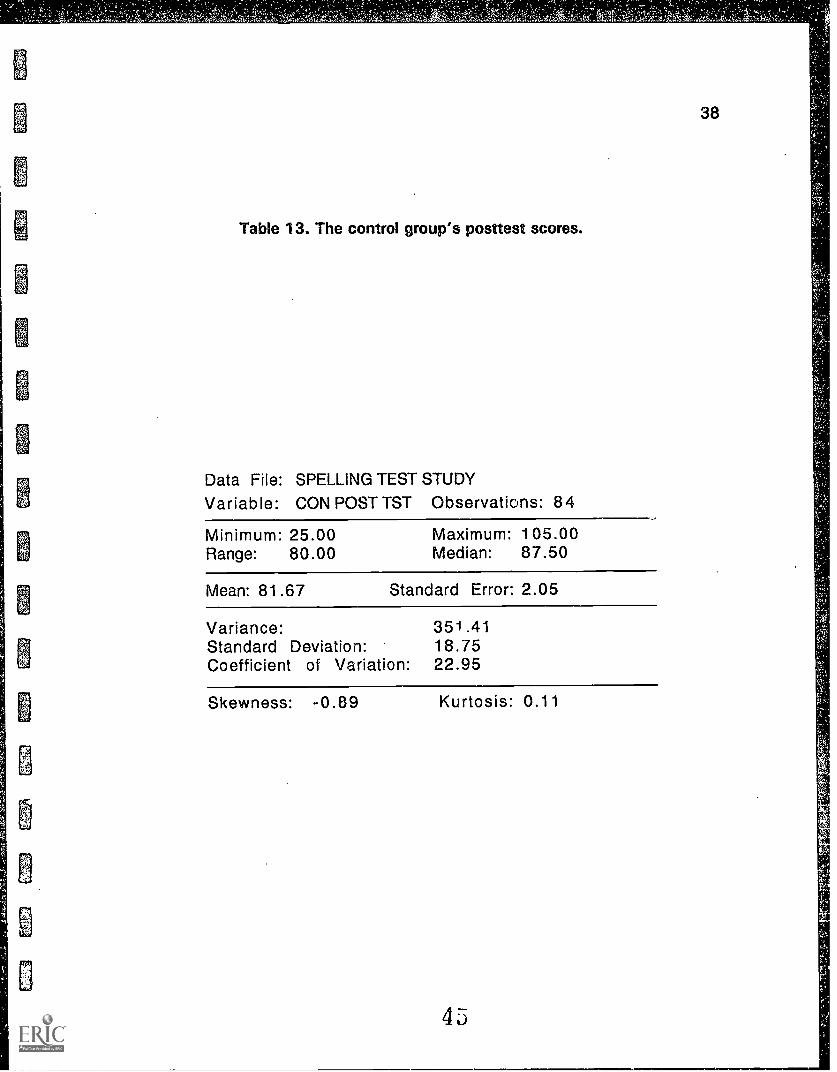
15 Posttest Scores of the Control Group 38
iv

LIST OF FIGURES
FIGURE PAGE
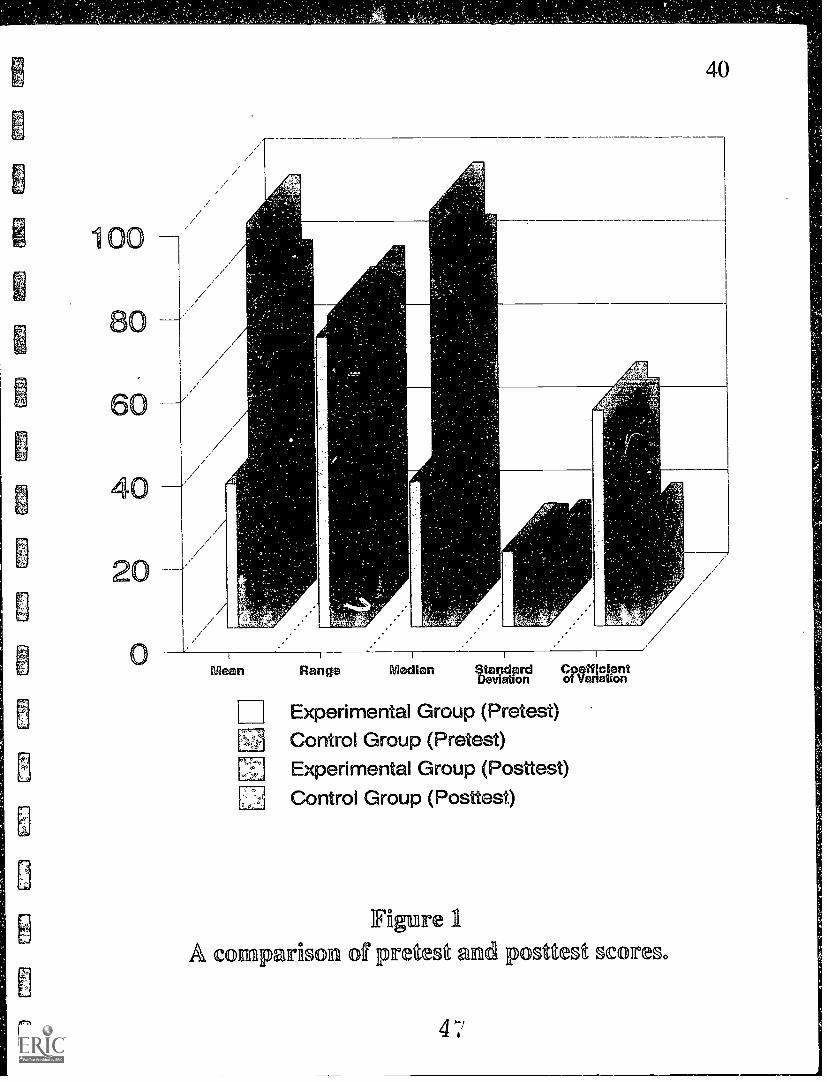
1 A Comparison of Pretest and Posttest Scores 40
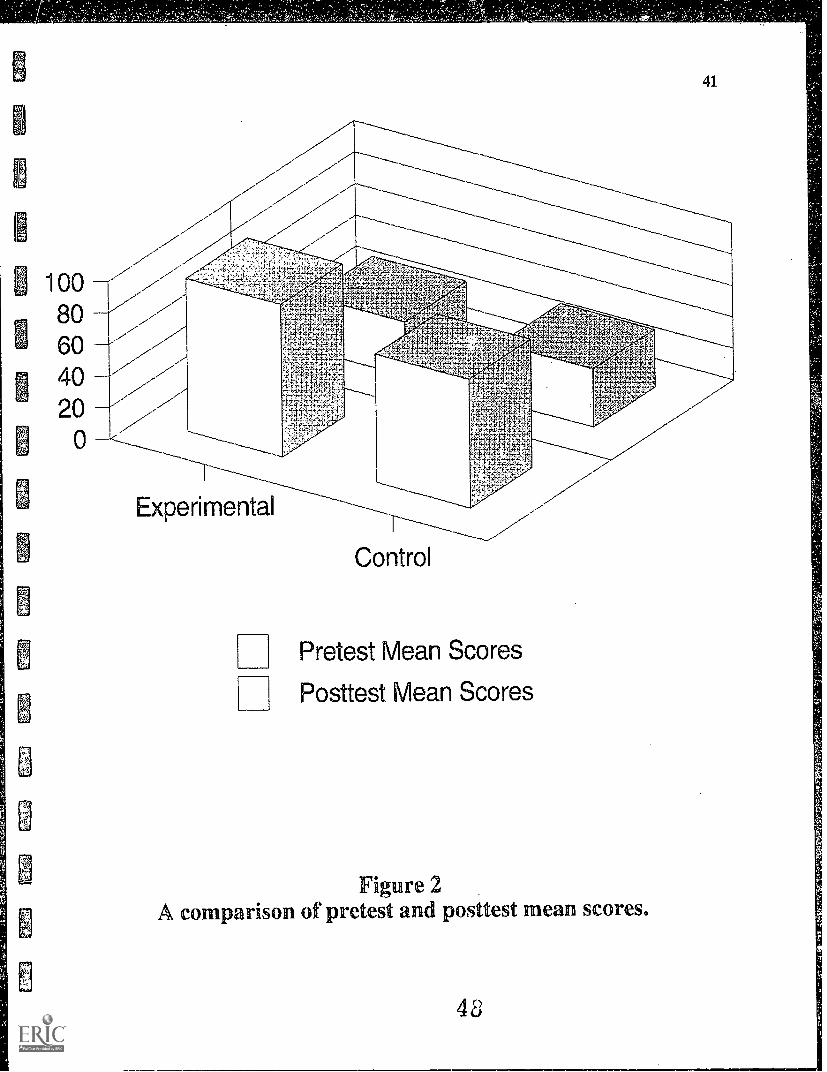
2 A Comparison cf Pretest and Posttest Mean Scores 41
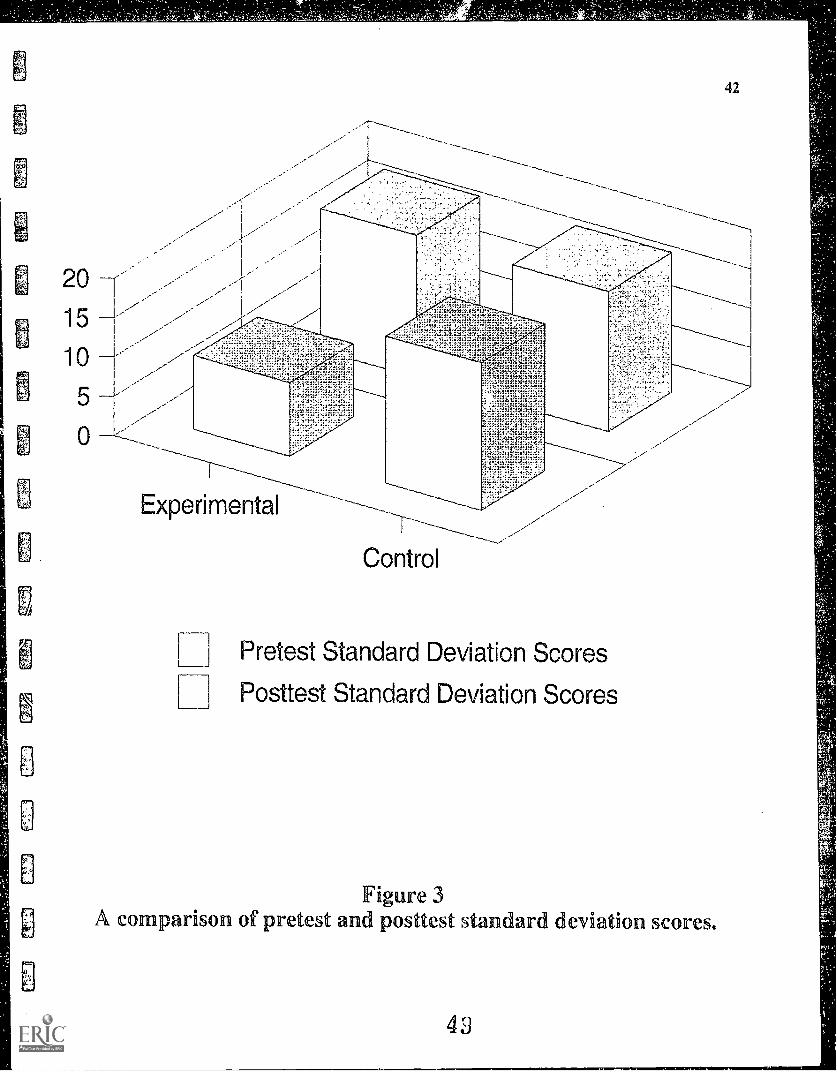
3 A Comparison of Pretest and Posttest Standard Deviation Scores 42
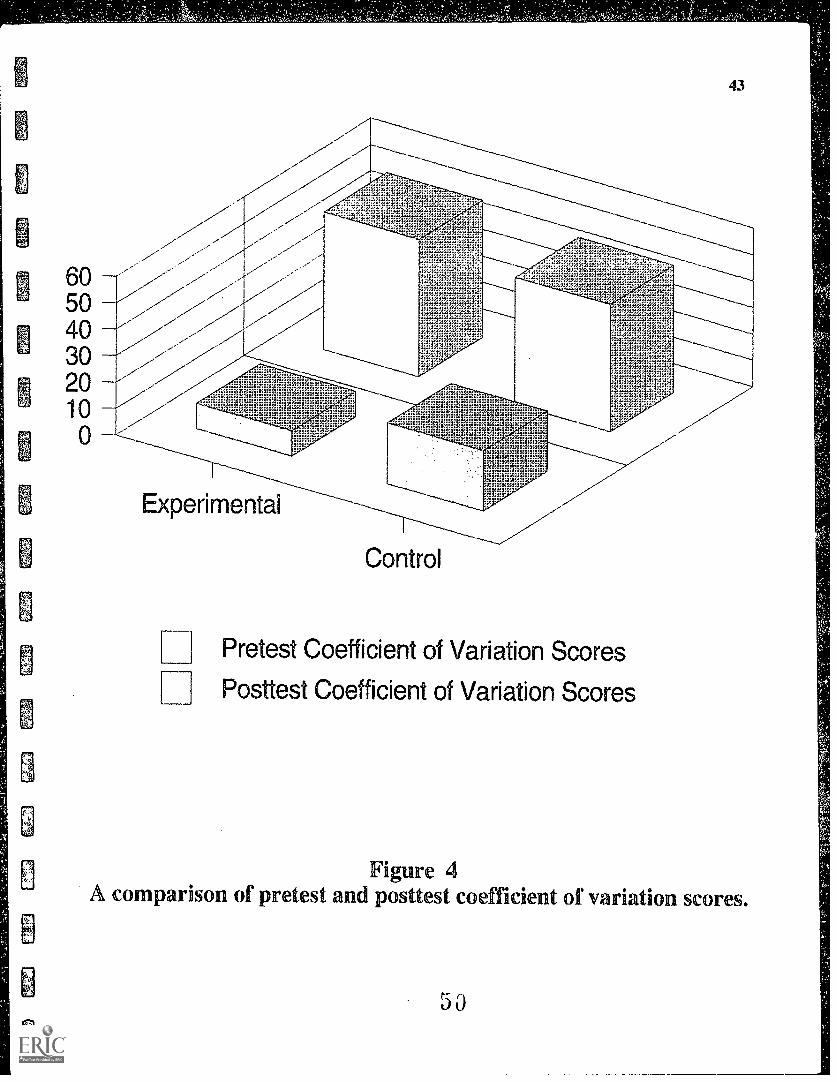
4 A Comparison of Pretest and Posttest Coefficient of Variation Scores 43
5 A Comparison of Pretest and Posttest Median Scores 44
6 A Comparison of Pretest and Posttest Range Scores 45
1
Chapter 1
INTRODUCTION
General Information
An assortment of instructional methods have emerged from traditional methods
of teaching spelling with new perspectives in processing information. Some researchers
believe that one instructional component that is common to effective techniques is that
of immediate, corrective feedback (Gettinger, 1993, p. 39). The effectiveness of
feedback may stem, in part, from the enhancement of memory, attention and
discrimination necessary to master spelling patterns.
Regardless of the many theoretical explanations and spelling techniques
available to teachers, perhaps spelling difficulties may persist simply because regular
classroom instruction does not include sufficient time to master correction spelling by
providing daily, structured practice sessions that include feedback.
Statement of the Problem
Some students perform better than others on a spelling test.
Purpose
The purpose of this study is to explore the effectiveness of adding a daily
structured practice session of weekly spelling words to the traditional instructional
pattern of pretesting on Monday, posttesting on Friday.
3

2
Importance of the Study
If data suggests there is a significant improvement of students' performance
after adding a systematic practice procedure, then the school district may want to
encourage elementary school teachers to incorporate the technique into their weekly
course schedules.
Definition of Terms
1. Feedback. Refers to a response of suggestions to a proposal, action or
process.
2. Structured Practice. Refers to an organized design where students pair up
each day to repeatedly drill each other on misspelled words for that week's spelling
test.
3. Traditional Methods f Teaching Spelling_ Refers to presenting a list of words
to students on Monday and testing them on Friday.
Null Hypothesis
Spelling scores of students incorporating daily, structured practice sessions do
not significantly differ from scores of students allowed to devise their own study
methods.
Limitations and Delimitations
This study will be limited to Grapeland Independent School District (GISD). it is
delimited to a six-week period beginning Monday, February 6, and ending March 17,
1995. This study is also delimited to 28 second grade students and two teachers at one
elementary school.

3
Assumptions
1. The Grape land Elementary School second grade students used are
representative of other Grape land Independent School District second-graders.
2. The teachers used are representative of other teachers in the Grape land
Independent School District.

Chapter 2
REVIEW OF RELATED LITERATURE AND RESEARCH
Research on spelling ability has witnessed a vigorous but fragmented growth in
the last twenty years (Brown, 1990, p. 365). Many studies on elementary students tend
to focus on second-graders, as this is the grade where formal sp3Iling introduction is
typically introduced (Gentry, 1978, p. 89).
A number of children struggle to learn to spell, with some burdened more than
others. To this latter group, learning is a tedious chore. The possibility that spelling wil'
someday be a tool instead of a toil does not usually occur to students experiencing
difficulties (Gerber & Hall, 1987, p. 34).
Despite the actuality that teachers are familiar with effective research-based
techniques, spelling procedures used in most classrooms are based on textbooks or
other commercially prepared materials. The most cusiomary method has been to
present students with a list of words on Monday, then testing the pupils on Friday,
without any class time permitted for studying (Gettinger, 1993, p. 40).
The reason why this routine continues year after year stems from the fact that
teachers usually do not have the time or resources to devise alternative instruction
(Cronnell & Humes, 1980, p. 59). Pew schools provide study periods devoted to
spelling practice (Greene & Petty, 1959, p. 261). Surveys mailed to participants in a
1986 spelling bee indicated that 80% of those responding spent less than 30 minutes
per week reviewing for spelling tests, even though most experts recommend between
60 to 75 minutes of study time (Olson, Logan & Lindsey, 1988, p. 154-155). At least 20
5
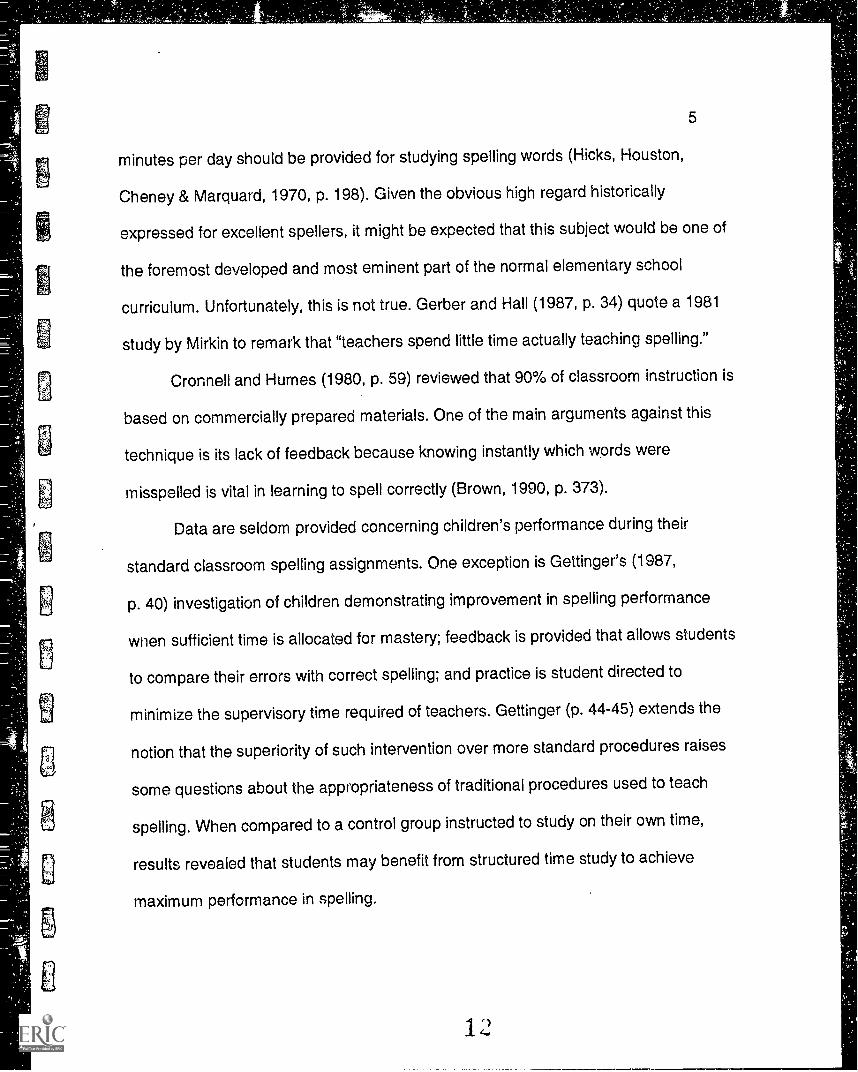
minutes per day should be provided for studying spelling words (Hicks, Houston,
Cheney & Marquard, 1970, p. 198). Given the obvious high regard historically
expressed for excellent spellers, it might be expected that this subject would be one of
the foremost developed and most eminent part of the normal elementary school
curriculum. Unfortunately, this is not true. Gerber and Hall (1987, p. 34) quote a 1981
study by Mirkin to remark that "teachers spend little time actually teaching spelling."
Cronnell and Humes (1980, p. 59) reviewed that 90% of classroom instruction is
based on commercially prepared materials. One of the main arguments against this
technique is its lack of feedback because knowing instantly which words were
misspelled is vital in learning to spell correctly (Brown, 1990, p. 373).
Data are seldom provided concerning children's performance during their
standard classroom spelling assignments. One exception is Gettinger's (1987,
p. 40) investigation of children demonstrating improvement in spelling performance
when sufficient time is allocated for mastery; feedback is provided that allows students
to compare their errors with correct spelling; and practice is student directed to
minimize the supervisory time required of teachers. Gettinger (p. 44-.45) extends the
notion that the superiority of such intervention over more standard procedures raises
some questions about the appropriateness of traditional procedures used to teach
spelling. When compared to a control group instructed to study on their own time,
results revealed that students may benefit from structured time study to achieve
maximum performance in spelling.
I4-
6
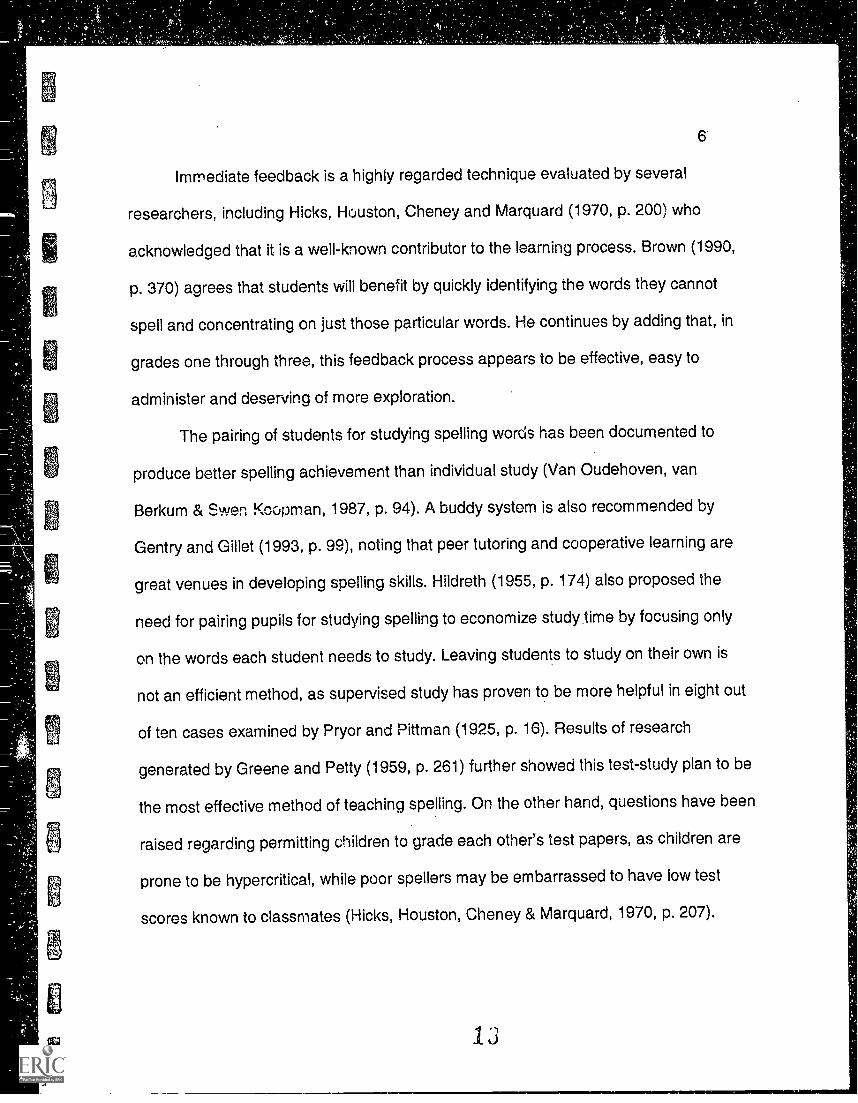
Immediate feedback is a highly regarded technique evaluated by several
researchers, including Hicks, Houston, Cheney and Marquard (1970, p. 200) who
acknowledged that it is a well-known contributor to the learning process. Brown (1990,
p. 370) agrees that students will benefit by quickly identifying the words they cannot
spell and concentrating on just those particular words. He continues by adding that, in
grades one through three, this feedback process appears to be effective, easy to
administer and deserving of more exploration.
The pairing of students for studying spelling words has been documented to
produce better spelling achievement than individual study (Van Oudehoven, van
Berkum & St.Alen Koopman, 1987, p. 94). A buddy system is also recommended by
Gentry and Gillet (1993, p. 99), noting that peer tutoring and cooperative learning are
great venues in developing spelling skills. Hildreth (1955, p. 174) also proposed the
need for pairing pupils for studying spelling to economize study time by focusing only
on the words each student needs to study. Leaving students to study on their own is
not an efficient method, as supervised study has proven to be more helpful in eight out
of ten cases examined by Pryor and Pittman (1925, p. 16). Results of research
generated by Greene and Petty (1959, p. 261) further showed this test-study plan to be
the most effective method of teaching spelling. On the other hand, questions have been
raised regarding permitting children to grade each other's test papers, as children are
prone to be hypercritical, while poor spellers may be embarrassed to have low test
scores known to classmates (Hicks, Houston, Cheney & Marquard, 1970, p. 207).
7
Chapter 3
METHODS AND PROCEDURES
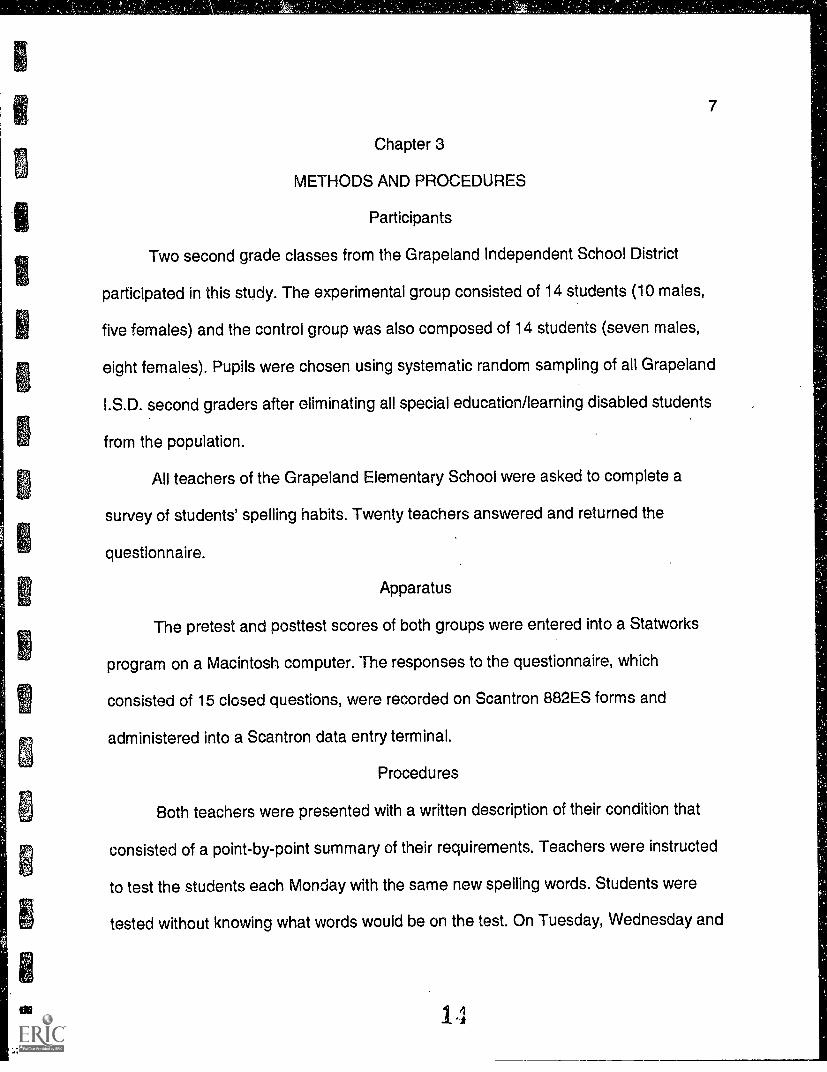
Participants
Two second grade classes from the Grape land Independent School District
participated in this study. The experimental group consisted of 14 students (10 males,
five females) and the control group was also composed of 14 students (seven males,
eight females). Pupils were chosen using systematic random sampling of all Grape land
O.S.D. second graders after eliminating all special education/learning disabled students
from the population.
All teachers of the Grape land Elementary School were asked to complete a
survey of students' spelling habits. Twenty teachers answered and returned the
questionnaire.
Apparatus
The pretest and posttest scores of both groups were entered into a Statworks
program on a Macintosh computer. The responses to the questionnaire, which
consisted of 15 closed questions, were recorded on Scantron 882ES forms and
administered into a Scantron data entry terminal.
Procedures
Both teachers were presented with a written description of their condition that
consisted of a point-by-point summary of their requirements. Teachers were instructed
to test the students each Monday with the same new spelling words. Students were
tested without knowing what words would be on the test. On Tuesday, Wednesday and
8
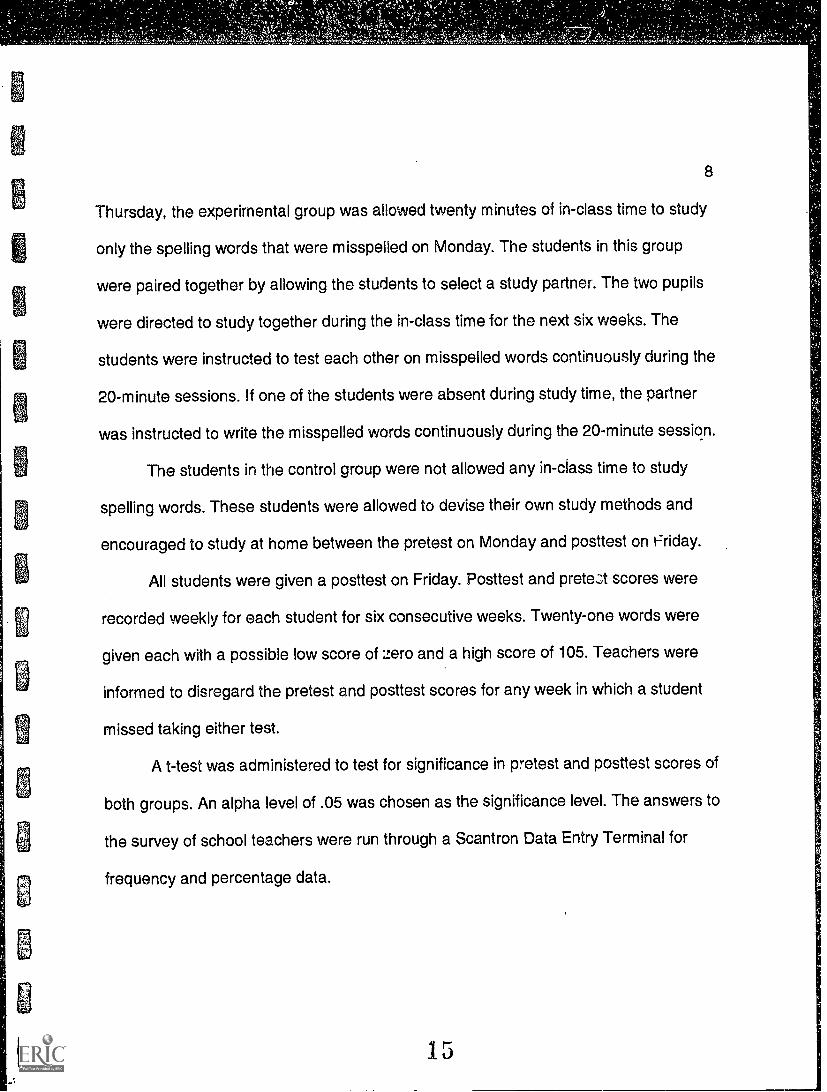
Thursday, the experimental group was allowed twenty minutes of in-class time to study
only the spelling words that were misspelled on Monday. The students in this group
were paired together by allowing the students to select a study partner. The two pupils
were directed to study together during the in-class time for the next six weeks. The
students were instructed to test each other on misspelled words continuously during the
20-minute sessions. If one of the students were absent during study time, the partner
was instructed to write the misspelled words continuously during the 20-minute session.
The students in the control group were not allowed any in-class time to study
spelling words. These students were allowed to devise their own study methods and
encouraged to study at home between the pretest on Monday and posttest on Friday.
All students were given a posttest on Friday. Posttest and pretest scores were
recorded weekly for each student for six consecutive weeks. Twenty-one words were
given each with a possible low score of zero and a high score of 105. Teachers were
informed to disregard the pretest and posttest scores for any week in which a student
missed taking either test.
A t-test was administered to test for significance in pretest and posttest scores of
both groups. An alpha level of .05 was chosen as the significance level. The answers to
the survey of school teachers were run through a Scantron Data Entry Terminal for
frequency and percentage data.
15

9
Chapter 4
PRESENTATION AND ANALYSIS OF DATA
A t-test was used to compare the pretest and posttest averages of the
experimental and control groups. An alpha level of .05 was used in all tests.
The pretest scores from the experimental group consisted of 80 observations.
One child was absent for four consecutive weeks so his scores for those weeks were
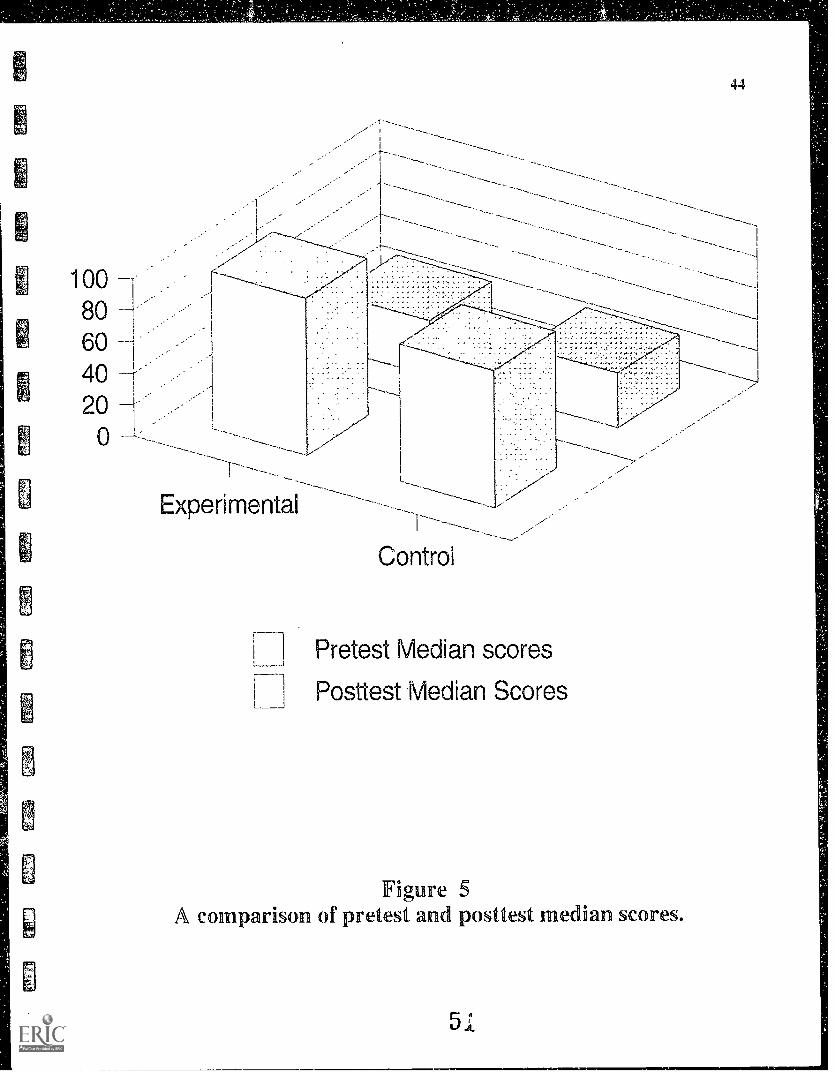
not recorded. Scores produced a mean of 34.75, a range of 70, and a median of 35.
The standard deviation was 18.05 and the coefficient of variation was 51.95. Pretest
scores from the control group consisted of 84 observations with a mean of 37.02, a
range of 75 and a median of 35. The standard deviation was established as 17.82 with
a coefficient of variation of 48.13. Pretest scores were not found to be statistically
significant. Table 1 exhibits the t score was -0.81, 162 degrees of freedom and a
significance of 0.418.
The posttest scores from the experimental group also consisted of 60
observations with a mean of 97.19, a range of 45, and a median of 100. The standard
deviation was 9.34 with a coefficient of variation of 9.61. The posttest scores from the
control group consisted of 84 observations with a mean of 81.67, a range of 80 and a
median of 87.50. The standard deviation was 18.75 with a coefficient of variation of
22.95. The posttest scores were found statistically significant using an alpha level of .05
and the null hypothesis was rejected. Table 2 shows a t score of 6.66, 162 degrees of
freedom and a significance of zero.
The following are frequency and percentage results for each of the variables on

10
the questionnaire regarding spelling study habits. The frequencies and percentages,
shown in Table 3, are a result of running the Scantrons (882ES) through the Scantron
Data Entry Terminal for the IBM computer.
1. Twenty respondents (100%) were females.
2. Six respondents (30%) were between the ages of 20-40; 12 (60%) were
between the ages of 41-60; and two respondents (10%) were 60+ years of age.
3. Fifteen respondents (75%) held bachelors' degrees and five (25%) held
masters' degrees.
4. Ten respondents (50%) primarily taught grades 1-2; six (30%) taught grades
3-4; and four (20%) taught grades 5-6.
5. Eight respondents (40%) had taught in public schools for 0-10 years; ten
(50%) had taught 11-20 years and two (10%) had taught 20+ years.
6. Twenty respondents (100%) had offered class time for studying spelling words
in the past six weeks.
7. Thirteen respondents (65%) think students who are allowed to study spelling
during class time will score higher than those who study on their own. Seven
respondents (35%) said they did not think students would score higher if allowed to
study spelling during class time.
8. Six respondents (30%) have suggested commercial products such as
"Hooked on Phonics" and fourteen (70%) have not.
9. Fourteen respondents (70%) conclude commercial products are helpful
spelling aides; six (30%) do not.
17

11
10. Three (15%) respondents had assigned flash cards for spelling words in the
past six weeks. Seventeen (85%) had not assigned flash cards.
11. Fourteen respondents (70%) thought flash cards are effective study
methods; six (30%) did not.
12. Eighteen respondents (90%) had allocated writing assignments with spelling
words in the past six weeks; two (10%) had not.
13. Nineteen respondents (95%) thought writing assignments are effective study
methods; one (5%) did not.
14. Seventeen respondents (85%) had assigned students to re-write misspelled
words in the past six weeks; three (15%) had not.
15. Twenty respondents (100%) maintained the method of re-writing spelling
words is an effective study habit.

12
Table 1. A comparison of experimental and control groups' pretest scores.
Data File: SPELLING TEST STUDY
Independent Samples...
Variable: EXP PRE TEST CON PRE TEST
Mean: 34.75 37.02Std. Deviation: 18.05 17.82Observations: 80 84
t-statistic: -0.81 Hypothesis:Degrees of Freedom: 162 Ho: 1.11 =Significance: 0.418 Ha: i_11 * 112
13
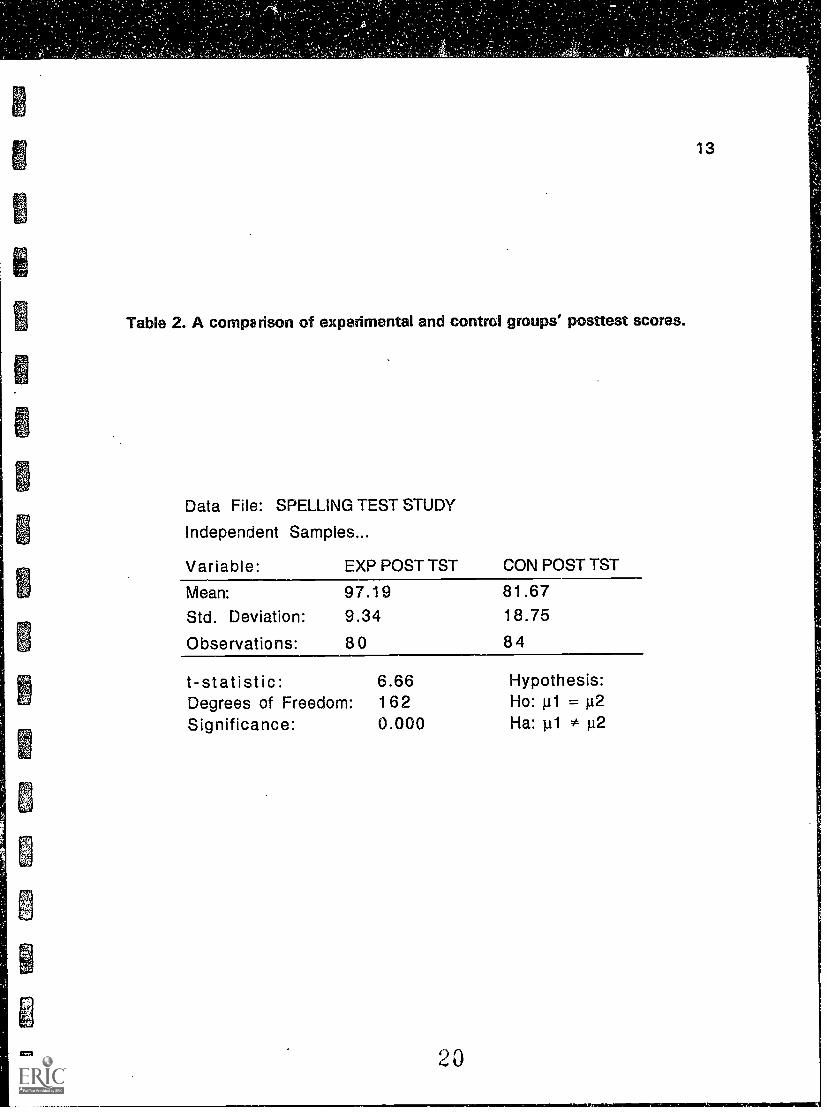
Table 2. A comparison of experimental and control groups' posttest scores.
Data File: SPELLING TEST STUDY
Independent Samples...
Variable: EXP POST TST CON POST TST
Mean:
Std. Deviation:
Observations:
97.199.34
80
81.6718.75
84
t-statistic: 6.66Degrees of Freedom: 162Significance: 0.000
20
Hypothesis:Ho: 1.0 =112Ha: pi #µ2
13
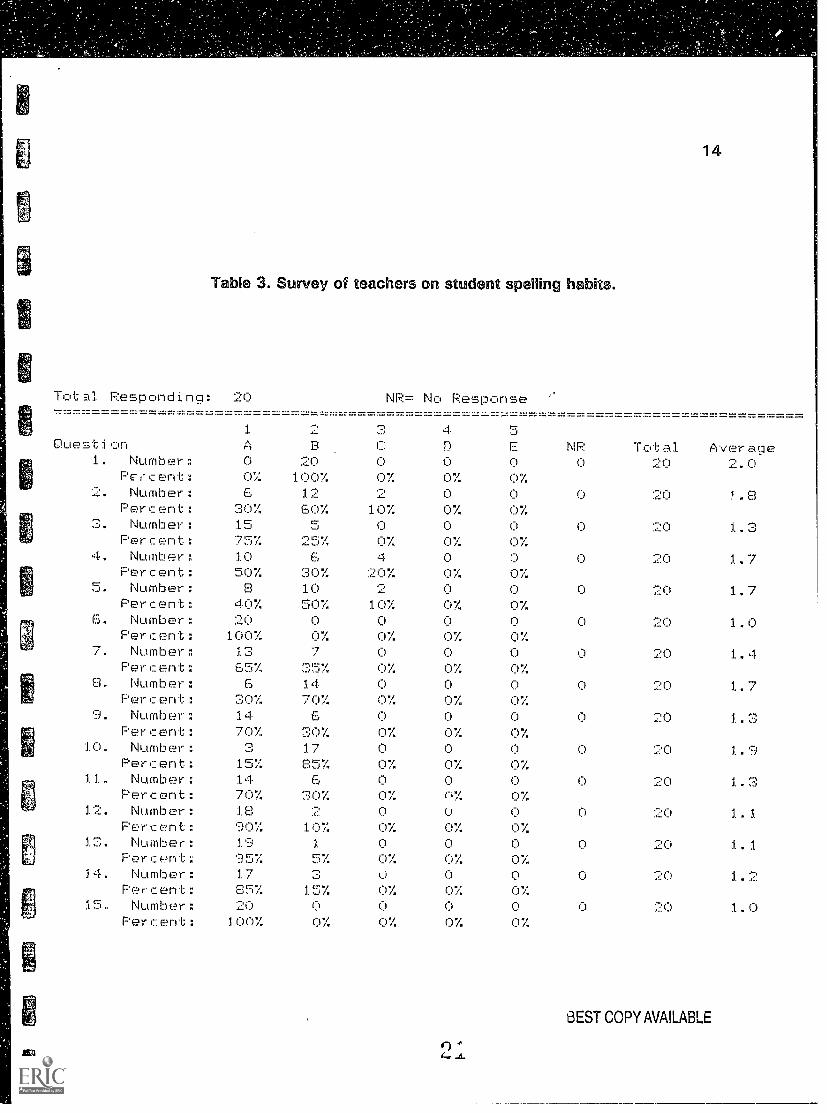
Table 3. Survey of teachers on student spelling habits.
14
Total Responding:
Question1. Number:
Pc(cent:2. Number:
Percent :3. Number:
Percent:4. Number:
Percent:r:. Number:
Percent:6. Number:
Percent:7. Number:
Percent:0, Number:
Percent:S. Number:
Percent:JO. Number:
Percent:11. Number:
Percent:12. Number:
Percent:13. Number:
Percent:14. Number:
Percent:15. Number:
Percent:
20
1
A00::
630%1575%10"0%8
40%20100%1365%6
20%14
70%3 ..:-,
15%14
70%18
'.7.1:1)
05%1785%20100%
2 ..
870100%1260%5
:-'5%
630%1050%00%7
35%14
70%6
30%1785%6
20%2
10%1
5%315%
.-,
0%
NR= No
3C
0
0%210%00%4
:-'0%
2'10%
00%00%00%00%00%00%00%00%u
n%00%
Response
4 'Jn E0 00% 0%0 0
0% n%0
0%
"1.""/.
00%00%0 00% (:1)0:
0 00% 0%0 0
0% 0%0 00% 0%0 00% 0%0 0
1-04 0%0 00%
(--.):
00%0 00% n%0 00% 0%
NP0
0
0
0
0
0
0
0
0
0
0
n
0
0
0
Total20
20
20
20
20
20
20
20
20
20
20
20
20
20
20
Average2.0
1.3
1.3
1.7
1.7
1.0
1.4
1.7
1.3
1.9
1.3
1.1
1.1
1.2
1.0
BEST COPY AVAILABLE

15
Chapter 5
SUMMARY, CONCLUSIONS AND RECOMMENDATIONS
Summary
This study found a significant difference in the averaged posttest spelling
scores of students allowed a daily structured, in-class study period when
compared to the mean scores of students who were not given the same study
time. There was no significant difference in the pretest mean scores of the two
groups.
Thirteen (65%) of the 20 teachers surveyed said that students would
probably score higher on spelling tests if allowed to study words during class time.
All 20 respondents (100%) had offered time for studying spelling words in the past
six weeks.
Conclusions
Adding class time to study spelling words seems to be an effective method
of improving test scores. Instructing the students to point out each other's spelling
errors may have contributed directly to a better knowledge of the spelling of words
and, consequently, to a higher score on the spelling test. This knowledge seems
particularly valuable for assisting students who have a difficult time devising their
own study methods, especially if study time is not set aside at home by a parent
or guardian. In addition, this cooperation between student's may offer a solution for
big classes, where it is difficult for teacher to give students individual attention.
16
Recommendations
While the experimental group did show a significant difference in spelling scores,
it is imperative to retest these students at a later date on the same spelling words to
see if the difference was due to factors other than the treatment. Memorization and
practice may have played a part in the difference in score averages. lf, in fact, the latter
scores are also found to be significantly different, it can be concluded the the in-class
study time is an effective method for improving test scores.
This being the case, I would recommend this method to other teachers of
Grape land Elementary School and ask them to consider incorporating it into their class
schedules during the next school year. Further score comparisons are deserving of
more investigation.
17
References
Brown, A. (1990). A review of recent research on spelling. Educational
Psychology Review. 2. 365-397.
Cronnell, B. & Humes, A. (1980). Elementary spelling: What's really taught.
The Elementary School Journal. 81. 59-64.
Gentry, J. (1978). Early spelling strategies. TheElementary School Journal. 79,
88-92.
Gentry, J. R., & Gillet, 2. W. (1993). Teaching kids to spell. New Hampshire:
Heinemann Education Books, Inc.
Gerber, M. M., & Hall, R. J. (1987). Information processing approaches to
studying spelling deficiencies. Journal of Learning Disabilities. 20. 34-42.
Gettinger, M. (1993). Effects of error correction on third graders' spelling. Journal
of Educational Research. 87. 39-45.
Greene, H. A., & Petty, W. T. (1959). Developing language skills in the
elementary school. Boston: Allyn and Bacon, inc.
Hicks, W. V., Houston, W. R., Cheney, B. D., & Marquard, R. L. (1970). The new
elementary school curriculum. New York: Van Nostrand Reinhold Company.
Hildreth, G. (1955). Teaching spelling. New York: Henry Holt and Company.
Olson, M. W., Logan, J. W., & Lindsey, T. P. (1988). Orthographic awareness
and gifted spellers: Early experiences and practices. Roeper Review. 10, 152-155.
Pryor, H. C., & Pittman, M. S. (1925). A guide to the teaching of spelling. New
York: The Macmillan Company.
04. -At
18
Van Oudehoven, J. P., van Berkum, G., & Swen-Koopman, T. (1987). Effect of
cooperation and shared feedback on spelling achievement. Journal of Educational
Psychology, 79. 92-94.
t-)r-4..(1)

41:
0
APPENDIXES
9
. .
,
. .
,
-
1
21
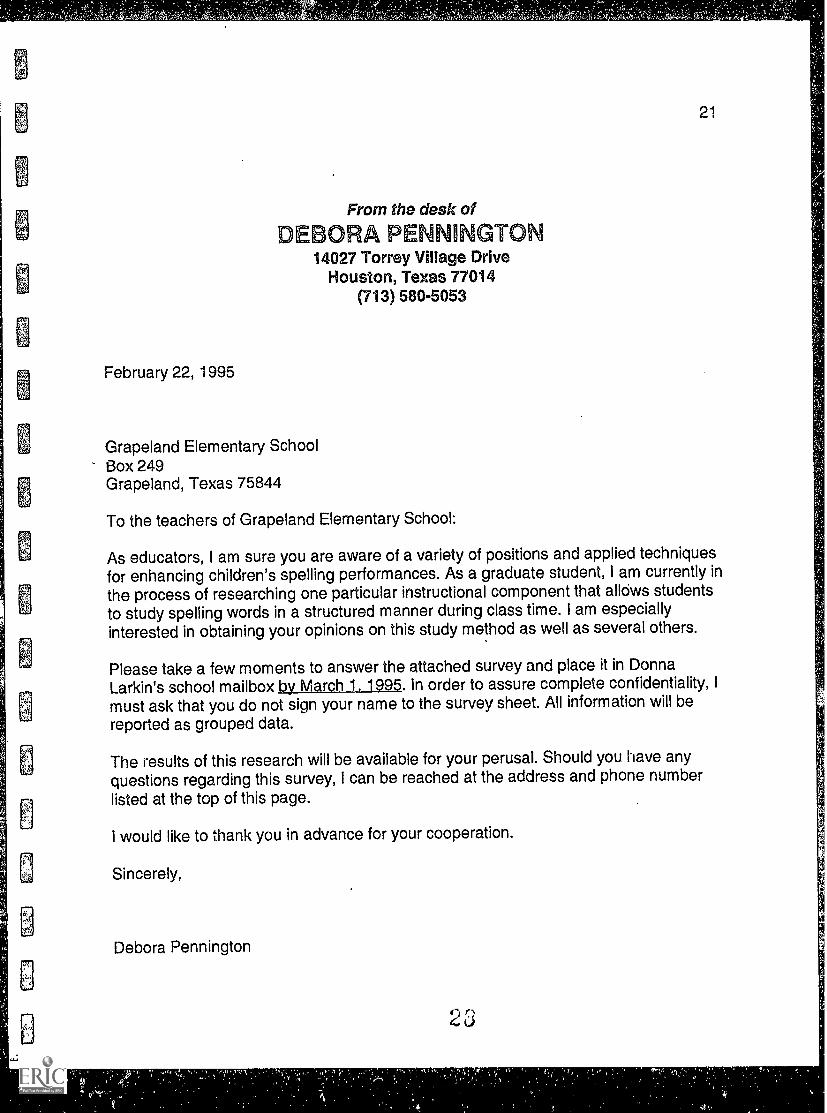
From the desk of
E ORA PENNINGTON14027 Torrey Village Drive
Houston, Texas 77014(713) 580-5053
February 22, 1995
Grape land Elementary SchoolBox 249Grape land, Texas 75844
To the teachers of Grape land Elementary School:
As educators, I am sure you are aware of a variety of positions and applied techniquesfor enhancing children's spelling performances. As a graduate student, I am currently inthe process of researching one particular instructional component that allows studentsto study spelling words in a structured manner during class time. I am especiallyinterested in obtaining your opinions on this study method as well as several others.
Please take a few moments to answer the attached survey and place it in DonnaLarkin's school mailbox by March 1, 1995. In order to assure complete confidentiality, Imust ask that you do not sign your name to the survey sheet. All information will bereported as grouped data.
The results of this research will be available for your perusal. Should you have anyquestions regarding this survey, i can be reached at the address and phone numberlisted at the top of this page.
I would like to thank you in advance for your cooperation.
Sincerely,
Debora Pennington
23

ELLI
22
Directions: Please circle only one answer for each question.
1. Sex
2. Age
3. Highest Degree4. Grade level you primarily teach5. Years you have taught in public schools
A B C
Male Female
20-40 41-60 60+
Bachelor Master Other
1-2 3-4 5-6
0-10 11-20 20+
6. Have you offered class time for studying Yes No
spelling words in the past six weeks?
7. Do you think students who are allowed to Yes No
study spelling during class time will scorehigher than those who study on their own?
8. Have you ever suggested any commercial Yes No
products such as "Hooked on Phonics"?
9. Do you think commercial products are Yes No
helpful spelling aides?
10. Have your students made flash cards for Yes No
spelling words during class time in thepast six weeks?
11. Do you think the flash card method of Yes No
studying is effective?
12. In the past six weeks, have you Yes No
allocated writing assignmentswith the spaing words, such assentences or stories?
13. Do you think this writing method of Yes No
of studying spelling words is effective?
14. In the past six weeks, have you Yes No
assigned students to re-writetheir misspelled words?
15. Do you think this method of re-writingspelling words is effective?
Yes No
Please return to Donna Larkin by Friday, March 3, 1995.
23
APPENDIX B
FREQUENCY AND PERCENTAGE TABLES
0

24
Table 4. Survey of teachers in grades 1-2 concerning student spelling habits.
Total Responding:
Quest ion
10
1
A2B
NR=No
3 z,
C:
Response
4 5D E NR Total Average
1. Number: 0 10. 0 0 0 0 10 2.0Percent : 0% 1007, 0% 0% 0%
2. Number : 4 ...-, 1 0 0 0 10 1.7
Percent: 40% 50% 10% 0% 0%3. Number: 7 3 0 0 0 0 10 1.3
Percent: 70% 30% 0% 0% 0%4. Number: 10 0 0 0 0 0 10 1.0
Percent : 100% 0% 0% 0% 0%
5. Number: 3 6 1 0 0 0 10 1.8
Percent: 30% 60% 10% 0% 0%6. Number : 10 0 0 0 0 0 10 1.0
Percent : 100% 0% 07. 0% 0%
7. Number : 6 4 0 0 0 0 10 1.4
Percent : 60% 40% 0% 0% 0%
C. Number: 2 S 0 0 0 0 10 1.8
Percent : 20% 80% 0% ()X. ox9. Number : 7 3 0 0 0 0 10 1.3
Percent : 70% 30% 0% 0% 0%10. Number : 2 9 0 0 0 0 10 1.8
Percent : 20% 80% 0% 0% 0%
11. Number : 7 3 ..:,0 0 0 0 10 13
Percent : 70% 30% 0% 0% 0%
12. Number : 10 0 0 0 0 0 1.0 1.0
Percent : 100% 07, 0% 0% 0%
13. Number : 10 0 0 0 0 0 10 1.0
Percent : 100% 07, 07. 0% 0%
14. Number : 9 1 0 0 0 0 10 1.1
Percent : 90% 10% 0% 0% 0%
15. Number : 10 0 0 0 0 0 10 1.0
Percent: 100% 0% 07, 0% 0%
3
25
Table 5. Survey of teachers in grades 3-4 concerning student spelling habits.
Tot al Respond n Q
Question
6
1
A
--.
B
NR=No Response_ -_ ^
,J-:1 4 5C D E NP Total Average
1. Number : 0 6 0 0 0 0 6 2.0Percent: 07. 1007. 07. 07. 07,
2. Number : 1 4 1 0 0 0 6 2.0Percent: 17% 677. 177. 07. 07,
3. Number : 4 2 0 0 0 0 6 1.3Percent: 677. ,,--,./.:,,D,. 07. 07. 07.
4. Number : 0 6 0 0 0 0 6 2.0Percent: 0% 100% 0% 0% 07.
5. Number : 2 3. . , 1 0 0 0 6 1.8Percent: 337. 507. 177. 07. 0%
6. Number : 6 0 0 0 0 0 6 1.0Percent: 1007. 07, 07. 07. 07
7. Number : 4 2 0 n () 0 6 1.3Percent: 67% 337. 0% n% 07.
8. Number : 3 3 0 n 0 0 6 1.5Percent: 507. 50% 0% 07 07.
9. Number : 4 2 0 0 0 0 6 1.3Percent: 67% 33% 07. 07. 0%
10. Number: 1 u 0 0 0 0 6 1.8Percent: 177. 837. 0% 07, 07.
11. Number : 5 1 0 0 0 0 6 1.2Percent: fl:.:17. 177. 07. 07. 07,
1 2 . Number: 6 0 0 0 0 0 6 1.0Percent: 1007. 0% 0% 0% 0%
13. Number : 6 0 0 0 0 0 6 1.0Percent: 1007. 07. 0% 0% 0%
14. Number : 5 1 0 0 0 0 6 1.2Percent: 837. 177. 07. 0% 07.
15. Number : 6 0 0 n 0 0 6 1.0Percent: 1007. 0% 0% 0% 0%
1.4
26
Table 6. Survey of teachers in grades 5-6 concerning student spelling habits.
Tot al Responding:_ _
Question
4
1
A2B
NR=Nci Response
3 4 5C D E NR Tot al Aver age
1. Number : 0 4 0 0 0 0 4 2.0Percent: 0% 100% 0% 0% 0%
2. Number : 1 3 ,D 0 0 0 0 4 1.8Percent: 25% 75% 07. 0% 0%
3. Number : 4 0 0 0 0 0 4 1.0
Percent: 100% 0% 07. 0% 0%4. Number : 0 0 4 0 0 0 4 3.0
Percent: 0% 0% 100% 0% 0%5. Number : :.)3, 1 0 0 0 0 4 1.3
Percent: 75% 2 ...1 I. 0% 0% 0%6. Number: 4 0 0 0 0 0 4 1.0
Percent: 100% 0% 0% 0% 0%7. Number : 3 ,..-., 1 0 0 0 0 4 1.3
Percent: 75% 25% 0% 0% 0%8. Number : 1 3 ,..:,
0 0 0 0 4 1.8
Percent: 25% 757. 0% 0% 0%9. Number: 3 1 0 0 0 0 4 1.3
V Percent: 757. ....:,..,, 0% 0% 0%10. Number : 0 4 0 0 0 0 4 2.0
Percent: 0% 100% 0% 0% 0%11. Number : 2 2 0 0 0 0 4 1.5
Percent: 507. 50% 0% 0% 0%12. Number : 2 2 .,,.
0 0 0 0 4 1.5
Per c c?nt : 50% SO% 0% 0';': 0%13. Number : 3 1. 0 0 0 0 4 1.3
Percent: 75% .e....,, 07. 0% 0%
1.4. Number : 3 1. 0 0 0 0 4 1.3
Percent: 75% 25% 07. 07. 0%1.5. Number : 4 0 0 0 0 0 4 1.0
Percent: 1007. 0% 0% 0% 0)7.
;VI,
Table 7. Survey of teachers with 0-10 years experience.
Total Responding: 8 NR=No Response
Question1
A28
3 '-'
C1. Number: 0 8 0 0
Percent: 0% 100% 0%2. Number: 5 3 0 0
Percent: 63% 33% 0%3. Number: 8 0 0
Percent: 100% 0% 0%4. Number: ,3 2 3
Percent: 38% 25% 38%5. Number: 8 0 0
Percent: 10.)% 0% 0%6. Number: 8 0 0
Percent: 100% 0% 0%7. Number: 4 4 0
Percent: 50% 50% 0%S. Number: 3 5 0
Percent: 38% 63% 0%9. Number: 6 2 0
Percent: 75% 25% 0%10. Number: 0 8 0
Percent: 0% 100% 0%11. Number: 5 J 3 0
Percent: 63% 38% 0%12. Number: 6 2 0
Percent: 75% 25% 0%13. Number: 7 1 0
Percent: 88% 13% 0%14. Number: 6 2 0
Percent: 75% 25% 0%15. Number: 8 O. 0
Percent: 100% 0% 0%
4
D
',JE NR Total Average
0 0 0 8 r, 2.00% 0%0 0 0 8 1.40% 0%0 0 0 8 1.00% 0%0 0 0 8 2.00% 0%0 0 0 e 1.00% 0%0 0 0 8 1.00% 0%0 0 0 8 1.50% 0%0 0 0 8 1.60% 0%0 0 0 8 1.30% 0%0 0 0 8 2.00% 0%0 0 0 8 1.40% 0%0 0 0 8 1.30% 0%0 0 0 8 1.10% 0%0 0 0 8 1.30% 0%0 0 0 8 1.00% 0%
4'1
28
Table 8. Survey of teachers with 11-20 years experience.
Total Responding:________________________
Question
10
1
A2B
NR=No Response
,, 4 5C D E NR Total Average
1. Number: 0 10 0 0 0 0 10 2.0Percent: 0% 100% 0% 0% 0%
2. Number: 1 8 1 0 0 0 10 2.0Percent: 10% 80% 10% 0% 0%
3. Number: 6 4 0 0 0 0 10 1.4Percent: GO% 40% 0% 0% 0%
4. Number: 6 3 , 1 0 0 0 10 1.5Percent: 60% 30% 10% 0% 0%
5. Number: 0 10 0 0 0 0 1.0 2.0Percent: 0% 100% 0% 0% 0%
6. Number: 10 0 0 0 0 0 10 1.0Percent: 100% 0% 0% 0% 0%
/. Number: 7 3 0 0 0 0 1.0 1.3Percent: 70% 30% 0% 0% 0%
8. Number: 2 8 0 0 0 0 10 1.8Percent: 20% BO% 0% 0% 0%
9. Number: 6 4 0 0 0 0 10 1.4Percent: 60% 40% 0% 0% 0%
10. Number: 2 8 0 0 0 C) 10 1.8Percent: 20% BO% 0% 0% 0%
11. Number: 7 3 , 0 0 0 0 10 1.3Percent: 70% 30% 0% 0% 0%
12. Number: 10 0 0 0 0 0 10 1 . 0Percent: 100% 0% 0% 0% 0%
13. Number: 10 0 0 0 0 0 10 1.0Percent: 100% 0% 0% 0% 0%
14. Number: 9 1 0 0 0 0 1,0 1.1Percent: 90% 10% 0% 0% 0%
15. Number: 10 0 0 0 0 0 10 1.0Percent: 100% 0% 0% 0% 0%
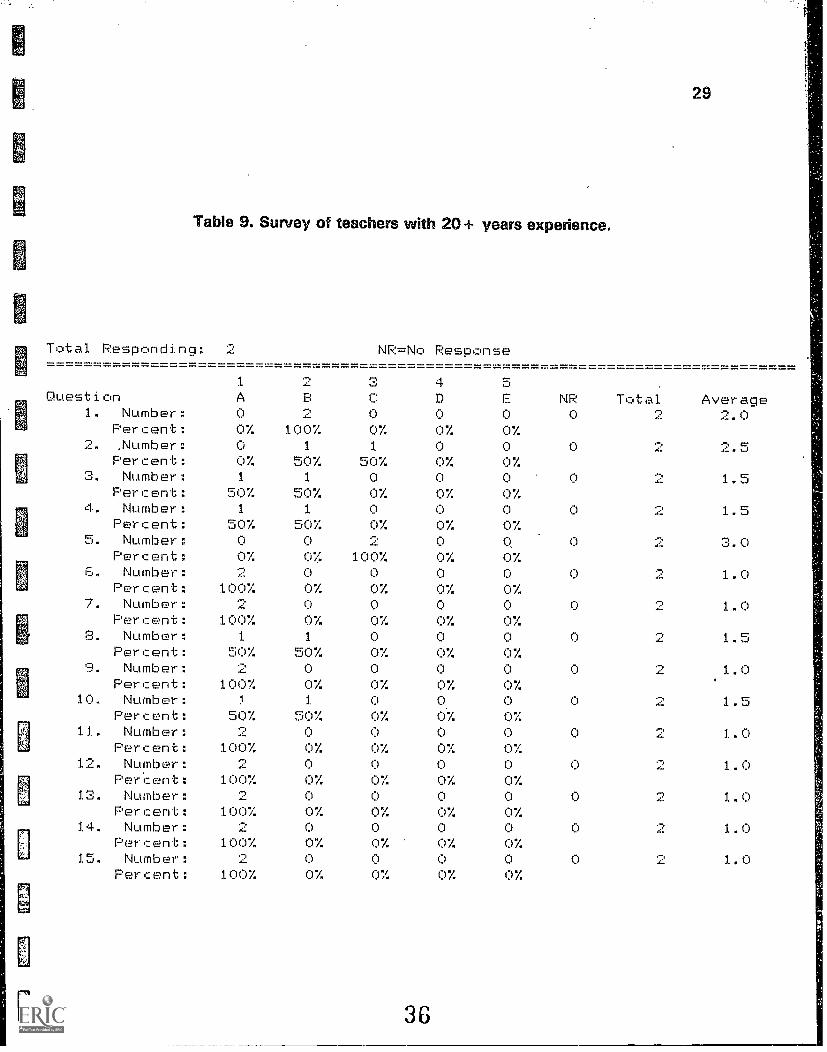
Tabe 9Sof teachers with 20 + yeas pce.
Tot al Responding : 2 NR=No Response
29
Quest i on1. Number :
Per c en t :2. . Number :
Per cent :3. Number:
Per c en t :4. Number :
Per c en t :5. Number :
Per cent ;6. Number :
Per c en t :7. Number :
Percent:8. Number:
Per cent :F. Number :
Per cent :10. Number :
Per c en t11. Number :
Per c en t :12. Number :
Percent:13. Number :
Percent:14. Number:
Per c en t15. Number:
Percent:
_
t 2 ,7.,., 4 5A B C: D E NR Tot al AverageO 2 0 0 0 0 2 2.0a% 100% 0% 0% 0%O 1 1 0 0 0 2 2.50% 507. 50% a% 07.1 1 0 0 0 0 2 - 1.5
507 507. 0% 0% 07.1 1. 0 0 r) 0 2 - 1.3
507. 507. 07 07. 07.O 0 2 0 0 0 2 3.00% 07. 1007. 07. 07..2 0 a a 0 0 2 1.0
100% 0% 0% 0% 0%2 0 0 0 0 0 .-.- 1.0
1007. 07. 07. 07. 07.1 1 0 a a a 2 15
507. 507. 07. 0% 0%2 0 0 0 0 0 2 1.0
100% a% a% 0% 071 1 0 0 0 0 :2 1.5
507 50% 07 07 a%2 0 0 0 0 0 2 1.0
100% 0% a% 07 072 0 0 0 0 0 2 1.0
1007. 07 07 0% 0%2 0 0 0 0 0 2 1.0
1007. 07 07 07 07,2 0 0 0 0 0 2 1.0
1007. 07 0% 07. 0%2 0 0 0 0 0 2 1.0
1007. 0% 07. 07. 0%
36

EXP PRE TEST EXP POST TST
SPELLING TEST STUDY
CON PRE TEST CON POST TST
1 30 105 30 952 50 100 50 953 30 105 30 954 60 88 60 955 70 105 45 1006 45 100 25 957 35 105 65 958 40 105 60 559 40 100 45 80
10 65 105 45 9011 35 94 45 10012 25 100 65 10013 60 83 40 9514 55 105 25 8015 25 95 30 5016 30 105 35 7017 20 100 30 6518 55 95 25 10519 30 85 5 6020 30 105 30 7521 30 105 15 9022 45 105 45 2523 20 95 10 9524 10 95 65 7525 20 95 15 10026 5 95 25 5527 5 105 25 5028 50 100 35 7029 35 95 75 10030 45 105 55 8531 20 100 50 7532 35 90 55 7033 55 100 55 6534 60 100 35 10535 20 100 45 10036 45 105 15 5037 70 105 35 6538 70 85 35 9539 25 100 60 8540 40 105 55 7541 10 65 35 9042 40 85 5 9043 25 105 45 9044 20 105 0 10545 40 105 35 9546 70 105 25 7047 50 105 40 8048 45 105 70 10049 45 105 35 8050 45 95 55 9551 70 105 60 4552 45 100 50 9553 10 100 40 10054 10 90 35 10055 35 105 30 9556 5 100 65 55

EXP PRE TEST EXP POST TST
SPELLING TEST STUDY
CON PRE TEST CON POST TST
57 40 80 35 8558 15 105 0 9559 15 85 10 6560 35 90 5 8561 15 100 35 3062 15 95 20 9063 35 90 25 10564 5 90 20 4065 10 90 20 6066 10 60 20 10567 30 105 20 10568 45 105 10 7069 45 100 20 9570 0 95 20 5571 40 90 65 10072 45 105 55 9073 15 85 50 8074 25 80 35 8075 60 100 20 8076 50 85 40 10077 30 85 50 7078 25 90 45 9579 45 105 60 5580 30 105 25 7581 50 9082 55 8583 50 9084 35 75

4
S.
4
-.m
A ID
33
Table 10. Pretest scores of the experimental group.
Data File: SPELLING TEST STUDYVariable: EXP PRE TEST Observations: 80
Minimum: 0.00 Maximum: 70.00Range: 70.00 Median: 35.00
Mean: 34.75 Standard Error: 2.02
Variance: 325.89Standard Deviation: 18.05Coefficient of Variation: 51.95
Skewness: 0.13 Kurtosis: -0.77
40
u
Table 11. Pretest scores of the control group.
Data File: SPELLING TEST STUDYVariable: CON PRE TEST Observations: 84 1.
Minimum: 0.00 Maximum: 75.00Range: 75.00 Median: 35.00
Mean: 37.02 Staniard Error: 1 .94
Variance: 317.54Standard Deviation: 17.82Coefficient of Variation: 48.13
0.Y
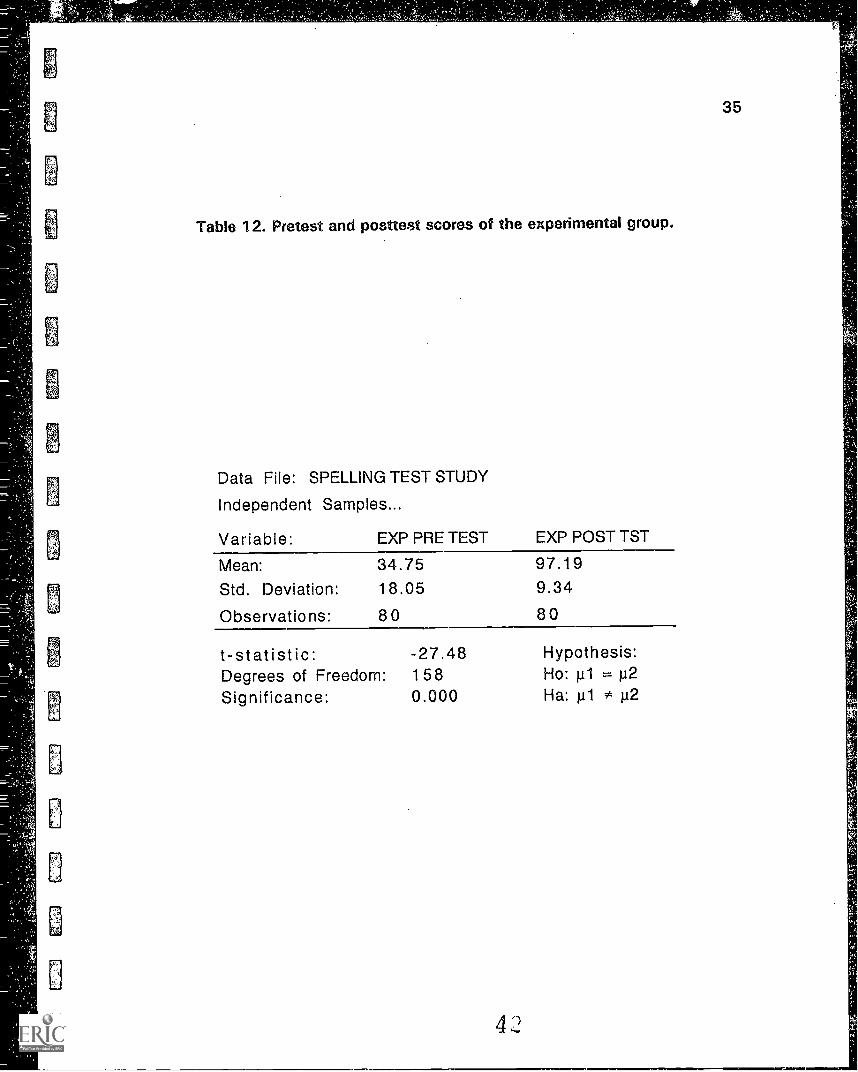
Table 12. Pretest and posttest scores of the experimental group.
Data File: SPELLING TEST STUDY
Independent Samples...
Mean:
Std. Deviation:
Observations:
t-statistic: -27.48 Hypothesis:Degrees of Freedom: 158 Ho: A1 = p2Significance: 0.000 Ha: p1 p2

36
Table 13. Pretest and posttest scores of the control group.
Data File: SPELLING TEST STUDY
Independent Samples...
Variable: CON PRE TEST CON POST TST
Mean: 37.02 81.67Std. Deviation: 17.82 18.75Observations: 84 84
t-statistic: -15.82 Hypothesis:Degrees of Freedom: 166 Ho: 111 =Significance: 0.000 Ha: g1 42
43
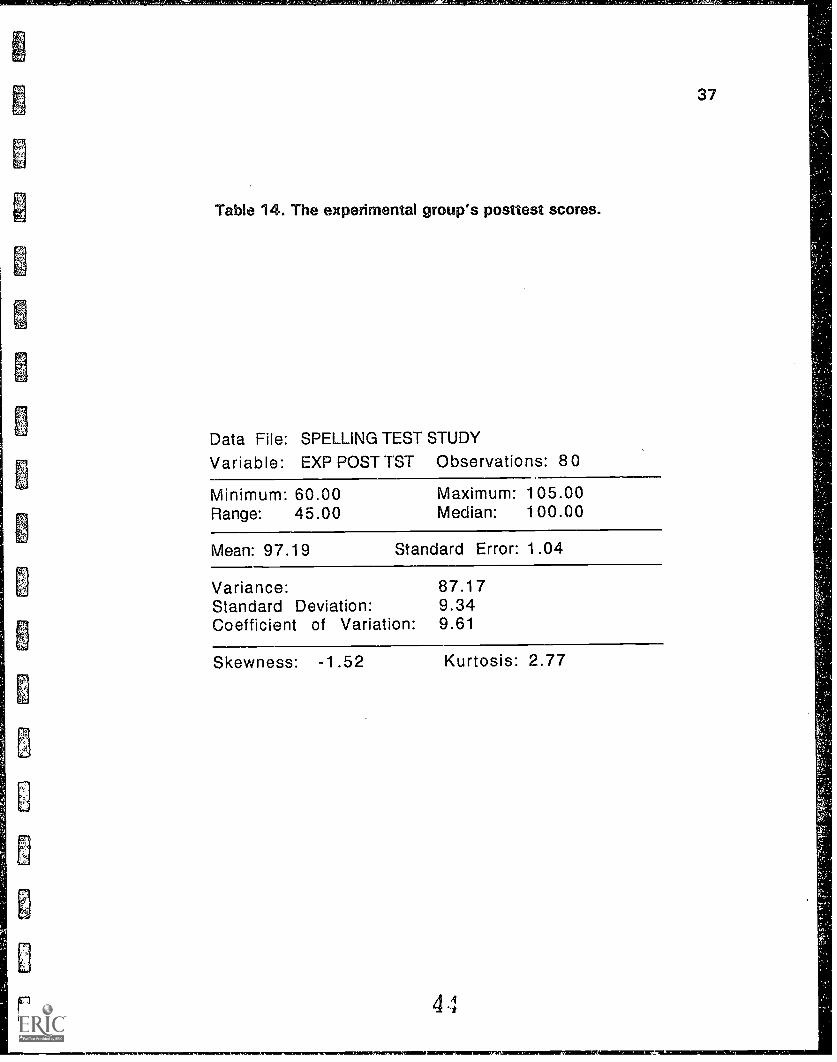
Table 14. The experimental group's posttest scores.
Data File: SPELLING TEST STUDYVariable: EXP POST TST Observations: 80
Minimum: 60.00 Maximum: 105.00Range: 45.00 Median: 100.00
Mean: 97.19 Standard Error: 1.04
Variance: 87.17Standard Deviation: 9.34Coefficient of Variation: 9.61
Skewness: -1.52 Kurtosis: 2.77
B
4
37
38
Table 13. The control group's posttest scores.
Data File: SPELLING TEST STUDYVariable: CON POST TST Observations: 84
Minimum: 25.00 Maximum: 105.00Range: 80.00 Median: 87.50
Mean: 81.67 Standard Error: 2.05
Variance: 351.41Standard Deviation: 18.75Coefficient of Variation: 22.95
Skewness: -0.89 Kurtosis: 0.11
45
APPENDIX D
ADDITIONAL FIGURES
El
I 1
Range Medianttit'grorg
Experimental Group (Pretest)Control Group (Pretest)Experimental Group (Posttest)Control Group (Posttest)
Fit'y re IA comparison of pretest and posttest scores.
47
41
10080 17-60 --vv40 ---
0
Experimental
Control
-44
20
Pretest Mean Scores
Posttest Mean Scores
Figure 2A comparison of pretest and posttest mean scores.
48
42
Experimental
Control
Li Pretest Standard Deviation Scores
Posttest Standard Deviation Scores
Figure 3A comparison of pretest and posttest standard deviation scores.
4J
605040302010
7 7
43
i / ---7-.,- ,7---- % % .7..--
7--..7 .77_7_,7<-----__
7,..- 7---
-7-- %.7.".
0 ---=,
Experimental
Control
Pretest Coefficient of Variation Scores
Posttest Coefficient of Variation Scores
Figure 4A comparison of pretest and posttest coefficient of variation scores.
1 00,1
80 .-
6040 -Jr20
0
44
"7.
Experimental ----------
Control
1 Pretest Median scores
Fl Posttest Median Scores
Figure 5A comparison of pretest and posttest median scores.
51.

45
a
Control
Pretest Range Scores
H Posttest Range Scores
Figure 6A comparison of pretest and posttest range scores.
51)

3
iC
I
'I
.;

Week 1
brimfriendfuriousgrinpresentsmilespotsweetswimtroubleagainstswampsnackfriendlieststayinggrinnedhorribleflamesscream* Apatasaurus
Week 2
anotherbugbutcutdonefunmonthmuchscissorssomechalkhuggedfromrubbedSundaywascuttingpuzzledmaterial
beautiful
'BONUS WORDS
3
Spelling Word List
Week 3 Week 4
cake bettermake brookmay coloronce dinnerpaint doctorpay flavorrain neverraise suppertall sugarthey fireapron waterahead soldiersbirthday sirgave carefullytamales tasteartist guestscene spareTexas perfectMexico aren'tafternoon *gracious*watermelon
Week 4 Week 6
ashamed coverclever delightfather findfinish flyshould lieshow lightshut nighttheir skythem whythought brilliantbushes delightedanything disappearthere sunlightnothing highestshame grapefruitempty climbedcourage escapingchoose likereceived nighttimeEmperor conversation*impossible
47


![Yufu...118 1 1 Ëffiñ,ffiBJJIlL-3066-1 1 æffiffiJï-$]fflJJï-ü841 -5 5-7 097-582- 097—583- 0977—84 -3111 097-583- 1 500 097—582- 0119 0977-85- 2355 097— 542- 097— 583-](https://static.fdocuments.net/doc/165x107/60981a78106b331b15740b06/-118-1-1-ffiffibjjill-3066-1-1-ffiffij-ffljj-841-5-5-7-097-582-.jpg)