DOCUMENT RESUME ED 365 431 PS 021 845 TITLE INSTITUTION ... · DOCUMENT RESUME ED 365 431 PS 021...
71
DOCUMENT RESUME ED 365 431 PS 021 845 AUTHOR Huitt, William G., Ed. TITLE Proceedings from the Annual Graduate Research Symposium (5th, Valdosta, Georgia, May 20, 1991). INSTITUTION Valdosta State Coll., GA. School of Education. PUB DATE 20 May 91 NOTE 71p.; For 1990 Symposium Proceedings, see ED 333 334. PUB TYPE Collected Works Conference Proceedings (021) EDRS PRICE MFOI/PC03 Plus Postage. DESCRIPTORS Academically Gifted; Comparative Analysis; Cooperative Learning; Elementary Secondary Education; Graduate Study; Group Dynamics; Higher Education; *Instructional Effectiveness; *Mathematics Instruction; *Music Education; Parody; Problem Solving; Self Concept; Teaching Methods; *Writing Instruction; Writing Research IDENTIFIERS Explicit Instruction; *Project Follow Through; Writing Style ABSTRACT Covering a wide variety of issues of concern to educators, the papers compiled in this proceedings report present graduate student research on writing instruction, mathematics instruction, cooperative learning groups, a follow-up program to Project Head Start, relationships between language and music, and the self-concept of gifted children. The papers are as follows: (1) "Effect of Writing Parodies on the Writing Style of Advanced Ninth Graders" (J. Albert Rowell); (2) "An Evaluation of Explicit Instruction in Problem-Solving Heuristics in Mathematics" (Wanda L. Sumner); (3) "Effects of Group Processing Skills on the Social Interaction of Cooperative Learning Groups" (Emilie Allen); (4) "Have the Results of Project Follow Through Been Well Utilized?" (Janis N, Lee); (5) "Relationships between Language and Music' (Linda J. Star); and (6) "The Self-Concept of Gifted Children: A Developmental and Comparative Study" (Polyann Diamond). (MM) *********************************************************************** Reproductions supplied by EDRS are the best that can be made from the original document. ***********************************************************************
Transcript of DOCUMENT RESUME ED 365 431 PS 021 845 TITLE INSTITUTION ... · DOCUMENT RESUME ED 365 431 PS 021...

DOCUMENT RESUME
ED 365 431 PS 021 845
AUTHOR Huitt, William G., Ed.TITLE Proceedings from the Annual Graduate Research
Symposium (5th, Valdosta, Georgia, May 20, 1991).INSTITUTION Valdosta State Coll., GA. School of Education.PUB DATE 20 May 91NOTE 71p.; For 1990 Symposium Proceedings, see ED 333
334.
PUB TYPE Collected Works Conference Proceedings (021)
EDRS PRICE MFOI/PC03 Plus Postage.DESCRIPTORS Academically Gifted; Comparative Analysis;
Cooperative Learning; Elementary Secondary Education;Graduate Study; Group Dynamics; Higher Education;*Instructional Effectiveness; *MathematicsInstruction; *Music Education; Parody; ProblemSolving; Self Concept; Teaching Methods; *WritingInstruction; Writing Research
IDENTIFIERS Explicit Instruction; *Project Follow Through;Writing Style
ABSTRACTCovering a wide variety of issues of concern to
educators, the papers compiled in this proceedings report presentgraduate student research on writing instruction, mathematicsinstruction, cooperative learning groups, a follow-up program toProject Head Start, relationships between language and music, and theself-concept of gifted children. The papers are as follows: (1)
"Effect of Writing Parodies on the Writing Style of Advanced NinthGraders" (J. Albert Rowell); (2) "An Evaluation of ExplicitInstruction in Problem-Solving Heuristics in Mathematics" (Wanda L.Sumner); (3) "Effects of Group Processing Skills on the SocialInteraction of Cooperative Learning Groups" (Emilie Allen); (4) "Havethe Results of Project Follow Through Been Well Utilized?" (Janis N,Lee); (5) "Relationships between Language and Music' (Linda J. Star);and (6) "The Self-Concept of Gifted Children: A Developmental andComparative Study" (Polyann Diamond). (MM)
***********************************************************************
Reproductions supplied by EDRS are the best that can be madefrom the original document.
***********************************************************************

1a
U S DEPARTMENT OF EDUCATIONRes,eaKIN and improvement
EDUCATIONAL RESOURCES INFORMATIONCENTER (ERIC,
Xin.s document has Deer. reproduced aseceved from the oersOn Of OfQMtAhOn
or.onahngMmot changes have oeeh made to rno,o,,etwoduri.on Quality
Porntsot v.e. or opmons stated., th.s clocumen/ 00 nOt necessarily replesent °Mc.)OE RI positron or policy
PROCEEDINGS FROM THE FIFTH ANNUAL
GRADUATE RESEARCH SYMPOSIUM
SCHOOL OF EDUCATION
PERMISSION TO REPRODUCE THISMATEPIAt HAS BEEN GRANTED By
w
rat FCItKAl riN L RI SOURCE!;1.1 14M6 ION ...Els/ EH ,ERIC
BEST COPY AVAILABLE

Editorial Review Board
Glenda L. Akins, Early Childhood and Reading Education
C. Jay Hertzog, Middle Grades Education
William G. Huitt, Psychology, Counseling, & Guidance
Robert A. Hull, Special Education
Thomas G. Jackson, Health, Education, & Athletics
Robert 0. Michael, Educational Administration & Supervision
Thomas M. Reed II, Special Education
Tonja Root, Early Childhood and Reading Education
Robbie J. Strickland, Secondary Education
Valdosta State College, a unit of the University System of Georgia, does not discriminate on thebasis of race, religion, sex, color, national origin, age, disability, marital status, sexual orientationor as a disabled Vietnam-Era veteran in its education programs or employment.
Valdosta State College is an Affirmative Action/Equal Opportunity Employer
UBEST COPY AV AIL ABLE

PROCEEDINGS FROM THE FIFTH ANNUAL
GRADUATE RESEARCH SYMPOSIUM
SPONSORED BY
THE SCHOOL OF EDUCATION
VALDOSTA STATE COLLEGE
MAY 20, 1991
WILLIAM G. HUITT, EDITOR
The publication of these proceedings is funded by the RegionalEducation Center, School of Education, Valdosta State College
Table of Contents
Effect of Writing Parodies on the WritingStyle of Advanced Ninth GradersJ. Albert Rowell 1
An Evaluation of Explicit Instruction inProblem-Solving Heuristics in MathematicsWanda Sumner 11
Effects of Group Processing Skills on the SocialInteraction of Cooperative Learning GroupsEmilie Allen 19
Have the Results of Project Follow ThroughBeen Well Utilized?Janis Lee 29
Relationships Between Language and MusicLinda Star 37
The Self-Concept of Gifted Children:A Developmental and Comparative StudyPollyann Diamond 45

Preface
The selections presented in this vol-ume are edited versions of papers present-ed at the Fifth Annual Graduate ResearchSymposium sponsored by the School ofEducation at Valdosta State College onMay 20, 1991. The purpose of the gradu-ate research symposium is to acknowl-edge superior work of graduate studentswithin the School of Education and toencourage students to engage in researchactivities.
The Symposium owes its beginningsto efforts made by the Writing Across theCurriculum Committee at Valdosta StateCollege. This college-wide committeewas established to increase awareness ofthe importance of writing as an academicand learning tool. The committee wasappointed by the Vice-President of Aca-demic Affairs and held a number ofworkshops on specific techniques thatcould be used by college faculty to im-pact students' writing skills. As morefaculty encouraged their students to en-gage in writing at the graduate level, ameans was needed to recognize the excel-lent student work being produced.
The first three papers in this volumedescribe research studies completed byauthors in their classrooms. The firstpaper, "Effect of writing parodies on thewriting style of advanced ninth graders,"by J. Albert Rowell describes a researchstudy whose focus is the improvement ofwriting. Wanda Sumner's paper "Anevaluation of explicit instruction in prob-lem-solving hueristics in mathematics"
ii
describes using a variety of strategies toteach problem solving to fifth-grade stu-dents. In her paper entitled "Effects ofgroup processing skills on the socialinteraction of cooperative learninggroups," Emilie Allen reports on teachingsocial skills to third-grade students usingcooperative learning. All authors foundsupport for their treatments in improvingstudent skills.
The use of research results is thefocus of Janis Lee's paper entitled, "Havethe results of Project Follow Throughbeen well utilized?" Ms. Lee considersthe results and controversy resulting fromthe Follow Through experiment of the 60sand 70s and suggests how disseminationof federally-funded research could be im-proved.
In "Relationships between languageand music," Linda Star considers therelationship between the two symbolsystems of language and music. Basedon her review, she suggests that musicshould occupy a more prominent place ineducation curriculum.
In the last paper, Pollyann Diamondreports on her research, "The self-esteemof gifted children: A developmental andcomparative study." The results suggestthat students identified as gifted see them-selves as more scholastically competentthan their non-gifted peers. However, theself-esteem of students selected for aspecial gifted program remained high,while the self-esteem of students notselected for a special program declined.
Acknowledgements
As mentioned in the previous pro-ceedings, these volumes owe a debt tomany people. The members of the Writ-ing Across the Curriculum Committee andthe Vice-President for Academic Affairsare primarily responsible for providing theimpetus to hold the original symposium.F. D. Toth, Dean of the School of Educa-tion, is primarily responsible for provid-ing the resources to hold the symposiumand publish the prxeedings. The editori-al review board, with the assistance offaculty readers Diane Andrew, RussDeavours, John Hummel, Dan Kaeck,Ben McLain, and Marty Meyer, are pri-marily responsible for the selection ofpapers actually presented at the sympo-sium. Ann Hi lgert provided invaluableeditorial assistance while CharleneMc Quire provided typing assistance.
iii

Biographical Sketches of Presenters
Emilie Allen holds a B.S. degree in EarlyChildhood Education from Auburn Uni-versity and an M.Ed. in Early ChildhoodEducation from Valdosta State College.She is currently a teacher at S. L. MasonElementary School in Valdosta, Georgia.
Pollyann Diamond holds a B.S. degree inMusic Education from Gettysburg Col-lege, an M.Ed. degree in ElementaryEducation from Armstrong State College,an M.Ed. degree in Educational andSchool Psychology from Mississippi StateUniversity, and an Ed.S. degree in SchoolPsychology from Valdosta State College.She is currently a teacher in the GiftedEducation Program for Valdosta CitySchools, Valdosta, Georgia.
Janis Lee holds a B.A. degree in historyand an M.Ed. in Early Childhood Educa-tion from Valdosta State College. Shecurrently teachers third grade at HahiraElementary School in Hahira, Georgia.
iv
J. Albert Rowell holds a B.A. degree inEnglish and B.S. and M.Ed. degrees inSecondary Education, all from ValdostaState College. He is currently a teacherof English at Lowndes High School inValdosta, Georgia.
Linda Star holds B.M. and M.Ed. degreesin Music Education, both from ValdostaState College. She is currently a graduateassistant in Music Education at ValdostaState College.
Wanda Sumner holds an A.S. degree inmathematics from Abraham BaldwinAgriculture College, and B.S. and M.Ed.degrees in Middle Grades Education fromValdosta State College. She is currentlya math/science teacher in Irwin County,Georgia and is enrolled in the Ed.S. pro-gram in Middle Grades Education atValdosta State College.

Effect of Writing Parodies on the Writing StyleOf Advanced Ninth Grade Students REPRODUCE 1 HIS
BEEN GRANTED BY
J. Albert Rowell
This research project sought to determineif writing style and attitude toward writingmay be improved through a guided processof writing parodies, exaggerated imitationsof literary works. Two groups of advancedninth-grade students at a rural Georgiahigh school participated in the study. Thetreatment group wrote four parodies over8 weeks, while the control group wrotefour traditional essays over the same peri-od. The treatment group made statisticallysignificant gains in writing style. Fluencyand attitude about writing were not statisti-cally significant between the treatment andcontrol groups. The major conclusion wasthat writing parodies is an effective meansof improving student writing style. Furtherresearch should attempt replication of thisstudy and should determine if this processbenefits students at other grade levels.
Prevailing methods of teaching compo-sition generally fail to recognize and nur-ture student style. Emphasis upon correct-ness and the dominance of such artificialforms as the five - paragraph theme yieldstudent writers who produce mechanicallycorrect, stylistically deficient compositions.In Georgia, results of student writing as-sessments indicate significant deficienciesin writing style.
The state of Georgia has instituted abasic skills test to assess student writingcompetency. Students take the writing testin the fall of the 10th grade, and mostindividuals will meet or exceed the state-established passing score on the first at-
TO THE EDUCATIONAL RESOURCESINFORMATION CENTER IERIC1
tempt. Trained raters evaluate studentwriting in five domains: content/ organiza-tion, style, sentence formation, usage, andmechanics. Vr..:hin each domain the stu-dent receives a score of inadequate, mini-mal, good, or very good. Among partici-pants in the fall 1989 administration of thetest, 70% received good or very goodratings for sentence formation; only 30%received inadequate or minimal (see Figure1). Sixty-five percent received simi larlyhigh ratings for usage, and 60% scored atthe good or very good level for mechanics.Sixty-six percent received good or very
50
4C
Percentage. - - -
44
40 1.
Coats nt, 114 'Qv., WM. la *chant. IOW.
OrP., for rtionDomain
Inadequate ta., Minimal
Figure 1. Deficiencies per domain instate writing test

good ratings for content/organization.Style, however, represented a weakness formany of the students; 44% were rated asinadequate or minimal on written composi-tion and style (Georgia Department ofEducation 1989). Clearly, improved in-struction is needed in the area of style.
To evaluate style in student composi-tions, raters judge a student's control oflanguage by observing four criteria estab-lished by the Georgia Department of Edu-cation (1990): 1) concrete images anddescriptive language; 2) readability; 3)varied sentence patterns; and 4) appropriatetone for topic, audience, purpose. Thesecomponents of style are desirable outcomesof writing instruction, yet student writers inGeorgia perform most poorly in this do-main. One possible explanation is thatteachers who are adept at teaching basicsentence structure, error detection, andoutlining lack strategies for guiding stu-dents to an individual style. One teachingstrategy that holds promise for encouragingstudent style is writing parodies of theworks of established writers.
Imitation is a time-honored method ofinstruction across disciplines. When writ-ing a parody, a student reads a work, iden-tifies its fundamental structure and style,then writes an imitation which follows theoriginal structure, but exaggerates keyelements, including noticeable style traits.This research project investigates whetherwriting parodies significantly improves thewriting style of ninth-grade students.
Review of the Literature
When teachers of English attempt toteach style, it is ironical they encounterdifficulties, since the present generation ofstudents seems to he particularly sensitive
2
to how things are done In addition, stu-dents seem to want to be seen as unique,but in composition class students hesitateto reveal themselves as individuals. Whileprecision in the mechanics of language isdesirable, instructional focus should berevised to emphasize not only correctnessbut how students express themselves inwriting. A survey of English teachers inthe Southeastern United States found styleto be the least emphasized aspect of com-position (Graves, 1974). According toCorbett (1980), ''The evidence supplied byannual bibliographies of style or of compo-sition and by the articles that appear inother professional journals does not con-firm that the teaching of style is currentlyflourishing in the writing classroom" (p.80). The literature does describe someteaching approaches which aspire to sub-stantially improve student writing throughthe use of models, imitation, and parody.
Teachers may avoid teaching the con-cept of style because the concept itself isnot well defined. Jolly (1982) elaborateson the challenge to teachers of composi-tion: "Teaching style, as opposed to dwell-ing on mechanical and grammatical confor-mity, is an elusive art, elusive because theword itself escapes exact definition. Per-haps Ella Fitzgerald's definition is ade-quate: 'It ain't what you do, it's the wayhowdya do it (p. 39). Narrow definitionslimit style to choices of diction or sentencestructure (Lindemann, 1987). Modernrhetoricians tend to reject the notion ofstyle as ornamentation. Graves (1974)maintains, "Style is not mere decoration,nor is it an end to itself; it is rather a wayof finding and explaining what is true. Itspurpose is not to impress but express" (p.189-190). Corbett (1980) offers a function-al definition of good style as "not mere

ornament" but as a means of expressionthat "facilitates the conveyance of meaningto readers" (p. 85). Although individualsmay disagree on its components, style isgenerally a distinctive, individual means ofexpression that clearly communicates withthe reader.
How can teachers develop studentwriting style? Weathers (1970) suggests,"We can remind students of Aristotle'sobservation, 'character is the making ofchoices,' and point out that since style, byits very nature, is the art of selection, howwe choose says something about who weare" (p. 187). Weathers proposes a specificexercise system: "We would advocatesetting up recognized stylistic material asmodels; the models to be copied until thestudent can create similar but originalversions of his own. It is a process ofcreative imitation . . (p. 189). In hisreview of research on* the use of modelsto teach writing, Hillocks (1986) found thatstudying models alone had a limited effecton writing quality. According to Hillocks,research indicates that using models ismore productive than the study of gram-mar, and that models can help writers ofvarious ages and abilities.
One of the oldest instructional methodsis imitation. Its champions emphasize thatthis process leads ultimately to a distinc-tive, more individual style. Zinsser (1985)encourages the aspiring writer: "Don'tever hesitate to imitate another vcriter--every artist learning his craft needs somemodels. Eventually you'll find your ownvoice and shed the skin of the writer youimitated" (p.126). Jolly (1982) cites LewisMumford in support of imitation: "'Imita-tion then is but one device to hasten theacquisition of an individual's style, anothertool to add to the writer's repertoire'' (p.
39). Grubei (1977) found that imitationproduces measurably better writing withaccurate diction, well-formed sentences,and overall improved organization. Ac-cording to Gruber, creating imitative worksallows students to acquire techniques toshape their own writing: "The act of imita-tion became. a tool to achieve individualfreedom; instead of stifling individualpersonalities, it liberated them" (p. 491).The process of imitation leads students toacquire individual style.
To further involve students in theactive processing of a model, some individ-uals have introduced their students toparody, an exaggerated form of imitation,most often for humorous effect. By study-ing and writing parodies, students donmasks, freeing themselves to experimentwith new expression (Clark & Motto,1986). Zahlan (1987) advocates parody asa means for students to develop individualstyle by "trying-on" the styles of estab-lished writers. According to Zahlan, "imi-tation to be effective must be informed,deliberate, creative" (p. 2). To facilitatedevelopment of student writing style, Zah-lan advocates a program of assignmentsprogressing from model analysis, throughimitation and parody, to the realization ofan individual style. Zahlan maintains thatparody bridges the gap between acquisitionof components of style and manifestationof individual style.
Style should be a vital concern for allteachers of composition. Parody holdsparticular promise as a means to developstyle because the student must analyze andact on the original model. Parody involvesstudents in the composing process andinvites them, in a non-threatening way, totry on new styles. The literature indicatessignificant improvements in style are possi-
3
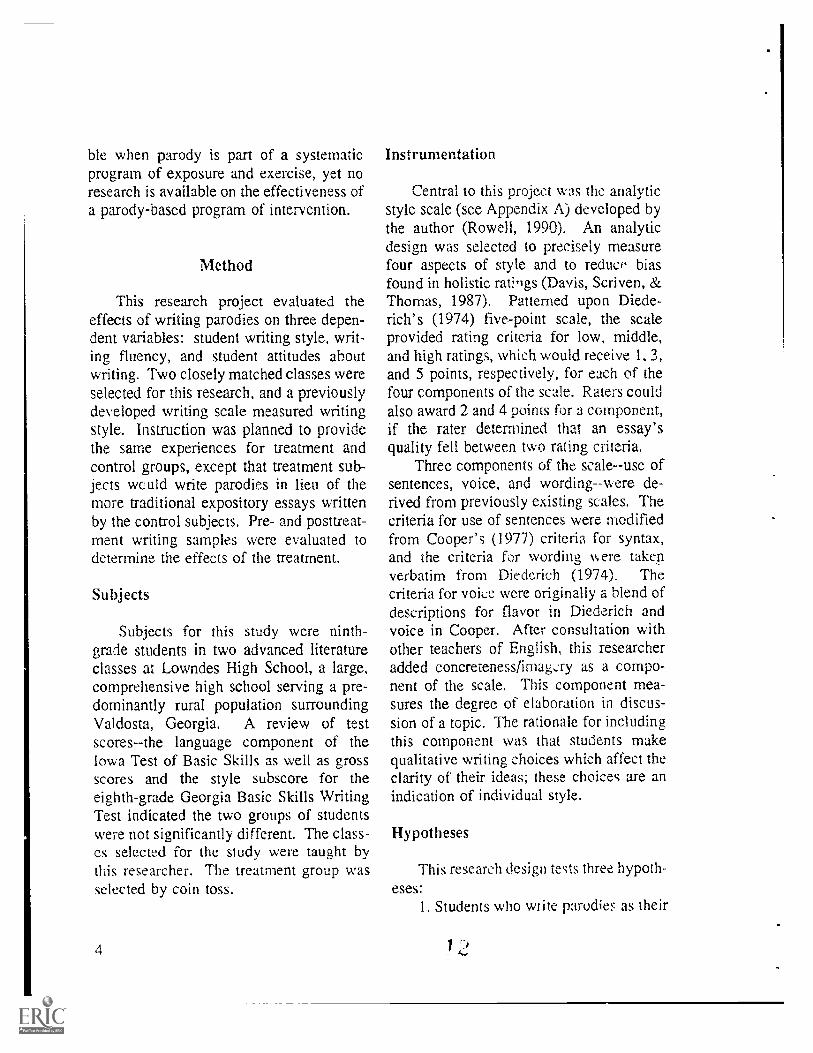
ble when parody is part of a systematicprogram of exposure and exercise, yet noresearch is available on the effectiveness ofa parody-based program of intervention.
Method
This research project evaluated theeffects of writing parodies on three depen-dent variables: student writing style, writ-ing fluency, and student attitudes aboutwriting. Two closely matched classes wereselected for this research, and a previouslydeveloped writing scale measured writingstyle. Instruction was planned to providethe same experiences for treatment andcontrol groups, except that treatment sub-jects would write parodies in lieu of themore traditional expository essays writtenby the control subjects. Pre- and posttreat-ment writing samples were evaluated todetermine the effects of the treatment.
Subjects
Subjects for this study were ninth-grade students in two advanced literatureclasses at Lowndes High School, a large,comprehensive high school serving a pre-dominantly rural population surroundingValdosta, Georgia. A review of testscores--the language component of theIowa Test of Basic Skills as well as grossscores and the style subscore for theeighth-grade Georgia Basic Skills WritingTest indicated the two groups of studentswere not significantly different. The class-es selected for the study were taught bythis researcher. The treatment group wasselected by coin toss.
4
Instrumentation
Central to this project was the analyticstyle scale (see Appendix A) developed bythe author (Rowell, 1990). An analyticdesign was selected to precisely measurefour aspects of style and to reduce biasfound in holistic ratins (Davis, Scriven, &Thomas, 1987). Patterned upon Diede-rich's (1974) five-point scale, the scaleprovided rating criteria for low, middle,and high ratings, which would receive 1, 3,and 5 points, respectively, for each of thefour components of the scale. Raters couldalso award 2 and 4 points for a component,if the rater determined that an essay'squality fell between two rating criteria.
Three components of the scale--use ofsentences, voice, and wording--were de-rived from previously existing scales. Thecriteria for use of sentences were modifiedfrom Cooper's (1977) criteria for syntax,and the criteria for wording were takenverbatim from Diederich (1974). Thecriteria for voice were originally a blend ofdescriptions for flavor in Diederich andvoice in Cooper. After consultation withother teachers of English, this researcheradded concretenessiimag,Ty as a compo-nent of the scale. This component mea-sures the degree of elaboration in discus-sion of a topic. The rationale for includingthis component was that students makequalitative writing choices which affect theclarity of their ideas; these choices are anindication of individual style.
Hypotheses
This research design tests three hypoth-eses:
1. Students who write parodies as their
experimental treatment will not achievesignificantly better style scores from pretestto posttest than control students who writeconventional narratives and expositoryessays.
2. Students who write parodies as theirexperimental treatment will not show sig-nificant gains in fluency from pretest toposttest when compared to control studentswho write conventional narratives andexpository essays.
3. Students who write parodies as theirexperimental treatment will not demon-strate significantly improved opinions ofthe writing course or of their own abilitiesfrom pretreatment to posttreatment whencompared to control students who writeconventional narratives and expositoryessays.
Design and Procedure
This research employed a quasi-experi-mental pretest-posttest control group de-sign. Control and treatment groups werenot randomly-assigned but were preexistingliterature classes taught by the researcher.Both classes followed the same program ofinstruction, reading, and testing. Writingassignments were the independent variablefor this project. Subjects in the controlgroup wrote a narrative composition andthree expository essays typical of Englishcomposition assignments. Subjects in thetreatment group wrote four parodies ofrecifie works studied in the class. This
res arcls project considered three dependents.snables: student writing style, as evaluat-
ed by the analytic style scale; fluency, asmeasured by total number of words writtenon a timed writing assignment; and stu-dents' opinions of the writing course and
of their own abilities, as measured by aresearcher-developed questionnaire.
Pretreatment assessment for bothgroups involved a writing sample and aquestionnaire. Pretreatment writing sam-ples for this project were written in 52-minute class periods on the same day forboth groups. These essays were then typedto eliminate the influence of handwritingon the raters' evaluations; the typed essayswere identified only by subject-selected,six-digit numbers. On the day followingthe initial writing assessment, subjectscompleted a researcher-developed question-naire of their opinions of writing, thecourse work, and their writing abilities.The preliminary questionnaire used a four-point Likert scale to measure subjectsresponses to eight statements.
During the treatment period of 8weeks, the subjects in both groups completed four units of a course in literary genres:short story, drama, novel, and nonfiction.To conclude each unit, the subjects com-pleted a writing assignment. Control sub-jects wrote a narrative and three expositoryessays during the research, while treatmentsubjects wrote a parody after each unit ofstudy. The protocol for the treatmentgroup included discussion to identify stylecharacteristics for each writer studied.Subjects in both groups wrote on the samedays; only writing topics differed.
The same procedures were followed forthe posttest as for the pretest. The subjectswrote their essays in a 52-minute classperiod. At the beginning of the class, thesubjects were given their topics and direc-tions as before. The subjects identifiedtheir essays with a self-selected, six-digitnumber. The essays were typed and identi-fied only by the six-digit number then
5

mixed with the pretest essays and placed innumeric order according to the six-digitidentification number. With these numbersand the same four-point rating scale onpre- and posttest assessments, raters did notknow if a paper originated from a pre- orposttest or from a control or treatmentgroup.
On the day following the posttest, thecontrol and treatment' subjects completed aresearcher-developed questionnaire. Thisquestionnaire was identical to the one thesubjects had previously completed, exceptfor the addition of an open-ended responsequestion. Again, the questionnaires wereonly identified by class.
Five experienced teachers of composi-tion volunteered to rate the essays for thisproject. These same raters piloted theoriginal analytic style scale and were famil-iar with its application. By the end of theevaluation sessions, each essay had receiv-ed two evaluations. For this research adiscrepant score was defined as a differ-ence of five points or more between thetotal scores assigned by the two raters. Inthe event of discrepant scores, the essaywas given to a third rater with the pre"i-ously assigned scores omitted. The scorefarthest from the mean of the three scoreswas discarded.
Questionnaire results and essay ratingswere then tabulated, recorded, and ana-lyzed. Total word counts for each essay,necessary to evaluate treatment effect onfluency, were generated by the word pro-cessing software used during the typing ofthe essays prior to evaluation by the raters.
Results
This research was designed to deter-mine if the writing of parodies by students
6
of English would have any significanteffect on students' attitudes about writing,their fluency in controlled writing situa-tions, and their writing style as evaluatedby raters using an analytical style scale.Using the Statistical Package for the SocialSciences (SPSS/PC-1), the researcher com-puted means for control and treatmentgroups. Gains in each area were deter-mined by calculating the means of post-treatment scores less pre-treatment scores,and the significance of any gains wereanalyzed by using t tests.
The writing of parodies had no signifi-cant effect on student attitudes about writ-ing or on their opinions of their skill aswriters; probability levels were at .245 andabove, too high to assume any significanteffect of the treatment. The open-endedresponse question on the posttreatmentquestionnaire generated some response.
The control subjects were generallyvague in their comments about completedwriting assignments: a typical responseread, "Students who take this course in[the] future should be required to completethese kinds of assignments because it helpsto improve your writing abilities for thefuture." Another student commented,"They are helpful in their own way, butthey are boring, not interesting." Thestudents who wrote parodies appeared moreemphatic in their opinions; most endorsedthe use of parodies, although a few stu-dents suggested limiting the number. Onesubject responded, "Students should berequired to complete these types of writingassignments because they need to learndifferent types of writing. Parodies are alotmore fun than regular assignments so longas you don't give too many parodies to theclass." Another wrote, "They get boringafter one or two. But they make you

think." One subject remarked, "It's veryhard to think of something to write on. 1
think students should have a choose [sic] towrite a parody or a regular essay."
A second aim of the research was todetermine if the writing of parodies madestudents more fluent writers, as measuredby the number of written words, Both thetreatment group and control group improv-ed in fluency from pretreatment to post-treatment; differences in gains between thegroups were not statistically significant.
In the qualitative measure of studentwriting style, the treatment group did scoreseveral statistically significant gains. Thereported means are for the sums of thescores assigned to the papers by two raters.Each component of the style scale couldreceive a score from 1 to 5; therefore, thesum of scores for each component wouldrange from 2 to 10. The range for totalscores was 8 to 40. A review of mean
scores for each component and total scoresshows that on the initial assessment thetreatment group performed more poorlythan did the control group; however, thetreatment group demonstrated significantgains in writing style following the treat-ment period (see Table 1). The group ofsubjects who wrote parodies marked mea-surable gains on all four components ofstyle and actually exceeded the controlgroup's pedormance on three of the fourcomponents on posttreatment assessment.The performance of the control groupremained essentially the same from initialto final assessment. The treatment groupdemonstrated marked gains on all fourcomponents of the style scale; gains forvoice and concreteness were significant (p< .05). Gains for the treatment group ontotal style scores were also statisticallysignificant (p < .05) (see Table 2).
Table 1. Means for Scores on Student Writing Assessments
Group Pretreatment Posttreatrnent 2-Tail pa
Sentences Treatment 5.05 6.05 .06Control 5.52 5.52
Voice Treatment 4.36 5.77 .04Control 5.57 5.81
Concreteness Treatment 4.05 5.55 .04Control 4.95 5.24
Wording Treatment 4.91 5.91 .07Control 5.19 5.33
Total Treatment 18.36 23.27 .03Control 2i.24 21.90
'Probability levels for t tests comparing mean gains of treatment vs. control.
7

Table 2. Pretreatment to Posttreatment Gains in Total Scores
Group N Mean Gain StandardDeviation
Treatment
Control
22
21
4.91
0.67
5.87
6.04
Pooled Variance Estimate
t Value
2.33
Degrees ofFreedom
41
2-tail probability
.025
Results of this research disprove thenull hypothesis regarding the influence ofparody writing on the development ofstudent writing style. Directed writing ofparodies of works read in class lead tostatistically significant improvements instudent writing style. The null hypothesesregarding the influence of writing parodieson student fluency and on student attitudesabout writing have been supported. Thewriting of parodies has not been shown tohave a statistically significant effect oneither student writing fluency or on studentattitudes.
Conclusions and Implications
This research demonstrated that im-provement in student writing style can beeffected in a relatively short period of timeby having students experiment with variousstyles through the writing of parodies.Several factors may have contributed tothese improvements in writing style. First,the instructional method and requirementsof the writing assignments may have corn-
8
pelled the treatment group to consciouslyconsider and to imitate writing styles ofvario.ts writers studied during the treatmentperiod. Second, the treatment group ap-peared to have been more personally en-gaged in writing parodies than was thecontrol group in writing essays, Treatmentstudents were able to express their sensesof humor as they attempted to elicit laugh-ter through their writing; control students,in general, reflected little of their personali-ties in their essays. This aspect of theparody exercises may explain the signifi-cant gains in voice scores by the treatmentgroup.
Several aspects of this study may haveinfluenced its results. First, the treatmentperiod of this research was limited to 8weeks, which permitted the writing of fourparodies in the treatment group and fourtraditional writing assignments in the con-trol group. During a longer time period,different results, especially pertaining toaffect, may be possible.
Second, the researcher taught bothgroups and possibly allowed expectation

biases to intrude upon the experimentalsetting. Of course, any research situationis suspect when the researcher is directlyinvolved in administration of the treatment.This researcher exercised care to providenearly identical ministrations over theexperiment period to both the treatmentand control groups; he Never, researcherexpectancy is a threat that can be eliminat-ed only through replication by educatorswho do not have an interest in the experi-ment's results. This researcher has some-what successfully used parodies with otherlevels of students. Research could beundertaken to measure the effectiveness ofwriting parodies on the writing style ofstudents other than those at the gifted oradvanced level.
Third, subjects for the study wereadvanced ninth-grade students. Resultsmay not generalize to the broader popula-tion.
In conclusion, writing parodies offersteachers an exciting opportunity to inte-grate composition instruction and the studyof literature. Guiding students through thewriting of parodies actively involves teach-ers and students in considering the style ofvarious writers, and the inherent element ofhumor promotes student engagement inthese exercises. This research suggests thatwriting parodies may be one means todevelop student writing style.
References
Clark, J., & Motto, A. (1986). The uses ofparody and excess in composition.Exercise Exchange, 31(2), 11-13.
Cooper, C. (1977). Holistic evaluation ofwriting. In C. Cooper & L. Odell(Eds.), Evaluating writing: Describing,
measuring, judging (pp. 3-31). Urbana,IL: National Council of Teachers ofEnglish.
Corbett, E. (1980). Ventures in style. In A.Freedman & I. Pringle (Eds.), Rein-venting the rhetorical tradition (pp. 79-87). Ottawa: Canadian Council of Tea-chers of English.
Davis, B., Scriven, M., & Thomas, S.(1987). The evaluation of compositioninstruction (2nd ed.). New York: Tea-chers College Press.
Diederich, P. (1974). Measuring growth inEnglish. Urbana, IL: National Councilof Teachers of English.
Georgia Department of Education (1989).Basic Skills Writing Test: Systemreport for Lowndes County. Atlanta:Author.
Georgia Department of Education (1990).Teacher's guide: Georgia Basic SkillsWriting Test. Atlanta: Author.
Graves, R. (1974). A primer for teachingstyle. College Composition and Com-munication, 25, 186-190.
Gruber, W. (1977). "Servile copying" andthe teaching of English composition.College English, 39, 491-497.
Hillocks, G., Jr. (1986). Research onwritten composition: New directions forteaching. Urbana, IL: ERIC Clearing-house on Reading and CommunicationSkills and National Conference onResearch in English.
Jolly, P. (1982). A question of style. Exercise Exchange, 26(2). 39-40. (ERICDocument Reproduction Service No.ED 236 601)
Lindemann, E. (1987). A rhetoric forwriting teachers (2nd ed.). New York:Oxford.
Rowell, J. A. (1990). Development andvalidation of an analytic scale for eval-
9

uating writing style. Unpublished man-uscript.
Weathers, W. (1970). Teaching style: Apossible anatomy. College Compositionand Communication, 21, 144-149. InG. Tate & E. Corbett (Eds.), The Writ-ing Teacher's Sourcebook (pp. 187-192). New York: Oxford UniversityPress.
Zahlan, A. (1987). Liberating parody:Strategies for teaching style. (ERICDocument Reproduction Service No.ED 285 191)
Zinsser, W. (1985). On writing well: Aninformal guide to writing non-fiction(3rd ed.). New York: Harper and Row.
10

-PERMISSION TO REPRODUCE THISMATERIAL HAS BEEN GRANTED BY
\NrAngio, L
An Evaluation of Explicit Instruction TO OT HREM \[,),.IUOCNA TCIEONNTAELR Rig OU RCES
in Problem-Solving Heuristics in MathematicsWanda L. Sumner
This study investigated the effectiveness ofteaching problem-solving heuristics on adaily basis to 66 fifth graders in a small,rural school. The explicit teaching ofproblem-solving strategies was comparedto the basal arithmetic program. Thestrategies included using logical and spa-tial reasoning, making lists or tables,working backwards using flow charts,finding patterns, and drawing pictures.Results indicated that explicit teaching ofproblem-solving strategies was more effec-tive than using the basal arithmetic pro-gram to teach problem solving to fifth-grade students. Differences in attitudeswere noted. While all students initiallyexpressed fear and dislike of word prob-lems, after treatment the explicit-treatmentgroup reported a more favorable attitudetoward problem solving than did the basal-textbook group.
George Polya (1957) stated that thefirst duty of all mathematics teachers is todevelop students' abilities to solve prob-lems. According to the National Councilof Teachers of Mathematics (NCTM)(1989), problem solving, the focus ofschool mathematics for the 1980s, is nottreated as a separate content area but is theprocess by which students learn and domathematics.
The development of problem-solvingabilities using higher order thinking skillsis the major goal of mathematics, but manystudents have difficulty problem solving.Results of the Fourth National Assessment
of Educational Progress (NAEP) (cited inKouba et al., 1988) indicated that students'difficulties with verbal problems are notcaused by an inability to read the problemor by a lack of computational skills. Stu-dents could identify the correct operationsfor one-step problems but had difficultyanalyzing nonroutine and multi-step prob-lems.
Kouba et al. (1988) presented severalreasons for students' difficulties in solvingword problems. They suggested that stu-dents lose track of information and resortto guessing without considering the reason-ableness of an answer or use inappropriatestrategies, such as key words or numbersize, when solving multi-step or nonroutineword problems. Moreover, students findsolving word problems and nonroutineproblems perplexing because they are un-sure of how to decide which strategy touse.
Even though developing skill in prob-lem solving is a major goal in mathemat-ics, instruction in this area is troublesomebecause problem solving is a complexprocess rather than a set of algorithmicskills (NCTM, 1989). Swing and Peterson(1988) noted that problem solving requiresstudents to use, mathematical concepts toestablish links between problem informa-tion and everyday meaning. A problem isa dilemma in which a person wants some-thing but does not immediately recognizewhat to do to get it. Routine story prob-lems concern the translation and applica-tion of a simple arithmetic procedure;nonroutine problems demand more reason-
11
ing, since the choice of mathematical sche-ma is not clear. Problem solving is thendefined as the process of applying previ-ously learned knowledge to new and unfa-miliar settings.
Problem-solving heuristics areguidelines that can be applied across do-mains. Heuristics emphasize higher orderthinking skills such as questioning, analyz-ing, translating and illustrating results,working backwards, drawing pictures anddiagrams, and using trial and error strate-gies (Polya, 1957). Problem-solving strate-gies simplify the process of translating andsolving problems.
Teachers of mathematics can no longerassume that the ability to solve problemswill develop with time and maturity.Problem solving needs to be taught in asystematic rather than an incidental way.This study tested the effectiveness of ex-plicitly teaching problem-solving heuristicsto fifth graders on a daily basis with em-phasis on higher order thinking skills usingPolya's strategies. The explicit method ofteaching problem solving was compared tothe approach used in the basal arithmeticprogram.
Review of the Literature
The National Council of Supervisors ofMathematics (NCSM) (1989) stated thatstudents who graduate in the year 2001will frequently face a 19th century, compu-tation-dominated mathematics curriculum.However, due to changing technology andessential competencies, students mustdevelop mathematical skills and becomeexpert problem solvers. Further, studentsneed to ask questions, to become risk tak-ers, and to develop cooperative learningskills in solving and posing problems.
12
Finally, students need to analyze and findalternative solutions for problems and tocheck for reasonableness of results.
To become expert problem solvers,students need to solve word problems fromtext and real life settings. Students alsoneed to encounter questions with multipleanswers. Suydam (1982) stated that "onemajor conclusion is warranted from the re-search: teach problem solving strategies!"(p. 59). Suydam indicated that problem-solving strategies teach flexibility and givestudents a repertoire from which to draw asthey meet a wide variety of problems.
Heightened awareness of the impor-tance and of the difficulty in teachingproblem solving has resulted in increasedefforts to identify specific instructional.Robert Gagne (cited in Darch, Carnine, &Gersten, 1984) indicated that attention isneeded in translating "concretely statedproblems into mathematical form. Empha-sis needs to be given to this phase as aseparate kind of capability to be learned bystudents" (p. 359). Students have difficultychoosing the correct operation to completea mathematical equation or sentence(Fischbein, Defi, Nello, & Marino, 1985).These researchers believe students' con-crete models of division and multiplicationhinder their ability to choose the appropri-ate operation to solve word problems.Sellke, Behr, and Voelker (1991) conclud-ed that data tables, used to represent rela-tionships, helped overcome the constraintsof intuitive models. Darch et al. (1984)found a significant difference in problem-solving ability among students taught totranslate story problems into mathematicalequations using in an explicit, step-by-stepapproach. The researchers inferred thatwith explicit teaching of problem-solvingprocesses, students who understand the

structure of the operations no longer de-pend upon superficial clues and can usetheir knowledge flexibly to solve wordproblems.
Unlike translation problems, process ornonroutine problems require more generalstrategies. Difficulty depicting processproblems may even cloud the planning ofsolution strategies. Several studies(Charles & Lester, 1984; Essen & Hama-ker, 1990; Lee, 1982; Moyer, Sowder,Threadgill-Sowder, & Moyer, 1984) wereconducted to test the effectiveness of usingexplicit instruction with strategies adaptedfrom or similar to Polya's heuristics. Leeas well as Charles and Lester found thatstudents were able to learn and effectivelyuse heuristics to solve process problems.Students were taught to make a plan, drawpictures, make a table or chart, look forpatterns, and to look back. Charles andLester theorized that explicit teaching ofheuristics facilitates student learning andenables students to solve related problems.
Essen and Hamaker (1990) and Moyeret al. (1984) studied the use of drawings tohelp students solve problems. Essen andHamaker found that after instruction withself-generated drawings, fifth-grade stu-dents produced more drawings and im-proved their performance on word prob-lems. According to Moyer et al., thedrawn format produced superior perfor-mance across grades, especially for lowreaders. The researchers surmised thatdrawings provided students a concretemodel and relieved working memory ormemory overload.
Owen and Sweller (1989), however,
they doubt instruction in problem-solvingstrategies will overcome problems in thetransfer of learning. Owen and Sweller
the teaching of heuristics because
believe that failure in problem solving islikely to be from lack of specific subjectknowledge or algorithmic skills. They con-clude there is little evidence of successfullyteaching general problem-solving tech-niques in mathematics education.
Word problems and nonroutine prob-lems require students to use higher orderthinking skills or moe creative thinkingprocesses. Gilbert-Macmillan and Leitz(1986) found that thinking and insight arestimulated when students explain theirsolutions to a group. The NCSM (1989)emphasized that in the future, creativeproblem solving will become more impor-tant since students must "know when andhow to use computation; and they mustdevelop proficiency in problem solving" (p.44). According to Polya (1957), if studentsare to become expert problem solvers, theyneed to be actively involved in learningand decision making. Polya also stressedteacher/student interaction through imita-tion and practice. This paper examines theeffectiveness of Polya's theory of teachingand learning mathematical problem solvingthrough heuristics.
Method
Subjects
Participants in the study were 66 fifth -grade students, 10 to 12 years old, fromtwo upper-level mathematics classes in thesame rural elementary school (11 = 900).Students were placed in the two classesbased upon academic grades, scores on theIowa Test of Basic Skills (ITBS), andteacher recommendation. The experimentalgroup (n = 33) consisted of 17 males and16 females, while 15 males and 18 femalescomprised the control group (n = 33).
13
Treatment
The regular classroom teacher, having4 years' experience, taught both classes andadministered the pretest and posttest. Thecontrol group worked only the problem-solving exercises taught in their basaltextbooks. Students in the explicit-instruc-tion group experienced the treatment intheir daily mathematics class for 15 min-utes each day for 10 days. During each15-minute session, the teacher modeledspecific problem-solving strategies devel-oped by Polya. Students then solved aproblem as a group under the teacher'sguidance. Finally, students practiced thestrategy alone then were encouraged tocreate and share problems using the strate-gy within cooperative groups.
Instruments
Students in the experimental and con-trol group took a pretest to establish equiv-alence and then took the same test 11 days
later as a posttest to evaluate interventioneffectiveness. The teacher-made pre-test/posttest consisted of 29 problemsderived from various fifth-grade basalmathematics books over the last 5 years.The test involved the operations of addi-tion, subtraction, multiplication, and divi-sion. Problem-solving exercises coveredone-step and multi-step word problems,logical reasoning, making list or tables,working backwards using flow charts,finding patterns, drawing pictures, andspatial reasoning. On each test, studentswere directed to find the correct answerusing one of Polya's strategies for problemsolving.
Results
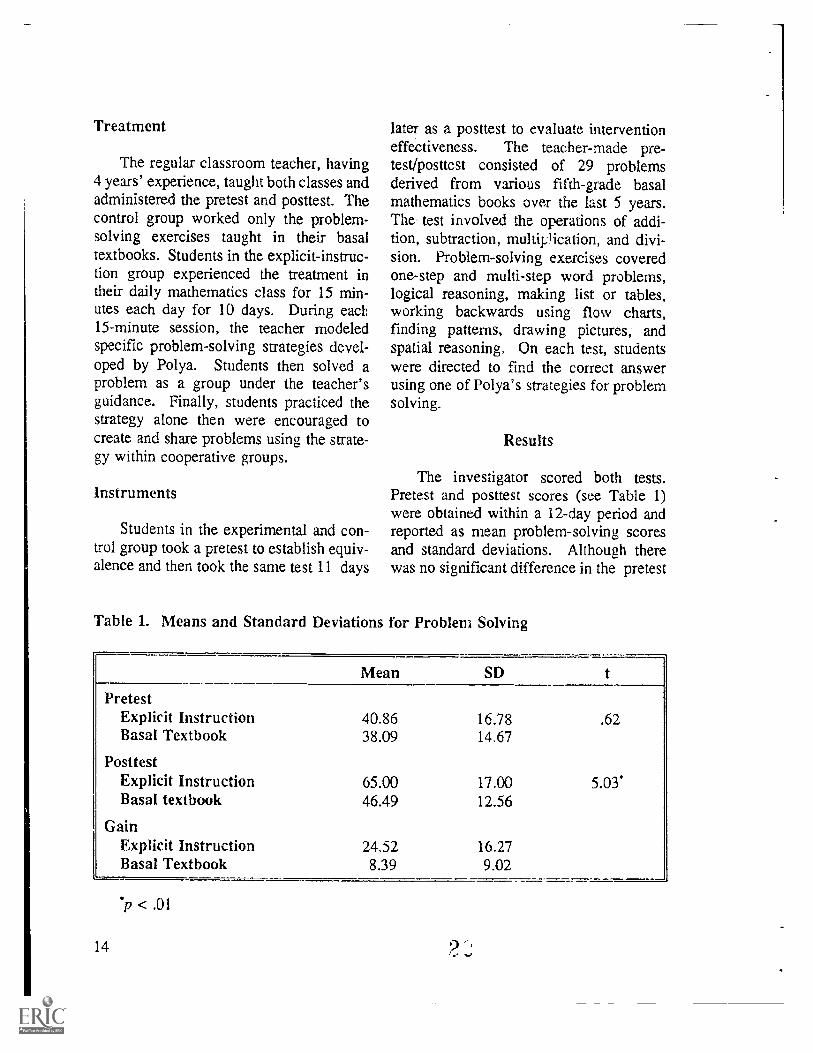
The investigator scored both tests.Pretest and posttest scores (see Table 1)were obtained within a 12-day period andreported as mean problem-solving scoresand standard deviations. Although therewas no significant difference in the pretest
Table 1. Means and Standard Deviations for Problem Solving
Mean SD
PretestExplicit Instruction 40.86 16.78 .62Basal Textbook 38.09 14.67
PosttestExplicit Instruction 65.00 17.00 5.03*Basal textbook 46.49 12.56
GainExplicit Instruction 24.52 16,27Basal Textbook 8.39 9.02
< .01
14

scores, there was a significant difference inthe posttest scores (p < .01) with the expli-cit-instruction group gaining an average of24.52 points while the basal-textbook groupgained an average of 8.39 points.
Correlations of the ITBS reading, math,and problem-solving scores to pretest andposttest scores (see Table 2) show a signif-icant correlation with both measures, withthe correlation higher for posttest scores.
Table 2. Test Correlations: ITBS to Pretest and ITBS to Posttest
ITBS to Pretest ITBS to Posttest
Reading .49* .55*
Mathematics .34* .54'
Problem Solving .35* .58*
p < .01
Test questions were grouped into relat-ed categories and the frequency of correctscores compared between groups (seeTable 3). The explicit-instruction groupshowed greater increase in percent ofcorrect responses among all five areas.The greatest increase was in the use ofgraphics to illustrate and solve word prob-lems. The mean of the experimental groupincreased 34.8 points compared to a 9.6-
point increase for the control group forfrequency of correct responses. Moststudents in the experimental group correct-ly answered questions which requiredconstructing a drawing, making a list,completing a table, or using a chart andworking backwards. Many students whomissed the questions did not use the prob-lem-solving strategies correctly or did notattempt to apply a definite strategy.
Table 3. Problem-Solving Heuristics, Pretest and Posttest (N = 29)
Category
Explicit Instruction Basal Textbook
Pre Post Gain Pre Post Gain
Patterns 38.9 53.5 14.6 20.2 24.3 4.1
Logic 30.3 64.7 34.4 29.3 30.3 1.0
Verbal 52.8 76.8 24.0 51.0 60.9 9.9
Graphics 29.3 64.1 34.8 36.4 46.0 9.6
Spatial 34.1 55.3 21.2 40.9 54.6 13.7
9 3 15

In the explicit-treatments group, 53.5%of the students correctly solved the num-ber-patterns problems. Only 24.3% of thecontrol group could do the same. Afterinstruction, the explicit-treatment group in-creased their scores 14.6 points, while thebasal-text group achieved a 4.1-point in-crease.
An increase of 34.4 points occurred inthe area of logical reasoning for the experi-mental group compared to a 1.0-pointincrease for the control group. Most stu-dents in the experimental group attemptedto answer these questions, and over 64%were successful. Results indicated thatincorrect answers were possibly due to anincomplete understanding of place valueand rounding.
With word problems and multi-stepproblems, the experimental group increased24 points compared to a 9.9-point increasefor the control group. During the pretestmost students in both groups correctlyanalyzed and solved word problems. How-ever, after instruction with Polya's methodof problem analysis, the explicit-treatmentgroup solved more of the multi-step prob-lems correctly than did the basal-textbookgroup.
With respect to spatial reasoning, afterinstruction in drawing and visualizingcubes, the explicit-treatment group gained21.2 points compared to a 13.7-point gainfor the control group.
As an informal assessment of theproblem-solving strategies, the researchrequested students write in their journalsabout their two weeks with our variousproblem-solving activities. Although moststudents thought problem solving was verydifficult, they believed the topic was inter-esting and important. Students' commentsranged from, "This is hard," and "Mom
16
didn't find an answer," to "The problemwas fun," or "My dad said that this is whathe does." The explicit-tr,atment groupliked the instructor and teaching methodbetter than did the basal-textbook group.Generally, both groups still expressed theusual dislike and fear of word problems.However, after instruction, both groupsstated they now felt more comfortable withword problems and believed they couldsolve problems similar to those taught inthe unit. Students' comments ranged from,"It still doesn't tell me what to do," and "Ithink I can find the answer, but it is hardto find the right plan," to "I can see thepattern," or "Picking out data is easy," and"It's fun to trick my sister," or "These arefun, let's do some more." Many studentsin the explicit-treatment group expressedenjoyment of the new activities and strate-gies now associated with problem solving.
Discussion
The purpose of this study was to evalu-ate the effectiveness of explicit instructionin problem-solving heuristics. Accordingto pretest and posttest results, the explicit-instruction group achieved a higher averageanswer than did the basal-textbook group.After 10 lessons in problem solving, moststudents in the explicit-instruction groupcould select and appropriately use a prob-lem-solving strategy. However, no attemptwas made to evaluate the impact of manip-ulatives, calculators, cooperative grouping,or problem-solving journals had on theresults of the two groups. Although therewere no significant differences between thetwo classes on the pretest, the results of theexplicit-instruction method of teachingheuristics is beneficial in teaching studentsto solve problems.

Many basal textbooks do not teachproblem solving as the focus of mathemat-ics but as a topic to be covered at the endof each lesson or chapter. Scatteredthroughout the chapter are exercises thatreview daily work using word problems,but most of these problems do not chal-lenge students to think about planningsolution strategies. The results of thisstudy indicate that explicit teaching ofheuristics can improve a student's ability tounderstand the problem and to plan asolution. Heuristics provides an index ofskills applicable to problem-solving situa-tions. Heuristics improve a student's confi-dence in his/her ability to succeed in math-ematics and to learn "how to think" aboutmathematics. Owen and Sweller (1989)warn there is no conclusive proof that in-struction in general problem-solving strate-gies will overcome transfer of learning.They imply that instructors should teachdomain-specific knowledge. However,according to Charles and Lester (1984),domain-specific strategies include heuristicswhich help the student organize and trans-form knowledge. Further research is need-ed to determine if teaching heuristics over-comes transfer of learning and if heuristicslearned in mathematics can be applied toother domains.
Effort was made to minimize differenc-es between the two classes by using coop-erative groupings, calculators, and problem-solving journals in both classes. This studydid not evaluate the effect of these aids andstrategies on students' attitudes or on theproblem-solving process. Future studiescould evaluate the effectiveness of coopera-tive-learning groups and calculators increative problem solving and creativeproblem formation.
Explicit teaching of prol- 'em-solving
strategies has definite implications foreducators. Teachers should carefully eval-uate the stage of learning for each student.Children at Piaget's concrete stage oflearning need more manipulatives in learn-ing problem solving than do children at theformal operational stage (e.g., Gage & Ber-liner, 1988). Both groups routinely usedmanipulatives to introduce and solve manyof the problems presented in this study.However, the study did not evaluate theimpact such manipulatives had on thesuccess experienced by the explicit-instruc-tion group. Future studies could examinethe effect of extended use of manipulativeson the problem-solving process.
Summary
This paper has presented the findingsand evaluation of a problem-solving unit inmathematics. Results are encouraging andsupport a mathematics program whichemphasizes explicit teaching of problemsolving and higher order thinking skills.Such explicit teaching helps swdents be-come more comfortable with problemsolving as problem-solving abilities in-crease. By expanding their repertoire ofskills, students made gains and developedcritical attitudes toward solving problemswhich helped widen their views of mathe-matics.
References
Charles, R., & Lester, F. (1984). An evalu-ation of a process-oriented instructionalprogram in mathematical problemsolving in grades 5 to 7. Journal forResearch in Mathematics Education,15(1), 15-34.
9J17

Darch, C., Carnine, D., & Gersten, R.(1984). Explicit instruction in mathe-matics problem solving. Journal ofEducational Research, 77, 331-358.
Essen, G., van, & Hamaker, C. (1990).Using self-generated drawings to solvearithmetic word problems. Journal ofEducational Research, 83, 301-312.
Fischbein, E., Deri, M., Nello, M., & Mari-no, M. (1985). The role of implicitmodels in solving verbal problems inmultiplication and division. Journal forResearch in Mathematics Education,16(1), 3-17.
Gage, N., & Berliner, D. (1988). Educational psychology (4th ed.). Boston:Houghton Mifflin.
Gilbert-Macmillan, K., & Leitz, S. (1986).Cooperative small groups: A methodfor teaching problem solving. Arithme-tic Teacher, 33(3), 9-11.
Kouba, V., Brown, C., Carpenter, T., Lind-quist, hi., Silver, E., & Swafford, J.(1988). Results of the fourth NAEPassessment of mathematics: Number,operations, and word problems. Arith-metic Teacher, 35(8), 14-19.
Lee, K. (1982). Fourth graders' heuristicproblem-solving behavior. Journal forResearch in Mathematics Education,13(2), 110-123.
Moyer, J., Sowder, L., Threadgill-Sowder,J., & Moyer, M. (1984). Story problemformats: Drawn versus verbal versustelegraphic. Journal for Research inMathematics Education, 15(5),341-352.
National Council of Supervisors of Mathematics. (1989). Essential mathematicsfor the twenty-first century: The posi-tion of the National Council of Super-visors of Mathematics. ArithmeticTeacher, 37(1), 44-46.
18
National Council of Teachers of Mathemat-ics. (1989). Curriculum and evaluationstandards for school mathematics.Reston, VA: Author.
Owen, E., & Sweller, J. (1989). Shouldproblem solving be used as a learningdevice in mathematics? Journal for Re-search in Mathematics Education,21(5), 322-328.
Polya, G. (1957). How to solve it (2nded.). Garden City, NY: DoubledayAnchor Books.
Sellke, D., Behr, M., & Voelker, A.(1991). Using data tables to representand solve multiplicative story prob-lems. Journal for Research in Mathe-matics Education, 22(1), 30-38.
Suydam, M. (1982). Update on research onproblem solving: Implications forclassroom teaching. Arithmetic Teach-er, 29(6), 56-60.
Swing, S., & Peterson, P. (1988). Elabora-tive and integrative thought processesin mathematics learning. Journal ofEducational Psychology, 1(1), 54-66.

Effects of Group Processing Skills on the Social Interactionof Cooperative Learning Groups
Emilie Allen
Cooperative learning is an instructionalstrategy designed to provide students witha positive learning environment and toaddress problems associated with teachingstudents of diverse backgrounds. In addi-tion to enhancing student achievement,cooperative 12arning has shown positiveimpact on interpersonal relations, interac-tion with special education students, andself-esteem. This study was designed toteach necessary social skills to students inpreparation for additional work with coop-erative learning. Three measures of groupinteraction showed improvement at the endof the project. The results of this studysuggest that social skills can be improvedand that such improvement is a valuedoutcome in an educational setting.
The children who walk through Amer-ica's classroom doors each fall present aunique and .almost overwhelming challengeto their teachers. Each new group of chil-dren is a diverse mixture of academicabilities, emotional maturities, and motiva-tional interests. They represent broadcultural and economic backgrounds. Howdoes one teacher meet each child's individ-ual differences? How is it possible tochallenge the gifted and simultaneouslyincorporate the slower, less able studentinto the learning process?
A traditional classroom may not offeranswers to these questions. In mostschools, academically slower childrencompete with brighter classmates for teach-er approval, for grades, and for positive
recognition. In addition, Slavin (1990)notes that low achieving students may lackthe prerequisites to learn new material.They receive negative feedback daily ontheir academic efforts and learn that aca-demic success is not within their grasp.Eventually, they may use antisocial ordelinquent behaviors to gain a sense ofself-worth.
Cooperative learning addresses prob-lems associated with classroom competitionand encourages students to help one anoth-er succeed. Dividing students into teamswhose members are responsible for eachother's learning as well as their own estab-lishes a positive learning environment.Students encourage and help each othermaster skills and content presented by theteacher. In a cooperative setting, theyconvey to one another the idea that learn-ing is important, valuable, and fun (Slavin,1987 a).
In the past, this researcher had muchsuccess with several short-term cooperativegrouping projects. As a result of thesepositive experiences, cooperative learningwas implemented in the classroom as analternative to traditional instruction. As theyear progressed, one problem continuallythreatened to undermine the project's suc-cess--too much time was required forteacher intervention to solve communica-tion problems and to help resolve conflictamong group members. Rules of groupinteraction obviously had to be masteredbefore successful group work could occur.The children had to understand the con-
PERMISSION TO REPRODUCE THISMATERIAL HAS BEEN GRANTED BY
EvN\ c\\\'`\19
TO THE EDUCATIONAL RESOURCESINFORMATION CENTER (ERIC1."

cepts of cooperation and their applicationto group activities in order to achieveacademic success.
Most literature on cooperative groupingappears to describe in detail how to orga-nize the design material or how to imple-ment grouping in a classroom. Very littleinformation is available on teaching thenecessary interpersonal and group skillsessential for successful cooperation. Inorder to address this void in the literature,this study was designed to implement aunit on building interpersonal skills de-signed to create positive interdependencebetween group members and therefore,successfully impact the group's academicachievement.
Review of Literature
Cooperative learning refers to a set ofinstructional methods in which students ofvarying abilities work together in smallgroups toward a common goal (Slavin,1987a). Based on 60 experimental studies,Slavin (1989) concluded that under certaincircumstances the use of cooperative learn-ing methods increased student achievementmore than did traditional instruction. Twoessential elements--group rewards andindividual accountability--were necessaryfor this positive effect. The group mustwork together to earn recognition, grades,rewards, and other indicators of groupsuccess. The group's success must alsodepend on the individual learning of allgroup members. These methods consis-tently improved self-esteem and socialrelations among students (particularly racerelations), and acceptance of mainstreamedstudents (Slavin, 1987a).
20
Comparisons to Traditional Instruction
According to McElroy (1989), educa-tion has an individualistic focus in a tradi-tional classroom setting. Students workindividually on academic tasks and com-pete with each other for grades and otherrewards. One student's success may makeit difficult for others to succeed. In theseclassrooms, students are usually groupedhomogeneously for academic skill instruc-tion. The teacher is the traditional class-room leader and controls academic content,learning environment, and instruction.
In contrast, in the cooperative class-room students are grouped heterogeneouslyand work together in these groups forgrades and rewards. One student's successhelps others achieve their goals. All groupmembers are given the opportunity to leadand are encouraged to develop and useleadership skills. The students often partic-ipate in the decision-making process re-garding curriculum and the learning atmo-sphere of the classroom.
Theoretical Models
Two theoretical models developmentaland motivational--explain the superiority ofcooperative learning over traditional in-struction. According to Slavin (1987c), thedevelopmentalists believed that improvedstudent achievement results from studentinteraction on learning tasks. As studentsdiscuss academic content, they resolvemisunderstandings, thus higher qualityunderstanding emerges.
Motivationalists agree that peer interac-tion can lead to cognitive growth, butinteraction alone is not sufficient. Group
rewards and individual accountability arenecessary to make peer interaction moreeffective. Slavin (1987c) states, "Thecooperative reward structure is the criticalelement in increasing student achievement,because their use creates peer norms andsanctions supporting individual efforts" (p.1163). Slavin (1983) determined that 25 of28 studies on cooperative learning methodsusing group rewards based on the sum ofindividual learning performances showedsignificantly greater achievement in cooper-ative than in the control classes. Morerecently, 6 of 8 studies found similar posi-tive results (Slavin, 1987a).
Academic Achievement
While there are many benefits of coop-erative learning, enhanced achievement isthe most important outcome and has thebroadest research base. If properly struc-tured, cooperative learning methods cansignificantly accelerate the learning of allchildren. Research on academic achieve-ment overwhelmingly supports cooperativelearning over traditional instruction. Of 35nationwide studies conducted by Slavin(1987b) and stratified for age and ability,29 (83%) found that students in variouscooperative learning situations gainedsignificantly more in achievement than didstudents in regular classrooms covering thesame objectives.
Some of the greatest effects of cooper-ative learning on student achievement citedby Slavin (1987a) in the studies of Team-Assisted Individualization (TAI). Thismethod combines cooperative groups withindividualized instruction. In six studies,the TAI classes gained an average of twiceas many grade equivalents on standardizedmathematics computation measures than
did the traditionally taught control classes.Using another cooperative learning method--cooperative integrated reading and compo-sition (CIRC)--classes gained 30%-70% ofa grade equivalent more in reading compre-hension, reading vocabulary, languageexpression, language mechanics and spell-ing than did the control groups. Numerousother studies consistently document aca-demic gains for students.
Interpersonal Relations
In addition to achievement gains, coop-erative learning has positive effects onsocial, motivational, and attitudinal out-comes. According to Slavin (1990), coop-erative learning, by nature, is a socialmethod. Students engage in active ratherthan passive learning, which encouragesthem to work together toward commongoals. The heterogeneous structure of thiseducational strategy groups children who inother circumstances may not choose to betogether. By working in cooperative rela-tionships, children gain respect for andunderstanding of others who may be verydifferent from themselves. Ethnic, eco-nomic, and social barriers fall; and positivefriendships can develop. Several studies bySlavin (1987b) support the positive effectsof cooperative learning on close, recipro-cated friendships especially with cross-racial relationships.
In a study by Kagan (1989), race rela-tions improved significantly. As cited b.Kagan, when students in heterogeneouscooperative groups were asked to selectclose friends, another student's race wasnot a significant predictor of friendshipchoice. The highest level of intimacychoices among students were their team-mates, regardless of race.
21

Mainstreaming
Public Law 94-142, which requiresmainstreaming of the mildly mentally andphysically handicapped into the regularclassroom, has drastically changed thenature of teaching. In many classrooms,traditional instruction will not meet theindividual needs of these students. Accord-ing to Augustine, Gruber, and Hansen(1989), cooperative learning provides apositive way to include these special needschildren in the classroom socializationprocess and simultaneously provide themwith the extra academic help they need.Traditionally, handicapped children weretaught in separate classes, thus increasingtheir feelings of isolation and difference.By being part of a group, their social skillsand feelings of self-worth improved whenaccepted by regular students.
The benefits of cooperative learning forspecial education students are also support-ed by wer 80 studies conducted by John-son and Johnson (1989b). In addition toimproved self-esteem, improved socialskill, and improved psychological adjust-ment, cooperative experiences also promotacademic gains, use of higher-level reason-ing strategies, and greater critical thinkingdevelopment for these special needs chil-dren.
Other Outcomes
Various studies of other outcomes ofcooperative learning indicate positive gainsin self-esteem, attitude toward school,feelings of success, and feelings of beingaccepted and valued by classmates (Slavin,1990). Another study (Johnson, Johnson,Johnson, & Anderson, 1984) found thatcooperation increases a student's ability to
22
make helpful decisions and altruistic choic-es.
As previously mentioned, cooperativelearning nas an extensive research base.Volumes of material are available to helpteachers implement cooperative grouping intheir classrooms. However, for thesegroups to be completely productive, it isvital to teach interpersonal and small-groupskills essential for effective cooperation(Johnson & Johnson, 1989a). Other re-searchers state similar findings. This re-searcher agrees with the literature on theimportance of teaching social skills, butfound little information regarding the stepsinvolved in teaching these skills. Thisstudy proposed to design a unit of materialwhich outlines of the necessary steps forbuilding cooperative social skills.
Methods
Subjects
This study was composed of 1 teacherand 21 public school third graders. Thestudents were heterogeneously grouped, byrace and ability, into 6 teams of 3 or 4children. Classroom seating was arrangedso desks of each team were together allday. There were 8 girls and 13 boys in theclass with a ratio of 14 white to 7 black.The children all lived in a middle-sizetown in south central Georgia, and camefrom very diverse economic and socialbackgrounds.
Instruments
Three instruments were used to mea-sure student interaction among group mem-bers. A teacher-made questionnaire ofstudent attitudes on social interaction was
administered as a pretest and posttest. Toensure content validity, the questionnairewas patterned after team-building goalssuggested in the literature on cooperativelearning. The questionnaire was validatedby a graduate research class.
A sociogram was also drawn to beused as a pre- and postmeasure of studentinteraction. At the beginning and again atthe conclusion of the unit, each child listedthree other students he/she would most liketo work with in group activities. Theirchoices were diagrammed and compared toillustrate preferred interaction betweengroup members.
Daily evaluations of group interactionrepresented the third method of measure-ment. For a 10-day period, each groupparticipated in a daily fun activity. Aftereach activity, the individual groups evaluat-ed their ability to cooperate using a set ofcooperation guidelines developed as a
model at the beginning of the unit. (SeeTable 1 for a listing of the guidelines.)These evaluations were compiled on achart for comparison.
Procedures
This study used a single-subject, sin-gle-group experimental design to measurethe interaction of students working incooperative learning groups. The studylasted 3 weeks and had two goals: (a) tobuild team spirit among group membersand (b) to teach group processing skillsthat would enable the students to interactmore efficiently and resolve conflict moreeffectively.
At the beginning of the unit, the stu-dents responded to an attitudinal question-mire about the socialization skills of theirgroup. They also listed friendship choices
that were later charted on a sociogram.This information was used as pretest data.The activities of the first week centeredaround building team spirit. Each groupmade up group names and designed postersto be displayed on the bulletin board. Fun,noncompetitive group activities wereplanned for each day.
Near the end of the week, a classdiscussion was held to "brainstorm." Thechildren then listed different ways to dem-onstrate cooperative behavior in groupactivities. Following the discussion, theclass outlined six "guidelines of coopera-tion," which were written on chart paperand posted with the team-name posters.
During the next 2 weeks the groupsfocused on building group interaction skillsusing the "guidelines" as a model. Fifteento 20 minutes were spent each day in funactivities requiring the participation of allgroup members to be effective. At theconclusion of each activity, the groupsreviewed the guidelines and evaluated theircooperative behavior. The evaluationsconsisted of listing guidelines each groupperformed well and areas needing improve-ment. To add encouragement, superstarawards were given to groups who demon-strated cooperative attitudes at times otherthan the scheduled group activity time.These stars were stapled around the team-name posters as visual incentives. Starswere also added for outstanding groupperformance on certain academic taskssuch as spelling, math worksheets, andscience and social studies projects.
At the conclusion of the unit, the stu-dents again responded to the attitudinalquestionnaire and listed friendship choices.This information was used as posttest dataand was charted for comparison with pre-test results. The results of the daily evalu-
3 A_
23
ations were also charted and included in of the groups to each question were chartedthe posttest data. so that the pretest and posttest results could
be compared. The total number of re-Results sponses for each answer choice is recorded
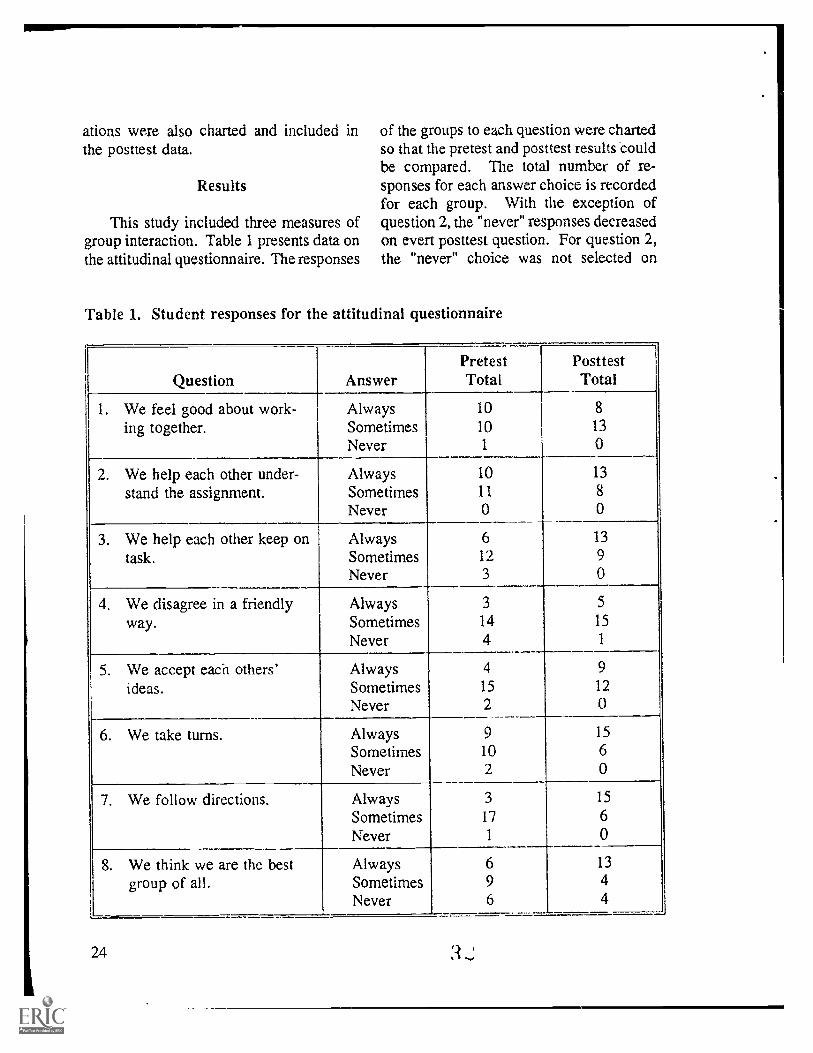
for each group. With the exception ofThis study included three measures of question 2, the "never" responses decreased
group interaction. Table 1 presents data on on evert posttest question. For question 2,the attitudinal questionnaire. The responses the "never" choice was not selected on
Table 1. Student responses for the attitudinal questionnaire
Question AnswerPretestTotal
PosttestTotal
1. We feel good about work- Always 10 8
ing together. Sometimes 10 13
Never 1 0
2. We help each other under- Always 10 13
stand the assignment. Sometimes 11 8
Never 0 0
3. We help each other keep on Always 6 13
task. Sometimes 12 9
Never 3 0
4. We disagree in a friendly Always 3 5
way. Sometimes 14 15
Never 4 1
5. We accept each others' Always 4 9
ideas. Sometimes 15 12
Never 2 0
6. We take turns. Always 9 15
Sometimes 10 6
Never 2 0
7. We follow directions. Always 3 15
Sometimes 17 6
Never 1 0
8. We think we are the best Always 6 13
group of all. Sometimes 9 4
Never 6 4_.i
24
either the pretest or the posttest. Thenumber of "sometimes" and "always"responses increased on every qt tort
the posttest. Some gains were quite dra-matic. On questions 3, 7 and 8, the num-ber of "always" choices more than doubled.The gains would have been even morepositive for question 8, if Group 5 hadanswered the question correctly. In a classdiscussion of the results, students in Group5 admitted they liked their group best andwanted to mark "always;" but since theyhad fewer superstar awards than did othergroups, they felt they had to mark the"never" choice.
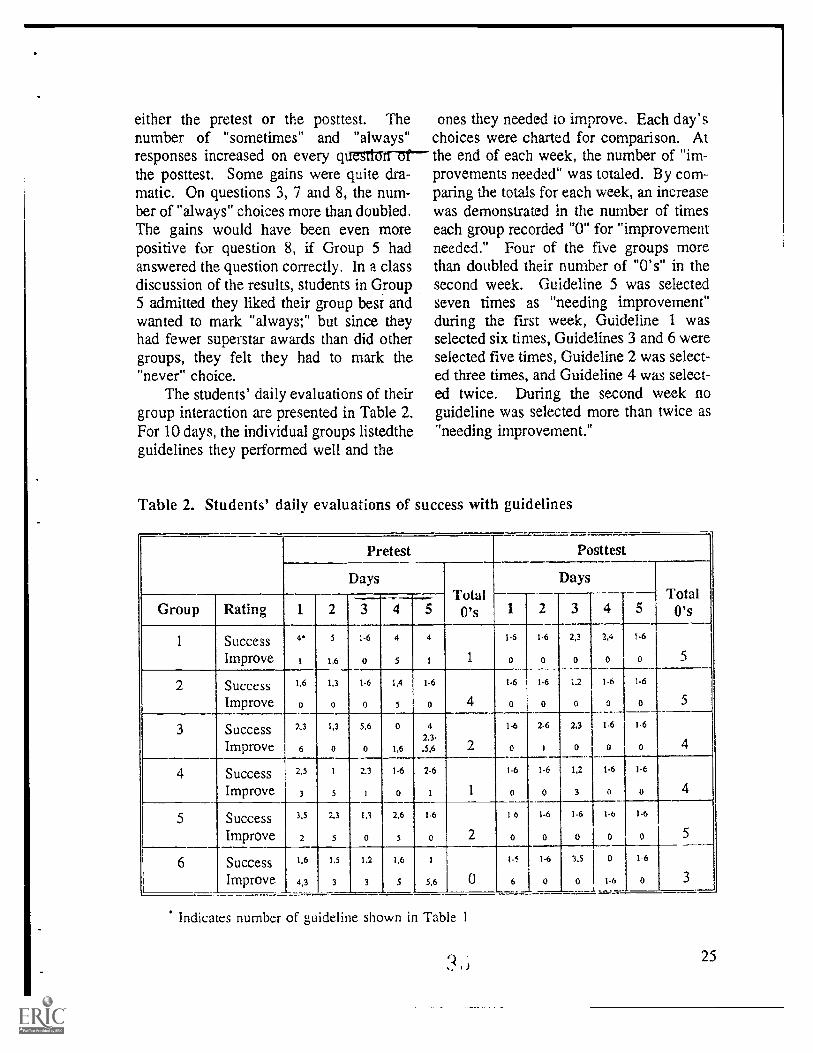
The students' daily evaluations of theirgroup interaction are presented in Table 2.For 10 days, the individual groups listedtheguidelines they performed well and the
ones they needed to improve. Each day'schoices were charted for comparison. Atthe end of each week, the number of "im-provements needed" was totaled. By com-paring the totals for each week, an increasewas demonstrated in the number of timeseach group recorded "0" for "improvementneeded." Four of the five groups morethan doubled their number of "O's" in thesecond week. Guideline 5 was selectedseven times as "needing improvement"during the first week, Guideline 1 wasselected six times, Guidelines 3 and 6 wereselected five times, Guideline 2 was select-ed three times, and Guideline 4 was select-ed twice. During the second week noguideline was selected more than twice as"needing improvement."
Table 2. Students' daily evaluations of success with guidelines
Pretest Posttest
DaysTotal
0's
DaysTotal0'sGroup Rating 1 2
-----3 4 5 1 2 3 4 5
1 Success 4' 5 1-6 4 4 1-6 1.6 2,3 2,4 14
Improve 1 1,6 0 5 1 1 0 0 0 0 0 5
2 Success 1.6 1,3 1-6 1,4 1-6 1-6 1-6 1,2 1-6 1-6
Improve 0 0 0 5 0 4 o o 0 3 0 5
3 Success 2.3 1,3 5,6 0 4 1-6 2-6 2,3 1.6 1.6
Improve 6 0 0 1,6
2.3-
,5,6 2 o 1 o o 0 4
4 Success 2.5 1 2.3 1-6 2.6 1.6 1.6 1,2 1-6 1-6
Improve 3 5 1 0 1 1 0 0 3 a o
5 Success 3,5 2.3 1,1 2,6 1-6 16 14 1-6 14 14
Improve 2 s 0 5 0 2 0 a 0 a 0
6 Success 1.6 1.5 1.2 1,6 1 1-5 14 3,5 0 1-6
Improve 4,3 3 3 s 5,6 0 6 J 0 0 1-6 0 3
Indicates number of guideline shown in Table l
2%.
25

Table 3 represents the results of thethird measure of interaction and shows datafrom the students' lists of friendship choic-es. On the pretest, Groups 1, 2 and 3made no intragroup choices. However, inGroup 6 only one child who made anintragroup choice (choosing two othermembers of the group); Groups 4 and 5had no intragroup choices at all. Twochildren were not selected by any otherchildren.
On the posttest, all groups, exceptGroup 1, demonstrated increases in intra-group choices. Additionally, all childrenwere selected at least once, leaving no onein isolation. The reasons for Group 1'sdecreased interaction are not evident fromthe data but may have partially resultedfrom a disagreement between two teammembers on the day of data collection.
26
Table 3. Students' intragroupfriendship choices
Group Pretest Posttest
1 6 2
2 3 5
3 2 4
4 0 2
5 0 2
6 2 4
Discussion
All three measures of group interactionincluded in this study demonstrate positivegains. Evaluation of the tables and thesociogram show improvement in teammembers' acceptance of each other and intheir ability to effectively interact. Eachgroup also evidenced a tremendous in-crease in pride as a team. Based on teach-er judgement, this researcher believes theimprovement was significant. As the unitprogressed, a positive increase occurred ineach group's ability to resolve conflicts andresume work. Passive students becomeincreasingly involved, and the leadershipbase of each group was more equallyshared. Each group's ability to successful-ly complete assigned tasks improved tre-mendously, and less time was required foreach task.
Personality disagreements and powerstruggles still exist within the groups.Realistically, since groups are made up ofchildren with diverse personalities andabilities, not all difficulties can be com-pletely resolved. Their continuing exis-tence, however, may result from problemswithin the study.
The internal validity of the study waspossibly threatened. The original studywas designed to last 5 weeks; however, dueto teacher absences for jury duty and ill-ness and due to illnesses of several chil-dren, the study only lasted for 3 weeks.There was insufficient time to effectivelyteach all group processing skills needed forgroup interaction. Several times after theunit began, it had to be interrupted andrestarted later. These interruptions greatlyhindered the progress of the unit by neces-sitating repetition of review material, thuslimiting time for work on new skills.

Other threats to internal validity mayhave affected the study's outcome. Theactual structure of individual groups mayhave caused selection bias. Although theteacher assigned groups very carefully,certain groups may have had more compat-ible personalities than did others, sincegroups were not randomly assigned. Priorto the study, the children had been workingin groups for several months. Since therehad already been much teacher interventiondue to cooperation problems, historicaldifficulties may have existed within somegroups. From the beginning of the study,the children knew the purpose of the unitand what was expected of them. Theirbehaviors may have improved as a result ofthis knowledge.
Although problems existed within thestudy, this researcher believes the gains tobe sufficiently positive to repeat the unitnext year. The unit will be implemented atthe beginning of the year for a longerperiod of time, and review sessions will bescheduled throughout the year. Hopefully,time spent teaching and practicing groupprocessing skills will produce groups whointeract less conflict, fewer disagreements,and fewer power struggles.
Schools should place greater emphasison teaching group processing skills. Asadults, individuals will be in -group situa-tions where interpersonal skills may bemost important to employability, productiv-ity and career success (Johnson & Johnson,1989a). Social skills also directly relate tobuilding and maintaining positive relation-ships as well as preserving emotional andmental health. Thus, social skills devel-oped through cooperative efforts in schoolare important contributors to the happiness,wholeness, and career successes of ourfuture generation.
References
Augustine, D., Gruber, K., & Hansen. L.(1989). Cooperation works. Education-al Leadership, 47(4), 4-7.
Johnson, D., & Johnson, R. (1989a) Socialskills for successful group work. Edu-cational Leadership, 47(4), 29-33.
Johnson, D., & Johnson, R. (1989b). Coop-erative learning, what special educationteachers need to know. The Pointer,33(2), 5-10.
Johnson, D., Johnson, R., Johnson, J., &Anderson, D. (1984). The effects ofcooperative vs. individualized instruc-tion on student prosocial behavior,attitudes toward learning, and achieve-ment. Journal of Educational Psycholo-gy, 68, 446-452.
Kagan, S. (1989). The structural approachto cooperative learning. EducationalLeadership, 47(4), 12-15.
McElroy, K. (1989). A taste of cooperativeness within an elementary school.The Pointer, 33(2), 34-38.
Slavin, R. (1983). Using student teamlearning. Baltimore: John HopkinsUniversity.
Slavin, R. (1987a). Cooperative learning:Can students learn? Instructor, 96(7),74-78.
Slavin, R. (1987b). Cooperative learning:Where behavioral and humanistic ap-proaches to classroom motivationmeet. The Elementary School Journal,88(1), 29-35.
Slavin, R. (1987c). Developmental andmotivational perspectives on coopera-tive learning: A reconciliation. ChildDevelopment, 58, 1161-1167.
Slavin, R. (1989). Research on cooperativelearning: Consensus and controversy.Educational Leadership, 47(4), 52-54.
27

Slavin, R. (1990). Cooperative learning:Theory, research, and practice. NewJersey: Prentice-Hall,
28

Have the Results of Project Follow ThroughBeen Well Utilized?
Janis N. Lee
Project Follow Through began in the late60s as a follow-up to Head Start and wasdesigned to serve needy children in gradesK-3. This pape,- considers the results andcontroversy of the Follow Through experi-ment. Several longitudinal studies arediscussed which confirmed that the DirectInstruction model was the most successfulFollow Through program. This paper alsoexamines federal dissemination and fundingof the Follow Through programs and con-siders suggestions for improvement as wellas future implications.
Project Follow Through (PFT) began in1968 and, during the first 10 years, served79,000 disadvantaged children in grades K-3. Between 1968 and 1978 the federalgovernment spent $500 million dollars onthe project and $50 million on its evalua-tion. Using a variety of learning and child-development theories, 22 teams createdspecific programs and teaching methods.Evaluation studies conducted since theinception of PFT have aroused considerablecontroversy, especially in 1977 and 1978.
Evaluation and Controversy
A 5-year study of PFT by Abt Asso-ciates (Stebbins, St. Pierre, Proper, Ander-son, & Cerva, 1977) resulted in three majorfindings.. The study discovered first thatdifferences in effectiveness among siteswithin the same model were greater thandifferences in the effectiveness betweenPFT models. Other evaluators confirmedAbt's results (Anderson, St. Pierre, Proper,
& Stebbins, 1978; Rhine, 1983; Wisler,Burns, & Iwamoto, 1978). The secondmajor finding was that no PFT modeleffectively raised test scores of disadvan-taged children. One critique agreed that "ifthe concentrated effort of highly competentand well-funded sponsors working with afew sites cannot produce uniform resultsfrom locality to locality, it seems doubtfulthat any model program could do so"(House, Glass, McLean, & Walker, 1978,p. 154). The third finding by Abt was thatdisadvantaged children continued to per-form poorly despite intervention programs.
Evaluations of PFI' hoped to identify atleast one or two models that would work inany school system. Such a strategy, whileplausible 10 years previously, began toappear misguided (Anderson et al., 1978).
Abt Associates found, secondarily, thatthe Direct Instruction (DI) model, spon-sored by the University of Oregon,achieved superior results overall, althoughthe improvements were inconsistent acrosssites. Rhine (1983) found that two modelprograms were more successful than others:the DI model and the Behavior AnalysisModel. However, House et al. (1978)claimed the Office of Education pressuredAbt to use a method which erroneouslymaximized model differences in the modelsto make one model appear superior. Houseet al. further claimed that Abt's evaluationresults were unfair to the various modelsponsors. Abt Associates strongly refutedthese criticisms (Anderson et al., 1978).
Four instruments were employed toevaluate the PFT models: (a) the Metropol-itan Achievement Test (MAT), which
29

measures reading, language, and math; (b)Raven's Colored Progressive Matrices,which measures non-verbal problem solv-ing ability; (c) Coopersmith's Self-EsteemInventory; and (d) the Intellectual Achieve-ment Responsibility Scale, which measuresstudent attitudes concerning academicfailure or success. The Abt study did notdirectly compare all 22 models but groupedresults into three categories: basic skillsmodels, cognitive-conceptual models, andaffective-cognitive models (House et al.,1978).
House et al. (1978) questioned govern-ment involvement in the evaluation processand concluded that large scale evaluationsare costly and unnecessary. Wisler et al.(1978) disagreed and stated the governmentshould have provided stronger direction inthe evaluation. These researchers conclud-ed that success was sufficiently evident toindicate that compensatory education canwork, although not on a widespread basis.Wisler et al. noted that "with a few excep-tions, the models assessed in the nationalFollow Through evaluation did not over-come the educational disadvantages poorchildren have" (p. 179). The DI modelshowed the best pattern of success but wasnot successful in every location (Wisler etal.).
Hodges (1978) believed PFT to besuccessful, but mistakes on the part of theAbt evaluators produced the negative re-sults. Hodges stated that unreported datawould have shown overall positive resultsin reading and math achievement, parentalinvolvement, and school morale. He alsopredicted that future examination of PFTwould reveal more valuable information."Just because Follow Through has notproved to be an easy, workable, inexpen-sive solution for all the educational prob-
30
lems of poor children does not mean itshould be dismissed as just another failurein compensatory education" (Hodges, p.191).
One Study of the Exception
Abt evaluators found DI, begun in P.S.137 in the Ocean Hill-Brownsville sectionof Brooklyn, New York, to be consistentlysuccessful in all measured areas from1968-1981. P.S. 137 is characterized asseverely disadvantaged. Parental involve-ment was instrumental in maintaining PFTfor 14 years despite budget cuts and exces-sively high turnover rates of teachers,principals, and PFT directors (Meyer,Gersten, & Gutkin, 1983).
DI employs the carefully sequencedDistar curriculum, ongoing teacher training,and constant monitoring of student prog-ress. Since this model is highly structured,it is less dependent on specific people.New teachers can quickly learn to use it,which leads to greater potential for successin areas characterized by high turnover(Meyer et al., 1983).
Since implementation of DI, studentsin P.S. 137 have surpassed students fromcomparably disadvantaged schools on theMAT in 1974, the Stanford AchievementTest (SAT) in 1975 and 1976, and theCalifornia Test of Basic Skills (CTBS) in1977 (Meyer et al., 1983).
Continued evaluations of the studentsinto the fourth and fifth grades demonstrat-ed mean scores at grade level. Studentsreceiving DI scored significantly higher onachievement tests when compared to allother students in that district not receivingDI. When compared to a group of 6,000low socioeconomic, non-PFT students, thepositive achievement test results generated

by students receiving DI were even moreimpressive. Among the seven PFT modelssponsored in New York City, only the DImodel demonstrated effective instruction(Meyer et al., 1983).
A Secondary Analysis
Gersten, Becker, Heiry, and White(1984) studied the relationship betweenentry IQ and yearly academic gains among1,500 low-income students, from 20 com-munities, who had been through the DIprogram. Low IQs did not hinder academ-ic progress in schools using DI, the onlyPFT model to bring low-income studentsnear or above the national average perfor-mance on the MAT.
Reanalysis of Site Variability
Although the large number and varietyof sites involved in the Abt study madeprecise comparisons difficult, the evaluatorsfound the DI model to be generally effec-tive in all three areas: basic skills, cog-nitive-conceptual, and affective-cognitive.Upon reexamination of the data, Gersten(1984) found cases of both good and poormatching of comparison groups. Positiveeffects of the DI model on math achieve-ment were consistent, replicable, and sig-nificant among all urban sites.
"When the same analyses that Glass orthe Abt Associates did are performed usingsamples of urban sites implementing theDirect Instruction model, much of theunexplained variation disappears" (Gersten,1984, p. 421). Since Abt's 1977 study,sites which continued to use the DI modelwere examined. In later analysis, research-ers gathered data exclusively from low-in-come students; only 80% of Abt subjects
were low-income. Data showed that in-creased performance levels had been main-tained in four urban sites (Gersten).
Results of Several Longitudinal Studies
Meyer (1984) compared students re-ceiving DI at the highly successful P.S.137 in Brooklyn, New York to a controlgroup of non-DI, similarly disadvantagedstudents in nearby school. The studentswere then about 20 years old. Meyercompared them in three areas: a) ninth-grade reading and math achievement, b)high school graduation, and c) collegeapplication and acceptance.
In ninth grade, the DI students per-formed significantly higher than the controlgroup in mathematics, yet were still ap-proximately 6 months below grade level.Approximately 60% of the DI studentsgraduated from high school, whereas onlyabout 38% of the control students graduat-ed. Thirty-four percent of the DI studentsapplied to college and were accepted. Ofthe control group, 18.5% applied to col-lege; 17% were accepted (Meyer, 1984).
Gersten and Keating (1987) investigat-ed the first of the PFT students who com-pleted high school in 1981 or 1982. Theywere compared to non-PFT students withthe same ethnic background and familyincome who attended other schools. Stu-dents receiving DI attended six differentschools. In all six schools, ninth-gradereading levels had come within 10 per-centile points of the national average, wellabove the average reading levels of otherlow socioeconomic students. Fewer stu-dents dropped out of high school and morestudents applied to college. Students whoparticipated in the 4-year (K-3) DI modelrealized greater benefits than did those
31

students in the 3-year program (1-3).Engelmann, Becker, Carnine, and
Gersten (1988) found that students in theDI model showed cognitive and affectivegains as well. Students enrolled in DIperformed better in reading comprehension,math problem solving, math concepts, andhad a greater degree of self-esteem than didstudents taught with all other models.
Engelmann et al. (1988) found thatteachers initially reacted negatively tohighly structured lessons and in-class su-pervision, yet half of them changed theirminds in view of classroom success. En-gelmann's study demonstrated that money,good intentions, and social services do notguarantee a particular program's success.PFT sponsors had equal money and assis-tance, yet only a few models exhibitedoverall, though inconsistent, success.
While DI appeared most successful forall students, programs oriented towardindividual learning styles provided the leastacademic achievement. Models usingPiagetian concepts of self-directed learningwere ineffective in increasing scores onstandardized tests of basic skills in thirdgrade. Only the carefully sequenced, high-ly organized DI model demonstrated gainsin the cognitive areas of thinking andproblem solving (Engelmann et al., 1988).
Some critics suggested there would bea dissipating or negative effect of DI pro-grams in later years as a result of stiflingstudents and evoking negativism towardeducation. To investigate these accusationsGersten, Keating and Becker (1988) com-pared fifth and sixth graders to students ofsimilar demographics. The study utilizedrecords from 1975 and 1976. For bothyears, students from the Dl model outper-formed the control group in most domainsassessed by standardized achievement tests.
32
'A second study followed junior andsenior high DI graduates who had eitherattended a program from kindergartenthrough third grade or from first throughthird. Comparison groups were selectedbased on reception of Aid to Families ofDependent Children and on ethnicity. Thestudy compared not only academic achieve-ment, but graduation and drop out rates,college application and acceptance, andretention (Gersten et al., 1988).
The results of ninth-grade readingachievement favored the DI students as didhigh school reading achievement. By theninth grade, students who had been en-rolled in DI programs since kindergartenperformed at or less than a year belowgrade level. Math achievement was similarbut not as strong as reading achievement.A study of graduation and dropout ratesshowed inconsistent or insignificant resultsat two of the sites; results from a third sitesignificantly favored DI. Although collegeacceptance was examined at only two sites,DI students demonstrated significantlybetter success. DI students were alsoretained significantly less often than werestudents in the control groups (Gersten etal., 1988).
A Preschool Model
Based on findings that students whoattended a PFT program from kindergartenthrough third grade achieved greater aca-demic success than did those studentsenrolled in a PFT program from firstthrough third grades, a preschool for chil-dren living at the poverty level was begunin 1976. The school utilized the DI modeland focused on 4- and 5-year-olds(Weisburg & Weisburg, 1988).
These students were compared to a
'1 )

group of preschoolers in another interven-tion project. On the Wide Range Achieve-ment Test measuring reading, spelling, andmath, the Direct Instruction preschoolersscored between the 73rd and 90th percen-tiles. DI children who had been in bothpre-kindergarten and kindergarten scoredabove the 90th percentile. The comparisongroup scored between the 30th and 45thpercentiles. Academic success followedthe DI students into regular school (Weis-burg & Weisburg, 1988).
Dissemination
The agents charged with disseminationof PFT programs were the National Diffu-sion Network (NDN), and the Joint Dis-semination Review Panel (JDRP). TheNDN was composed of 21 resource centersfunded by PFT. The 26 members of theJDRP represented groups in the Departmentof Education. They validated 48 exempla-ry Follow Through Programs (Rhine,1983).
Among the programs validated andfunded by JDRP and packaged and dis-seminated by NDN were PFT modelswhich had not demonstrated improvedacademic instruction. Schools, therefore,could not discriminate between effectiveand ineffective programs (Watkins, 1988).
Funding
At the time of development, PFT wasappropriated $120 million. Before PFTbegan, funds were cut to $15 million for1968 (House et al., 1978). Between 1968and 1983 almost $1 billion were spent onPFT. At the height of the program in1970, $70 million were appropriated. In1981 the number of funded programs was
4
reduced from 147 to 84, the number ofsponsors reduced from 22 to 16, and thenumber of enrolled students reduced from63,558 to 36,000. Fund,r.g continued formost of the validated programs (Rhine,1983).
In 1982 PFT programs validated byJDRP received fewer funds than did non-validated programs. In 1983, no newprograms were validated, and the highestfunding again went to non-validated pro-grams (Watkins, 1988). In its 1987 budgetthe Reagan administration called for termi-nation of the Follow Through programs,which had last been reauthorized in 1984;however, Congress appropriated $7.5 mil-lion for 1987, $7.8 million for 1988, $8.1million for 1989, and $8.4 million for 1990(Cohn, 1987).
Conclusions
Since the federal government has spentconsiderable money on PFT, it seemsunreasonable that results have not beenbetter utilized. PFT tested many differentmodels over a period of years. Reanalysesof original evaluative data as well as longi-tudinal studies of PFT graduates haverepeatedly demonstrated that only the DImodel obtained positive correlations acrossall measured areas. Longitudinal studiesalso demonstrated that DI produced ahigher graduation rate, lower drop-out rate,and increased likelihood of college accep-tance.
The results of program expansion tojunior and senior high school must beconsidered. In regards to New York Citywhich documented DI success, researchersstated, "Despite these important gains,however, 40 percent still dropped out ofnigh school. This is significantly less than
33
the comparison group dropout rate of 58percent, but it is far from ideal" (Gersten &Keating, 1987, p. 31).
Improvements could be made in PFTnot only by expanding to the upper gradesbut also by considering sociocultural fac-tors when educating disadvantaged chil-dren. "Schools are basically designed forwhite, middle-class children, and leavelargely to parents the teaching of a mostbasic building block for intelligent behav-ior-- namely, words and their referents"(Engelmann et al., 1988, p. 316).
We cannot depend on informal meth-ods of disseminating information. The DImodel was effective not only because ofthe material components but due to itsimplementation of specific teaching tech-niques, high teacher expectations, andparental support. "Learning these tech-niques is not easy. If teachers, even thosewho are experienced classroom teachers butnew to Direct Instruction, do not receiveintensive classroom supervision, the acqui-sition of these skills usually takes longer"(Carnine, 1988, p. 22).
Rather than improving or expandingthe DI Follow Through program, the feder-al government has sought to reduce it.PFT results have not been carefully dissem-inated. Educational circles are replete withteaching ideas based on a variety of meth-ods, few of which have been as thoroughlystudied and successfully demonstrated as
DI. Tha Duhl0 demand AtAf iiktQAappropriations for only proven methods.Data relating to program effectiveness mustbe made available to school districts andcolleges of education.
34
References
Anderson, R., St. Pierre, R., Proper, E.,& Stebbins, L. (1978). Pardon us, butwhat was that question again?: A re-sponse to the critique of the FollowThrough evaluation. Harvard Educa-tional Review, 48, 161-170.
Carnine, D. (1988). Breaking the failurecycle in the elementary school. YouthPolicy, 10, 22-25.
Cohn, M. (Ed.). (1987). Congressionalquarterly almanac, XLII. Washington,D. C.: Congressional Quarterly, Inc.
Engelmann, S., Becker, W., Carnine, D.,& Gersten, R. (1988). The Direct In-struction Follow Through Model: De-sign and outcomes. Education andTreatment of Children, 11(4), 303-317.
Gersten, R. (1984). Follow Through revisit-ed: Reflections on the site variabilityissue. Educational Evaluation andPolicy Analysis, 6(4), 411-423.
Gersten, R., Becker, W., Heiry, T., &White, W. (1984). Entry IQ and yearlyacademic growth of children in DirectInstruction programs: A longitudinalstudy of low SES children. EducationalEvaluation and Policy Analysis, 6(2),109-121.
Gersten, R., & Keating, T. (1987). Long-term benefits from Direct Instruction.Educational Leadership, 44, 28-31.
Gersten, R., Keating, T., & Becker, W.
(10H1. ThA &antinuod ifiltIROt of thoDirect Instruction Model: Longitudinalstudies of Follow Through students.Education and Treatment of Children,11(4), 318-327.
'1

Hodges, W. (1978). The worth of the Fol-low Through experience. HarvardEducational Review, 48(2), 186-191.
House, E., Glass, G., McLean, L., & Walk-er, D. (1978). No simple answer: Cri-tique of the Follow Through evalua-tion. Harvard Educational Review,48(2), 128-158.
Meyer, L. (1984). Long-term academiceffects of the Direct Instruction ProjectFollow Through. The ElementarySchool Journal, 84(4), 380-394.
Meyer, L., Gersten, R., & Gutkin, J.(1983). Direct Instruction: A ProjectFollow Through success story in aninner-city school. The ElementarySchool Journal, 84(2), 241-252.
Rhine, W. (1983). The role of psycholo-gists in the national Follow ThroughProject. American Psychologist, 38(3),288-297.
Stebbins, L., St. Pierre, R., Proper, E.,Anderson, R., & Cerva, T. (1977).Education as experimentation: Aplanned variation model (Volume IV-A): An evaluation of Follow Through.Cambridge, MA: Abt Associates.
Watkins, C. (1988). Project FollowThrough: A story of the identifi-s;ationand neglect of effective instruction.Youth Policy, 10, 7-11.
Weisburg, R., & Weisburg, P. (1988).Effective preschools for at-risk chil-dren: Our hope for the future. YouthPolicy, 10, 30-31.
Wisler, C., Burns, G., & Iwamoto, D.(1978). Follow Through redux: Aresponse to the critique by House,Glass, McLean, and Walker. HarvardEducational Review 48(2), 171-191.

-PERMISSION TO REPRODUCE THISMATERIAL HAS BEEN GRANTED BY
Relationships Between Language and Music Sitcc-Linda J. Star
Since language and music are forms ofcommunication, and both use symbol sys-tems, other similarities may exist. Thispaper reviews the literature regardingstructural, processing, and perceptivesimilarities between language and music.Also included is a review that indicates ahigh correlation between academicachievement and music. Recommendationsand implications for educators and admin-istrators are discussed.
Music education programs are fre-quently among the first casualties duringbudget cuts. Core subjects have obviouseducational value, whereas music is oftenconsidered a frill or mere entertainment.Music education is neither frill nor solelyentertainment; it is an activity that relatesreal life experience to the expression ofexperience. Music is a multi-modal artform that requires processing of complextemporal information, development ofmotor skills, assimilation and comprehen-sion of coordinated sounds, and aestheticappreciation.
Language and music share certainobvious traits. They both use symbolsystems and sound, and both are forms ofcommunication and expression. Musicaldevelopment in humans has been comparedto language development and is believed tobe as universal to humans as is language.Sloboda (1985, p. 17) says "that humanshave a general capacity to acquire linguis-tic and musical competence." Regardingmusic's cultural ubiquity, Serafine (1988,p. 1) states, "No culture exists without it
10 THE EDUCATIONAL RESOURCESINFORMATION CENTER IERIC)-
and all persons have a knowledge of it toa considerable degree." Citing anthropo-logical studies, Dowling and Harwood(1986) argue that music does have adaptivevalue but at the societal rather than theindividual level. They further suggest thatmusical abilities have evolved parallel tolinguistic abilities, and that humans haveenough musical ability to make musicsocially. If these assertions are true, theneducators should reconsider music educa-tion in the schools.
This paper will explore relationshipsbetween music and language. Questions tobe considered include: (a) Is music per-ceived according to structure? If so, is itsimilar to language perception? (b) Areprocessing strategies in music and languagesimilar? and (c) Can predictive associationsbe made between music and academicachievement?
Hierarchical Structure
One area of study focuses on the hier-archical structure of language perception ormusic perception. That is, a sentence orpiece of music contains primary structuresupon which less important or ornamentalstructures are successively built. All thewords in a sentence or sounds in a piece ofmusic comprise the surface structure. Byapplying appropriate rules, deeper struc-tures emerge. The final reduction is themost basic structure around which thesentence or music composition is built. Ingraphic form, a reduction resembles afamily tree.
Sloboda (1985) compares the work of
37

linguist Noam Chomsky to that of themusic theorist Heinrich Schenker. Almostsimultaneously, Chomsky and Schenkerdeveloped similar theories of hierarchicstructure in their respective fields. Chom-sky described language as having surfacestructures which allow one to arrive at adeeper structure when a set of transfor-mational rules are applied. He believed allnatural languages have the same deepstructure which makes language a universalintellectual skill. Schenker's theory des-cribes a structure based on harmonic andcontrapuntal movement. A limited numberof deep structures can generate an unlimit-ed number of surface structures. Chom-sky's rules, however, are applied sentenceby sentence, producing an unlimited num-ber of deep structures.
Lerdahl and Jackendoff (1983) havedeveloped a generative theory of __tonalmusic which details rules used to derive adeep structure from the surface structure.They describe deep structure as analogousto phrase structure in language (p. 283).Their theory is restricted to the "formalcharacterization of the listener's intuitionsabout musical structure" (p. 332) and relieson the belief that humans have an innatecognitive musical capacity.
Although many theories of hierarchicalstructure in music exist, Serafine, Glas-sman, and Overbeeke (1989) could find nostudies that tested the reality of its percep-tion. Therefore, they performed a series ofsix experiments using six different groupsof college students from either Yale Uni-versity or Vassar College. The number ofsubjects and degree of musical experiencevaried in each group.
In order to test music perception ac-cording to hierarchical structure, an expertreduced several Bach excerpts to fore-
38
ground and middleground structures consis-tent with Schenker's theory. The firstreduction from the surface is known as theforeground reduction, which can be furtherreduced to the middleground reduction.Each reduction contains fewer notes thanthe previous one. The expert then providedfalse reductions for each excerpt at bothlevels. Experiments 1-3 required subjectsto match the correct reduction to the appro-priate excerpt. Results showed a generaltendency for subjects to correctly match asurface with its correct reduction. Metricplacement of structural pitches seemedimportant in correct matching; however;the roles of aesthetic preferences and re-peated hearings were unclear. Upon firsthearing, subjects appeared to have morecorrect matches than after repeated hear-ings.
The experiments were revised, andnewly composed pieces replaced the Bachexcerpts. These compositions were gener-ated from the structures in four forms: (a)two models having the same structure (M1& M2), (b) a harmonically different piecehaving the same structure as the models(harmonic foil [fin, and (c) a similarpiece on the surface having different struc-ture (counterpoint foil [CF]).
In experiments 4-6, subjects matchedmusical examples with a model and ratedthem according to similarity. Serafine etal. (1989) found that subjects were morelikely to rate the HFs as being more similarto the model than were the CFs. Since theHFs differed more on the surface but hadthe same deep structure while the CFs hada different deep structure, Serafine et al.concluded that subjects were matchingcompositions according to perception ofdeep structure. Repeated hearings strength-ened a subject's tendency to regard the HF
4 3

as similar to the model.Experiment 6 provided no evidence
that music is stored according to surface ordeep structure. Repeated hearings mayaffect encoding. Nevertheless, the experi-menters found sufficient evidence to sup-port the theory of perception according tostructure.
Processing Strategies
Levinowitz (1989) explored the rela-tionship of language development to songproduction in 4- and 5-year-old children.The study examined how the imposition ofwords affected the learning of a song andhow a child's language proficiency helpedor hindered this learning process.
Subjects were thirty-five 4- and 5-year-old children from two nursery school class-es in the same school. Levinowitz taughtboth classes for 5 months, one day perweek for 30 minutes. Rhythm, movement,and rote-singing were included; both class-es received the same instruction. Half therote songs contained words, while the otherhalf were sung with neutral syllables. Twocriterion songs were taught the last monthand were rated by two judges. One songcontained words; the other was sung on"bum." The songs were somewhat har-monically and rhythmically similar.
Language development was assessedby the Peabody Picture Vocabulary Test-Revised (PPVT-R). Rhythm achievementand tonal achievement were assessed andtheir resulting scores correlated. No dif-ferences were found in rhythm performancebetween songs sung with or without words.A partial correlational analysis revealed arelatively strong relationship betweenrhythm performance without words and thefollowing three indicators: (a) song with
4 7,
words (.60), (b) song without words (.64),and (c) rhythm performance with words(.64). Results may indicate that underlyingrhythms are involved in perception andprocessing of language and music.
A significant difference (p < . 01) wasfound between tonal performances of thesongs with or without words. The songwithout words was performed better thanthe song with words. Levinowitz hypothe-sized that a young child's attempt to learna song with words may involve two differ-ent processes. Words may interfere withan ability to learn the melody. Due to avery low correlation between the PPVT-Rand all other indicators, Levinowitz con-cluded that language development mayhave little to do with the ability to performrote songs.
Young children may employ two dif-ferent processes in language and musicdevelopment. Hahn's (1987) study consid-ered whole-to-part language processing bybeginning string students, ages 9-12.Students tended to drop out of music withthe introduction of traditional note reading,taught part-to-whole. Hahn's hypothesisrepresents Chomsky's (1969) and Good-man's (1984) psycholinguistic view oflanguage learning, which maintains thatlanguage is learned whole-to-part, fromgeneral to specific rather than vice-versa.Hahn's research is also based on musicperception theories developed by Longuet-Higgins (1978), Lerdahl and Jackendoff(1983), and Sloboda (1978), which explainthat music is learned whole-to-part, similarto processes employed in language learn-ing.
Subjects consisted of 18 students fromtwo beginning public school string classes.Hahn worked closely with the two musicteachers to coordinate the study. Both
39

classes received the same prereading in-struction for the first 2 months. Followingthis instruction, the control group receivedtraditional note reading instruction, whilethe experimental group received whole-to-part note reading instruction. A posttestwas administered after the 1 1 th musicreading lesson.
On the sight-reading and music readingportions of the posttest, students in theexperimental group performed significantlybetter than students in the control group .
They performed similarly on the recogni-tion task. Hahn suggested that the controlgroup performed the recognition task usingshort-term memory, producing attention tosurface elements. Due to the experimentalgroup's superior performance on the sight-reading and music reading portions of thetests, Hahn concluded that whole-to-partnote reading strategies provide a viablemethod to teach music reading.
In an attempt to discover the influencesof learning style and language dependencyon aural discrimination tasks, Schmidt(1984) studied 75 freshman music studentsat Indiana University. Previous studiesdetermined two types of learning styles: (a)field dependence/field independence and(b) reflection/impulsivity. Field depen-dence/field independence describes whetheran object is perceived in context or out ofcontext. Reflection/impulsivity describesthe speed and deliberateness of decisionmaking and the accuracy of the response.The Group Embedded Figures Test (GEFT)(Witkin, Oltman, Raskin, & Karp, 1971)tested for field dependency, and the Match-ing Familiar Figures Test (MFF) (Kagan,1964) tested for reflection/impulsivity.Language relationships in aural skills weretested based on a construct developed byDay (1981). This construct describes
40
language-bound individuals as those whoprocess aural information by using lan-guage rules. Language-optional individualsuse language rules or set them aside, de-pending on the situation. A test of tempo-ral order discrimination (TOD) (Keele &Lyon, 1982) tested language-optional/language-bound perception. Scores onthese three tests served as the independentvariables. An entrance/placement examina-tion which tested several types of auralskills served as the dependent variable.
A step-wise multiple regression deter-mined which indicators were more impor-tant in predicting aural skills. The TODtest (16.1% of the variance) and the GEFT4% of the variance) proved to be the bestindicators of aural skills achievement.Language-optional subjects performedsignificantly better than language-boundsubjects (p < .05). Field-independentsubjects also performed significantly betterthan field-dependent subjects (p < .05).Schmidt (1984) suggested that the successof the language-optional students is proba-bly due to reliance on short-term memoryfor each task (p. 166).
In the previous studies, subjects werefrom middle- to upper-middle-class socio-economic backgrounds. The following twostudies involved at-risk students.
In a study designed to help studentswith language problems access music,Tanner (1990) paired the Initial TeachingAlphabet (i.t.a.) with music. According toTanner, "music will strengthen readingskills which, in turn, will allow the studentgreater access in learning musical skills"(p. 7). I.t.a. uses one symbol for each ofthe 44 sounds of the English language andis easily transferred to the 26-characteralphabet. This system was chosen to elimi-nate enfusion arising from the many

inconsistencies between spoken and writtenEnglish.
Twelve elementary students enrolled inthe resource program were tested duringthe first 4 weeks of classes and again inthe spring during the last 4 weeks of class-es. The experimental group was taughtreading by the Early-to-Read i/t/a/ Pro-gram; music was taught using this systemin conjunction with the Silver BurdettMusic Series and supplemental folk songs.The control group was taught readingthrough a pull-out resource program andmusic was taught conventionally. Theyreceived reading instruction 5 days perweek, 30 minutes each day. and musicinstruction 3 days per week, 30 minuteseach day. Reading and music classes weretaught to the experimental group using amultisensory approach: visual, auditory,and kinesthetic. Computers and a MIDIsequencer/synthesizer were used in musiccomposition and playback. Computerprograms using i.t.a. were written for boththe music and reading classes. Studentswere encouraged to create their own songsand supply correct rhythms. Phrasing inmusic and language received rhythmicemphasis.
ANOVA results indicated significantimprovement in all areas of the reading andmusic tests (p < .01). The control groupimproved, but not significantly. Tanner(1990) suggested that the interaction be-tween the i.t.a. reading system and themultisensory teaching methods used withthe experimental group served as mutualreinforcement.
A similar study involving at-risk stu-dents was undertaken by Everett (1990) todetermine if music would improve readingand comprehension skills in third-gradestudents. Students in two classes from low
A
socio-economic backgrounds were selectedand then subdivided into experimental andcontrol groups.
The control group received normal andremedial reading instruction, while theexperimental group received three extra 30-minute music activities per week in lieu ofremedial reading. The study took placeover an 18-week period. Activities in theexperimental group remedial reading (mu-sic) class utilized visual, aural, and kines-thetic modes and incorporated languageinto musical elements by means of rap,games, and dances.
The results of a t test indicated that theexperimental group scored significantlybetter than the control group in readingachievement (p < .05). A comparison ofgrade level changes using the Botel Read-ing Inventory revealed that all students inthe experimental group attained a normal1/2 year gain, while only three students inthe control group demonstrated any gain.
Relationship between Music andAcademic Achievement
In an extensive correlational study,Asmus (1990) collected and analyzednational, regional, and local statistics todetermine the effects of music on academicachievement and concluded it has a posi-tive effect. Asmus' literature review in-cludes a study which positively correlatedmusic electives in junior high and highschool with higher scores on the Iowa Testof Basic Skills taken in the 6th grade. Inanother study, Kvet (1985) found thatexcusing 6th grade students from regularclass time for music did not have a nega-tive effect on academic achievement.
After collection and analysis of nation-al data on test scores, monetary expendi-
41

tures, and student/teacher ratios, Asmus(1990) found student/ music teacher ratioto be the strongest indicator of academicachievement as measured by the ScholasticAptitude Test or the American CollegeTest.
In a related study, Hedden (1982)studied the effects of academic achieve-ment on music achievement. After consid-ering other factors (music background,attitude toward music, self-concept, andgender), Hedden found that academicachievement most strongly predicted musicachievement. Inversely, Asmus (1990),using Hedden's data, found that musicachievement was positively correlated withacademic achievement as measured by theIowa Test of Basic Skills.
Summary and Conclusions
Rhythm and meter seem to greatlyinfluence structural perception (Serafine etal, 1989), song production (Levinowitz,1989), and music and language achieve-ment (Tanner, 1990). Levinowitz's studyrevealed a relatively strong relationship be-tween rhythm and all other indicators ofsong production. However, language andmusic, when paired, may not contain con-gruous rhythmic or metrical structures.Perhaps for this reason, subjects learnedrote songs without words more easily thansongs with words. In Tanner's study, stu-dents composed texts and supplied correctrhythms. Perhaps, they intuitively suppliedmatching structures which produced suc-cess. Original creations might have madethe subject matter more relevant, thereforemore meaningful.
Short-term memory was cited in recog-nition tasks (Serafine et al., 1989; Hahn,1987) and learning style (Schmidt, 1984).
42
Tasks calling for quick judgments producedattention to underlying structure, whilerecognition tasks seemed to produce atten-tion to surface structures. Part-to-wholeteaching methods focus attention to surfacewhich may account for the control group'ssuccess on the recognition task in Hahn'sstudy. Language-optional and field-inde-pendent perception, also attributed to short-term memory (Schmidt), may require an-other cognitive process such as one fordiscrimination.
Studies by Tanner (1990) and Everett(1990) correlated language achievementwith music education. Everett's study,however, may have more practical implica-tions for schools lacking elaborate equip-ment. Both studies used multisensory ap-proaches with high-level student involve-ment. By its very nature, music is multi-sensory, which readily lends itself to thisapproach. Asmus (1990) found that musicdoes strongly influence academic achieve-ment.
These findings suggest other research:(a) What is the interrelatedness betweenunderlying structure in music and lan-guage? (b) What place might rhythm andmeter have in this relationship? and (3)Can the ability to discriminate be devel-oped through music and transferred tolanguage?
In conclusion, these studies suggestthat music should occupy a more promi-nent place in education, particularly withat-risk students. This issue requires coop-eration among administrators, music spec-ialists, and special education personnel.Reading skills are very important, provid-ing students access to other academic areas.If music helps students unlock languagebarriers, educators should pursue the rela-tionship between language and music.
References
Asmus, E. (1990). The influence of musiceducation on non-musical indicators ofeducational attainment. Paper presentedat the National In-Service Conferenceon the Value of Music Learning. Win-ston-Salem, NC.
Chomsky, N. (1969). Syntactic structures.Paris: Mouton.
Day, R. (1981). Music ability and patternsof cognition. In R. Day (Ed.), Docu-mentary report of the Ann Arbor Sym-posium: Applications of psychology tothe teaching and learning of music (pp.270-283). Reston, VA: Music Educa-tors National Conference.
Dowling, W., & Harwood, D. (1986).Music cognition. Orlando: AcademicPress.
Everett, P. (1990). The effect of music onthe development of basic reading skillsof third-grade students. Georgia MusicNews, 51(1), 55-57.
Goodman, K. (1984). Unity in reading. InA. Purves and 0. Niles (Eds.), Eighty-third Yearbook of the National Societyfor the Study of Education: Becomingreaders in a complex society Part 1.(pp. 79-114). Chicago: National Soci-ety for the Study of Education.
Hahn, L. (1987). Music reading and language reading: Correlations in process-es and instruction. Council of Researchin Mu ;ic Education Bulletin, 93,41-48.
Kagan, J. (1964). Matching Familiar Figures. Cambridge, MA: J. Kagan.
Kee le, S., & Lyon, D. (1982). Individualdifferences in speech fusion: Method-ological and theoretical explorations.Perception and Psychophysics, 32(5),433-442.
Kvet, E. (1985). Excusing elementaryschool students from regular classroomactivities for the study of instrumentalmusic: The effect on sixth-grade read-ing, language, and mathematicsachievement. Journal of Research inMusic Education, 33(1), 45-54.
Lerdahl, F., & Jackendoff, R. (1983). Agenerative theory of tonal music. Cam-bridge, MA: MIT Press.
Levinowitz, L. (1989). An investigation ofpreschool children's comparative capa-bility to sing songs with and withoutwords. Council of Research in MusicEducation Bulletin, 100,14-19.
Longuet-Higgens, H. (1978). The perception of music. Interdisciplinary ScienceReviews, 3(2), 148-156.
Schmidt, C. (1984). The relationshipamong aspects of cognitive style andlanguage-bound/language-optionalperception to musicians' performancein aural discrimination tasks. Journal ofResearch in Music Education, 32(3),159-168.
Serafine, M. (1988). Music as cognition.New York: Columbia University Press.
Serafine, M., Glassman, N., & Overbeeke,C. (1989). The cognitive reality ofhierarchic structure in music. MusicPerception, 6(4), 397-430.
Sloboda, J. (1978). The psychology ofmusic reading. Psychology of Music,6(2), 3-20.
Sloboda, J. (1985). The musical mind.Oxford, Great Britain: Clarendon Press.
Tanner, D. (1990, November). Initial teach-ing alphabet, language experience andmusic. Paper presented at the NationalIn-Service Conference on the Value ofMusic Learning. Winston-Salem, NC.
J143

Witkin, H., Oltman, P., Raskin, E., &Karp, S. (1971). A manual for theEmbedded Figures Test. Palo Alto:Consulting Psychologists Press.
44
The Self-Esteem of Gifted Children:A Developmental and Comparative Study
Pollyann Diamond
This study compared aspects of the self-esteem of gifted and non-gifted, high achie-ving children in grades 3, 4, 5, and 6 usingHarter' s Self-Perception Profile for Chil-dren. Gifted children perceived themselvesas more competent than their non-giftedpeers only in the scholastic area (2<.01).Differences were found for both groups inthe physical appearance area by grade(g<.001) and in the athletic (E<.01) andbehavioral conduct (2<.001) areas bygender. Consistent with previous findings,boys were found to have higher self-esteemin the athletic realm, while girls expressedhigher self-esteem in conduct. Also, com-patible with other research was the findingthat self-esteem associated with appearancedeclines over the elementary school years.Gifted children appear to be quite similarto their high achieving, non-gifted peers inall but scholastic areas. The difference inscholastic self-esteem favored the giftedgroup after only 1 year in a special pro-gram and continued to remain relativelyconstant over time, while the scores of thenon-gifted peers declined. It is indetermi-nate if the difference in the scholastic areais due to the first year of the special pro-gram or to the effect of labeling a child asgifted.
Self-concept is a construct comprisedof an individual's beliefs about variousaspects of the self derived from interactionwith significant others and self-appraisal ofcompetencies. Self-esteem, on the otherhand, is the value or worth an individualassigns to various dimensions within theconstruct of self-concept (Harter, 1983). In
the literature, the terms "self-concept" and"self-esteem" have been used interchange-ably; self-esteem is the referent in formalmeasures of self-concept. The term "self-concept" will refer, in this paper, to theglobal construct; "self-esteem" will applyto particular aspects of the general con-struct (e.g., academic or social self-esteem).There is less agreement on the nature andmeasurement of the global construct butconsiderable agreement on the multidi-mensional quality of its constituents basedon factor analytic studies (Byrne, 1984).
Historically, the construct of self-con-cept emerged in the works of WilliamJames and, notably, in the writings of Coo-ley around the turn of the century (Harter,1983). Many schools of psychology haveundertaken studies of the self-concept andhave generated a variety of theories toaccount for the importance of this constructwithin the personality. Cooley suggestedthat self-image is a reflection of how othersregard us. Piaget (1981), a representativeof the organismic school, indicated that theself-concept is not merely a reflection ofhow others view us but stressed the addi-tional importance of self-evaluationthroughout childhood. Theorists of thehumanistic perspective link self-esteem toboth motivation and achievement citing theeducational significance of deficiencyneeds, self-fulfilling prophecy, and thecentral role of positive self-concept devel-opment for students (Biehler & Snowman,1986, p. 496). Bandura (1977), a neo-behaviorist, reinforced the connection be-tween self-esteem and motivation, contend-ing that successful achievement enhances
PE IMISSII,N 10 RE PRODLIC.F THISMATE RAI HA;, BEEN GRANT ED BY
THE IDI1C.ATIONAI RESOURCESOF ORMAliON LENTER 'ERIC)
45

self- efficacy which, in turn, increasesmotivation and partially determines confi-dence, persistence, and goal-setting. Thus,organismic, humanistic, and neo-behavior-istic schools acknowledge the importanceof self-concept, but differ on the relation-ship between self-esteem and achievement.
Self-Esteem and Achievement
According to traditionalists, successenhances self-esteem (Harter, 1989). In the1960s, the popular view emerged that self-esteem enhancement improved academicperformance. However, Bachman andO'Malley (1977) found no evidence thathigh levels of school self-esteem wererelated to subsequent educational or occu-pational attainment. Rather, academicability and achievement influenced self-esteem. On the other hand, studies dosupport that a student's perception of aca-demic self-esteem may strongly impactachievement (Caslyn & Kenny, 1977;Harter & Connell, 1982). Perceived aca-demic competence (i.e., high academicself-esteem) predicted motivational orienta-tion; a greater sense of cognitive compe-tence intrinsically motivates the stud nt toperform academically (Harter & Connell).Thus, it appears that academic self-esteem,rather than global self-concept, is impor-tantly related to achievement. Additional-ly, mood or affect may be a moderatingvariable in this relationship (Harter, 1983).Low self-esteem can be associated withdiminished affect and energy to performacademically.
There is little agreement in the field ofeducation that enhancement of self-esteemimpacts achievement, or that achievementenhances self-esteem. A reciprocal rela-tionship between achievement and dimen-
46
sions of self-esteem appears to be theemerging conceptualization. The impor-tance of achievement to self-esteem seemsto relate to the student's perception ofacademic competence (i.e., academic self-esteem) and the value the student attachesto that aspect of the self-concept.
Self-Esteem and Gifted Children
Gifted and high-achieving childrenwould be expected to exhibit relativelyhigh self-esteem regardless of the direc-tionality of the relationship between self-esteem and achievement. Students are saidto respond according to their self-percep-tions, and the way teachers react to stu-dents influences the students' self-percep-tions (Biehler & Snowman, 1986, p. 405).Huryn (1986) reported that gifted studentsgenerally believed their teachers viewedthem as good students to whom they couldgive more work and send on errands sincethey were more reliable. However, 11 ofthe 60 students interviewed had encoun-tered teachers who viewed them negatively;these students felt they had to hide theirgiftedness for the teacher to like them.
Several studies have examined teach-ers' reactions to and perceptions of thegifted. Findings indicate that two criteriahave greatest impact on teacher percep-tions: (1) years of teaching experience and(2) knowledge about the gifted. The moreexperienced teachers and those with greaterknowledge of the characteristics of gifteddemonstrate the greatest acceptance andpositive regard for gifted students (Bran-sky, 1987; Cramond & Martin, 1987;Morris, 1987). Further, teachers mayrespond to gifted students based, in part, ontheir perceptions of gifted programs (Co-langelo & Kelly, 1983; Schneider, 1987)
5

which may not always be favorable.Historically, the self-concept of gifted
children has been a topic ofconsiderable discussion. In the last cen-tury, the gifted were stereotyped as puny,insane, and weird (Maker, 1977). Khatena(1982) cited Terman's longitudinal studieson gifted individuals which indicated thatthe gifted were generally superior on mostmeasures, although considerable variabilitywas found. Zaffrann and Colangelo (1979)questioned whether these qualities neces-sarily dispose the gifted to better accep-tance by others, better personal adjustment,and greater self-esteem. Such children mayfind themselves isolated from peers. Forexample, Ross and Parker (1980) reportedthat gifted students exhibit lower expecta-tions for social success than academicsuccess.
Other investigators confirm that giftedand high-achieving students may lacksocial confidence and perceive themselvesas less popular (Brody & Benbow, 1986;Whalen & Csikszentmihalyi, 1989). Kha-tena (1982) also expressed concern foraffective development of the gifted andtalented, viewing adequacy in this domain,including self-concept, as a prerequisite tothe risk-taking behavior necessary for newdiscoveries. Thus, impairment in thisrealm may result in loss of productivityand other social consequences. Maker(1982) echoed these concerns by includingdevelopment of a positive and realistic self-concept and positive attitudes toward learn-ing as important goals for gifted programs.
The self-concept of gifted childrenconcerns experts in the field. The literaturedoes not support that the gifted automati-cally have positive self-concepts and ade-quate affective adjustment. McDowell(1984) summarized the literature by stating
that "feelings of being 'different' can havea deleterious effect on both the (gifted)child's emotional and social adjustment"(p. 26). He further commissioned adminis-trators, teachers, and counselors to attendto this aspect of gifted children.
The consensus appears to be that theself-concept of gifted individuals is notuniformly positive, and that programsshould make enhancements of self-esteema major goal. The task is to determinewhat is being done to develop a positiveself-concept in gifted children. Whatdevelopmental trends are noted by theresearchers? Has there been a systematicstudy to determine the effect of specialprogramming on the self-concept of thegifted population?
Current findings have resulted in in-consistent conclusions. Some researchersused global scores of self-esteem andreported no difference between gifted andnon-gifted; others, using the same or simi-lar measures, found that gifted childrenhave significantly higher or significantlylower self-esteem than their non-giftedpeers.
Bracken (1980) studied gifted elemen-tary school students and their non-giftedpeers employing self-esteem scales de-signed specifically for that study. Nosignificant difference was found in theglobal self-esteem scores of the twogroups. In a similar study, Ross and Park-er (1980) administered the Sears Self-Con-cept Inventory to gifted students in grades5 through 8. No sex differences werereported on either the academic or socialsubscale, but academic self-esteem of thegifted population was found to be signifi-cantly higher than social self-esteem. Nosignificant difference was reported acrossgrade levels. Kelly and Colangelo (1984)
5 ,47
reported similar findings using the Aca-demic Self-Concept Scale and the Tennes-see Self-Concept Scale (social self-concept)with students in grades 7 to 9. Thus, inthe Ross and Parker study, academic self-concept was higher than social self-esteemamong gifted students; in the Kelly andColangelo study, social and academic self-esteem among the gifted were higher thanagemate controls.
Lehman and Erdwins (1981) attemptedto further define the social incongruencyexperienced by gifted students as theyrelate to their non-gifted peers. Third-grade gifted students were compared to agepeers and to sixth-grade students describedas their mental-age peers. On social skillsand sense of personal worth, the research-ers found gifted students differed moresignificantly from peers of the same chro-nological age than from peers of the samemental age; generally, the gifted studentswere well-adjusted personally and sociallyand had good self-concepts. In familieshaving a gifted child and a non-giftedsibling, parents may "idealize" the giftedchild resulting in lower self-esteem for thenon gifted. sibling (Colangelo & Brower,1987; Cornell, 1983).
Contrast effects and social comparisonsappear to be factors impacting the develop-ment of self-esteem. According to Ban-dura's social comparison theory (1977),gifted children may or may not increaseself-esteem over the school years depend-ing on the educational and social groupwith whom they associate. This theorymay account for differences in self-esteemamong gifted resulting from different ser-vice methods reviewed subsequently.
Some researchers have found signifi-cant differences between the self-esteem ofgifted children and their non-gifted peers;
48
others have not. Results are inconsistent,probably due to the use of different instru-ments, different ages and abilities of chil-dren, and divergent control-comparisongroups as well as comparison of the self-esteem of gifted and controls followingdiverse lengths of placement and types ofspecial programming delivery models.Further comparative studies of global andunique dimensions of the self-concept ofgifted children with both age peers andmental age peers is indicated.
Gender Differences in Self-Esteem andPeer Acceptance
Gender comparisons have been pre-sented in the literature on how gifted chil-dren are perceived/accepted by peers andwhether gender is a factor in self-esteemamong the gifted or in relation to controls.Gender differences in peer acceptance ofthe gifted did not obtain, while attitudestoward non-gifted females were morefavorable than those for non-gifted males(Killian, 1981). Using a peer nominationtechnique to assess perceived social compe-tence of 10th-grade gifted and non-giftedmales and females, Schneider (1987) re-ported a pattern similar to Killian's notingthat methodological problems in previousstudies may have obscured gender differ-ences in ratings of social competence andacceptance since the rater's gender was nottaken into account.
When comparing the self-esteem ofgifted to non-gifted peers, gender differ-ences were reported by several researchersusing a variety of instruments. Colangelo,Kelly, and Schrepfer (1987), using theTennessee Self-Concept Scale, reported thatgifted girls, grades 7 through 9, had higheracademic self-esteem than did non-gifted
5

girls. Gifted boys had higher general self-esteem than did non-gifted boys. No dif-ferences were noted regarding gender;however, other studies (e.g., Bartell &Reynolds, 1986) did find differences.
Bartell and Reynolds (1986), using theCoopersmith scale, reported that gifted girlsin grades 4 and 5 had higher self-esteemthan did gifted boys; non-gifted boys' self-esteem was higher than that of non-giftedgirls. They commented that the differencemay have been due to the reinforcementgifted girls received from teachers foracademic performance compared with thetendency to reinforce boys for achievementin other areas.
Loeb and Jay (1987) reported genderdifferences in global self-concept for giftedstudents ages 9 through 12 on the Piers-Harris scale. Gifted girls had significantlyhigher self-esteem than did non-gifted girls;no effects were noted for gifted versusnon-gifted boys. No gender differenceswere noted within the gifted group.
With regard to global self-concept,reports of gender differences are inconsis-tent. Two studies reported that gifted girls'self-concepts were significantly higher thanthose of non-gifted girls; however, differ-ences within the gifted samples were notconsistently significant. Additional study isneeded to clarify this point. Gifted girlstend to have higher self-esteem than dotheir non-gifted female peers, while thesame is not evident for boys.
Grade Effects and Self-Esteem
Several researchers have used thePiers-Harris Self-Concept Scale to assessgifted students, using the norm sample forcomparison. The results, with regard tograde effects, have been inconsistent.
Karnes and Wherry (1981) found that, as agroup, gifted fourth through seventh grad-ers had significantly higher self-esteemthan the norm sample for this instrument.No sign:.ficance was noted for gender orgrade, or between gifted enrolled in giftedprograms and those not enrolled. In astudy of gifted students in grades 5 and 6,Maddux, Scheibner, and Bass (1982) foundsignificant grade effects using the Piers-Harris scale. Sixth graders had significant-ly higher self-esteem than did those sub-jects in the norm sample, while no differ-ence was found between fifth graders inthis study and those in a previous study.The norm sample could not be used for thefifth grade comparison since no fifth grad-ers were included in the norm sample.
Placement Effects
Using the Piers-Harris scale, Colemanand Fults (1982) studied the global self-concept of fourth- through sixth-gradestudents enrolled in a gifted program andthe global self-concept of high achievingstudents who remained in regular classes.No significant effects for sex, grade, ortime period of testing (prior to enrollmentor after enrollment) were reported. Asurprising result was that gifted studentsenrolled in special programs had signif-icantly higher self-esteem than did thenorm sample but had a significantly lowerself-esteem than did high achievers inregular classes. When returned to regularclasses, the self-esteem scores of the giftedreturned to preplacement levels within 8months. This effect was especially signifi-cant in the area of academic self-esteem.The researchers hypothesized the differencewas due to the reference groups of eachpopulation. The researchers hypothesized
49
that the results reflected the influence ofthe reference groups of the gifted high-achieving students. Gifted students inspecial programs compared themselves togifted students, while high achievers inregular classes compared themselves to lessgifted peers. As a result, the gifted en-rolled in special programs had higher self-esteem but a more realistic perception oftheir ability than did those high achieversin regular classes. Chovan and Morrison(1984) reported similar results with stu-dents ages 9 through 12. Schneider (1987)observed that such findings would bepredicted on the basis of Bandura's (1977)social comparison theory.
In an attempt to clarify this relationshipbetween placement and self-esteem, Cole-man and Fu its (1985) assessed fourth-gradestudents before and after placement ingifted programs. They hypothesized thatthe children's self-esteem prior to place-ment would be higher than their self-es-teem after placement; and those "just eligi-ble," or borderline, would have a lowerself-esteem than those with higher IQs. Allgifted students in the study had high self-esteem. Preplacement self-esteem scoreswere higher than postplacement scores.High IQ gifted had higher self-esteemscores than lower IQ gifted, irrespective oftime of assessmenn. Before placement,scores of both groups were approximatelyequal; after placement, those with high IQshad significantly higher scores than thelower IQ group. The researchers hypothe-sized that high IQ students did not showsignificant changes after placement becausethey were superior to both referent groups(lower IQ gifted and non-gifted students);lower IQ gifted students reflected thechange in perception due to changes inreferent group. Again, evidence was found
50
to support the social comparison hypothe-sis.
In a related study, Chapman and Mc-Alpine (1987) completed a 2-year investi-gation of gifted and average-achievingchildren, grade 6, using the Student'sPerception of Ability Scale. The giftedgroup had significantly higher self-esteemthan the average group. The researchersfound no significant group or time effect,indicating relative stability over the 2-yearperiod in the self-perception of ability forboth groups. This may indicate that self-perception of ability becomes stable aspatterns of performance become stable;therefore, high levels of achievement donot necessarily produce increasingly highlevels of academic self-esteem. Since thegifted sample in this study was not enrolledin special programs, the stability of theirperce, tions of ability may be reflective ofthe stability of the reference group. Theresearchers suggest that a study of giftedchildren enrolled in special programs mayshow that the academic self-esteem ofthese students is lower than that of similarstudents enrolled in regular classes; theyalso conjectured that this lower self-esteemis due to the character of the referent groupfor the special classes.
In three recent studies, the Harter scale(Harter, 1979), the Perceived CompetenceScale for Children (Harter, 1982), or theSelf-Perception Profile for Children (Har-ter, 1985) were used. These studies high-light the influence of reference groups onthe gifted students' perception of theircognitive functioning. Chan (1988), usingthe original scale, compared three groupsof Australian children: (1) gifted children,grade 7, enrolled full-time in enrichmentclasses; (2) gifted children, grades 5, 6, and7, enrolled part-time in enrichment classes;
r"1

and (3) students enrolled in regular classes,grades 5, 6, and 7, in the same schools asthose students in the enrichment classeswere housed. The findings were similar tothose of Coleman and Fults (1982, 1985).Gifted students had higher perceived com-petence on cognitive and general self-worthscales, regardless of sex or type of pro-gram, than did the controls. Gifted stu-dents in full-time enrichment classes hadlower scores on cognitive and physicalscales than those enrolled in part-timeenrichment classes. The researcher notedthat in cognitive functioning the formergroup compared themselves exclusively tosimilarly able peers, thus developing amore realistic and accurate perception ofcognitive competence while experiencingadequate success to allow high perceptionsof general self-worth.
Similar results were reported by Li(1988) using the revised Harter scale. Thesubjects were gifted fourth and seventhgraders and non-gifted controls from urbanCanadian schools. The gifted group hadgenerally positive self-perception across thedomains with significant group effects inscholastic competence and behavior. Asignificant group effect was also found forathletic competence, in favor of the controlgroup. The gifted girls had significantlyhigher scholastic competence scores thaneither gifted boys or controls. This findingsupports that of Coleman and Fults (1982)
regarding the academic self-esteem ofgifted girls. The findings also supportthose of Chan (1988) in which the giftedgroup had significantly higher scholasticcompetence scores than did the controls.
The third study also used Canadianstudents, grades 5, 8, and 10 (Schneider,Clegg, Byrne, Ledingham, & Crombie,1989). The gifted students participated in
either self-contained gifted classes or regu-lar classes (integrated gifted); the controlgroup consisted of classmates of the inte-grated gifted. Some controls were matchedfor age, sex, and number of years inschool; others were randomly matched.The randomly matched sample was used tocomplete the statistical comparisons. At allthree grade levels, significant effects werenoted for scholastic competence, favoringthe integrated gifted over controls. Withregard to school placement of gifted (self-contained versus integrated), a significantdifference was found in grades 5 and 8where the integrated gifted had higherperceived scholastic competence scoresthan did self-contained gifted; while notsignificant at grade 10, a difference favoredthe integrated group. These results areconsistent with those of Coleman and Fults(1982, 1985), Chan (1988), and Li (1988).
Examination of current literature sup-ports the contention that scholastic compe-tence (i.e., academic self-esteem) is adistinguishing factor in the self-esteem ofgifted children. A related variable in theformation of scholastic competence is thereferent group. Initial studies found nodifference between gifted students in spe-cial programs and gifted students notplaced. Other studies found part-timespecial programs to be the most favorablefor the self-concept of gifted children. Sexdifferences do not occur consistently buttend to favor female gifted over non-giftedcontrols. The developmental issue has yetto be systematically addressed regardingnumber of years in special programs andages of the children. At present, littleresearch is available addressing the effectof systematic programming on the self-concept of the gifted.
The purpose of the present study was
51
5 3

to assess developmental and comparativeaspects of self-esteem with gifted children.Information is needed to describe the giftedand to address the effects of special pro-grams. Does part-time placement (enrich-rnent) of the gifted result in higher scholas-tic competence (Chan, 1988), and is itlikely to continue after several years ingifted programs; or is this effect temporary,with scholastic competence stablizing oreven declining with increasing number ofyears in special programs (Chapman &McAlpine, 1987)? Also, do findings byChan (1988), Li (1988), and Schneider etal. (1989) using Australian and Canadianchildren generalize to American children?The present study proposed to examinethese questions and to specifically addressthe following hypotheses: (1) gifted chil-dren will score significantly higher thantheir high-achieving peers on a globalmeasure of self-esteem; (2) gifted childrenwill score significantly higher on a globalmeasure of self-esteem with each succes-sive year that they are enrolled in a specialenrichment program; (3) gifted childrenwill score significantly higher than high-achieving children not eligible for specialprograms on a measure of academic self-esteem; (4) gifted children will score sig-nificantly higher than their high-achievingpeers on other areas of self-esteem; and (5)gender differences in self-esteem shouldfavor female gifted over non-gifted femalecontrols.
Method
Subjects
Subjects for this study were selectedfrom students in grades 3, 4, 5, and 6enrolled in three public elementary schools
52
in a small urban area. Two of the threeschools house grades K-4 and serve as"feeders" for the third school which con-tains grades 5 and 6. Students enrolled inthese schools were primarily from middleand upper middle income families.
Eligibility for participation first in-volved examination of second gradeachievement test results from the years1986 - 1989. All students defined as eligi-ble to participate met state criteria forgifted programs regarding scores on astandardized achievement test, the IowaTest of Basic Skills (ITBS). A student'sTotal Reading or Total Math must be at orabove the 90th percentile or the CompleteComposite at or above the 85th percentile.Participants were further delineated asgifted or non-gifted on the basis of Cogni-tive Ability Test scores from the samesecond-grade testing. Students scoring ator above the 96th percentile on two of thethree areas (Verbal, Nonverbal, or Quanti-tative) or at or above the 96th percentile byaveraging standard scores on two of thethree areas were eligible to participate inthe gifted program. Non-gifted studentswho became eligible for the gifted programafter grade 3 were considered ineligible forinclusion in the study.
Control subjects were defined as thosechildren who initially qualified on theachievement (ITBS) measure but failed toqualify on the aptitude test at the end ofsecond grade. Thus, they were selectedfrom grades 3, 4, and 5 from the sameschools and regular classes as their giftedpeers. They had nearly identical educa-tional experiences in terms of teachers,curriculum, and peers apart from the en-richment placement.
All gifted students in the study wereplaced in the gifted program at the begin-
53

ning of third grade. Therefore, the sixth-grade group participated for 4 years, thefifth-grade group for 3 years, the fourth-grade group for 2 years, and the third-gradegroup for 1 year. With few exceptions,students in both programs had been en-rolled in one of the K-4 schools and/or the5-6 school within this school system forthe duration of their education. Exactfigures reflecting participation in the studyare included in Tables 1 and 2. The giftedprogram was delivered on a resource basis.Students attended gifted classes 5 hours perweek. The remaining 25 hours per weekwere spent in a regular classroom with thecontrol group members as classmates.
Materials
The Self-Perception Profile for Chil-dren (Harter, 1985) was used to assess self-esteem. This scale yields scores on fivespecific subscales (Scholastic Competence,Social Acceptance, Athletic Competence,Physical Appearance, and Behavioral Con-duct). Also included is a separate scalemeasuring Global Self-Worth. This scale
is not a composite of the five subscales butis computed from responses to items notincluded on any other subscale. The totalscale is designed for use with children ages8 to 13, approximately grades 3 to 6 or 7.Reliabilities reported in the manual forvarious subscales range from .71 to .86.The reliability reported for the Global Self-Worth scale ranges from .78 to .84. Re-ported means are approximately 3.0 withstandard deviations falling between .50 and.85.
The total scale includes 36 items, sixitems per subscale, and is completed inapproximately 30 minutes. Items areworded in a structured alternative format inwhich either choice is perceived to beequally attractive. The author of the instru-ment granted permission to duplicate it foruse (Harter, 1985, p. 7).
Procedure
Permission from parents, teachers, andadministrators was obtained for each partic-ipant. Parents and teachers evidenced ahigh level of cooperation. Most permission
Table 1. Number of Subjects by Sex, Grade, and Program
Subjects
Grade
3 4 5 6
TotalG C G C G C G C
Male 15 15 9 15 14 17 11 12 108
Female 13 16 13 15 7 13 10 17 104
Total 28 22 30 21 30 21 21 29 212
Note. G = Gifted (N=92); C = Control (N=120)
53

Table 2. Mean Age for Gifted and Controls
Subjects
Grade
3 4 5 6
TotalG C G C G C G C
Male 9-3 9-4 10-1 10-4 11-2 11-3 12-2 12-4 10-9
Female 9-1 9-2 9-11 10-5 11-0 11-5 12-1 11-8 10-7
Total 9-2 9-3 10-0 10-4 11-1 11-4 12-2 12-0 10-8
Note. Mean Age Gifted (G) = 10-7; Controls (C) = 10-8
slips were returned within the 10-dayperiod established for collection; a total of320 students (80% return) had permissionto participate. Administration dates andlocations were established with buildingprincipals and communicated to the teach-ers involved.
The scale was administered to groupsof students, by grade, within a 1-weekperiod in May. Each administration fol-lowed standard procedures as outlined inthe Harter manual. Items were read aloudto third and fourth grades; fifth and sixthgraders worked at their own pace.
After protocols were scored, an averagewas determined on each of the six scales.Results were recorded by code number ongroup tally sheets. Since the number ofstudents in regular education and giftedprograms was disproportionate (2:1 insome grades), random selection of approxi-mately 30 regular education, high-achievingstudents in each grade was completed.Grade 6 consisted of only 29 high-achiev-ing, control students; random selection wasnot necessary for this grade.
54
Results
Data were examined using a 2 x 2 x 4ANOVA (Group Status x Gender x Gradein School). Significant main effects werefound on the Scholastic Competence sub-scale for program and grade as well as onthe Physical Appearance subscale forgrade. Complete results are shown inTables 3 and 4.
Scholastic Competence
Gifted students had significantly higherself-perceptions of their scholastic compe-tence than did the control group, F(1, 196)= 10.76, p<.01 (see Table 3). Grade wasalso significant, F(3, 196) = 4.97, p<.05.Subsequent one-way ANOVAs were com-pleted across grade levels for both instruc-tional groups. Significant differences wereobtained for grade within the control groupF(3, 119) = 3.88, p<.05. Both groupsrecorded high mean scholastic competencescores compared with scale norms. Thegifted group's mean scores remained high

Table 3. ANOVA Summary for Scholastic Competence Subscale
Source of Variation SS f MS F
Program 3.49 1 3.49 10.76"
Grade 4.84 3 1.61 4.97'
Gender 0.03 1 0.03 0.10
Program X Grade 0.50 3 0.17 0.52
Program X Gender 0.37 1 0.37 1.17
Grade X Gender 1.67 3 0.56 1.71
Program X Grade X Gender 0.30 3 0.10 0.31
Residual 63.55 196 0.32
Total 74.74 211
"LK .05, "LK .01
over the four grades (no significant differ-ence), while the control group's meanscores declined significantly over time.Post hoc comparisons using the Scheffetechnique indicated that the sixth-grade,high achieving, non-gifted students hadsignificantly lower scores on this subscalethan third, fourth, and fifth graders withinthe same group.
Physical Appearance
Main effects for grade were notedon the Physical Appearance subscale, F(3,196) = 7.35, p<.01 (see Table 4). Subse-quent onr-way ANOVAs completed acrossthe grades within both educational groupsindicated a significant difference for bothgroups; for gifted F(3, 88) = 2.71, p<.05,and non-gifted F(3, 116) = 4.63, p<.01.Post hoc comparisons using the Scheffetechnique showed significant differences
between grades 3 and 6 for the giftedgroup. Similar comparisons revealed sig-nificant differences between grades 4 and6 for the control group. A comparison ofgrades 3 and 4 with grades 5 and 6 wasalso significant for controls. For bothgroups, perception of competence on thePhysical Appearance sub-scale was signifi-cantly lower for students in grade 6.
Other Subsea les
No main effects were noted onSocial Acceptance, Athletic Competence,Behavioral Conduct, or Global Self-Worthwith regard to program or grade. Meanscores for both groups in all areas werewithin the 2.75 to 3.52 range. Most scoreswere near 3.0 (reported mean for the normgroup). Table A-1 provides a completelisting of mean scores for the six subscalesfor both groups and all grades.
55
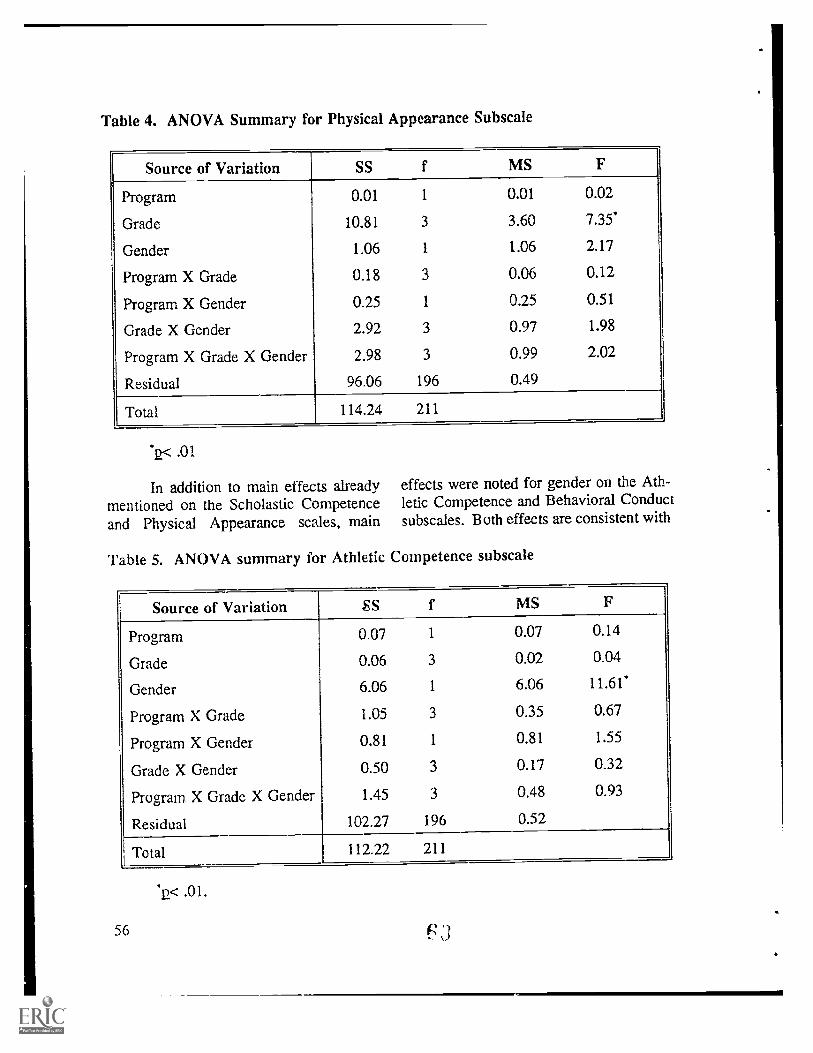
Table 4. ANOVA Summary for Physical Appearance Subscale
Source of Variation SS f MS F
Program 0.01 1 0.01 0.02
Grade 10.81 3 3.60 7.35'
Gender 1.06 1 1.06 2.17
Program X Grade 0.18 3 0.06 0.12
Program X Gender 0.25 1 0.25 0.51
Grade X Gender 2.92 3 0.97 1.98
Program X Grade X Gender 2.98 3 0.99 2.02
Residual 96.06 196 0.49
Total 114.24 211
2< .01
In addition to main effects already effects were noted for gender on the Ath-mentioned on the Scholastic Competence letic Competence and Behavioral Conduct
and Physical Appearance scales, main subscales. Both effects are consistent with
Table 5. ANOVA summary for Athletic Competence subscale
Source of Variation SS f MS F
Program 0.07 1 0.07 0.14
Grade 0.06 3 0.02 0.04
Gender 6.06 1 6.06 11.61'
Program X Grade 1.05 3 0.35 0.67
Program X Gender 0.81 1 0.81 1.55
Grade X Gender 0.50 3 0.17 0.32
Program. X Grade X Gender 1.45 3 0.48 0.93
Residual 102.27 196 0.52
Total 112.22 211
56
'p< .01.
3

Table 6. ANOVA Summary for Behavioral Conduct Subsea le
Source of Variation SS f MS F
Program 0.00 1 0.00 0.01
Grade 1.88 3 0.63 1.57
Gender 12.83 1 12.83 32.13'
Program X Grade 2.09 3 0.70 1.74
Program X Gender 0.06 1 0.06 0.14
Grade X Gender 1.30 3 0.43 1.04
Program X Grade X Gender 1.06 3 0.35 0.88
Residual 78.27 196 0.40
Total 97.79 211
.001
results of the norm samples in the manual.No main effects were noted on the SocialAcceptance or Global Self-Worth scales.With regard to Athletic Competence, malesconsistently rated themselves as morecompetent than females F(1, 196) = 11.61,p<.01 (see Table 5). On the BehavioralConduct subscale, females consistentlyrated themselves higher than males withoutregard to grade or program, F(1, 196) =32.13, p<.01 (see Table 6). No significantinteractions were noted in either analysis.A summary of ANOVA i=,sults by subscaleis included in Table A-2.
Discussion
This study hypothesized that giftedchildren and high achieving, non-giftedpeers (control group) would show a dif-ference with respect to self-esteem. TheGlobal Self-Worth subscale best charac-
terizes what is commonly termed globalself-esteem. No main effects by programwere noted on this subscale; thus, thehypothesis of a difference between the twogroups on global self-esteem was rejected.The mean scores on this scale ranged from3.10 to 3.38. The mean for the nationalsample of age-appropriate children reportedin the manual was 3.0; therefore; bothgroups in this study exhibited ratings with-in a standard deviation of the normativemean.
The second hypothesis stated therewould be a difference in the self-esteem ofgifted students as a result of the number ofyears in a special program, There were nomain effects for grade on the Global Self-Worth subscale for either group; this hy-pothesis, with regard to Global Self-Worth,was rejected.
The third hypothesis stated therewould be a difference in the academic self-
57

esteem of gifted children and high achiev-ing children not eligible for special pro-grams. Significant main effects were notedby program and grade with no significantinteraction on the Scholastic Competencesubscale. Gifted students' scores weresignificantly higher than those of the con-trols, and the scores remained high acrossthe grades. Control group means declinedacross grades with the sixth-grade meansignificantly lower than the third-, fourth-,and fifth-grade means. The hypothesis wassupported; students who participated inspecial programs appeared to have higherand more stable academic self-esteem thandid their high achieving, non-gifted peers.This difference appeared after the first yearof the program. Whether the program pro-duced such differences or whether theywere present prior to initial placement isindeterminate.
The fourth hypothesis stated that adifference was expected between the twogroups in other specific areas of self-es-teem. With the exception of the ScholasticCompetence subscale, as noted above, nosignificant difference existed between thetwo groups on any subscale. The giftedstudents appeared much like their highachieving, non-gifted peers. This findingappears intuitively valid since academicplacement constituted the unique differencebetween the two groups. Finally, withrespect to the gender difference hypothesis,males (irrespective of program) producedhigher self-esteem ratings on AthleticCompetence, while females (irrespective ofplacement) showed higher esteem on Be-havioral Conduct.
With regard to recent research usingthe Harter scales (Chan, 1988; Li, 1988;Schneider et al., 1989), results of this studysupported the finding that the gifted have
58
significantly higher Scholastic Competencescores than do the controls. Unlike theearlier studies, Global and Behavioralsubscales did not manifest main effects forprogram, nor was there a main effect forgender within the gifted sample. Thisdifference in Global and Behavioral sub-scale results may have resulted from differ-ences in control groups used in the variousstudies. Prior studies used grade peerswith heterogeneous achievement levels; thisstudy used gifted and control groups whoseachievement levels were homogeneous andwho shared the same teachers for the ma-jority of the school day. Scores of thesegroups were expected to be more similarthan those of groups with fewer commonal-ities. Unlike the Li (1988) study, thecurrent study found no gender differenceon the Scholastic Competence subscale forthe gifted or controls. The lower AthleticCompetence subscale scores for the giftedgroup, noted in the Li study, were likewisenot replicated. These differences i resultsmay have been due to either cultural differ-ences between the Canadian students usedin Li's study and the group used in thisstudy or perhaps due to other factors.
Other recent research (e.g., Chapman& McAlpine, 1987), using a variety ofinstruments, also found that the giftedsample had a higher global self-esteemthan did both the control and norm groups.Since few instruments isolate academicself-esteem, the global score is a compositeof the subscales (i.e., an amalgam ratherthan a separate scale); thus, the higher self-esteem may actually have resulted from thehigher academic self-esteem usually notedamong gifted individuals rather than aglobal difference between the gifted andcontrols. This effect may also have beenenhanced through use of a broader, more
65

heterogeneous control group. More vari-ance in self-concept scores would havebeen expected within such a group, perhapsresulting in lower group means comparedto the means from a more homogeneouscontrol group.
The current study supported Brack-en's (1980) results. In the former study,gifted and non-gifted age peers differedless in areas unrelated to academic success(e.g., athletic, social). In the present study,gifted children and their non-gifted, high-achieving peers differed only in the area ofscholastic competence, an area relatingdirectly to academic success. The currentstudy replicated Bracken's findings, despitethe use of a more stringent test using con-trols matched for achievement in the pres-ent study. Whether the difference in areasrelating to academic success was due toplacement in a gifted program, to a subtledifference related to intelligence, or toother factors is yet undetermined.
This study confirmed previous re-search in terms of the effect of identifica-tion and placement of the gifted on a spe-cific dimension of self-esteem, i.e., aca-demic, particularly where placement is ona part-time basis. The present investigationis particularly compelling since closelymatched high-achieving controls wereutilized. Selection and placement occurredearly in the educational careers of thegifted students and remained stable acrossthe remaining 3 year. Additionally, theglobal Self-Worth scale did not producesignificant comparisons for gifted versuscontrols by gender or grade. Previousreports of gender differences on self-esteemmeasures may have been influenced bybehavioral conduct and/or athletic compe-tence self-esteem factors contained, tovarious degrees, within diverse generic
self-esteem measures and/or by compari-sons between gifted and heterogeneouscontrols which had greater initial aptitudeand achievement differences. Differencesin control group selection and/or self-es-teem measures could also account for thefailure to find gender differences in aca-demic or global self-esteem. Such effectsmay be weak and result when heteroge-neous (lower ability) controls are used.Within the gifted group, gender differenceshave not been uniformally reported. Gen-der differences on the Behavioral Conductsubscale (females > males) and AthleticCompetence subscale (males > females)were expected for all students based onprevious findings.
Future research needs to addresswhether academic self-esteem is boosted asa result of selection for or academic experi-ence in the gifted placement. Self-esteemassessment prior to determination of giftedversus high-achievement status is a neces-sary additional procedure. The roles ofexpectancy and labeling may very wellcontinue to be paramount in a student'sacademic self-perception.
References
Bachman, J., & O'Malley, P. (1977).Self-esteem in young men: A longi-tudinal analysis of the impact ofeducational and occupational attain-ment. Journal of Personality andSocial Psychology, 35, 365-380.
Bandura, A. (1977). Social learning theoa. Englewood Cliffs, NJ: Prentice-Hall.
Bartell, N., & Reynolds, W. (1986).Depression and self-esteem in aca-
59

demically gifted and non-gifted chil-dren: A comparison study. Journalof School Psychology, 24, 55-61.
Biehler, R., & Snowman, J. (1986). Psychology applied to teaching (5thed.). Boston: Houghton Mifflin.
Bracken, B. (1980). Comparison of self-attitudes of gifted children and chil-dren in a non-gifted normativegroup. Psychological Reports, 47,715-718.
Bransky, T. (1987). Specific programinformation: A key to attitudesabout the gifted education program.Gifted Child Quarterly, 31(1), 20-24.
Brody, L., & Benbow, C. (1986). Socialand emotional adjustment of adoles-cents extremely talented in verbal ormathematical reasoning. Journal ofYouth and Adolescence, 15(1), 1-18.
Byrne, B. (1984). The general/academicself-concept nomological network:A review of construct validation re-search. Review of Educational Re-search, 54, 427-456.
Caslyn, R., & Kenny, D. (1977). Self-concept of ability and perceivedevaluation of others: Cause or effectof academic achievement? Journalof Educational Psychology, 69, 136-145.
Chan, L. (1988). The perceived compe-tence of intellectually talented stu-dents. Gifted Child Quarterly, 32(3),310-314.
Chapman, J., & McAlpine, D. (1987,April). Academic self-concept ofgifted and average achieving stu-dents: A two-year study. Paperpresented at annual meeting of theAmerican Educational ResearchAssociation, Washington, D. C.
60
Reston, VA: ERIC Clearinghouseon Handicapped and Gifted Chil-dren. (ERIC Document Reproduc-tion Service No. ED 286 300)
Chovan, W., & Morrison, E. (1984).Correlates of self-concept amongvariant children. Psychological Re-ports, 54, 536-538.
Colangelo, N., & Brower, P. (1987).Labeling gifted youngsters: Long-term impact on families. GiftedChild Quarterly, 31(2), 75-78.
Colangelo, N., & Kelly, K. (1983). Astudy of student, parent, and teacherattitudes toward gifted programs andstudents, Gifted Child Quarterly, 27,107-110.
Colangelo, N., Kelly, K., & Schrepfer, R.(1987). A comparison of gifted,general, and special learning needsstudents on academic and socialself-concept. Journal of Counselingand Development, 66, 73-77.
Coleman, J., & Fults, B. (1982). Self-concept and the gifted classroom:The role of social comparison. Gift-ed Child Quarterly, 26(3), 116-120.
Coleman, J., & Fulls, B. (1985). Specialclass placement, level of intelli-gence, and the self-concepts ofgifted children: A social comparisonperspective. Remedial and SpecialEducation, 6(1), 7-11.
Cornell, D. (1983). Gifted children: Theimpact of positive labeling on thefamily system. American Journal ofOrthopsychiatry, 53(2), 322-333.
Cramond, B., & Martin, C. (1987). Inser-vice and preservice teachers' atti-tudes toward the academically bril-liant. Gifted Child Quarterly, j(1),15-19.

Harter, S. (1979). Manual: PerceivedCompetence Scale for Children.Denver, CO: University of Denver.
Harter, S. (1982). The Perceived Compe-tence Scale for Children. Child De-velopment, 53, 87-97.
Harter, S. (1983). Developmental per-spectives on the self-system. In E.Hetherington (Ed.), Handbook ofchild psychology: Vol. 4 (4th Ed.,pp. 275-385). New York: JohnWiley.
Harter, S. (1985). Manual for the Self-Perception Profile for Children.Denver, CO: University of Denver.
Harter, S. (1989). Causes, correlates, andthe functional role of global self-worth: A life-span perspective. In J.Kalligian & R. Sternberg (Eds.),Perceptions of competence and in-competence across the life-span (pp.67-100). New Haven, CT: Yale Uni-versity Press.
Harter, S., & Connell, J. (1982). A cornparison of alternative models of therelationships between academicachievement and children's percep-tions of competence, control, andmotivational orientation. In J.Nicholls (Ed.), The development ofachievement-related cognitions andbehaviors. Greenwich, CT: J. A. I.Press.
Huryn, J. (1986). Giftedness as deviance:A test of interaction theories. Devi-ant Behavior, 7, 175-186.
Karnes, F., & Wherry, J. (1981). Self-concepts of gifted students as mea-sured by the Piers-Harris Children'sSelf-Concept Scale. PsychologicalReports, 49, 903-906.
r)J
Kelly, K., & Colangelo, N. (1984). Aca-demic and social self-concepts ofgifted, general, and special students.Exceptional Children, 50(6), 551-554.
Khatena, J. (1982). Educational psycholo-gy of the gifted. New York: JohnWiley & Sons.
Killian, J. (1981). Personality characteris-tics and attitudes of intellectuallygifted secondary students. Disserta-tion Abstracts International, 42,2060A. (University Microfilms No.81-22,024).
Lehman, E., & Erdwins, C. (1981). Thesocial and emotional adjustment ofyoung, intellectually-gifted children.Gifted Child Quarterly, 25(3), 134-137.
Li, A. (1988). Self-perception and moti-vational orientation in gifted chil-dren. Roeper Review, 10(3), 175-180.
Loeb, R., & Jay, G. (1987). Self-conceptin gifted children: Differential im-pact in boys and girls. Gifted ChildQuarterly, 31(1), 9-14.
Maddux, C., Scheibner, L., & Bass, J.(1982). Self-concept and social dis-tance in gifted children. GiftedChild Quarterly, 26(2), 77-81.
Maker, C. (1977). Providing programs forthe gifted handicapped. Reston, VA:Council for Exceptional Children.
Maker, C. (1982). Curriculum develop-ment for the gifted. Rockville, MD:Aspen Systems Corporation.
McDowell, J. (1984). Coping with socialand emotional factors through vari-ous strategies: Help for the giftedstudent. The Creative Child andAdult Quarterly, 9(1), 18-27.
61
Morris, S. (1987). Student teachers' atti-tudes toward gifted students. TheCreative Child and Adult Quarterly,12(2), 112-114.
Piaget, J. (1981). Intelligence and affec-tivity: Their relationship duringchild development. (T. Brown andC. Kaegi, Eds. and Trans.). PaloAlto, CA: Annual Reviews (Originalwork published 1954).
Ross, A., & Parker, M. (1980). Academicand social self-concepts of the aca-demically gifted. Exceptional Chil-dren, 47(2), 6-10.
Schneider, B. (1987). The gifted child inpeer group perspective. New York:Springer-Verlag.
Schneider, B., Clegg, M., Byrne, B.,Ledingham, J., & Crombie, G.(1989). Social relations of giftedchildren as a function of age andschool program. Journal of Educa-tional Psychology, 81(1), 48-56.
Whalen, S., & Csikszentmihalyi, M.(1989). A comparison of the self-image of talented teenagers within anormal adolescent population. Jour-nal of Youth and Adolescence,18(2), 131-146.
Zaffrann, R., & Colangelo, N. (1979).Counseling with gifted and talentedstudents. In J. Gowan, J. Khatena, &E. P. Torrance (Eds.), Educating theablest: A book of readings on theeducation of gifted children (pp.167-181). New York: F. E. PeacockPublishers, Inc.
62
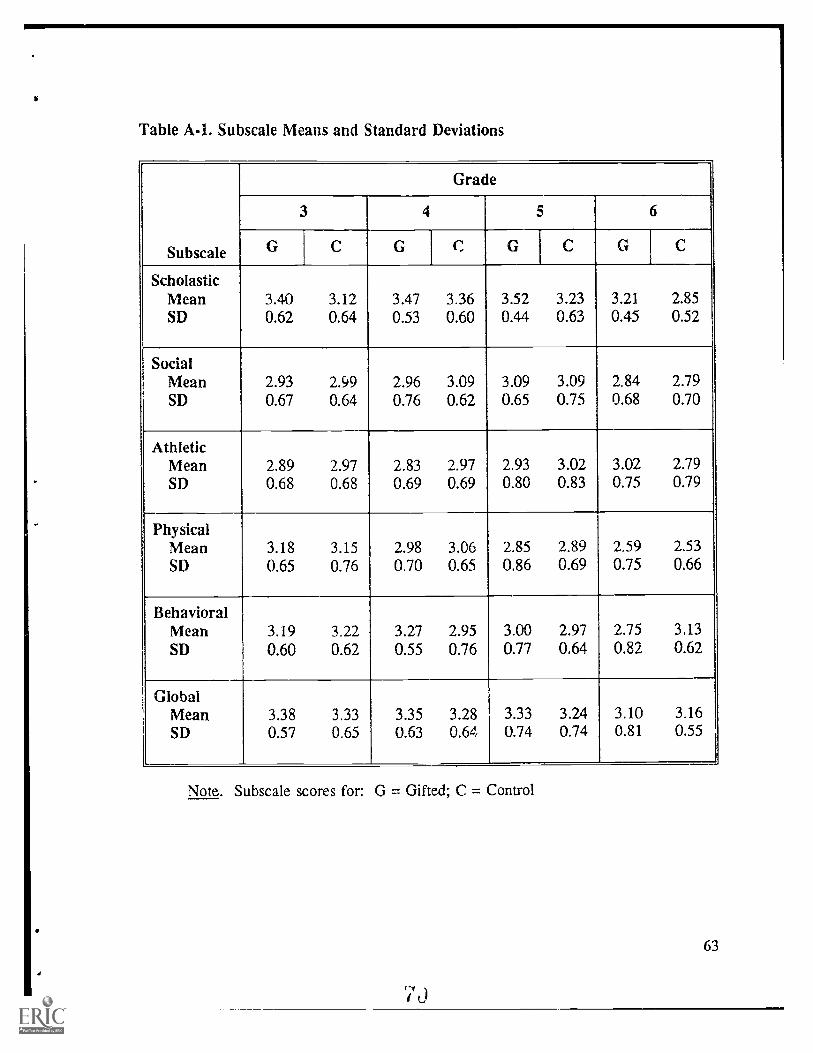
Table A-1. Subscale Means and Standard Deviations
Subscale
Grade
3 4 5 6
G C G CGCG C
ScholasticMean 3.40 3.12 3.47 3.36 3.52 3.23 3.21 2.85SD 0.62 0.64 0.53 0.60 0.44 0.63 0.45 0.52
SocialMean 2.93 2.99 2.96 3.09 3.09 3.09 2.84 2.79SD 0.67 0.64 0.76 0.62 0.65 0.75 0.68 0.70
AthleticMean 2.89 2.97 2.83 2.97 2.93 3.02 3.02 2.79SD 0.68 0.68 0.69 0.69 0.80 0.83 0.75 0.79
PhysicalMean 3.18 3.15 2.98 3.06 2.85 2.89 2.59 2.53SD 0.65 0.76 0.70 0.65 0.86 0.69 0.75 0.66
BehavioralMean 3.19 3.22 3.27 2.95 3.00 2.97 2.75 3.13SD 0.60 0.62 0.55 0.76 0.77 0.64 0.82 0.62
GlobalMean 3.38 3.33 3.35 3.28 3.33 3.24 3.10 3.16SD 0.57 0.65 0.63 0.64 0.74 0.74 0.81 0.55
Note. Subscale scores for: G = Gifted; C = Control
63
70
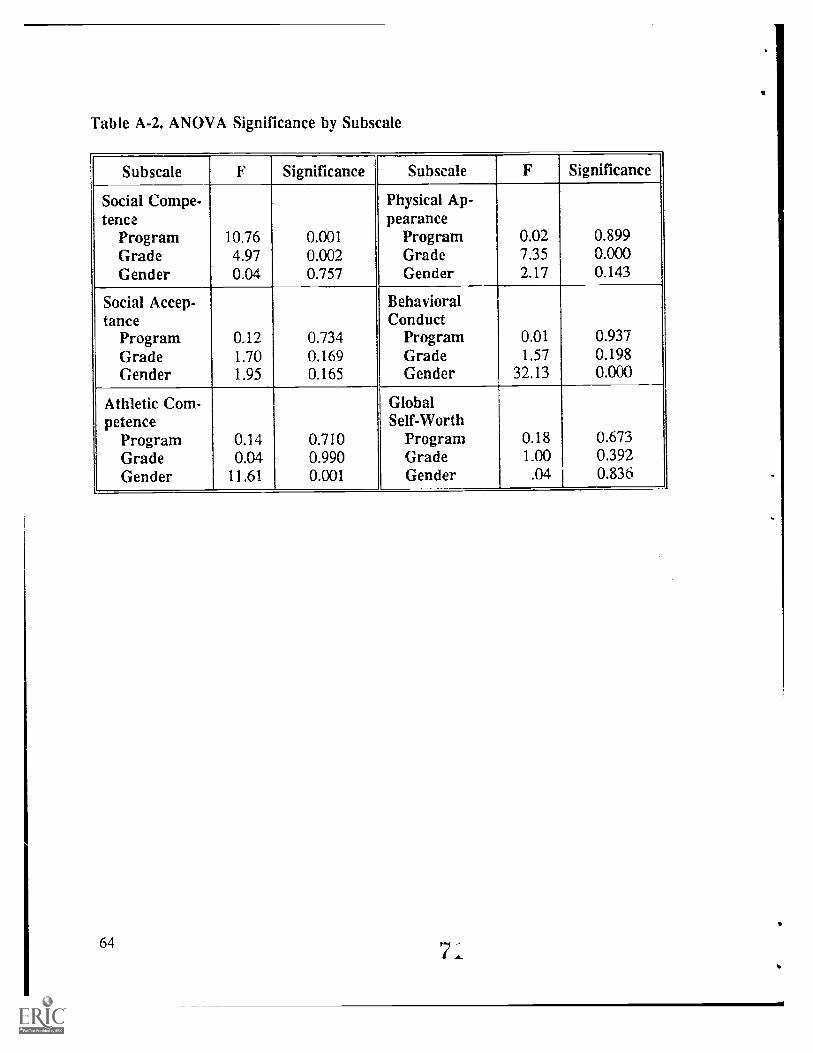
Table A-2. ANOVA Significance by Subscale
Subscale F Significance Subscale F Significance
Social Compe-tence
Physical Ap-pearance
Program 10.76 0.001 Program 0.02 0.899Grade 4.97 0.002 Grade 7.35 0.000Gender 0.04 0.757 Gender 2.17 0.143
Social Accep-tance
BehavioralConduct
Program 0.12 0.734 Program 0.01 0.937Grade 1.70 0.169 Grade 1.57 0.198Gender 1.95 0.165 Gender 32.13 0.000
Athletic Com-petence
GlobalSelf-Worth
Program 0.14 0.710 Program 0.18 0.673Grade 0.04 0.990 Grade 1.00 0.392Gender 11.61 0.001 Gender .04 0.836
64