
DOCUMENT RESUME AUTHOR Shipman, Vi. TITLE · DOCUMENT RESUME. Shipman, Vi. Disadvantag....
264
ED 068 522 AUTHOR TITLE INSTITUTIO'N SPONS AGENCY REPORT NO PUB DATE, NOTE DOCUMENT RESUME Shipman, Vi. Disadvantag Experiences. Strude.Ure at TM 001 883 ginia C.; And Others' . .,' d Children and Their First School . ETS-Head Start Longitudinal Study:, d Devefopment of Cognitive Competencies -and Styles. Prior to School Entry. . . Educational Testing Service, Princeton, N.J. Office of Child Developmgnt, (DHEW), Washington, ETS-PR-71-19 Dec 71 265p. EDRS PRICE MF-$0.65 HC-$9.87 DESCRIPTORS *Cognitive Development; *Data Collection; *Disadvantaged Youth; *Educational Experience; Evaluation Methods; Item Analysis; *Longitudinal Studies; Preschool Childrbn; Research Methodology IDENTIFIERS *Project Head Start - r,,. .ABSTRACT . In a continuing description of a Head Start longitudinal study, analyses are presented of the interrelationships among individual measures of the childls.performances prior to school. entry, accompanied by brief descriptions of the tasks and the, scores used. Despite the size and extensiveness of the data base, the findings are considered tentative until further data is colleCted on socio-cultural determinants,- 'developmental trends, and other interrelationships. This report describes the interrelationships among_ certain cognitive,-perceptual, and personal-social behaviors of the children, age 4, in the first year of the study as assessed by the initial':test battery., Chapters of the, report include characterisics-df the sample4,,methcdology, results and discussion, and conclusiOns. Structural analyses of he Year 1 child test data yielded 1) a general ability dimension information-processing skills), cutting across contents and operations sampled in the cognitive test battery', and 2) a stylistic response tempo dimension. Descriptions of each of the individual child measures are presented in the appendices, which comprise about half the report. (LH)
Transcript of DOCUMENT RESUME AUTHOR Shipman, Vi. TITLE · DOCUMENT RESUME. Shipman, Vi. Disadvantag....
ED 068 522
AUTHORTITLE
INSTITUTIO'NSPONS AGENCY
REPORT NOPUB DATE,NOTE
DOCUMENT RESUME
Shipman, Vi.DisadvantagExperiences.Strude.Ure at
TM 001 883
ginia C.; And Others' . .,'
d Children and Their First School .
ETS-Head Start Longitudinal Study:,d Devefopment of Cognitive Competencies
-and Styles. Prior to School Entry..
.
Educational Testing Service, Princeton, N.J.Office of Child Developmgnt, (DHEW), Washington,
ETS-PR-71-19Dec 71265p.
EDRS PRICE MF-$0.65 HC-$9.87DESCRIPTORS *Cognitive Development; *Data Collection;
*Disadvantaged Youth; *Educational Experience;Evaluation Methods; Item Analysis; *LongitudinalStudies; Preschool Childrbn; Research Methodology
IDENTIFIERS *Project Head Start
-r,,.
.ABSTRACT.In a continuing description of a Head Start
longitudinal study, analyses are presented of the interrelationshipsamong individual measures of the childls.performances prior to school.entry, accompanied by brief descriptions of the tasks and the, scoresused. Despite the size and extensiveness of the data base, thefindings are considered tentative until further data is colleCted onsocio-cultural determinants,- 'developmental trends, and otherinterrelationships. This report describes the interrelationshipsamong_ certain cognitive,-perceptual, and personal-social behaviors ofthe children, age 4, in the first year of the study as assessed bythe initial':test battery., Chapters of the, report includecharacterisics-df the sample4,,methcdology, results and discussion,and conclusiOns. Structural analyses of he Year 1 child test datayielded 1) a general ability dimension information-processingskills), cutting across contents and operations sampled in thecognitive test battery', and 2) a stylistic response tempo dimension.Descriptions of each of the individual child measures are presentedin the appendices, which comprise about half the report. (LH)
PR-71-19
DISADVANTAGED CHILDREN
AND FIRST SCHOOL EXPERIENCES
ETS-Head Start Longitudinal Study
Structure and Development-of Cognitive
Competencies and Styles Prior to School Entry
4
Virginia C. -Shipman
in collaboration withJohn BaroneAlbert BeatonWalter EffirnerichWilliam Ward
December 1971EDUCATIONAL TESTING SERVICEPRINCETON, NEW JERSEY
p.
6
DISADVANTAGED CHILDREN AND THEIR FIRST SCHOOL EXPERIENCES
-ETS-Head Start Longitudinal Study o.
. Structure and Development of Cognitive
Competencies and Styles Prior to School Entry
Virginia C. Shipman
Report under
Grant Number H-8256
Prepared for: Project Head StartOffice.of Child DevelOpmentU. S. Department of Health,',Education and. Welfare
December 1971
.
TABLE OF CONTENTS
Preface
e
Acknowledgments iii
Chapter
1. Introduction 1
2. Characteristics- of the Sample 6
3. Methodology 45
4.- Results. and Discussion 0 67
5. --Conclusions 106
Appendiceso71.
A. Statistical Proc2dures 119..
B. Task Descript.)ons 127
C. Supplementary Results 241
k D. Project.Personnel 249
Bibliography 253
P.
Preface
This is the sixth report describing the progress of the Longitudinal Study
conducted under Contract 0E0 4206 and Grants H -8256 and CG-8256. The first
report (PR-68-4) discussed theoretical considerations and measurement strategies
proposed for the study of disadvantaged children and their first school exper=
iences.. The second (PR-69-12) and third (PR-70=2) reports described 'operations
during the first two years of the study.. In 1969 mothers were interviewed qnd
children tested, prior .to their enrollment in Head Start or any other preschool
. program;- in 1969-70 these measures were:repeated and extensive observation of
'.those-children attending preschool programs in Portland, St. Louis. and Trenton
took place. In Lee County, where Head Snort is a kindergarten level program,
a brief version of the test battery was administered. The fourth report (PR-
70-20) gave a detailed description of the initial longitudinal sample in Port-
land, St. Louis and Trenton, prior to enrollment in-school. It was based on
the first analyses of 16 of the 33 instruments administered during 1969,
including a parent interview and medical examination designed to elicit infor-
mation about family and environmental characteristics; The fifth report (PR-.
71-20) dealt with the structure' and development of personal-social behaviors .,.
in preschool settings in Portland, St. Louis, and Trenton.
The present report continues the description of the initial sample, incor=
porating data from Lee County and what. is now known about the child"s enrollment
ein Head Start or other preschool programs. The major focus of this- report,
however, is to present the first analyses of the interrelation-,..ips among
individual measures of. the child's performances prior to school entry, accomp-'
anied by brief descriptions of the tasks and the scores used. Despite the size
ii
and extensiveness . of the data base, such, findings must nevertheless 'be
considered tentative; important clues . to interpretability await' the relating
of these data to socio-cultural determinante, developmentaerends, and t
interrelationships that may become increasingly apparent with measurements
in subsequent' years.
*-1
ACKNOWLEDGMENTS
This report,a'description of the initial child test findings, is the
product not only of the current, project staff (spe Appendix D) but also -.
of many other contributors at Educational Testing ServiceMand thcl study
Sites.
For. -hpr able leadership during .the difficult. early years of the pro-
ject, primary recognition is here acknoWledged Scarvia B. Anderson. Also,S
the guidance and direction given to the study by the initial Steering Com-
mittee, Samuel J. Messick (Chairman), ,Albert E. Beaton, Walter Emmerich,
Edmund W. Gordon, Winton H. ManningMarshall P. Smith, Silvan S. Tompkins,
and Melvin .Tumin is due special recogr\tion. Their !questiOns, ideas, and
\constructive criticisms 'contributed greatly to both the form and substance
01 the' study.
Special thanks are due the former Local Coordinators: Mrs. Lida
Campbell, Lee County, Alabama; Mrs. Verna Shepherd, Portland, Oregon:' Mr.
Ronald Greeley and,
Mr. Bobby Westbrooks, St. Louis, Missouri; and Mr. Con
rad McLean, Trenton,, New Jersey. All contributed knowledgt of their
communities and varied technical and administrative-skills that wer
invaluable for organizing and coordinating testing activities n the field.
I owe gratitude as well to the many testers, test center and playroomr.
supervisors, and drivers, without whose effortsdata could not have been
collected., Their hard work, enthusiasm, and-patiencemere a continuing
source of encouragement to those of us who knew the frustrations they. .
experienced working within a complex organizational st..ucture that was not
alWays geared.to their needs. In addition to the valuable program and field
iii
r.
61.
O
iv
coordination provided by''.Joseph Boyd and.Samuel Barnett, a large debt must be
acknowledged to the tester trainers: Anne .juSsis, Rosalea Courtney, Diran
Dermen, Martha Friendly, ,Karla Goldman, Sandra Landes, Jean Orost, Masako Tanaka,. , .
.:..
.
. .
Phyllis Ward, William Ward, and Patricia Warren, who spent many hours traveling
to and from the test centers. Without their'ability and willingness to function.
in a variety of roles, and most of all, without their patience and humor, the
study could not have progressed through its initial trying stages. Gratitude
must also be expressed for the monitoring and field consultation provided by
ETS.Regional Office staff:. Junius Davis (Tkoderick Ironside, Chandra Mehotra,
Daniel Norton, Santelia Knight, Robert LaMbert and George.Temp.
For measurement and analysis coordination during the initial year, parti7
cular thanks must go to John Barone-, Ruth Ekstrom, Richard J. Marta and Victor
Wichert; and thanks are due the women who painstakinglycOded.all the data
presented here udder the able supervision of Joan:Tyson. The continuing 'su)port
I V
provided by the ETS administration, particularly the administrative staff of
the Developmental Research. Division, has been especially impnrrAnt for the
study's progress.
The study has also benefited Featly from the constructive criticirti and
support provided by the Office of Child Development, particularly the Head -
Start Evaluation Research staff in-Washington and the Head Start Research
Advisory Committee. Appreciation for their counsel and understanding is here
expressed to Dr. Lois-ellin Datta, Mr. Richard Orton and Dr. Edward Ziiler of
the Offic.e of Child.Development, to Dr. John McDavid, former Director of ilead
Start Research and Evaluation, and to Dr. Urie Bronfenbrenner,-Dr. Boyd
McCandless, Dr. Alfred Yankauer and the late Dr. Edward.Suchman:
T
NI.
No report, of course, appears automatically on paper.. It, too, is
the product of many person's' efforts. I am grateful to Albert BeatOn for
his contribution to the detailed explanation and description, of the sample
4 .in ChaOter.2 and to John BarOne-for the description of his well-designed.
. .
date processing system in Chapter 3.. The following ETS research staff took.
major responsibility for describing and interpreting ,certain portions of
the data found in Appendix:. B. They are: .
Scarvia Anderson Peabody Picture Vocabulary Test-Preschool InventoryTAMA-
Anne Bussis ETS Matched Pictures. Language Comprehension. Task 1Seguin Form Board Test.
Edward Chittenden Enuteration ISpontaneous Numerical Correspondence
Diran Dermert Picture Completion (WPPSI)Preschoq.Embedded Figures Test
Walter Emmerich , Boy-Girl Identity Task
Carolyn Massad Children's Auditory Discrimination InventoryMassed Mimicry Test I
Masako Tanaka ETS Story Sequence; Part I
William Ward Matching. Familiar Figures. Test
Motor Inhibition TestOpen. Field Test
The writer also wishes to express appreciation. to William Meyer and
Irving Sigel of the External Advisory Committee for their aid in-interpreting
'ele test fin-dings: For providing the daily coordination with analysis,'
research,, and production staff, in addition to assistance with proofing and
editing, special thanks go to Susan Sitosko. Appreciation is also expressed
to Thelma Benton and June Daly for their care and speed :in typing the
-
v i
4.§.eVeral drafts and final copy. I am also grateful to Lynn.Gilbert,
'N . 4
David Lindstrom, James Towery, Thor'WynInyckyj for their ability and willing-.
ness to perform a variety of dehtanding functions.
Special gratitude goes to Walter. Emmerich, Robert Linn, and
William Ward for reviewing the various sections of the report, providing
thoughtful and "constructivecriticism throughout, and for their support and
counsel \throughout the study.\ o
. ,
Deepest gratitude, however, goes to the childien and their faTilies;- 0 ...
who praticipated in the study. We are grateful-for their belief in us and
in the purposes of the study.. This report discusses. the child test findings2P
from the first year of the study. To all thoge childfen who, while pointing-.
at.picCures; talking, lhughing, walking around the -room, turning pages,
putting blocks In holes, squirming,' were helping us to underst.ind the delight-.
fulcomplexity that is the young child', goour.deepest thanks. Together we-
YZI.;
hope to.-.provide insights that will bring about meaningful educational change.
Princeto.n, New Jersey .
December 31, 1971
1 '4
Virginia C. Shipman
1
INTRODUCTIONti
N., The Longitudinal Study of Disadvaritaged Children and Their First School. A
Experiences was initiated in the spring of 1967 as a cOo'peratfii.4,venture
of the Head Start Research OffiC.01(Office.of Economic Opportunity) and
Educational .Testing Service. The study brings together the concerns of the
psychologist; (:2;:iologist-, and educator,as-It'seeks'answrs to the questions:a
what are the aop.onents of early education that are assoCiatedwith the.
cognitive,' persunal, and social development of disadv,antaged children; what
are the.envloebnmental and background variables'that moderate these associa-
tions; and how do these moderators produce their: influence?
The specific age range Chosen for study wAs'th4 critical developmental
. span of approximately 4 through S years .of age--or from two. years' prior to-,
-.. . .
entr ce into the first -gtade throUh completion of third grade. This period
is thought to be partiCularly important because it Is a time during which
many abilities consolidate and the child makes-the social transition from
familiar home-surroundings to the world of. school, peers, and unfamiliar
adults. The first data were collected during the spring and summer of 1969
'on over'1,800 children, the majority falling between the ages of three'years
nine'mOnths.(3-9) and foUi years eight months (4-8). All were scheduled to
be enrolled in first grade imthe fall of'' 1971. Data collection on these
childTen,;and:tHeir families, communities and schools is planned to continue
through.sPrin.1974. Of par.ticular interest as the study progresses is.
,-.,. .3
.
identification of.differential groZth ;patterns thatay be associated.. -
.
,C f .'
., wilh'c-ertain characteristics of Head' Start and Follow ThroUgh programs apd',
..,
1
1.
their interaction with characteristics of the child and his family.
__The study population was identified and information was gathered prior
to'the-time when the target children were eligible to enter a,Head Startoprogram.
Decisions about sending or not sendi ng children to Head:Start or kindergarten
Were therefore made in the. ordinary way by ,the parents involved, after the.
. \
study was underway: Thus, given a lack of control in assigning children, to
"treatments" or programs, the prior informatiOn (baseline. dta) is used to1
assess the comparability of4childten receiving.differeril treatments:.
By following the same children over a number of years, one can alSo
-assess the comparability of beginnLng grade school experiences for both. Head9
Start and non-Head, Start youngsters- -e.g., the degree to which primau_ grade.
curricula are congruent with and Capitalizia on what the child- has learned. in
preschool. Finally, a longitUdinal design affords the opportuni:Ey.t6 sttAy-, . .
variables -which might be expected to have long term rather than short termea.
effects. Such a strategy has potential value for educational'and social
"Y
planning, theories of child development and. techniques okassess ing
young children and their environments. It offers the possibility
to:
a. Determine the cognitive., personal, social and physical characteristicsof "disadvantagedu'ehildren prior to any formal preschool experience,
.1. and to relate these characteristics to hoi and community variables;. .
b. Determine the differential characteristics of families that do anddO not sent their children to Head Start;
c. Identify the characteristics of preschool and primary grade pr fgramsin the'stbdy sites and to detertine the relationships among" thesecharacteristiCs within.and between the.educational levels involved;
. d. Determine the cognitive, social and personal outcomes in childrenthat seem to be associated with various aspects pf compensatorypreschool experience,.and to study the permanence of.sucheffectsthrough the first three primary grades;
).
"o
ri
e. Determine the relationship of Head Start-to family and communitycharacteristic's and attitudes;
f. .Relate particular charaCteristics of children and their grow\hpatterns to partidular.characteristics of families and educatlunal
programs;
g. Determine relationships among physical, personal,. social., andcognitive characteristics of children in each of the years of thestudy;
h.. Describe changes in the structures of cognitive abilities and -
personal-social characteristic-s of these children over the crucialdevelopmental period of the-study;
i. Develop much needed and, it is hoped, generally useful techniquesfor the assessment of some of the individual and environmentalcharacteristics under consideration.
The initial study report (ETS, PR-68-4) specified a wide variety of
measures that we felt would help us describe more adequately the complex inter-.
relationships and structure of children's abilities and characteristics over
time, and enable us to- tease out their interaction effects with particular
preschool and primary school programs. Selection of these measures followed
certain inherent assumptions about What we felt was necessary to accomplish
the goals of the study. Whenever possible, multiple sources of information
about a ,particular phenqmenon were proposed (e.g. verbal behavior was seen
as a function of the stimulus materials, the communird-r nica-commucant relation-
ship, and_the-purp-Use of.the act--to inform, seek help, express emotion).
We emphasized process rather than static variables, especially those process
variables involving parent -child and teacher-child interacticns, such as modes
of information-processing and reinforcement 39rategieS.- Implicit throughout
was our belief that only for the intermediate tumpose of structural analysis
and measure derivalioh within domains could/One separate coghitive-"puceptual.0.-
and social-personal domains .oi. study t4 child ithout taking his environment... ,,,..e*
, .
J2- .14
4
into account.
The present report describes the interrelationships among certain
cognitive, perceptual and personal-social behaviors of the children in the
first year of the study as assessed by the initial test battery. The
questions asked of the data were: To what extent are these indices of the
functioning Of the 4-year-old describable in terms of differential processes?
How do cognitive styles and competencies interact? Within the particular age
period represented, are differential results obtained by age, sex, social
status on'general ability level of the child, and /or by their interactions?
In addition to contributing to our understanding of the young child, answers
to such questions haye obvious implications for interpretation of 1---.:ticularDtest findings obtained in various assessment situations.
The report consists of five chapters,, of which this introduction is the
first. Chapter 2, Characteristics of the Sample, provides tables and
statistics which indicate Moth the composition the sample and the degree
to which we were successful in unconfounding its major independent variables.
Chapilt 3, Methodology, presents a brief discussion of how the data were
gathered as well as a statement about the methods of analysis (such as coding,
validity checks, computer procedures, etc.). Chapter 4, Results and Discussion,
presents the findings from the various Structural analyses of the test data,
including comparisons by major subject classifications. Chapter 5, Conclusions,
summarizes and discusses the general results of the analysis to date and
'presents a statement of,plans for furthef analysis. Brief deSCtiptions of
each of the individual child measures are presented in the appendices.
It must..be- emphasized, however, that the data presented here provide only
some beginning answers. to the questions to which the study is addressed. Further
C.
13.4
5
analyses are planned which, it is kkoped, will provide a more comprehensive
picture of the children in our sample and which will help delineate important
sociocultural determinants. As noted earlier,'the project's focus is on
interactions as well as main effects; moreover, the questions being asked
must be answered within a framework of repeated measures and observations of
411.
the same children (and their parents) over a period of time.
r
14
CHAPTER 2CHARACTERISTICS OF THE SAMPLE
Introduction
Chapter 2 describes the initial sample, the basis for selection of sites,
and certain demographic charaCteristics (i.e., parents' occupational and
educational level, race, and the study child's sex and later attendance in
Head Start or other preschool programs) that'emerged from the nonrandom selec-
tion of children and their families. We had anticipated disproportionate
numbers of children in the above categories because of the basic design of
the study. And though this disproportion is a necessary characteristic of
the sample, it does complicate interpretation of general means because the
groups defined through a simple classification on a single variable will not
have equal numbers of children in important related classifications. Thus,
a major purpose of this chapter is to point out some of the disproportionali-
ties in terms of single and multiple classifications and to caution the
reader against unwarranted interpretations of the results reported later in
Chapter 4.
The information is essentially. the same as reported earlier in Progress ,
Report 70-20, except that numbers, have been, updated on, the basis of the most'
recent information from-school retords, and preschool information for the Lee-.
County sample has been added.
Since the reader may_ find our necessarily detailed accounting-somewhat
burdensome, we have tried to lighten his labors by first presenting the following
summary of major findings:
_The attempt to gather data on children in the four selected sites was, in
general, successful. At least partial data were obtained for a total of 1875
children, 99.6% of the 1882 children originally expected from these four
7
commuiities (ETS, PR-68-4). However, the distribution of children from site to*
site was different from our expectati0PS, since we had expected St. Louis and
Trenton to be our large sites (and we were least successFul in enrolling subjects
there), but found more children than we had anticipated in Lee County and Portland
(and we were most successful in enrolling subjor....ts there). The other problems
were the slightly older ages at testing time of the St. Louis sample, because we
had extended their test-period (although the ages of the children are actually
in the appropriate rante) and the impossibility of collecting full data on all
subjects.
There are, of course, a number of disproportionalities in the various
classifications of'importance. There are almost one and three-quarters times as
many blacks as whites, more boys than girls, more children who did attend
preschool programs, and various interactional differences such as different propor-
tions of blacks and whites attending Head Start. These disproportionalities make
the interpretation Of general means quite difficult, for one must be concerned
that an apparent effect is not due to important differences among other variables
that are not cancelled out in computing a general mean. The sample, then, dictates
our caution in interpreting such measures.
Such differences in tht numbers of children in various classifications is
.a necessary part, in some ways a desirable part, of the type of design used in
the study. It would inevitably be impossible in such a study to identify and
select equal or proportional cell sizes because of the very large number of
classification variables; but even if the-number of classification variables
were to be kept small, the differential attrition over the life of the study would
still result in an unbalanced sample. As recompense for the disproportionality,
however, we have a measure, albeit crude, of the naturally occurring inter-
relationship among the classificatory variables at various sites.

8
The disproportionalities, in any case, do not prevent statistical esti-
mation.of effects that would be expected if the sample were proportional.
Disproportionality does affect the power of ,tests to reject alternate hypotheses,
but we feel this diminution is not of primary importance.0
Some of the salient facts about the sample are these:
1. The number of subjects at different sites varies, with Lee County
and Portland together constituting about 60% of the sample.
2. The sample is 62% black.
3. Boys make up 53% of the sample. For the four sites they make
.up 54.5% of the black sample and 50.5% of the white, sample.
4. For the three sites in which children had the opportunity to
attend Head Start in Year 2 of the study, 37.2% of the sample
attended Head"Start, 11% attended other preschool programs, and
51.8% had no known attendance in Head Start or other preschool
programs. In Lee County, where Head Start is a kindergarten
level program, 41.7% of the initial sample attended Head Start,
19.1% attended other preschool programs and 39.3% ha4 no known.
attendance in Head Start or other preschool programs.
r
5. Substantially more blacks than whites attended Head StStt. While
this varies by site, in the total sample only 5.1% of the child-
ren who attended Head Start are white.
6. The paren-ts of the whites are, generally, better educated than
the black parents, except in St. Louis where the reverse is true.
7. Although the fathers of both blacks and whites tend to be in
blue-collar positions,a disproportionately large number of blacks
are so classified.
9
8. Educational and occupational data were obtained for substantially
fewer fathers than mothers--the difference between the number of
\fathers and the number of mothers for whom data were obtained was
greater for blacks than for whites, and for children who attended
Head Start than for others.
The Selection of Sites
The sites were selected from areas where there is an opportunity for child-
ren to attend Head Start, and thus from areas with a substantial proportion of the
population below the poverty level. Considerations of cost and feasibility of
the study determined that four communities could participate, and these were
selected according to the following major criteria:
0 1. Program. To be considered, a school system had to serve
children who had an opportunity to attend a year-long Head Starr-
program. To increase the variety of preschool-Primary grade
experiences, we preferred school systems with Follow Through
programs and, tried for at least one without a kindergarten.
2. National spread. Urban-rural variation,tpopulation stability,.1
and representation from different sections of the country were
all considered vital criteria.
3. Sufficient number of students. A community was considered
eligible if it had a sufficient number of children in school and
in the Head Start program. We attempted to obtain a reasonable
racial mix and also took into account factors that might signi-
ficantly change the area's characteristics during the life of
Che study.
10
4. Opportunity -to follow. Bussing of children to schools outside
their home districts and high mobility reduced the chance of a
city being selected.
5. Cooperation. The study would, of course; be impossible without the
cooperation of the community, including its, school officials and
community leaders. Areas whose continued support was doubted
were disqualified.
As an added condition, we decided that one participating community should
be relatively near Princeton, thus making possible a close interaction be-
tween ETS staff and a local "site.
The selection procedure began by examining a list of the 30 school systems
having Follow Through programs at the time. The list was scrutinized care-,
fully in terms of the other criteria and several systems were selected for
further investigation. Members of the ETS staff visited the respective sites
for additional information,.including- avidence of willingness to engage in a
relatively long-term study. Since the Follow Through program was nonexistent-
in any Southern rural school system which met all our criteria, additional
lists of Southern comiunities.had\to be reviewed as Well. After an extensive' .
.
..-..,. .
period of information-gathering and the preparation of a list of eligible pairs
of cities to guide our selection, the following study sites were finally,chosen:
a. Lee County, Alabama. Lee County is mainly a Southern rural area.
There are two small cities, Auburn .and Opelika, within the county,
but outside the city limits the area is distinctly rural ar.d poor.
Auburn is dominated by its university which is a major employer in
that city. Opelika has a few small factories and serves as the
county seat. The population is approximately 33% black (0E0, 1970).
I
11
b. Portland, Oregon.* Portland is a medium-size city on the West Coast.
Its population is fairly stable, having risen from 373,000 in 1960
to 375,000 in 1970. About 6% are black.' Unlike the populations
of other large cities, Portland whites have not fled to suburbia.
The population is better educated than in many other parts of the
country, and poverty in Portland is not as intense as in our other
sites.
c. St. Louis, Missouri.** St. Louis is a central city, with declining
population -amid quickly growing subuibs. The city's population dropped
from 750,000 in 1960 to 607,000 in 1970. As the white population
moved out of the city, the non-white population increased from approx-,
imately 29% in 1960 to 43Y, in 1965; it is believed to be nearly 50%
in 1970. Largely industrial, the city is also a trading center.
d. Trenton, New Jersey.** Trenton is a small city on the Eastern sea-
board. The city's popul.ation dropped slightly from 114-000 in 1960
to 102,000 in 1970. The non-white population was estimated to be
35%-38%_of the total population in 1968. The-city is industrial
and also serves as the state capital.
Within these communities, elementary school districts with a substantial
proportion pf the population eligible for Head Start were selected for participation.
For the mot part, the schools in the target districts are located near Head Start
centers.' It is in these school districts that the Longitudinal Sample is expected
to be enrolled when they reach third grade in the fall of 1973. In each school
*The statistics reported are based on 1970 U. S. Bureau of Census figuressupplied by Opinion Research Corporation, Princeton, N. J.
**The statistics reported are based on 1970 U. S. Bureau of Census figuressupplied by local city officials.
,
12
district, an attempt was made to include all child en of approximately 3 1/2 to
4 1/2 years of age in the initial".testing and data collection of 1969, although
some children were excluded4from the sample; e.g., children from families speaking
a foreign language, and those with severe physical handicaps. The 1969 sample
was identified through a canvass of each neighborhood of the school districts
and an enumeration of the resident children.
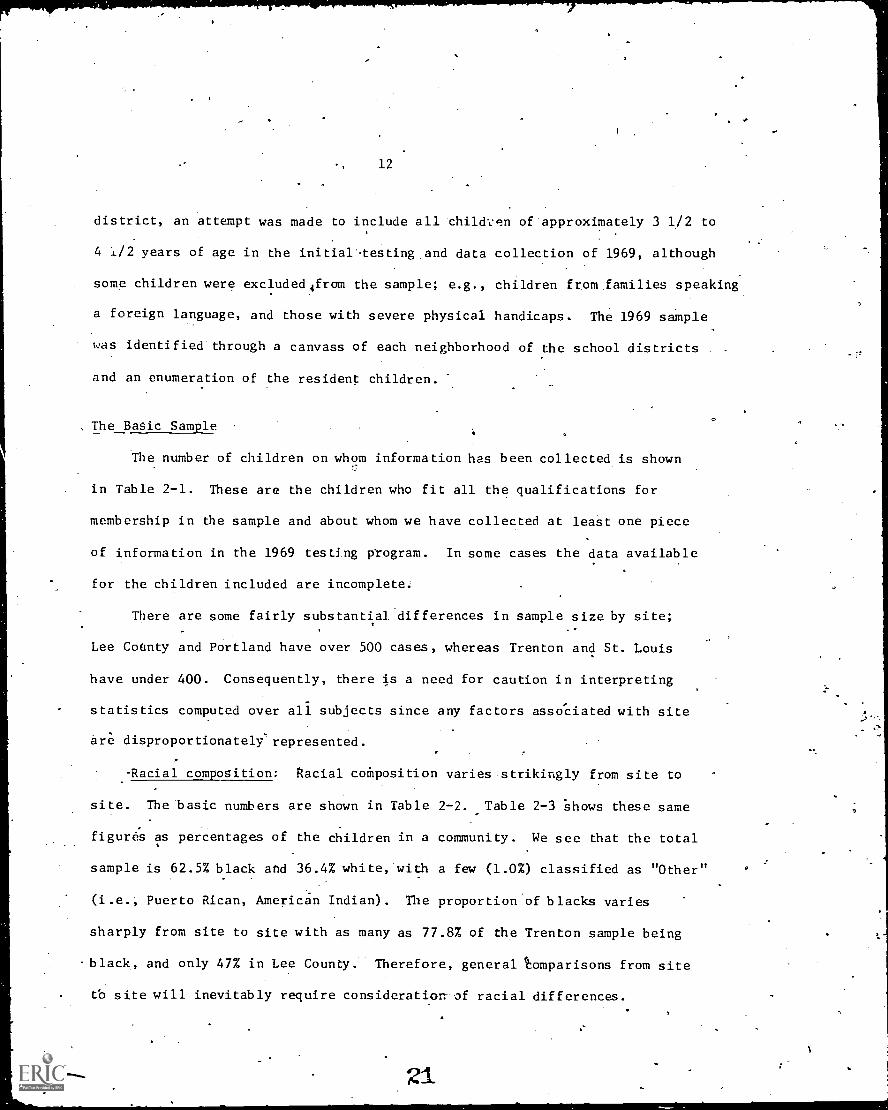
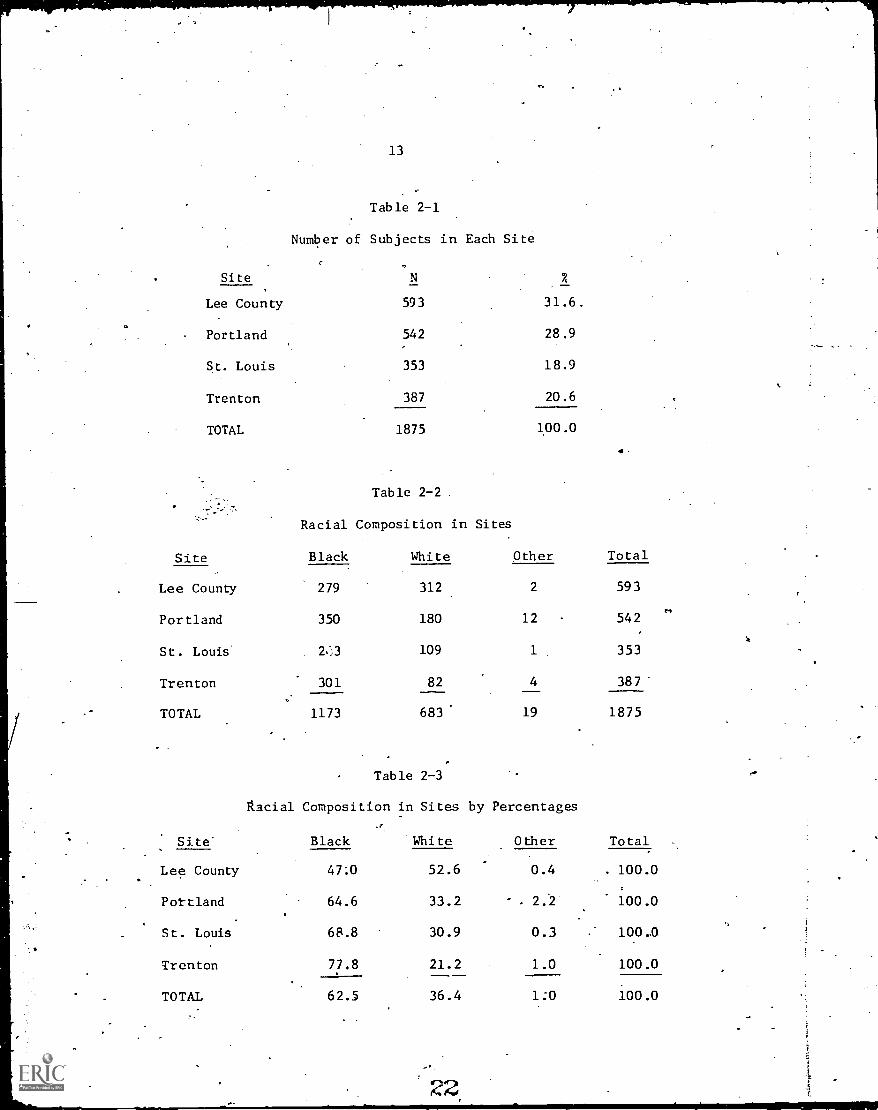
, The Basic Sample
The number of children on whom information has been collected is shown
in Table 2-1. These are the children who fit all the qualifications for
membership in the sample and about whom we have collected at least one piece
of information in the 1969 testing program. In some cases the data available
for the children included are incomplete.
There are some fairly substantial differences in sample size by site;
Lee County and Portland have over 500 cases, whereas Trenton and St. Louis
have under 400. Consequently, there is a need for caution in interpreting
statistics computed over all subjects since any factors associated with site
are disproportionately-represented.
Racial composition: Racial composition varies strikingly from site to
site. The basic numbers are shown in Table 2-2. Table 2-3 shows these same
figures as percentages of the children in a community. We see that the total
sample is 62.5% black and 36.4% white, with a few (1.0%) classified as "Other"
(i.e., Puerto Rican, American Indian). The proportion of blacks varies
sharply from site to site with as many as 77.8% of the Trenton sample being
-black, and only 47% in Lee County. Therefore, general Comparisons from site
tb site will inevitably require consideration- of racial differences.
21
13
Table 2-1
Site
Number of Subjects in Each Site
N
Lee County 593 31.6.
Portland 542 28.9
St. Louis 353 18.9
Trenton 387 20.6
TOTAL 1875 100.0
Table 2-2
Racial Composition in Sites
Site Black White Other Total
Lee County 279 312 2 593
Portland 350 180 12 542
St. Louis 2.3 109 1 353
Trenton 301 82 4 387'
TOTAL 1173 683. 19 1875
Table 2-3
Racial Composition in Sites by Percentages
.r
Site Black White Other Total
Lee County 47:0 52.6 0.4 . 100.0
Portland 64.6 33.2 . 2.2 100.0
St. Louis 68.8 30.9 0.3 100.0
Trenton 77.8 21.2 1.0 100.0
TOTAL 62.5 36.4 1:0 100.0
14
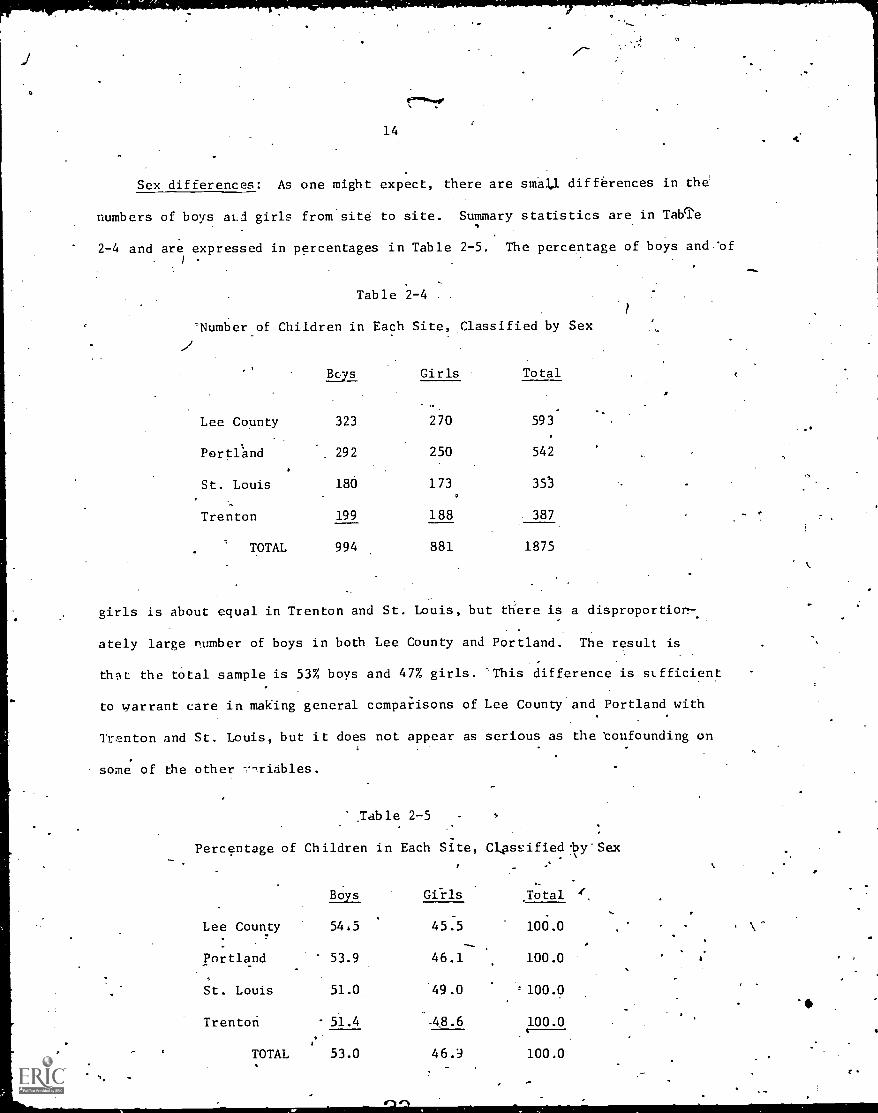
Sex differences: As one might expect, there are small differences in the
numbers of boys aLl girls from site to site. Summary statistics are in Table
2-4 and are expressed in percentages in Table 2-5. The percentage of boys and "ofI
Table 2-4
-Number of Children in Each Site, Classified by Sex
Boys Girls Total
Lee County 323 270 593
Pertfand 292 250 542
St. Louis 180 173 35
Trenton 199 188 387
TOTAL 994 881 1875
girls is about equal in Trenton and St. Louis, but there is a disproportion-
ately large number of boys in both Lee County and Portland. The result is
thilt the total sample is 53% boys and 47% girls. This difference is sLfficient
to warrant care in making general comparisons of Lee County and Portland with
Trenton and St. Louis, but it does not appear as serious as the toufounding on
some of the other 1.1riables.
Table 2-5
Percentage of Children in Each Site, apsEified.by-Sex
Boys Girls ,
Lee County 54,5 45.5
.Total
100.0
Portland 53.9 46.1 100.0
St. Louis 51.0 49.0 ' 100.0
Trenton 51.4 -48.6 100.0
TOTAL 53.0 46.9 100.0
0
15
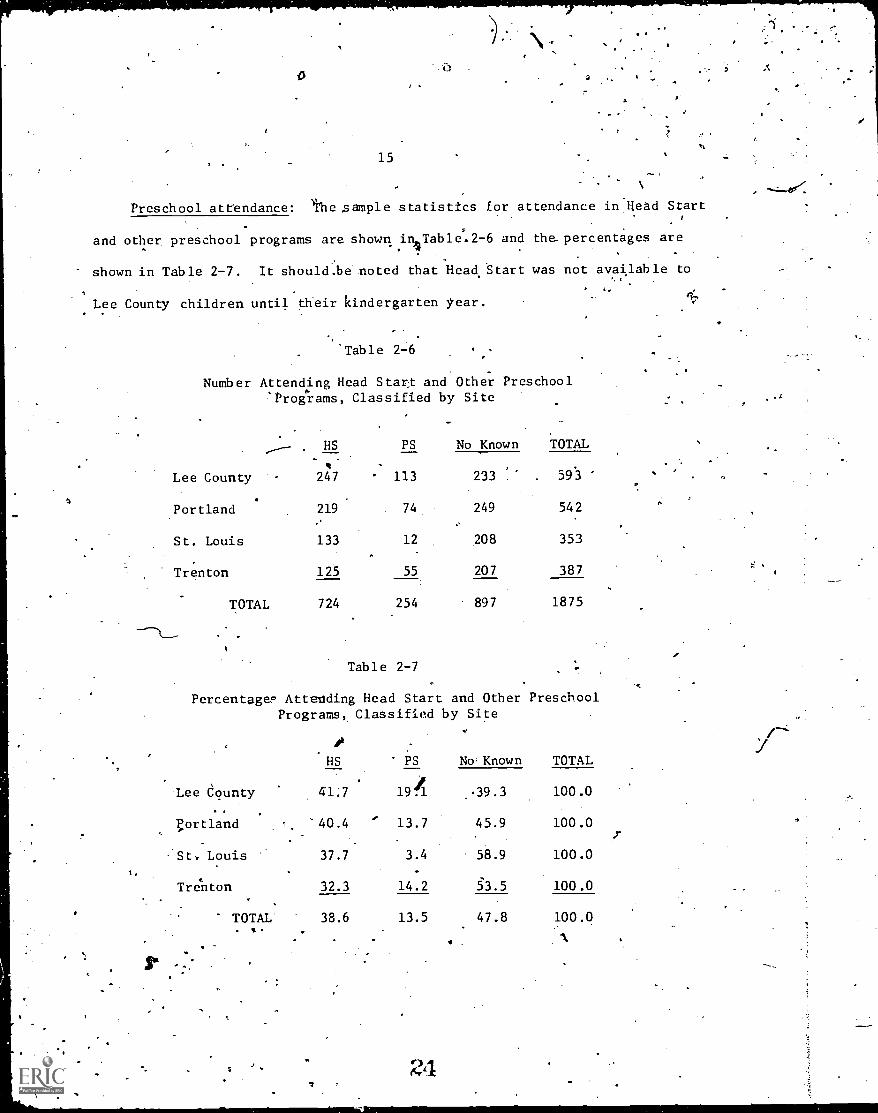
Preschool attendance: he sample statistics for attendance in Bead Start
and other preschool programs are shown iniTable. 2-6 and the percentages are
shown in Table 2-7. It should.be noted that Head Start was not available to
Lee County children until their kindergarten year.. .
'Table 2-6
Number Attending Head Start and Other Preschool'Programs, Classified by Site
. HS PS No Known TOTAL
Lee County 247 113 233 :' 593
.
Portland 219 74 249 542
St. Louis 133 12 208 353
Trenton 125 55 207 387
TOTAL 724 254 897 1875
Table 2-7
Percentages Attending Head Start and Other PreschoolPrograms, Classified by Site
1HS PS No Known TOTAL
`Lee bounty 41:7 194 .39.3 100.0
Portland '40.4 13.7 45.9 100.0;
''St. Louis 37.7 3.4 58.9 100.01,
Trenton 32.3 14.2 53.5 100.0
TOTAL 38.6 13.5 47.8 100.0
r
16.
The children are divided into three groups. The first.group consists of
. -
children who attended Head Start during 1969-7Q in Portland, Trenton, and
St, Louis and during 1970-71 in Lee County. Information was taken ;from Head
Start registers in the communities, and .the number given is the minimum' number
of Head Start children. The seco) group, other-preschool (PS), consists of.
children who are known to have attended other preschool or nursery programs
during .1969-70 in Portland, Trenton, and St. Louis and during 1970-711
in
Lee County, so this too is a minimum number. Children who were not on Head.
Start or other preschool lists are ink. the "no known" . category; it is likely
that many of these children ,attended neither Head Start nor other preschool
programs, but this category also includes children who may have moved out of
the community and were enrolled in Head Start elsewhere or those who were
enrolled in Head Start out of the general area. As the children in the "no
known" category are followed up, they may be reassigned to the Head Start or
other preschool categories.
Across the three urban sites 38.6% of the children' attended Head Start
In Lee County 41.7% attended'Head Start. However, we note thlOt the number
2of children in the Head Start category at the individual site runs fronl 32.3%
to 41.7% and the number in the preschool category runs from 3.4% to 14.2%:
As indicated later, there are substantial interactions between race and Head
Start attendance which vary from site to site; this may, perhaps, make Head
Start children incomparable to other children at the different sites.
Cross-Classification by Major Variables 4The following section contains tables displaying all cross-classifications
of the major variables: site, race, sex, and Head Start attendance for
Portland, St. Louis, Trenton, and Lee County.
25
4
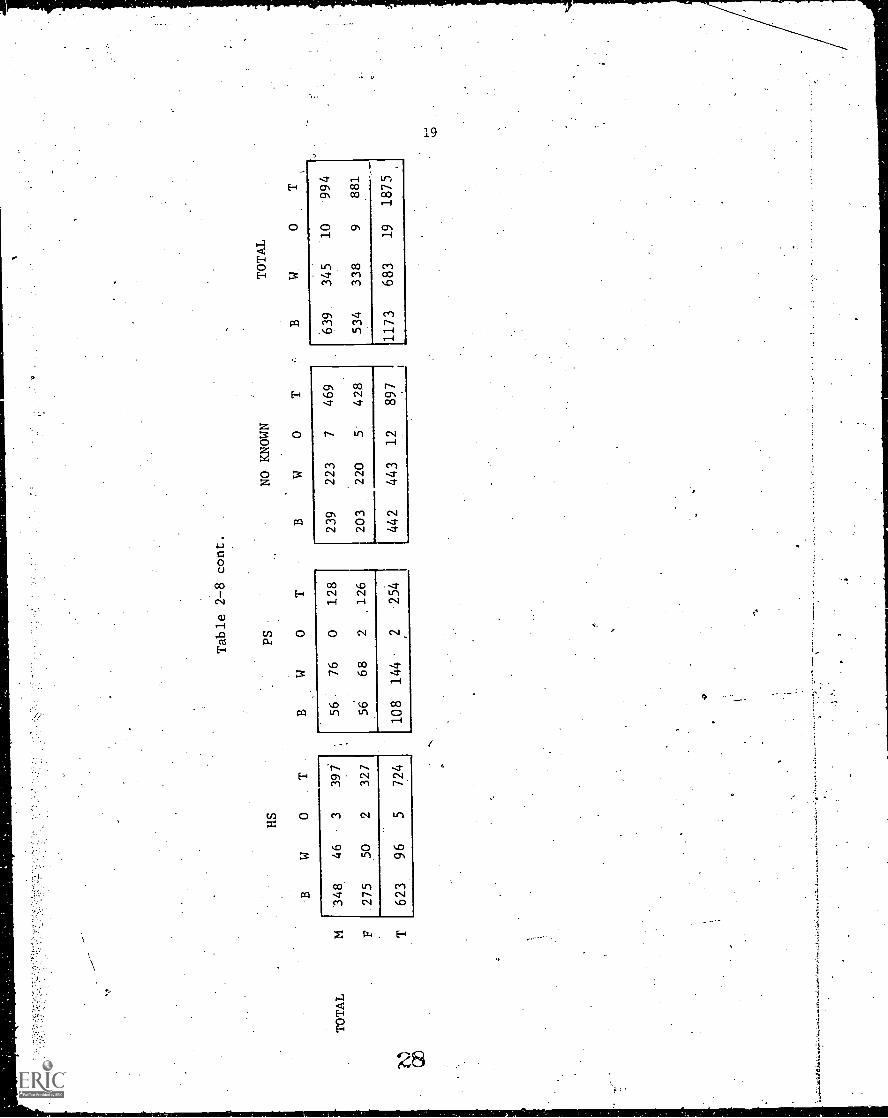
a Complete cross-classification: table 2-8 contains a complete c.ross7--11
.classificttion by the 41rrmajor variables. Although there are a substantial
number of void cells, there are none in the areas of particular. interest.
.'d cells occur only in the cells representing "other preschool programs"
and in the "'other" racial category, It is 'therefore Possible to estimate a
mean.value for each cell of black or white children by` Head Start or by known
ea-
preschool program for any measured variable, although the means for the- largest
cell (Lee County's .black males in the. Head Start category) will be ,much better
eatimated than for- the smallest cells (e.g., St. Louis's one white female and
Lee County's one black male in the Preschool catego
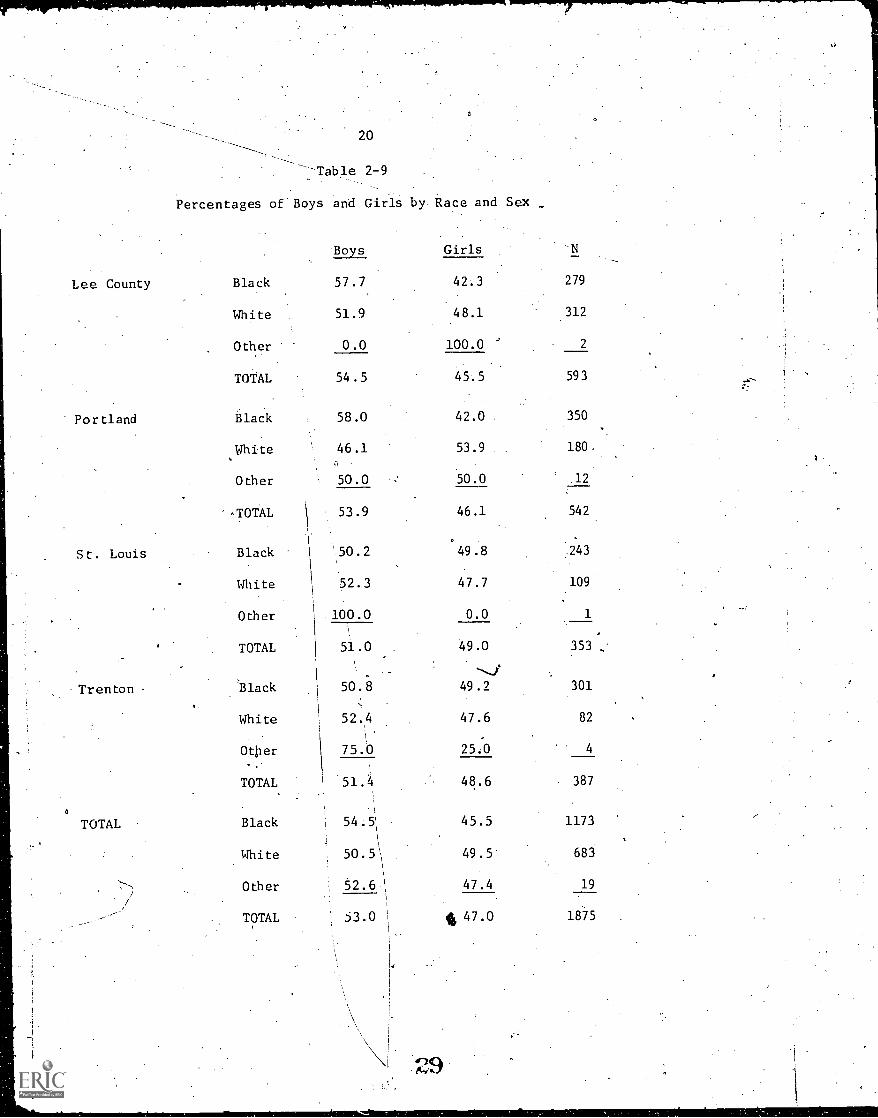
Race.by sex classification: Since there are often ifferences in per-
formance level of boys and, girls, we. now ask whethe'r there is the same per-
. -
centageo of black 'boys as white boys and black 'girls as white girls. The
percentages are shown in Table 2:-9. , :.
.
Overall', the boys are a substantial majority in the black sample and a.
slight majority in the white. This relationship, is not consistent over sites.
In Trenton, the proportion of boys is slightly over 50% for both black and
white; in portland, a large percentage (58%) of the blacks are boys, whereas
only .46.1% of the whites are boys; in S.t. Lotiis the sample of blacks is about
50% male, ,whereas the white sample is 52.3% male. In Lee County the pro-
portion of boys is over 50% for both black and white. These differences °again
dictate caution in interpreting general means, for otherwise Portland
wouldhave a special advantage on variablet where white girls excelled.
The "other" race category varies widely,,, but the c611 sizes are too
'small to intexpret.
A;
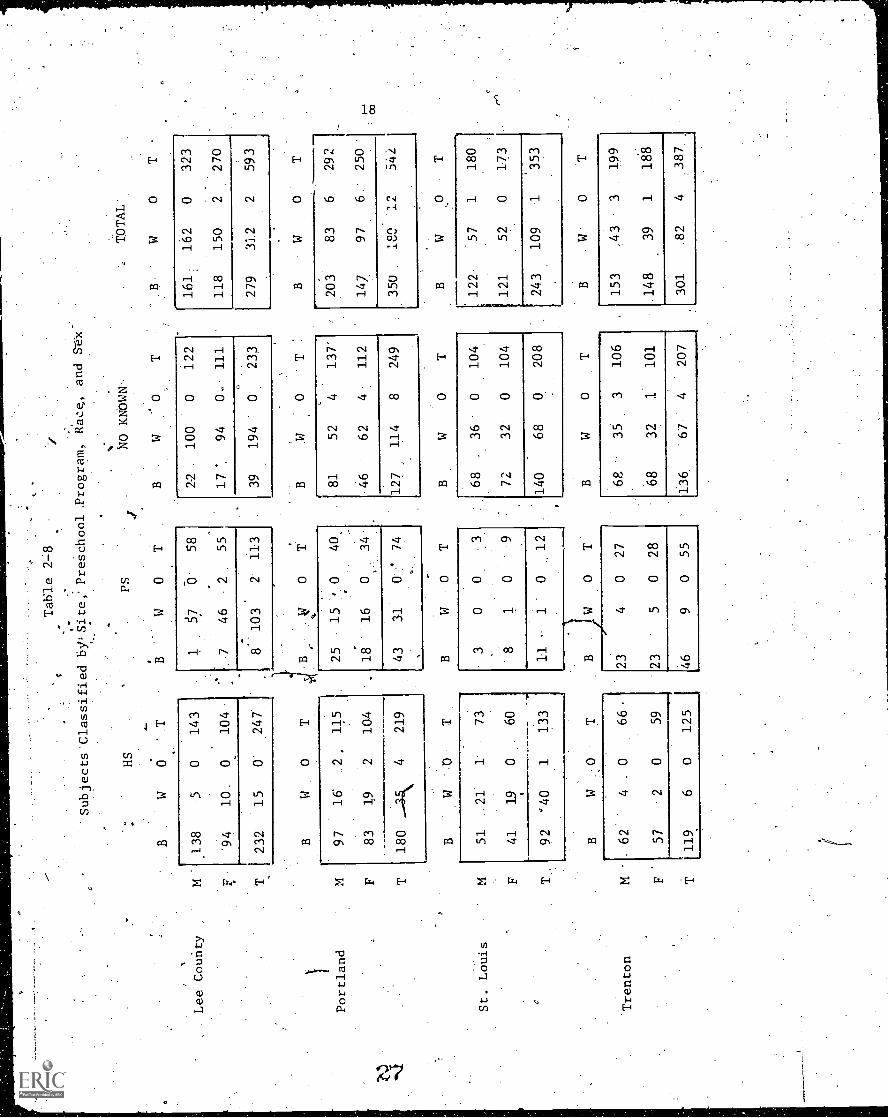
Table 2 -8
Subjects Classified BY' Site,'
Preschool .Program, kacg, and S--e-5c"
B.
W
HS
6T
Lee County
M138
-5
0143
F .
'94
10 .
0104
T232
15
0'
247
BW
0T
Portland
M97
16'
2,
115
F83
19
2104
T180
4219
BW
St. Louis
51
21
173
F41
19
060
92
"40
1133
BT
PS
W0
T 58
746
55
8103
2113
0
25
15
1816
040,
034
43
31
74
W0
T
'Trenton
M62
4_
066
23
4
F57
20
59
23
5
T119
60
125
46
9
0T
027
028
055
NO KNOWN-
TOTAL '
W0
2-2
17
'
100
94
0
122
111
39
194
233
W0
T
81
46
52
62
4
137'
112
127
114
8249
T
68 72
36
32
0 0
104
104
140
68
0208
BW
0
6P,
68
35
32
3 1.
106
101
136.
67
4207
"
.B
W0
T
161.
162
0323
118
150
2270
279
312
2593
203
83
6292
1147
97
6250
350
-ton
1n
a. t
342
BW
T
122
57
1180
121
52
0173
243
109
1353
1
W0
153
43
199
.148
39
1188
301
82
4387
re,
Tab
le 2
-8 c
ont.
HS
PSN
O K
NO
WN
BW
0B
W0
TB
W0
T
TO
TA
L34
846
339
i56
760
128
239
223
746
9
F27
550
232
156
682
126
203
220
542
8
T62
396
572
410
814
42
254
ti
442
443
1289
7
639
534
1173
TO
TA
L
0T
345
1099
4
338
988
1
683
1918
75
%.0
Lee County
Portland
St. Louis
Trenton
4
TOTAL
20
Table 2-9
Percentages ofBoys and Girls by-Race and Sex
Boys Girls N
Black 57.7 42.3 279
White 51.9 48.1 312
Other 0.0 100.0 ' 2
TOTAL 54.5 45.5 593
Black. 58.0 42.0 350
White 46.1 53.9 180.
Other 50.0 50.0 12
'.TOTAL 53.9 46.1 542
Black 50.2 49.8 .243
White 52.3 47.7 109
Other 100.0 0.0 1
TOTAL 51.0 49.0 353
'Black 50.8 49.2 301
White 52.4 47.6 82
Ottler 75.0 25:0 4
..
TOTAL, 51.4 48.6 387
Black 54.5' 45.5 1173
White 50.5\ 49.5 683
Other 52.6 \ 47.4 19
\
TOTAL 53.0 \ * 47.0 1875
,
-
21
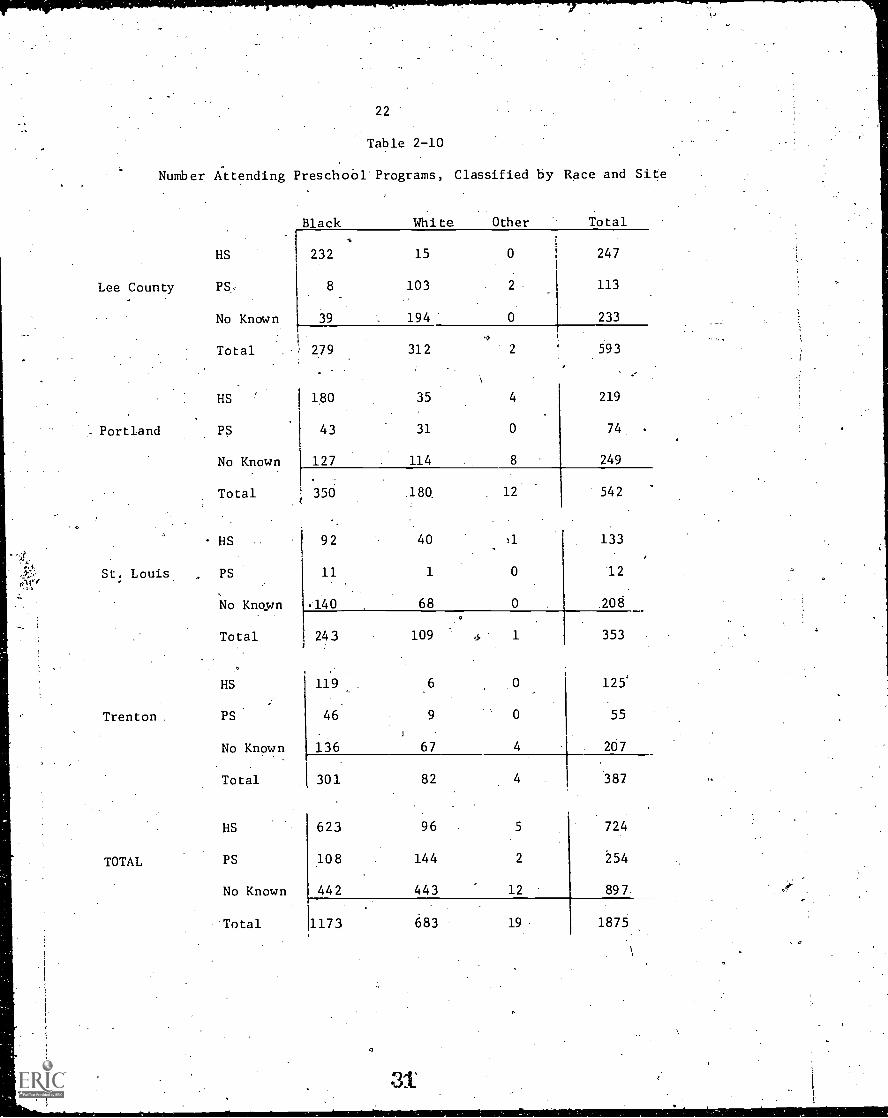
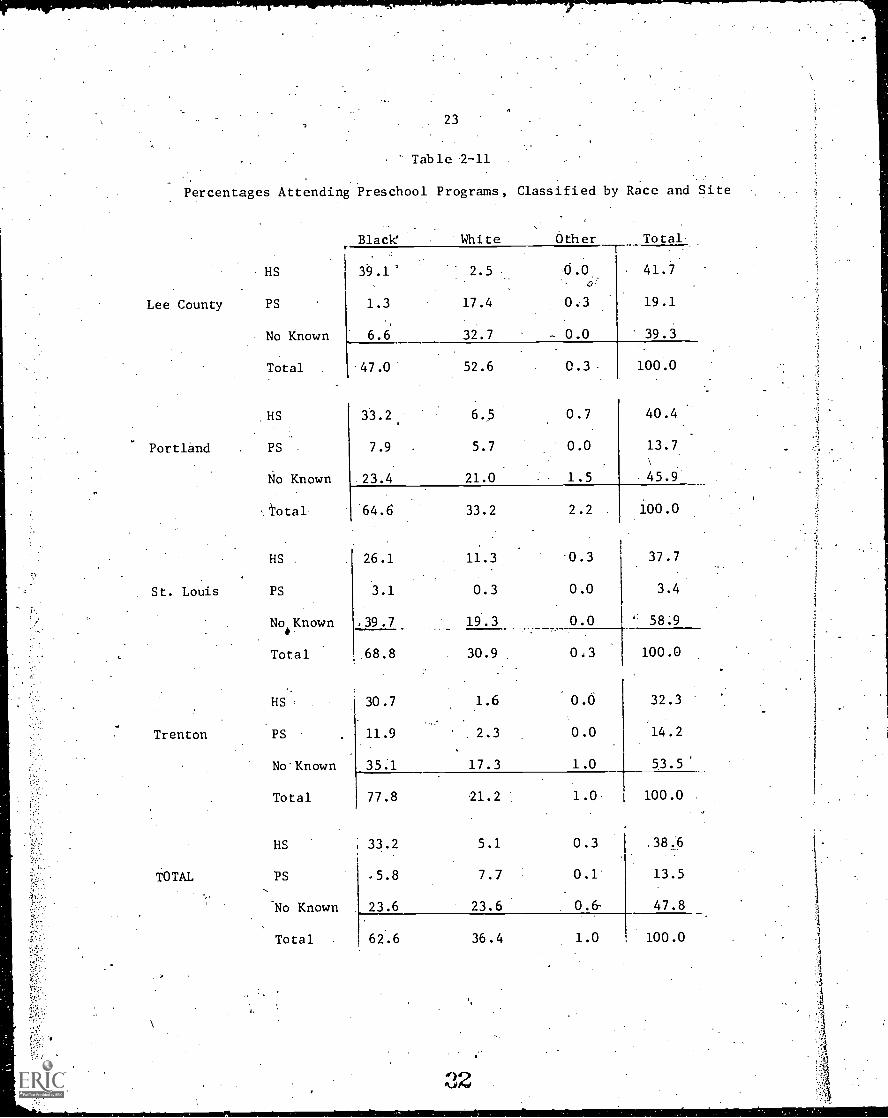
Race by preschool attendance classification: Table 2-10 presents the
basic statistics, classified by race, for dhe number of children who attended
Head Start or other preschool programs or were not known to have attended a
preschool program. The information is separated by site. Table 2-11 contains
the information in percentage form.
We first note that there are 96 whi.te children who attended Head Start.
This is.about 5% of the total sample or about 14% of the whites in the
sample. On the other hand, a much larger percentage '(53%) of blacks in the
sample attended Head Start. This racial difference is .especialll.' marked in
0
Lee County and in Trenton where only fifteen out of 312 and six of 82 whites
attended Head Start. Thus, we must 'consider Head Start in Lee County and
Trenton essentially a black program. In Portland and in St. Louis there are,
respectively, 35 and 40 white children in Head Start. This sample is substantial
enough to work with for some purposes 'in both sites; it is a relatively large
proportion-in St. Louis and relatively close to what would beexpected from
All in all, it is necessary to be very careful in making overall comparisons
;
of Head Start children with non-Head Start children, siwe race isi dispropor-
tionately represented among these groupings.
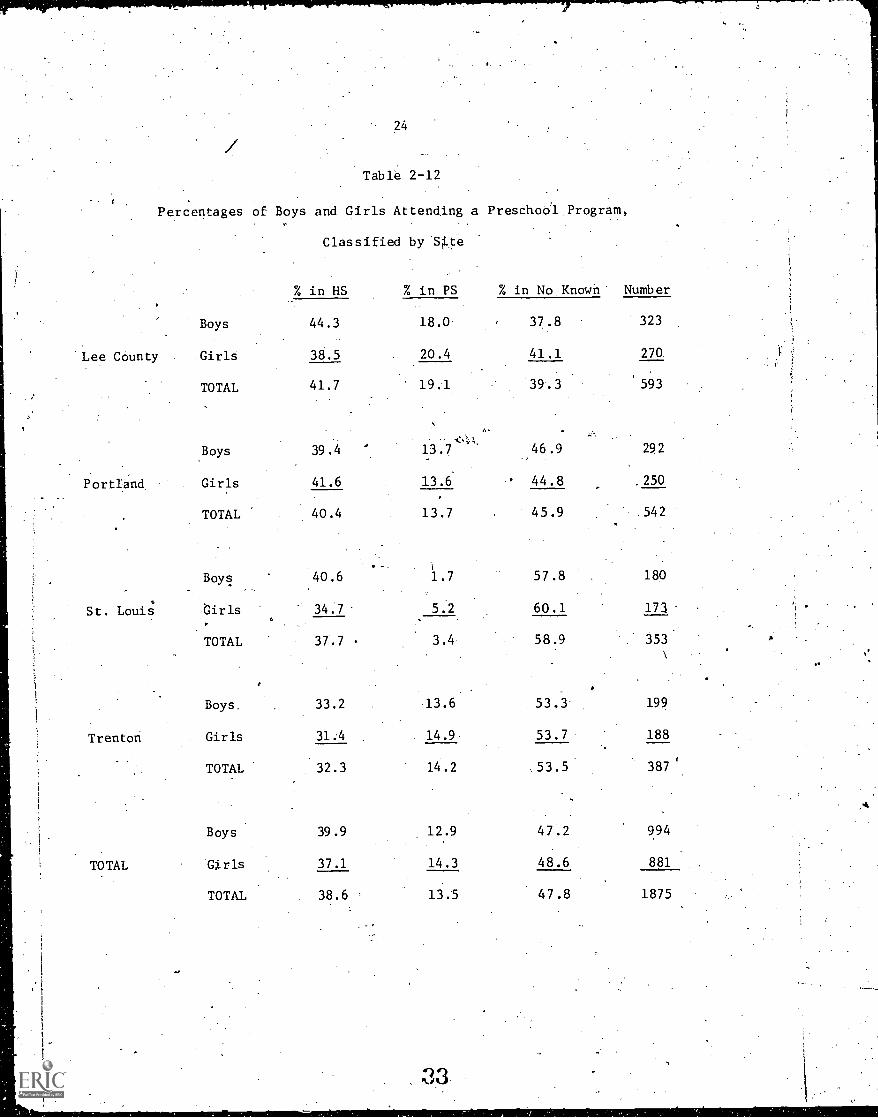
, Sex by preschool attendance classification: Table 2-12 shows the per-
centage.of children who attended Head Start, other preschool programs, or
neither. This table is classified by sex. Overall, 39.9% of the boys. and
37.1% of the girls attended Head Start. There is not a.consistent pattern
over dhe four site-s. It-Lee County, St. Louis,and Trenton a larger percentage of
the marginals.
boys attended, whereas in Portland a larger percentage of girls attended Head
Start. In all cases the differences in proportions are slight.
22
Table 2-10
Nuthber. Attending PreschoOl'Programs, Classified by Race and Site
Black White Other Total
HS 232 15 0 247
Lee County PS. 8 103 2 113 0
No Known 39 194 0 233
Total 279 312 2 593
HS 180 35 4 219
Portland PS 43 31 74
No Known 127 114 8 249
Total 350 180. . 12 542
HS 92 40 31 133
St: Louis PS 11 1 0 12
No Knoyn .140 68 0 208
Total 243 109 1 353
HS 119 125'
Trenton . PS 46 9 0 55
No Known
Total
136 67 207
t301 82 .387
HS 623 96 5 724
TOTAL PS 108 144 2 254
No Known 442 443 12 897
Total 1173 683 19 1875
31
23
Table 2-11
Percentages Attending Preschool Programs, Classified by Race and Site
Black' White Other Total
HS 39.1' 2.5 0.0 41.7. 0.
Lee. County PS 1.3 17.4 0.3 19.1
No Known 6.6 32.7 - 0.0 39.3
Total 47.0 52.6 0.3 100.0
HS 33.2. 6.5 0.7 40.4
Portland PS 7.9 5.7 0.0 13.7
No Known 23.4 21.0 1.5 45.9
.total 64.6 33.2 2.2 100.0
HS 26.1 11.3 0.3 37.7
St. Louis PS 3.1 0.3 0.0 3.4
No Known .39.7 19.3 0.0 58:9
Total 68.8 30.9. 0:3 100.0
HS' 30.7 1.6 0.0 32.3
Trenton PS 11.9 2.3 0.0 14.2
Nol(nown 35.1 17.3 1.0 53.5'
Total 77.8 21.2 1.0 100.0
HS . 33.2 5.1 0.3 38.6
TOTAL PS .5.8 7.7 0.1 13.5
No Known 23.6 23.6 0.6 47.8
Total . 62..6 36.4 1.0 100.0
32
24
Table 2-12
Percentages of Boys and Girls Attending a Preschool Program,
Classified by Site
% in HS % in PS % in No Known Number
Boys 44.3 18.0. 37.8 323
Lee County . .GirlS 38.5 20.4 41.1 270
TOTAL 41.7 19:1 39.3 '593
1.
Boys 39.4 13.7 46.9 29 2
PortlAnd Girls 41:6 13.6. ° 44.8 250
TOTAL 40.4 13.7 45.9 542
. _
Boys 40.6 1.7 57.8 180
St. Louis Girls 34.7 5.2 60.1 17a
TOTAL 37.7 3.4 58.9 353
Boys. 33.2 13.6 53.3 199
Trenton Girls 31.4 14.9 53.7 188
TOTAL 32.3 14.2 53.5 387e
Boys 39.9 12.9 47.2 994
TOTAL Girls 37.1 14.3 48.6 881
TOTAL 38.6 13.5 47.8 1875
25
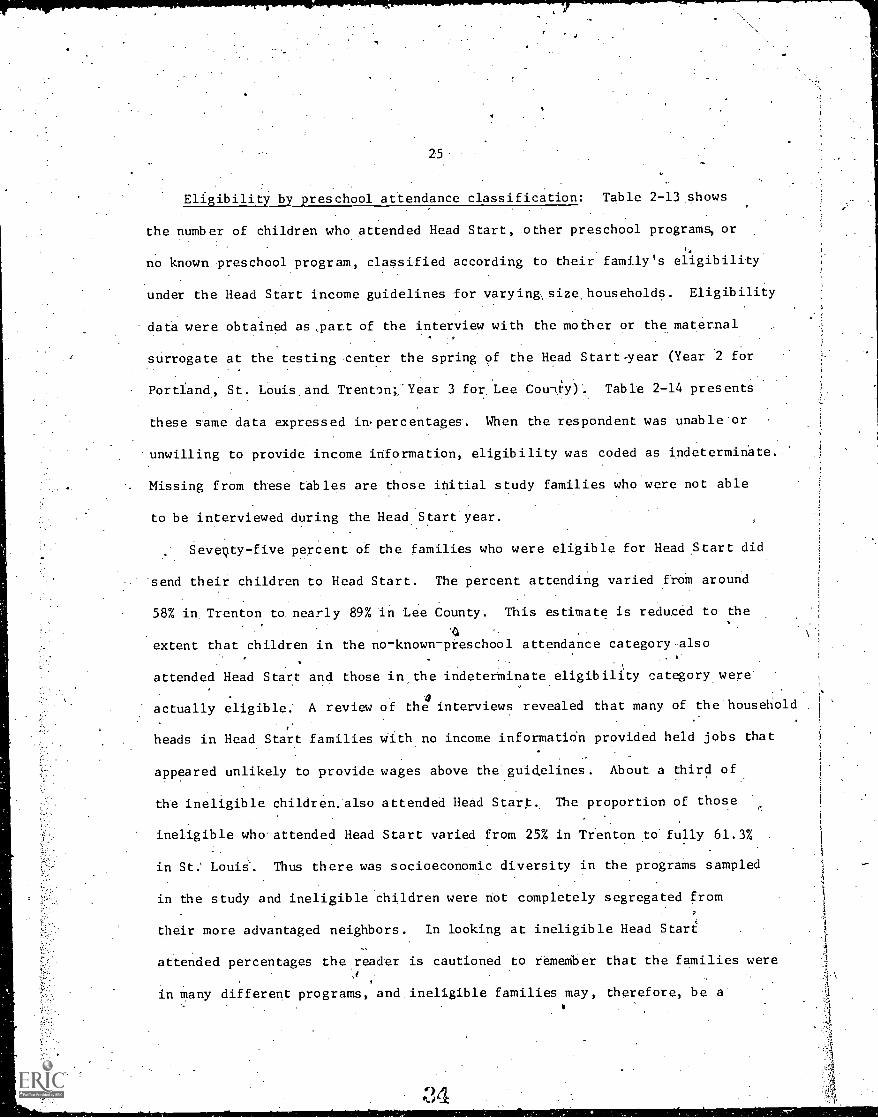
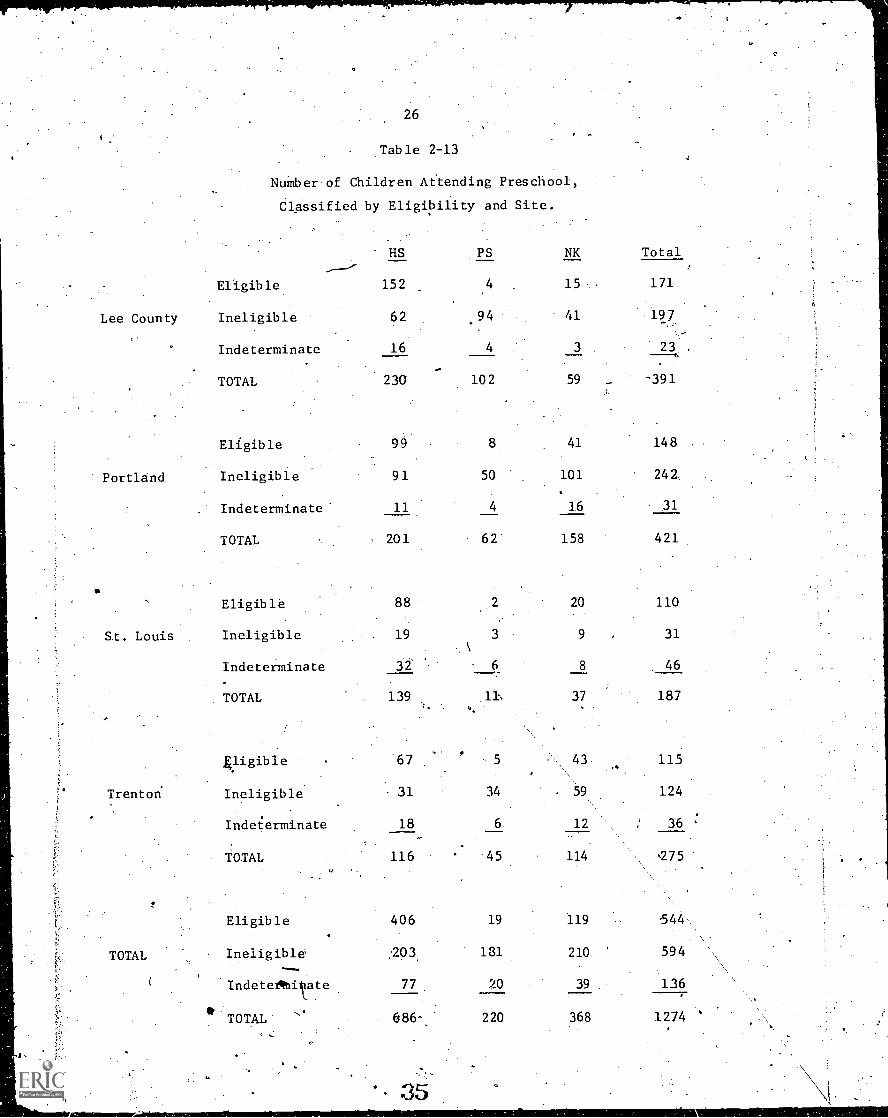
Eligibility by preschool attendance classification: Table 2-13 shows
the number of children who attended Head Start, other preschool programs, or
no known preschool program, classified according to their family's eligibility
under the Head Start income guidelines for varying,size,households. Eligibility
data were obtained as ,part of the interview with the mother or the maternal
surrogate at the testing center the spring of the Head Start-year (Year 2 for
Portland, St. Louis, and. Trenton; Year 3 for. Lee County). Table 2-14 presents
these same data expressed in. percentages. When the respondent was unable or
unwilling to provide income information, eligibility was coded as indeterminate.
Missing from these tables are those initial study families who were not able
to be interviewed during the Head Start year.
Sevepty-five percent of the families who were eligible for Head Start did
'send their children to Head Start. The percent attending varied froM around
58% in, Trenton to nearly 89%ln Lee County. This estimate is reduced to the
extent that children in the no-known-preschool attendance category also
attended Head Start and those in- the indeterminate eligibility category were
actually eligible. A review of the4interviews revealed that many of the household
heads in Head Start families with no income information provided held jobs that
appeared unlikely to provide wages above the guidelines. About a third of
the ineligible children. also attended Head Start, The proportion of those
ineligible who attended Head Start varied from 25% in Trenton to fully 61.3%
in St: Louis. Thus there was socioeconomic diversity in the programs sampled
in the study and ineligible children were not completely segregated from
their more advantaged neighbors. In looking at ineligible Head Start
attended percentages the reader is cautioned to remember that the families were
in many different programs, and ineligible families may, therefore, be a'
26
Table 2-13
Number.of Children Attending Preschool,
Classified by Eligibility and Site.
Portland
St. Louis
Eligible
Ineligible
Indeterminate'
TOTAL
Ineligible
TOTAL
HS
Eligible 152 4
Lee County Ineligible 62
Indeterminate 16
TOTAL 230
99
91
11
201
Eligible 88
19
Indeterminate 32'
. TOTAL 139
eligible 67
Trenton Ineligible 31
Indeterminate 18
116
TOTAL
(
Eligible.
Ineligible
IndetetIthiate
TOTAL
PS NK Total
15. - 171
.94 41 197.
4 3 . 23
102 59 -391
8 41 148
50 101 242,
4 1.6 31
62' 158 421
6
5
34
6.
20
9
8
37
43.
59
12
110
31
46
187
115
124
36
45 114 275
406 19 119 544,,
,203. 131 210 594
77 20 39 136
686-. 220 368 1274
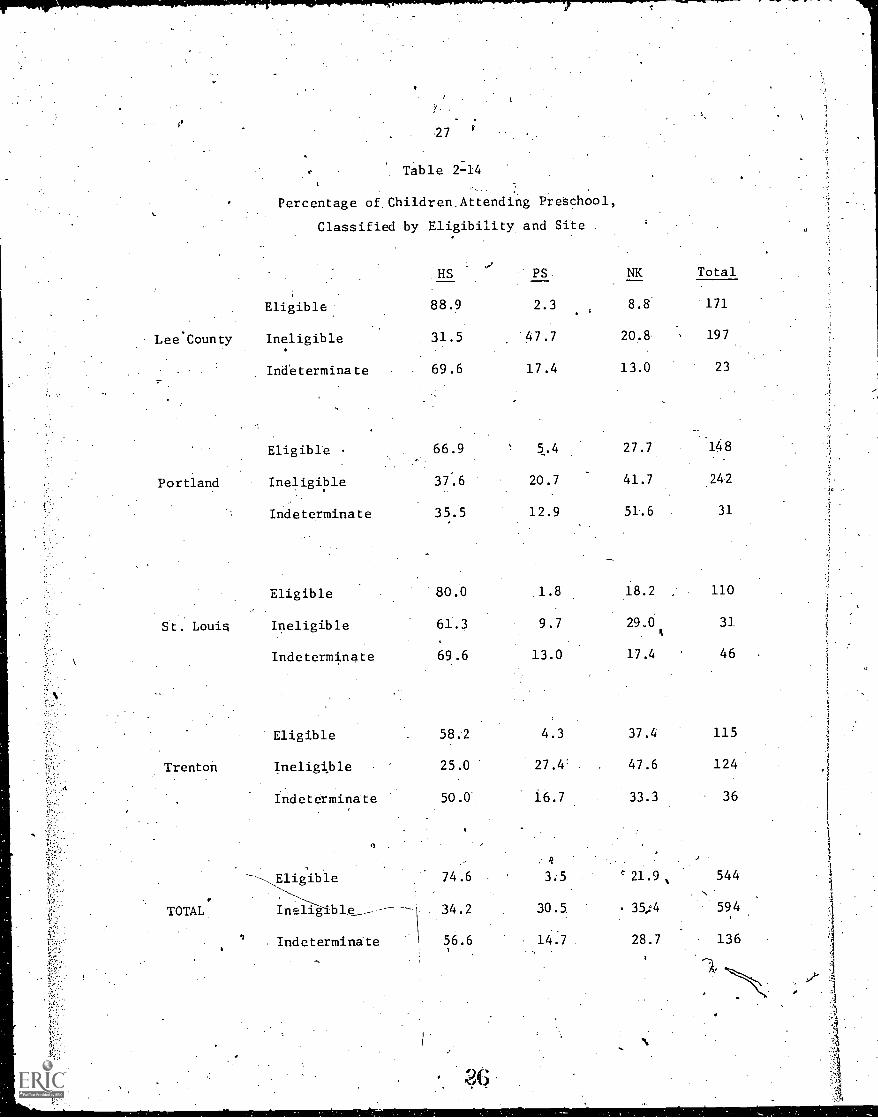
r'27
Table 2:141
Lee County
Percentage of. Children.Attending Preschool,
Classified by Eligibility and Site
HS,
PS
Eligible 88.9 2.3
Ineligible 31.5 47.7
Indeterminate 69.6 17.4
NK
8.8
20.8
13.0
Total
171
197
23
Eligible 66.9 5.4 27.7 148
Portland Ineligible 37.6 20.7 41.7 242
Indeterminate 35.5 12.9 51.6 31
Eligible 80.0 1.8 18.2 , 110
St. Louis Ineligible 61.3 9.7 29.0 31.
Indeterminate 69.6 13.0 17.4 46
Eligible 58.2 4.3 37.4 115
Trenton Ineligible 25.0 27.4' 47.6 124
Indeterminate 50.0 16.7 33.3 36
,,Eligible 74.6 3.5 21.9, 544 1
TOTAL Ineligible ------- 34.2 30.5. 35,:4 594
Indetermindte 56.6 14.7 28.7 136
e ,.
;.4.
;,1
. .
5-smaller percentage of a particular-program's enrollment._ Moreover, 'Income
data were obtained in the spring of the Head Start year, whereas enrollment.
was in.the tall. Given the greater instability Of job opportunities for
the poor, the line hetween"eligible" and "ineligible" for many of. the families
28
in this study may be fine indeed.
Socioeconomic Variables
We have selected for xle.scription in this report fourevariables that are
components of socioeconomic status. They are mother's and father's education
and mother's and father's-occupation. A more fine-grained .des.cription of
socioeconomic.indites will be pregented in the next report. We have chosen
to present the mother's variables first since these areavailable for a sub-
stantially larger sample.
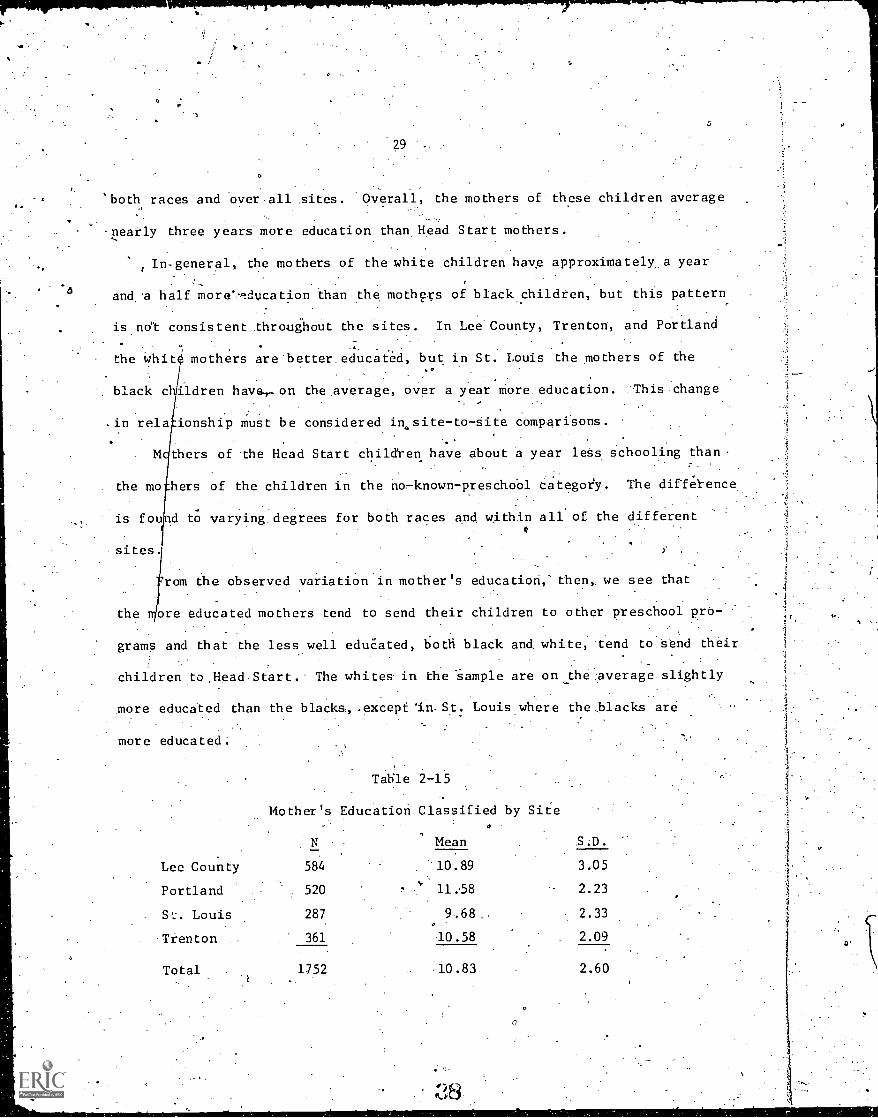
Mother's education: Data are available for mothers of 1752 of the 1875
children in the four sites. The index of mother's education used as a variIIblei
here is highest grade attended. Mean values for the different sites are shown'
in Table 2-15.
Mothers of,children in the Portland .sample. have the highest average
grade attended -- 11.58 -- or a half year under high school graduation. The 6°
Lee County average is 10.89, the Trenton sample 10.58 grades,-and the St. Louis
sample is lowest with an average of 9.59 grades. These averages and the-)
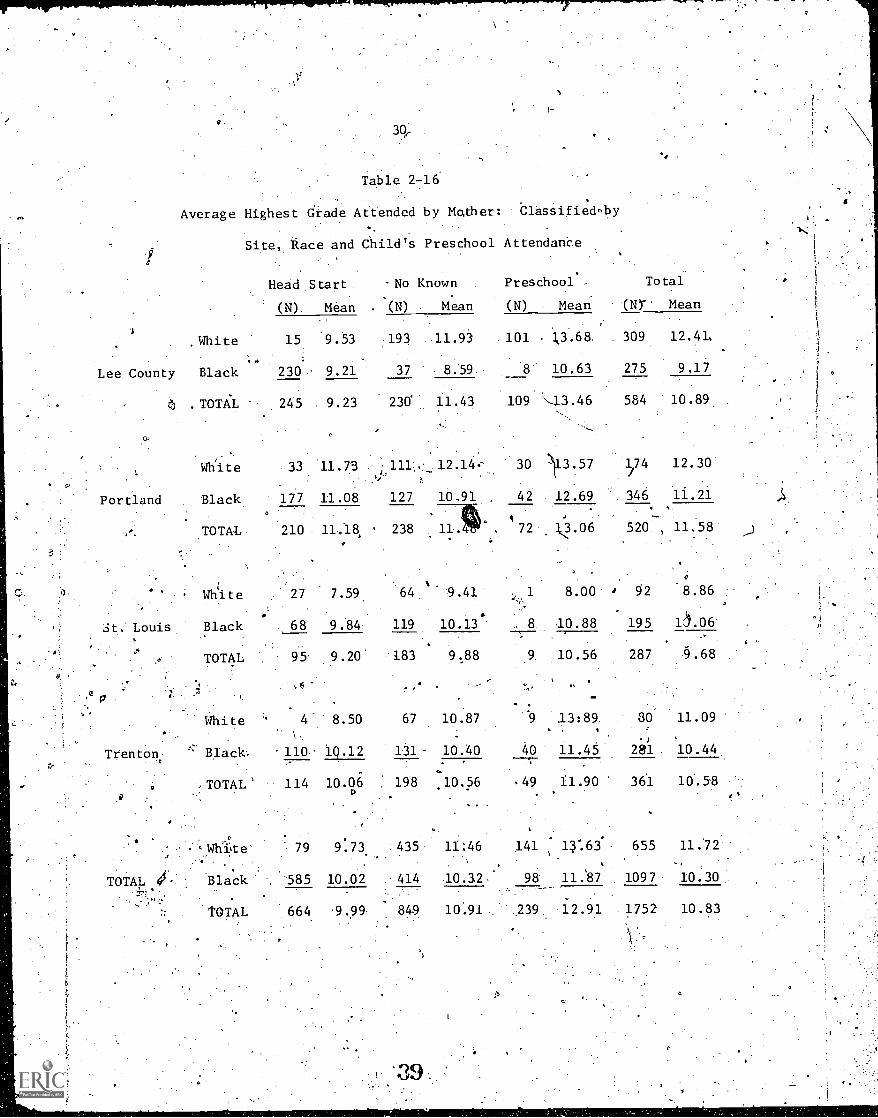
numbers on which they are based are cross-classified by race and presthool
attendance in Table 2-16.
FiTs,t, we note that the mothers of children who go to other preschool'
programs are in all cases.more.highly educated than mothers of either Head
Start children or of those with no known preschool program. ThisholOs for
r
29
'both races and over all sites. Overall, the mothers of these children average
nearly three years more education than Head Start mothers.
In- general, the mothers of the white children have approximately_ a year
and, a half more -.c!ducation than the mothers of black childten, but this pattern
is no't consistent throughout the sites. In Lee County, Trenton, and Portland
the whit mothers are better educated, but in St. Louis the mothers of the..
black children haver on the .average, over a year more education. This change
. in rela ionship must be considered in.site-to-Site comparisons.
M thers of the Head Start children have abOut a year le8s schooling than
. the mo hers of the children in the no,-known-preschoO1 categoy. The diffeYence
is fou d to varying degrees for both races and within all of the different4
sites.
rom the observed variation in mother's education,' then, we see that
the ore educated mothers tend to send their children to other preschool pro-
grams and that the less well eduCated, hotti black and white, tend to send their
children to .Head Start. The whites in the 'sample are on the average slightly
4
more educated than the blacks, .except 'in. St. Louis where the :blacks are
more educated:
Table 2-15
Mother's Education Classified by Site
N Mean ,S.D.
Lee County 584 ' 10 . 89 3.05
Portland 520 11.5.8 2.23
St:. Louis 287 9,68 ...
2.33
Trenton 361 10.58 2.09
Total 1.752 10.83 2.60
'2.
I
0
tet
Table 2-16.
Average Highest Oracle Attended by Mather: elasSified.by
Site, Race and Child's Preschool AttendanCe
Head Start No Known Preschool- Total
(N). Mean - (N) Mean (N) Mean
. White 15
Lee County Black 230
TOTAL 245
. ,
White
9.53 193 11.93
9.21 37 8.59
9.23 230' 11.43
101 . 0.68,
8 10.63
109 N-13.46
33 11.75 ;111..L., 12.14- 30 --)13.57. v ,
Portland Black 177 11.08 127 10,91 , 42 12.69
St. Louis
TOTAL 210 11,18 ' 238 11.
. .
White 27 7.59, 64..
9.41
Black . 68 9.84 119 10.136'
TOTAL .. 95. 9.20 .. 183
TOTAL
White 4' 8.50 67\
Black- 110 1Q.12 131
0 . TOTAL' 114 10.06 198a
White' 79 9.73 435
Black 585 10.02 414
TOTAL 664 9.99 849
72
9 t88
10.87.
10.40 40.
.10.56 49
11:46 141
10.32 98
10.91 239
8.00 J
10.88
10.56
13:89.
11.45
.11.90
13:63'
11.'87
12.91
(N)''' Mean
309 12.41,
275 9.17
584 10.89
174./
12.30
346 11.21.
520 11.58
92 8.86
195 1.06
287 9..68
80
)
11.09
'
281 10.44
361 10.58
655 11.72
1097 10.30
1752 10.83
0
.31
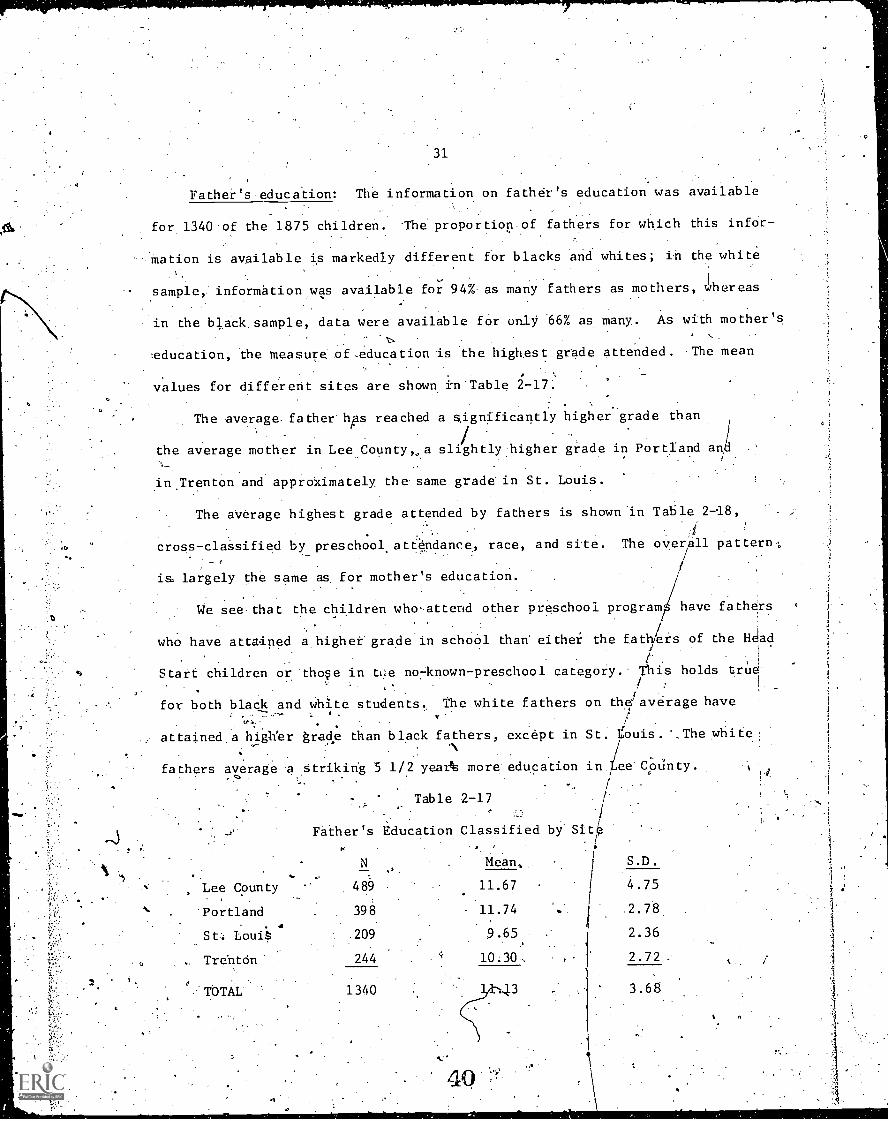
Father's .education: The inforMation on father's education was available
for 1340 of the 1875 children. The proportion -of fathers for which this infor-
mation is available is markedly different for blacks and whites; in the white
sample,. information was available for 94% as many fathers as mothers, Jhereas
in the black.sample, data were available for only '66% as many. As with mother's
;education, the measure of .education Is the highest grade attended. -The mean
values for different sites are shown inTable 2-17:
The average- father hps reached a significantly higher grade than
1the average mother in Lee Countya slightly higher grade in Portland and
/
in .Trenton and approXimately the. same grade in St. Louis.
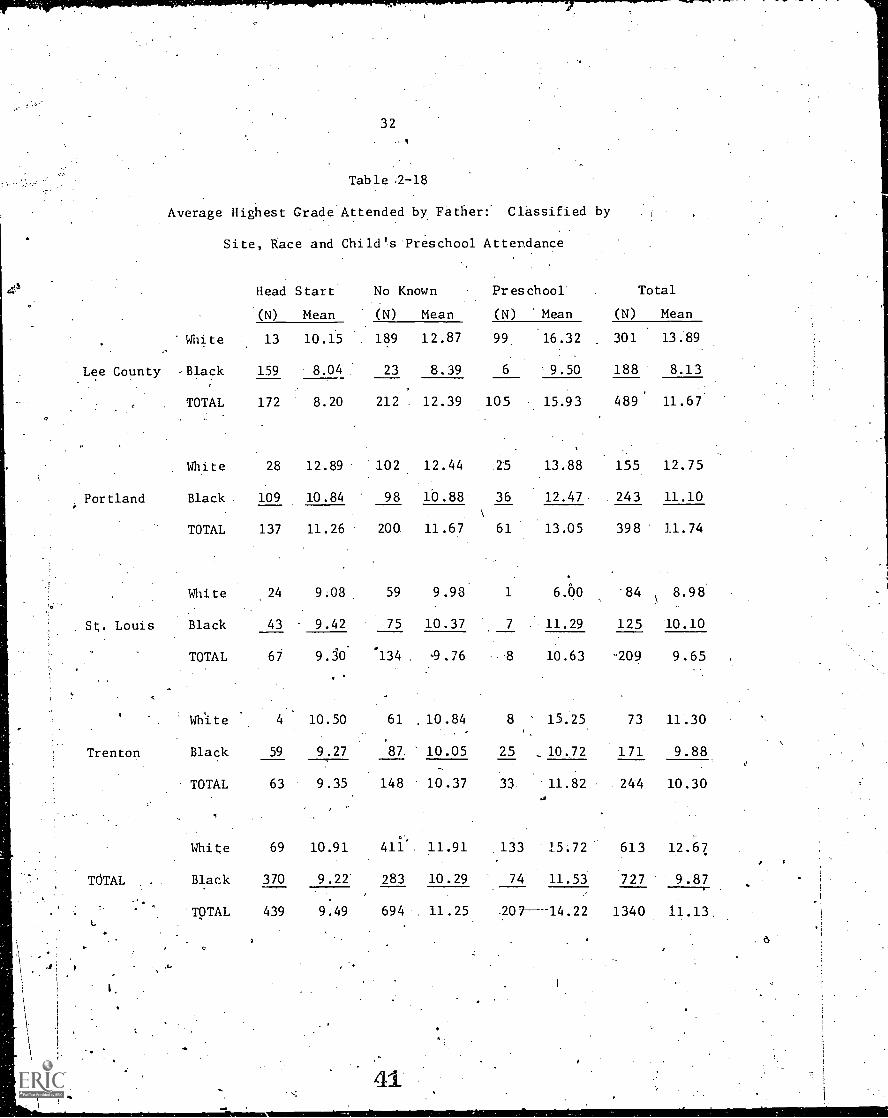
The average highest grade attended by fathers is shown 'in Table 2-18,
cross-classified by preschool attendance, race, and site. The Overall pattern
is largely the same as for mother's education.
We see that the children who-attend other preschool program have fathers
who have attained a higher' grade in school than either the fathers of the HJad
t .
trueStart children or thoe in tie no7known-preschool category.- This holds true!
for both black and white students., The white fathers on the average have
attained a high'er grade than black fathers, except in St. tOuis. The white/
fathers average a...Strikirig 5 1/2 year more education in Lee' COUnty.,,)
. ._ /
Table 2-17 t-, .
Father's Education Classified by' Sitei
Mean..
Lee County
Portland
St: Loui.
Trentdon'
N
489
39A.
.209'
244
11.67
11.74
10.30
TOTAL 43
S.D.
4.75
2.78
2.36
2.72.
3.68
Lee County
Portland
. S. Louis
Trenton
TOTAL
L
32
Table .2-18
Average Highest Grade Attended by Father:. Classified by
Site, Race and Child's Preschool Attendance
Head Start
(N) Mean
No Known
(N) Mean
Preschool
(N) 'Mean
Total
(N) Mean
White 13 10.15 . 189 12.87 99 16.32 301 13.89
-Black 159 8.04 23 8.39 6 '9.50 188 8.13
TOTAL 172 8.20 212. 12.39 105 15.93 489 11.67
White 28 12.89 102. 12.44 25 13.88 155 12.75
Black 109 10.84 98 10.88 36 12.47 243 11.10
TOTAL 137 11.26 200 11.67 61 13.05 398 11.74
White 24 9.08. 59 9.98 1 6.60 '84 8.98
Black 43 9.42 75 10.37 7 11.29 125 10.10
TOTAL 67 9.30 p134 . 9.76 .. 8 10.63 -209 9.65
White 4 10.50 61 .10.84 8 15.25 73 11.30
Black 59 9.27 87 10.05 25 10.72 171 9.88
TOTAL 63 9.35 148 10.37 33 11.82 244 10.30
,0
White 69 10.91 411. 11.91 133 15.72 613 12.67
Black 370 9.22 283 10.29 74 11.53 727 9.87
TOTAL 439 9:49 694 11.25 .207 -14.22 1340 11.13.
-/
33
Mother's occupation: Mother's occupation is coded as the three-digit code
used by.the Census Bureau; however, for the purposes of this report, only the
first digit'will be reported. An eleventh group' was added to the 10 groups
used by the Census. Bureau to accommodate the unemployed. The coding used was:
01 Professionals
02 Farm Owners and Managers
03 Managers and Proprietors.
04 Clerical and Kindred Workers
05 Sales Workers
06 Craftsmen, Foremen, Kindred Workers
07, Operatives and Kindred Workers
08 Service Workers (including priVate hOUsehold workers)
09 Farm Laborers. and Foremen
10 Laborers, Except Farm and Mine
11. Unemployed
For purposes of simplicity, we have grouped.categories 1 through 5 under the
general. title "white collar" and categories '6 through A_O under the general
category "blue collar." This rough categorization is useful for descriptive
purposes; full information on the 11-category code for race X sex x site.x
preschool attendance is presented in Progress Report 70-20, Appendix A,and' :
r.
I
will be updated for the next report which will include a detailed report of
,
the interview findings. /
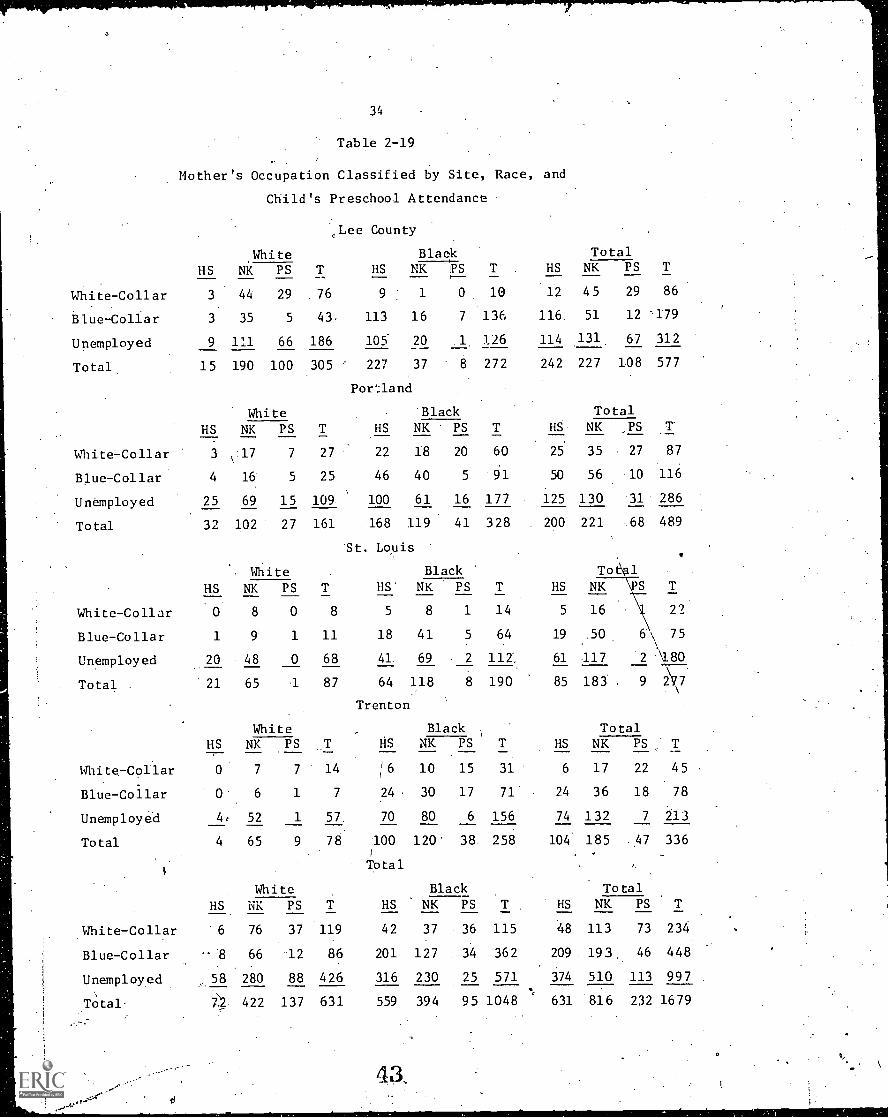
Table 2-19 summarizes the.analyses of basic white-collar/blue-collar/
t
data in each'site by race and by category of preschool attendance. Note that i
.
some of the cells have ra;:her small membership and must be interpreted with
caie.
42
1
34
Table 2-19
Mother's Occupation Classified by Site, Race, and
Child's Preschool Attendance
White-Collar
Blue-Collar
Unemployed
Total
White-Collar
Blue-Collar
Unemployed
Total
White-Collar
Blue-Collar
Unemployed
Total
White-Coilar
Blue-Collar
Unemployed
Total
i
HS
3
3
9
15
HS__3
4
25
32
HS
0
1
20.21
HS-.-
0
0.
4,__
4
HS____
White
',Lee
T
76
43,
186
County
BlackT
10
136
126_272
T_60
91
177
HS
12
116
114
242
HS__
25
50
125
NK PS
44. 29
35 5
111 66
190 100
White
HS NK PS
9 : 1 0
113 16 7
105 20 I.
305
T_27
25
109
227 37 8
Portland
Black
NK PS__
.17 7
16 5
69 15
102 27
.. White
HS NK PS__ __.
22 18 20
46 40 5
100 61 16
161
T
8
11
68
87
T
14
7
57__:
78
T_
168 119 41
St. Louis
Black
328
T
14
64
112',
. 200
HS
5
19
61
85
HS
6
24
74
104
HS
NK PS
8 0
9 1
48 0__
65 1
White
HS' NK PS
5 8 1
18 41 5
4L 69 2
64 118 8
Trenton
Black 1
190
T
31
71
156
NK PS
7 7
6 1
52 1__ __
65 9
White
HS NK PS
1
16 10 15
24 , 30 17
70 80 6__ ___
100 120 38i
Total
Black
258
TNK PS HS NK PS_White-Collar '6 76 37 119 42 37 36 115 48
Blue-Collar '8 66 12 86 201 127 34 362 209
Unemployed 58 280 88 426 316 230 25. 571'.,
374
Total. 7. 422 137 631 559 394 95 1048 631
,-:
4a
TotalNK PS T_45 29 86
51 12 179
131 67 312
227 108 577
TotalNK ,PS 7. _35 27 87
56 10 116
130 31 286
221 -.68 489
ToNK
16 22
..50. 6\ 75
117 2 :480
183 9 1q7\
TotalNK PS T
17 22 45 .
36 18 78
132 7 213
185 ,47 336. .
TotalNK PS T__ __ _113 73 234
193.. 46 448
510 113 997
816 232 1679
35
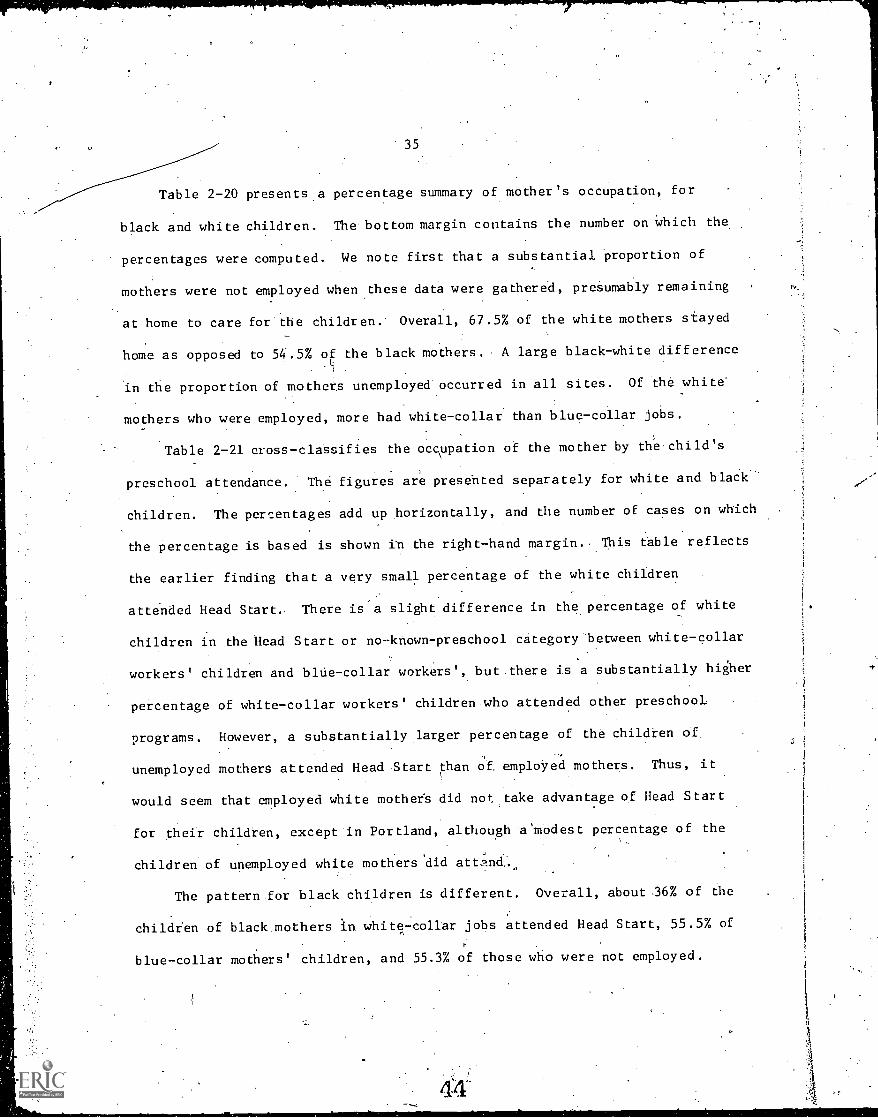
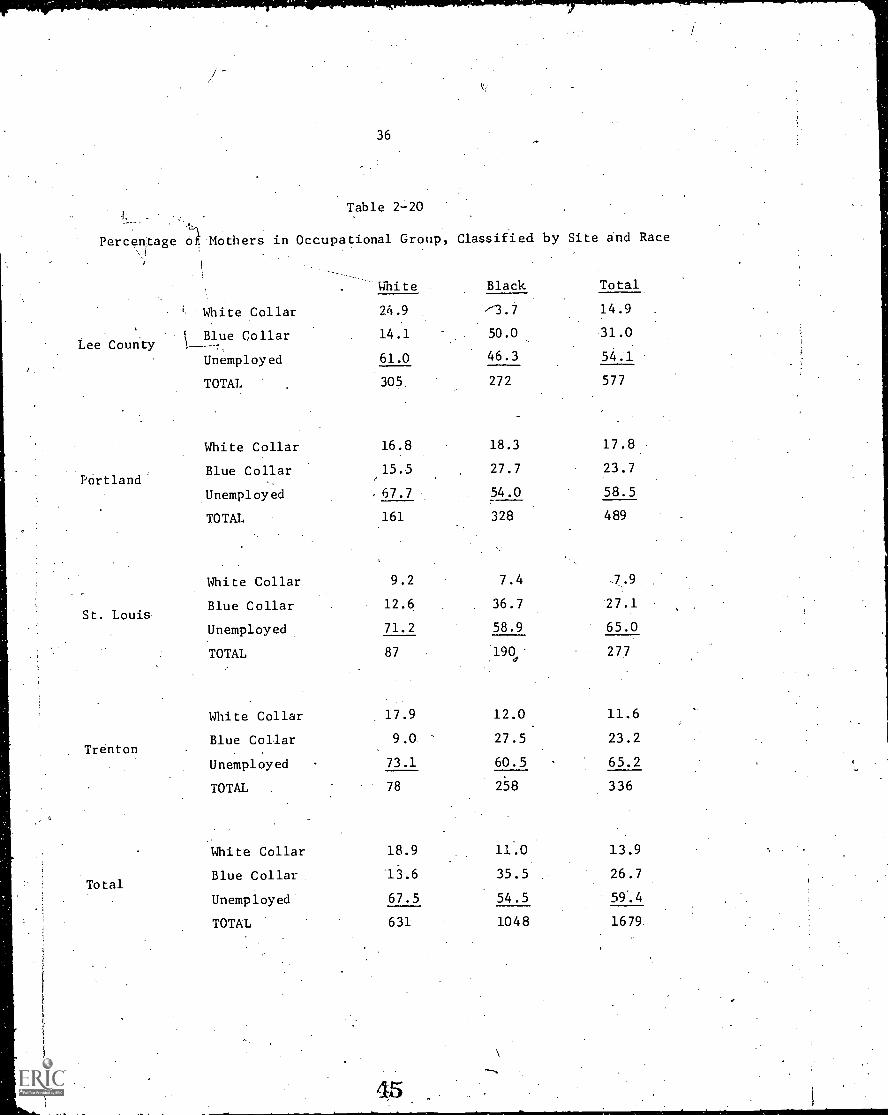
Table 2-20 presents a percentage summary of mother's occupation, for
black and white children. The bottom margin contains the number on which the
percentages were computed. We note first that a substantial proportion of
mothers were not employed when these data were gathered, preSumably remaining r.
at home to care for the children. Overall, 67.5 %, of the white mothers stayed
home as opposed to 54.5% of the black mothers. A large black-white difference
in the proportion of mothers unemployed occurred in all sites. Of the white'
mothers who were employed, more had white-collar than blue-collar jobs.
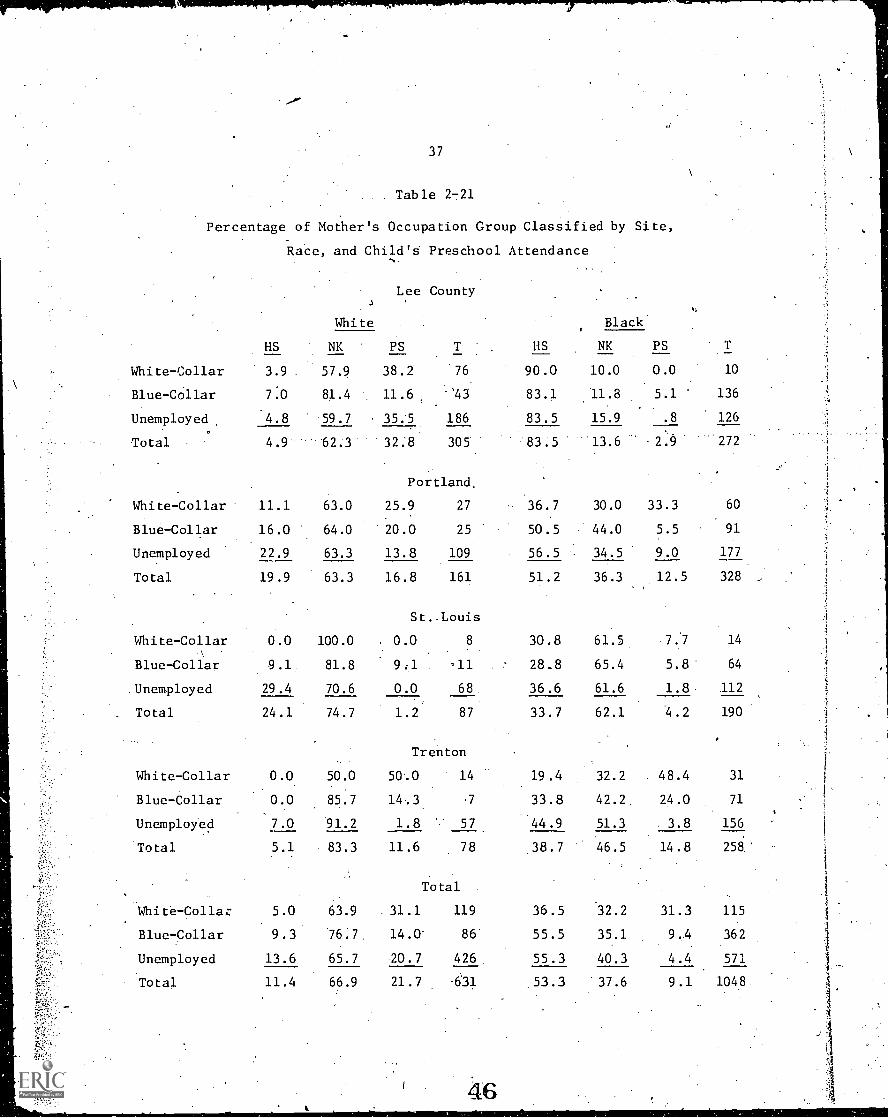
Table 2-21 cross-classifies the occupation of the mother by thechild's
preschool attendance. The figures are presehted separately for white and black
children. The percentages add up horizontally, and the number of cases on which
the percentage is based is shown in the right-hand margin., This table reflects
the earlier finding that a very small percentage of the white children
attended Head Start.. There is a slight difference in the percentage of white
children in the Head Start or no-known-preschool category between white-collar
workers' children and bide-collar workers', but there is a substantially higher
percentage of white-collar workers' children.who attended other preschool
programs. However, a substantially larger percentage of the children of
unemployed mothers attended Head Start than of employed mothers. Thus, it
would seem that employed white mothers did not, take advantage of Head Start
for their children, except in Portland, although a'modest percentage of the
children of unemployed white mothers did attnnd...,,
The pattern.for black children is different. Overall, about 6% of the
children of black mothers in white-collar jobs attended Head Start, 55.5% of
blue-collar mothers' children, and 55.3% of those who were not employed.
36
Table 2-20
Percentage of Mothers in Occupational Group, Classified by Site and Race
Lee County
-White Collar
( Blue Collar1 -1,
White .- Black Total
24.9
14.1
61.0
''3.7
50.0
46.3
14.9
31.0
54.1Unemployed
TOTAL 305. 272 577
White Collar 16.8 18.3 17.8
PortlandBlue Collar 15.5
e
27.7 23.7
Unemployed , 67.7 54.0 58.5
TOTAL 161 328 489
White Collar 9.2 7.4 .7.9
St. LouisBlue Collar 12.6 36.7 27.1
Unemployed 71.2 58.9 65.0
TOTAL 87 190 277
White Collar 17.9 12.0. 11.6
TrentonBlue Collar 9.0 27.5 23.2
Unemployed 73.1 60.5 65.2
TOTAL . 78 258 336
White Collar 18.9 11.0 13.9
TotalBlue Collar 13.6 35.5 26.7
Unemployed 67.5 54.5 59..4
TOTAL 631 1048 1679.
1,
37
. . Table 2721
.
Percentage of Mother's Occupation Group Classified by Site,
Race, and Child's Preschool Attendance ,
-,.
White
Lee County
PS T-- _ HS---
.
Black
PS T
'
I1
HS NK_ __ NK--
White-Collar 3.9 57.9 38.2 76 90.0 10.0 0.0 10
Blue-Collar 7.0 81.4 11.6.. '43 83.1 .1l.8 5.1 136
Unemployed 4.8 59.7 35.5 186 83.5 15.9 .8 126.
Total 4.9'''62.3 32:8 305 83.5 13.6 '2:9 272
Portland,
White-Collar 11.1 63.0 25.9 27 36.7 30.0 33.3 60
Blue-Collar 16.0 64.0 20.0 25 50.5 44.0 5.5 91
Unemployed 22.9 63.3 13.8 109 56.5 34.5 9.0 177____
Total 19.9 63.3 16.8 161 51.2 36.3 12.5 328
St.-Louis
White-Collar 0.0 100.0 0.0 8 30.8 61.5 7:7 14i
\
Blue-Collar 9.1 81.8 9,1 '11 28.8 65.4 5.8 64
Unemployed 29.4 70.6 0.0 68 36.6 61.6 1.8 112,
Total 24.1 74.7 1.2 87 33.7 62.1 4.2 190
1
;_
Trenton
. White-Collar 0.0 50.0 50.0 14 19.4 32.2 48.4 31
Blue-Collar 0.0 85.7 14.3 7 33.8 42.2 24.0 71
Unemployed 91.2 1.8 57 44.9 51.3 3.8 156
Total
.7.0
5.1 83.3 11.6 78 38.7 46.5 14.8 258'
Total1
f White-Collar 5.0 63.9 31.1 119 36.5 32.2 31.3 115
Blue-Collar 9.3 76.7 14.0' 86. 55.5 35.1 9.4 362,--,,
?,. Unemployed 13.6 65.7 20,7 426 55.3 40.3 4.4 571
;;.: '
i',..
Total 11.4 66.9 21.7 -631 53.3 37.6 9.1 1048
46
38
BMployed mothers, whether in. white- collar or. blue-collar occupations, were
more likely to send their Children. to Head Start than to othar_preschOol
programs. Although a substantial, number of lilaCk children of mothers with
white-collar occupations aere enrollepi in other preschool programs, very few,
of the unemployed mothers sent their children;to other preschool programs.
All in all, the differences irillead Start attencie seem to be. related to
racial differences.
Father's occupation: The occupations of fathers were classified into
10 groups using the 'Census Bureau categories. We have added an eleventh
category for the unemployed. The classifications are:.
01 Professionals%
02 Farm Owners and Managers
03 Managers and Proprietors
04 Clerical and Kindred Workers
05 Sales Workers
06 Craftsmen, Foremen, Kindred Workers
07 Operatives and Kindred Workers
08 Service Workers (including private household workers)
09 Farm Laborers and Foremen
10 Laborers, Except Farm and Mine
11 'Unemployed
Complete data on father's occupation for race x sex x site x preschool atten-
dance are presented in-Progress Report 70-20, Appendix A.
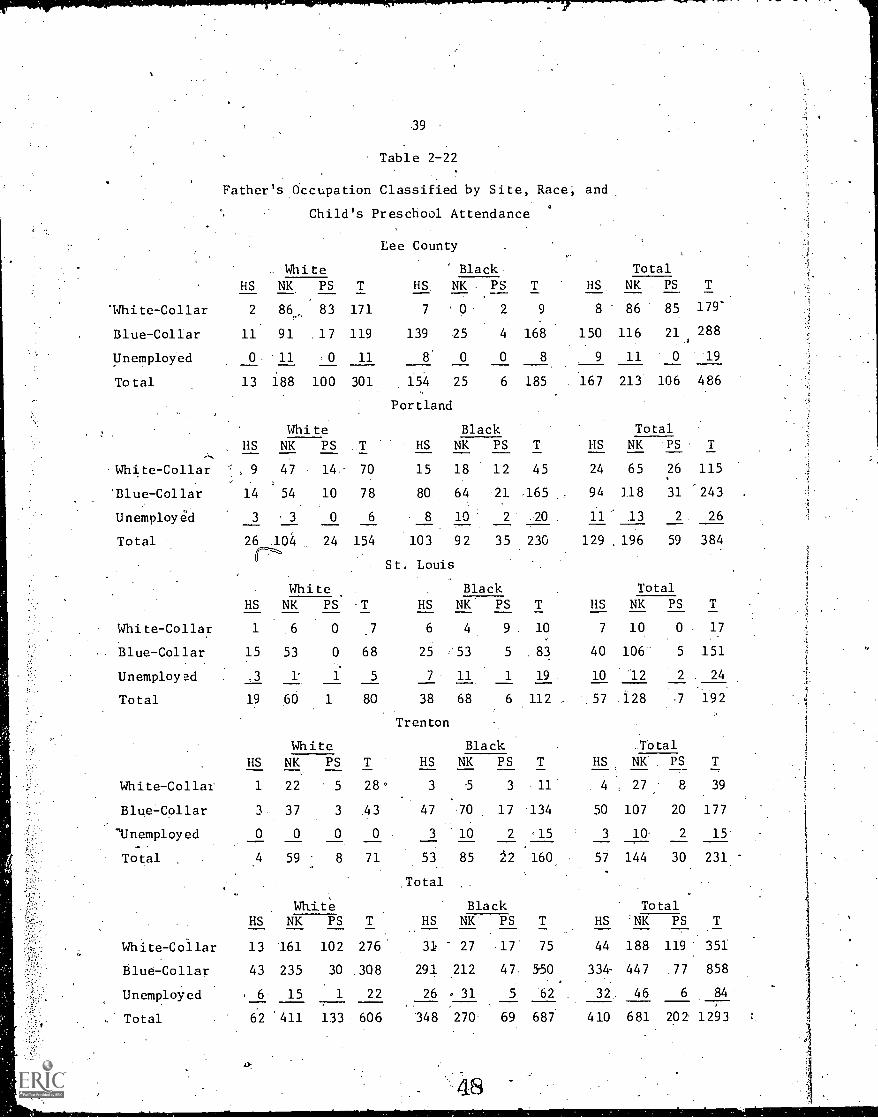
We have again for simplicity grouped categories 1 to 5 as white-collar
and 6 to 10 as blue-collar. These data are shown in Table 2-22, analyzed
by race and category of preschool attendance, separately for each site: Compared
to mothers (N=1679),.this information was available for only 1293 fathers.
39
Table 2-22
Father's Occupation Classified by Site, Race; and
Child's Preschool Attendance
Lee County
Unemployed
Total
_ White Black Total
HS NK PS T HS. NK PS T __.HS. NK PS T
'White- Collar 2 86, 83 171 7 0 2 9 8 86 85 179'
Blue-Collar 11 91 .17 119 139 25 4 168 150 116 21 288
Unemployed 0 .11 .0 11 8 0 0 8 9 11 0 19
Total 13 188 100 301 154 25 6 185 . 167 213 106 486
Portland
White Black Total
HS NK PS T HS NK PS T HS NK -PS T
White- Collar 1, 9 47 14.- 70 15 18 12 45 24 65 26 115, .
'Blue-Collar 14 54 10 78 80 64 2]. .165 , 94 1.18 31 243
3 3 0 6 8 10 2 .20 . 11" 13 2 26
26 .104 24 154 103 92 35 230 129 ..196 59 384(--7-
St. Louis
White Black Total
HS NK PS T HS NK PS T HS NK PS T
White-Collar 1 .6 0 7 6 4 9. 10 7 10 0 17
Blue-Collar 15 53 0 68 25 "53 5 . 83 40 106 5 151
Unemployed .3 1 1 5 7 11 1 19 . 10 12 24
Total 19 60 1 80 38 68 6 112 .57 .128 7 192
Trenton
White Black Total
HS NK PS T HS NK PS T HS NK PS T
White - Collar 1 22 5 28° 3 '5 3 11 4 27 8 39
Blue-Collar 3 37 3 43 47 70 17 134 50 107 20 177
'Unemployed 0 0 0 0 3 10 2 15 3 10' 2 15
Total 59 8 71 53 85 160 57 144 30. 231
Total
White Black TotalHS NK PS T HS NK PS T HS NK PS T
White- Collar 13 161 102 276' 31 27 17 75 44 188 119 351
Blue-Collar 43 235 30 .308 291 212 47. 550 334- 447 77 858
Unemployed 6 15 1 22 26 31 5 62 32 46 6 84
,' Total 62 411 133 606 348 270 69 687 410 681 202 1293
40
There are many rather small cells which are difficult to interpret.
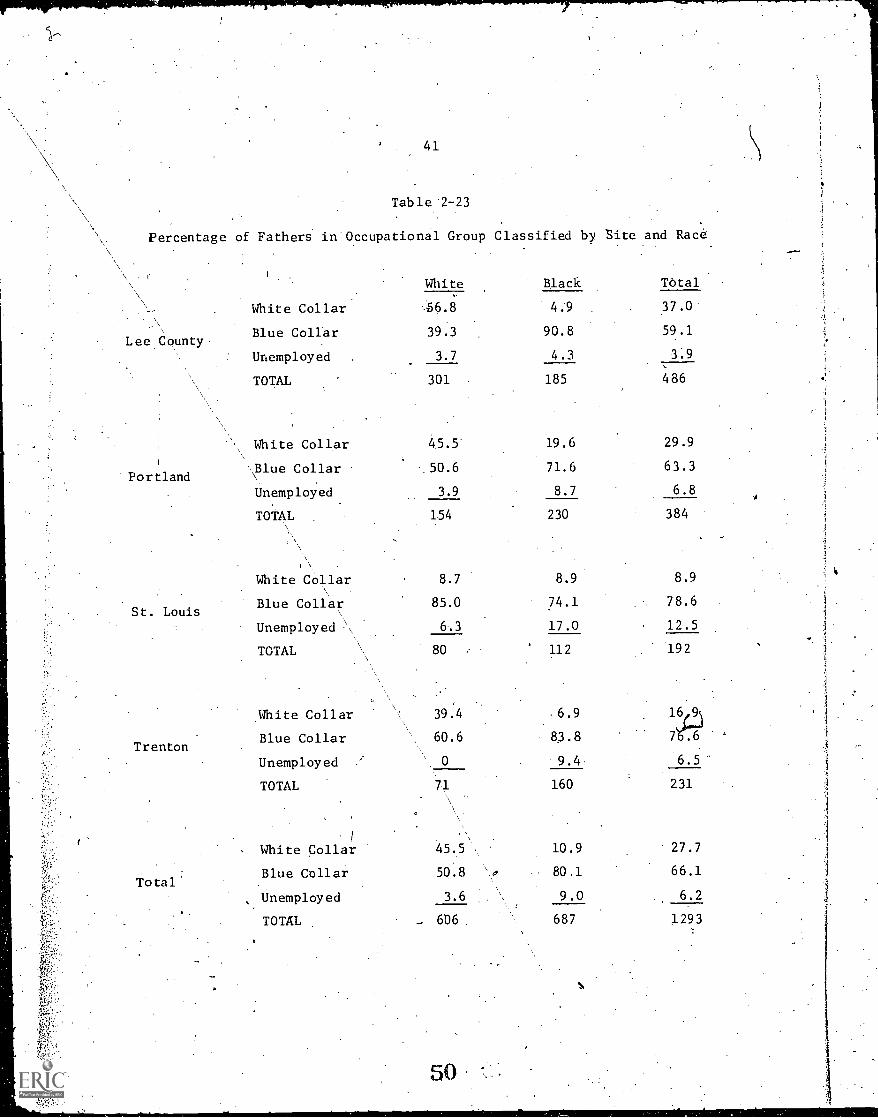
Table 2-23 presents percentages of white-collar, blue-collar, and
unemployed fathers, separated by race and by site. The number of persons1
on whom the percentages were based is shown as a lower margin of each'table.
We first note that a substantially larger proportion of the black;
children had unemployed fathers. The proportion was 9% overall'for blacks
,and 3.6% for whites. The finding of a substantially larger percentage .of..
unemployed fathers of black children was consistent from site to sitd'. Of
the employed fathers, there was a larger proportion of blue-collar than
white-collar workers for both races and'in all sites, but the total of
blue-collar employees outnumbers white-collar employees about 10 to 9 among
the Whites and about 7 to 1 among the black's (see Table 2-23). St. Louis
was an exception where there was a larger tendency for the'fathers of white
children to be employed in blue-collar ocCupations than for the fathers'of
black children.
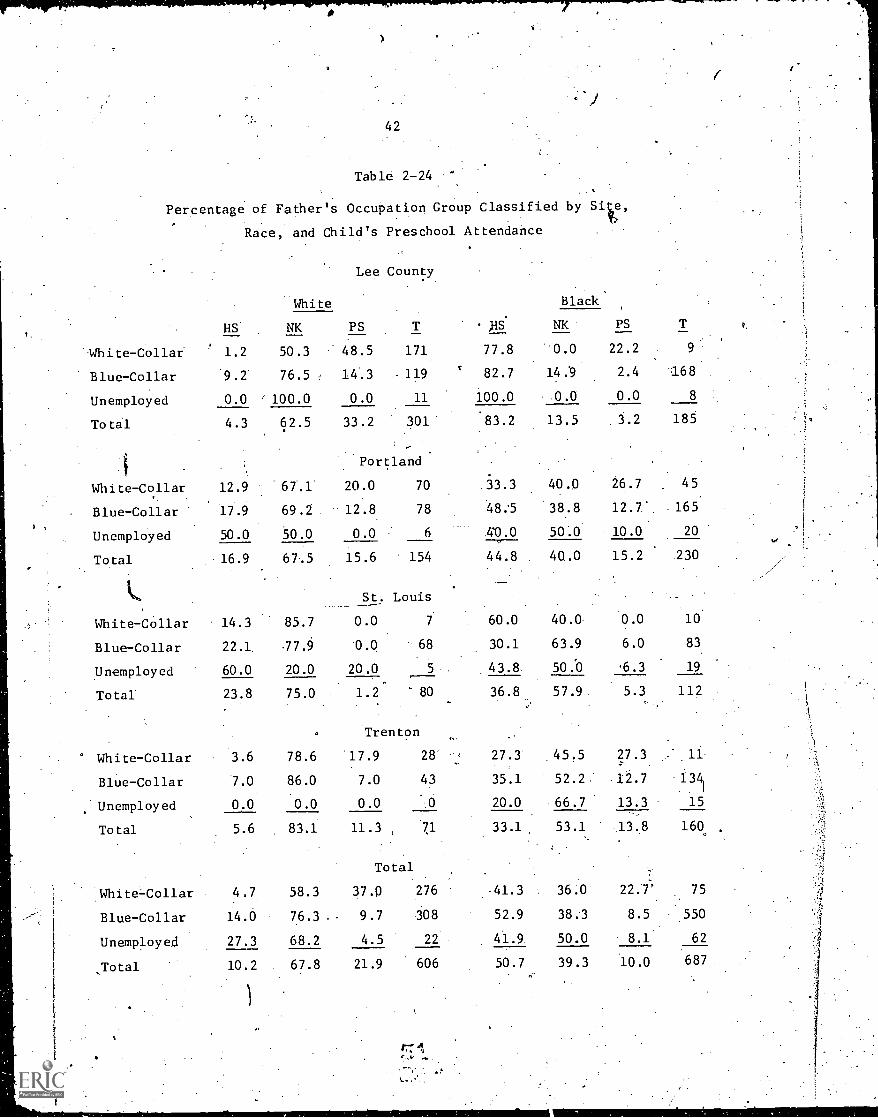
Table-2-24 presents the Proportion of fathers in each type of occupation
whose children attended Head Start, other preschool programs, or no-known-
,
preschool program. This information is .displayed separately by race. The
right7hand magin of'each table shows-the nuMbers from which the percentages
were,computed. -
The number of unemployed white fathers was only 22, so we shall not
discuss percentages based on ,such a small sample. There was a differential
pattern for white-collar and blue-collar fathers in *ending their children
to preschool programs, with white-collar workers' children more likely to have
attended other preschool programs and bltle-collar workers' children to have ,
. .
attended Head Start programs. The distribution of fathers in white-collar
and blue-colLar jobs,.differentiated similarly among blacks, except in St. Louis
1
.
41
Table '2 723
Percentage of Fathers in' Occupational Group Classified by Site and Race
Lee County
Portland
St. Louis
White Black Total
White Collar 56.8 4.9 37.0
Blue Collar 39.3 90.8 59.1
Unemployed . 3.7 4.3 3.9
TOTAL 301 185 486
White Collar 45.5 19.6 29.9
Blue Collar 50.6 71.6 63.3
Unemployed. 3.9 8.7 6.81
TOTAL 154 230 384
White C011ar 8.7 8.9 8.9
Blue Collar 85.0 74.1 78.6
Unemployed 6.3 17.0 12.5
TOTAL 80 . 112 192
White Collar 39.4 6.9 16A
Blue Collar 60.6 83.8 7.1/4(.7-
Unemployed ' 0 9.4. 6.5
TOTAL 71 160 231
White Collar 45..5 10.9 27.7
Blue Collar 50.8 80.1 66.1
Unemployed 3.6 9.0 6.2
TOTAL 606 .687 1293
tb
a.
42
Table 2-24
Percentage of Father's Occupation Group Classified by Sie,
Race, and Child's Preschool Attendance
White-Collar
Blue-Collar
Unemployed
Total
White-Collar
Blue-Collar
Unemployed
Total
k,
White-Collar
Blue-Collar
Unemployed
Total
White-Collar
Blue-Collar
Unemployed
Total
White-Collar
Blue-Collar
Unemployed
Total
Lee County
White Black
HS NK PS T AS NK PS T
1.2 50.3 48.5 171 77.8 0.0 22.2 9
9.2' 76.5 , 14.3 119 82.7 14.'9 2.4 168
0.0 ' 100.0 0.0 11 100.0 0.0 0.0 8
4.3 62.5 33.2 301 83.2 13.5 ,3.2 185
iPortland
12.9 67.1 20.0 70 .33.3 40.0 26.7 45.
17.9 69.2 12.8 78 48;5 38.8 12.7' .165
50.0 50.0 0.0 6 40.0 50.0 10.0 20
16.9 67.5 15.6 154 44.8 40.0 15.2 .230
St. Louis
14.3 85.7 0.0 7 60.0 40.0. 0.0 10
22.1. .77.9 0.0 68 30.1 63.9 6.0 83
60.0 20.0 20.0 5 43.8 50,0 .6 . 3 19
23.8 75.0 1.2 80 36.8 57.9 5.3 112
Trenton..
3.6 78.6 17.9 28' , 27.3 45.5 27.3 11:.-
'7.0 86.0 7.0 43 35.1 52.2. 12.7 1341
0.0 0.0 0.0 .0 20.0 66.7 13.3 15
5.6 83.1 11.3 71 33.1 53.1. .13.8 160
Total
4.7 58.3 37.0 276 41.3 36.0 22.7' 75
14.0 76.3 9.7 308 52.9 38.3 8.5 550
27.3 68.2 4.5 22 41.9 50.0 8.1 62
10.2 67.8 21.9 606 50.7 39.3 10.0 687
43
where a disproportionate number of children of_blazk.white7collar fathers
attended Head Start and children ofblatk blue-collar fathers attended no
. known preschool program. And, except in' Trenton, there was. a tendency for
..the.children of white - collar black fathers to attend Head Start rather thanAg.
other preschool programs.
Age at time of testing: A description of the. age of the children at the
time they were tested iscomplidated by the fact that some ,children were
tested.over aleveral-month period.. This happened because children who
missed some of the week. of testing were followed up and brought back whenever
possible to the testing center for further testing: In the ordinary routine,
children were given a common battery of instruments' on. their first day and
then took. three batteries during the rest of the, week. Fdr simplicity, we have
selected at random one test from each battery, and computed the mean age of
the children at the time of testing; classified by preschool attendance. These
Aata,.teparated by. site, are shown in Table 2-25.
The table contains two entries in each dell: the number of children in.
that cell and their average age in months. One.pattern shows up quite strongly:
the children in St.louis were on the average about-two-and-a-half months
older when they were:tested than were the children in other sites. As
discussed in the next chapter, it was necessary to begin testing later andkZ
also to extend testing by abdut three months in St.Louis in order to increase
the sample size in that site. We note that these children are still of :the
appropriate age, but the, age at the preliminary testing was about two-and-a-
hayf-months older..
There is also a very slight tendency for children. enrolled in some
preschool program (Head Start or other) to be slightly older than those ina the '1
'no-known-Oreschoo.1 categdry.
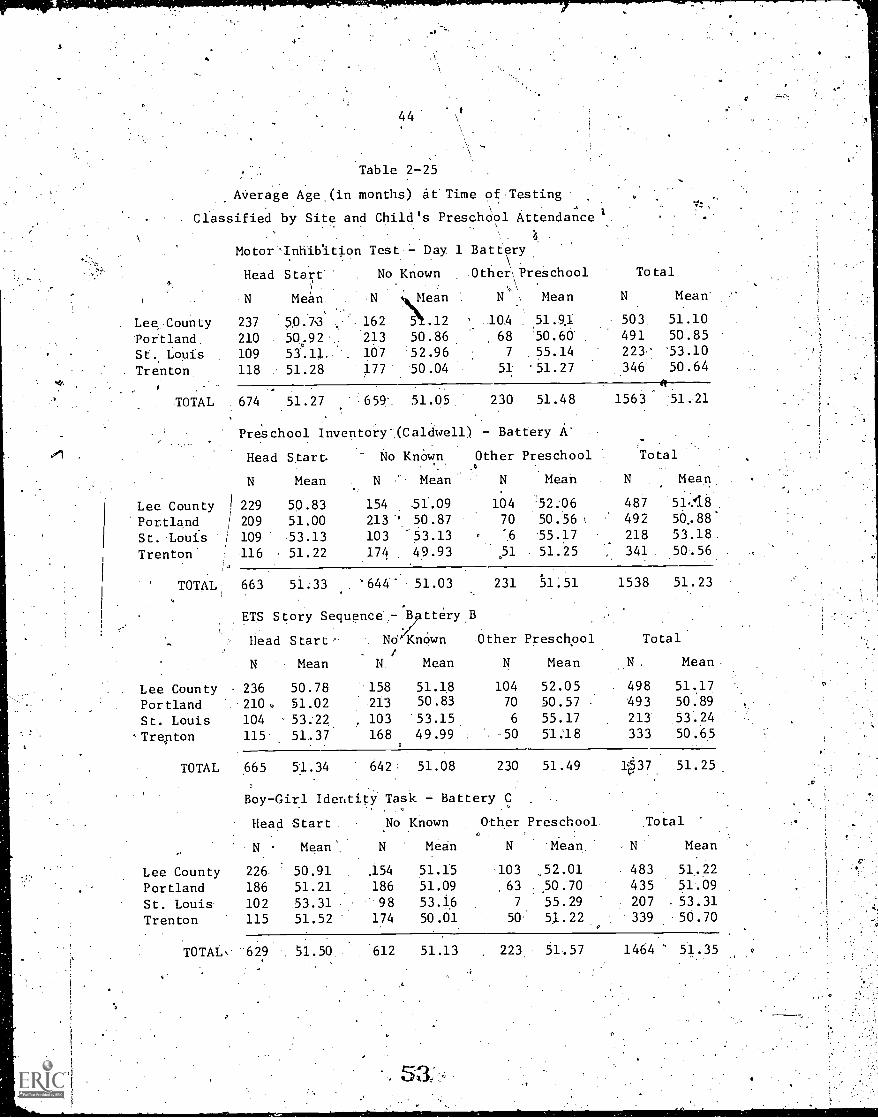
44
Table 2-25
.'AlierageAge.(in months) at'Time of.Testing .
Classified by Site and Child's PreschOol Attendance 1.
.6.
Motor'Inhibltion Test H- Day. 1 Battery
Head Start No Known Othe\Preschool Total,,,
\ .
N Mean. .N ,:leean N Mean N Mean'
Lee:County 237 50.7,3 . 162
Portland..210.50. A2 213
St. Louis 109 53.11. 107
. Trenton 118 .. 51.28 177.
f
TOTAL 674 51.27 ''659:.
1
511i.12 104 .51.9,1 503 51.10
50.86 ,68 50.60' 491 50.85
'52.96 7 55.14 223: '53.10
50.04 51 '51.27 346' 50.64
51.05 230 51.48 1563 51.21
Preschool Inventory(Caldwell) Battery A-,
Head Start No KnOwn Other Preschool Total
Lee CountyPortlandSt. LOufsTrenton'
N Mean N Mean N Mean N Mean
229 50.83 154 51'.09 104 52.06 487 51,.'18
209 51.00 213 ' 50.87 70 50.56\ 492 50,88'
109 53.13 103 -53.13 . '6 55.17 218 53.18
116 51.22 174 49.93 ,51 51.25 341 50.56
TOTAL 663 51.33 '644" 51.03 231 *1.51 1538 51.23
ETS Story Sequence -.13 ttery B
Head Start. NO KnOwn Other Preschool Total
N Mean N Mean N Mean N. Mean
Lee County 236 50.78 158 51.1.8 104 52.05 498 51.17
Portland 2100 51.02 213 50.83 70 50.57 493 50.89
St. Louis 104 53.22 , 103 53.15 6 55.17 213 53.24
Trepton 115 51.37 168 49.99 50 51:18 333 50.65
TOTAL 665 51'..34 642; 51.08 230 51.49 1537. 51.25_
Boy-Girl Identity Task Battery C
Head Start No Known Other Preschool. Total
N Mean'. N Mean N 'Mean. N Mean
Lee County 226 50.91 .154 51.15 103 52.01 483 51.22
Portland 186 51.21 186 51.09 63 50.70 .435 51.09
St. Louis 102 53.31 98 53.16 7 55.29 207 53.31
Trenton 115 51.52 174 50.01 50 51.22 339 50.70
TOTALS. 629 51:50 612 51.13 223. 51.57 1464 51.35
53.
O
.11
CHAPTER 3-- METHODOLOGY °
Collection of Dati'lk
o
Enumeration and Parent Interviews
The first phase of data collection, enumeration and parent interviews,
was undertaken by the New York City-fkrm-of
subcontract withETS. Its task was first to
the geOgraphic areas being studied, and then
with each child's mother or mother surrogate,r
on the basis of his birthdate,
of 1971.
ITi-fggFidStriTieys (A & S), under
.... -
locate all' eligible ,children within
to complete'a '90-minute interview/
An eligible child was one who,
was expected to.enter first grade' in the Fall
Since previous experience with similar'surveys had demonstrated. the
importsnce of col\ munity support, cooperation through the use of local media
and through contact with key community"l .s t.eaders was effectively ough Inter-.
viewers, all female, were recruited from the community, with A & S staff\
,\During .the enumeration phase, several problems were encountered. One-of
the most dilficult involved development of individual location,maps to monitor
interviewer assignments: This was particularly "difficult in' rural areas of
Lee County because frequentlyothere were no named streets ,,r official county
responsible for both training and supervision.^
/
roa s. The problem was finally resolved by hi -ring several local long-term
res dents Who traveled through the county making detailed maps ofeach-sChool
The problem of locating the expected number of Households was not
-*See ETS, PR-69-12, "From Theory to Ourations," for a more detailedaccounting of-Year 1 data-collection procedEres.
. -
46
unique to the rural areas oE Lee County. In St. Louis, for example, it was
found than many of the neighborhoods in the study have houses with entrances
in alleyways that do not appear on Official map,. Here, too, the solution
involved reliance on the knowledge and cooperation of local residents. As a
cross check, to ensure tha.: as few eligible households as possible were missed
during pre-listing, a question about first-grade enrollment was used. However,
unexpected variations in ldcal enrollment practices did cause problems, several
of which are discussed in ETS Progress Report 70-20.
Following initial piloting in the metropolitan New York area,
scale pilot test of about 10 completed interviews was conducted in each of the
fou'r study sites. The interviewing procedures paralleled the final design and
execution to as .great an extent as ;possible.. Three interviewers' in each city
underwent an extensive briefing \inorder to conduct the pilot test. All
,j,1
three completed practice interview and later had the opportunity to discuss
their reactions and opinions at a\\group debriefing session. The debriefing
.report, supported by tape recordings of the discussions and independent analysis
of the pilot-test questionnaires, proved to be extremely useful in the final
revision of both questionnaire and training projedures.
Since changes in the interview' involved only deleting or rewording a few
. .
Modifyingambiguously worded questions, or format rather than the nature of
an item, another pilot testing proved unnecessary. The actual interviewing
+a
'of eligible ,mothers or mother sub
I
titutes went relatively smoothly,. and each
one was reviewed on a question-bytquestion basis'for consistency, clarity,
and completeness. I
55
47
.Individual Testing
Phase two of data collection involved administration of individual tests.
From the beginning of the study it had been argued that using local testers
would facilitate community cooperation, contribute to the validity of the
data pbtained, and provide training. that would contribute to future employ-
ment possibilities for community residents.
The general procedures were the same in each site. Prior to the arrival
of tht ETS training team, the local coordinator preselected the tester train-
ees, choosing approximately '30% more than the number who eventually' would be
hired. -Depending on a variety of facors (such as resources in the community,
the local coordinator's preferences, publicity concerning the project, and
intra-community relations), trainees varied both within and between sites.
All trainees were female. The usual educational credentials were not required,
but experience in working with young children was considered highly desirable,
as was the ability to read and speak with ease. Our judgments as".to the ade
quacy of the tester's affective reactions to children and her ability to
learn the tasks were the two focal criteria for final selection. Most of the
trainees were, housewives who had limited work experience, and most were black.
The on-site training was undertaken at staggered intervals, starting
March 17 in Auburn, March 31 in Pottland, April 14 in Trenton, and April 28
in St. Louis Training at each-site during the first two weeks took place in
the local coordinator's office. After receiving a general orientation,
trainees began practice on one of the simpler tasks on the first day.
'It was felt that facility in handling the variety of problems a tester was
likely to encounter could best be developed in the context of a particular
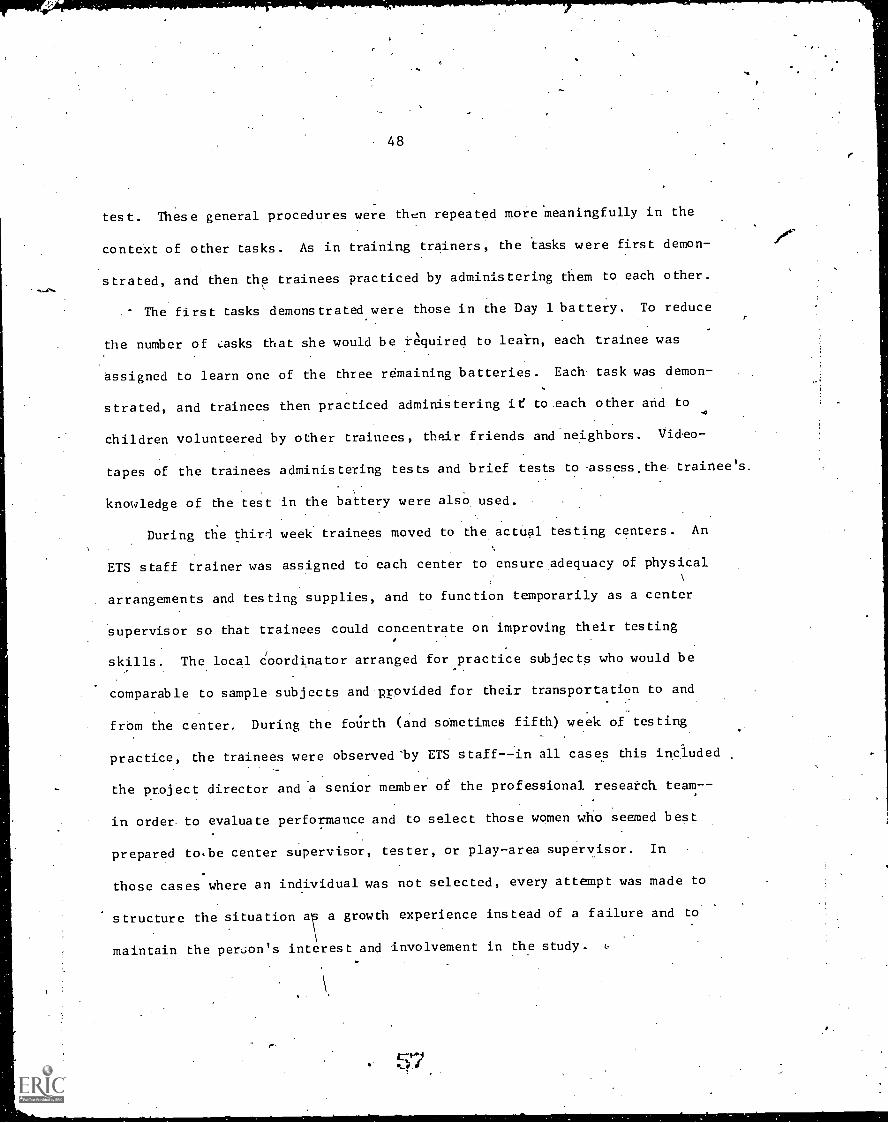
48
test. These general procedures were then repeated more meaningfully in the
context of other tasks. As in training trainers, the tasks were first demon-
strated, and then the trainees practiced by administering them to each other.
The first tasks demonstrated were those in the Day 1 battery. To reduce
the number of ,:asks that she would be required to leastn, each trainee was
assigned to learn one of the three remaining batteries. Each task was demon-
strated, and trainees then practiced administering ie to each other and to
children volunteered by other trainees, their friends and neighbors. Video-
tapes of the trainees administering tests and brief tests to .assess,the. trainee's.
knowledge of the test in the battery were also used.
During the third week trainees moved to the actual testing centers. An
ETS staff trainer was assigned to each center to ensure adequacy of physical
arrangements and testing supplies, and to function temporarily as a center
supervisor so that trainees could concentrate on improving their testing
skills. The local coordinator arranged for practice subjects who would be
comparable to sample subjects and provided for their transportation to and
frbm the center. During the fourth (and sometimes fifth) week of testing
practice, the trainees were observed by ETS staff--in all cases this included
the project director and a senior member of the professional research team-
in order. to evaluate performance and to select those women who seemed best
prepared to,be center supervisor, tester, or play-area supervisor. In
those cases where an individual was not selected, every attempt was made to
structure the situation a a growth experience instead of a failure and to
maintain the perGon's interest and involvement in the study.
57
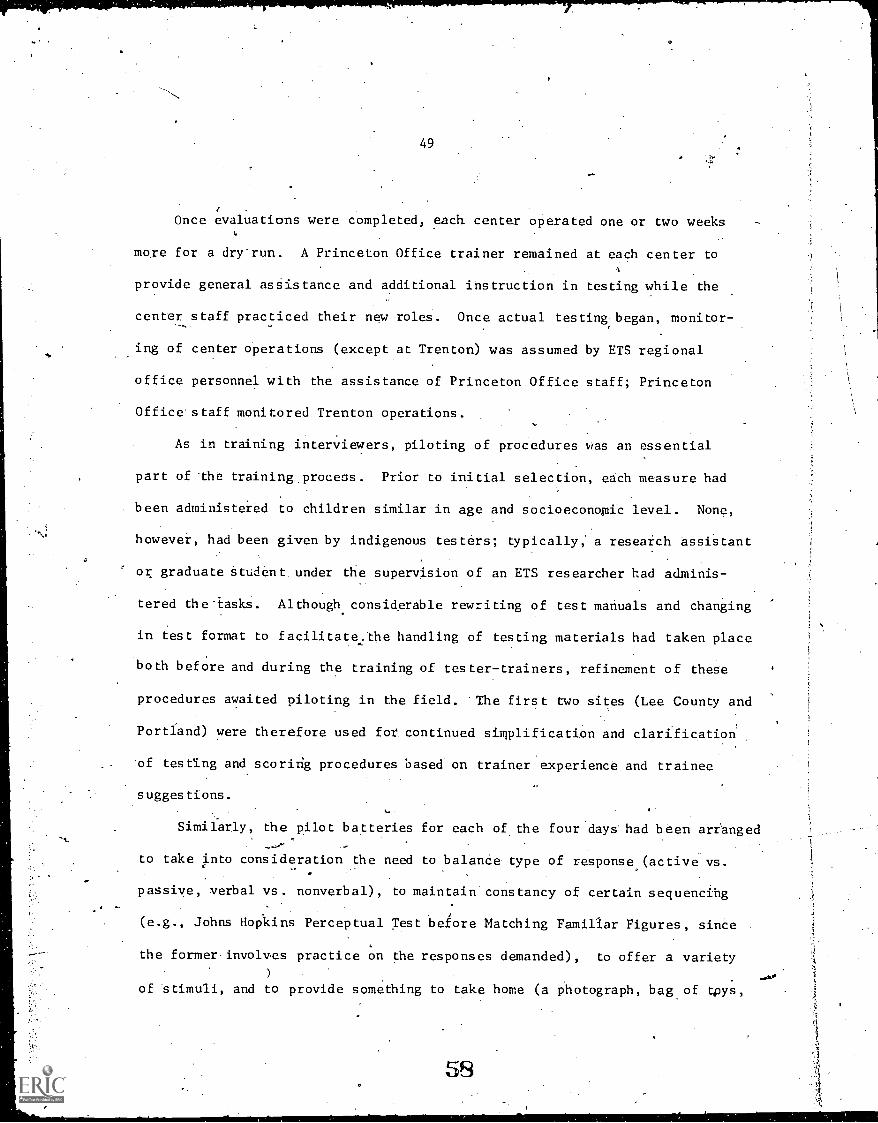
49
Once evaluations were completed, each center operated one or two weeks
more for a dry run. A Princeton Office trainer remained at each center to
provide general assistance and additional instruction in testing while the
center staff practiced their new roles. Once actual testing began, monitor-,
ing of center operations (except at Trenton) was assumed by ETS regional
office personnel with the assistance of Princeton. Office staff; Princeton
Office staff monitored Trenton operations.
As in training interviewers, piloting of procedures was an essential
part of the training.process. Prior to initial selection, each measure had
. been administered to children similar in age and socioeconomic level. None,
however, had been given by indigenous testers; typically; a research assistant
or graduate Student. under the supervision of an ETS researcher had adminis-
tered the.iasks. Although considerable rewriting of test manuals and changing
in test format to facilitate:the handling of testing materials had taken place
both before and during the training of tester-trainers, refinement of these
procedures awaited piloting in the field. The first two sites (Lee County and
Portland) were therefore used for. continued simplification and clarification
of testing and scoring procedures based on trainer experience and trainee
suggestions.
Similarly, the pilot batteries for each of the four days had been arranged
to take into consideration the need to balance type of response(active vs.
passive, verbal vs. nonverbal), to maintain constancy of certain sequencihg
(e.g., Johns Hopkins Perceptual Test before Matching Familiar Figures, since
the former involves practice on the responses demanded), to offer a variety
of stimuli, and to provide something to take home (a photograph, bag of tpys,1
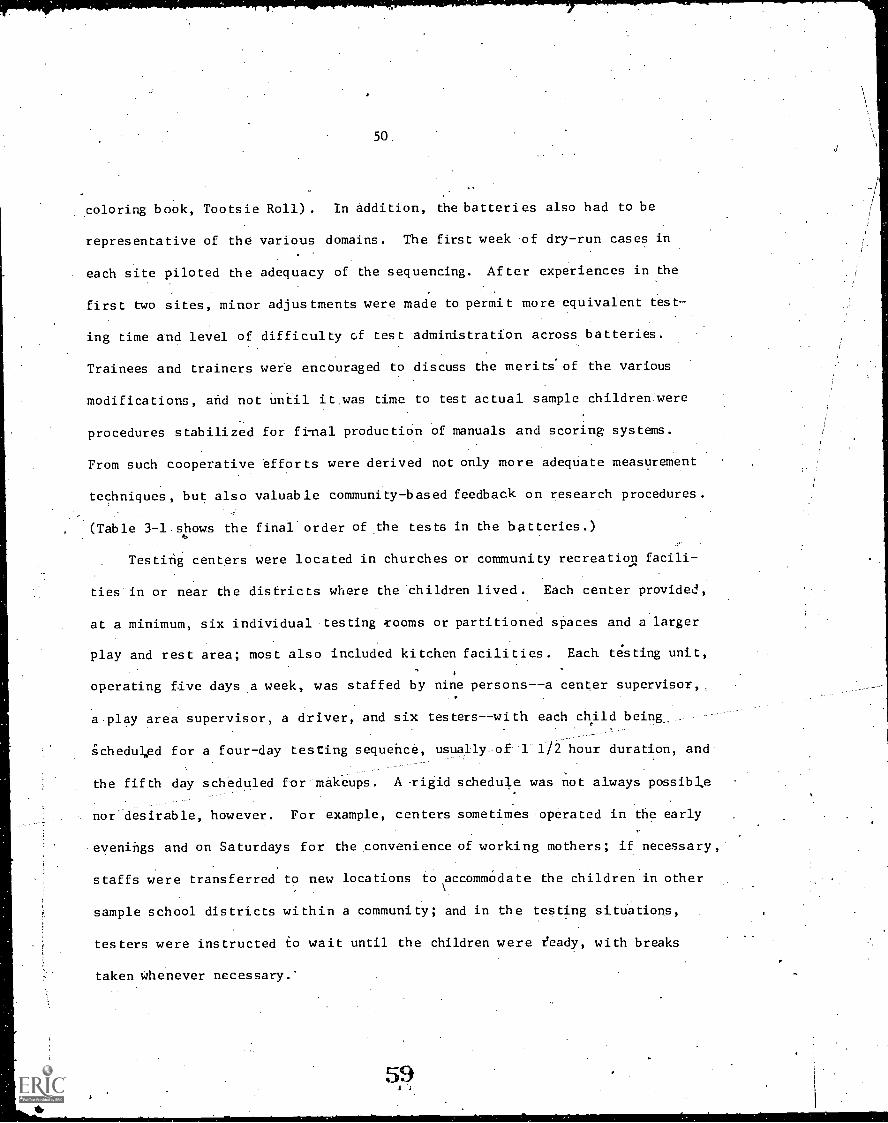
50
coloring book, Tootsie Roll). In addition, the batteries also had to be
representative of the various domains. The first week of dry-run cases in
each site piloted the adequacy of the sequencing. After experiences in the
first two sites, minor adjustments were made to permit more equivalent test-
ing time and level of difficulty of test administration across batteries.
Trainees and trainers were encouraged to discuss the merits' of the various
modifications, and not until it was time to test actual sample children were
procedures stabilized for final production of manuals and scoring. systems.
From such cooperative efforts were derived not only more adequate measurement
techniques, but also valuable community-based feedback on research procedures.
,(Table 3-1 shows the final order of the tests in the batteries.)
Testing centers were located in churches or community recreation facili-
ties in or near the districts where the children lived. Each center provided,
at a minimum, six individual testing zooms or partitioned spaces and a larger
play and rest area; most also included kitchen facilities. Each testing unit,
operating five days a week, was staffed by nine persons--a center supervisor,
a play area supervisor, a driver, and six testers--with each child being__
icheduLed for a four-day testing sequence, usually of 1 1/2 hour duration, and-.
the fifth day scheduled for-makeups. A -rigid schedule was not always possible
nor desirable, however. For example, centers sometimes operated in the early
evenings and on Saturdays for the convenience of working mothers; if necessary,
staffs were transferred to new locations to accommOdate the children in other
sample school districts within a community; and in the testing situations,
testers were instructed to wait until the children were feady, with breaks
taken whenever necessary.'
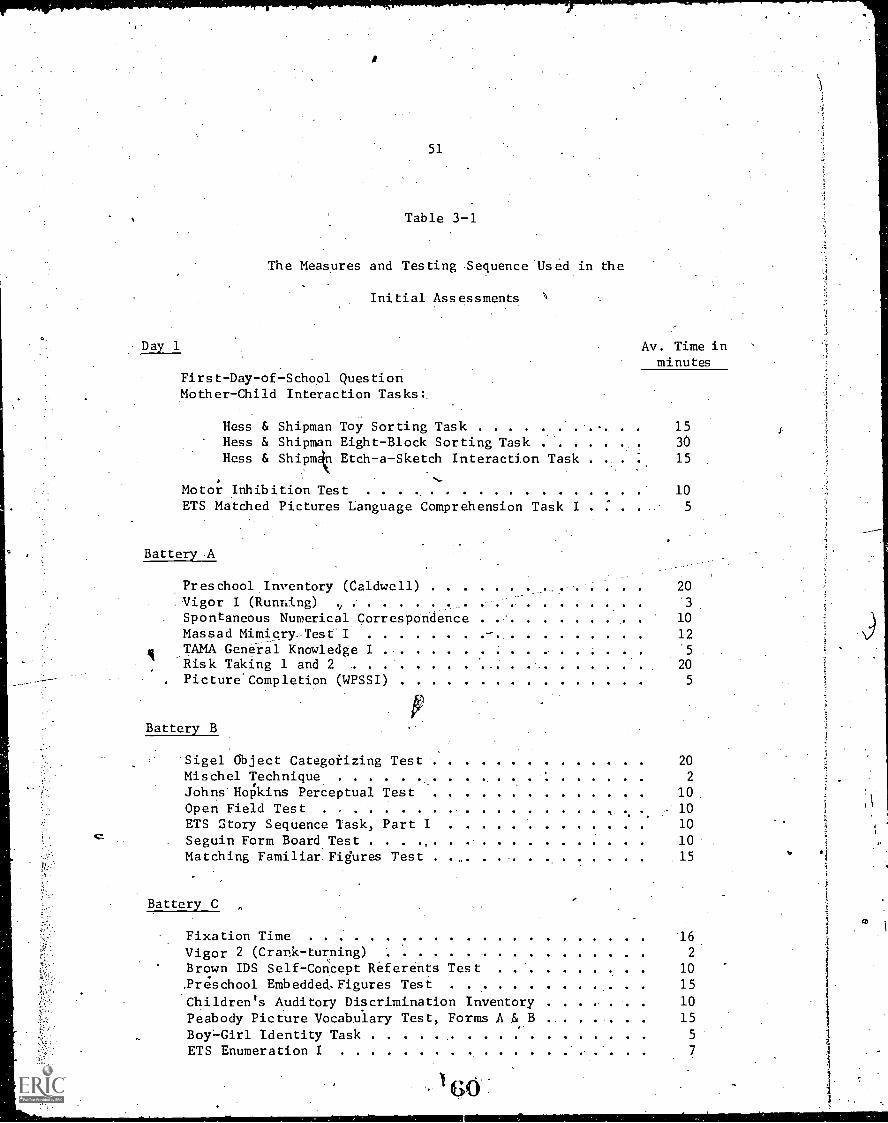
Day 1
51
Table 3-1
The Measures and Testing Sequence Used in the
Initial Assessments
First-Day-of-School QuestionMother-Child Interaction Tasks:.
Hess & Shipman Toy Sorting TaskHess & Shipman Eight-Block Sorting TaskHess & Shipmt Etch-a-Sketch Interaction Task
Motor Inhibition TestETS Matched Pictures Language Comprehension Task I
Battery A
Preschool Inventory (Caldwell)Vigor I (Running) ,
Spontaneous Numerical CorrespondenceMassad Mimicry-Test-ITAMA General Knowledge IRisk Taking 1 and 2 .
Picture'Completion (WPSSI)
pBattery B
Sigel Object Categotizing TestMischel TechniqueJohns Hopkins Perceptual TestOpen Field TestETS Story Sequence Task, Part ISeguin Form Board TestMatching Familiar. Figures Test . .
Battery C
Fixation TimeVigor 2 (Crank-turning)Brown IDS Self-Concept Referents Test,Preschool Embedded. Figures Test
Children's Auditory Discrimination InventoryPeabody Picture Vocabulary Test, Forms A & BBoy.-Girl Identity TaskETS Enumeration I
Av. Time in
.
.
.
.
minutes
.
1530
15
10
5
20
'3
10
12
'5
20
5
20
2
10.
% ... 10
10
10
15
162
10
15
10
15
5
7
52
The first longitudinal sample children were tested seven to'eight weeks
after the beginning of tester training. During the actual testing, the center
staffs worked independently except for periodic visits by monitors who were
responsible for providing general advice on both testing and administrative
problems to the, center staff and to the local coordinator, and for observations
to determine whether standard testing procedures were being followed.
Despite initial predictions that all testing would be completed by
early July, centers continued in operation throughout the summer in an attempt
to test the desired number of children. Several factors contributed to delays.
In some cases there were failures to obtain, at an adequate rate, the names.of .
families interviewed, and in several sites there was some reluctance of parents
to allow their children to participate. Increased project publicity and per-
sonal visits by the local coordinator and testing staff helped to combat the'
latter problem. Also, there was a greater turnover in testing staff than had
been anticipated because of the temporary nature of the job, because of pre-
vious summer or other domestic commitments, 'and also due to various private
emergencies which arose more frequently since many of our testers lacked
personal support and back -up resources. The high turnover rate made it nec-
es5ary-to continue training activities throughout the summer, although actual
training time was shortened% since the trainee could obtain more individual
attention and the trainer could share his duties with regional office and local .
center staff.
Because children were still being tested at the end of August, particulaily
in St. Louis and Trenton, and it was necessary to have those children who would
attend Head Start tested before they were exposed to the program, we did the
following:
Gt.
53
1. Head Start advance registr'ation lists for all centers within the study
districts were-obtained and checked against the names of children already
tested -; those not yet tested were scheduled for testing as quickly as possibl
2. At the opening of Head Start, center directors provided each Head
Start teacher with a list of all children who had .been tested in the district;
and provisions were made to have any untested children sent directly to the
esting center before they participated in the Head Start program.
Assistance the national Head Start Research Office was very important
for this phase.
3. ing of any "left over" non-Head Start children was completed
in September after the ldst Head Start children had been tested.
We should stress again that these extraordinary efforts were mainly
relevant to Trenton and St. Louis, although we also extended- testing time in
Portland and Lee County to obtain as complete samples there as possible.
Medical Histories and Examinations
The third phase of data collection involved medical histories and examina-
tions. As is true for other aspects of the study, there Were'regional varia-
tions in the procedures fc,r conducting the medical examination. In St. Louis,
. a Neighborhood Health Center was contracted to do the examinations. In
,Portland and Trentori, a single physician- examined all the study children.
Distances in Lee County made it impossible to concentrate the medical examina-
tions in one location, so three physicians covered the children in their
respective areas. Examinations were scheduled routinely following completion.
of the testing cycle.
0
54
Processing of Data
The various processing operations required for the Year I data included
scoring and coding of the raw data, the construction and maintenance of the
data base, and the design, programming, and execution of the various internal
and cross-domain analyses. Many of.the-analyses described will not be dis-
cussed in this report. Some of these, the initial descriptive analyses of
instruments, were reported in Progress Report 70-20; some were useful as
() preliminary analyses described in this report but are not of sufficient
general interest to be reported in detail; and some will be reported in
greater detail in future reports (e.g.; in the technical reports of the
individual measures). .A detailed account of the design of .the data base
was also-presented earlier (PR-70-20);therefore, many of its aspects will
not be included in this report.
Coding
All data were scored by several raters to establish reliability end,
following resolution of scorer differences, double-coded at. the Princeton
Office. Each answer sheet was checked for tester error in administrat?Ion
(e.g., allowing the mother to be present, or interruptions on the Fixation
Test within a sequence) or recording (e.g., not rounding to .2 second on timed
tasks or not circling the final responst to an initial multiple resporse) or
for comments that might affect the scoring. Given the inexperience of our
testers, considerable time had to be spent preparing the data for coding.
Such time, howeVer, was valuable in provi ing greater familiarity with the
diactual responses made to a given task 'an subsequent clues to understanding
the processes involved.
55
Preparation of the Data Base
To permit flexible and economical retrieval of the data for present and.
future analyses, it was necessary to create a merged tape file that con-
' .
tained all the derived instrument scores and classification variables such
as race, sex, preschool experience, and age in one contiguous information
block for a. given child. Continuing deveibpment and maintenance' of thiS
comprehensive,\ accessible, correctible data base was -a major component of
the, analysis system.
It was necessary to create programs that would up-date, add or delete
entries into the merged file. This programming was accomplished by using
the building blocks of the FOTAT Statistical System (see Appendix A) to
produce a flexible set of programs. In a system of this type there is the
problem of tracking variables through the file updates, and of assuring that
the information retrieval can be accomplished with minimum effort. To accom-
plish this tracking, subroutines were built into the merge update programs
which concurrently upd2te a catalog of s,zores on a separatedisc file. This
catalog contains all the pointers (locations) of the variables.' contained in
the merged file, as well as their related headings and titles necessary to
properly label the analysis output. The catalog also provides an up-to-date
listing of all scores that are available; thus, a researcher could use it
in selecting scores for analysis. As is customary, precautions were taken
at every step to prevent accidental deletion\or loss of any data on the tape.
Back-up tapes were created at all critical points of up-dating, assuring
rapid and complete recovery from any type of computer or programming error
at any point in the process.
56
csa
0
The score retrieval programs were created in FORTRAN Subroutine form,"
using the basic Input/Output routines available'in 'the F4STAT computer
statistics system. In this way a programmer is able to retrieve any set of
variables for any sample on the merge file by first passing a list of the
variable numbers to the first of two retrieval routines. The relative loca-
tions of the selected variables in the child' block of info ation would
now be available o the programmer since they are returned by this, access
routine. The rogrammer could then access the actual variables from the
merge tape by passing this list of pointers. to the second retrieval routine.
This routine would actually read. the merged tape, and, 'using the list of
pointers passed to it, would then extract the requested variables for use, in
analysis. For any given observation, which the programmer could select by
querying any of the classification variables, the program could now decide...
-whether this set of variables was -a member of the sample needed. This
system was deyeloped in such a manner that the programmer need not be
knowledgable of the actual format of the tape but only.need concern himself
with the liSt of variables he would like to select for his particular, appli-
cation. The access routines retrieve not only' the data variables but also
their'mnemonic coded headingt' and titles to be used in labeling of output
for easier interpretation by researchers.
In all file maintenance and analysis runs, a child's test data must be
matched to-his. master -file data. The master-file data provides the necessary.
identification checks and information on the age at 'time of testing which
must be-computed for eah'instrument since the date of testing varies among
instruments.. It also includes. information on sex, race, site, and preschool
65..
57
0
experience. A subprograM ised by the meiWenande routines and' the analysis
routine performs this function. The ability of both the maintenance and the
9
analysis programs.to use this common subprogram not only s ves programming
and .testing time, but it also insures that the data Use at all stages 'of -.the
analysis, are "clean" data.
It was stated earlier that each instrument was essentially an independent
set of data. This fadt was a major obstacle in the design of a generalized
primary analysis program that could be used, for all instruments (excluding`rs
the questionnaire type,of instrument), since.everTinatrument had' a different.
decoding scheme., A further complication was that many scores had to be com-
puted by a logical%sequence involving many pieces of information in the child's
record. It was dedided to use a method developed at Educational Testing
Service, involving the programming of a unique decoding subprogram for each
instrument- Its function is to decode the.chil4's record and create derived
i
scores for the instrument. In this way a generalized analysis Program can
/
be designed and tables for any instrument can be computed by providing the
correct input control cards, label cards, and'decoding subprog am. A time-,
saving feature of this method was that the programming and to ting of the
primary analysis program could be accomplished while the decoding subprograms
were being independently assembled and tested. This method L decoding.the
instruments.has.proven to be successful in this study, as i t has been in
earlier applications.
Analyseg of Individual Instruments
The initial program written for descriptive analysis of a given
instrument computed and .printed for each site and for the four sites
combined two factorially constructed tables containing descriptive
6
statistics on the derived scores of each instrument. The irst.statistical
table presented data by age at time of testing, by sex, and by race,.with. .
age subdivided into six three-month intervals. starting with 42-4'4. months and
ending at 577:59 months. Race was divided into two categories black and
white. (The aces classified under 'Other'': in the sample were excluded
from these analyseshecaus,e Of a paucity of data.) The second table presented
data by preschool experience, by sex, and by race. This table did not include-.
the Lee Count data since Head Start information was not available at the
time. Preschool experience was di(fided.into three categories: .Head Stat,
no' knownpresthool, and other preschool experience., The tables were completely,
cross-classified with .a Total.roW computed 15,Y collapsing all the cells°inte
i'..:. ,Vor each! cell dri.e information included the number of observations, mean,0 1 .
1
..
standard deviation, minimum score, maximum score, and a percent response0
,.
for each possible score category. The percent-response option had a cell
I
count separate, from the count used for the mean. This occurred,because the.-'
percentage of tester errors and the percentage of refusals were computed and
printed in the percent- response .part of the table, but these cases were :. .1,
excluded from' the cell :mean. When p rcentileS were used,the separate,cell.
siz'was not printed'since only ehe-scores used in compdting the mean were
used to compute the percentiles. -.Tester errors and refusals. were excluded
from the percentiles-as well as from the mean.- When the percentile bpeio .
was used and'. the number of observations in the cell was less than six, the
:
printed output consisted of asterisks.
.
J'Among" and ."within" statistics were provided. at the bottom of, each
pmenable researchers to perform "a posteriori" tests on the data.
.7.
The squares
59
'of the statistic printed under the standard deviation column in the."amotlg"
rad_wts.the mean square associated with ail the non -zero cells in the table.
The squared "within" ,statistic was the, estimate of the WithinIcell variane
computed by pOoling.the variances vithin'all the-non-zerO cells. Race, sex,
age at time of testing, and preschool experience marginal cells were,also.
. .
.provided by this, program.c) \
The. Statistics for the Child Health. Record and Parent Interview were
prepared somewhat differently -.from those of the other instruments. Here
questionnaire distributions.were rpn, consisting.of counts and percent.rth:-
ponding for each response of every item. This infOrmatiOn was provided by
1 .
,sex, by "face, and by preSchool experience, both across all sites and within
9
,each site. A Chi-sqUare statistic was provided for all items for which the\.
questiOnnaire had several.categorieS (such as male;' female). The Chi-sqUare
computation did not inClude.the'"No Response" category. provided onevery
item. If a predicted cell size was smaller than five, the Chi-square'stat-
-..
istic was,flagged with the letters (NV) ind4ating that the statistic may. ,
not be.valid. Items considered to be of a continuous nature weill. excluded
from the quest onnaire distributions, and separate frequen0 distributions
were provided fo'r each of'these items Using the same Site; sex, race, and
preschool categories as for the questionnaire items. The frequency distri-
bution output also provided other useful information, such as the mean,
standard deviation, mimimum value, maximum value, sum of seores,.sum of
squared'scores, percent below intervals, and an analysis of variance table
\
.for comparison of the efrtegories involved.
8
C.
60
AS shown in figure 3-1, special or secondary analyses have been runon
all of the instruments involved
differ widely in content as well
n this-report. Since ithe various instruments
as. in style and presentation, a wide variety of
, . .,.
internal analyses were required. For all scores that/were composites derived/
I,
from right-wrong type of items, ables of item diffiCulty,biserial correla-'/
tions of the items with the score, and.KR-2l reliabi/lity coefficients were !
(.
computed and printed. For other types., of composite] scores the alpha coefficient
of reliability (KR -20) was computed. The alpha pr vides a lower bound for the
true reliability.
bf theCompOsit
I
score. Other se ondary analyses were deslgned
by researchers responsible for particular instrumets. Used in these analyses
were such techninues as analysis of variance, product- moment correlations and
partial correlations, regression and factor analysis, reliability st,:dis for
scores, scorers, and testers, co tingeney tablea, f equency distributiOns and1
percentile tables. and several noin-parametric ranks atistics. Many of these
\
/ .
secondary analyses involved trans ormations of variab es, including lOgarithmic
\ '-
J
transformations used with several positively skewed ti.
e scores.: They common
purpose of thes internal analyse was to derive and evaluate comprehensive
scores which would represent as well as possible.the total information in the
test.
In this-analysis program -as, dell as in the file main enance Program--
label checks,' data checks, variable checks, program checks, and input control-
card cheCkswere all carefully planed to prevent 'any.possiVlitytof incorrect
use of any _data, labels, or program givan.computer run.I.StructUrai Analyses
\-------,,
Missing data Pearson product-mqinent correlation. ables wer41
P,
for every.variable that was placed oh the merged file. Correlations 'were\
.1 -. .
cliatructed
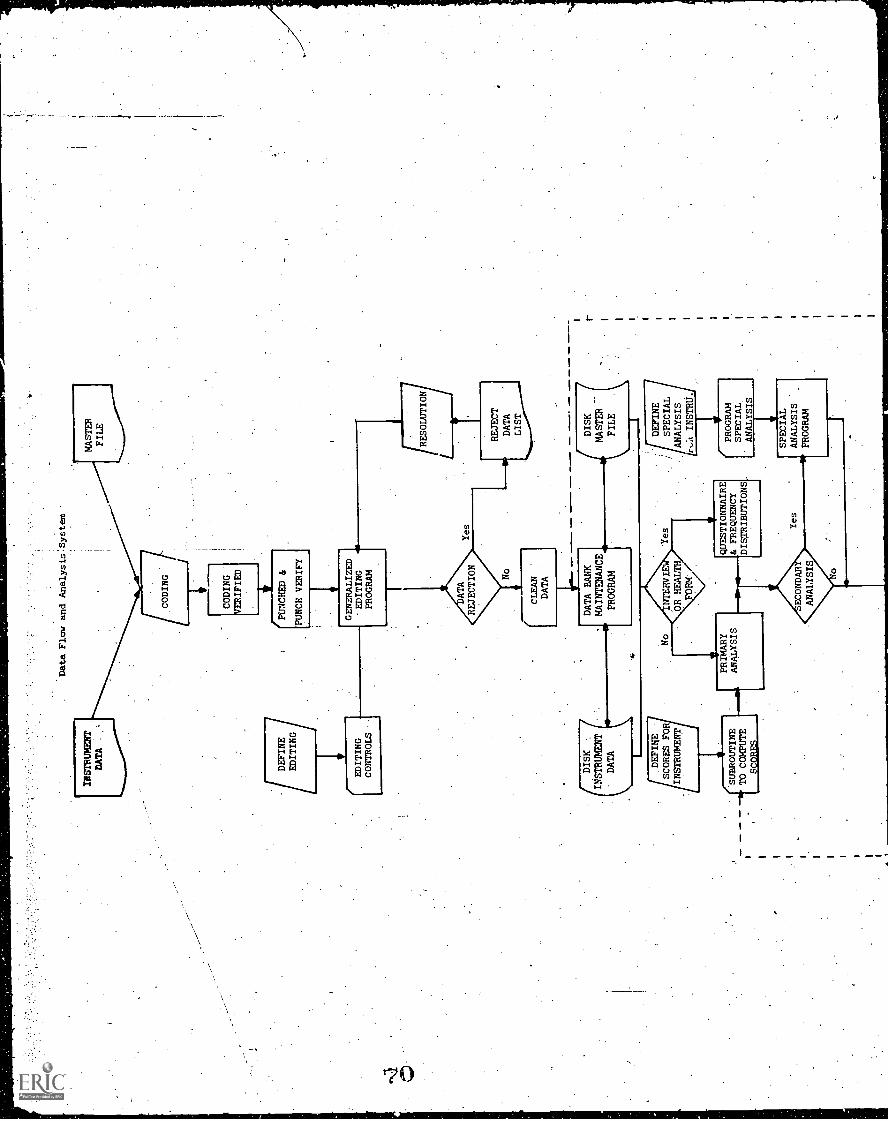
Data Flow and Analysis System
/DEFINE
EDITING
EDITING
CONTROLS .-
CODING
VERIFIED
FUNCKED
PUNCH VERIFY
GENERALIZED
-EDITING
PROGRAM
/RESOLUTION
REJECT
DATA
DISK
..
DATA BANK
DISK
INSTRUMENT
MAINTENANCE
MASTER
DATA
PROGRAM
FILE
/
DEFINE
SCORES FOR R
INSTRUMENT
/SUBROUTINE
0" TO COMPUTE
SCORES
MARY
ANALYSIS
QUESTIONNAIRE
& FREQUENCY
DISTRIBUTIONS,
Yes
fr
DEFINE
SPECIAL
ANALYSIS
IN1STRU./
PROGRAM
SPECIAL
ANALYSIS
SPECIAL
ANALYSIS
PROGRAM
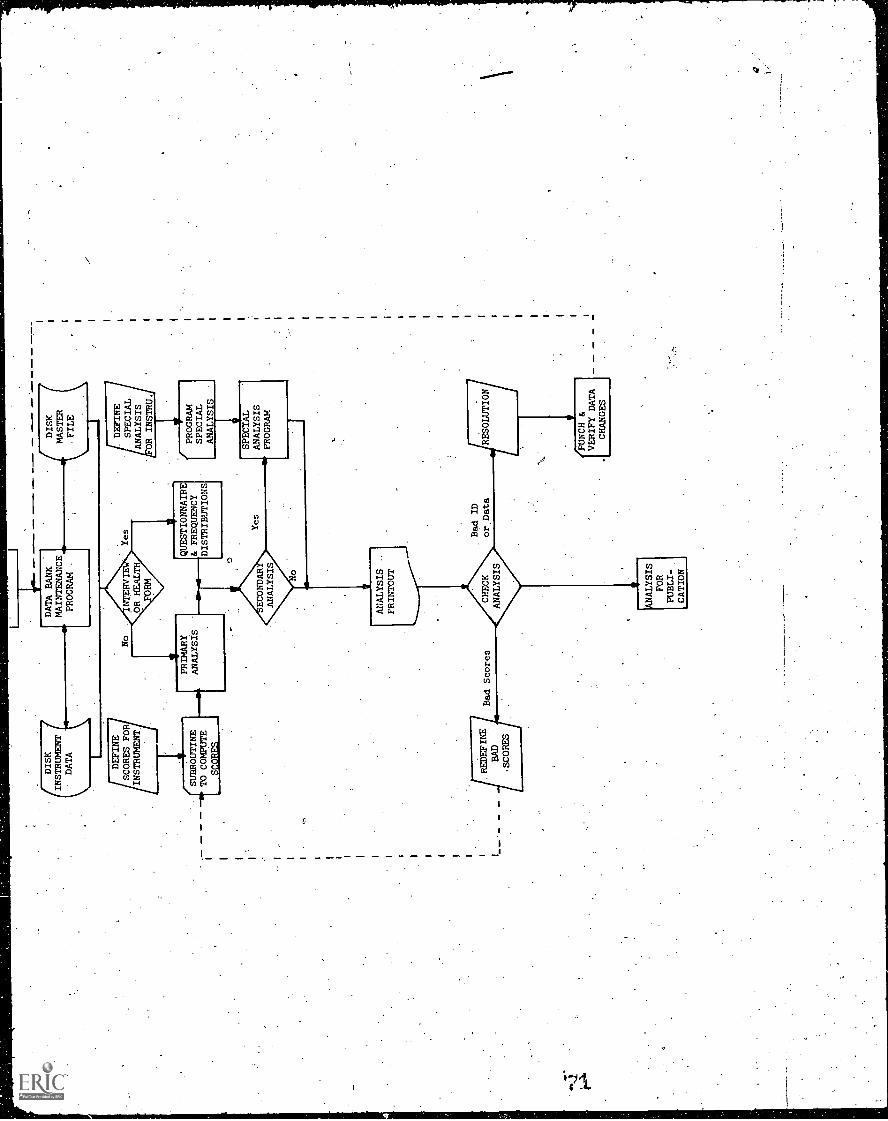
/DISK
INSTRUMENT
DATA
INSTRUMENT.
SCORES FOR
QUESTIONNAIRE
& FREQUENCY
DISTRIBUTIONS
Yes
DEFINE
SPECIAL
ANALYSIS
OR INSTRU.
PROGRAM
SPECIAL
ANALYSIS
SPECIAL
ANALYSIS
PROGRAM
ANALYSIS
PRINTOUT
ANALYSIS
FOR
PUBLI-
CATION
Bad ID
or Data
RESOLUTION
PUNCH &
VERIFY DATA
CHANGES
62
run for the total sample, and for the critical breakdowns such as sex, pre-
school experience, SES level, site, and for subclassifications based upon
interactions among these main level factors.
The structural analyses run for the first year .data analysis involved
factor analysis techniques and the Guttman-Lingoes Smallest'Space Analysis.
Factor analysis is used most widely as a method for summarizing intercor-
relations among large numbers of logically distinct scales in an attempt to
infer underlying precursors or determinants of manifest test scores.. The
smallest space analysis is similar to factor analysis except for fewer
. "parametric assumptions. It has been used in this study as a check on com-
posites isolated through factor analysis, to insure that conclusions would
not be based on results which were dependent on the method of analysis.
Before using either of these techniques it was necessary to reduce the.. ...
total number.of variables from all the instrumentswhich was approximately .
300, to a manageable (and meaningful)-subset. The reduced subset was selected
by eliminating unreliable variables, subscores and other logically dependent
measures. In those cases where two or more scores from 'a given instrument-'
were logically distinct, not experimentally interdependent, and not very
highly correlated with one_another, several scores from an instrument were
included.; In this way, 46 variables were identified and plaged into the
structural analyses with an additional set of 5 variables placed dnto exten-
sion with Lhe main set of variables.,
The factor analyses were computed twice, first placing -l's in the diagonal
of the correlation matrix (principal components analysis), and.secondly placing
an.estimate of communalities into the diagonal. Communalities were estimated
by Tucker's Adjuste'd Highest Off-Diagonal element firocedure,' which is
63
explained in Appendix A. In both cases the initial factor loadings were rotated
by varimax for 2 to 5 factors and then placed into promax oblique rotation using
the same range of factors. Extension variables were also carried along during
these steps to study ,their relations with the factors derived from the main set
of variables. Again, all of these steps were conducted for breakdowns such as
sex, age, SES .level and preschool attendance controlled for Head Start eligi-
bility. Six and seven faCtor varimax and promax solutions were also obtained
for the composite sample and for narrower age groupings.
For every factor analysis, a parallel analysis was computed using the.
Guttman-Lingoes Smallest Space program. The Guttman-Lingoes program represents
a non-metric technique for finding the smallest euclidean space for a configur-
ation of points. To quote from the authors' description: "Briefly stated the
problem posed for the program is: given a matrix of inequalities among pairs
of points in.a metric or nonmetric space, determine a set of euclidean coordin7
ates such that the distances calculated from them are a monotonic function of
the ranks or order among the inequalities" (Lingoes, 1965).
Unlike factor analysis techniques, this analytic procedure is sensitive
to direction of scoring a variable. Therefore, before any of these smallest
space analyses were computed, the-algebraic signs. of error scores were changed
so that wherever it was clear that, a variable reflected level of performance,
high scores would _indicate better performance.
After analyzing the-results of the initial phases of the analysis it was
decided to extract the variables that loaded heaVily on the first factor and
-submit them to a separate analysis in an attempt to further separate them into
subfactors. Both the factor analytic technique and the Guttman-Lingoes program
were used in this secondary.analysis. It was also observed that the PresChool
64
Inventory total score was the single most important component of the first
factor. This led to a more complex analysis of this total score. An analysis
oF variance technique was used on the items of the Preschool. Inventory in an
item by sex by SES level ANOVA.
In addition, each variable in the structural analyses was submitted-as-
a dependenrwrriable in two'separate.sets of ANOVAS. The first used .age, sex
and SES. level as independent variables. Preschool attendance and Head Start
eligibility served as independent variables in^the second set of ANOVAS. The
results of these analyses of variance and the results of all the abOve analyses
are reported in the succeeding sections of the report.
The importance of the merged tape for anytype of analysis that will be
done in the future can now readily be seen to be substantial. We.have essen-
tially reduced our data base from a collection of over 100,000 card images
separated by instruments to one all-encompassing data flile which contains
approximately 2000 records or blocks of information, with each block of infor--
mation containing all the information about a child. Equally important Is the
ease with which a programmer can access the file to perform an analysis.
.Illustrative information retrieval system flow charts are included in this
section (Figures 3-2 and 3-3) in an attempt to provide an overview of the.
procedure.
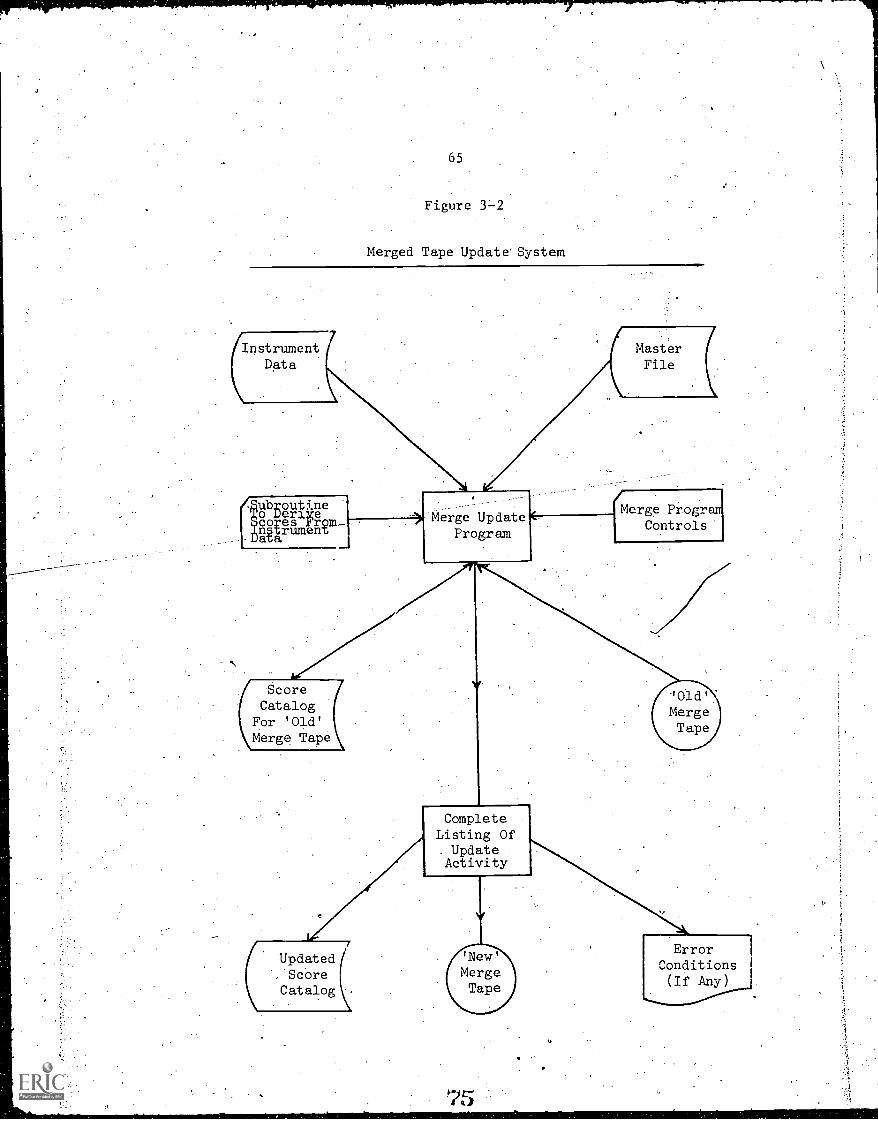
65
Figure 3-2
Merged Tape Update' System
ubrouttneo uerlyecores rrom-nsrumentaza
Merge UpdateProgram
Merge Prograrr
Controls
/ Score /Catalog
For 'Old'Merge Tape
-101d'
Merge1\Tape
Updated /Score
Catalog
ErrorConditions(If Any)
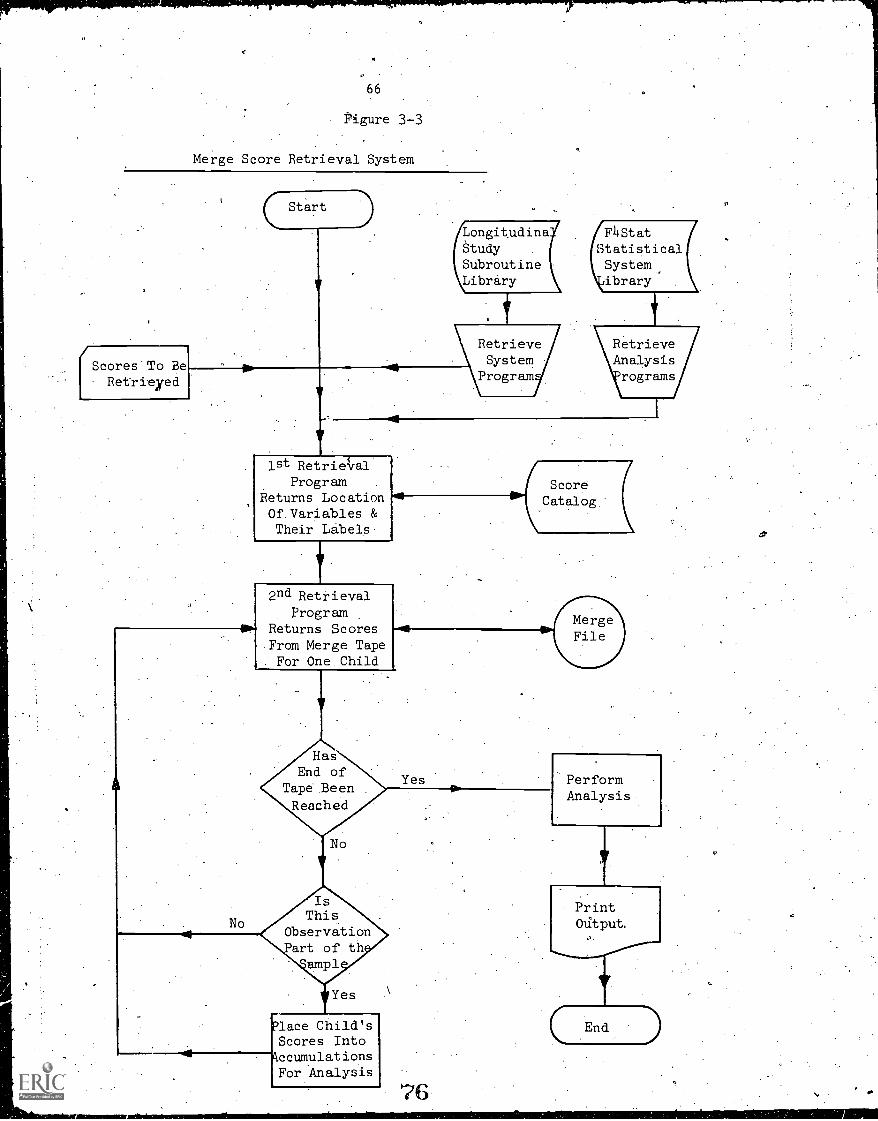
66
Figure 3-3
Merge Score Retrieval System
Scores .To Be
Retrieyed
Start
/Longitudina FliStat /Study . StatisticalSubroutine System
ibrary
V
RetrieveSystemProgram
1st RetrieiralProgram
Returns LocationOf. Variables &Their Labels.
No
From Merge TapeFor One. Child
Returns Scores
2nd Retrieval. Program
HasEnd of
Tape Been
Reached
IsThis
Observationart of thampl
Yes.
Place Child'sScores IntoccumulationSFor Analysis
ScoreCatalog:
/
Yes
76
PerformAnalysis
PrintOtitput
End
Chapter 4--RESULTS AND DISCUSSION
Initial Classification of Processes
In the first propct report, Theoretical Considerations and Measurement
.Strategies (ETS, PR-68-4, Chapter C), a tentative outline was proposed by
Messick for mapping the perceptual-cognitive-intellectual domain in a cross-
classification scheme organized into hierarchical levels reflecting breadth0
of function and different orders of complexity. Basically an extension of
Guilford's (1967) theory for the structure of the intellect, this outline
combined features of dimensional, hierarchical, morphological and sequential
models of intellect and incorporated variables derived both from the child
development literature and from studied of adult performance. It also
provided a guide for selecting instruments ro represeht the different types
of contents, products, and operations delineated by Guilfoid.
Attention also was given to assessing thOse personality dimensions
referred to as controlling mechanisms that cut across. affective, personal-
social and cognitive domains and thereby serve to interlace the cognitive
system with other sub-systems.of personality organization. In that same
report (Chapter D) Emmerich delineated three other. distinct but interrelated
areas of personality investigation--social motives, attitudes; and interests- -
and suggested measurement strategies ,across the years of the study.
On the basis of this and other.reviews of domains to be represented,
variables considered salient for the study population were selected. Given.
the state 'of the art in measure development, tasks were .selected which would
allow: 1) continuity of measurement across age periods by'uSing the same or.'
vertically equivalent forms; and 2) multiple measurement of the same variable
(within a context) across several age periods so that possible developmental
67
i
68
shifts in expression could be monitored. Other fa.tors affecting task
selection were constraints related to available testing time, talance among/ .
el
areas and modes of.response, sufficient knowledge of the appropriateness-of
the task for the intended population, and ease of administration.
Pribr to statistical analysis, the Year 1 child test measures were
grouped according to the abdve classifications (i.e., cognitive perceqtual0
affective physical) with certain sub- domains alio suggested ( .g., within
the cognitive domain, both Piagetian-derived' measures and "academic" skills
represented by.verbal, quantitative and general information measures).
Included in sub-domains were measures clustered according to contents, products
or operations. Thus, verbal skill measures included comprehension of Syntax,
sequence an8 vocabulary, classification ability, and the ability to discrim
4.inale and mimic phonemes. In addition', cognitive styles (e:g., reflection -
impulsivity, analytic functioning) and other controlling mechanisms zuch rs
risk-taking, curiosity, and'attention deployment were delineated.- .A logical
series of analyses were planned to study data within and across ddifiafiiS by.
mode and time of data collection. This report presents theresults of the
first "within-method;' (i.e., individual testing) analyses, bOth.Vithin and
across. domains..
Overview of Structural Findings
As described in the previous section on data analysis, procedures,
following reduction to logically distinct scores for each task, principal
components factor analyses using both unity and Tucker adjusted communal_ities..
on the diagonal were obtained. These analyses were performedJor _the composite
sample and for major subject classifications; i.e., by age, sex, SES
78
a
1
3
later preschool attendance controlled for..
Head Start'eligibility, and-- 7 a, .
.,
. . .
.
.
Presdh ol Inventory [Caldwell] score with_age partialled out. To facilitate:.v .
interpr Cation, varimax and promax rotations df the; first 2; 3; 4 and 5.
-7-principa .components were performed successively. 'Six and seven factor
variAx d promax rotations were also obtained for, the composite sample.
TfieSe am series of analyses were perforthed for a reduced set of variables
posited to be in the cognitive domain. For -these .various analyses, 5 to 10
. .
additional cores-were included in extension analyses . to study their relation-
\
ships with factors- derived from the main set of ,variables. In addition to
the factor anlyses, GuttMan-Lingoes smallest space analyses (Lingoeg, 1965)
_for 1, 2, andp-dimensional solutions were performed on the same set o
ubject classifications and sets of variables.,
The main findings of the factor and smalleSt'space analysesof.the
data for the toAal group can be summarized as .follows; 1) There was clear
evidence of a 'general dimension accounting for; most of 'the common variance
among cognitive tasks. 2) A second orthogonal dimension relating to thei
chrd.'s speed of-responding to a Multiple'choide task was obtaineth
c,9:Additional-factors that .appeared were apparently tapping task-specific.
A
yles and behaviors (e.g.,:a factor erincipally.defined.by-rieasures from..,
....---.
, ___----
*p Open Field Task; a factor.defined by two 1scor..6Son the Fixation Task; a'
spontaneous____--
Numjerical CorreSpondence=factor; a BOyGirl Identity Task factor)
4) Sub - clusters of 'tasks were nOt obtained; non -error_
- , 0
specific variance was .revealed for the many tasks used in the Study. These
findings were,strikingly-consistent across statistical methods and across. .
1.
79
'70
=subject classifications. -given, the saliency of the first factor and the
:small remaining common variarice,slight. differences in'rotated solutions.
were very :The. orie exFePtion Was proVided.by children from ineligible. .,
, . .
families who later attende(Head Start; for these children...the latency.,
measures split into the Spontanedus .Correspondence and Open Field factors..
Zane 4- presents the tucker communality estimates for each score
along with the estimated reliability where available. Thie estimates in
Table 4 -fare based on the composite sampler Score abbreviations are
. - . .,
included; task descriptions and a more,
detailedexplanation oftine scoresr
Used .are presented in Appendix B. FOr all scores, coefficient alpha was
the incleX:bf reliablity.' With .feiT. 'exceptions, estimated communalitieS wereI-!
-jmoderate to low, with considerable 'reliable but unique varianc-Q remaining.
Table 4-2 pr.esents loadings for the first six unrotated principal
components using unitiAs in the diagonal).-and associated eigenvalues for
, :.
the composite sample. Loadings with absolute value\equal to or greater-
than .30 have been underlined. The generality of, the first and second1 .
- components and the sOe'difidity of the other components are clearly evidentF,c
_ .
The first principal component described in Table 4 -2 accounted for 18.8% of 6
. ! ,
'the total variance; itS'egeftyalue was '8.6.--The eigenvaluefor the second. .
____
i
.
component was2.3, and d!t accounted for an additional 5% of the'total1
, .
.
, ii .-
variance.- Subsequent components accounted for 3.9I% or less of the variance.,/ °
. , 1 I / ,
-. .. ..
Fifteen components had eigenvalpes of l ()Is above. Utilizing communali.ties
on the diagonal,- the root for, the fOrst principal axis for the total sample
'was 8.1; itaccountedfor 50.6%'of the common variance. Table 4-3 presents
*Among the six preschdol attendance by eligibility categories; two groups,those Head Start eligible who attended a different praschool prograth andthose who were not khown to have attended preschool, had Ns too small topermit adequate comparisons of the factor structures.
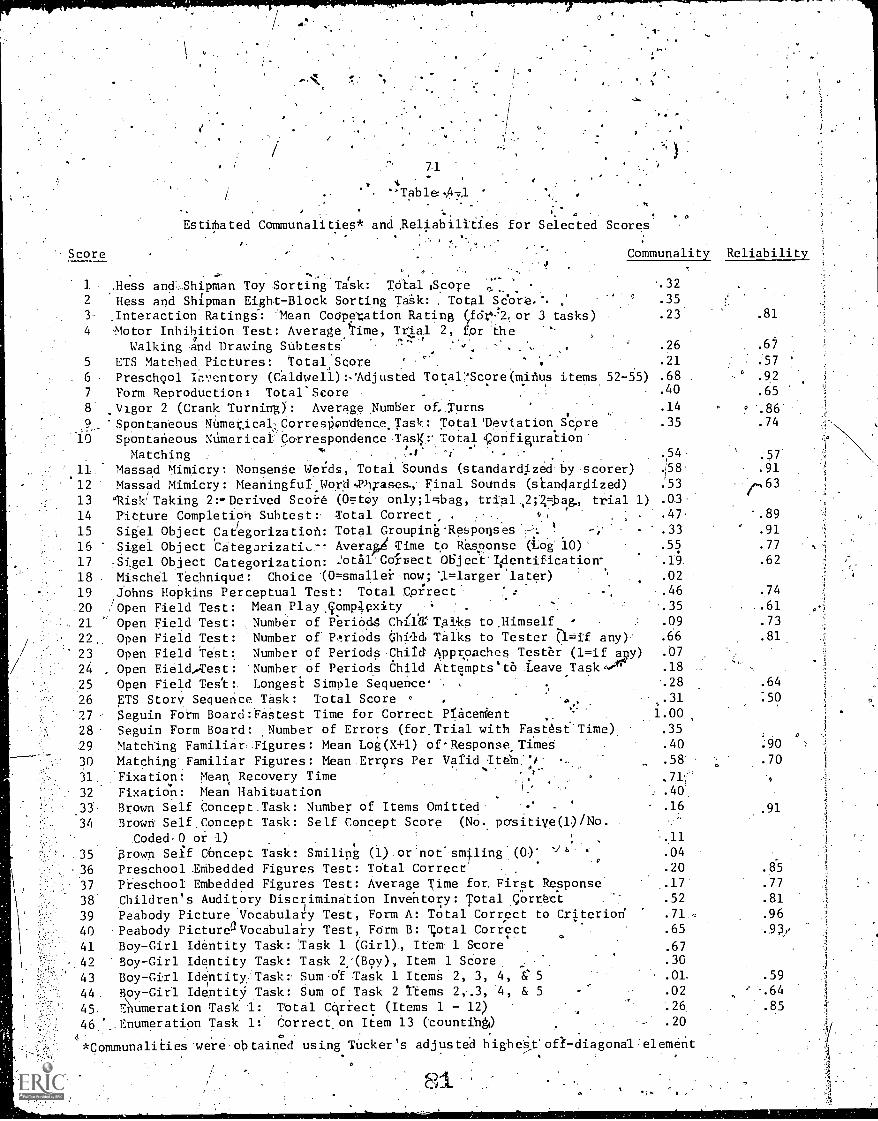
7.1
t"Table-,4-7,1 ' ,
.t
. 01 0
Estitated Communalities* and Aeliabillties for Selected Scores
.: ,',.... .,..,Score ,
Communality Reliability..
.,. ..
I.
, .,Hess and Toy Sorting Task: TotallSoore ,_ .32
2 Hess and Shipman Eight-Block Sorting Tak: Total Score. % :.
.35;.
3- ,Interaction Ratings: 'Mean CoOpeution Rating ,for'? -'2, or 3 tasks) .23 .81
4 Motor Inhibition Test: Average 'rime, Trial 2, for the ''.
Walking and Drawing SUbtests .26 .0,7
5 ETS Matched; Pictures: Total,Score , . -
. .21 .57
. 6 Preschgol loventory (Caldwell):-Adjusted Totar'Score(minus items 52-55) .68 .92
7 Form Reproductions Total'Seore . 40 .65
8 ,Vigor 2 (Crank Turning): Average Number of:Turns .14 * '.86',
9 'Spontsneous NUmeticalCorrespondbnce.Task r Total 'Deviation ScOre .35 74.,--10 Spontaneous NUmericalcotrespondenceTasg.:. Total configuration'
Matching : ..
.54-
11. Massad Mimicry: NonsenSe Wol:ds, Total Sounds (standardized by scorer) :158
,.
12 Massad Mimicry: MeaningfuIWorases., Final Sounds (standarglized) .53
13 'Risk' Taking 2:-.Derived Score (0toy only;1-tbag, tria112;'q=bag., trial 1) .0.3
14 Picture CompletiTil Subteat: Total Correct, . .c, .47, '.89
1.5 Sigel Object Categorization: Total Groupin.Responses -.--': i -,' - .33 .91,. ,
16 Sigel Object Categorizati,7' Avera4 Time to Respon8e (Log' 10)' .55 .7.7
17 gel Object Categorization: 2otelCdrect Otiject.TiOentification' '.19 .62
18 Mischel Technique: Choice -(0=smallei now; '1=larger 'later) ' .02
19 /Johns Hopkins Perceptual Test: Total Correct' : , .46 .74
;OpenOpen Field Test: Mean,Play.compi.exity : . .35 ..61
21 Open Field Test: Number of Periods Chifil'TpIks to ,Himself .09 .73
22,. Open Field Test: Number of 1:triOds 61416 Talks to Tester (1 =if any) .66 .81.
23 Open Field Test: Number of PeriodsChird Approaches Tester (1=if a y ) .07
24 , Open Field, Test: 'Number of Periods Child Attempts°tO Leave Task .18
25 Open Field Tes't:, Longest Simple Sequence'. . ..28 .64
26 ETS Story Sequence Task: Total Score 0 . s.31 :50
27 Seguin Form Board:Fastest Time for Correct Pncem'ent 1.00
28 Seguin Form Board: ,Number of Errors (for,Trial with Fastest'Time). .35
29. Matching FamiliarFigures: Mean Log(X +l) of-Response Times .40 :90-
30 Matching Familiar Figures: Mean 6MIErrors Per Valid t:'/,
.58' .70. -. ,-
31. Fixation: Mean Recovery Time .71C.
32 Fixation: Mean Habituation '" : .40,
.33 Brown Self Concept_Task: Number of Items Omitted -
.
.16 .91
:34 Brown Self ,Concept Task: Self Concept Score (NO. pasitiye(1/NoCoded-0 or I)
. .
,11,35 Brown Self COncept Task: Smiling (1) or'not smiling (0' ve .04
,..36 Preschool .Embedded Figures Test: Total Correct . .20 .85
37 Preschool Embedded Figures Test: Average Time for. First Response ,.17 .77
38 Children's Auditory Discrimination Inventory: Total correct .52 .81
39 Pesbody Picture Vocabulary Test, Form A: Total Correct to Criterion .71.E .96
40 Peabody PictureaVocabulary Test, Form B: ;otal Correct.
.65 -..93y
41 Boy-Girl Identity Task: Iask 1 (Girl), Item 1 Score 67'-,49 Boy-Girl Identity Task: Task 2(Boy), Item 1 Score .30
43 Boy-Grl Identity;Taskv Sum-nf Task 1 Items 2, 3, 4, e 5 .01. .59
44 Boy-Girl Identity Task: Sum of Task 2 Items 4.3, '4, & 5 .02 .64
45. F_Iumeration Task 1: rotal Ulriect (Items 1 - 12) ,'.26 .85
46.'._. Enumeration Task 1: Correct on Item 13 (counting) .20
,i .
. : 0 .
*Communalitieswereobtained using.
Tucker's adjusted highe'st'ofk-diagongl:element
i ^
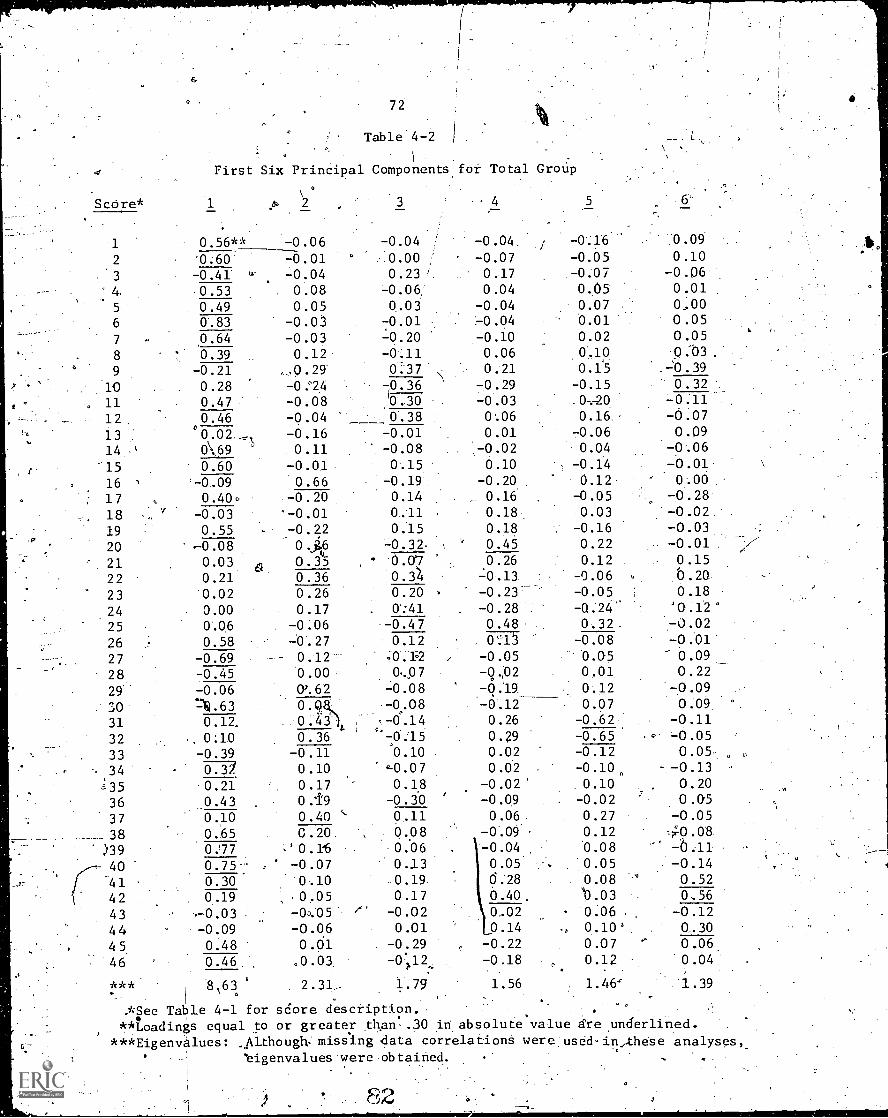
0
Score*
6
72lk
Table 4-2 1
First Six Principal Components for Total Group
2' 3 4
1 0.56** -0.06 -0.04 -0.04./
-0.16 0.09
2 '0.60 -0.01 0.00 -0.07 -0.05 0.10
-0.41 ,... -0.04 0.23 / 0.17 -0.07 -0.064 0.53 0.08 -0.06 0.04 0.05 0.01
5 0.49 0.05 0.03 -0.04 0.07 0,00
6 0.83 -0.03 -0.01 -0.04 0.01 0.05
7 . 0.64 -0.03 -0.20 -0.10 0.02 0.05
8 0.39 0.12 -0.11 0.06 0.10 0.03
9 -0.21 0.29 0:37 0.21 0.15 =0.39
10 0.28 -0:24 70.36 -0.29 -0.15 0.32 ..
11 0.47 -0.08 0,30 -0.03 .0--.20 -0:11
12 0.46 -0.04 : 0,38 0.06 0.16. -0.07
13 °O.02._\ -0.16 -0.01 0.01 -0.06 0.09
14 .' 0\69 0.11 -0.08 -0.02 0.04 -0..06
'15 0.60 -0.01 0.15 0.10 -0.14 -6.01.
16 , '-0,09 0.66 -0.19 .-0.20 0.12 0,00
17 , 0.40. .-0.20 0.14 _ 0.16 -0.05.
-0.28.
18 -0.03 '-0.01 0.11 0.18 0.03 -0.02.
19 0.55 - -0.22 0.15 0.18. -0.16 -0.03
20 -0.08 0.6 =0.32 ' 0.45 0.22
21 0.03 0.A - 0.07 0.26 0.12-0.01 ---X
0.15
22 0.21 0.36 0.3)f -40.13. -0.06 0.2G.
23 0.02 0.26 0.20 -0.23 -0.05 0.18
24 0.00 0.17 0':41 -0.28 . -Q.24 'G:12°
25 0.06 -0.06 .-0.47 0.48 0.32. -0.02
26 0.58 -0.27 0.12 , 57.175 -0.08 -0.01
27 -0.69 0:12 .0.1;2 -0.05 - '0.05 0.09
-28 -0.45 0.00 0..07 -9.02 0.01 0.22
29 -0.06 0%62 -0.08 -00a 0.12 -0.09
30. =11.63 0.94, -0.08 -0.12 0.07 0:09,
31 0.12. . H0.4311. 1-6.14 0.26 -0.62 -0.11
32 0;10 0.36 -0.15 0.29 -0.65 . -0.05
33 -0.39 -0.11 0.10 0.02 -0.12 0.05.
34 -6737 0.10 c...0.07 0.02 . -0.10 -0.13
35 0.21 0.17 0.18 -0.02 . 0.10 0.20
36 0.43 0.19 -0.30 -0.09 -0.02 0.05
37 0.10 0.40 ' 0,11 0.06. 0.27 -0.05
38 0.65 0.20. 0.08 -0.09' 0.12 :0.08)39 0.'77 -,' 0.1'6 .0.06 .-0.04 0.08 -6.11
40 0.75 , -0.07 0.13 0.05 . 0.05 . -0.14
'41 0.30 '0,10 .0.19. 0:28 . 0.08 ' 0.52
42 0.19 -0,05 0.17 0.40. '0.03 . 0.56
43 -.-0.03 . -03.05 /' -0.02 0..02 0.06 , -0.12
44 -0.09 -0.06 0.01 0.14 0.10' 0-30
4 5 0.48 0.01 -0.29 -0.22 0.07 ' 0.06,
46 0.46, .0.03, -0;12. -0.18 0.12 0.04
*** , 8,63 2.31-- 1.79 1.56 i.391.46'
I ...
.*See Table 4-1 for score description.* *Loadings equal to or greater .than .30 in absolute'value are underlined.
***Eigenvaiues: Although,' missing data correlations were used- in;.these analyses,'eigenvalues were ob tallied. , ..
1.
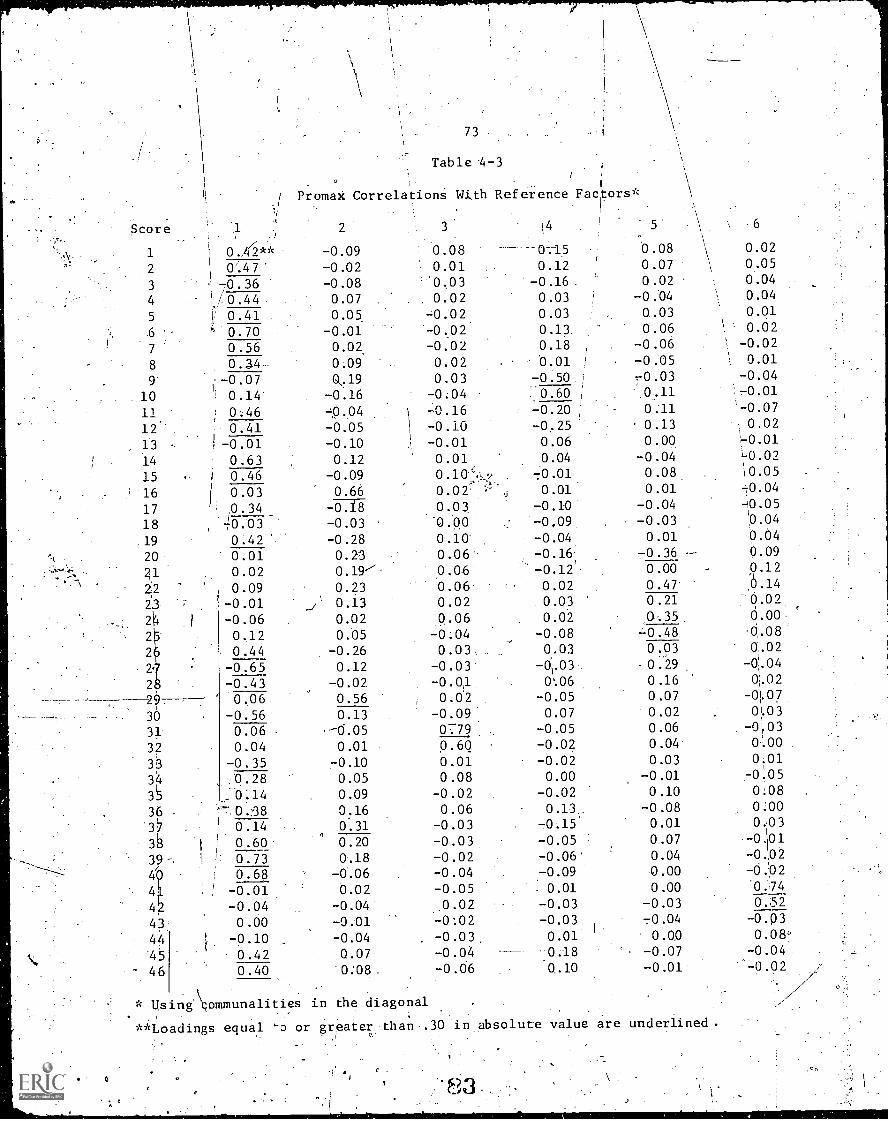
Score
1
2
3
4
5
.6
7
8
9'
10
it
12
13
14
15
' 16
17
18
19
20
21
23
2
2'
2.
29.
30
313?
3334
3
36
37
Table -4-3/
Promak CorrelationS With Reference Facpors*
1 2 3'
0.4<)** -0.09 0.08
0.47' -0.02 0.01
-0.36 -0.08 0.030.07 0.02
0.41 0.05. -0.02
0.70 -0.01 -0.02
0.56 0.02, -0.02
0.34 0.09 0.02.
.-0.07 0,19 0.03
' 0.14 -0.16 -0;04
0.46 -0.04 -0.16
0.41 -0.05 -0.10
-0.01 -0.10 -0.01
0.63 0.12 0.010.46 -0.09 0.10'":, _Y
0.03 0.66 0.02 '''''. ,J
0.34 -0.18 0.0370.03 -0.03 .000.42 -0.28 0.10'
0.01 0.23 0.06-0.02 0.06
0.09 0.23 0.06.
-0.01 0.13 0.02
-0.06 0.02 0.06
0.12 0..05 -0;04
0.44 -0.26 0.03,
-0.65 0.12 -0.03
-0.43 -0.02. -0.0,1.
0.06 0.56 0.02
-0.56 0.13 -0.09
0.06 -0.05 0779.
0.04 0.01 0.60
-0.35 -0.10 0.010.28 0.05 0.08
0:14 0.09 -0.02
0.38 0.16 0.06,-
' 0.14 0.31 -0.03
0.60 0.20 -0.03
0.73 0.18 -0.02
0.68 -0.06 -0.04
-0.01 0.02 -0.05
-0.04 -0.04 .0.02
0.00 -0.01 -0:02
-0.10 -0.04 -0.03,
0.42 0.07 -0.04
0.40 0:08 -0.06
4 5 6.
--0T15 0.08 1 0.02
0.12 0.07 0.05
-0.16 0.02 0.04
0.03 -0.04 0.04
0.03 0..03 0.01
0.13. 0.06 0.02
0.18 -0.06 -0.02
.. 0.01 1 -0.05 0.01
-0.50 -0.03 -0.04I
:0.60 0.11 H-0.01I
-0.20 0.'11 -0.07i
-0.25 0.13 0.02
0.06 0.00. 4.010.04 -0.04 -0.02
70.01 0.08 \0.05
0.01 0.01 -0.04
-0.10 -0.04 -0.05
-0,09 -0.03 0.04
-0.04. 0.01 0.04
-0.16' -0.36 0.09
-0.12' 0.00 0.12
0.02 0.47 Q.140.03 0.21 70.02
0.02 ,0-.35 0.00
-0.08 =0.48 0.08gm 0.03
g.0.024-0.03. -0.29 -
0..06 0.16 0!1.02
-0.05 0.07 -01.07
0.07 0.02 01.03
-0.05 0.06 . -003-0.02 0.04 0.00
-0.02 0.03 0.01
0.00 -0.01 70.05
-0.02 0.10 0:08
0.13.. -0.08 0:00
-0.15' 0.01 0:03
-0.05 : 0.07 -0.01
-0.06' 0.04 -0.02
70.09 .0.00 -0 .p 2
0.01 0.00 0074
-0.03 -0.03 0.52
-0.03 -0.04 -0.p3
0.01 0.00 0.08
.0:-18 -0.07 -0.04-
0.10 -0.01 -0.02
* 0sing'\communalitieS in the diagonal1
.
**Loadings equal 'a or greater than .30 in absolute value are underlined.Q
83
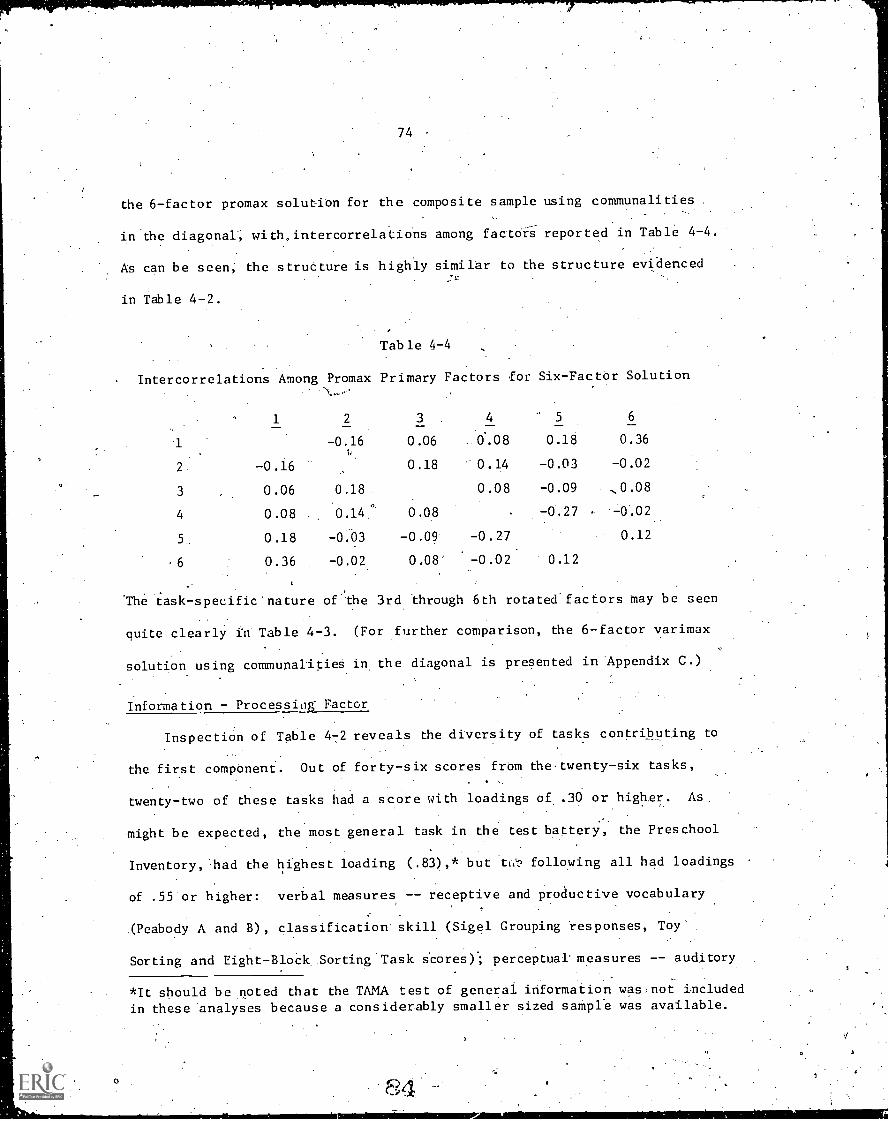
74 .
the 6-factor promax solution for the composite sample using communalities
in the diagonal, with,intercorrelations among factors reported in Table 4-4.
As can be seen; the structure is highly similar to the structure evidenced
in Table 4-2.
Table 4-4
Intercorrelations Among Promax Primary Factors for Six-Factor Solution
1 2 3 4 5 6
1 -0.16 0.06 .0.08 0.18 0.361,
2 -0.16 0.18 0.14 -0.03 -0.02
3 0.06 0.18 0.08 -0.09 ,0.08
4 0.08 0.14' 0.08 -0.27 -0.02
5 0.18 -0.03 -0.09 -0.27 0.12
-6 0.36 -0.02 0.08' -0.02 0.12
The task specific' nature of 3rd 'through 6th rotated factors may be seen
quite clearly in Table 4-3. (For further comparison, the 6-factor varimax
solution using communalitieS in the diagonal is presented in Appendix C.)
Information - Processing Factor
Inspection of Table 4 -2 reveals the diversity of tasks contributing to
the first component. Out of forty-six scores from the, twenty -six tasks,
twenty -two of these tasks had a score with loadings of, .30 or higher. As.
might be expected, the most general task in the test battery, the Preschool
Inventory, 'had the highest loading (.83),* but following all had loadings
of .55 or higher: verbal measures -- receptive and productive vocabulary
(Peabody A and B), classification' skill (Sigel Grouping responses, Toy
Sorting and Eight-Block Sorting Task scores).; perceptual' measures -- auditory
*It should be noted that the TAMA test of general information was not included
in these analyses because a considerably smaller sized sample was available.
)
75.
',discrimination (Children's Auditory Discrimination Inventory), form.discrim--
ination and matching (Johns Hopkins Perceptual Test score and Matching
'.Familiar Figures Test errors); and percePtual-motor measures visual-motor
coordination (Seguin), form reproduction (Form Reproduction Test). Virtually
identical results were obtained when comparing the ranking of deviation co-
.efficients from the Caldwell (2-dimensional smallest spice solution) with
the ranking of weights on the first principal component. A factor that was
very similar to the first principal component appeared after rotations of
varying numbers of factors (between 2 and 7) whether unities or communality
estimates were used in the diagonal of the correlation matrix. This is
evident in the comparison of the first factor in Table 4-2 (first principal
component using unities in the diagonal) and the first factor in Table 4-3r1 0
(first promax factor using communality estimates).
The first component seemed to be best defined as "g" or
information-processing skills which contribute to level of performance on\
all of these tasks.. For this sample, it was best.represented.by performance
on the Preschool Inventory and Peabody Picture Vocabulary Test (PPVT) which
correlated .62. The Preschool Inventory was developed to measure achievement
in areas. regarded as critical for successful kindergarten performance. To
some extent.performance on this task is an index of the child's ability to
process general informationjrom the environment. -Mill:ham et al. (1971)
recently described scores on a vocabulary test as measuring associative
information-processing ability. A3Oth' tests have been found to be highly
.sqnsitive to environmental impoverishment. Included in measures of -"g," of
6course, are such'"non-cognitive" aspects as ease and willingness to rergte
.and.assert oneself in the testing 4tuation, attention, persistence, and
8r_
O
76
task. orientation. A common cognitive component is the ability to understand
and follow directions. These aspects of "g" may, however, be age-specific.
Response Tempo Dimipsion
The second factor describing the overall correlational structure .
appears to represent a response tempo dimension; as defined by oblique
rotation (Table. 4-3), this factor was nearly orthogonal to the first factor.
The correlation between the first two promax factors was -.16. It was best
represented by the mean latency scores on the Sigel Object Categorizing Test
and the Matching Familiar' Figures Test (r=.-47). The only other variable
with a loading of .30 or greater on the second primary factor was the
average time to first response on the Embedded Figures Test (loading = .31),
Thus, response tempo, frequently used to measure the cognitive style of
refIection-impulsivity, appeared as a consistent individual difference
variable; hOwever for this sample during this age period response tempo
was not related to performance level on the first factor.- Similarly,:latency
and adequacy of- response were not correlated within tasks (r = -.07 with
grouping responses on the Sigel and .02 with errors on the Matching FaMiliar
Figures Test). -Response-latency, therefore, did not have the same implication
for PerforMancjashas'been 'found with older'and/or more advantaged subjects
(Messer, 1970;Eska and-Black, 1971), sinne.it did not reflect individual
differences in the degree to which the-child.considers.the adequacy of his
CArespbrise. Perhaps, prior to school experience, there is a lack of anxiety
. or concern over error and/or fewer internalized standards of perfoYmance.
These findings Suggest that temperamental components have not yet,becomeo
integrated into the- cognitive domain.
77
Further Analyses of Cognitive Measures
-. Subsequent to dadse analyses, faCtcqNanalytic and smallest space
analyses were perfoimed on those measures contributing to the first com-
poaent in an attempt to delineate clusters, if'any, among the cognitive
measures. The resulting clusters of measures were not stable and, the
factors, alexpe'cted, were highly correlated. The verbal measures, for
example, did not sort into receptive skills (e.g., comprehension of
syntax [ETS Matched Pictures]; sequence [ETS Story Sequence -.Part I]; and
vocabulary [Peabody A]) and productive skills (e.g., labelling [Sigel Object
Identification and Peabody B scores]; imitation of phonemes and real words
[Massad Mimicry]) or into different subskills such as classification (Toy
Sorting and Eight-Block Soting.acores and Sigel Grouping responses) br
vocabulary comprehension (Matched Pictures [fUnctor words] and Peabody A
[content words]). Neither was there evidence of larger clusters, e.g.,
verbal, quantitative, perceptual. Also, a separate factor analysis of
the Preschool Inventory yielded only a large general factor, and item-
specific factors rather than logically distinct clusters of quantitative,
verbal, social and Perceptuar-motor items.
As would be predicted, a "g" factor became much more salient, when the
n °k n-cognitiv,ely defined measures were removed. The first, factor
accounted for 32.3% of the total variance; its eigenvalue was 8.08. Using
communalities in the diagonal, the eigenvalue was 7.56, and 76.8% of the
common variance was accounted for. Again, however, the magnitude of
remaining non-error specific variance was clearly evidenced. .Varimax and
promax 5-factor rotations produced factors whose interpretation paralleled(11,.
'that of the largelr factor analyses. The first factor appeared to-Tepresent
78
- I
a general ability dimension, the second a stylistic one, and remaining
factors were .task-defined. Thus, the\general ability dimension evidenced
on the first factor did .not differentiate into various cognitive-
intellectual domains; instead, attitudinal and/or highly-specific deterini-:
nants appeared to,,be operating.
Intercorrelations among the "cognitive" subset of measures further
clarify these results. Intercorrefat42ns Among the receptive verbal
,.\measures were moderate to low.* Marched Pictures and Story Sequence cor-
-related .38 and .41, respectively, with Peabody A, and .33 and .31,
respectively, with the CADI; their correlatio
\
with each other was only
.25. Thus these measures appear to be tapping different verbal skills.
The CAD' however, correlated .61 with Peabody A\0 As can be seen from the
task descriptions, operations involved in both tasks are highly similar
the child must point to the picture representing the oral stimulus.
Moreover, the,auditory discrimination task involves vocabulary skill to
the extent that children had differential familarity with the meaning of
the real words.
Similarly, correlations among verbal productive measures were moderate
to low. The sorting tasks correlated higher among each other (Toy Sorting
and Eight-Block Sorting scores correlated .31 and .37, respectively, with
Sigel Grouping responses), than with the Mimicry scores (.19 to .25) or
with the number of objects identified correctly on the Sigel (.19 and .17,
respectively). Except for the correlatioyof .49 between Toy Sort and
Eight-Block Sort performance, correlations among the above tasks were high-\
est with Peabody B (.33 [Mimicry Nonsense Words] to .43 [Eight-Block Sorting
*The'intercorrelations among allof the scores listed in.Table 4-1 are
reported in' Appendix' C. r+
79
Test score and Sigel Grouping responses]). However, these measures cor-
related to a similar extent with the receptive verbal scores presented
above; correlations with Peabody A were highest and virtually identical
to those with Peabody B. Mimicry scores tended to have low intercorrel-
ation$ with other tasks suggesting that imitation skill is distinct from
understanding or producing language.
In Year 1, except for the counting and ordination items of the
Preschool Inventory, measurement in the quantitative area consisted of
.two measures, Enumeration and Spontaneous. Numerical Correspondence 'both
tapping what Piaget (1952) considered prerequisites for the later under-
standing and use of number -- perceptual ordering and articulation. These
two measures did not form a quantitative cluster and their placements in
the structure were quite different. Perhaps these measures are differen-
tially related to general mathematical concepts and to numerical and computp-
tional skills. Correlations among the four task scores ranged from .11'to
.18. The Enumeration scores, which are more closely linked to computational
skills, loaded on the first factor and correlated in the 20's and 30's'with
other measures. Spontaneous Numerical Correspondence-;-Vhich provides
information on global intuitive responses of young children to problems
one-to-one correspondence, had correlations with all other tasks that were
close to zero and:defined a separate factor. (Factor 4 in the.promax
rotation reported in Table 4-3.)
Distinct from "academic" skills, but subsumed under the cognitive domain,
are Piagetian - derived. measures. Three tasks wereincluded in the initial
test battery to learn more about the preoperational stage in general and to
89
80
chart its course in the socioeconomically disadvantaged child. Two of these
tasks have just been discussed.. The third, the Boy-Girl Identity Task,
assesses the child's ability to maintain gender identity constancy, espite
changes in stimuli which increasingly resemble the opposite ,sex. As noted
in the task delcription, although responses to item 1 (the "wish item") were
moderately cojrelated (.45),_correlations near zero were obtained with the
1,-other task scores. Item 1 was correlated'to some extent (approxiMately .20)
'pith those tasks, highest .on the' general ability:faCtor, whereas-the other
scores had virtually zero correlations with all other measures in the test
battery. As with Spontaneous Correspondence, the two correlated scores
formed a separate factor (Factor 6 in Table 4-3) . Thus, this task. did-not
seem to be tapping a cognitively based reality judgment of gender. identity
constancy in this population' at this 'age.
The disiinction between perception and cognition is obviously a fine
one. MeasureS,Ln Year I tapped form discrimination and recognition (Johns
Hopkins Perceptual Test, Matching'Familiar Figures Test), form analysis
(Preschool Embedded Figures Test,'WPPSI Picture Completion), eye-hand
coordination (Seguin Form Board), and form reproduction (items from the
Caldwell and Developmental Test of Visual Motor Integration). These taskso
did show moderate-sized correlations with each other, and the relative site
of the intercorrelations reflected task similarities. For example, the
Johns Hopkins and Matching Familiar Figures tests, which make highly similar
demands upon the_child, correlated .52;*the two eye-hand coordination tasks,
Seguin and Form Reproduction, correlated .47.i However, these tasks'did not
form a separate cluster. Instead, theyall,showed substantial loadings on
*Signs of correlations involving error scores (Matching Familiar Figures) andtime to quiCkest solution (Seguin) have been reversed.,
81
the first factor. As would be expected, those perceptual tasks which are
included in the WPPST, Picture Completion and Form Reproduction, had the
highest correlations with the child's general achievement level as reflected
in his Caldwell. core (.59 and .54, respectively). Studying correlations of
these measures with other tasks. does provide clues, however, to task specific
.components. Sigel grouping responses, for example, correlated .41 *with both
Matching Familiar Figures and the Johns Hopkins, reflecting the childus
ability to discriminate stimulus characteristics as a basis for sorting:
'The highest freqUency of classification on .the. Sigel was by manifest stimulus
attributes such as color or form.
Other Measures of Cognitive Style
Other cognitive-stylistic factors, such as analytic functibning, did
not appear. .Performance on both the Preschool Embedded Figures Test and the
Picture Completion subtest of the WPPSI, which were included as potential
markers of analytic functioning, loaded primarily on the first factpr (.38
and .63, respectively); their intercorrelation was only .29.. This finding
could reflect insufficiency of measurement in defining. this factor. Recent
evidence suggests that the Picture Completion subtest is not a stable and
consistent index of 'analytic functioning. Moreover, for many children in
this, sample performance was confounded by lack of understanding of the word
"missing" in the directions. -Both the Preschool' Embedded Figures Test and
Picture Completion Test exhibited substantial reliabilities, however,,indi-
cating consistent but specific functioning on these tasks.
Although speed'of responding emerged as a factor in the overall analyses,
the lack of relationship of the latency measures to other°purported measures
*Signs of correlations involving error scores' (Matching Familiar Figures) andtime to quickeSt solution (Seguin) have been reversed.
91
C
82
of impulsivity (inability to inhibit a response or to delay .gratification) .
,..
suggests4hat impulsivity is not a unitary trait or generalized dimension-
. ..
in this population at this age. .The correlation of mean latency on the
matching Familiar. Figures. Test with mean time in the "slow" walking and
draw -a -line trials of the Motor Tnhibition Test was .04, and with choice o
the delayed reward on the kschel Task it was -.01; the correlation between
these latter measures was As indice.ted in previous research (Maccoby
.et al., 1965; Massari, et-al., 1969; Ward, 1968), the ability to inhibit a
response when appropriate (Motor Inhibition "slaw" trial time), unlike a
more stylistic"variable sUch.as latency, is positively correlated with IQ.
In this study the Motor Inhibition score loaded only on the first factor and
not on the second tempo factor. As noted in describing the Mischel task,
impulsivity as defined by choosing the smaller but Immediate reward is con-
founded by the child's Understanding of the instructions and his faith.in
the tester. Delaying gratifidation is realistic only one sees an oppor-
tunity, to achieve gratification at a latex- time. Obviously', the task.
requirements for these measures-are dissimilar (e.g., one response choice_
vs. two or more pctssibTe responses), and such method variance appears more
potent than an underlying unifying personality dimensiOn, at least in this
population at this age. However, for primary grade children from low-
income families, Hess et al. ,(1969) also found motor inhibition, reflection-
)
impulsivity and delayed reward not to be correlated.
Other controlling mechanisms had near-zero communality estimates (e.
risk-taking had an estimated communality of .03) or appeared as a task-.
defined factor (e.g., the four variables that define factor 5 in
83
Table 4-3 are Open Field Test measures). Such results could be interpreted
f
as reflecting special abilities\limited to one task and/or incomplete sampl-
/ .
ing'of the processes represented by tasks. Given' the different setting for
the Open Field Test (unstructuree'pla observation. vs adult -child testing .
situation) , it is not known to what extent task-specific variance was due to
,
the method difference rather Eha/ n to the processes being tapiSed:i
Attentional'variables are among those that cut across 'relatively arbi7
trary distinctions-between cognitive and' personal-social functioning. 1,64s_
and his associates (Lewis et al., 1970; Lewis, 1971) have found attention to!
be an index of early cognitive.functioning. Not only may attention be a pie-
requisite of subsequent cognitive functioning, but individual differences in
attention are likely to have direct effects on learning. Moreover, attention j
canbe non-cognitively determined as well °by the intentiOns,and desires of the
Subject. As indicated earlier, the two Fixation Test scores used in the
structural analysis appeared as aitAsk-definedfacior: (Factor 3 in the pro--
'1
maX rotation reported in Table 4-3.) .However, their.latk'of relationships to
other measures and the low correlations across stimuli within the task
prevent us from Interpreting these findings further at this time.
Similarly, personal-social behaviors reflected ircthe Brown IDS Self-
-!
Concept''Referents Test (smiling in theyhotograph,.Self-concept sco6), the
Open Field Test (approaches E, attempts to leave) and the ratings of child.'
_ceoperetion in the mother-child structured interaction sessions had communal-, _
- ._. _.
_
Ades less th-alh :25 for the composite-sample. However, the test battery did,
not sample enough of these behaviorS, to delineate factors in the affective
ancr'Social doMains. Given the present "state. of the arC in valid measurement.
.
O
84
of these variables_fgr_this age,-however,, it is. doubtful that other results
_. ,. .
would be obtained with more extensive measurement in test-like settings. In
preliminary analyses the self"-concept'score,ls an extension variable, mapped
onto the first component only; in the promax 6-factor solutiOn it, loaded on
the first factor only (.28),1suggesting the importance of general intellectual
competency. as..a critical comkonent-i positive self-eValuation. .Similarly,
the mean rating of the ELiPs-cOoperation during the mother-child interaction
sessions mapped onto the general ability, measures and reflected the attitudi -
nal,nal non-cognitive components of measures of "g"..These results suggest. that
the child's task involvemenit and compliance with .the mother in the interaction
situations was 'highly similr-to hiS,behavior with the tester. We had intended
to include tester ratings in the Year I battery, but the various retings
posed were too numerous and too complex in format for testers to assimilate,
quickly and well. Since th various
revision, these ratings were not use
in subsequent.testing..
.1
° The one/ measure repres nting ihephysical domain, Vigor 2 crank-turning
°
badaommunality estimate -f .,only .14, but given the lack of Other Similar%..
demands at the time did not allOw adaquate'
Test ratings were d'ncluded, however,
. l
measures no
.
indicated in
fprther i nterpr tation of this score can be made at this time. As. 1
. .
.
the 'task escription;, the extent towhich this meaSure taps vigor.'-
persistence, physical coordination and/or willingness to 'please the-examiner
. , . -. , -e.
is teknown. In Appendix B it is noted.thet_another vigor measurere had/
been
L,,
/7.
/ /i !
.i,.a (running),(runnng), but since further inspection of the data suggested the',-
i I
presence of..
several, confounding factors (e.g., fear of falliii closeness of.. .
,
, , .
o ,------_.
/
the firsh,line.tO wallS), the running s.peed score was not i clUded in'eh.e-i'
structural analyses.
85 .
. . Ivj
These findings may reflect general instability of
performance in this area at this a e period.
Smallest Space Analyses
.
:The sra..1lest space solutions yielded highly Similar results: The two-'1 /
c;
\1 .
dimensional4olution of the larger matrix produced one vector that seemed
.1 i(''
to define-the first two factors (i.e., general' ability and respcnse tempo.)..
Those tasks with highest loadings on the first factor were clF,stered'together
D
at one end, with the latency measures at the opposite end. between these
/ -
cognitiye;and tempo measures were th6 Fixation Test scores. The other measures
.1
were scattered, around the space and nogeneral clusters were......... . , i
. 1
Given the lack of clustering and low intercorrelations among the remain-1
..._
ing measures, no clear interpretation of.thle second dimension-tan be made at
i --. . 1 -.------
this time. Tentative hypotheses refer to differences in the number of responsei . L
options offered' the child,(one for skill measures vs. two or more for the Risk-
evidenced: .3k
Taking Task, Mischel, Boy-Girl Identity Task and Open Field,Test; all of, which.
/
were located atHOne end_of_the second dimension), and to the possible.existence
of social dimension (s aing for the Brown Self- Concept Test photograph and'
talking to the eester in the Open Field Tes.0. ThUs, the task-defined factors
discussed previously_werp located-along the boundaries of the smallest space'.
solutions. This small s-tspace--6-oluil6ndid not-aid, however, in further delin-
eation of processes represented by those* particular measures since .there-was-
/. no, general' clustering of measures.
Similar results were obtained when the measures assumed to be.non-
cognitive were removed. Measures on the first faCtor clustered together;.
_fining.. the general ability componen4, with task-defined factors located-along
86
L
c;-
,
the boundar ies of 'the smallest space olutions.. Such' tasks may be highly--.
specialized, (e .g . , Massad Mimicry)- d/orage-spec ific e.g.(,__Sprontaneous
Numeric'al Correspondence) in their implications.. Thefr'distance from"the "g"
dimension wouldseem to indicate that theyhave not yet been organized by
cent re-3. information-processing-abilities. The smallest space, solutions thuse
provided° essentially similar ,information - as to the_ major structural dimensions ,
of the data -- suggesting general information-processing skill, response tempoce
and many task-specific aspects.
However, this analysis provided, add i tional ins ight into tlie processes
underlying .the correlational structure. Moving away_ from those measures
which were found to load highest on the first principal component and which,
in the smallest space, solution for the subset c,f measures, were centered
.
around Cie Preschdbl Inventory score, it was discovered that those measures\
closest together were those which had been given in the same battery (i.e.,\
same day and same tester) . Thus, 2 secondary structuring variable for the-se
data app.6ars 'to be a contextual one. This battery effect seems equivalent .
to what Campbell and Fiske (1959)!call method factors,, and may reflect the
operation of situationally determined-variables in.!test performance. Thus,
for example, self-concept and vigor scores were located close together not
only because of their common lack of relatedness to the major skill-tempo
vector, but presumably be,cause of shared method variance in that the Brown
and Vigor 2 tasks were both administered in Battery C. (See Table 3-1 in
Chapter 3 for batterydescFiptions.) Given the fact, however, that it was
the day of administration and tester which defined the battery effect;
situational and tester characteristics rather than stable child style or
personality variables may have created clustering. The smallest space-
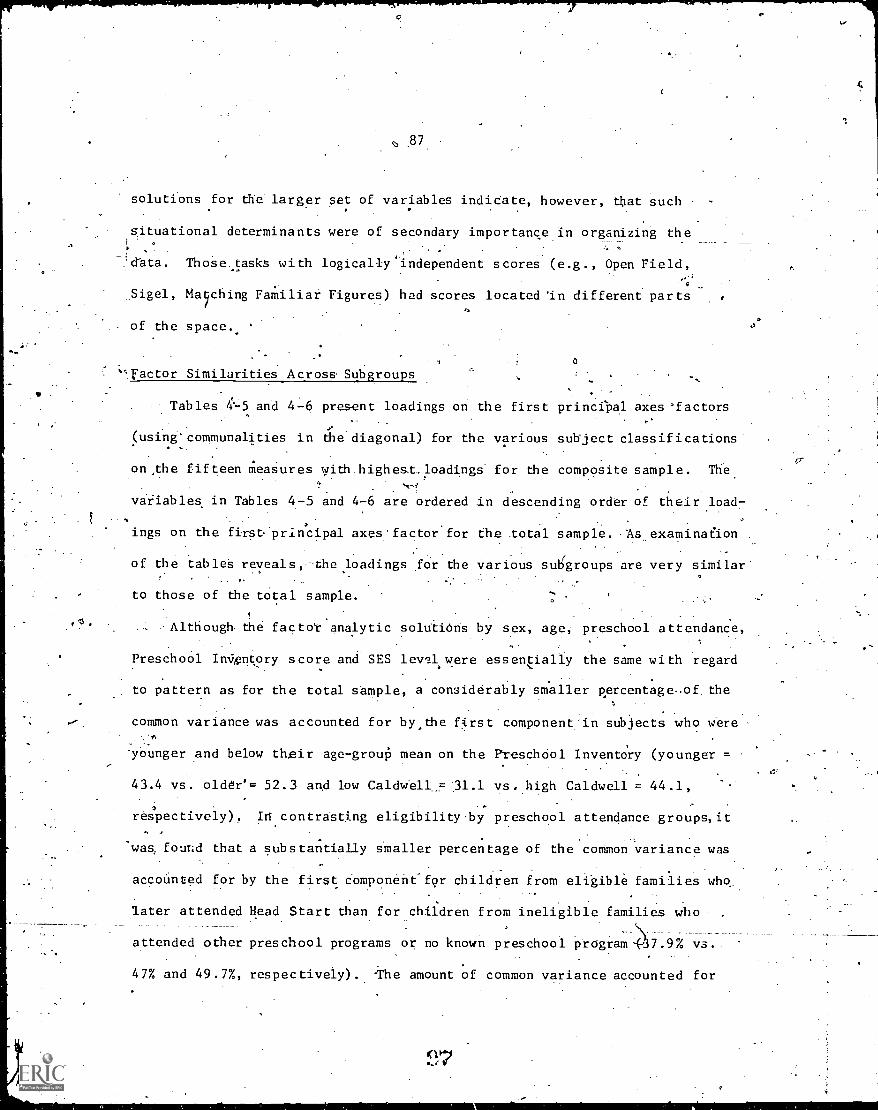
<, 87
solutions for the larger set of variables indidate, however, that such
situational determinants were of secondary importance in organizing the
:Tata. Those. tasks with logically 'Independent scores (e.g., Open Field,
o
_Sigel, Matching Familiar Figures) had scores located in different parts
of the space..
0
`'-.Factor Similarities Across. Subgroups
-
Tables 4-5 and 4-6 present' loadings on the first principal axes 'factors
(using' communalities in the diagonal) for the various subject classifications
on the fifteen measures with highest. loadings for the composite sample. The.
variables in Tables 4-5 and 4-6 are ordered in descending order of their load-
ings on the first'principal axes' factor for the total sample. As examination
of the tables reveals, -the loadings for the various subgroups are very similar4 4I
to those of the total sample.
Although the factor analytic solutiOns by sex, age, preschool attendance,.
Preschool Inx"wntory score and SES lev?.1 were esseqially the same with regard
to pattern as for the total sample, a considerably smaller percentage-of the
common variance was accounted for by, the first component in subjects who wereo
'younger and below their age -group mean on the PreschOol Inventory (younger =
43.4 vs. oldr'= 52.3 and low Caldwell= 31.1 vs. high Caldwell = 44.1,
respectively) . In contrasting eligibility -by preschool attendance groups, it
was found that a substantially smaller percentage of the common variance was
accounted for by the first 6omponent for children from eligible families who.
later attended Head Start than for children from ineligible families who ,
attended other preschool programs or no known preschool program 7.9% vs..
47% and 49.7%, respectively). -The amount of common variance accounted for
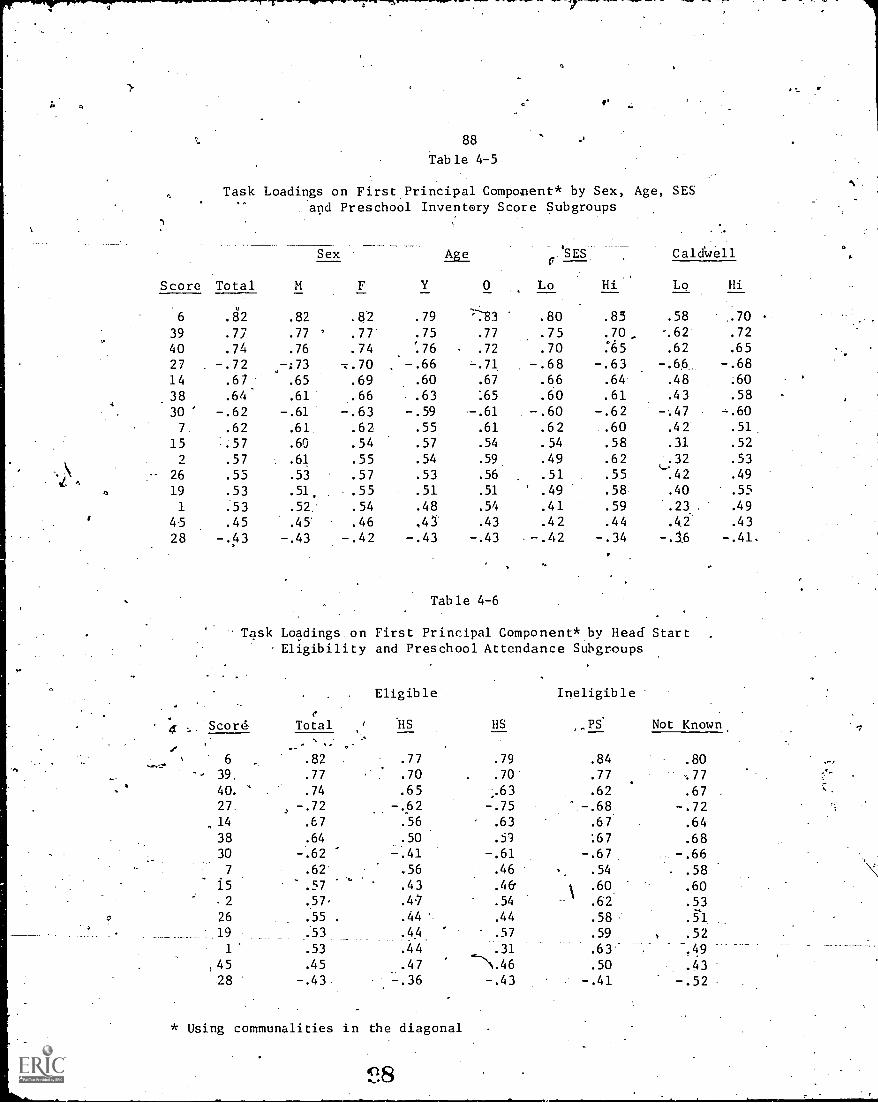
88
Table 4-5
Task Loadings on First Principal Component* by Sex, Age, SESand Preschool Inventory Score Subgroups
Score Total M
Sex
F Y
Age USES
Hi
Caldwell
0 0 Lo Hi
6 .82 .82 .82 .79 '`83 .80 .85 .58 -7039 .77 .77 ' .77 .75 .77 .75 .70, -.62 .72
40 .74 .76 .74 :76 .72 .70 :65 .62 .65
27 -.72 -;73 -.70 -.66 -.71 -.68 -.63 -.66_ -.68
14 .67 .65 .69 .60 .67 .66 .64 .48 .60
38 .64 .61 .66 .63 :65 .60 .61 .43 .58
30 -.62 -.61 -.63 -.59 -.61 -.60 -.62 -:47 -,-.60
7 .62 .61, .62 .55 .61 .62 .60 .42 .51
15 .57 .60 .54 .57 .54 .54 .58 .31 .52
2 .57 .61 .55 .54 .59 .49 .62 .32 .53
26 .55 .53 .57 .53 .56 .51 .55 .42 .49
19 .53 .51 .55 .51 .51 .49 .58 .40 .55
1 .53 .52 .54 .48 .54 .41 .59 .23 . .49
4 -5 .45 .45 .46 .41 .43 .42 .44 .42 .43
28 -.43 -.43 -.42 -.43 -.43 -.42 -.34 -.16 -.41.
Table 4-6
Task Loadings on First Principal Component* by Head StartEligibility and Preschool Attendance Subgroups
4 , Scoree
Total
Eligible
HS HS
Ineligible
,,PS. Not Known_
..... ..
6 .82 .77 .79 .84 .80
39 .77 .70 .70 .77 :7740. .74 .65 ,63 .62 .6727. -.72 -.62 -.75 -.68 -.7214 .67 .56 .63 .67 .64
38 .64 .50 .53 :67 .68
30 -.62 -.41 -.61 -.67 -.667 .62 .56 .46 .54 .58
15
2
.57
.57,
.43
.4/
.4&
.54\
.60
.62
.60
.53
26 .55 .44 .44 .58 ..n.
19 .53 .44.
.57 .59 .52
1 .53 .44 .31
--\.46.63 T4.9
45 .45 .47 .50 .4328 -.43 -.36 -.43 -.41 -.52
* Using communalities in the diagonal
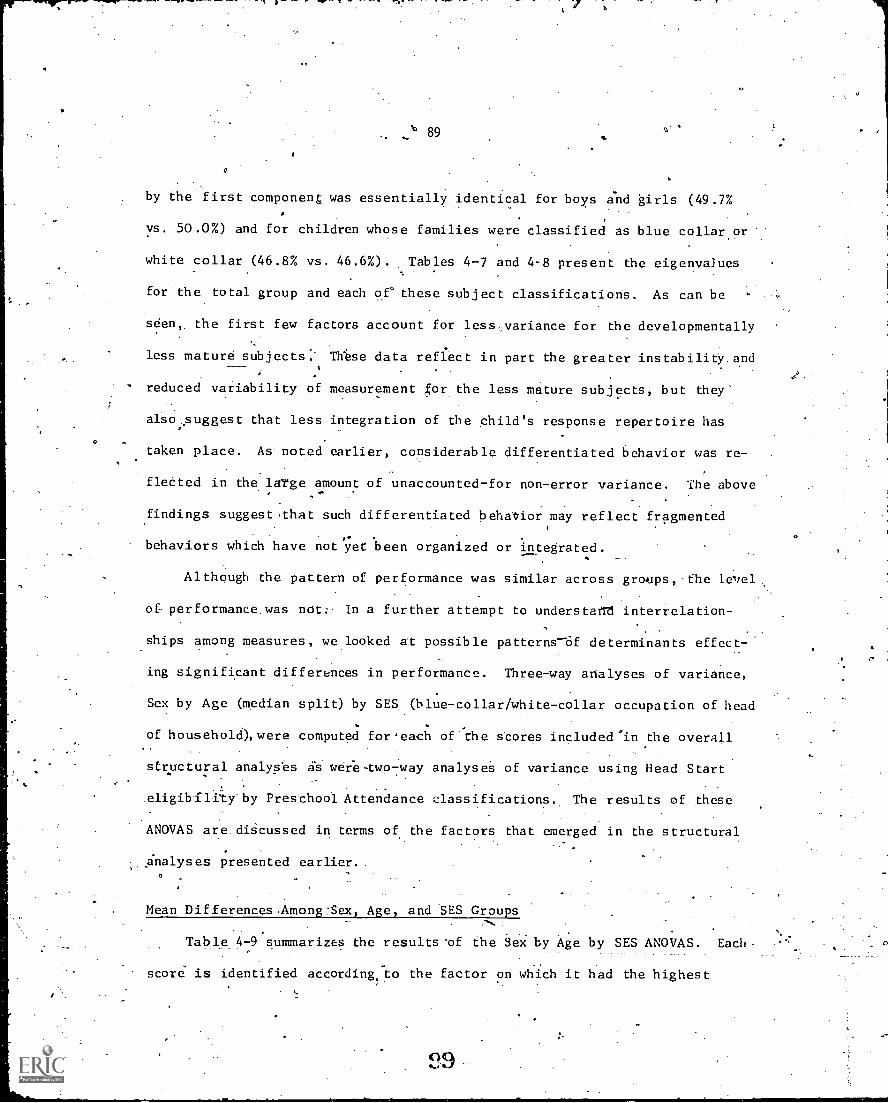
.`".' 89 o.
by the first component was essentially identical for boys and girls (49.7%
vs. 50.0%) and for children whose families were classified as blue collar or
white collar (46.8% vs. 46.6%). Tables 4-7 and 4-8 present the eigenvalues
for the total group and each of these subject classifications. As can be
seen,. the first few factors account for less,variance for the developmentally
less mature subjects:- Th'se data reflect in part the greater instability. and
reduced variability of measurement for the less mature subjects, but they'
also..suggest that less integration of the child's response repertoire has
taken place. As noted earlier, considerable differentiated behavior was re-,
flected in the large amount of unaccounted-for non-error variance. The above
findings suggest that such differentiated behavior may reflect fragmented
behaviors which have not yet been organized or integrated.
Although the pattern of performance was similar across groups, the lorel
of performance was not:. In a further attempt to understatit interrelation-
ships among measures, we looked at possible patterns-6f determinants effect-
ing significant differences in performance. Three-way analyses of variance,
Sex by Age (median split) by SES (blue-collar/white-collar occupation of head
of household), were computed foreach of the scores included in the overall
structural analyses as were -two -way analyses of variance using Head Start
.eligibility. by Preschool Attendance classifications.. The results of these
ANOVAS are diScussed in terms of the factors that emerged in the structural
analyses presented earlier..
Mean Differences .Among-Sex, Age, and SES Groups
Table 4-9 summarizes the results 'of the SeX by Age by SES ANOVAS. Each
score is identified accordinglo the factor on which it had the highest
0
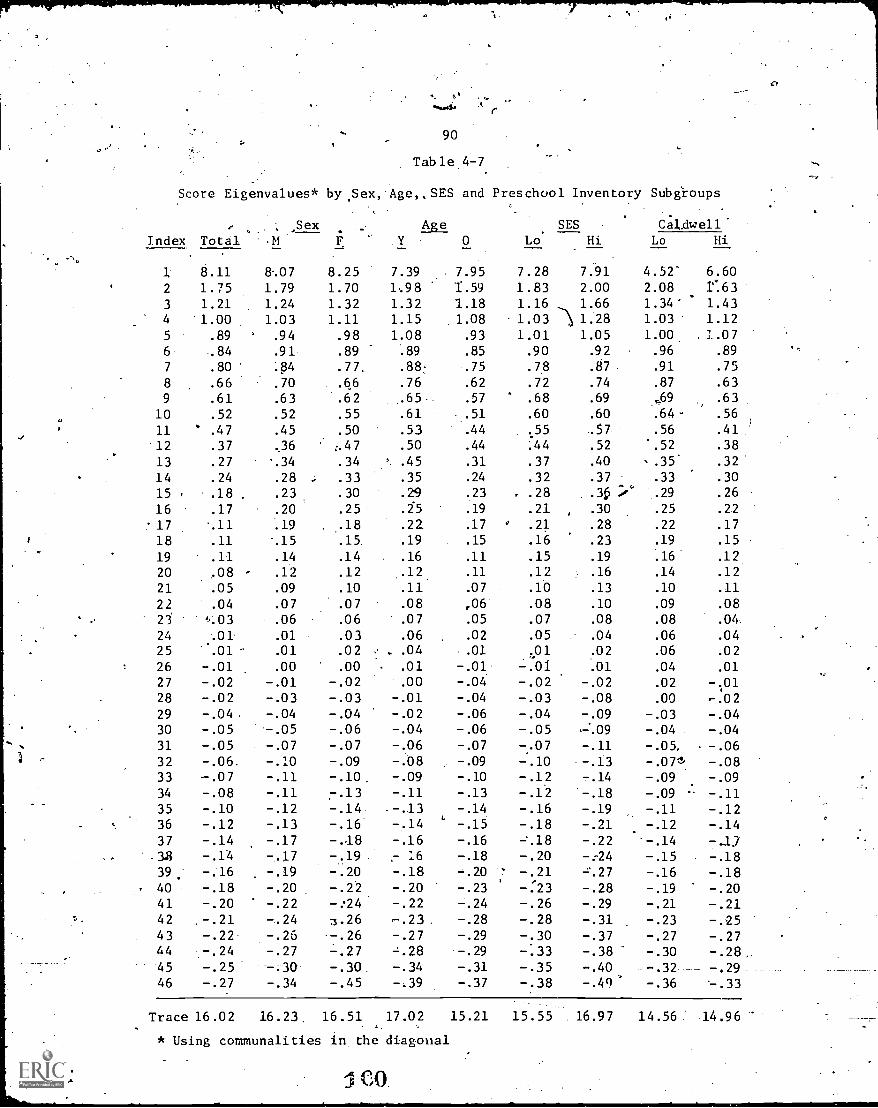
.,
A
90
Table 4-7.
Score Eigenvalues* by.Sex, AgeSES and Preschool Inventory Subgroups
Index Total,Sex
F
Age0 Lo
SES Caldwell.M Y Hi Lo Hi
1 8.11 8.07 8.25 7.39 7.95 7.28 7.91 4.52° 6.60
2 1.75 1.79 1.70 198 1.59 1.83 2.00 2.08 f163
3 1.21 1.24 1.32 1.32 1.18 1.16 1.66 1.34' 1.434 1.00 1.03 1.11 1.15 1.08 1.03 1.28 1.03 1.12
5 .89 .94 .98 1.08 .93 1.01 1.05 1.00 . 1.07
6 .84 .91 .89 .89 .85 .90 .92 .96 .89
7 .80 .84 .77. .88- .75 .78 .87 .91 .75
8 .66 .70 .66 .76 .62 .72 .74 .87 .63
9 .61 .63 .62 .65. .57 .68 .69 ,.69 .63
10 .52 .52 .55 .61 .51 .60 .60 .64 .56
11 ' .47 .45 .50 .53 .44 .55 .57 .56 .41
12 .37 .36 ;.47 .50 .44 .44 .52 ..52 .38
13 .27 '.34 .34 '. .45 .31 .37 .40 -.35' .32
14 .24 .28 , .33 .35 .24 .32 .37 .33 .30
15 .18 .23 .30 .29 .23 . .28 .3f, .../° .29 .26
16 .17 .20 .25 .25 .19 .21 .30 .25 .22
17 '.11 .19 .18 .22 .17 ° .21 .28 .22 .17
18 .11 .15 .15 .19 .15 .16 .23 .19 .15
19 .11 .14 .14 .16 .11 .15 .19 .16 .12
20 .08 .12 .12 .12 .11 .12 .16 .14 .12
21 .05 .09 .10 .11 .07 .10 .13 .10 .11
22 .04 .07 .07 .08 ,06 .08 .10 .09 .08
21 i-,.03 .06 .06 .07 .05 .07 .08 .08 .04
24 .01 .01 .03 .06 .02 .05 .04 .06 .04
25 ..01 .01 .02 ... .04 .01 .01 .02 .06 .02
26 -.01 .00 .00 .01 -.01 -.01 .01 .04 .01
27 -.02 -.01 -.02 .00 -.04 -.02 -.02 .02 -.0128 -.02 -.03 -.03 -.01 -.04 -.03 -.08 .00 ,-.02
29 -.04 -.04 -.04 -.02 -.06 -.04 -.09 -.03 -.0430 -.05 -.05 -.06 -.04 -.06 -.05 -.2.09 -.04 -.0431 -.05 -.07 -.07 -.06 -.07 -.07 -.11 -.05, -.0632 -.06. -.10 -.09 -.08 -.09 -.10 -.13 -.076 -.0833 -.07 -.11 -.10 -.09 -.10 -.12 -.14 -.09 -.09
34 -.08 -.11 -.13 -.11 -.13 -.12 -.18 -.09 - -.1135 -.10 -.12 -.14 . -..13 -.14 -.16 -.19 -.11 -.1236 -.12 -.13 -.16 -.14
t-.15 -.18 -.21 -.12 -.14
37 -.14 -.17 -.,18 -.16 -.16 -'.18 -.22 -.14 --1.7
38 -.14 -.17 -.19 ..- 16 -.18 -.20 -.-24 -.15 -.1839. -.16 -.19 -.20 -.18 -.20 : -.21 -:.27 -.16 -.1840 -.18 -.20 -.22 -.20 -.23 -.23 -.28 -.19 -.2041 -.20 -.22 - :24 -.22 -.24 -.26 -.29 -.21 -.2142 -.21 -.24 3.26 -.23 -.28 -.28 -.31 -.23 -.2543 -.22 -.26 -.26 -.27 -.29 -.30 -.37 -.27 -.2744 -.24 -.27 -.27 -.28 -.29 -.33 -.38 -.30 -.2845 -.25 -.30 -.30. -.34 -.31 -.35 -.40 -.32 -.2946 -.27 -.34 -.45 -.39 -.37 -.38 -.0 -.36 '-.33
Trace 16.02 16.23. 16.51 17.02 15.21 15.55 16.97 14.56 14.96
* Using communalities in the diagonal
1 CO
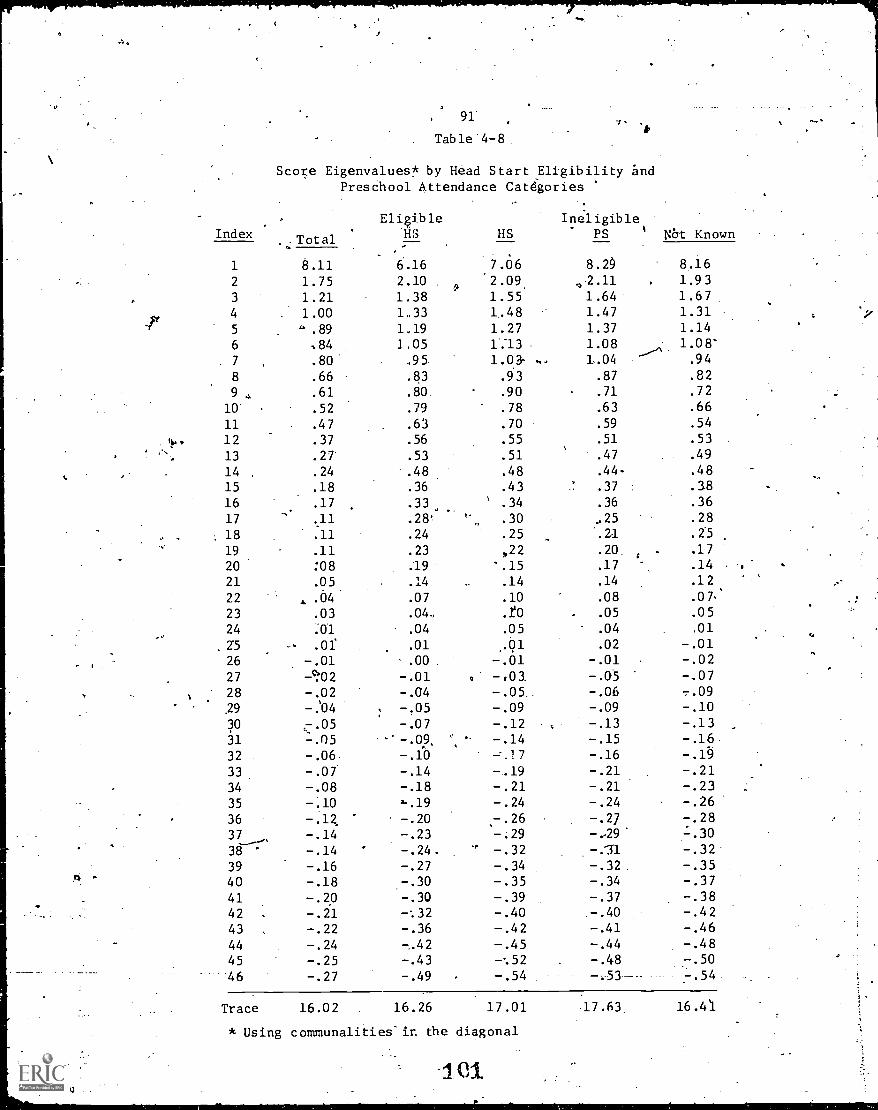
91
Table 4-8
Score Eigenvalues* by Head Start Eligibility andPreschool Attendance Catdgories
Index Total
EligibleHS HS
IneligiblePS ' Nit Known
1 8.168.11 6.16 7.06 8.29
2 1.75 2.10 . 92.09 ,2.11 1.93
3 1.21 1.38 1.55 1.64 1.67
4 1.00 1.33 1.48 1.47 1.31
5 °.89 1.19 1.27 1.37 1.14
6 .84 1,05 1:13 1.08 1.08'
7 .80 .95. 1.03- ... 1.04 .94
8 .66 .83 .93 .87 .82
9 a .61 .80 .90 .71 .72
10 .52 .79 .78 .63 .66
11 .47 .63 .70 .59 .54
lba 12 .37 .56 .55 .51 .53
13 .27 .53 .51 .47 .49
14 .24 .48 .48 .44 .48
15 .18 .36 .43 .37 .38
16 .17 .33. .34 .36 .36
17 .28! .30 ,.25 .28
18 .11 .24 .25 '.2-1 .25
19
20
.11
:08
.23
.19
,22
-.15.20
.17:..
.17
.14 .
21 .05 .14 .14 .14 .12
22 , .04 .07 .10 .08 .07.
23 .03 .04, .to .05 .05
24 .01 .04 .05 .04 ,01
25 .0f .01 Al .02 -.01
26 -.01 .00 -.01 -.01 -.02
27 -.01 -poa -.05 -.07
28 -.02 -.04 -.05. -.06 -.09
29 -:04 -.05 -.09 -.09 -.10
30 -.07 -.12 -.13 -.13
31 -.05 -.op. -.14 -.15 -.16
32 -.06. -.10 --.17 -.16 -.19
33 -.07 -.14 -.19 -.21 -.2134 -.08 -.18 -.21 -.21 -.2335 -.10 -.24 -.24 -.26
36 -.12 -.20 -.26 -.27 -.2837 -.14 -.23 -.29 -,29 L.30
38 -.14 -.24. -.32 -.31 -.32
39 -.16 -.27 -.34 -.32 -.3540 -.18 -.30 -.35 -.34 -.37
41 -.20 -.30 -.39 -.37 -.3842 -.21 -.32 -.40 -.40 -.4243 -.22 -.36 -.42 -.41 -.46
44 -.24 -.42 -.45 -.44 -.4845 -.25 -.43 -..52 -.48 -.50
46 -.27 -.49 -.54 -153 -.54
Trace 16.02 . 16.26 17.01 17.63 16.41
* Using communalities" in the diagonal
I el.
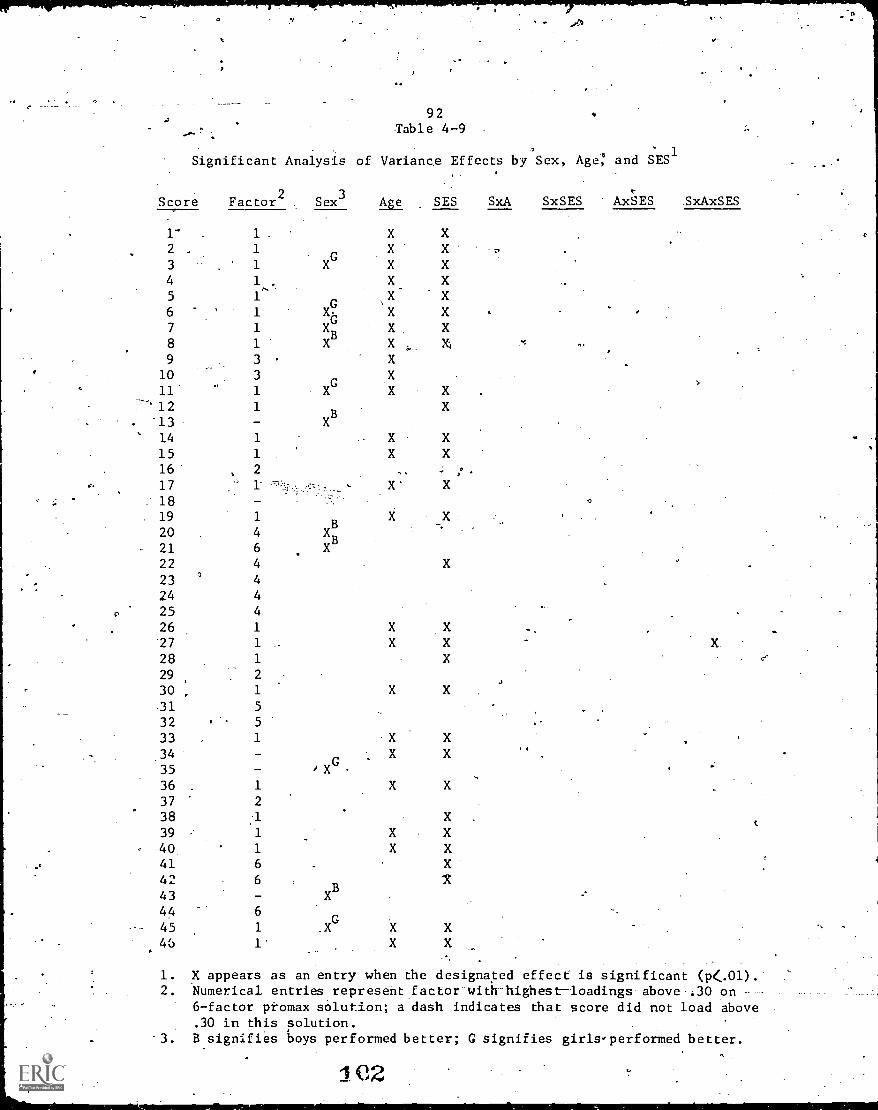
10-
92!fable 4-9
4
Significant Analysis of Variance Effects by Sex, Age: and SES1
Score
1-
2 ..
3
4
5
6
7
8
9
° 1011
---' 12
'13
14
1516
17
1819
20
2122
23
24
y 25
2627
2829
. 30,
31
3233
34
3536
37
3839 -
40414243444546
2Factor
3Sex Age SES SxA SxSES AxSES .SxAxSES
1 . X X1 X X I,
1 XG
X X1 , X X1' X X1 xd X X .
1 X X X1
BX X X,
3 X
3 X
1 XG
X
1
XB
1 X X1 X X
, 2 , ,- : .
1- , X' X
1 X X4 X
B
6 XB
4 X4
4
4
1 X X1 X X1 X2
1 X X_,
5
5 ,
1 X X- X X
Gi X
1 X X2
:1 X1 X X1 X X6 X6
B'X
X
6
1 XG
X Xl' X X
1. X appears as an entry when the designated effect is significant (p(A1).-2. Numerical entries represehtjactor-with-highest-loadings above-,30 on ---
6- factor ptomax solution; a dash indicates that score did not load above.30 in this solution.
-3. B signifies boys performed better; G signifies girls-performed better.
102
93
loading (of fhose...30 or higher), and significant effects are noted (p<.01) .
In chapter 2 we directed attention to dispropo'rtionalities and con-
founding of status classifications used in this report, pointing out the
limitation/ this situation imposed on interpretation of findings reported in
this chapter. Consequently, the findings reported below-must be read with
caution and any interpretations regarded as highly tentative.
None of the-iwo-:Way interactions were significant at. the -.01 level and
only one of the A6 measures had a significant three-way interaction. There
.: .
were a substantial number of significafit. main/effects. The description of.. ..
--the significant main effects is organized to correspond to the clustering
ft!
.
' . . .. .... .
of variables obtained in the factor analyses.
ANOVAS for measures on the, first factot were consistent in showing
significant SES differences and, with only three exceptions (Children's
Auditory Discrimination Inventory, Mimicry Final Word Sounds and Seguin
errors), significant age differences.* Thus, general information-processing
skills, conceptual understandings, and favorable responses to the testing
situation were greater for older children and for those from families of
higher Socioeconomic status. Not surprisingly, these findings indicatese
that cognitive-intellectual performance at this age period is a function of
both devel mental level and experience. Given the diversity of tasks
represen on the first factor, age and SES were shown to influence a
wide variety of behaviors. Differences were manifest on verbal, quantitative,
and perceptual tasks. Nonverbal as well as verbal performances were affected,
although for this sample-:at this age a verbal-nonverbal distinction may be
difficult to makesince the verbal component:of any task performance might
.*Of these three, only the Seguin failed to show e.ny age'difference; the othertwo tasks showed-marginally-significant effects for age'
1 0 3,
ti
O
I.94
be!substantial. For example, the child could not point to thea
picture that.
'matcbed the stimulus without understanding the meaning of the instruction.
Age and SES may be viewed, however, as differentially producing these
effects. Given the relatively shotit age span, only three measures-showed
larger age than SES effects--Child Cooperation, Vigor, and number correct on
the Enumeration task. These are sll among the few measures which Showed
significant sex'differences and,.if accord with:our later discussion of such
difference's, these results may indicate greater compliance and tsk persistence
along with superior motor coordination in older subjects.-On the other hand,
those measures which showed SES efectS which were largest relative to age
differences were the'Eight7BloCk Sorting Task,ithe M6tor.Inhibition Testscores,
Sigel grouping responses., and Story Sequence. .All these appear-tozreqUire not
only careful attention verbal instruction; but also the demonstration.
through another modality of a verbally-based understanding of the task, or,
conversely, verbal explanation of the chiliPs'own nonverbal performance. This
1. 4
difference suggests that higher SES is associated not only 'pith a greater
number of experien.ces--as age would' be- -but also with differences, in the.
'cognitive organization of.these experiences.
Those tasks which appear to require more active environmental interchange
showed larger SES and age differences. Thus, tasks requiring knowledge of
specific information (e.g., Preschool, Inventory) and communication skills
(Peabody g) showed larger differences than those requiring form discrimination
and matching or comprehension of syntax. The Caldwell was a particularly
difficult test for these children. Mean performance for the.total
group was 27.9. In comparison with data reported for the Head Start
pretest administration in t1.3-.:1 Fall of 1968, study children in a comparable
104
a 4
95
1. ..
. /age band (4-0 to 4-5) obtained a mean ::.core of 27.7 vs.. 30.0 for 'the
test standardization saMple72However, in looking at the/perforMance
of children froth blue-collar workers' families only, mean performance. .
was 24.3.
Particularly affected by SES were thosemeasures.asessfng the child's
ability to provide sorting rationales. Although approximately 50% of the
children were able to categorize in the Toy SOrting Task, few were able to
verbalize their reasons for doing.so. -As wa fodnd in preVious research with .
this task (Hess & Shipman, 1965),. differences were greater when the child
was :required to give a color rationale which taps abstract atd categorical
use o/language as opposeipte denotative and labelling usage.' In the
Eight-Block Sorting Task, the majority. of children placed the test blocks
correctly, but approximately.20% verbalized ane dimension and only 11% both
dimensions. Similarly, although most children were able to label the objects
correctly on the Sigel Object Categorization Test, few were able to give
appropriate verbal rationales for ther 'sorts. When reasons were offered,
they often had no discernible relationship to the grouping characteristics.
Similar findings have been reported for low SES children by Hess and Shipman
(1965);'Melton .et-al. (1967); Meyer (1971); and Sigel and hisassociaies
(1967). These results would concur with Cazden's (1968) statement that,
basic grammatical structures seem to be learned despite differences in the
chi.ld's linguistic environment; the manner-inwhich children use language
to express ideag, however, may be more sensitive to environmental manipulation.
differences.Mean between groups were similar for the various perceptual4".
tasks, but variations in performance level did suggest an ordering in com-
a
,
it
,
ik
96
/1/ ..plexity ranging from these' vtasks primarily ini form rm discriininatiOnP
; . _/".-(Johns ~Hopkins .and;Mat.ch guing Famidiar-,Fi res) to those requiring analysis
(Preschool Em8added Fi'gures and`PictIrreeomplet(ioh) and copying skills: ,
.(FornReproduotion).. Analysig skills' would appear l-6. require prior masteryi .. of discrigninaqon, which, in r-ir;''predupposes figure-ground separation.
Consequently one might expect these skills to be developmentally ordered,f
with the more ,complex functions developing at later ages than the simper..1f0
ones. (Birph, 1963, 1§6,7) . The Preschocil Embedded Figures Test and the'
PictureCompletion Test proved to be of cOnsiderabl difficulty. Mo_reover,
although the children were able to differentiate--tretweenssimple geometric
figures, form repro uction appeared to.,be a mech. more slowly developing0 .
skill. .Maccoby (1967) has qtated that while holistic perceptfon may suffice
for a, sirnple discrimination, it will not for making a copy; instead there
must tie perception of elem. ents of a figure in addition to the whole'. "
A few measures loading 9,n the first factor also showed.significant sex ;. .
r -differences: Cooperation rating, Preschool Inventory, Form' ReproductiOn
+.1
Mimicry Nonsense Words, Enumeration, and Vigor. In accordance with-previous..
findings, girls weA rated as more compliant and task - orient eld The fact,iti...7 . -
that girls performed significantly better on Enumeratiorl and not on Spontanr-,
`e`bus Numerical Corres$ondence suggests that this result is more attributable ,. , 4
to coordinated sustained attention than to any basic differenc.e.in undera . . `
2-
O
standing of number. pi As pointed out in the Enumeration Test to lc deqcription,'. . .
in a repetitious ,task of this sort, style and persistence,also play a. major -
a1.) - '
. .. .-'part in:determining the score:
.. .
...
1.
0
_
,4..
.*.'ts '7.-..4,-1
. ..
Sustained attention and compliance are also-ritical aspects of Mimicry.
I ef;
C-
*s, 24N
. . ''s +"
1
,
lar
*97
test performance; it also. has beennoted (Bever, 1970) that perceptual.-.
strategies and auditory dominance develOp.earlier in girls with resulting
facilitating. effects- on Consonant perception, The fact that significantL
...- sex and age effects were shown only for the Nonsense Words score and not''.
i
fortheReal-wOrdsFinal.sounds.scoremayhavebeendueta-the different..
\ ...__-.-. \
tasriemands;thatis, the short phrases used in the xeal Word items may. 0
`,
have introduced a memory component Dbrthis age!'group.. 'An equally plausible,.
hypothrlsis, however, is that the differenCeAfiscide to the relatively lower
reliability that'was obtained for the Real Words Final Sounds..
. .
The significantly higher. test performance of gir],s on the CaldWe11 and
ti
Form Reproduction items may reflect differential instruction in the home6.
since both tasks. would be highly, sensitive to differences in training.and
practice. As observed in the mother:child interaction situation-, g
appeared more attentive to, the mother as i teacher. Preliminary findings =
from the interview data (ETS, PR-70-20) revealed a small but' consistent_
trend for mothers of girls to be more'lrivolved in school relevant activities
:)(e.g., reading to their thild). These results 4so may reflect differential.
verbal interaction with themother (b th in amount and elaboration), as has
been Svggested in previous research (Goldberg, Godfrey & Lewis, 1987;-,
Halverson% Waldrcip,-1970; HesS et al., 0 Moss, 19k7) .
.
Unlike the above skill measures; boysobtained.hiiher_scores-on-the-Vigor
measure. MdreoverSES differences were relatively small as compared to age., .
- .
. .
,differences- These findings suggp- that physical coordination and/pr
, ..
4 ... ,
-.., maturation was a relevant comgbnent of crank- turning performance for this-ip 1
'sampleample at-this age period. The significant sex difference obtained may reflect.,r

98
effects-df sex typing, with greater reinforcement being given to boys at
this age for more active and assertive behaviors. These findingsplus the
low correlation of the Vigor score with other measures, suggest th\ only -a
small component of vigor performance is 1 adinvon Factor 1.
.
In contrast to the above findings, the three. latency measures that
defined FE.ctor 2 showed no significant age or SES effects. Sex effects
-also were non-significant, although boys tended co have longer latencies on
each of these measures. Thus the orthogonal relationship between the cognitive
competency and tempo factors was paralleled by an apparent lack of similarity
in the relationship of scores to age, sex, and SES.
The third factor in the 6-factor promax solution, defined by the two
scores from the Spontaneous NuMerical Correspondence task, showed only
significant age effects. Since it was assumed that these 'abilities were under-
going rather rapid 'change during this. age period, the potency of the age
variable was expected. The data from this task were in accord with Piaget's
4f
view (1052) that the understanding of number-at this preoperational stage,
is essentially perceptual in character, reflecting global rather than
articulated intuition processes. Most children fOund the task difficult
and matching to configuration was easier than matching to number. According
to Kohlberg's (1968) analysis, Piagetiar tasks are assumed to be relatively
Insensitive to specific instructional experiences and thug SES effects would
rhave been expected to be minimized. It should be noted that the other
quantitative measure, Enumeration, which is closer to computational skills
and-loaded on the first factor,. did §haw SES effects and; assUmingly, the
greater effectOlf exvi.iential differences.
1
08
t
99
The other Piagetian-derived measure, the Boy-Girl Identity Task, defined
a separate factor (Factor 6) and showed a different pattern of effects than
that for Spontaneous Numerical Correspondence. Paralleling its relationship
to the first factor (r = .36), performance on the "wish" items showed SES
effects. Boys gave significantly more constancy responses on the concrete
Girl items, but since this was not replicated with the Boy items and no other
significant inter-relationships among measures were obtained, such responses'
seem more appropriately described as "pseudo-constancy." This interpretation
is supported by the fact that although children above their age-group mean
on the Preschool Inventory were more likely to give a constancy response to
the "wish" items, - children who scot:: lower on that measure weje more likely
to give constancy 'responses to items two through five. Since developmental
trends were not obtained with this task at this age period, the SES results
may reflect differences in expectancies of the fulfillment of one's wishes
rather than in achievement of a reality judgment on gender identity constancy.
Factor 4-was defined by four of the OpenField Tes.t measures. Threeof
these showed no significant main or interaction effects, but boys obtained a
significantly higher mean play complexity score, and SES differences in talking
to the tester were significant. The former finding is consistent with previous
studies investigating curiosity which have repgrted boys as showing greater
preference for complexity w;-:en the behavior is manipulation rather. than visuAl
attending (Lucco, 1964),. Since talking to the, tester includes both task-
related verbalizations (e.g., requests for help, directing the tester's
attention to the task) and non task-related verbalizations (e.g., talking
about his family) and could reflect pOsitive or negative feelings about the
(39
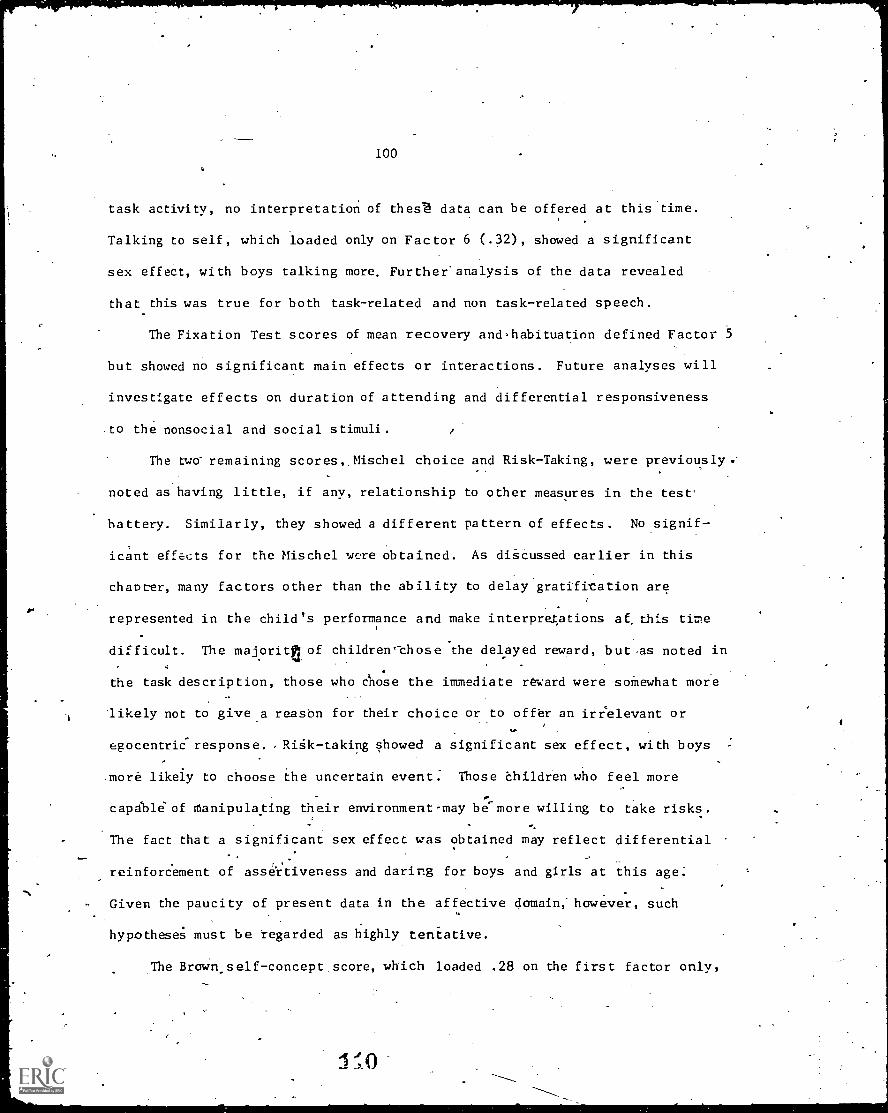
r
100
task activity, no interpretation of thes$ data can be offered at this 'time.
Talking to self, which loaded only on Factor 6 (.32), showed a significant
sex effect, with boys talking more. Further' analysis of the data revealed
that this was true for both task-related and non task-related speech.
The Fixation Test scores of mean recovery and-habituation defined Factor 5
but showed no significant main effects or interactions. Future analyses will
investigate effects on duration of attending and differential responsiveness
to the nonsocial and social stimuli.
The two remaining scores, Mischel choice and Risk-Taking, were previously .
noted as having little, if any, relationship to other measures in the test'
battery. Similarly, they showed a different pattern of effects. No signif-
icant effects for the Mischel were obtained. As diScussed earlier in this
chanter, many factors other than the ability to delay gratifi-eation are
represented in the child's performance and make interpretations of. this title
difficult. The majoritti of children chose *the delayed reward, but as noted in
the task description, those who chose the immediate reward were somewhat more
likely not to give a reasbn for their choice or to offer an irrelevant or
egocentric- response.. Rigk-taking showed a significant sex effect, with boys
more likely to choose the uncertain event. Those children who feel more
capSble of tanipulating their environment-may be more willing to take risks.
The fact that a significant sex effect was obtained may reflect differential
reinforcement of assertiveness and daring for boys and girls at this age:
Given the paucity of present data in the affective domain,- however, such
hypotheses must be regarded as highly tentative.
The Brown.self-concept score, which loaded .28 on the first factor only,
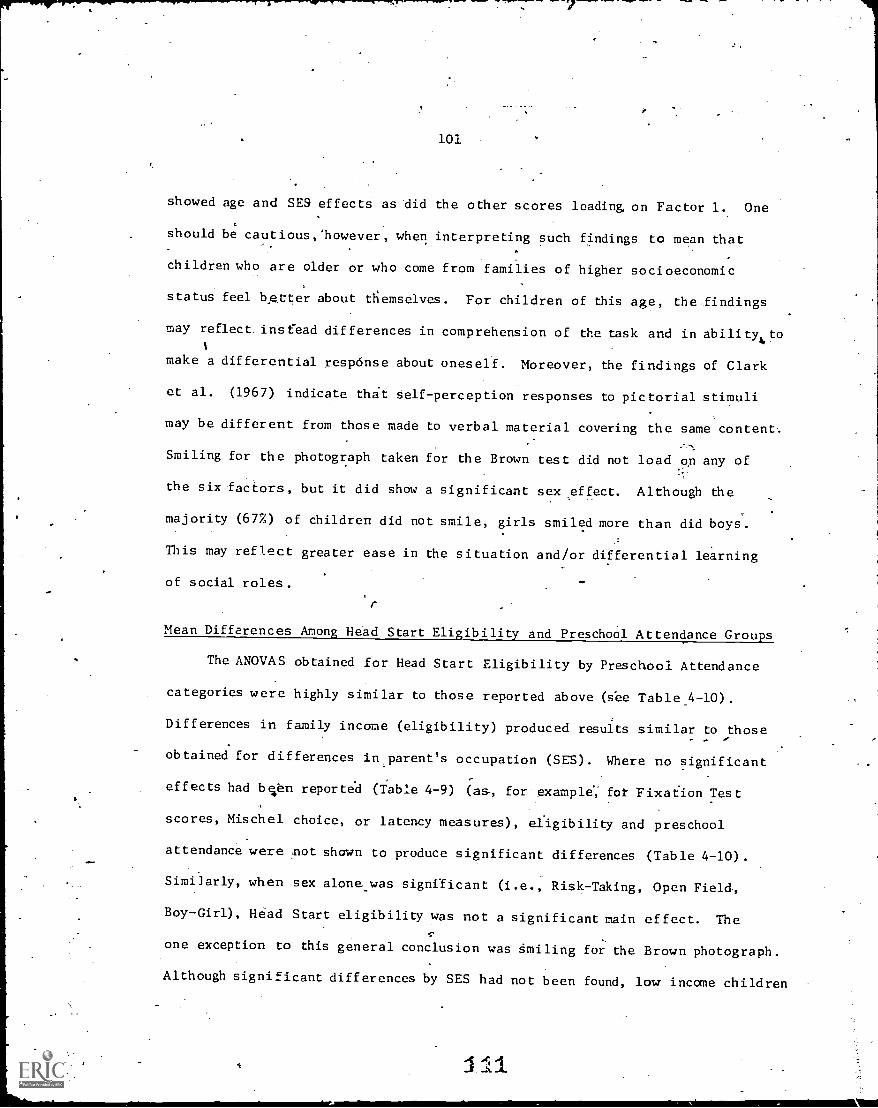
101
showed age and SES effects as did the other scores loading, on Factor 1. One
should be cautious,'however, when interpreting such findings to mean that
children who are older or who come from families of higher socioeconomic
status feel better about themselves. For children of this age, the findings
may reflect insfead differences in comprehension of the task and in abili ty4 to
make a differential response about oneself. Moreover, the findings of Clark
et al. (1967) indicate tht self-perception responses to pictorial stimuli
may be different from those made to verbal material covering the same content.
Smiling for the photograph taken for the Brown test did not load on any of.-
the six factors, but it did show a significant sex effect. Although the
majority (67%) of children did not smile, girls smiled more than did boys.
This may reflect greater ease in the situation and/or differential learning
of social roles.
'r
Mean Differences Among Head Start Eligibility and Preschool Attendance Groups
The ANOVAS obtained for Head Start Eligibility by Preschool Attendance
categories were highly similar to those reported above (see Table_4-10).
Differences in family income (eligibility) produced results similar to those
obtained for differences inparent's occupation (SES). Where no significant
effects had bepen reported (Table 4-9) (as, for example.; for Fixation Test
scores, Mischel choice, or latency measures), eligibility and preschool
attendance were not shown to produce significant differences (Table 4-10) .
Similarly, when sex alone_was significant (i.e., Risk-Taking, Open Field,
Boy-Girl), Had Start eligibility was not a significant main effect. The
one exception to this general conclusion was smiling for the Brown photograph.
Although significant differences by SES had not been found, low income children
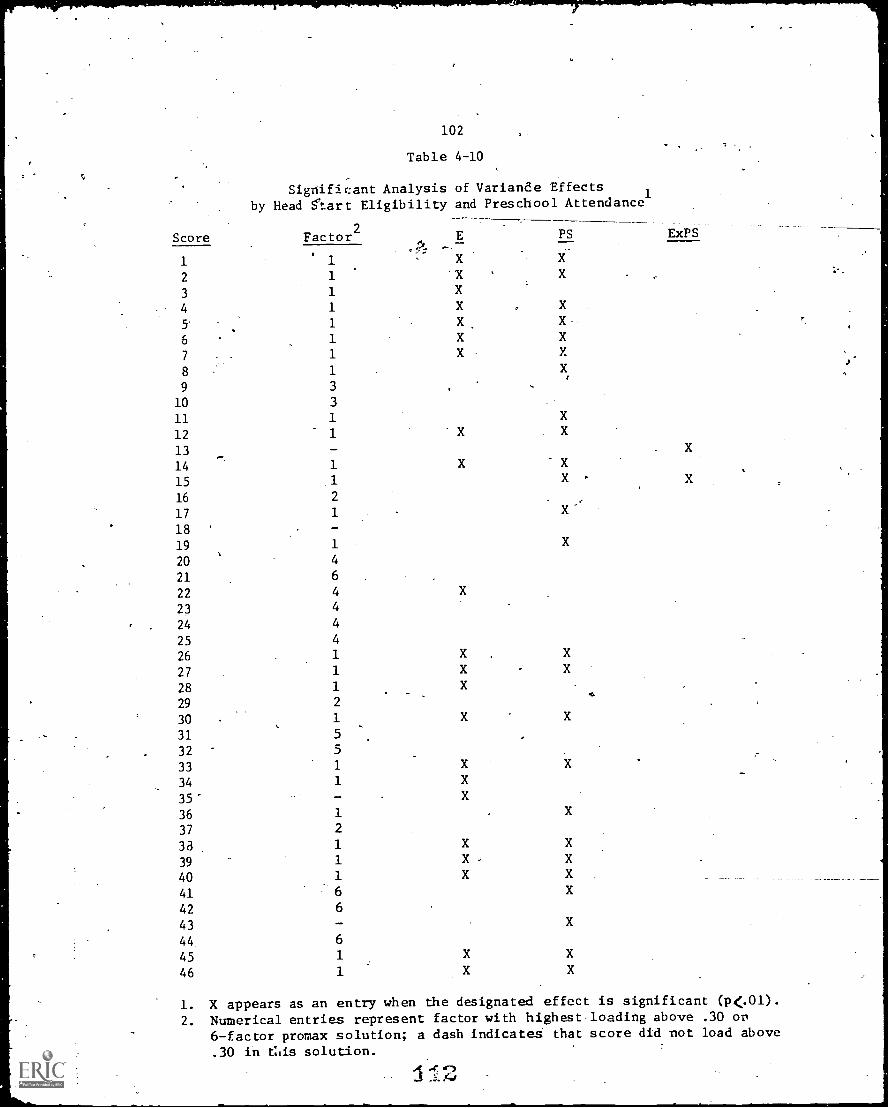
c
102
Table 4-10
Significant Analysis of Variande Effects1
by Head Start Eligibility and Preschool Attendance
Score Factor2 PS ExPS
1 1 X X
2 1 X X
3 1 X
4 1 X X
5 1 X X
6 1 X X
7 1 X
8 1 X
9 3
10 3
11 1
12 1 X
13
14 1 X X
15 1 X X
16
17
2
1 X.
18
19 1 X
20 4
21 6
22 4 X
23 4
24 4
25 4
26 1
27 1
28 1
29 2
30 1
31 5
32 5
33 1
34 1
35
36 1 X
37 2
33 1
39 1 x
40 1
41 6
42 6
43
44 6
45 1
46 1
1. X appears as an entry when the designated effect is significant (p(.01).
2. Numerical entries represent factor with highest loading above .30 or6factor promax solution; a dash indicates that score did not load above
.30 in t:iis solution.deed)
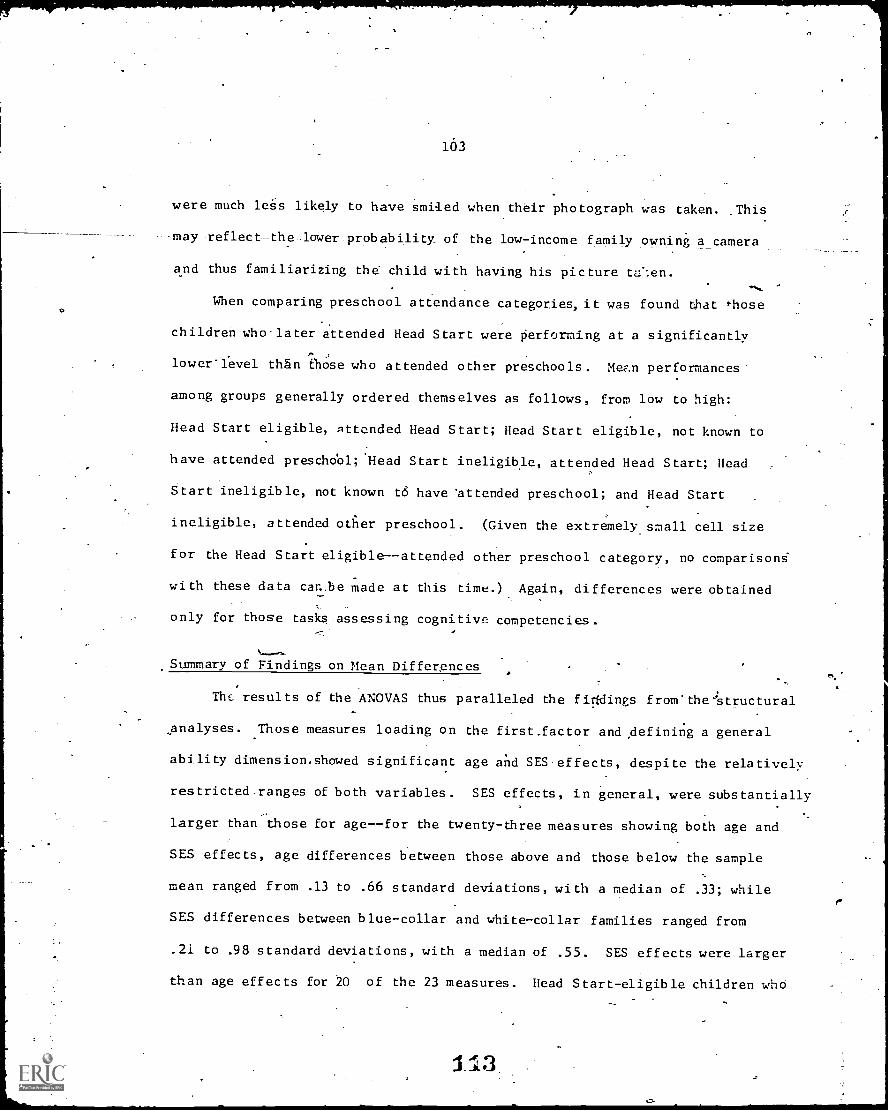
163
were much legs likely to have smiled when their photograph was taken. This
-may reflect-the -lower probability of the low-income family owning a camera
and thus familiarizing the child with having his picture te"-.en.
When comparing preschool attendance categories, it was found that *hose
children who-later attended Head Start were performing at a significantly
lower'level than Ehose who attended other preschools. Mez...n performances
among groups generally ordered themselves as follows, from low to high:
Head Start eligible, attended Head Start; Head Start eligible, not known to
have attended preschobl; *Head Start ineligible, attended Head Start; Head
Start ineligible, not known t6 have 'attended preschool; and Head Start
ineligible, attended other preschool. (Given the extremely small cell size
for the Head Start eligible--attended other preschool category, no comparisong
with these data car-be made at this time.) Again, differences were obtained
only for those tasks assessing cognitive competencies.
Summary of Findings on Mean Differences
The results of the ANOVAS thus paralleled the firtdings from' the "'structural
analyses. Those measures loading on the first .factor and defining a general
ability dimension showed significant age and SES effects, despite the relatively
restricted .ranges of both variables. SES effects, in general, were substantially
larger than those for age--for the twenty -three measures showing both age and
SES effects, age differences between those above and those below the sample
mean ranged from .13 to .66 standard deviations, with a median of .33; while
SES differences between blue-collar and white-collar families ranged from
.21 to .98 standard deviations, with a median of .55. SES effects were larger
than age effects for 20 of the 23 measures. Head Start-eligible children who
i13
104.
later attended Head Start performed significantly poorer on these measures;
both eligibility and later (self) selection for preschool experience were
associated with performance differences. 'Measures defining other-factors_ _
showed different patterns of effects. There were few significant sex
differences; those that were obtained showed girls performing better when
sustained attention was required,,whereas boys gave the preferred response
when assertiveness seemed a more critical component. It should be noted
that the usual finding of superior performance by girls on verbal measures
was not evidenced in these data: Girls generally obtained slightly higher
scores on the verbal tasks, but for this sample at this age these differenCes
were not significant. No such trends were present for the perceptual tasks.
Nor dicr boys perform better on tasks tapping analytic performance, as has
been found in previous research (Kagan, Moss, & Sigel, 1963; Sigel, 1965).
Whether such sex differences in performance on verbal and perceptual task;
will emerge in subsequent years remains to be determined. With one exception,
a Sex by Age by SES effect for Segut....4..time to quickest solution, there were no
significant interaction effects. Age and SES did not show different effects
for boys and girlg, nor d..:y SES hgve different effects for younger and older
children. Also, new clusterings of tasks according to patterns of effects
were not obtained.
In these analyses, SES (as defined by the occupation of the head of the
household) and Head Start eligibility (as defined by income per household size)
served as gross proxies for describing the child's environment. Future analyses
will include further delineation of processes in the child's home environment
provided by information from the parent interview and structured mother-child
105
interaction sessions. Such information should provide more direct evidence
on the environmental interactions accounting for differences in these test
performances.
115
Chapter .5 CONCLUSIONS
V5.
Structural-analyses-of the-Year 1 child-test data yielded (a) a general
ability dimension (i.e., :information-processing skills) cutting across con-,7_.
tents and operations sampled in the cognitive test battery and (b) a
stylis%ic response tempo dimension. Additional factors apparently tapped
task-specific styles and beha7iors. 'Although previous research has reported
differentiated abilities in very young children ranging down to ages two and
three (Hurst 1968; Meyers, Dingman, Orpet, Sitkei, & WattS..; 1964; Meyers,
-Orpet, Atwell, & Dingman, 1962; McCartin & Meyers, 1966), and several cog-
nitive dimensions have been delineated in analyses of infants' and preschoOl
children's performance onistandard.preschool scales (Stott & Ball, 1965;
Ramsey & Vane, 1970), primary factors differentiated by content, operations,
and/or products did not emerge in the present data. Given the generally
high-internal consistency of the various scores and their moderate to low
communalities, considerable non-error specific variance remained. These
findings were strikingly consistent across a variety of statistical methods
e
and across major subject classifications (i.e., by sex, age, .F.S, preschool
attendance controlled-for eligibility, and Preschool InventotY score).
Many theorists, including Piaget and Guilford, emphasize the importance
of interactions with the environment for intellectual development. Although
the child may start with certain innate mechanisms, such as pre.ispositions
for Guilford's five operations. or Plaget's invariant functions of assimil-
ation and accomodation, the rate of progression and the variety of dimensions
in cognitive functioning appear to depend upon-the extent to which these
mechanisms are exercised in interaction with a varied environment (Hunt, 1961).
106
1.16
103
Ferguson (1954, 1956) has suggested'that cognitive factors reprpsent
behavioral domains that happen to have been learned together, along with.
those similar behaviors that becoine associated through generalization of
learning and transfer. As'Messick has pointed out (ETS, PR-68-0_, some of
the determinants of these shared learnings are developmental, in the sense
that certain thi.lgs are experienced together because they are appropriate
to particular ages, but most of the determinants appear to be more directly
sociocultural (Lesser, Fifer & Clirk, 1965) :It would be expected from a
transfer theory of abilities that factor structures would be more clearly
defined for subjects having had the benefit of more varied experience. Thus,
the absence of differentiated factors in the present data may reflect a relatively
narrow range of environmental variations experienced by this sample as Compared
to subjects' assessed in previous studies. For example, Meyers et al.(1964),
Stott and Ball (1965), and Ramsey and Vane (1970), who tested children from
primarily middle-class and upper-class socioeconomic backgrounds, found
greater evidence for differentiation at this age or even earlier,.
There was a substantial amount of variance in-the present data, however,
that was not part of the general ability dimension. Using unities in the
diagonal, less than one quarter of the variance for the total test battery
- was accounted for by "g." The lack of clustering prevents us from knowing
at this time if such specific variance is related to special abilities limited
to one task, incomplete sampling of the processes represented by tdsks, or
particular situational determinants. The fact that a.geneial ability(dimension
or "g" was snmewhat less evident in less mature subjects (i.e. in younger
children and those performing below dAir age-group mean on the Preschool
Inventory) suggests that for this sample at this age behaviors were being
17.
108
tapped at the beginning of a period of integrz'ion rather than during a
period of.differentiation. Subsequent measurement might be expected to
reveal increasing common variance on "g" followed later by increasing
differentiation in terms of contents, operations, and /or products. Dis-
continuity in cognitive structure would thus be indicated by changes in the
number or size of dimensions over time and/or by changes in the meanings of
dimensions as revealed in new patterns of correlates or factor loadings.
The tentative finding of a battery-defined clustering of cognitive
measures suggested the role of situational determinants (i.e., day and
tester> as a secondary structuring variable. Perhaps children from more
restricted environments are less familiar with test-like settings and,
ti
therefore,, show greater variation in performance across days. Some children
may increasingly adapt to testing and generalize skills learned in the test-_
ing situation while others, especially those who find the tasks or the tcsting
center situation more difficult and frustrating, may become increasingly
alienated from the situation. This interpretation suggests the possibility
of analyzing the data by categorizing_ groups of children by extent of consistency
over the four testing days. Comparative data for groups of children so defined
would, of course, have to be controlled for tester and order of administration
of the test batteries. This battery effect, however, was least for those
measures with highest loadings on the general ability factor. The child who
appeared particularly able in one assessment was generally able in another.
The less clearly defined general ability,dimension whidh was found for
the younger, less "academically" prepared, and economically poorer children
in the sample may reflect both greater susceptibility to situational
determinants and less' generalizable information-processing skills. That is,
109 C.
they may have been less able to apply what they know, or, in Piagetian terms,
to "decenier." The difference in ge neralization o f these skills would seem
to reflect differential training and practice in the various.task components
as well as in the transfer of skills from one task to another. .These data
would suggest that the differentiation seen in the present data is task-
specific and may not be under the control of generalized cognitive mechanisms.
With continued practice and experience, cognitive mechanisms may come into
play that will give order and consistency to these behaviors. It may be that.
ohly after such integration and generalization of the specifpcS occur can
differentiation into stable cognitive factors take -place. Longitudinal data
will enable us to chart such developmental patterns and assess the dffferential
utility of various Cleories such as Garrett's (1946) hypothesis of a single
general ability that differentiates over time or the more general notion that
cognitive structure tends to become increasingly differentiate4 (and hierarchi-
cally integrated) during the course of development, as propounded by Werner
(1957) and Lewin (1951) .
A major question posed in the study was the relationship between
cognitive style andSkill. The concept of.ability implies measurement of
capac:ties in terms of-maximal performance, whereas'the concept of style implies
measurement of preferred modes of operation. Both are necessary for a full
understanding of cognitive functioning (Cronbach, 1960). Some controlling
. -mechanisms represent iimensions of individual differences in the/structural
characteristics of the cognitive system itself. Other controlling mechanisms
appear the form 'of preferences or information-processing habits, which
determine aserson's typical modes of perceiving, remembering, thinking, and
problem-solg. In the Year 1 test battery an attempt was made to assess
.19
110
the cognitive styles of reflection-impulsivity.andanalytic unctioning. 'f
There were-too fewiscorable.sorting rationales,given on the Sigel to asSess
differences in preferred-categorization ,stylp_at, ,,,, ,,, - , ,, .
---,
Sigel in future years of the study should enable us to assess not Oply the
child's classificatory ability over time but mode and stability of response
s ty le,.
A general dimnsion defined by the three latency meastfres did emerge.
However, the orthogonal-nature of the tempo dimensipn'tothe general ability
dimension suggested that for this sample-at this:age temperamentil. Components
have not yet been integrated into the cognitive-do main. -The orthogonal
relationship between cognitive competency and tempo Lectors wds paralleled
by an apparent lack of similarity in the relationships of scores to age, sex
and SES. Moreover, other possible indices of the impulsivity dimension--
the ability to-inhibit a response when appropriate' and the ability to delay
---\gratiffcation--were not related to the latency scores or to one another.
In accord with"recent findings (McGaw & Joreskcig, 1970; Wasik &
Wasik, 1969), the factor pattern was relatively constant ovia range of
socioeconomic and ability levels. Inspection of stand'ard eriors of the means1'
and patterns of correlates of ye measures in the Year 1 battery indicated
no majpr differences in construct validity of the tasks for the major cIassi-
fications used in these analyses. Similar results were reported by Stevenson
et al. (1971) who found the pattern of interrelationships among learning
. -tasks for four- and five-year-old low-income children to be similar to that
reported for middLe-class prescfloolers.
Mean performance levels did.show significant group differences, however.
Performance on those tasks defining the general ability dimension.was shown
1. 0
-
' 4 "
a
Ilf
to be aAinction of deveopmental leve/ (age) ana expiience (socio"8"tonOmic, . .
t
N
- -..
status),, despite the relatively restricted ranges of.bath variables...,
studySeventy-five percentc.of the-tUdy childTen who were eligible for Head'I
Start did ..attend Head' Start subsequent to our initial: testing.Wcprdine,
o -4 , 'S..
, .to the present resulfs these children generally were'p:erfCrmingsignificantlY
1
.
. ...... . .
.less well on a yariety of cdgnitive-perceptual tasks prior to th4ir enroll--
..
. .
ment. Such effects were particularly evident on tasks. highly saturated
with "g'" including those tapping-acquisition of information considered'.
necessary for success in school (Breschool Inventory and Peabody)"and use of
language as . cognitietool e.g., classificatory skills).- Piaget has
argued that.classificatory structures which emerge during the presChool. 1, ---
years are an essential, foundation for later concrete operations '(F1aven,, ..
1963)N Longitudinal data may enable us to.asI sess the extent to which retar-,
datior in the development of logical operations in socioeconomically disadi-
children may be due to inadequate foundationsJor'st}ch processes.
Those children who later attended other preschool programswere fourd
to be more advanced prior to entering any preschool program. As pointed out
in Chapter 2, however, the variables defining the several groups are con-,
founded and thus, no simple main effect comparisons for classificatory variables
such as Head Start vs. non-Head.Start can be4made without careful consideration
of"their interactions with?other variables. For example, preschool attendance
is. confounded with site, race, and the four indicators of socioeconomic....iotatus
(mother's and father's educational and occupational levels). Thus, to inter-
pret simple.mean differences for Head Start vs.. non-Head Start - groups would
be quite unwarranted.
.
Assignment of tasks to the "cognitive domain/2-does not imply they
121
112
-are independentof motivation. For the young child especially, one cannot
separate intellective and non-intellective Specifically, motivat9.t
ional factOra cannothe separated from the learning process. As was found,
a
measures of persistence and cooperation loaded on the general ability dimen-'
...
siOn (cf. Zigler. & Butterfield,'168). Although there was prubably
insufficient sampling of such behaviors, in the ,test.baftery to produce
%
'factors in the. affective domain, the affective domain may not be highly..
.,.. :
diffetentiated at this age. HoWever, there was rather strong .evidence fat
differentiated personal-social characteristics of .these children when seen
later in the ClassrOom setting- (Emmerichv1971).
Foi this sample at this age "non-cognitive" measures did not show the
Same SES dilfetences found on the measures of cognitive competency. 'The
--majority of children were willing to choose the uncertainoutcome, to accept
the delaSred reward (which alsO might be seen as'an uncertain outcome), and to
express positive statements about themselves.. Consistent with the findings of
. .
other investigators (Brown, 1966; .Clark et at., 1967)., self-concept scores were
predominantly high. ThiS may reflect the fact that "significant otherse" at
this age are primarily family members and particularly the mother,.whom'we
might expect the child to perceive in a supportive role.* As the child grows.
older with increasing opportunity for interaction with others in a variety.
of situations, we would expect a more differentiated concept of self to
eirtrge,.resulting in greater variance of scores. For many low-income
children, especially those of minority status, such interactions may lead to.
negatiVe self-evaluations and markedly lower scores'(Katz, 1969;-,Tannenbaum,
1967).:
The aboVe .discussion should not lead us ter overlook the most striking
finding o.a11,naMely the wide.range of variation in performance exhibited.
- .
*In subsequent.analyses we 'will look at the child's self"concept score inrelation.to.the mother's supportiveness in the interaction t!Isks.
'113
Although group differences were statistically significant, many mean dif-.
ferences in task performance weresmall relative to within-group variability.
Low-income youngsters are not a homogeneous group. Children from low-income
families span a much wider range of cognitive, personal-social and perceptual
functioning than some would have us believe. The fact that the same factor
pattern was found within the low SES group reflects this finding also.
"In general, tasks in the Year 1. battery proved to.be appropriate for
this age group. They Were sensitive to individual differences, were enjoyed
by most children, and were. relatively easy to administer. Of7TiaYticular impor-----
tance for this age group was the fact that the tests were not speeded tests
and the administration procedures allowed for great flexibility. Because
of the young child's greater susceptibility to situational variables in test-.
ing (Sattler & Theye, 1967), the total testing climate was geared toward
making the child more Comfortable. Time was taken to establish rapport.(in
some4cases, several.days), relatively familiar testing rooms in church schools
were used, and the tasks were administered by local testers whose dialect and
race (wherever possible) were similar to the childis. Future analyses, will
investigate influgnces of tester characteristics on child performance. All
(/of these factors contrfbuted o'a congenial'and supportive atmosphere.. In
addition, we attempted to schedule so that each moth,2r could accompany her
child on the first testing day. These test conditions, diffeiing as they do
from the rigidities of.non-essential components of standardized practice, may
have contributed substantially to the level of competency observed -- as well
as to the validity and reliability of measurement.
It should be noted that the present analyses imply a linear model of
cognitive growth. Emmerich (1968) has made a distinction between "differen-t,
tial" and "classical" views of sequential structural development. The
114
differentiation hypothesis, which assumes increasing differentiation of the
cognitive domain with development, was discussed in the first section of
this-chapter. However, there is also the possibility that individuals pass
through a developmental sequence of qualitatively different structural
organizations, usually held to be in an invariant order, which is the more
classical developmental view of stage progression. Several theorists have
postulated such a developmental sequence of stages, usually involving three
major phases that encompass similar phenomena from theory to, theory but are
labelled in somewhat different terms_ such-as sensorimotor, perceptual,
and conceptual-0%1e er 1948); enactive, ikonic, and symbolic (Bruner, Olver
& Greenfield, 1966); perceptual, imaginal, and conceptual (Thurstone, 1926);
or sensorimotor, preoperational, and operational (Piaget, 1950). The emphasis
in measurement would then be upon the assessment of qualitative features that
are characteristic of particular stages of cognitive functioning and upon
ordered sequences of tasks capable of gauging the transition from one stage
to another.
The present analyses were based primarily on total scorei-Vhich might
mask differences in patterning or level of response; data reduction entails
a risk of-losing critical information. Moreover, few "markers" of stage
level are represented in the Year 1 battery. An exception is the Sigel Object
Categorization Test; analyzing the performance of children differentiated into
three groups that may represent different developmental stages -- i.e., above
the median on nonscorables, on color responses, or on form responses might
give clues as to developmental stage. Recent findings reported by Katz (1971)
suggest that the change from color to form sorting reflects a change in the
115
tendency of children to go beyond perceptually dominant stimulus characteris-
tics.and to analyze, reflect upon, and use alternative dimensions. Younger
children, because they tend to process impulsively and do not 'decode all
relevant-stimulus information, respond to color on color-form tests more
than reflective children. Thus, changes in cognitive tempo associated with
age (not age per se) may aCcount for differential responding.
Thoae tasks that might have yielded scores representing different
levels on a developmental scale (e.g., Boy-Girl Identity and Spontaneous
Numerical Correspondencej_d_id-no-o-s-oe.The Boy-Girl Identity
Task did not tap a-cognitively based reality judgment of gender identity
constancy in his population at.this age, but instead yielded four reasonably
.orthogonal sc resj children's performance on the Spontaneous Numerical
11\
CorrespondenceTaSk indicated that understanding of number at this pre-
\, _
operational s age 'was essentially perceptual in chpracter, reflecting global
rather.than articulated, intuition processes. Thus, the study children were. _
generally preo erational. Measurement in subsequent years on these tasks
might provide such scaled scores. Also, additional tasks amenable to such
I
differentiated scoring have been included in later test batteries. The later
use of conservation items with the Spontaneous Numerical CorrespOndence TaSk
will enable assessment of changes associated with shifts from preoperational
thinking to concrete logical operations.
1
Efforts will continue in deriving other, more sensitive, indices of
level of performance and of task sequences. The generally quick test responses
\
of this sample Suggest Ithat at this age Most subjects could not inhibit long
\1
enough to enablecognitive processes to operate optimally in contexts where
?
116
greater reflection would be functional. As.suggested recently by Eska and
Black (1971), future analyses may fruitfully separate children into
"reflective" (long latency, lbw errors),. "impulsive" (short latency, high
errors), "quick" (short latency,. low errors), and "slow" (long latency,
high errors) groups in order to obtain a better understanding of the factors
which influence and/or determine a particular respomt style. Moreover,
given the likelihood that response sets are particularly important in the
responses of young children (Damarin & Cattell, 1968), further internal
analyses of tasks will be directed toward investigating such effects. For
example, it was noted in describing the findings from the Children'sst
Auditory Discrimination Inventory that children showed a differential
preference for pointing to the real as contrasted to the,nonsense picture.
For these analyses, in which children would be grouped on: various attributeS,
utilization of inverse factor analytic and other clustering techniques
might be explored.
Further understanding of the present data will be provided by mapping
out similarities and differences in sociocultural determinants. Planned
analyses will assess the extent.to which.task7specific variance separates
variously defined groups, both with and without partialling out "g."
Tasks loading on the first factor range from general to specific, and
common dimensions may be defined where shifts in determinants occur. Con-
figurations of the data provided by the smallest space solutions could define
clusters of behaviors with similar sociocultural determinants. Moreover,
the variety of measures included in the study enables one to examine the
r.components of related but not identical constructs (e.g., cognitivi styles
I
117 .-;
as defined by Witkin (1967) and by .Kagan and his associates (1964).
The findings of McGaw and-JOreskog (1970) in studying the factorial
invariance of abilitymeasUres in high school subjects differing in intel7
ligence and socioeconomic status suggest the value of looking at SES
differences within ability level. They fond the gap in mean factor scores
between low_and,high-SES groups to-be-muchwider-for. low IQ than for high IQ;--
the facilitative effect of high SES thus appeared greater for low IQ subjects.
Similar findings have been reported by Willerman et al. '0.97P) for infants
and preschool children.
The.above discussion illustrates .some analyses presently planned to
help tease out complex interrelationships among variables that must bev
.
investigated before one can understaud the complexity of the child's func-,
, t
.,
...
\ tioning in the test situation. The .next report will describe cross-method
/ . . ..
.
..i.
(i.e., data fromtests, interviews and interaction situations)--cross-doman .
,,
:
'analyses essential todelineating underlying processes. Present analyses :,
.
.
.
.
-iused occupation of head of houSehold,and.income as gross proxies for_
,
... assessing the child's environment. These indices assume constancies.of.
. .
- . meaning within and across groups, and they tell us little about the type.
of. stimulation' the child is..being exposed to 4 the home environment. Within .i .
;
a given SES level, the range of home environments can be so great as to.t:
.
::make any generalizations about SES level and development extremely tenuous)
C...,,:. ,.
(Pavenstedt, 1965; Tulkin, 1968;'Zigler, 1968). More fine-grained analyses
will become possible using indices from the parent interview and mother-
child interaction sessions. For example, we will look at the effects of\
;
variation in experience on the child's ability to use language as a toolr
0
;.;*e
1.72,7
118
for symbolic or representational' thinking, The present data as well as
-those recently reported by Golden et al. (1971) suggest that the effects
of variety of experience are particularly salient for dhoSe behaviors
reflecting the cognitive use of language. the first project report
(ETS, PR-68-4), Shipman and Bussis delineated other process variables in
the child's environment that appear to be particularly influential in
the child's cognitive development, especially the -role of the mother
in selecting, structuring and transmitting information about the environ-
pent to her child and in regulating his behavior in relation to both
the environment-and the information transmitted.
Data in subsequent years will enable us to evaluate hypotheses
generated by the present structural findings; especially whether there
is increasing integration of cognitive behaviors followed by differentiation
into clusters, as those found in previous research. We will also
bt able to assess the effects of differential experiences provided by
Head Start and other preschool programs. Such experiences would be expected
to show differential effects depending on the nature of the processes
involved and the level of the child's functioning.
J
.4
F4STAT
F4STAT is a set of building blocks with, which general or special purpose
programs can be assembled with ease and without the user of the resulting
program necessarily being aware of the existence of the F4STAT. F4STAT is a
system of subroutines, compatible with .both Fortran and Cobol main programs.
This system was originally designed in 1964 for the IBM 7040 and was trans
lated to the IBM 360/65 in 1968. It has been in continuous operation at ETS
in both production and research functions since 1965 and is used by both
Cobol and Fortran programmers. This long experience with operational aspects
assures its freedom ,from programming errors.
The F4STAT system recognizes that mathematical manipulation is but a.;
small part of data analysis. It is not unusual for the creation of a data
file, including its editing, to be far more expensive and time consuming than. .
the statistical manipulations. For, this reason, F4STAT has a number of
special editing features as well as a capability of handling complex files.
It also has an extensive collection of statistical procedures. Both the
data and statistical procesges are based on unique basic modules. Data and
files of data are operationally defined by procedures rather than aesthetic
symbols in a computer memory. The operational definition allows not only
complex transformation but also complex file organizations. The statistical
processes are built on concepts of special matrix operatorV described by
tr.
Beaton (1964). The combination of these facilities permits the same language
to be used for both data manipulation and mathematical analysis, and indeed
it is customary to do both in the same task over a data file. This process
minimizes the number of reads and writes performed, minimizes temporary data
OY
121
1.20v
- 122
files, and minimizes computer costs.
The design considerations in F4STAT are as follows:
1. Accuracy
' The F4STAT subroutines are continually undergoing accuracy
.checks to assure the adequacy of eh6 arithmetic in our programs..
Whenever F4STAT can identify computational problems (e.g., multi-
collinearity), it warns the user of possible problems- All addi-
tions to F4STAT are very carefully checked before admission to
the system.
2. Generality
A statistical system must be able to perform any computable
statistical analysis presented. Over the years, F4STAT has grown
to include many subroutines for descriptive statistics, correlation
analysis, factor analysts, and the other techniques .mentioned in
the data analysis section. The basic building blocks described by
Beaton (1964) assure the very wide variety. of application. The
system is also Ilexible in that newly developed algorithms can be
added,.
3. oEfficiency .
In working with large data bases, efficiency is a very important
factor. F4STAT is considerably faster than other statistidal systems
largely due to its efficient use of storage; that is, F4STAT does
as many operations as possible in One pass over a data base.. Its
algorithis are efficient as well as accurate. Such properties are
e-3pecially important in large analyses such as these.
L
123
4. Ease of Use
This project depended upon flexible, easy to use programs
to dospecific tasks with t -he data base. This was accomplished
by building tailor made, easy-to-use programs for specific tasks
from the F4STAT repetoire.
5. Transportability
Since Fortran is the basic language of F4STAT, the package
is easily transportable to other computer systems.
6. Output.Readallility
F4STAT routines allow labeling of output so Chat a user may
have the mnemonic labels as assistance in interpreting the output..
There are a number-of very general output routines as well as
service routines for tailoring output for specific needs. Examples
of some output of descriptive statistics are shown in the analysis
section.
';
iY
1

124
Derivation of Tucker's Procedure for Estimating Communalities.
Professor.Dedyard R. Tucker has suggested a modification of Thurstone's
procedure of using the highest correlation to estimate the communality of a
variable. .A brief derivation of this estimate is presented here.
Given the factor analysis model
. Er.., = a a,jj k j k
o-
where rjj
, is the correlation between variable j and variable and
° ajk is the loading of the jth
variable On the kth
factor. If variables
and j' are co. lInear.in the factors, then an orthogonal.rotation exists.
1
such that
rJJ
=- a. aj,l
Assume that variables .j and j' (jam i j'.) are co-linear in the fitors,
where j' is the variable which correlates most highly with variable j .
Then,
and,
41.
E rjj"
I ai I I.
= !ail' I ajnil.+- 0 ,
I+ 0
a.
Where
where'
Iri,jin
a.,
i"
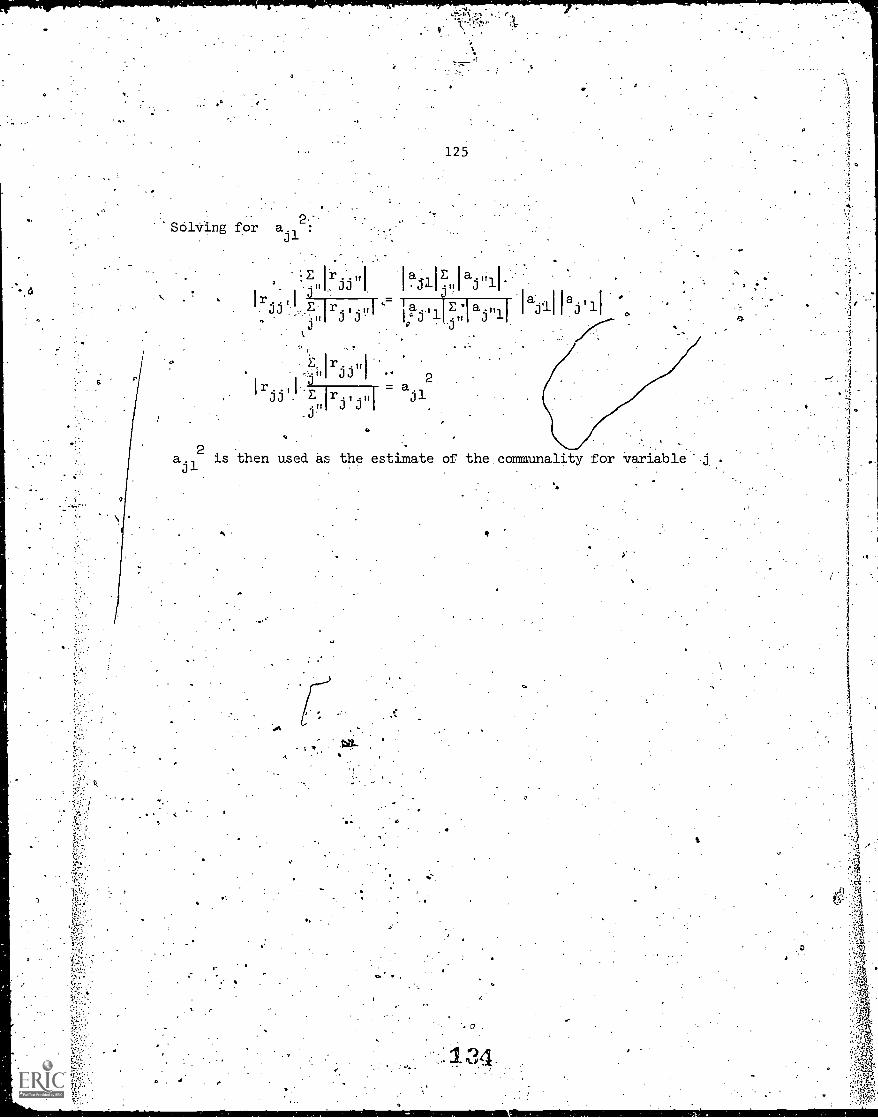
SokVing for a.12:
ail2is then used as the estimate of the communality for variable
125
' '' l'i,1 "I ,i'llciaj"11.Ir..,lin
i a Pj.'il z 1 aj"1JJ ,.......'
, iv0
....
.iiiri..1J 1 ..
2r..,I,JJJ E Ir ., .,I
- ajl
.j" 3 3
a
I la
... .
.
_-.. +.- -..' t ."""r"--:^-*'"-"'"-:-'3:"!--,`"""."797:9C-. '"rl!nr,°7,-.,-4n-,r!4!r,..,-n..:rr-,-,-,r,,,..r,--s,-ffr-,-,,r,r.:,. -.,,,, ,PA.1.SIr-.(1;i,-.,:,.-,;-=,:.:::::,.1...,A:...7.:. . , . .... . , . .
. .
a
-
NOTE
Appendix B presents abbreviated task descriptions.for child measures
administered in Year 1 which were in the analyses for this, report. The
.information On'each task is intended to serve ag an outline; data will
ppear in more comprehensive form as a compendiuM of Technical Reports as
a part of the next report. The present task descriptions provide informa-0 -
tion on.genek.task rationale, administration and scoring procedures, and::..t.
re properties ft)r those scores used in the present Structural 4nalyses.
Also, sample.characteristiCs are presented as defined by age and /sex
categories. The information in these tables typically lncludeS-the number
of. observations, the mean, the. standard deviation, and the percentage of
children responding for each possible response category (a identified.in
the table headings). Percent Response is replaced by Perc ntiles (10th,
25th, 50th, 7.5th, 90th), where continuous scores are used. The percent
response option may provide a total cell count differen 'from that used in. ?
._\. . 1. .
the total mean.; since .6.676-E87-ottesten-srr chiadrien's refusals are
. ./ .
included in the response total but not in the total n{ean. Where percentilei
intervals are computed, testers' errors and childre's refusals are
o, 1.
excluded from the total count so that the total it7 .the percentile ce.ls
I
agrees with the total count for the mean. Also, /in comparing the number
of subject's by task, either across classificatio s or ,by composite1
used in deriving indices of reliability, totalN'sfor a task may vary
slightly due either to the aboVe adjustment§ or to periodic updating of
Master'ille information....
totals
NonimMeniiiiii11111111011111111.11110111111
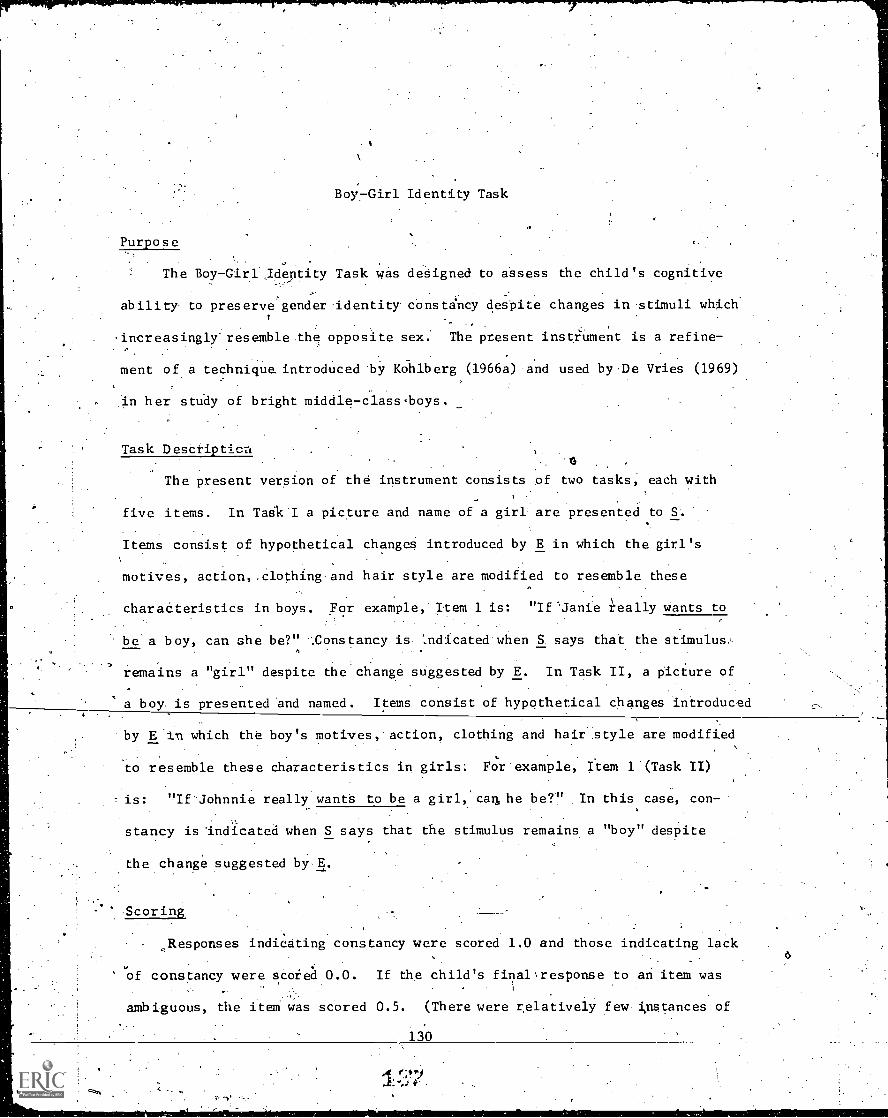
Boi-Girl Identity Task
Purpose
The Boy-Girl _Identity Task was designed to assess the child's cognitive
ability to preserve gender identity constancy despite changes in stimuli which
increasingly resemble .the opposite sex. The present instrument is a refine-,
ment of a technique introduced by Kohlberg (1966a) and used by ,De Vries (1969)
n in her study of bright middle-class .boys.
Task Descripticri
The present version of the instrument consists of two tasks, each with
five items. In Tas1 I a picture and name of a girl are presented to S.
Items consist of hypothetical changes introduced by E in which the girl's
motives, action,Clothing.and hair style are modified to resemble these
charaCteristics in boys. For example, Item 1 is: "If'Janie really wants to
be a boy, can she be?" '.Constancy is Indicated when S says that the stimulus
remains a "girl" despite the change suggested by E. In Task II, a picture of
a boy is presented and named. Items consist of hypothetical changes introduced
by E in which the boy's motives, action, clothing and hair style are modified
to resemble these characteristics in girls: FOr'example, Item 1 (Task II)
is: "If Johnnie really wants to be a girl, can he be?" In this case, con-.
stancy is 'indicated when S says that the stimulus remains a "boy" despite.7
the change suggested by E.
Scoring
°Responses indicating constancy were scored 1.0 and those indicating lack
f constancy were scored 0.0. If the child's final \response to an item was
ambiguous, the item was scored 0.5. (There were relatively few,instances of
130
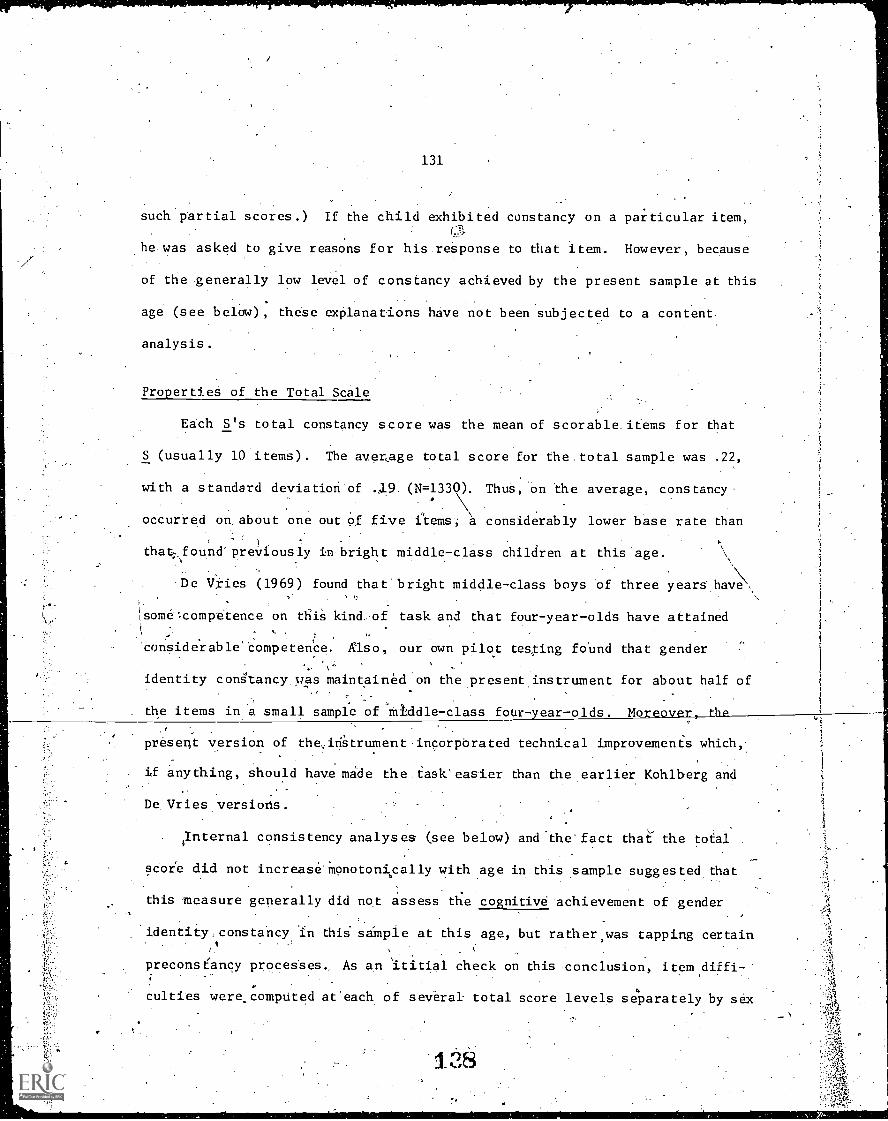
/
/
131
such partial scores.) If the child exhibited constancy on a particular item,
he was asked to give reasons for his reaponse to that item. However, because
of the generally low level of constancy achieved by the present sample at this
age (see below), these explanations have not been subjected to a content
analysis.
Properties. of the Total Scale
Each S's total constancy score was the mean of scorable. items for that
S (usually 10 items). The avenage total score for the total sample was . 2 2 ,. -with a standard deviatiori of (N=1330). ThuS, on the average, constancy-
occurred on. about one out Of five items; a considerably lower base rate than s
,, ,
)
that, found' previously in bright middle-class children at this age.,,..,
\ ;, .
' 1-: De If.ries (1969) found that bright middle-class boys of three years hav\,,,
e ,
1`competence on t is kind. of task and that four-year-olds have attained. .I
.
iconsiderable'Competence. Risc), our own pilot testing foUnd that gender
I
1
iidentity constancy was maintained on the present instrument for about half of i
,. .. . ,
. i,
. the items in a. small sample of thiddle-class four-year-olds. Moreover, t-8- 1
.
k,i
ipresent version of the...iAtrument incorparated technical improvements which,
,'.;
- .
.,if anything, should have made the task' easier than the earlier Kohlberg and .i
...;.--. De. Vries versions. ..,
,,,`::.. , --
1
:;Internal consistency analyses (see below) and the fact that' the total
, ,
score did not increase Monotonically with age in this sample suggested that
.. this measure generally did not assess the cognitive achievement of gender...-g,
..
identity constancy in this- simple at this age, but rather,was tapping certaini% .
A
.!4,... preconseancy processes. As an ititial check on this conclusion, item diffi-,.
... ..-. ,.Is:
..01 culties were.compUted at each of several total score levels separately by sex'.,f.., . _ ,
. . . ...-t:.; .f.,v . ,
w, 1.38 ,,,,.N.
, -.'-,,, . ..-;,.
>
.:-..1, 4,..-,E,
`;
,Vo.-,..t?...-
132
of subject. It was reasoned that once item difficulty ranks become similar
across .the boy and girl stimuli and across boy and girl subjects, we would be
dealing with a total score level representing minimal competence in cognitively
based gender identity constancy. It was found that (comparable) items were at
different levels of difficulty across the two tasks and sexes within different
total .score levels below 50% correct. Also, be1Ow this cutting point, con-
'stancy on some items failed to increase monotonically with increasing total
score level! Thus, the total scale score did not appear to have the same mean-
ing across the tasks, sexes, and total score levels.
Item and ,Subscale Properties
Item and internal consistency analyses revealed the presence of four
subscores which are reasonably orthogonal to one another n this sample at
this age. The first component is the child's response to i em I-1 ("If Jar.ie
really wants to be a boy, can she be?")., The second is the 8 ild's response
to item ("If Johnny, really wants to be a ,girl, can he be?" )\. The third
is the child Is slimmed-se-ore- oni-temsI=2throug signifying constancy of
the girl stimulus despite suggested changes in activity, clothes, and hair
style. The fourth index isi the child's summed score on items II-2 through 11-5,
signifying constancy of the boy stimulus despite suggested changes in activity,
clothes, and hair styl .
IteA' I-1 and II-1 were uncorre].ated with-all other items (highest r=.14),
although they were correlated with each 'other (r=.45) . Subscores 1-2-5 and
11-2-5 had KR-20's of .59 and .64, respeOtively, but were uncorrelated with
each other (r=.01)'. While the positive correlation between I-1 and II-1
indicates that they share common variance, it-may be useful to keep them as
distinct measures in future analyses of these subscales.
133
jConclusion
The total constancy score did not tap a cognitively based reality judgment.
of gender identity constancy in this population at this age, and, therefore,
great caution should be exercised in its use. Moreover, internal analyses
r.revealed four reasonably orthogonal scores derived'sfrom this instrument.
These outcomes are interpreted tentatively as followS; Sex-role identity
becomes increasingly stabilized as the child's cognition of gender identity
invariance becomes increasingly firm. When the child developes some competence
(if not maximal performance) with regard to this basic reality judgment, this
judgment influences his sex-role attitudes and behaviors (Kohlberg, 1966b).
Prior to this point in development, however, sex-role processes such as those
indexed by the present four orthogonal subscales probably are influenced by
preoperational interpretations of the meanings of social relationships, rein-
.forcements, and cultural stereotypes.z,
Future analyses will evaluate the hypothesis that prior to the achieve-
ment of a cognitive reality judgment of gender identity invariancett.
measures are differentially influented by diverse and interacting
motivational, affective, and social factors measured in the study.
0
Purpose
Brown IDS Self-Concept Referents Test
An underlying assumption about the development of children is that their
potential for learning is enhanced when they are relatively contented, are
able to relate well to others, and have a generally positive self-concept.
Yet, in contrast to the numerous studies of language development and cogni-
tive fUnctioning, there are very few studies of the emergence and development
of the self-concept, in young children (Wiley, 1961). Since a primary goal*1/4.
of most preschool programs, is to increase the child's self-esteem, there has
been much rhetoric on the need for adequate measurement in this 'area. For a
variety of reasons, ,however, task development has been slow. The BrOwn- IDS
Self-Concept Referents Test, developed in 1966, is a technique for assessing
self-concept using a photograph of the child to induce the young child to take
the role of another toward himselfV. The task measures;.self-esteem and also
the_percep-t-ion---o-f-ernese pogi:..bf_ view of socially significant others.
It was included in the present study since it was one of the few measures in
the literature during the first year of the study relating to the child's
evaluation of "self as object" and "self as subject" which had reliability .
data and .evidence of validity for use with four-year-old disadvantaged children.
In Brown's (i966) study, 38. black (lower class) and 36- white (middle class)
preschool children responded as to how they, their mothers, their teachers, and
"other kids" perceived them. Self-perceptions of the black children were Signi-
ficantly less favorable than those of white children, and black children pet-
_
ceived their teachers as viewing them less favorably. However, black and white
children did not differ in their perception of either their mothers' or their
134
141
135
peers' evaluatiOns. Test-retest reliability for the self-referenl responses
was .71 for blacks and .76 for whites. These findings-were later replicated
,by Brown (1967).
Task Description
A full-length color Polaroid photograph is taken of the child. After
the tester ascertains that the child recognizes himself in the picture, the
child is asked to respond to 15 bipolar adjectival items stated in the vocab-
ulary of the four-year-old child (e.g., happy-sad; afraid of a lot of things-
notcafraid of a lot of things), each time referring to the child's picture.
All items are presented in an "either-or" format, the more positive and socially
desirable choice being scored one and the less socially desirable choice
scored zeros (Positive choices were randomly assigned first and second position.)
Since data with children three-six to four-six indicate that they may have diffi-
culty understanding the difference between "self" and "other" referents, only
the self-referent part of the test was administered in the first year of the
study.
Scoring
In the present study, each item was scored as positive, negative, refused,
indeterminate (e-g., multiple answers) or "don't know." Total number of items
1
to which the child did not respond and total self-concept score were the two 1
scores used in .the' present .structural analyses. For these analyses, the self-4
1
.
Concept score was adjusted in order to account for items which were refused
or otherwise unscorable. Thus the scores reported here are percentages of
"positive" 'responses based on the number of, items clearly answered in a positive
142

136
or negative way. In addition, the child was judged as smiling or not smiling
in the photograph in order to investigate the relationship between the concrete
stimulus and the response alternative chosen.
Score Characteristics
The-KR-20 coefficient of reliability (alpha) for the unadjusted self- '
concept score was computed to be .71 for a subsample of three of the sites
(N = 972). For this smaller group, R biserials for each item with, the total
score ranged from .48 to .73. Coefficient alpha' for number of om\tted items
was .91.
Sample Characteristics
As has been found in previous studies, the distribution of the self-
concept score (N = 1371) was markedly skewed (mean = 82.0%, S.D. = 14.6),
indicating the strong .tendency for the child to select positive attributes.
The correction for indeterminate responses, howeyer, would have spuriously
inflated the score to the extent that this reflected a defensive response
rather than the child's lack of differentiation with rega to a particular
item. However, the correlation between the corrected and uncorrected self-
score wag .83. The mean number of items omitted was 1.5, with
S.D. = 3.0.
Age and sex differences in mean self-concept score were insignificant.
There were, however, differential item responses for boys and girls that merit.
further study. For example, the strong-weak item discriminated most between
the sexes. As would:be expected, total number of omitted items decreased
with age. The majority of children (66.6%) did not smile for their picture,
137
bat females, white children and older children smiled more,.suggesting that
smiling may have been a reflection of differential social expectations or of the
child's greater familiarity and ease in the situation. Smiling in the photo-
graph correlated'only .15 with the happy (rather than sad) response to item
one. Thus, children did not seem to' be responding primarily on the basis of
immediate stimulus cues.
Future analyses will be directed toward investigating 1) differential
item responses over. time as they relate to differential sex role expectancies
'and other environmental influences upon the child as he exCmds his inter-
actions with "significant others," and 2) the interaction among affective and
cognitive responses. Utilizing, Mead's notion of the evolvement of self=concept
fromone's perception of salient others' perception of self, we may observe the
development of the young child's positive and negative conceptions of self as
they interrelate with data obtained on specific teacher-child, peer-child
and parent-child interaction behaviors.
Children's Auditory Discrimination Imientory (CADI)
Purpose
In assessing verbal skills, it is important to determine children's ability
to discriminate oral verbal utterances. Such ablli'zy'contributeS to effective,
listening, reading,' speaking, and writing behavior.
Research by Stern (1966) indicated that children's auditory discrimination
may be assessed by asking children to identify pictures which represent terms,
both nonsense. and meaningful, presented orally. .Nonsense' terms were includedo
as a set of terms equally unfLmiliar to all subjects so that the results would
not be confounded-by irrelevant differences in vocabulary skills.
.Task Description
The CADI', the result Of Stern's work, individually administered meas7
ure:designed to evaluate children's ability to identify, from among two pictures.
that have been given oral word equivalents, the' picture that repiesents the
orally presented stimuli's word. The testing material includes-:38-iii rs of
words and 38 cards, with bwo_piGtureSIin each card. One picture in each pair is
a real picture representing a-familiar word and the second picture is a.non-
sense picture to be paired with a nonsense word. The real and nonsense pictures
are randomly located on the right or lift side of the cards to avoid positional
responding by the child. E presents each pair of pictures orally, naming them
as he points to each. Following the presentation of each pair,.the child is
asked to point to the one picture that represents the name he then says orally.'
There are two sample items prior to beginning the test. If the child does not
respond to thd sample items, the procedure is explained again. If, after the
repetition, the child still does not respond, the test is discontinued. During
138
145
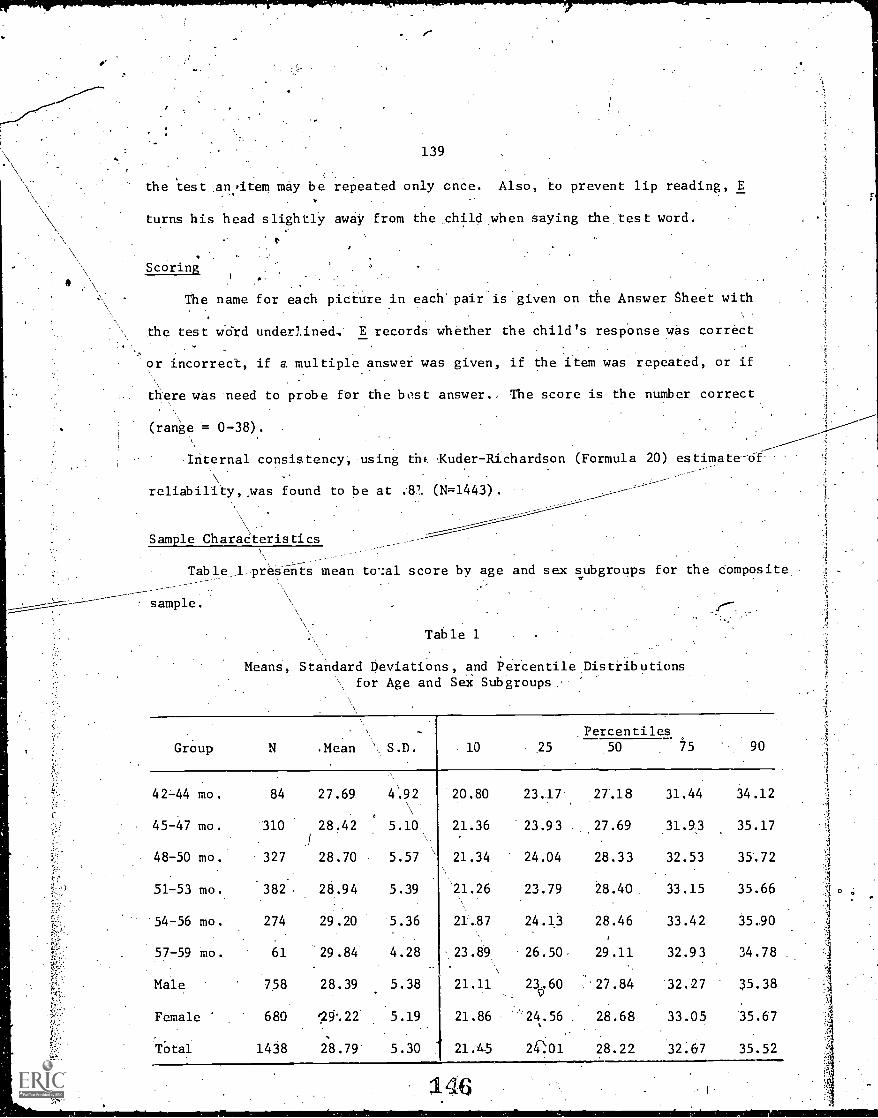
139
the test .andtem may be repeated only once. Also, to prevent lip reading, E
turns his head slightly away from the child when saying dhe test word.
Scoring
The name for each picture in each' pair is given on the Answer Sheet with
the test word underlined, E records whether the child's response was. correct
-or incorrect, if a, multiple answer was given, if the item was repeated, or if
there was need to probe for the best answer. The score is the number correct
(range = 0 -38).
Internal consistency, using tht Kuder-Richardson (Formula 20) estimate-of-
reliability, ,was found to be at .81 (N=1443) .
Sample Characteristics
Table_1-pres-ents mean to:al score by age and sex subgroups for the composite..
sample.
Table 1
Means, Standard Deviations, and Percentile Distributionsfor Age and Sex Subgroups
Group N .Mean ' S.D. 10 25
Percentiles9050 75
42-44 mo. 84 27.69 4.92 20.80 23.17 27.18 31.44 34.12
45-47 mo. 310 28.42 5.10. 21.36 23.93 27.69 31.9.3 35.17
48-50 mo. 327 28.70 5.57 21.34 24.04 28.33 32.53 35.72
51-53 mo. .382 28.94 5.39 21.26 23.79 28.40 33.15 35.66
54-56 mo. 274 29.20 5.36 21.87 24.13 28.46 33.42 35.90
57-59 mo. 61 29.84 4.28 23.89 26.50 29.11 32.93 34.78
Male 758 28.39 5.38 21.11 23.60 '27.84 32.27 35.38
Female 680 0%22 5.19 21.86 24.56 28.68 33.05 35.67
fotal 1438 28.79 5.30 421.5 24-101 28.22 32.67 35.52
146
140
The data indicated that children's auditory disCriAlnation increases with
age for children between 42 and 59 mont s. Further, it apPeared that girls in
this age range had slightly better auditory discrimination than boys..
Remarks
--Real words and nonsense words do not appear to be measuring the same thing
.During testing it was noted that children pointed more often toini this task.
the "real" picture. Subsequent analyses revealed that scores. were higher for
real. words than for nonsense words (Mean for real words = 16.59, S.D. =
Mean for nonsense words = 12.21, S.D. = 4.49), and the correlation between the
real word subscore and nonsense word Subscore was .03: Internal consistency
.of these subscOres, using the coefficient!alpha estimate of reliabilitywas..,
found .to beat .76 and .85, respectively. In the present analysee the total,
score only was used,..b..ut_future analyses will investigate the differintial
'Meaning of "nonsense" and "real word" subscores.
Of
47
ETS,Enumferation14 .
PurposeI
The purpose of ETS Enumeration I was to measure a component of quanti-1
tative ability that Wes not require counting or reciting the name ofi...
numerals. The task assesses the child's abilitIr to organize a field of..
figures and to keep track' of two shifting sets- the set of figures !'pOinted
[at" and the set "not-Yet-pointed at." It is patterned after a procedure
described by Potter and Levy (1968). in the befief, that the no-counting
quality makes it a promising procedure with4,
Task Description' .
very yourig children.
The child is asked. to point once, and one
rray ona. test-booklet.page. No verbal respo
. -consiSting:of colored circles, are arranged on
of arrays: single line., rows, random.
only, to each figure in,ar.
is requested; The figures,
page into. one of three typea
The numb er of figures within an array
varies from six to,nine. There is one practice item and 12 test items.
. (A thirteenth item, on which the child was asked to.count aloud, was-also,
included for the purposes of examining 'perform' Ce under -conditions.of countingI
instructifts nd.of preparing a version of 'the measure for the second year
4
of the study.)
Scoring
The tester s rdcord of . the child's. per ormance on each item includes an. ,
indication of the nature of any errors made and! the direction of hand movements.
The item is scored "correct" if the child points to each figure in the array
once, neither omitting nor repeating a figure. The possible range for the
total .score is 0 to 12.'
.1r
141
148
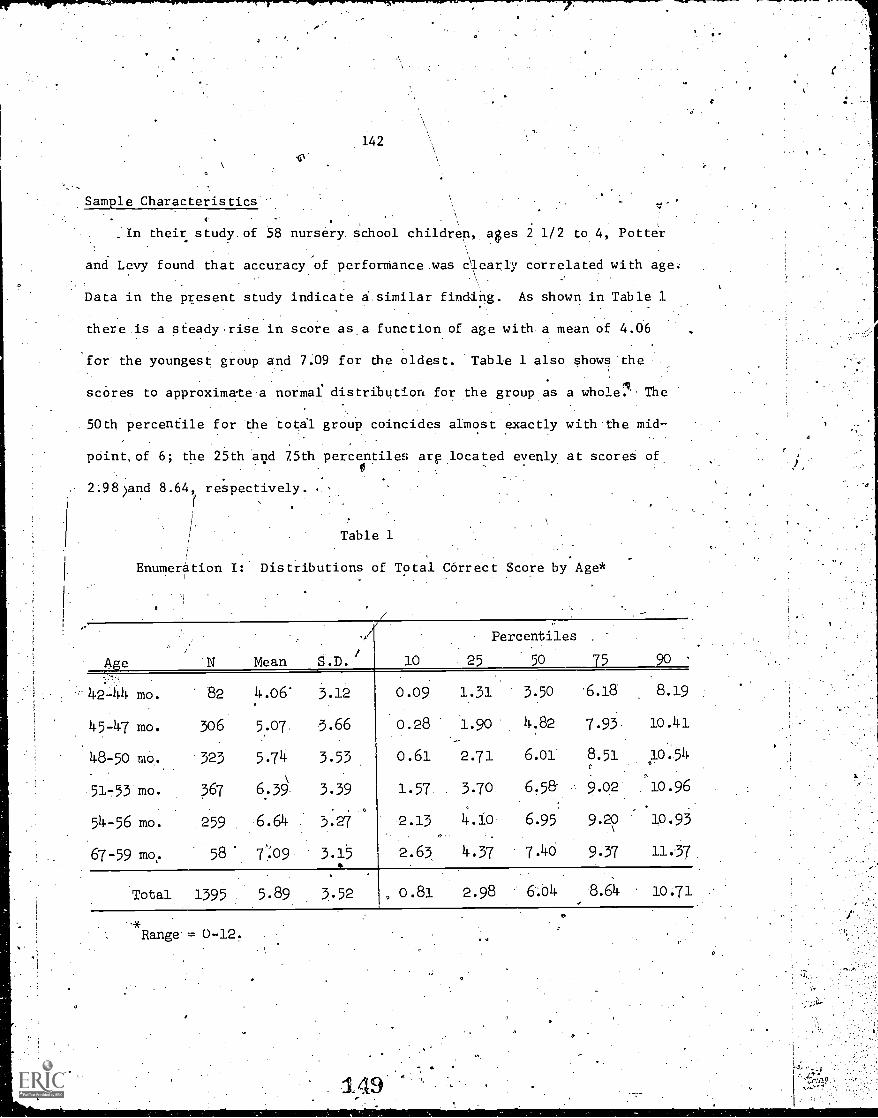
142
.41
Sample Characteristics
_In their study. of 58 nursery school children, ages 2 1/2 to 4, Potter
and Levy found that accuracy of performance was Aearly correlated with age:
Data in the present study indicate 4.similar finding. As shown in Table 1
there is a steady rise in score asa function of age with a mean of 4.06
for the youngest group and 7.09 for the oldest. Table 1 also shows the
scores to approximate a normal distribution for the group as a whole7. The
.50th percentile for the total group coincides almost exactly with.the mid-, .
point,of 6; the 25th and 75th percentiles0. . .
2.98)and 8.64, respectively.
Table 1
arp located evenly at scores of
Enumeration I: Distributions of Total Correct Score by Age*
Age N Mean S.D./ 10
Percentiles
25 5o 75 go ,
42-44 mo. 82 4.06 3.12 0.09 1.31 3.50 6.18 8.19
45-47 mo. 306 5.07 3.66 0.28 1.90 4.82 7.93 10.41
48-50 mo. 323 5.74 3.53 0.61 2.71 6.01 8.51 .10.54
51-53 mo. 367 6:39 3.39 1.57 3.70 6.5 9.02 10.96
54-56 mo. 259 6.64 3.27 2.13 4.10 6.95 9.20 10.93
67-59 mo,. 58 7'.09 3.15 2.63 4.37 7.4o 9.37 11.37
Total 1395 5.89 3.52 0.81 2.98 6.04 8.64 10.71
Range' = 0 -12. 0,1
143
. .
Item Difficulty-and Internal Consistency--)
c - , . .
-
Item analysis of the measure indicates that accuracy of perforMance is
a
systematically influenced by the number and arrangemento of figures on a
stimulus page. . Arrays containing six figures were $onsistently easier than
.arrays containing nine. figures. Difficulty levels of Six-figure-items
ranged from 75% passing to 50% passing; difficulty levels of nine-figure-
items ranged from 47% passing to. 27 %. For. items of six figures, random
arrangement were the most difficult, ordered arrangements of two rows were
.
of moderate difficulty, while
parallel order of diffidulty, associated with.type of arrangement, was found
1.
for the items of, nine figures. This contribution of, number and arrangement
a single row of figures was the easiest. A
.qf figures, to item difficulty parallels. the findings of Potter. and Levy.
An Alpha of\.85 indicates .satisfactory internal consistency.
Item 13: Counting
The counting item. (severvfigures in a single row) was administered at
the conclusion of the test: Responses were coded in two ways. .0ne coding
system took into account whether the total of number names recited by. the
Child corresponded, one_ to 'one, with the .total of seven figures; the other
system took into accounr thecorrectness of the sequence recited. Thus,
a
response:of "1, 2, 3, 7,.8,.9, 10". was judged correct in'correSpOndence
.(seven number names). but incorrect in sequence. The response: "1, 2,
was judged noncorresponding but correct in sequence. Approximately 29%
the children were correct in 'troth senses; 22% recited a correct but non-.
corresponding sequence; another 11% were accurate. in correspondence but
incorrect in sequence; 30% failed in both systems; 8%.refused. Although:
150
144
there is a correlation of .36 Between item 13 and the total correct for
items 1-12, it would appear that the request to count changes the character
of the task in the' directi)n of making it more difficult.
O
Remarks
Perceptual' abilities required in the organization of a field of figures.
Would be expect to contribute to performance on this test. The observed
pattern of item difficdlty makes psychological sense in this context, insofar
as an increase in number of figures on a page and/or an increase in complexity
01 of their arrangement shcrd have the effeCts on accuracy that were indeed
evident: However, the extent to which this test may be regarded as a measure ,
1of enumeratiftg:abilities pan be dgteiMined only through further examination
,
of relationships to other measdres within the Study and to longitudinal
f
evideride on the significance of these "precounting" abilities. In Piaget's
analyses, perceptual orderi g and articulation.areviewed as'. necessary pre-
:cursors to a .corceptual tanding Of number. Finally, it should also
be stressed that on a repetitive homogeneous task of this sort, the child's
style and persistence in res.plo\ nding can very well play a major part deter-
mining. his score.
6
ETS Matched Pictures Language Comprehension Test I
Purpose
It is knowledge of grammatical .or syntactic structure that allows the
mature speaker to understand and generate an infinite variety of sentences.
This, the degree to which a person has command of'structufal rules deterMines elp.
what linguists have 'come to call underlying language competence. Increasingly
over the. past years it is this aspect of language, rather than its-lexical
aspect (i.e.,. vocabulary), which has been the focus of study for those interested
in development of language,and in its relationship to other facets of cognitive
growth.
Most studies of.syntactic development have relied on spontaneouS speech
samples for their primary data. Productive speech,. however, can be influenced
by a host of factors which have
Therefore, a comprehension test
little. or nothing to do with language competence.
was. devised for the Longitudinal Study.ds a
means of obtaining data on syntactic development. The major ov rall purpose of
such a measure (and of similar measures deviSed for Succeeding yeara)..is to
study the developmental pattern of syntactic comprehension and the relationship0 .
of this pattern to family and school determinants. In addition, the immediate
concern in Year 1 was to shed light on a question of current controversy and
debate among educators and theorists.. Is the child from a low-income environ-
ment retarded in syntactic comprehensicn, as Bereiter and Engelmann (1966) and
Osborne (1968) suggest? Or, is even a minimal language environment sufficient
for a child to develop the basic grammatical rules of adult language, as many
linguists (e.g., Weksel, 1965; Lenneberg, 1967) would suggest? Analysis of
the mother's verbalizations in the interaction tasks will provide an index of
145
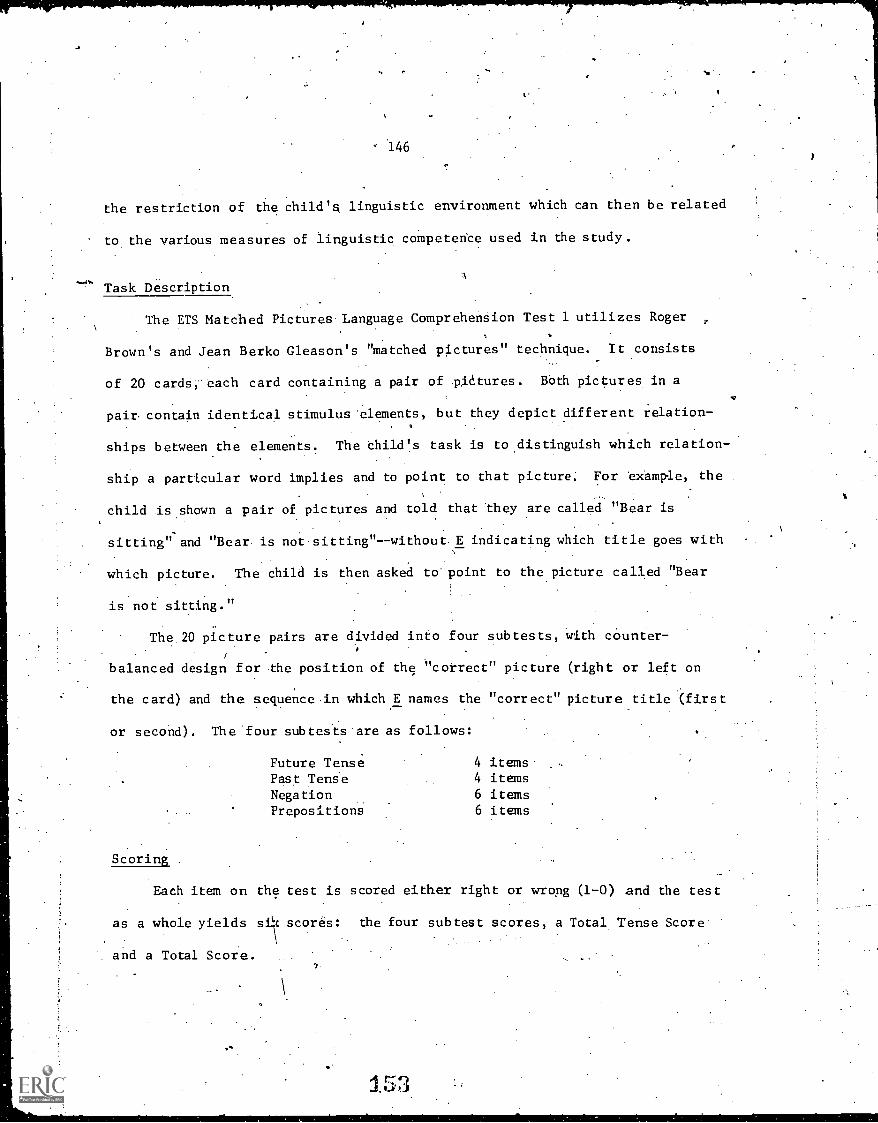
146
the restriction of the child's linguistic environment which can then be related
to the various measures of linguistic competerice used in the study.
A
Task Description
The ETS Matched Pictures Language Comprehension Test 1 utilizes Roger
Brown's and Jean Berko Gleason's "matched pictures" technique.-
It consists
of 20 cards, each card containing a pair of pictures. nth pictures in a
pair contain identical stimulus 'elements, but they depict different relation-
ships between the elements. The child's task is to distinguish which relation-
ship a particular word implies and to point to that picture. For example, the
child is shown a pair of pictures and told that they are called "Bear is
sitting" and "Bear. is notsitting"--without E indicating which title goes with
which picture. The child is then asked to point to the picture called "Bear
is not sitting."
The 20 picture pairs are divided into four subtests, with counter-
balanced design for the position of the correct" picture (right or left on
the card) and the sequence in which E names the "correct" picture title (first
or second). The four subtests are as follows:
Future Tense 4 itemsPast Tense 4 itemsNegation 6 itemsPrepositions 6 items
Scoring .
Each item on the test is scored either right or wrong (1-0) and the test
as a whole yields si!\c scores: the four subtest scores, a Total Tense Score
and a Total Score.
153
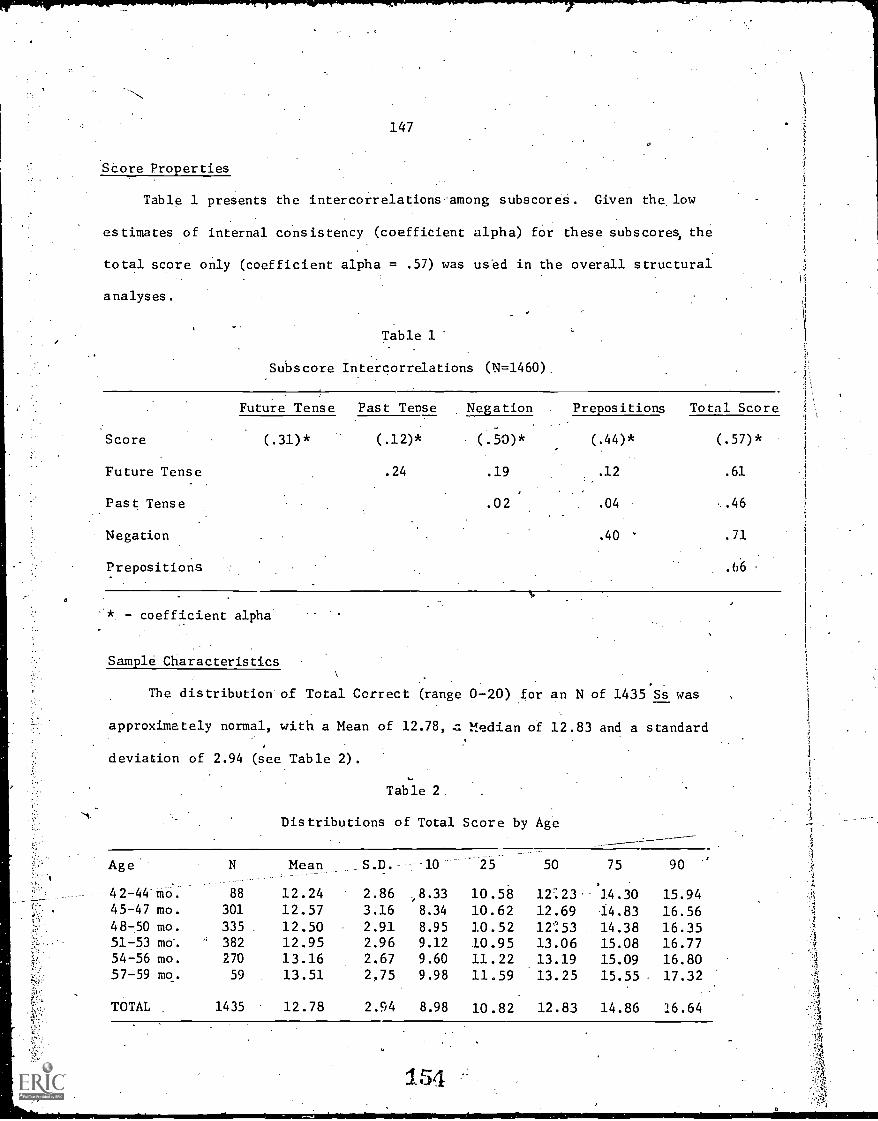
147a
Score Properties
Table 1 presents the intercorrelations among subscores. Given the low
estimates of internal consistency (coefficient alpha) for these subscores, the
total score only (coefficient alpha = .57) was used in the overall structural
analyses.
Table 1
Subscore Intercorrelations (N=1460).
Score
Future Tense
Past Tense
Negation
Prepositions
Future Tense Past Tense Negation Prepositions Total Score
(.31)* (.12)*
.24
(.50)*
.19
.02
(.44)*
.12
.04
.40 '
(.57)*
.61
.46
.71
- coefficient alpha
Sample Characteristics
The distribution of Total Correct (range 0-20) for an N of 1435 Ss was
approximately normal, with a Mean of 12.78, Median of 12.83 and a standard
deviation of 2.94 (see Table 2).
Table 2
Distributions of Total Score by Age
Age N Mean S.D. 10 25 50 75 90
42-44 um. 88 12.24 2.86 ,8.33 10.58 12:23 14.30 15.9445-47 mo. 301 12.57 3.16 8.34 10.62 12.69 14.83 16.5648-50 mo. 335 12.50 2.91 8.95 ].0.52 12:53 14.38 16.3551-53 mo. ' 382 12.95 2.96 9.12 10.95 13.06 15.08 16.7754-56 mo. 270 13.16 2.67 9.60 11.22 13.19 15.09 16.8057-59 mo. 59 13.51 2,75 9.98 11.59 13.25 15.55 17.32
TOTAL 1435 12.78 2.94 8.98 10.82 12.83 14.86 16.64
4
148
Remarks
With respect to the various subtest scores, future _and past tense discrim-
inations proved, to be quite difficult for children of this age; negations and
prepositions proved quite easy, with the children obtaining median scores of
5.03 and 5.09 respectively on these 6-item subtests. While these results con-
tradict the claims of Bereiter and Engelmann (1.66) and Osborne (1968) who
state that disadvantaged 4-year-old children do not understand prepositions
or negation, they are similar to results obtained on the Matched Pictures test
with other-low and middle-income populations (ETS, PR-70-20) and to-results
obtained in a recent study of syntactic comprehension in Italian preschool
children (Parisi, 1971). However, it will be necessary to study succeeding
years. of longitudinal data before drawing any firm conclusions about the
effect of low-income environments on basic language competence.
155
ETS'Story Sequence Task I
Purpose
Traditionally, the.development of language skills in young children has
been viewed in terms of the two major components of "receptive" vs. "productive"
language. The "receptive" skills are identified as the recognition of language
labels given'in oral or written form, whereas the "productive" skills involve
the use bf these labels in such a way that the child "produces" (e.g., "says
something") in response. Both types of language skills are present in
intelligence tests, but tests which measure school readiness, such as the
Metropolitan Readiness Tests (Hildreth at al., 1965), are composed almost
entirely of "receptive" language items. However, the close relationship of
both measures with actual school performances suggests' the advisability of
assessing both receptive and productive language at earlier ages.
There is a great deal of evidence for social class differences in
language development (e.g., Loban, 1965; Raph, 1965; Weaver, 1965) and some
evidence that productive responses are somewhat more difficult than receptive
responses. The few studies which have compared the two modes of response vith
the same materials and procedures (e.g., Carson &,Rabin, 1960) indicate that
productive language is a, much more difficult skill for the culturally disad--
vantaged child. Most of these studies have been limited to a comparison of
receptive and productive skills regarding dingle -word comprehension versus
asking the child to verbally label or describe the pictured item. An interest
in looking at the young child's use of larger units (sentences, and short para-
graphs) requiring both receptive and productive responses led to the develop-
ment.of the ETS Story Sequence Task used in this study.
149
1.56
.150
Task Description
The ETS Story Sequence Task was designed to assess the young child's
understanding-and use of language in story sequence under three different
conditions varying in the degree to which the child is asked to use receptive
and procluctive language skills. The materials are similar for all conditions,
consisting of seven sets of cards" with drawings of animals in various'situa-
tions, Including one instructional set and six test sets. There is no
apparent sequence in any of the pictured situations--the sequence is provided
either by the verbal dies used in the presented stories or by the story pro-
duced by the child. The stories were especially written for these tasks in
order to avoid the problem of differential familiarity. It was decided to
use animals as the "characters" in the stories, rather than children, because
of the difficulty of !Ipalancing" the distribution of sex, race and situations
in a small number .of items.
The items are divided into three types of tasks which require different
kinds of responses from the 'clhild as follows:
Task Type Description
, 1 Receptive language: the thild selects and arranges card sequencewhile listening to a story told by the examiner. There is noinherent order in the pictured situations and the child isdependent on linguistic -cues provided an the story.
\
2 Productive language using verbal recall: tester presents cardsin Order as she tells the story. Child is asked to retell the"same" story.
. \3 _PrOducitive language using child's own story: child chooses
picture cards. from an 'array and tells his own storyabout theM.
Two practice items are given to familiarize the child with the idea .of
physically placing pictures.in a left-to-righ9 row and to give Practice in
157
151
selecting the appropriate sequence from an array of cards. The two test items
which folloW'ask the child to select thd'appropriate sequence of pictures while
listening to a story. In both test items, there is no replacement of cards in
the-array_so that the size of the arra}, diminishes with each choice, bu': the
child could use the same card twice (e.g., the child may decide to reuse a
card placed in the row rather than the last card remaining in the array). The
decision to avoid replacement of cards was based on pretesting experience
which suggested that such a procedure would be confusing to the child.
Scoring
Story Sequence I is the first of the three parts of the total task k, and
only its scores are reported here. It is composed of two items which focus
on the child's receptive language and his 'ability to use linguistic cues ,in
the construction of a sequence. *There are two sequences: Tommy Kitten (3 cards)
and Timothy Mouse (4 cards). Each correctly selected card is given one point
so that the possible range for the two items combined is 0-7.
The product-moment correlation coefficient between item 1 and item 2 for
the composite sample of 1448 children Was 0.33.
Sample Characteristics
The composite mean score for the task was 4.26 with a S.D. of
Reliability y2(coefficient alpha) was .50. The combined site scores (with
only a small discrepancy in the oldest group) showed a consistent progression
with age (see Table 1). This increase was consistent acrql3s all age ranges
in Auburn, Portland, and St. Louis but- showed some very slight discrepanCles
in the yOungest.and oldest grOups in Trenton (however, tivase groups have very.
small N's, e.g., five children in oldest group) . Me potential, range of scores
15S
t.
152
from 0-7 was.foUnd in each age group of children. Sex differences.in mean
scores were negligible. The composite score for the females (4.43) was.p C
slightly higher than for the males (4.12), and similar differences were
reported for each of the sites.
Table 1
Mean Total Score by Age
Age Mean S.D. Range
42-44 mo. 89 3.86 2.41 0-7
45-47 mo. 315 3.87 2.19 0-7
48-50 mo. 331 4.11 2.26 0-7
51-53 mo. 383 4.48 2.23 0-7
54-56 mo. 270 , 4.68 2.19 0-7
57-59 mo. 60 4.58 2.29 0-7
Total 1448 4.26 2.25. 0-7
Conclusions
The findings are in general agreement with the results of the earlier use
of this measure with preschool and kindergarten children in New York City
(Melton et al., 1968). In that study, a significant SES difference was
reported. Further, the results showed an interaction of SES with sex and age
(p4.04) which is relevant to the current study. That.i , within the middle
'SES, the girls were superior ,to boys 0, both age levels, whereas in the low.
SES, the boys did better in the.older group and there were no sex differences
in the younger group. The children in the present study form a similar SES
1population of "four-year-olds". nd it is interesting to note the parallel
159

153
.finding of no sex differences at this age. Later data will be examined to see
if the parallel holds at older ages. Mcreover, addition of the recalVand
story production.items in later years will provide scme information on the
relationship between the- receptive and productive language of the child using
similar stimulus materials.
Fixation -Time
Purpose
'Working with infants and young children, Kagan and Lewis (1965) and LeWis
and his associates (Lewis et al., 1970; Lewis, 1971; Lewis, 1972) have.demon-
,..
strated that attention, at least in the early years o£ life, is an index of
early cognitive functioning. Moreover; individual differences in attention may
also have smile direct effects onlearning; for example, the child who cannot
concentrate or who grows bored quickly cannot obtain as much information from
his environment as the child who can. Thus, in the child of preschool age,
attention may serve to relate to later as well as current cognitive functioning.
Attention may be noneognitively determined.as example,, by. the inten=
tions and desires of the subject (Messick, ETS; PR-68-4). In this respectJ
attention may fall withiphe personality &main as well as serving as an indexit'
of cognitive functioning,_____
Task Description
The task used in this study obtained a measure of the amount of time a%
child fixates or looks at a given'pecture as itis repeated over a number of
trials. Of interest also was the degree to which a child was able to discrim-
inate between this redundant stimulus and a variation of it.
Two series of slides were. used in the fixation task. Series one consisted
( 1
of six trials of a redundant nonsocial Visual stimulus (twenty chromatic straight
.
IlfneS) and a seventh trial of chromatic curved lines. Series two,. the social
I \
array, consisted of a chrothatic schematic representation of a family:: a man,
't woman, and young child, shownjor six trials, and a seventh presentation which
consisted of the same schematic without color.1 'Each slide was shown for 30
.
155
seconds and was followed by a black slide for 130 seconds before tide next pre-
sentation. An ofterver.positiOned behind apeg 'board t)artition watched the
child's hehavior. Fixation time was recordedtas the amount of time a child
. .
looked. at each picture before turning away the first time. (In past research
)
the interobservex reliability for determining whether the child was or was not.1\\,
looking at the 3creen. had varied between 60 and .99, [ETS, If a*
child did.not look at the picture within ten seconds of presentation, he was
.remired tr do so; if he.was already looking at the screen when the slide \
,1
, ,i
appeared, timing.began at that point. A short break was allowed etw(een series. . _
b t dt be n slide (trial). Oresentations. This procedure has been used
previously in laboratory settings under-highly controlled conditions; however,
these conditions did not alWays-exist.for the present study and the results
may have been affected by external noise, 'visibility of the observer, and other
distracting stimuli.
Scoring
By presenting slides in .two series, each consisting of a repeated and then.!
some ,varied event, it was possible to obtain three measures of attention:
response :decrement, stimulus differentiadion,'and amount, f attention. Response
decrement, or habituation, is .measured b the change Over trials
strength tO a repeated event; stimulus differentiation
recovery'when a variation of the repeated event.is'pres!
is the total fixation timd over all.
trials: For thestructural analyses, meanhtbituationi! and mean recovery for the.
. .two series were used Recovery scores :represent the differende between trial 7
and trial 6. Habituation scores were computed as the difference between trial 1.
and trial 6 weighted by trial I time.
. .
trial 7 and trial 6); amount of attention
in response
is measured by response
11;.'k (difference between
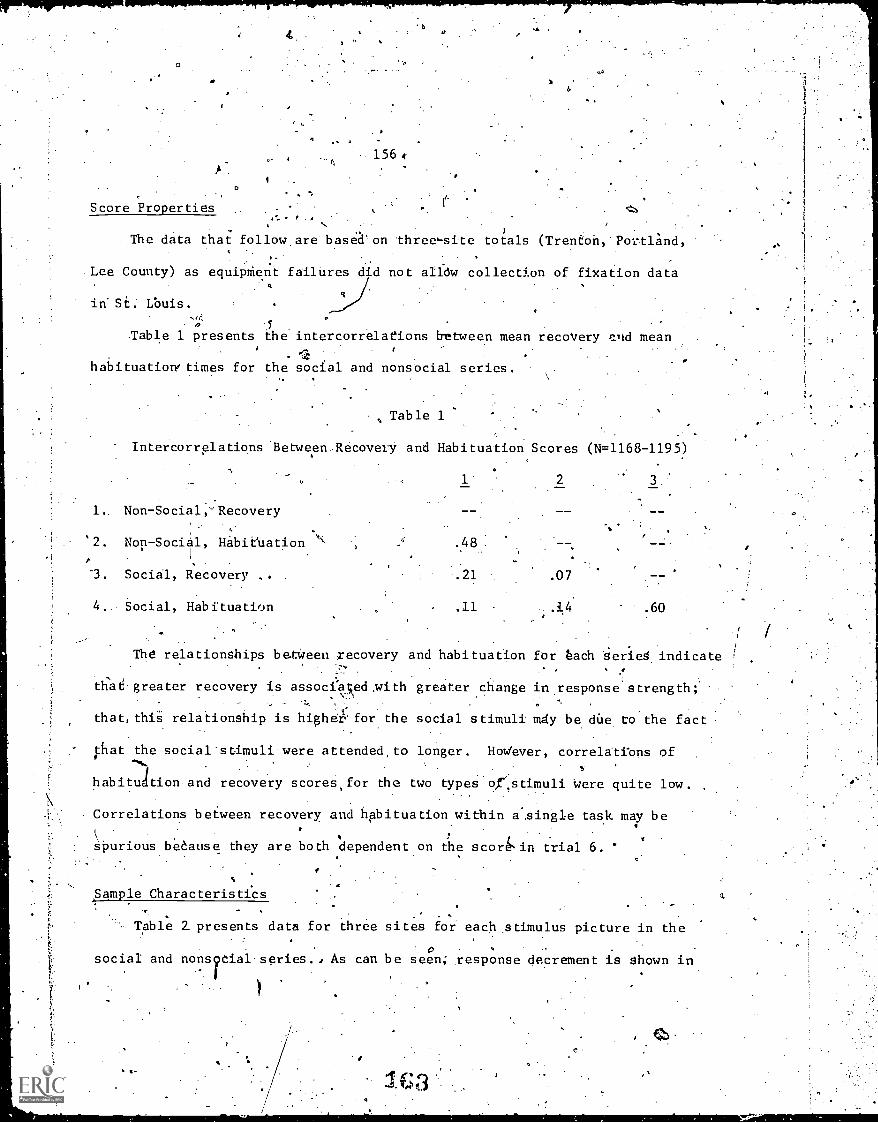
156 e
Score Properties
The data that follow are based' on .three.-site totals (Trenton, Portland,
Lee County) as equipMent failures did not alldw collection of fixation data
in SE:.Lbuis....,,,., 5
Table 1 presents the intercorrelations b-etween mean recovery end mean
habituatimy times for the social and nonsocial series.
Table 1
Intercorrelations Between. Recovery and Habituation Scores (N=1168-1195)
1'
1.. Non-Social,- Recovery
'2. Non-Social, Habituation '''. .48
, .'3. Social, Recovery ..
2 3
.21 .07
4.. Social, Habituation .11 .60
The relationships between :recovery and habituation for Bach aeries indicate
that greater recovery is associ-aed with greater change in response. strength;
that, thiS relationship is highell, for the social stimuli mly be due to the fact
plat the social-stimuli were attended, to longer. However, correlations of
habitultion and recovery scores, for the two types o,r.stimuli were quite low.
Correlations between recovery and habituation within a..single task may be
spurious beattse they are both dependent on the scor& in trial 6.
Sample Characteristics
Table 2. presents data for three sites for each ,stimulus picture in the
social and nonsocial series., As can be seen; response decrement is. Shown in
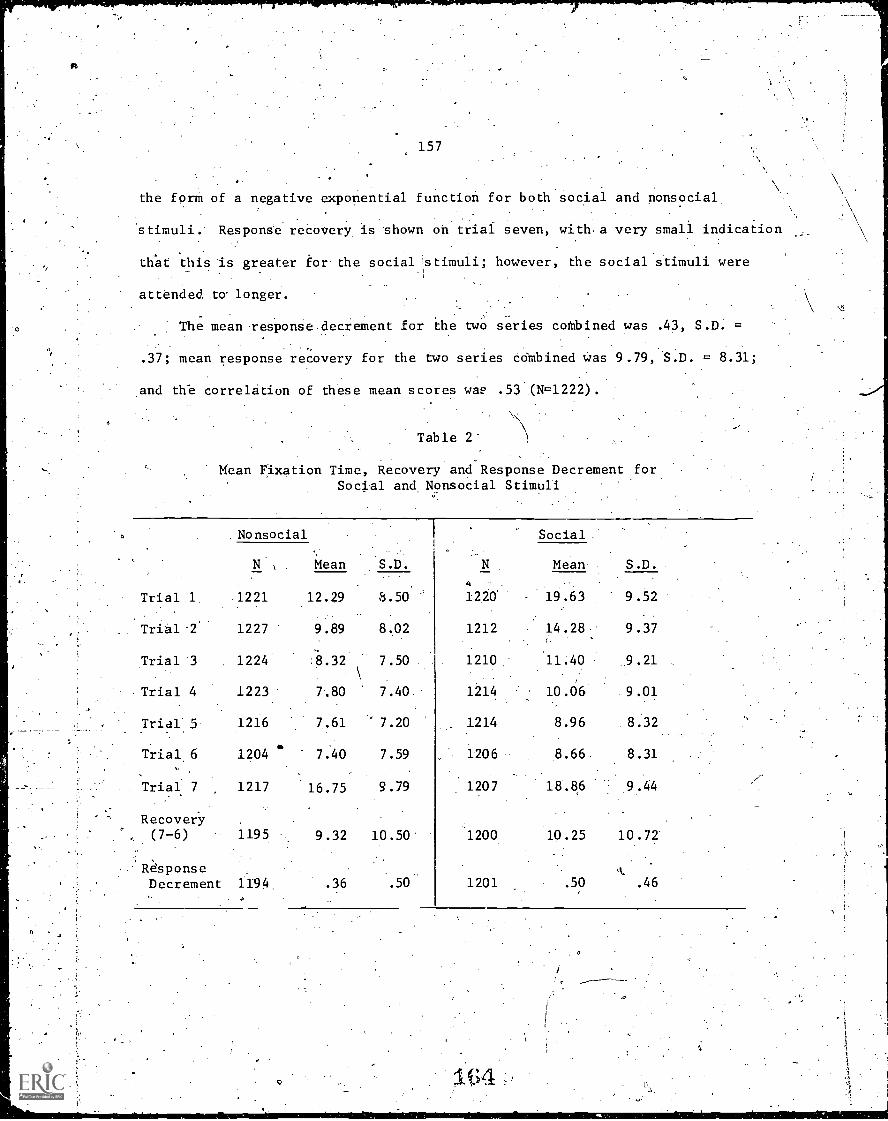
157
the form of a negative exponential function for both social and nonsocial.
Stimuli. Response recovery is shown on trial seven, with.a very small indication
that this is greater for the social Stimuli; however, the social stimuli were
attended to longer.
The mean xesponse.decrement for the two series combined was .43, S.D. =
.37; mean response recovery for the two series combined was 9.79, S.D. = 8.31;
and the correlation of dbese mean scores was 53 (N=1222) .
Table 2-
Mean Fixation Time, Recovery and Response Decrement forSocial and Nonsocial Stimuli
..-
.Nonsocial
NI Mean S.D.
Trial 1 1221 12.29 8.50
Trial-2 1227 9.89 8.02
Trial 3 1224 .1.32 7.50
Trial 4 1223 7.80 7.40.
Trial 5 1216 7.61 7.20
Trial 6 1204 * 7:40 7.59
Trial 7 1217 16.75 9.79
Recovery(7-6) 1195 9.32 10.50
Social.
N Mean S.D.
4
1220' - 19.63 9.52
1212 14.28 9.37
1210 11.40 9.21
1214 10.06 9.01
1214 8.96 8.32
1206 8.66 8.31
1207 18.86 9.44
1200 10.25 10..72'
ResponseDecrement 1194. .36 .50 1201 .50 .46
PurposeI
1
,
Success in the ability to:reproduce geometric forms graphically relies on/
/
a complex integration of visual-motor, visuai,/ /prope..)ceptive, verbal and con-i
Form Reproduction
1
ceptual functions. This a ility is highly liiiked to deVelopmental level both/
within and across age leve s: Beery (1967) reported a correlation of .89
between chronological age (2 -15 years) and n mber of items correct oin the.24-
r .
item Development Test .of VisUal-Motor Int gration (VMI). -Alsp related to
Beery, 1967) and
writing. Reported correlations with measures of intelligence are I.48 for
this ability is (the level of achievement in Ireading ( g,
Verbal, .60 for performanc and .58 with Fu 1 Scale Scores on th!e Wechsler
Preschool and Primary Scal of Intelligence ( PPSI) (Wechsler, 1?67) . Tests
of form reproduction are a so indicators of in egrative skills at a nonverbalr/
.level, thus increasing eas of administration with a.non-verbal1 ichild..
IntElriud-gpstorer reliability. for the reported as _98 by Beery
(1967) by Buktenica (19 6). Test-retest reli bilities for this instru-
Merit ranged from .80. to .90 for intervals from two to eight weeks (Beery,i .
I,1967).' 'Wechsler (1967) reported a test-retest reliability of :62-for form.I
. )
'reproduction for a retest gr up, and estimated it .78 forthe standardi-
I
iation sample. Internal Con istency (Kuder-Richardso ) foriBeery's sample
(,ge 3714 years) was .93 On a sample of subUrban sulj cts.!
IBuktenica- (1966)
rePorted 'Kuder-Richardson_a.
of .78 for f rst! .grade sample.H .
1
\
159
Task Description
The Form Reproduction Test for Year 1 -. consisted of the four form reproduc-
tion items from the Preschool Inventory (vertical line, circle, square and
triangle) ;, I the right oblique line and oblique cross items from the VMI de-.
veloped by Beery (1967).. The procedure adapted for use'in this study required`
the Child to copy' the four Preschool Inventory forms in the standard manner
and order for this test; when the Preschool Inventory was completed the child
was asked to copy 'the two forms from the VMI. It sl,Duld be noted that the
first four items are included in the VMI forms, although their ordering is
somewhat different.
Scoring
Scoring of the six forms was done using a combination of the Beery sys-,
tem of 0 or 1 (for the vertical line, triangle, right oblique line' and oblique
cross) and the WPP-SI scoring criteria of 0,1,2 for the circle and square,
resulting in a maximum score of 8. WPPSI scoring was used witenever possible
since the Beery and WPPSI use essentially the same criteria', but the WPPSI
provides more differentiated scoring and norms based on larger preschool
samples.
Score Characteristics
Inter-item correlations generally werelow (see Table 1). The highest
relationship was between the two most difficult items, the square and triangle.
(r = .46). (Successful production and integration of vertical and horizontal
lines\ appears common to both of these'forms.) All items have moderate
166
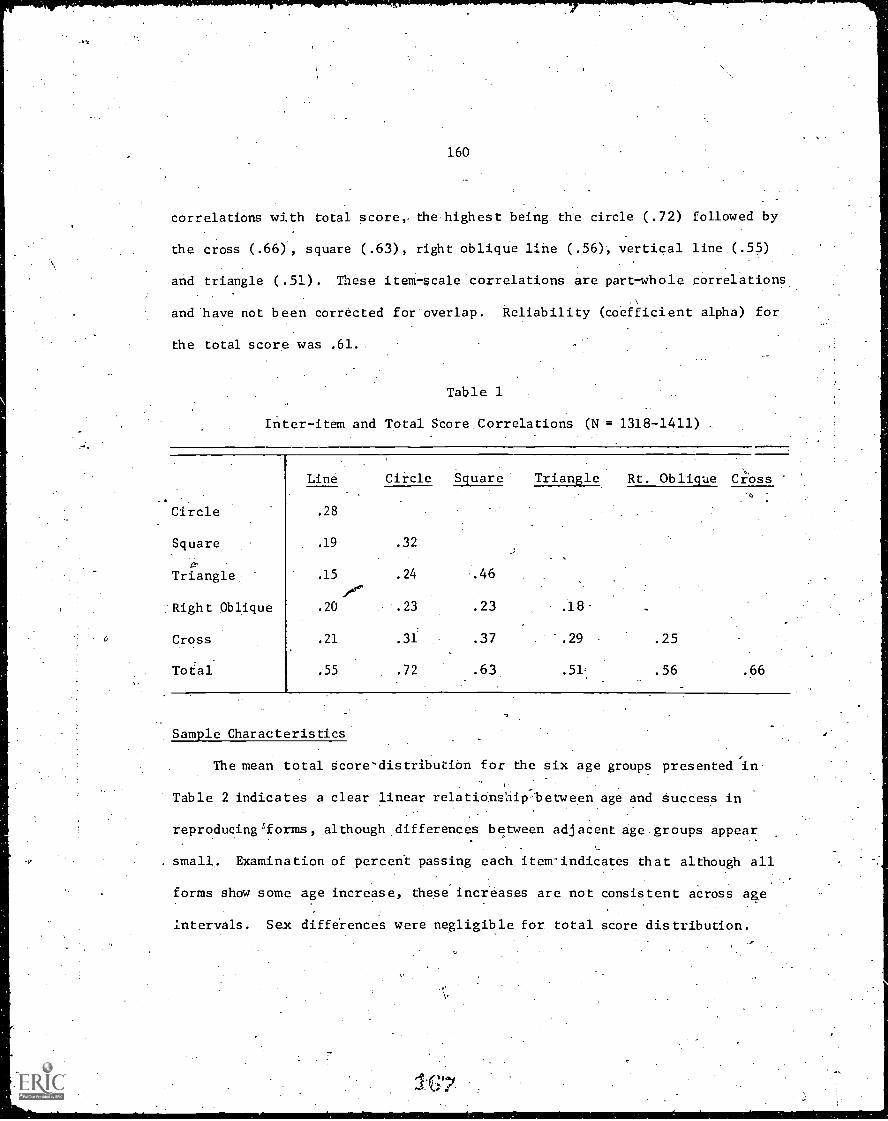
160
correlations with total score,- the highest being the circle (.72) followed by
the cross (.66), square (.63), right oblique line (.56), vertical line (.55)
and triangle (.51). These item -scale correlations are part-whole correlations
and have not been corrected for overlap. Reliability (coefficient alpha) for
the total score was .61.
Table 1
Inter-item and Total Score. Correlations (N = 1318-1411)
Circle
Line Circle Square Triangle Rt. Oblique Ci-bss
.28
Square .19 .32
Triangle .15 .24 .46
Right Oblique .20 .23 .23 .18
Cross .21 .37 ".29 .25
Total .55 .72 .63 .56 .66
Sample Characteristics
The mean total score-distribution for the six age groups presented in
Table 2 indicates a clear linear relationship between age and success in
reproducing 'forms, although .differences between adjacent age.groups appear
small. Examination of percent passing each itenrindicates that although all
forms show some age increase, these increases are not consistent across age
Intervals. Sex differences were negligible for total score distribution.. -
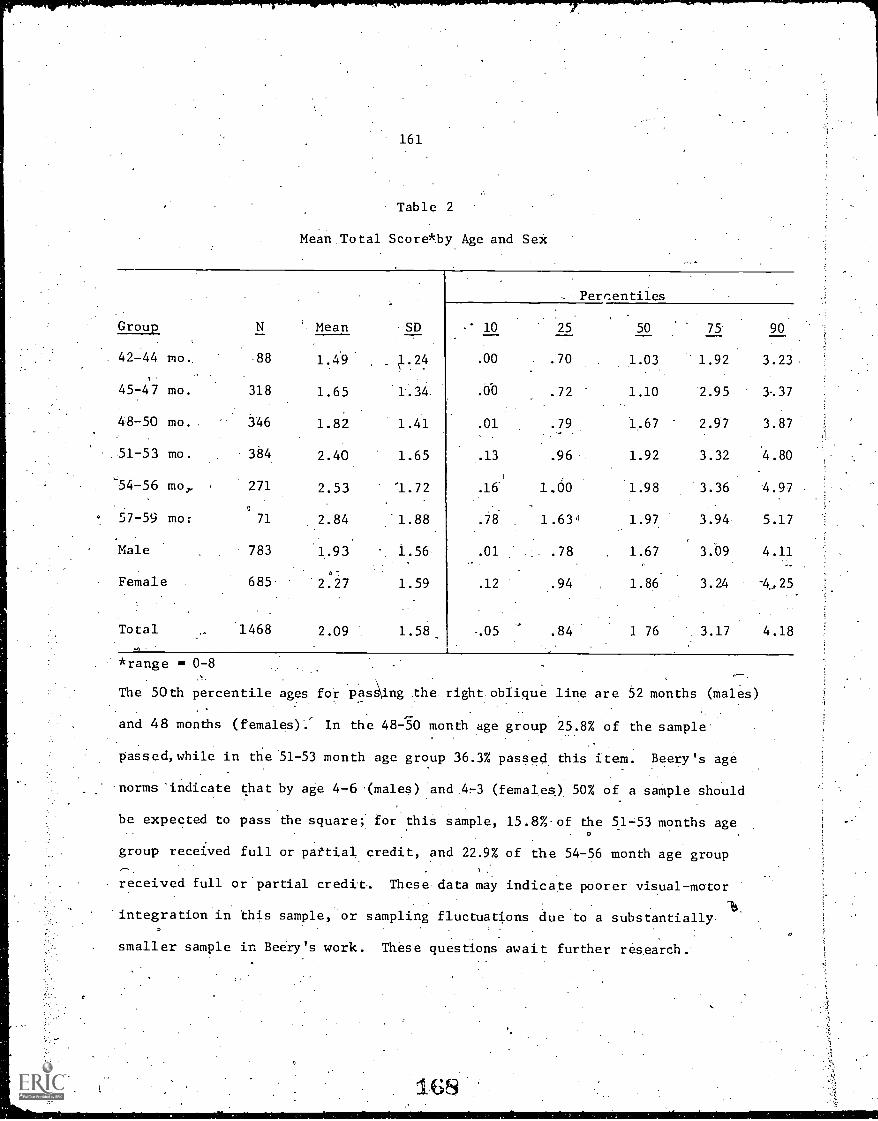
161
Table 2
Mean Total Score*by Age and Sex
Percentiles
ar9142 N Mean SD 10 25 50 75 90
42-44 mo. 88 1.49 _ 1.24 .00 .70 1.03 1.92 3.23.,
45-47 mo. 318 1.65 1.34. .00 .72 1.10 2.95 3.37
48-50 mo. 346 1.82 1.41 .01 .79 1.67 2.97 3.87
51-53 mo. 384 2.40 1.65 .13 .9,6 1.92 3.32 4.80
-54-56 mot. 271 2.53 '1.72 .16 1.00 1.98 3.36 4.97
57-59 mo: 71 2.84 1.88 .78 1.63' 1.97 3.94 5.17
Male 783 1.93 1.56 .01 .78 . 1.67 3.09 4.11
Female 685 2.27 1.59 .12 .94 1.86 3.24 -425.
Total 1468 2.09 1.58 -.05 .84 1 76 3.17 4.18
*range 0-8
The 50th percentile ages for pas4ng the right oblique line are 52 months (males)
and 48 months (females): In the 48-30 month age group 25.8% of the sample
passed,while in the 51-53 month age group 36.3% passed this item. Beery's age
'norms 'indicate that by age 4-6 (males) and 47-3 (females) 50% of a sample should
be expected to pass the square; for this sample, 15.8%-of the 51-53 months age.
group received full or pattial credit, and 22.9% of the 54-56 month age group
received full or partial credit. These data may indicate poorer visual-motor
integration in this sample, or sampling fluctuations due to a substantially
smaller sample in Beery's work. These questions await further research.
168
Johns Hopkins Perceptual Test
Purpose
The Johns Hopkins Perceptual Test was developed in 1966 by L. A. Rosenberg,
' A. M. Rosenberg, and M. Stroud as a brief measure of intelligence in young
children. It was recognizedthat available measures of ,Litellectual function
were seriously limited in their use with some groups of children: children
with functional or _organically determined slieech defedts; culturally deprived
. children with limited verbal and experiential repertoires; children with motor
handicaps; and very young or retarded children. Thre aim, therefore, was to
develop a diagno.stic instrument for the evaluation of such children. In
preliminary work with this test using 340 children ranging from .3-6 years of
age Roseriberg (1966) obtained correlations of .62 and ..45 with the Peabody
Picture Vocabulary Test for middle-class and lower-class children, respectively,o
and correlations of .80 and .66 with the Columbia Mental Maturity Scale.
The perceptual nature of the task, however, was a major factor in its
inclusion in the Longitudinal Study battery. A number of investigators (Frostig,
Maslow, Lefever, & Whittlesey, 1964; Kephart, 1960; Koppitz, 1964) have postulated
the existence of a neurological developmental hierarchy underlying cognitive
skills. Although the evidence is inconclusive, it can be hypothesized that
children who lack certain discrimination skills, whether through a developmental
"lag" or through physical impairment, will not be able to benefit from many
normal!learning experiences.
Task Description
The test is one of form discrimination involving black geometric figures
printed on cards. It consists of 30 test items, preceded by 3 practice items,162
. 163
in which the child is presented with a stimulus. form and asked. to point to the
matching one from among several alternatives. There are two typeS of. forms;
some are purely random. and some figures are related to each other along a con-
tinuumof known variation. Complexity is defined by the number.of angles in
the figure and by the number of alternatives given the child (either 2, 3, or 5
Scoring
Items were scored as correct, incorrect or indeterminate (e.g., multiple
answerS). 'The score is simply the'number of correct matches" made ,(maximum is
30). For the Longitudinal Study two "subset" scores 'were also computed:
Gordon (1969)' had distinguished between items in which the child responds to."
the figure as a whole and makes a "global comparison, and items involving
more complex figures in which the child compares-them in terms of subtle
differences in component parts. The former type of discrimination was hypo-
thesized to constitute a "form perception" subset of the test,-whereas the
latter type would constitute an "analysis" subset. 'Gordon distinguished 16
"form perception" and 14 "analysis" items.
Score Properties .
Item analysis did not support the use of separate perception and analysis
subscores: Item-intercorrelations in general.were modefate to low and were as
high across the two item types as they were within each type. The confounding
of item type with order of presentation (9 of the 14 "analysis" items were in
the second half of the test) and diffiCulty level (all analysis items had the
maximum number (5) of alternative responses) makes it difficult to tease out
170
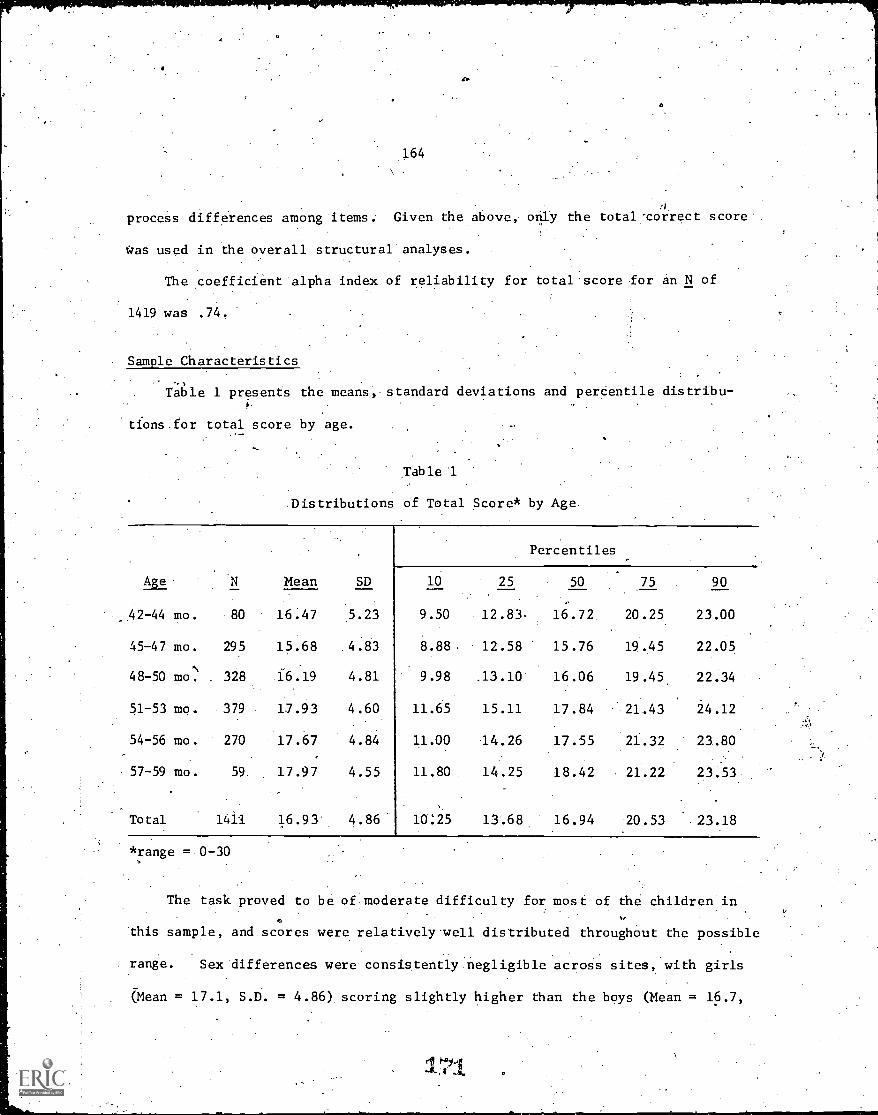
164
\
process differences among items. Given the above, only the total-correct score
was used in the overall structural' analyses.
The coefficient alpha index of reliability for total.score for an N of
1419 was .74.
Sample Characteristics
Table 1 presents the means,-standard deviations and perdentile
tions.for total score by age.
. -
Table '1
Distributions of Total Score* by Age.
Total 141.1 16.93' 4.86
Percentiles
Age N Mean SD 10 25 50 75 90
,42 -44 mo. 80 16.47 5.23 9.50 12.83. 16.72. 20.25 23.00
45-47 mo. 295 15.68 4.83 8.88- 12.58 15.76 19.45 22.05
48-50 mot 328 f6.19 4.81 9.98 .13.10 16.06 19.45 22.34
51-53 mo. 379 17.93 4.60 11.65 15.11 17.84 21.43 24.12
54-56 mo. 270 17.67 4.84 11.00 14.26 17.55 21.32 23.80
57-59 mo. 59 17.97 4.55 11.80 14.25 18.42 21.22 23.53
10:25 13.68. 16.94 20.53 .-23.18
*range = 0-30
The task proved to be of moderate difficulty for most of the children in
o
this sample, and.scores were relatively-well distributed throughout the possible
. range. Sex differences were consistently negligible across sites, with girls
(Mean = 17.1, S.D. = 4.86) scoring slightly higher than the boys (Mean = 16.7,
165
S.D. = 4.86) There was a trend, for mean score_to increase with age, bust with
the exception of St. Louis, no significant mean differences by age were found.
Remarks
Although. Rosenberg referred to this task as a nonverbal test of general
mental ability, the correlation with the Peabody Picture Vocabulary Test,
Form A, was only .33. However, it did correlate substantially with other tests
involving visual discrimination (.52 with errors on the Matching Familiar
Figuies Test and .41 with quickest time to correct solution on the Seguin
Form Board Test). Future analyses will investigate possible differential
effects of experiential factors on performance in contrast to effects on verbal
measures, as well as exploring relationships' to indices of possible neurological
involvement available from the children's health data.
172
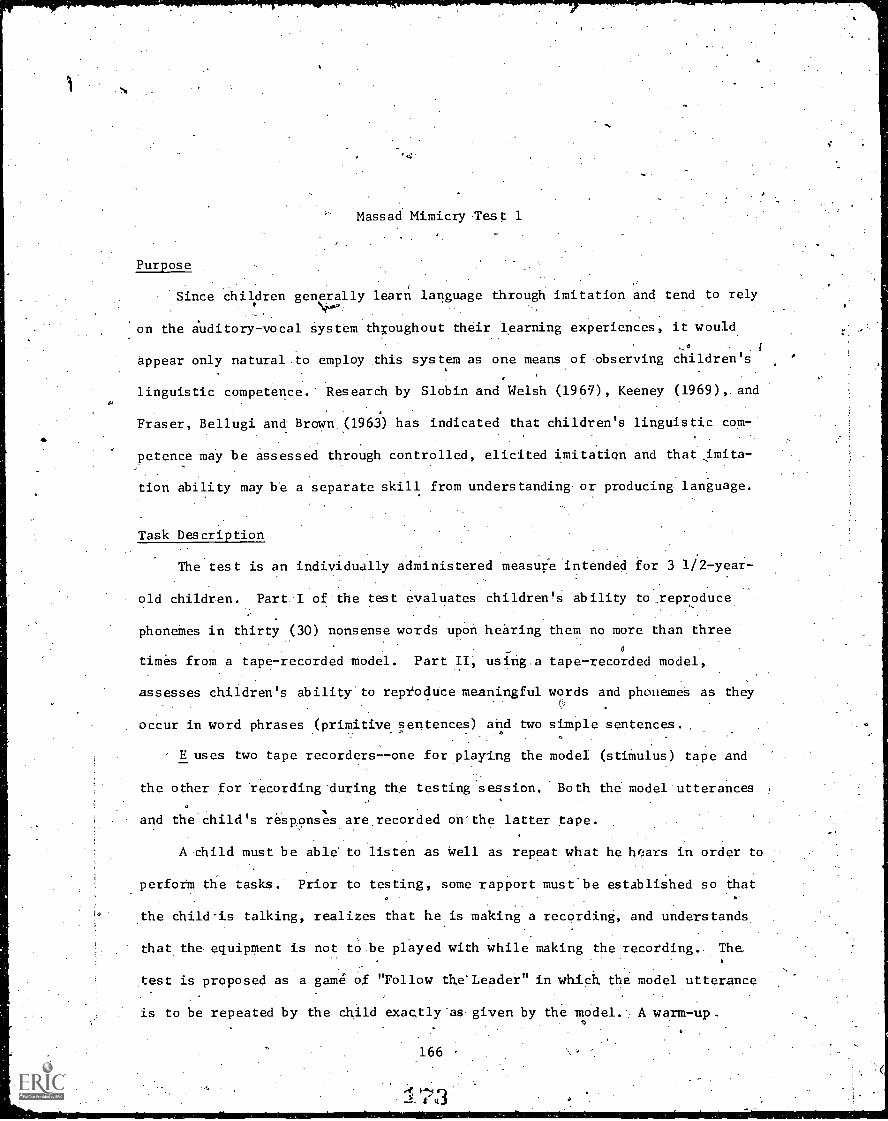
Massad Mimicry .Test 1
Purpose
Since children generally learn language through imitation and tend to rely
on the auditory-vocal system throughout their learning experiences, it would
appear only naturalto employ this system as one means of observing children's
linguistic competence. Research by Slobin and Welsh (1967), Keeney (1969),. and
Fraser, Bellugi and Brown (1963) has indicated that children's linguistic com-
petence may be assessed through controlled, elicited imitation and that .imita-
tion ability may be a separate skill from understanding or producing language.
Task Description
The test is an individually administered measure intended for 3 1/2-year-
old children. Part I of the test evaluates children's ability to reproduce
phonemes in thirty (30) nonsense words upon hearing them no more than threeo
times from a tape-recorded model. Part II, using .a tape-recorded model,
assesses children's ability to reproduce meaningful words and phonemes as they
occur in word phrases (primitive sentences) and two simple sentences.
E uses two tape recorders--one for playing the model (stimulus) tape and
the other for recording during the testing session. Both the model utterances
and the child's responses are recorded on'the latter tape.
A child must .be able' to listen as well as repeat what he hears in order to
perform the tasks. Prior to testing, some rapport mustbe established so that
the child-is talking, realizes that he is making a recording, and understands
that the equipment is not t8.be played with while making the recording.. The
,test is proposed as a game of "Follow the'Leader" in which the model utterance
is to be repeated by the child exactly 'as given by the model. A warm-up.o
166
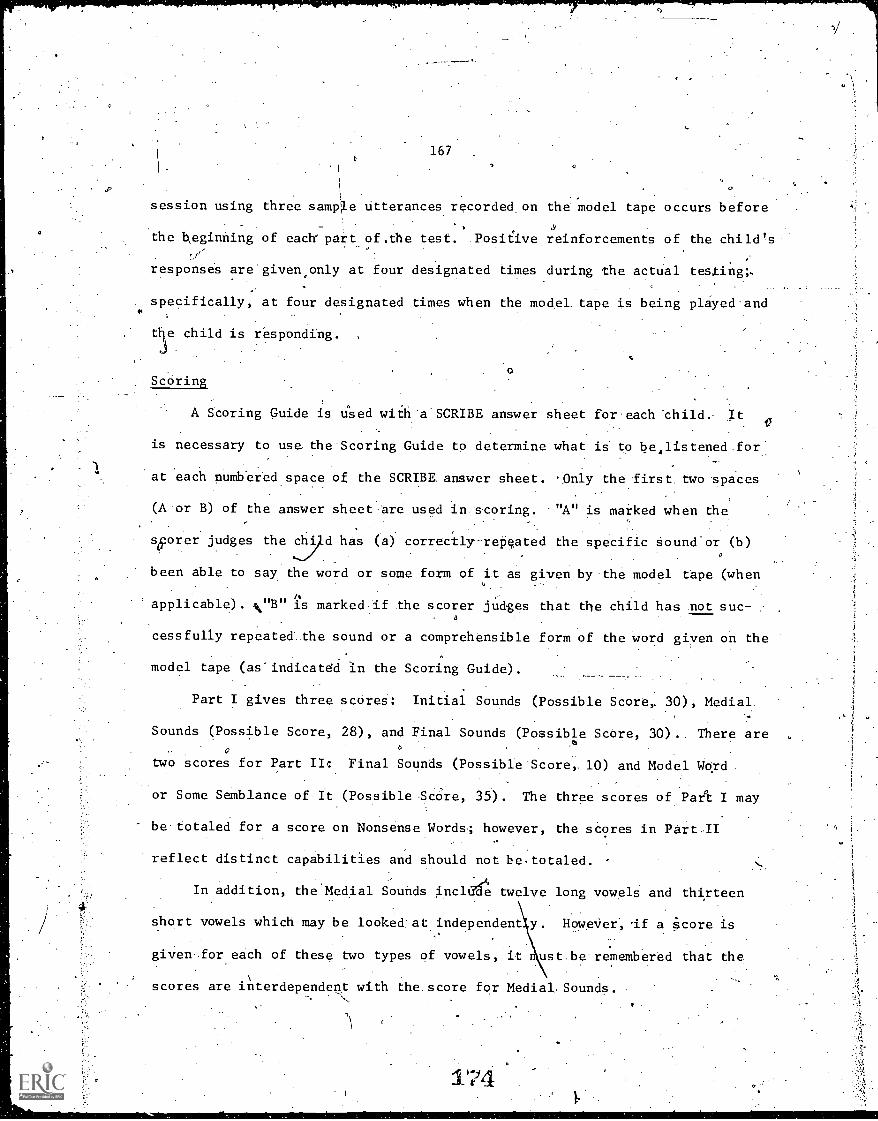
S.
167
session using three sample utterances recorded on the model tape occurs before
the beginning of each part of .the test. .Positive reinforcements of the child's
response's are given, only at four designated times during the actual testing;..
specifically, at four designated times when the model. tape is being played and«
the child is responding.
Scoring
A Scoring Guide is Used with'a'SCRIBE answer sheet for-each child..
is necessary to use the Scoring Guide to determine what is to bejistened.for
at each numbered space of the SCRIBE. answer sheet. 'Only the first. two spaces
(A or B) of the answer sheet .are used in scoring. ."A" is marked when the
sorer judges the chid has (a) correctly-repeated the specific Sound or (b)
been able to say, the word or some form of it as given by the model tape (when
it
applicable). N"B" is marked 'if the scorer judges that the child has not suco
cessfully repeated the sound or a comprehensible form of the word giyen on the
model tape (as'indicated in the Scoring Guide).
Part I gives three scores: Initial Sounds (Possible Score,. 30), Medial.
Sounds (Possible Score, 28), and Final Sounds (Possible ScOre, 30).. There are0
two scores for Part IIc Final Sounds (Possible Score,. 10) and Model Word.
or Some Semblance of It (Possible ScOre, 35). The three scores of Peri I may
be totaled for a score on Nonsense Words; however, the scores in Part-II
reflect distinct capabilities and should not be. totaled.
In addition, the Medial Sounds inclrfde twelve long vowels and thirteen
short vowels which may be looked at independent y However, -if a .core is
given for each of these two types of vowels, it rhust.be remembered that the.
scores are interdependent with the score for MedialSounds.
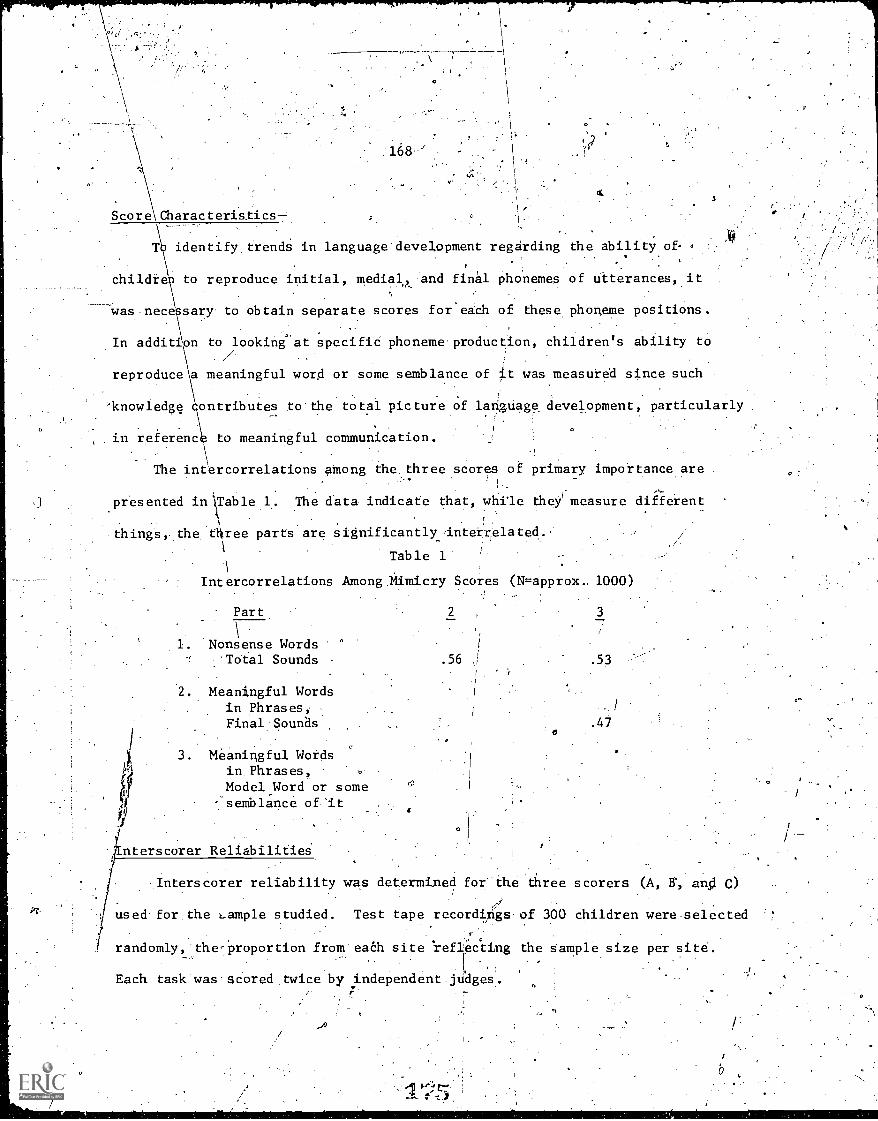
o
3
Characteristics---
identify trends in language development regarding the ability o
,
childie to reproduce initial, medial? andand final phonemes of utterances, it. ,.
was nece sary to obtain separate scores for each of these phoneme positions.
In addition to looking at specifid phoneme production, children's ability to
reproduce \a meaningful word or some semblance of it was measured since such
'knowledge contributes to the total picture of language development, particularly
in referenc to meaningful communication.
The intercorrelations among the three scores of primary importance are
presented in Table 1. The data indicate that, whi'le they measure different
things, the tllree parts are significantly Interrelated..
Table 1
Intercorrelations Among Mimicry Scores (N=approx- 1000)
Part.
1. Nonsense Words'Tdtal Sounds
2. Meaningful Wordsin 'phrases,Final.Sounas
3. Meaningful Wordsin. Phrases,
Model Word or some-. semblance oflt
nterscorer Reliabilities
2
.56 .53
.47
Interscorer reliability was determined for the diree scorers (A, 13', an, C)
used for the sample studied. Test tape recordings of 300 children were-selected
randomly, the-proportion from each site 'reflecting the sample size per site.
F
Each task was scored twice by independent judges.7
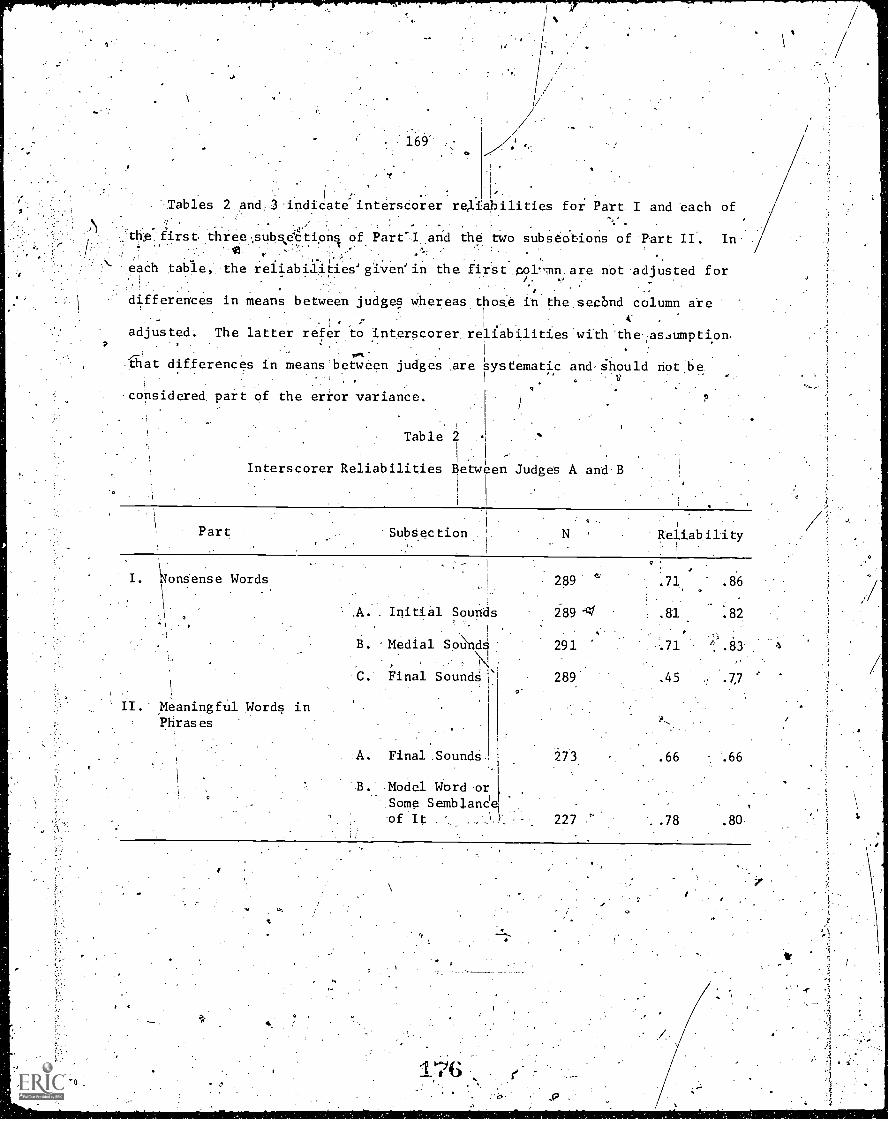
169
Tables 2:and,3 indicate interscorer regOilities for Part. I and each of
th firs t three subd,e* dons of Part7I_ and the two subSeOtions of Part II. In
each table, the reliablaities' given' in the -Eirst.col.:,mn.are not adjusted for
differences in means between judges whereas those in the.seand column are
adjusted: The latter refer to interscorer, relfabilities with 'theasJumption,7 '
sotthat differences in means between judges are systematic
considered, part of the error variance.
Table 2
Interscorer Reliabilities Between Judges A and B
and should not ,b
Part Subsection N Reliability
I. Nonsense Words
II Meaningful Words inPhrases
289' ' . 71 .86
, Initial Sounds 289 .8'1 .82
. Medial Sollnd 291 . Eb.
Final Sound4 289 .45 .7,7 '
A. Final Sounds
B. Model Word orSome Semblanc'of It . ,
.66
227 .78 .80
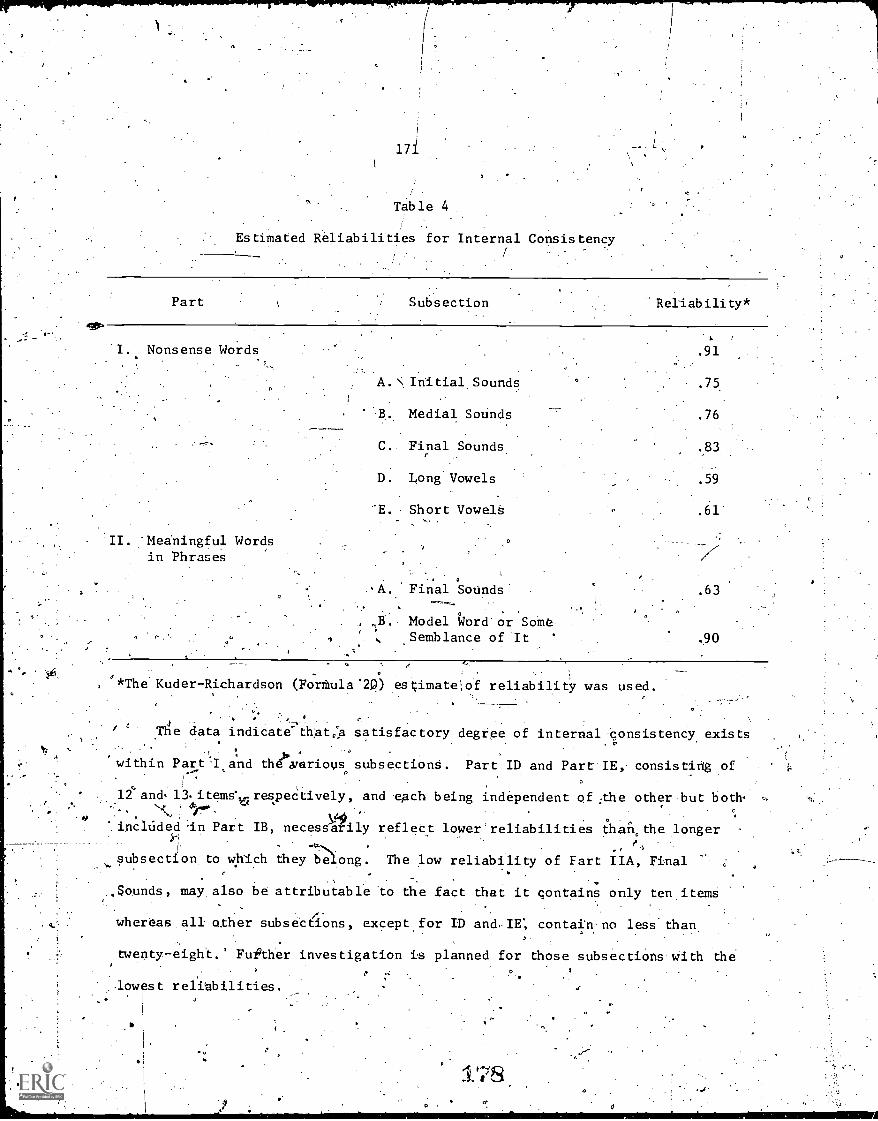
17i
Table 4, .
Estimated Reliabilities for Internal Consistency
Part Subsection Reliability*
I. Nonsense Words
II. Meaningful Wordsin Phrases
A. Initial Sounds
B. Medial Sounds
C. Final Sounds
D. Long Vowels
'E. Short Vowels
. Final Sounds
Model Word' or SomeSemblance of It .90
. 91
.75.
. 76
.83
.59
. 61
.63
. .
'*The Kuder-Richardson ForMula '20) estimateof reliability was used.
The.J 4
data indicate" thAt0la satisfactory degree of internal consistency exists, . .
.
t I a-I.within Par .nd the Ntrious subsectionS. Part ID and Part. IE, consisting of
.
12.4and.li.iteme,respeCtively, and each being independent of ;the other but both- '%, ! 4'e!'" -
.. inCluded :in Part IB, necesslily reflect lower' reliabilities hai% the longer. .
''.)
subsection to which they belong. The low reliability of Fart IIA, Final
,Sounds, may also be attributable to the fact that it contains only ten items
whereas all uther subsections, except for ID and. IE; contaiin no less' than
twenty-eight.' Fufther investigation is planned for those subsections with the
lowest t
I
1.
c
relitbilities.
17S
D
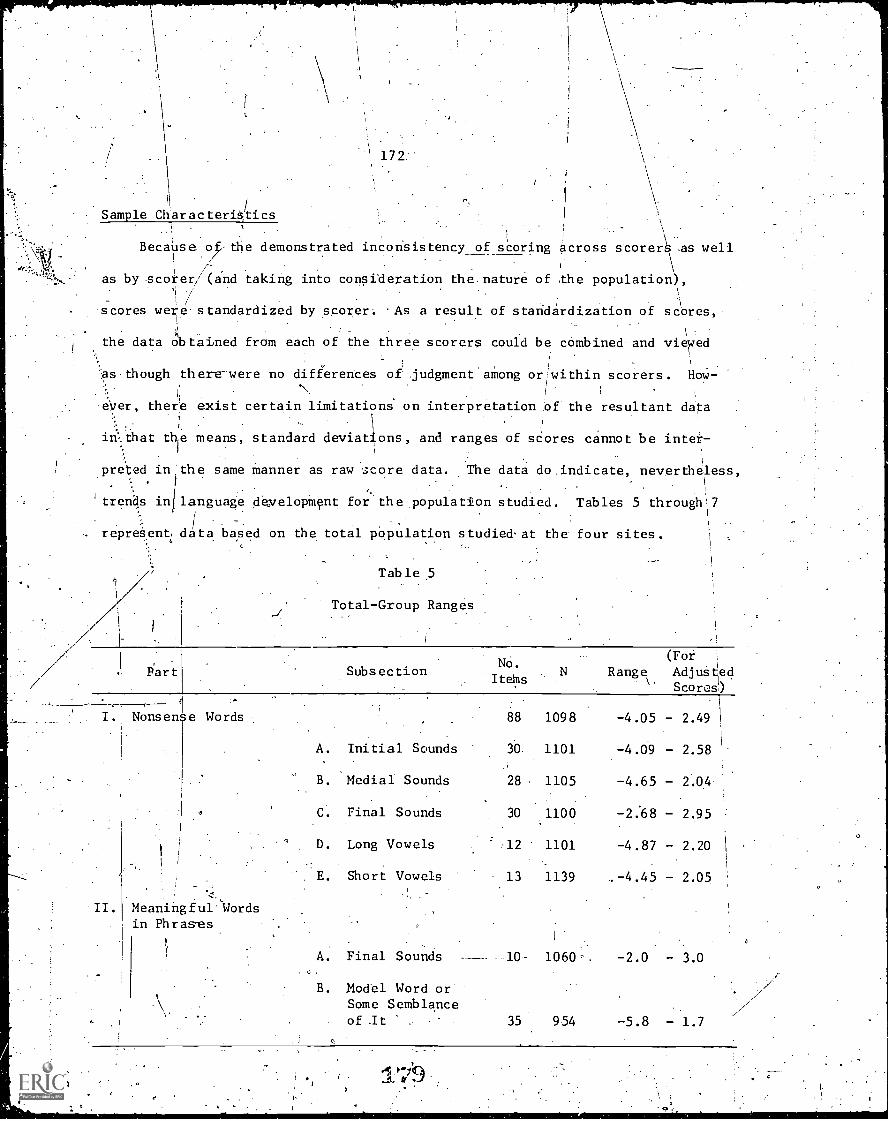
Sample Characteristics
.
172
Because o£- the demonstrated inconsistency of scoring across scorer as well(
\ i. . .,
..
as by scorer/ (and taking into consideration the. nature of the population),
- / \scores were- standardized by scorer: As a result of standardization of scores,
x 1
the data obtained from each of the three scorers could be combined and viewed-.. I
1
:as- though there-were no differences of judgment among or /within scorers. How-,
ever, there exist certain limitations on interpretation pf the resultant data
that tb1e means, standard deviations, and ranges of scores cannot be inter-,
preted in 'the same manner as raw score data. The data do .indicate, nevertheless,. i
trends in' language developMent for the population studied. Tables 5 through! 7
represent data based on the total pOpulation studied, at the four sites.
II.
Part
Nonsense Words
Meaningful 'Wordsin Phrases
Table 5
Total-Group Ranges
SubsectionNO.
Items
88 1098
A. Initial Sounds 30. 1101
B. Medial Sounds 28 . 1105
C. Final Sounds 30 1100
D. Long Vowels : 1101
E. Short Vowels 13 1139
A. Final Sounds 10- 1060'.
B. Model Word orSome Semblanceof .It 35 954
(For
Range Adjustl
Scores)
-4.05 2.49
-4.09 - 2.58
-4.65
-2.68 2.95
-4.87 2.20
1
..-4.45 2.05
-2.0 - 3.0
-5.8 - 1.7
P"1.47411
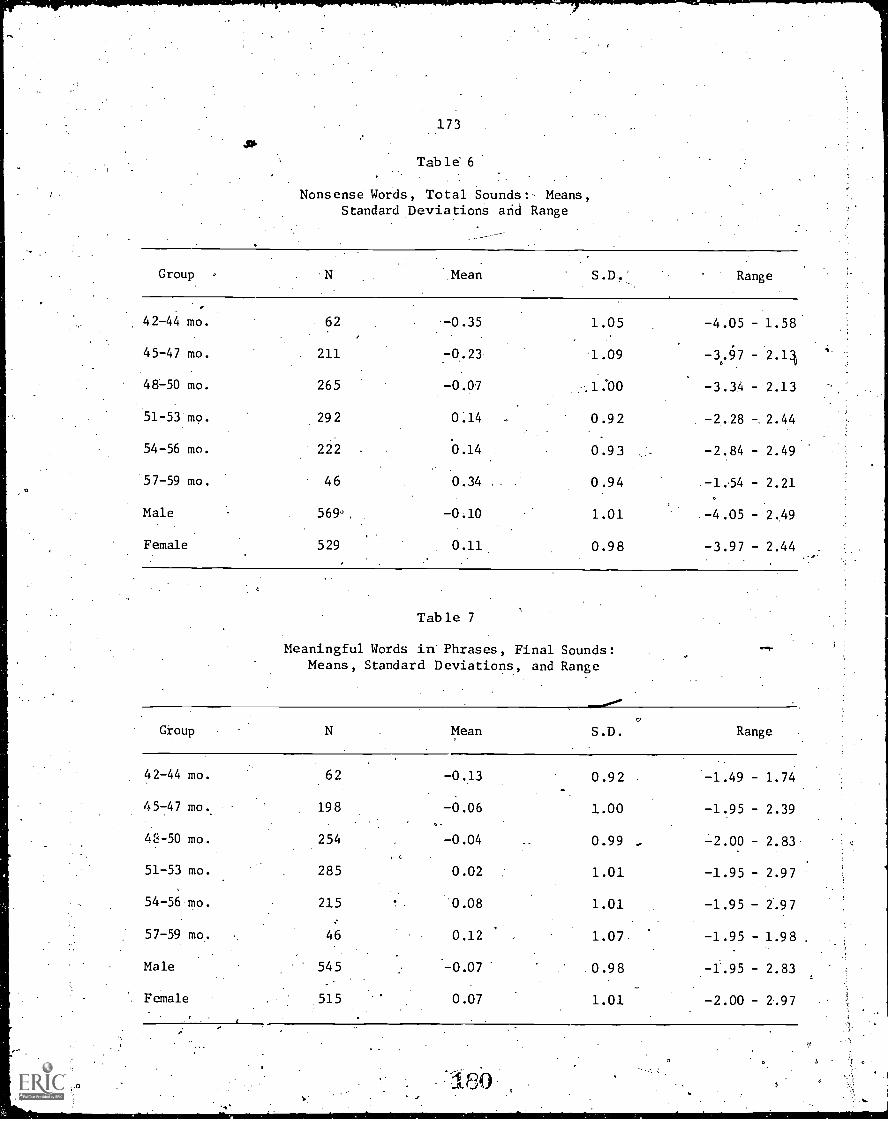
173
Table- 6
Nonsense Words, Total Sounds: Means,Standard Deviations and Range
Group . Mean S .D., Range
42-44 mo. 62 -0.35 1.05 -4.05 - 1.58,
45-47 mo. 211 .-0.23 1.09 -3.. 67 2.11
48-50 mo. 265 -0.07 -.1.'00 -3.34 - 2.13
51-53 mo. 292 0.14 . 0.92 -2.28 - 2.44
54-56 mo. 222 0.14 0.93 -2.84 - 2.49
57-59 mo. 46 0.34 . 0.94 -1.54 2.21
Male 569', -0.10 1.01 -4.05 2.49
Female 529 0.11 0.98 -3.97 2.44 ....
Table 7
Meaningful Words in Phrases, Final Sounds:Means, Standard Deviations, and Range
Group N Mean S.D.O
Range
42-44 mo.
/45 -47 mo.
62-50 mo.
51-53 mo.
54-56 m
57-59 mo.
Male
Female
62
198
254
285
215
46
545
515
-0.13
-0.06
-0.04
0.02
0.08
0.12
- 0.07
0.07
0.92
1.00
0.99
1.01
1.01
1.07.
0.98
1.01
-1.49 - 1.74
- 1.95 2.39
- 2.00 2.83
- 1.95 2.97
1.95 - 2.97
- 1.95 1.98 .
1.95 2.83
-2.00 2.97
174
The data indicated that children's ability to reprOduce phonemes as well,
as meaningful words in phrases increases with age between 42 and 59 months.
Further, it appeared that boys and girls in this . age range differ. in these
abilities, girls .tending to achieve at a higher. level.
0
Matching Familiar Figures Test
Purpose
The Matching Familiar Figures Test is a measure of the response style
"reflection-itpulsivity." On'tasks where there are several response alterna-
tives and some uncertainty as to which is correct, some individuals--
reflectives--typically take time to consider their. possible responses, and
therefore have a relatively low error rate; others-impulsives--respond
quickly and with a higher, proportion of errors (Kagan, Rosman, Day, Albert,
& Phillips, 1964). Response latency on tests of reflection-impuisivity'has-
been found to be nearly independent of-IQ, although errors are a function
both of the stylistic. variable and of ability. Reflectiveness is, however,
related to petfoimance on tests of reasoning (Kagan, Pearson, '& Welch, 1966)
and of word reading (Kagan, 1965). in early elementary children. Its implica-
tions for performance in children below school age are not known, but the
dimension has been .found to be present in kindergarten children (Ward, 1968),
and in middle- class nursery school children (Lewis, Rausch, Goldberg, &Dodd,
1968). Inclusion of a measure of the dimension iwthe present battery, along
with.several other me4sures-of impulse expressioz.and control, will allow
assessment of the generality and dimensionality of impulsivity in young dis-
advantaged childrenoand,of its implications for cognitive performance at
this age.
Task Description
The version of the testAed in the present battery was developed by
Levis et al. (1968), and used'by them with middle-class three-year-olds._
The test consists of two practice and eighteen test, items. On each item the0
.175.
t32
,
176O
child is shown one standard and four comparison figures and must point to the
one figure among the four which is fdpintiral to the standard. Latency -to
first choice and number of errors (to a maximum of two per item) are recorded.
Scoring
Two scores were obtained: mean response time and mean number of errors.
The laterviies were Windsorized. to a maximum of .20 seconds and then transformed
by log (X + 1) before 'averaging, since their distributions were positively
skewed, and it appeared desirable to decrease the effect of a single unusually
long latency on the score. Mean errors were expressed on a per-item basis,
so that spoiled items could be eliminated from the average for a subject with-
out affecting his possible error score.
Sample Characteristics
Item data were examined for a subsample consisting-of the first 853
cases available for analysis. Over the various items, `the number of, subjects
whose first response was correct ranged from 37 to 84 percent, with median,
of 50 percent. The correct alternative was the modal first response for six-.
teen of the eighteen test items, and was nearly so for the remaining two items.
The most favored distractor was chosen with a.frequency ranging'from 8 to 47
percent of the subsample, and a median of 25 percent. ,The test, therefore,
appeared to possess an appropriate difficulty level for the present sample,
and none of the items had Unacceptable distributions of responses.
Mean response time and mean error scores were examined for possible ageIt
and sex dicferences. Scores were.obtained fon.the first eight test items,- 4,- . .
q. .
the last .ten test items, and all test.items,- to allow,examination of whether-.
any"systematic differences in performance were to be found between early and
177
later items on the test. No major differences were evident; only the tote
scores need be considered.
There was'no sex difference for either score. Mean errors decreased
with age within the sample (r = -.20);. while mean response time had a
negligible correlation (-.07) with age. However, when the, data were examined
for each three-month age group in the sample,-mean response time showed a
regular decrease with, increasing age w'aich was consistent across testing
sites and as large-7dround four-tenths of one standard deviation--as that for
. \-mean errors. (See Tables 1 and 2.) ThiS latter'findihg is inconsistent with
dxpeCtations from other work where, over a broader age range, older children
hive shown longer response time and lower error scores than have young sub-.
j ects .
Both the time and the error scores possessed substantial internal con-b
sistency. For response time, coefficient alpha was .90, while for the error
score it was .70. However, contrary to previous findings with the reflection-
impulsivity dimension, these two scores were unrelated--over the entire sample
their correlation was .02, and this coefficient did not differ for males
versus females, or for younger as. compared to older subjects. This result
suggests\ the need for caution in interpretation; the children in the present
sample show the same consistency in response tempo which has been obtained
with older children, but this variance in tempo does not appear to have the
same implications for quality of performance for them as it has in older
subjects.
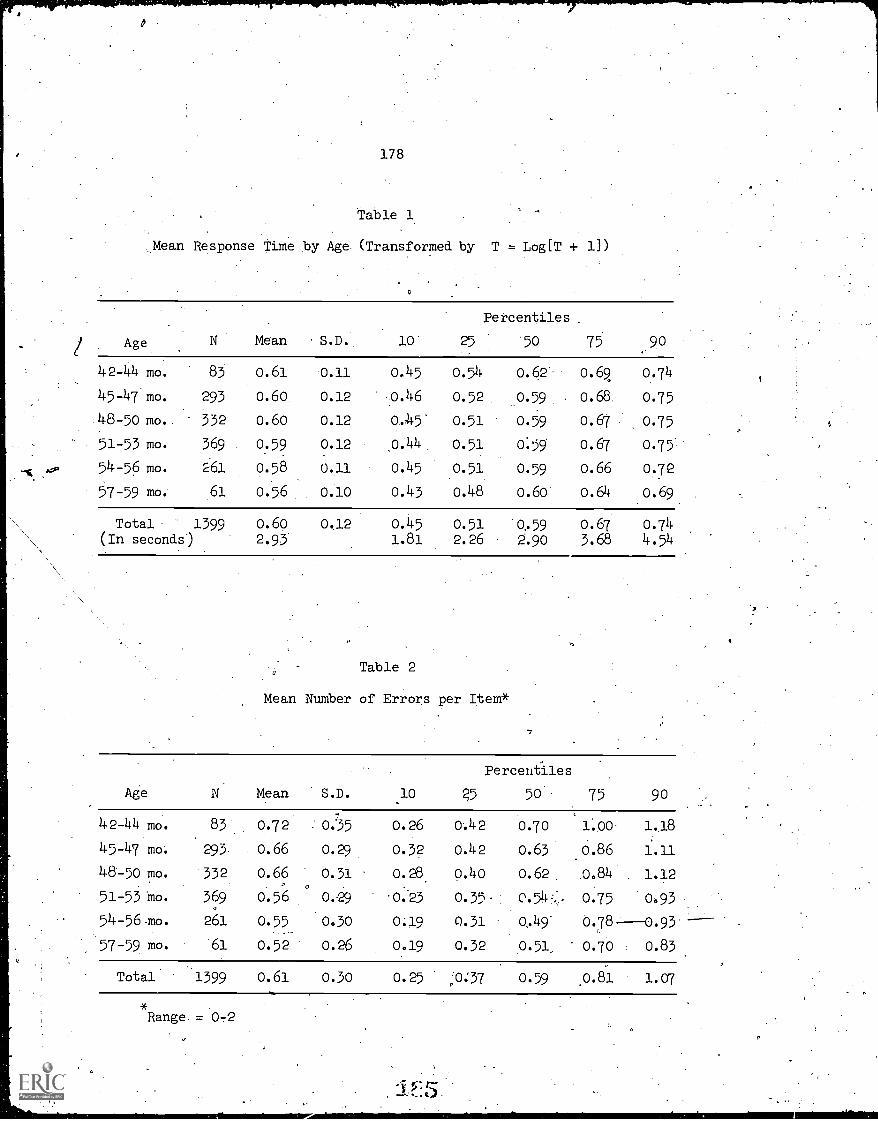
178
Table 1
Mean Response Time by Age. (Transformed by T = Log[T + 1))
Age N Mean S.D.
Percentiles
25 '50 75 90
42-44 mo. 83 0.61 0.11 0.45 0.54 0.62 0.69 0.74
45-47 mo. 293 0.60 0.12 0.46 0.52 0.59 0.68. 0.75
48-50 mo. 352 0.60 0.12 0e45. 0.51 0.59 0.67 0.75
51-53 mo. 369 0.59 0.12 0.44 0.51 0.59 0.67 0.75
54-56 mo. 261 o.58 0.11 0.45 0.51 0.59 0.66 0.72
57-59 mo. 61 0.56 0.10 0.43 0.48 0.60 0.64 0.69
Total 1399 0.60 0.12 0.45 0.51 0.59 0.67 0.74(In seconds) 2.93 1.81 2.26 2.90 3.68 4.54
Table 2
Mean Number of Errors per Item*
Age N Mean S.D. 10
percentiles
?5 5o 75 90
42-44 mo. 83 0.72 0235 0.26 0.42 0.70 1.00 1.18
45-47 mo. 293 0.66 0.29 0.32 0.42 0.63 0.86 1.11
48-50 mo. 332 0.66 0.31 0.28. 0.40 0.62 0.84 1.120
51-53 mo. 369 0.56 0.29 '0.25 0.35 0.54, 0.75 0.93
54-56 .mo. 261 0.55 0.30 0.19 0.31 0,49 0.78----0.93
57-59 mo. 61. 0.52 0.26 0.19 0.32 0.51 0.70 0.83
Total 1399 0.61 0.30 0.25 00.37 0.59 0.81 1.07
Range .= 0-2
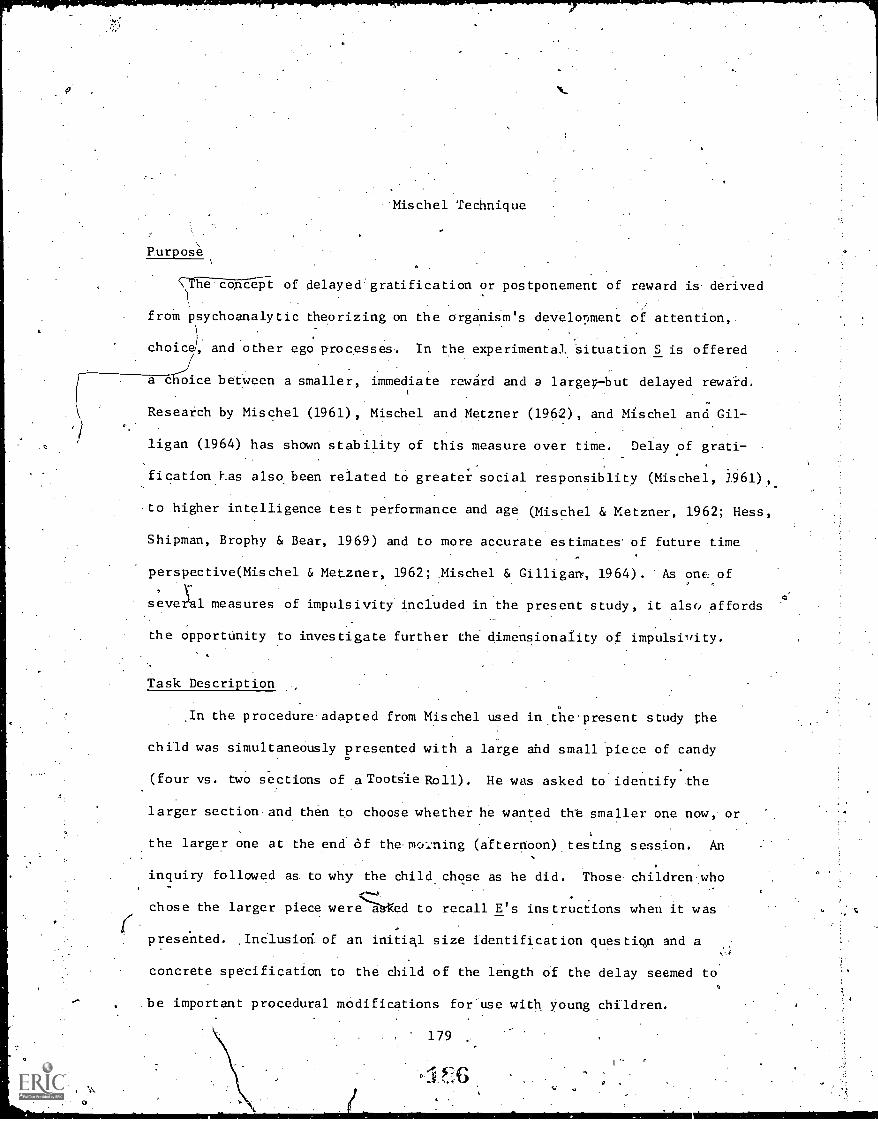
Purpose
Mischel Technique
SThe concept of delayed-gratification or postponement of reward is derived
from psychoanalytic theorizing on the organism's development of attention,
choice, and other ego processes. In the experimental situation S is offered
a 6O ice between a smaller, immediate reward and a large-but delayed reward.
Research by Mischel (1961), Mischel and Metzner (1962), and Mischel and Gil-
ligan (1964) has shown stability of this measure over time. Delay of grati-
fication Las also been related to greater social responsiblity (Mischel, i961),.
to higher intelligence test performance and age (Mischel & Metzner, 1962; Hess,
Shipman, Brophy & Bear, 1969) and to more accurate estimates' of future time
perspective(Mischel & Metzner, 1962; .Mischel & Gilligan, 1964). As onc of
sevel measures of impulsivity included in the present study, it also affords0
the opportunity to investigate further the dimensionality of impulsivity.
Task Description
In the procedure.adapted from Mischel used in the'present study the
child was simultaneously presented with a large and small piece of candy
(four vs. two sections of a Tootiie Roll). He was asked to identify the
larger section and then to choose whether he wanted the smaller one now, or
the larger one at the end of themcJIming (afternoon) testing session. An
inquiry followed as to why the child chose as he did. Those children-who
chose the larger piece wereed to recall E's instructions when it was
preselited. ,InClusioli of an initial size identification question and a
concrete specification to the child of the length of the delay seemed to
be important procedural modifications for use with young children.
179
I
O
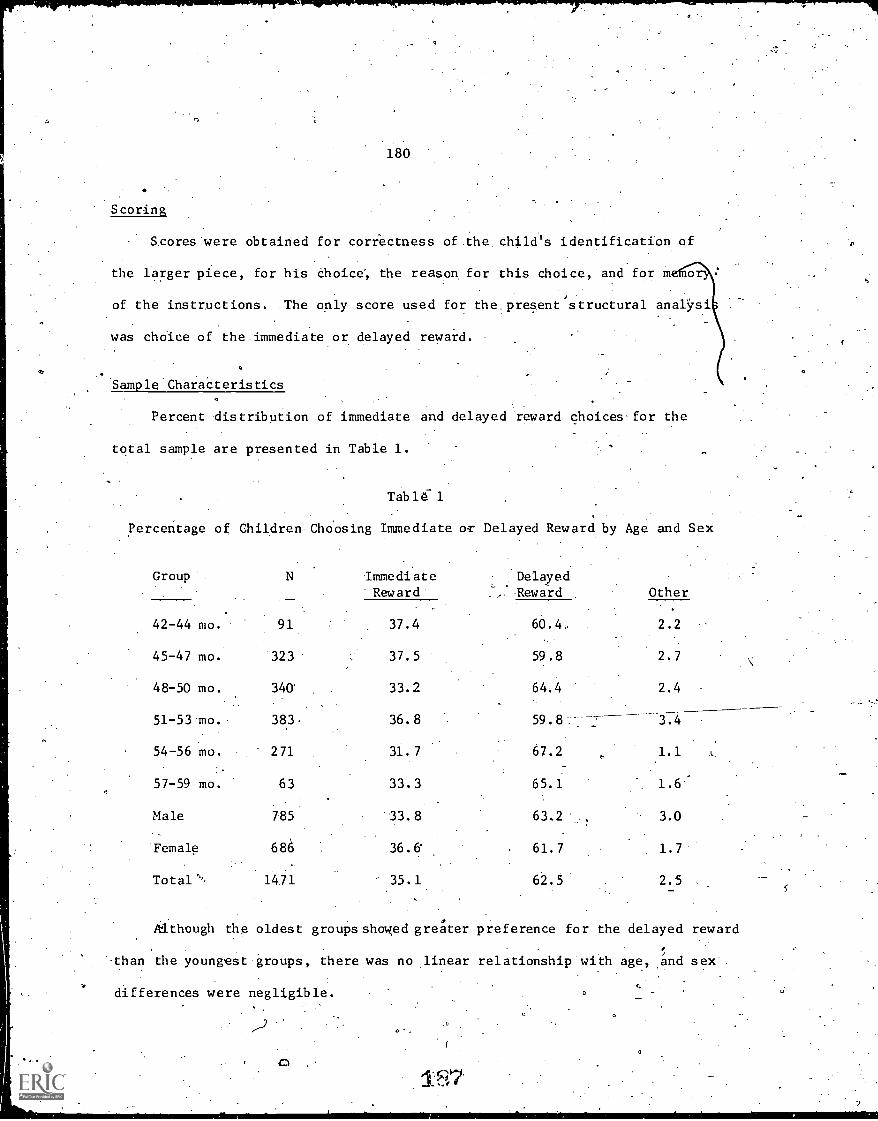
180
Scoring
Scores were obtained for correctness of the child's identification of
the larger piece, for his choice, the reason, for this choice, and for m
of the instructions. The only score used for the.present'structural analSrsi
was choice of the immediate or delayed reward.
O
Sample Characteristics
Percent distribution of immediate and delayed reward choices-for the
total sample are presented in Table 1.
Tab16-1
Percentage of Children Choosing Immediate or Delayed Reward by Age and Sex
Group N Immediate Delayed_ .
Reward Reward Other
42-44 mo. 91 37.4 60.4, 2.2
45-47 mo. 323 37.5 59.8 2.7
48-50 mo. 340' 33.2 64.4 2.4
51-53 mo. 383 36.8 59.8 :----- 3.4
54-56 mo. 271 31.7 67.2 1.1
57-59 mo. 63 33.3 65.1 1.6"
Male 785 '33.8 63.2 3.0
Female 686 36.6 61.7 1.7
Total', 14.71 35.1 62.5 2.5
Although the oldest groups showed greater preference for the delayed reward
than the youngest groups, there was no ,linear relationship with age, and sex
differences were negligible.
.)
ca
..
1.947,,
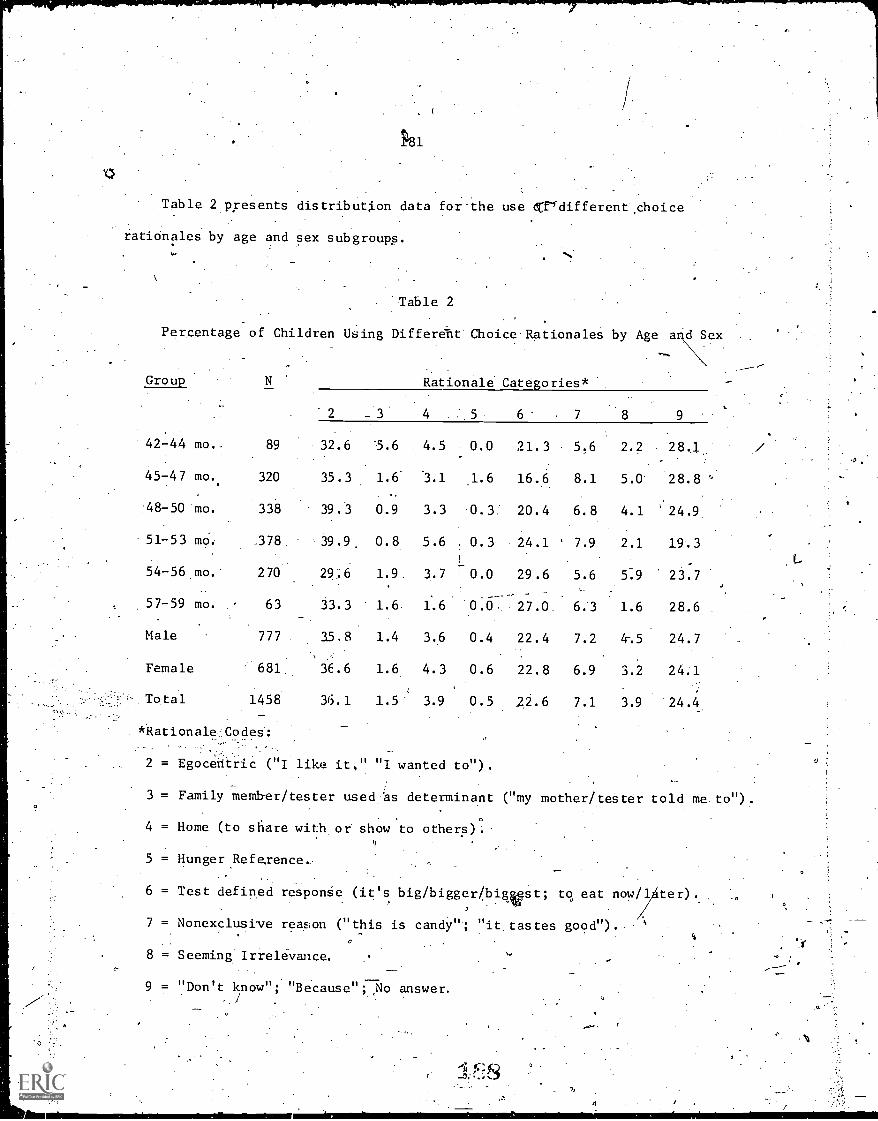
148 1
Table 2 presents distribution data forthe use drrdifferent,choice
rationales by age and sex subgroups.
Table 2
Percentage of Children Using Different' Choice Rationales by Age a Sex
Group N Rationale Categories*
2 4 5 6 7 8 9
42-44 mo. 89 32.6 5.6 4.5 0.0 21.3 5.6 2.2 28.1
45-47 mo. 320 35.3 1.6 3.1 1.6 16.6 8.1 5.0 28.8
48-50 mo. 338 39.3 0.9 3.3 0.3. 20.4 6.8 4.1 24.9
51-53 m . _378 39.9. 0.8 5.6 . 0.3 24.1 7.9 2.1 19.3
54 -56 mo. 270 29.6 1.9 3.7 ^ 0.0 29.6 5.6 5.9 23.7
57-59 mo. 63 33.3 1.6 1.6 0.6 27.0 6.3 1.6 28.6
Male 777 35.8 1.4 3.6 0.4 22.4 7.2 4-.5 24.7
Female 681 36.6 1.6 4.3 0.6 22.8 6.9 3.2 24.1
Total 1458 36.1 1.5 3.9 0.5 22.6 7.1 3.9 24.4
*Rationale Codes:
2 = Egocentric ("I like it," "I wanted to").
3 = Family member/tester used as determinant
4 = Home (to share with or show to others).
5 = Hunger Reference..
mother/tester told me. to").
6 = Test defined responge (it's big /bigger /biggest; to eat now /liter).
7 = Nonexclusive reason ( "this is candy"; "it.tastes good").
8 = Seeming Irrelevance.
9 = "Don't know "; "Because"i7slo answer.../ .
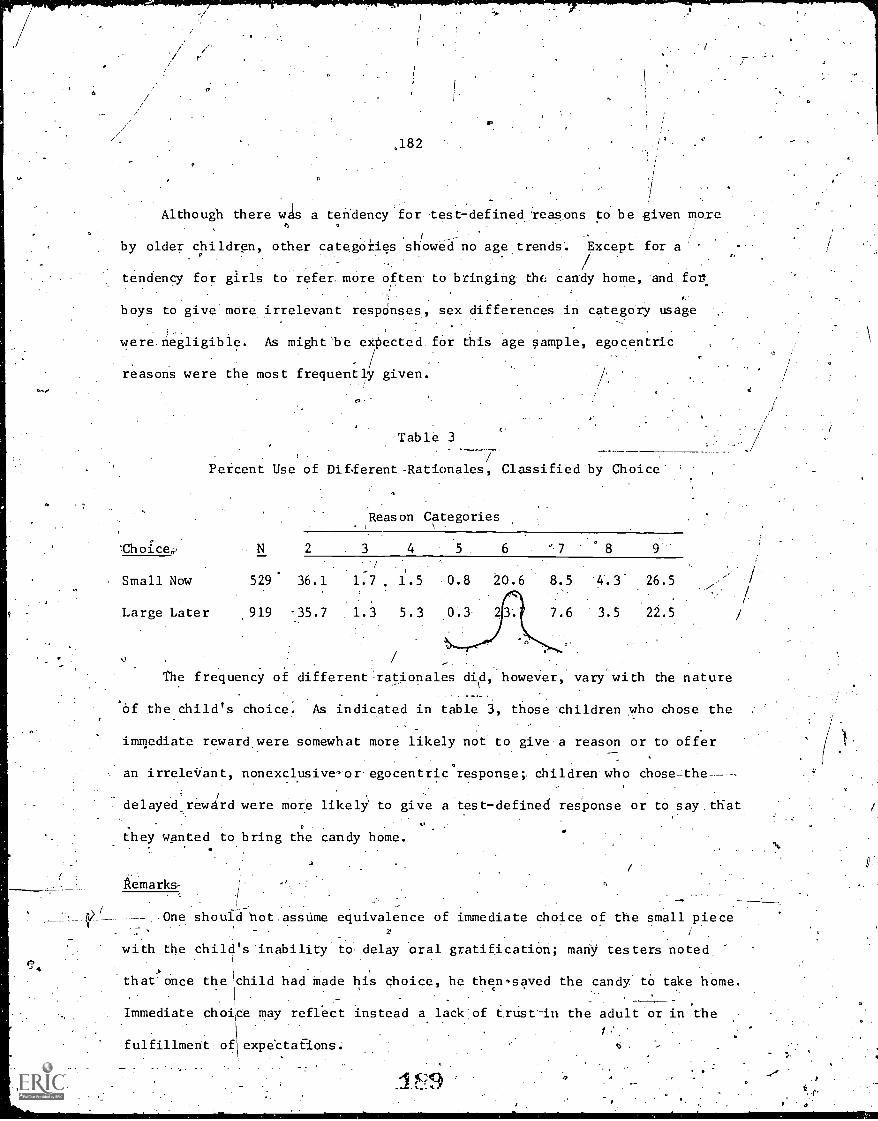
6
.182
Although there wds a tendency for test-defined 'reasons to be giyen more
_.--
by older children, other categOries showi ed no age trends'. Except for a
tendency for girls to refer. more often .to bringing the candy home, and fot
boys to give more irrelevant respOnses, sex differences in category usage
were negligible. As might be expected for this age sample, egocentric
reasons were the most frequently given.
Table 3
Percent Use of Diflerent-Rationales, Classified by Choice
Reason Categories
Choice, N 2 3 4 5 6 °7 8 9
Small Now 529' 36.1 1.7 1.5 0.8 20.6 8.5 4.3' 26.5
Large Later ,919 -35.7 1.3 5.3 0.3 7.6 3.5 22.5
The frequency of different rationales did, however, vary with the nature
of the child's choice. As indicated in table 3, those children who chose the
immediate reward were somewhat more likely not to give a reason or to offer
an irreleVant, nonexclusive-or- egocentric response;. children who chose-the-----
/
delayed reward were more likely' to give a test-defined response or to say.that.
they wanted to bring the candy home.
Remarks-
.
,One should hot .assume equivalence of immediate choice of the small piece
with the child's 'inability to delay oral gratificatiOn; many testers noted
. .. I
that once the II child had Made his Choice, he then-saved the candy to take home.
1
Immediate choi'Ce may reflect instead a lack of trust-in the adult or in the
\
f:,.fulfillment ofl1 expeCtaflons. o ..,
.

Mother-Child Interaction Tasks\.
, .
(Hess and. Shipman Toy-Sorting and Eighrldck Sorting Tasks)
t.
The three tasks used in this study for investigating mother-child inter-/
action were the Hess and Shipman Toy. Sorting and Eight-Block Sorting Tasks and
the Hess and Shipman Etcl-A-Sketch Interaction Task. .Discussion hgre is
limited to the two sortiig tasks included in the present analysis, and to only
those data concerning the child's performance-in the test situation and the
tester's rating of his degree of cooperation during the teaching sesgions..
1
,.
Purpose
/
-In studying the e
child, it .is. essential
eCt ofI
co delineate the principal mechanisms of exchange that
mediate between the chi !ci and his environment. In this respect, the; mother
0
environment on the development of!sl ,
the young
may be seen as the most significant figure in the organization of the child's
early experiences .. One method of studying moher-chiidFOmmunication is by
i
\ .
.observing interaction iltuations structured so>that the 'information to be.t.
,
conveyed sto- the- child held (relatively) constant for all subje ts, but
each mother is free to,' hoose her preferred mode or technique of iconutiunicating
I ", ., 1
t ,
' this information. In t e Toy SOr ting and Eight - Block, Sorting!. Tasks, mothers. , .. .
are asked to-teach/their children to sort objects in specifiC way's and to make" ,
...1-.'1 . 0
clear the principles whch underly theresultant groupings.' Sorting tasks ofI
. . 1 ,this ics nature are. partular .useful for studying the mother's ability to trans- ,7
,A- / ---mit specific informatiOn to her child, her manner of presenting the task, and.;
her ability to recognize a d adjust to difficulties which the child may exper-.
ierle iri the.:situation. _,Also,0 the mother 's teaching strategies are .1.Aely to
have,consequences for the child's ability to grasp concepts or learn. lessons
in other specific teaching situations; they.thus affect the cognitive structures
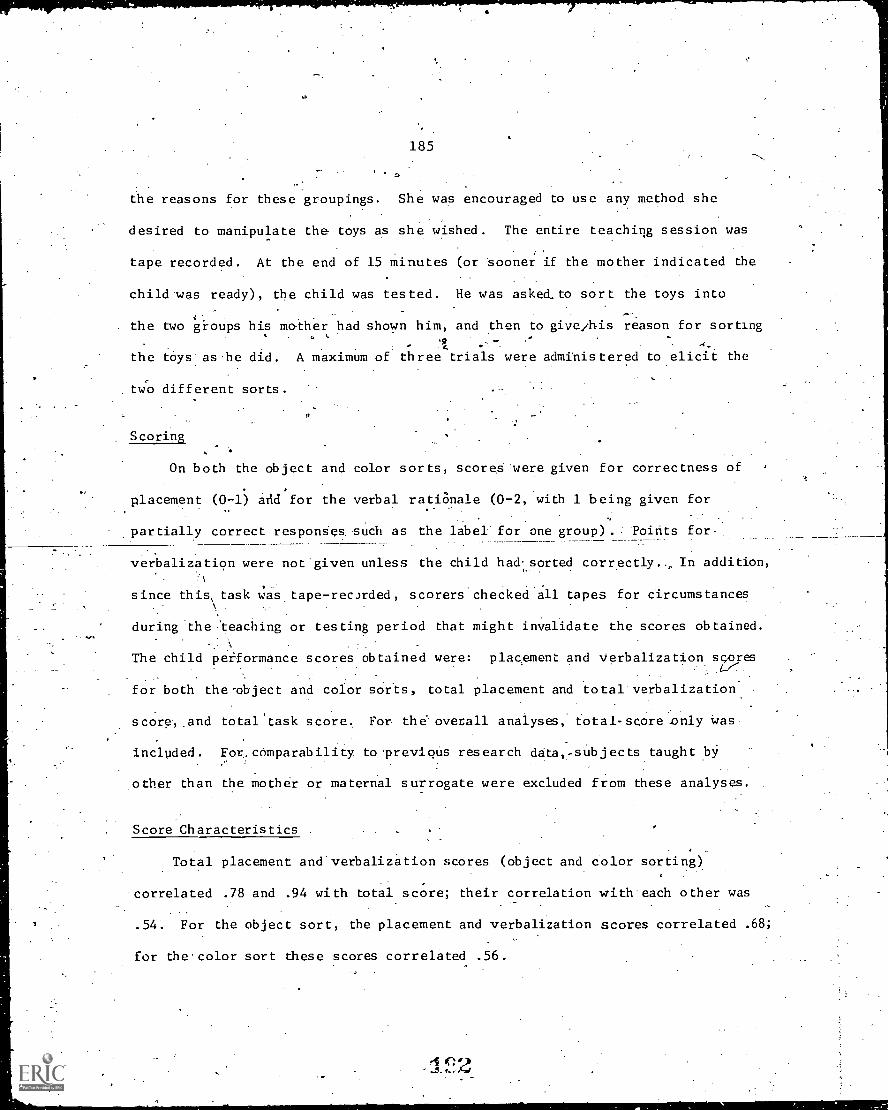
185
the reasons for these groupings. She was encouraged to use any method she
desired to manipulate the toys as she wished. The entire teaching session was
tape recorded. At the end of 15 minutes (or sooner if the mother indicated the
child .was ready), the child was tested. He was asked,.to sort the toys into
;
the two groups his mother had shown him, and then to give/his reason for sorting.. -
.
- '51. - 4-the toys as he did. A maximum of three trials were administered to elicit the
two different sorts.
Scoring
On both the object and color sorts, scores were given for correctness of
placement (0-1) aiidfor the verbal rationale -(0-2, with 1 being given for
partially correct responSes..such as the label for one group). Points for-.
verbalization were not given unless the child had- sorted correctly., In addition,
since this task was tape - recorded, scorers checked all tapes for circumstances
during the 'teaching or testing period that might invalidate the scores obtained.
The child performance scores obtained were: placement and verbalization scores
for both the-object and color sorts, total placement and total verbalization
score-,.and total task score.. For the'overall analyses, total-score-only was
inclpded. For.. comparability to previous research data,- subjects taught by
other than the mother or maternal surrogate were excluded from these analyses.
Score Characteristics
Total placement and verbalization scores (object and color sorting)
correlated .78 and .94 with total score; their correlation with each other was
.54. For the object sort, the placement and verbalization scores correlated .68;
for the color sort these scores correlated .56.
-
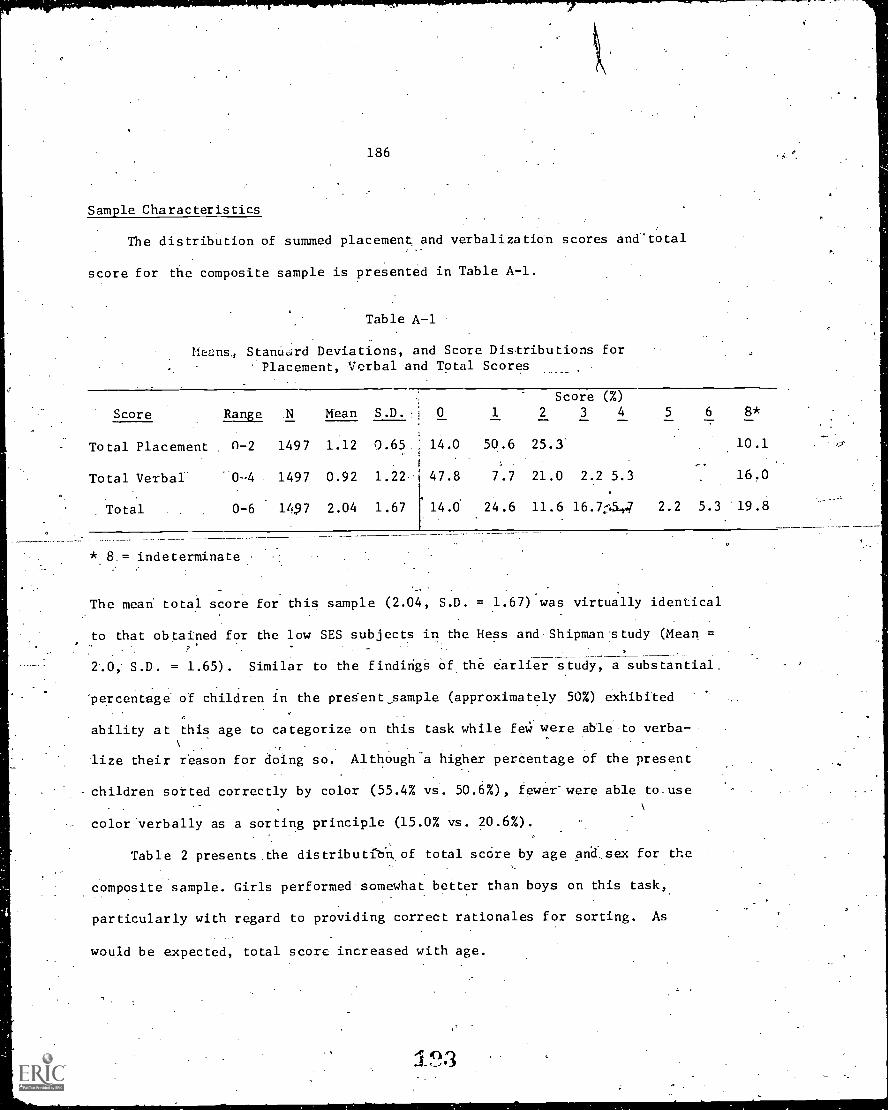
186
Sample Characteristics
The distribution of summed placement and verbalization scores and'total
score for the composite sample is presented in Table A-1.
Table A-1
Meims, Stana4,1rd Deviations, and Score Distributions forPlacement, Verbal and Total Scores
Score (%)
Score Range N Mean S.D. 0 1 2 3 4 5 6 8*
Total Placement n-2 1497 1.12 0.65 14.0 50.6 25.3 10.1
-Total Verbal 04 1497 0.92 1.22 47.8 7.7 21.0 2.2 5.3 16.0
Total 0-6 1497 2.04 1.67 14.0 24.6 11.6 16.7:154W 2.2 5.3 19.8
* 8.= indeterminate
The mean' total score for this sample (2.04, S.D. = 1.67) was virtually identical
to that obtained for the low SES subjects in the Hess and-Shipman study (Mean =
2.0; S.D. = 1.65). Similar to the findings of the earlier study, a substantial.
'percentage of children in the preSentsample (approximately 50%) exhibited
ability at this age to categorize on this task while feW were able to verba-
lize their reason for doing so. Although a higher percentage of the present
children sorted correctly by color (55.4% vs. 50.6%), fewer-were able to.use
color verbally as a sorting principle (15.0% vs. 20.6%).
Table 2 presents .the distributrbil of total score by age and..sex for the
composite sample. Girls performed somewhat better than boys on this task,
particularly with regard to providing correct rationales for sorting. As
would be expected, total score increased with age.
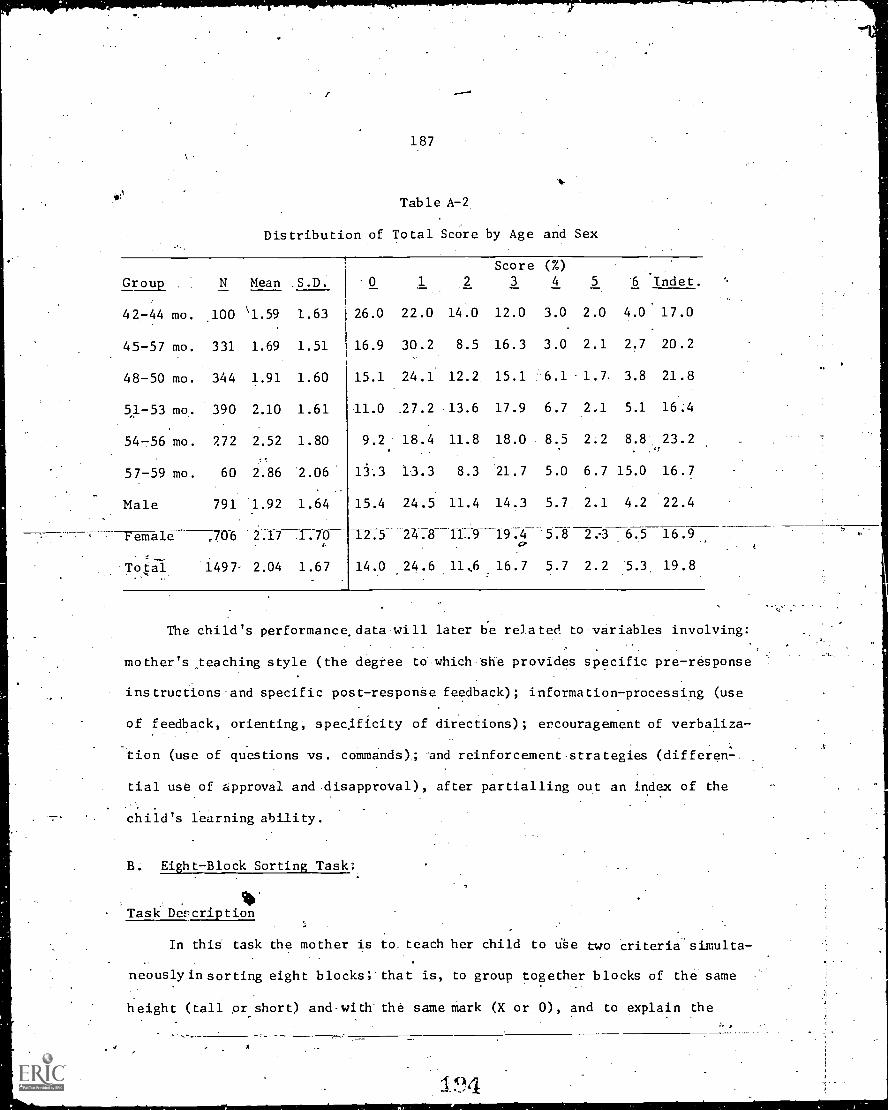
187
Table A-2
Distribution of Total Score by Age and Sex
Score (%)
Group N Mean S.D. 0 1 2 3 4 5 6
42-44 mo. 100 '1.59 1.63 26.0 22.0 14.0 12.0 3.0 2.0 4.0
45-57 mo. 331 1.69 1.51 16.9 30.2 8.5 16.3 3.0 2.1 2.7
48-50 mo. 344 1.91 1.60 15.1 24.1 12.2 15.1 6.1 1.7. 3.8
51-53 mo. 390 2.10 1.61 11.0 .27.2 13.6 17.9 6.7 2.1 5.1
54-56 mo. 272 2.52 1.80 9.2 18.4 11.8 18.0 8.5 2.2 8.8
57-59 mo. 60 2.86 2.06 13.3 13.3 8.3 21.7 5.0 6.7 15.0
Male 791 1.92 1.64 15.4 24.5 11.4 14.3 5.7 2.1 4.2
Female ..706 2.17 1.70 12.5 24.8 11-9 19.4 5.8 2.3 6.5
Total 1497' 2.04 1.67 14.0 24.6 11,6 16.7 5.7 2.2 5.3
indet.
17.0
20.2
21.8
16.4
23.2
16.7
22.4
16.9
19.8
The child's performance,data-will later be related to-variables involving:
mother's teaching style (the degfee to which -she provides specific pre-response
instructions and specific post-response feedback); information-processing (use
of feedback, orienting, specificity of directions); encouragement of verbaliza-
tion (use of questions vs. commands).; and reinforcement-strategies (differen--
tial use of approval and disapproval), after partialling out an index of the
.
child's learning ability.
B. Eight-Block Sorting Task:
. 10'Task Description
In this. task the mother is to. teach her child to use two criteria simulta-
neously in sorting eight blocks; that is, to group together blocks of the same
height (tall or short) and-with the same mark (X or 0), and to explain the
194
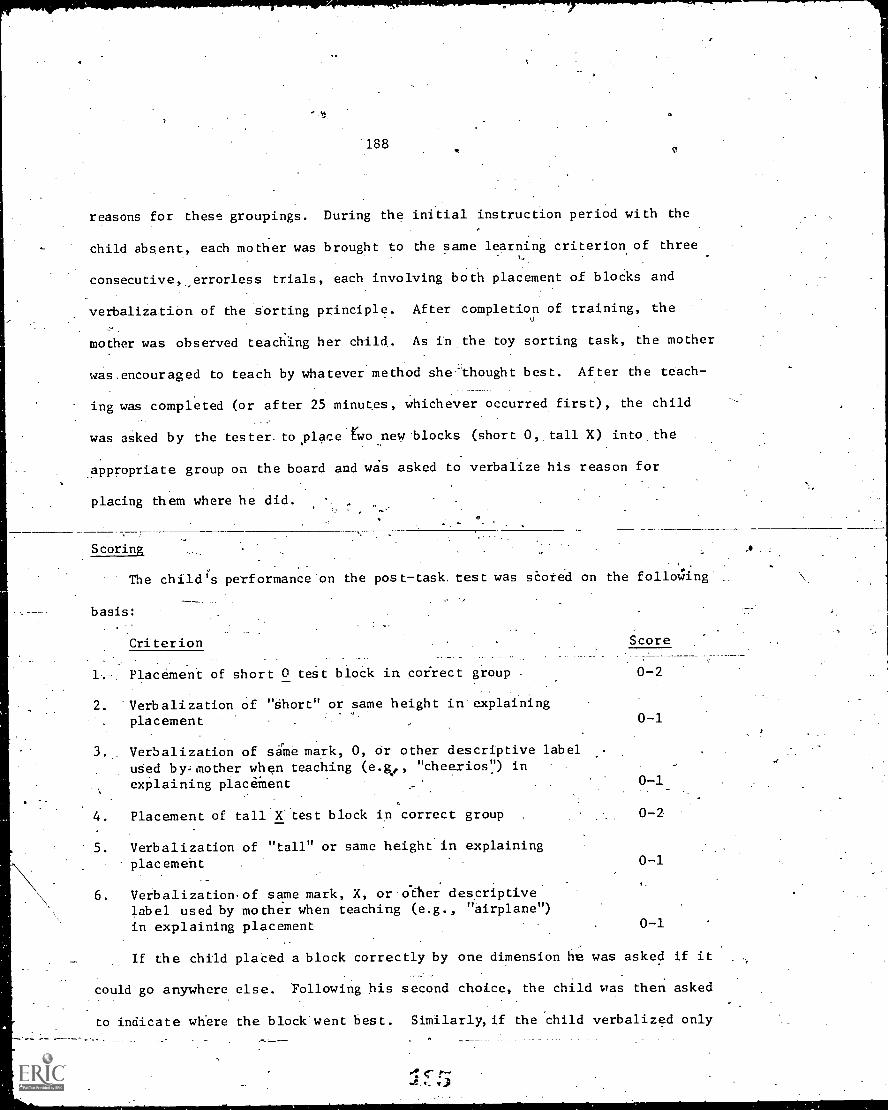
188
reasons for these groupings. During the initial instruction period with the
child absent, each mother was brought to the same learning criterion of three
consecutive,., errorless trials, each involving both placement of blocks and
verbalization of the sorting principle. After completion of training, the0
mother was observed teaching her child.. As in the toy sorting task, the mother
was,encouraged to teach by whatever method she thought best. After the teach
ing was completed (or after 25 minutes, whichever occurred first), the child
was asked by the tester to place rwo new blocks (short 0, tall X) into the
appropriate group on the board and was asked to verbalize his reason for
placing them where he did.
Scoring. .
The child's performance 'on the posttask. test was scored on the folloWing
basis:
Criterion Score
1. Placement of short 0 test block in correct group . 0-2
2. 'Veebalization of "short" or same height in explaining, placement
3. Verbalization of same mark, 0, or other descriptive labelused by= mother when teaching (e.g,, "cheerios ") inexplaining placement
4. Placement of tall )(test block in correct group .
5. Verbalization of "tall" or same height in explainingplacement
6. Veebalization.of same mark, X, or other descriptivelabel used by mother when teaching (e.g., "airplane")in explaining placement
0-1
0-1
0-2
0-1
0-1
If the child placed a block correctly by one dimension he was asked if it
could go anywhere else. Following his second choice, the child was then asked
to indicate where the block went best. Similarly, if the child verbalized only
189
one dimension after placing it in the correct group, he was asked if there was
any other reason. In combination these scores yielded a range of 0-8 points.
Points for Verbalization were given only if the child had placed the block
correctly according to the relevant dimension (height or mark).
The child performance scores obtained included placement and verbalization
scores for each of the two test blocks (short 0, tall X), total placement and
verbalization scores, and total score:'Total score only was used in the struc-
tural analyses.
Score Characteristics
Pearson product-moment correlations .for placement ana verbalization sub-
-stores-with- -to tal-s core- were .81 -and ,B6,respiettivelyr-th-eir'correla tiein,,
_ .
each other was ,32. Estimated relIabilities (coeffi,:ient alpha) for total
placement and total verbal scores were .55 and .86, respectively. In scoring
the protocols at was discovered that many testers had not requested and/or not
indicated. the Child's best choice after a multiple response( In all such cases
the child was given the benefit of doubt;and credited with the higher score.
The placement, score, therefore, is inflated. .This accounts partially for the
lower reliability of the placement score as 'Well as the low correlation between
the placement and verbal scores.
Sample Characteristics
Aistribution of summed placement and verbalization scores and total
score for the composite sample is presented in Table B-1.
1e6
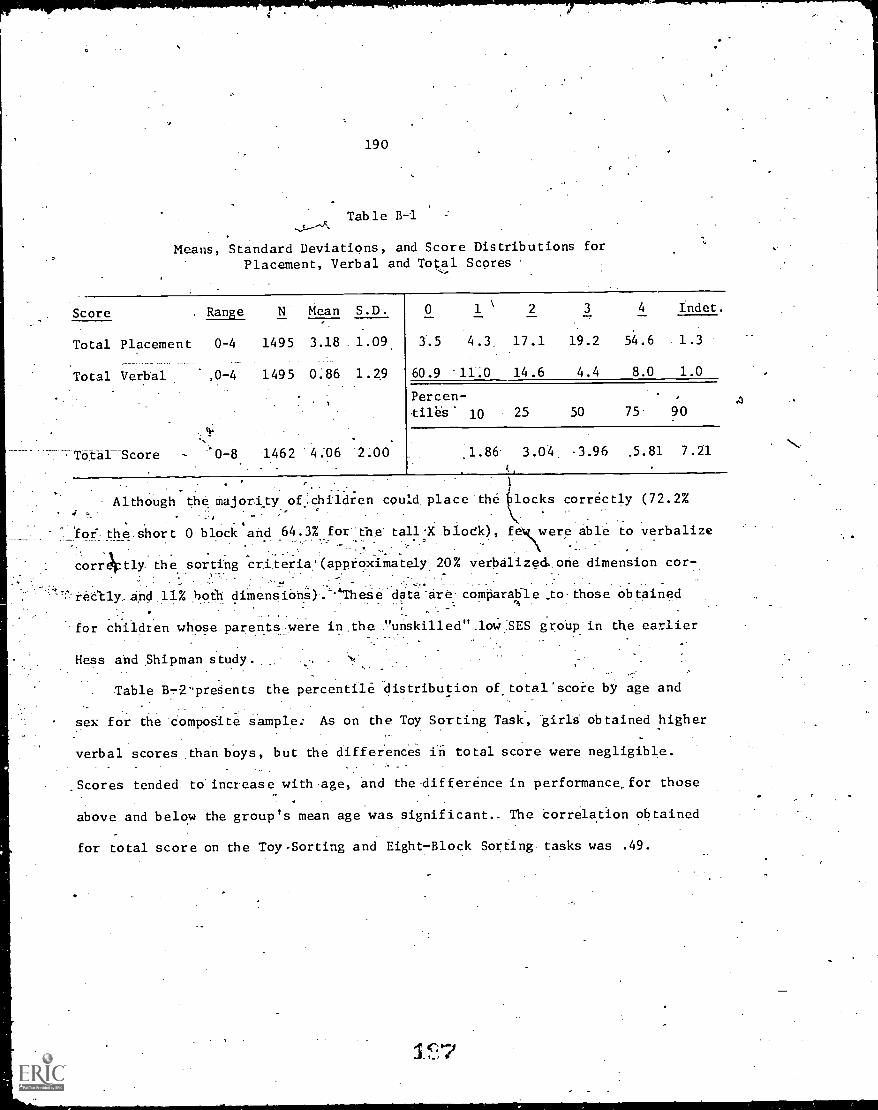
190
Table B-1
Means, Standard Deviations, and Score Distributions forPlacement, Verbal and Total Scores
Score . Range N Mean S.D. 0 1 2 3 4 Indet.
Total Placement 0-4 1495 3.18 1.09. 3.5 4.3, 17.1 19.2 54.6 1.3
Total Verbal ,0-4 149 5 0:86 1.29 60.9 11.0 14.6 4.4 8.0 1.0
Percen-tile's' 10 25 50 75 90
Total Score - 0-8 1462 4 :06 2.00 .1.86 3.04 3.96 .5.81 7.21
(,
Although the majority of children could. place the blocks correctly (72.2%-
- .
_Toe the short 0 block and 64.3% for the tall -X b1odk), able to verbalize
corrktly the sorting criteria' (approximately 20% verbalized, one dimension cor-. .
reetly,.and 11% both diinensiOng)..''These data:are. comparable _to- those obtained
for children whose parents were in the Hunskilledu_low SES group in the earlier
Hess and .Shipman study..
Table B7.2'preSents the percentile distribution of total' score by age and
- . .
sex for the compogite sample: As on the Toy Sorting Task, girlg obtained higher
verbal scores than boys, but the differences in total score were negligible.. -
Scores tended to increase with age, and the -difference in performance, for those
above and below the group's mean age was significant., The correlation obtained
for total score on the Toy -Sorting and Eight -Block Sorting tasks was .49.
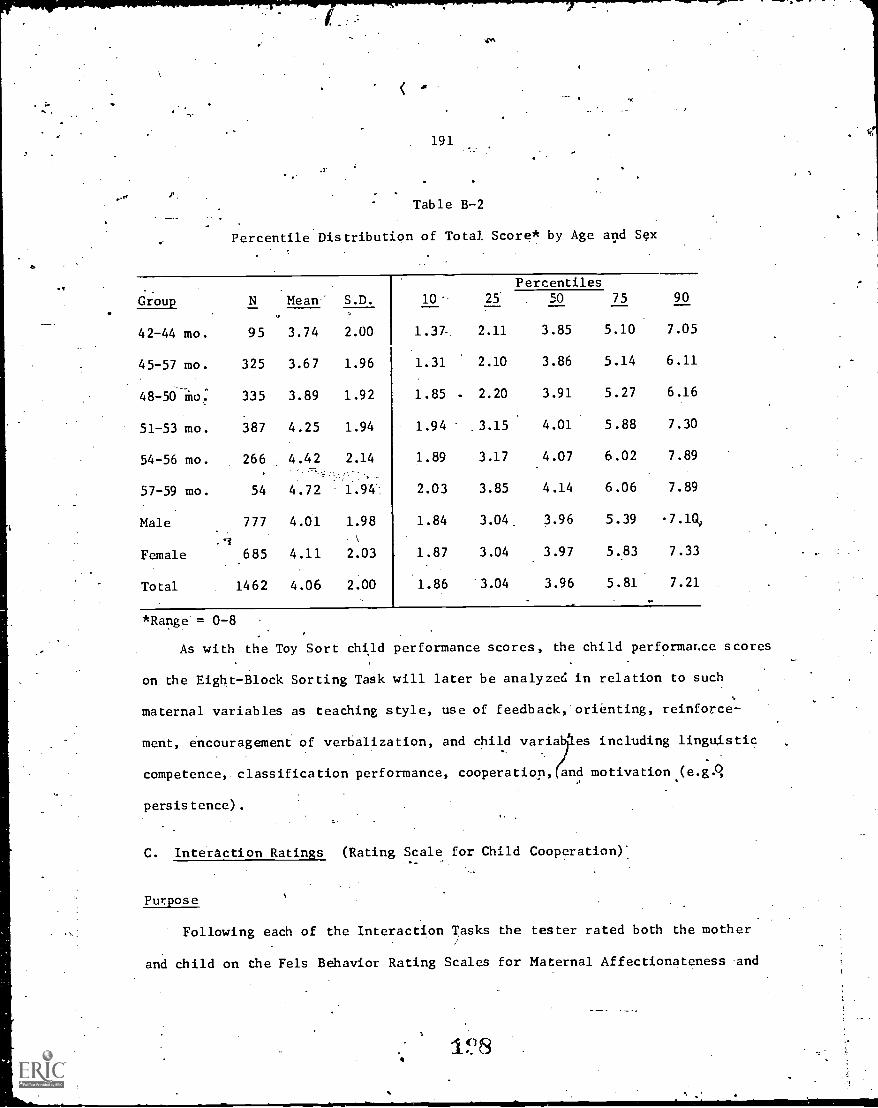
191
Table B-2
Percentile Distribution of Total. Score* by Age and Sex
r.
.1
Group N Mean" S.D. 10 25
Percentiles75 9050
42-44 mo. 95 3.74 2.00 1.37 2.11 3.85 5.10 7.05
45-57 mo. 325 3.67 1.96 1.31 2.10 3.86 5.14 6.11
48-5061o. 335 3.89 1.92 1.85 . 2.20 3.91 5.27 6.16
51-53 mo. 387 4.25 1.94 1.94 3.15 4.01 5.88 7.30
54-56 mo. 266 4.42 2.14 1.89 3.17 4.07 6.02 7.89
57-59 mo. 54 4.72 1.94 2.03 3.85 4.14 6.06 7.89
Male
.9
777 4.01 1.98 1.84 3.04 3.96 5.39 -7.1R,
Female 685 4.11 2.03 1.87 3.04 3.97 5.83 7.33
Total 1462 4.06 2.00 1.86 3.04 3.96 5.81 7.21
*Range = 0-8
As with the Toy Sort child performance scores, the child performance scores
on the Eight-Block Sorting Task will later be analyzed in relation to such
maternal variables as teaching style, use of feedback, orienting, reinforce-
ment, encouragement of verbalization, and child varia es including linguistic
7competence, classification performance, cooperation, and motivation (e.g .41
, .
persistence).
C. Interaction Ratings (Rating Scale for Child Cooperation).
Purpose
Following each of the Interaction Tasks the tester rated both the mother
and child on the Fels Behavior Rating Scales for Maternal Affectionateness -and
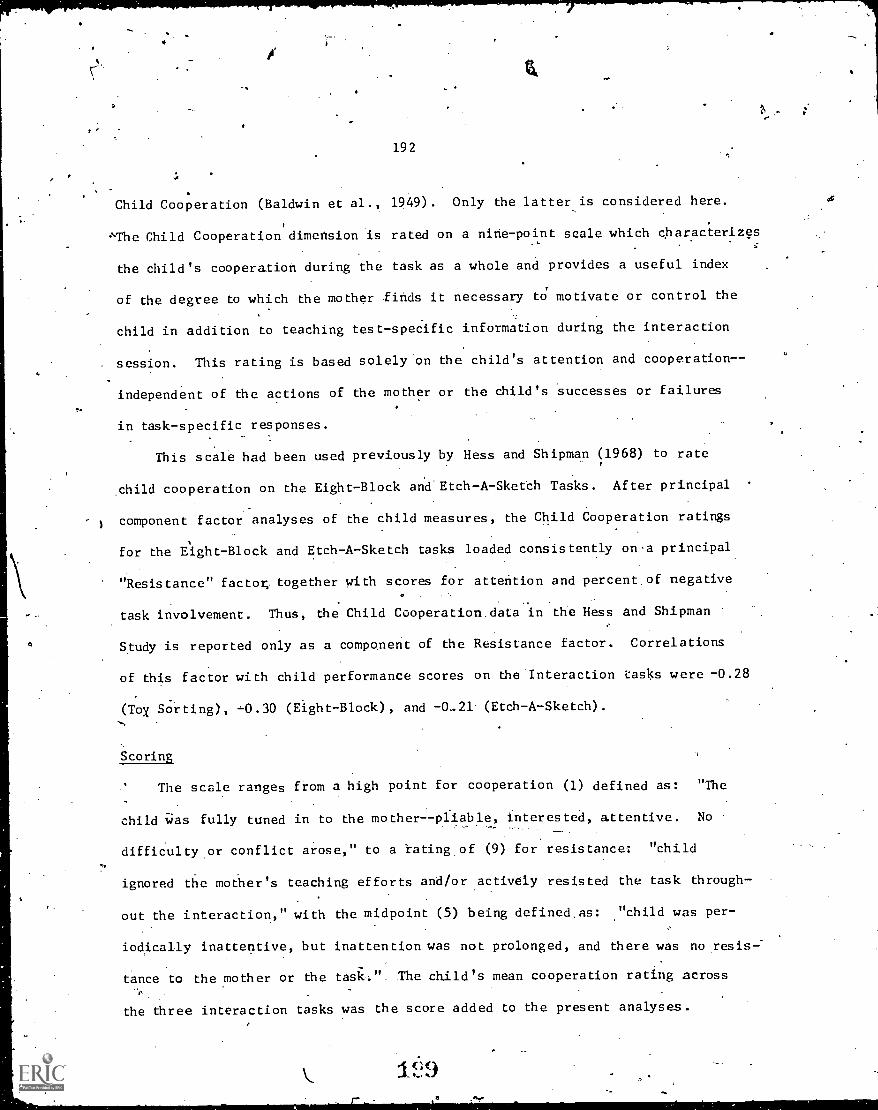
192
Child Cooperation (Baldwin et al., 1949). Only the latter is considered here.
.\-The Child Cooperation dimension is rated on a nine-point scale which characterizes
the child's cooperation during the task as a whole and provides a useful index
of the degree to which the mother finds it necessary to motivate or control the
child in addition to teaching test - specific information during the interaction
. session. This rating is based solely on the child's attention and cooperation- -
independent of the actions of the mother or the child's successes or failures
in task-specific responses.
This scale had been used previously by Hess and Shipman (1968) to rate
child cooperation on the Eight-Block and Etch-A-Sketch Tasks. After principal
) component factor analyses of the child measures, the Child Cooperation ratings
for the Eight-Block and Etch-A-Sketch tasks loaded consistently on-a principal
"Resistance" facto4 together with scores for attention and percent of negative
task involvement. Thus, the Child Cooperation data in the Hess and Shipman
Study is reported only as a component of the Resistance factor. Correlations
of this factor with child performance scores on the Interaction tasks were -0.28
(ToX Sorting), -0.30 (Eight-Block), and -0-21 (Etch-A-Sketch).
Scoring
The scale ranges from a high point for cooperation (1) defined as: "The
child Was fully tuned in to the mother -- pliable, interested, attentive. No
difficulty or conflict arose," to a 'rating -of (9) for resistance: "child
ignored the mother's teaching efforts and/or actively resisted the task through-
out the interaction," with the midpoint (5) being defined.as: "child was per-
iodically inattentive, but inattention was not prolonged, and there was no resis-.
tance to the mother or the task. " The child's mean cooperation rating acrossr.
the three interaction tasks was the score added to the present analyses.
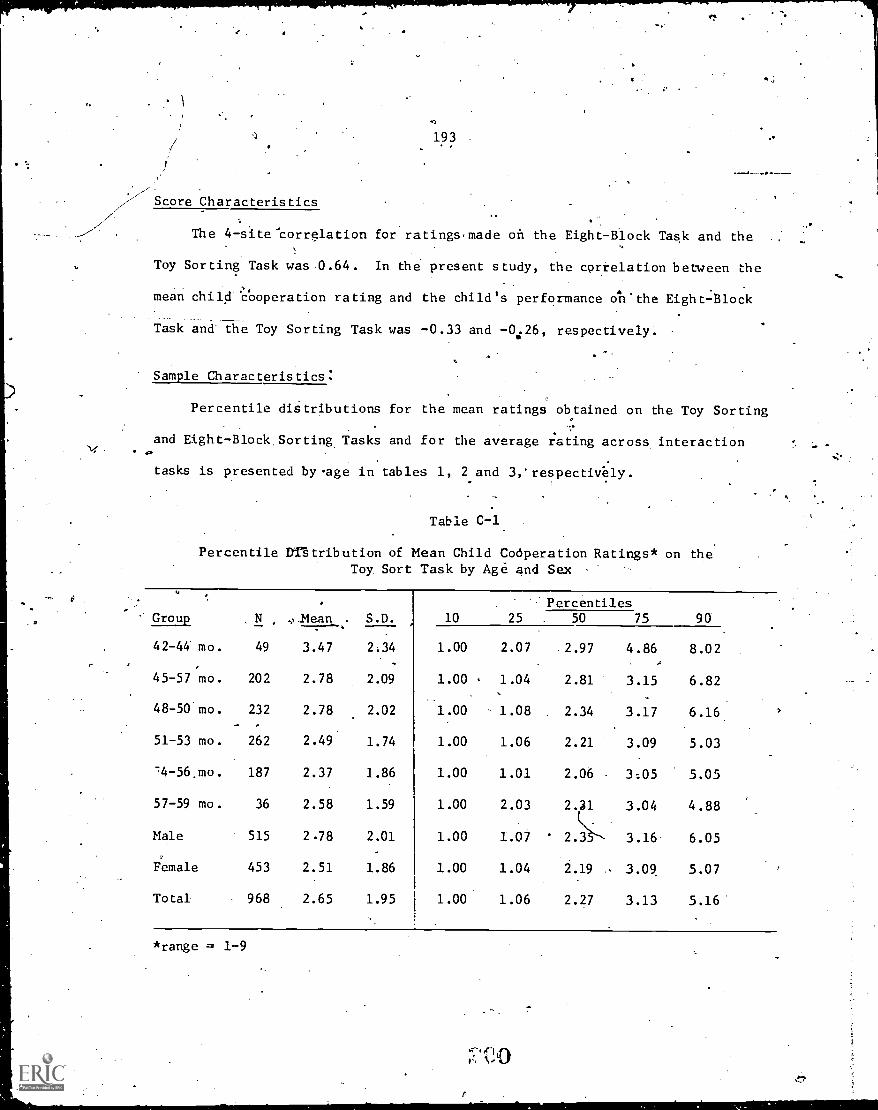
193
Score Characteristics
The 4-site'correlation for ratings -made on the Eight-Block Task and the
Toy Sorting Task was 0.64. In dhe present study, the correlation between the
mean child cooperation rating and the child's performance oll.the Eight -block
Task and the Toy Sorting Task was -0.33 and -0.726, respectively.
Sample Characteristics:
Percentile distributions for the mean ratings obtained on the Toy Sorting
and Eight-Block.Sorting Tasks and for the average rating across, interaction
tasks is presented byage in tables 1, 2 and 3,' respectively.
Table C-1.
Percentile antribution of Mean Child Cooperation Ratings* on theToy. Sort Task by Age and Sex
' Group , N 4-Mean S.D. 10 25
Percentiles9050 75
42-44' mo. 49 3.47 2.34 1.00 2.07 .2.97 4.86 8.020
45-57 mo. 202 2.78 2.09 1.00 1.04 2.81 3.15 6.82
48-50 mo. 232 2.78 2.02 1.00 1.08 2.34 3.17 6.16
51-53 mo. 262 2.49 1.74 1.00 1.06 2.21 3.09 5.03
-4-56_mo. 187 2.37 1.86 1.00 1.01 2.06 3:05 5.05
57-59 mo. 36 2.58 1.59 1.00 2.03 2.31 3.04 4.88
Male 515 2.78 2.01 1.00 1.07 2.3 3.16 6.05
Female 453 2.51 1.86 1.00 1.04 2.19 , 3.09 5.07
Total 968 2.65 1.95 1.00 1.06 2.27 3.13 5.16
*range = 1-9
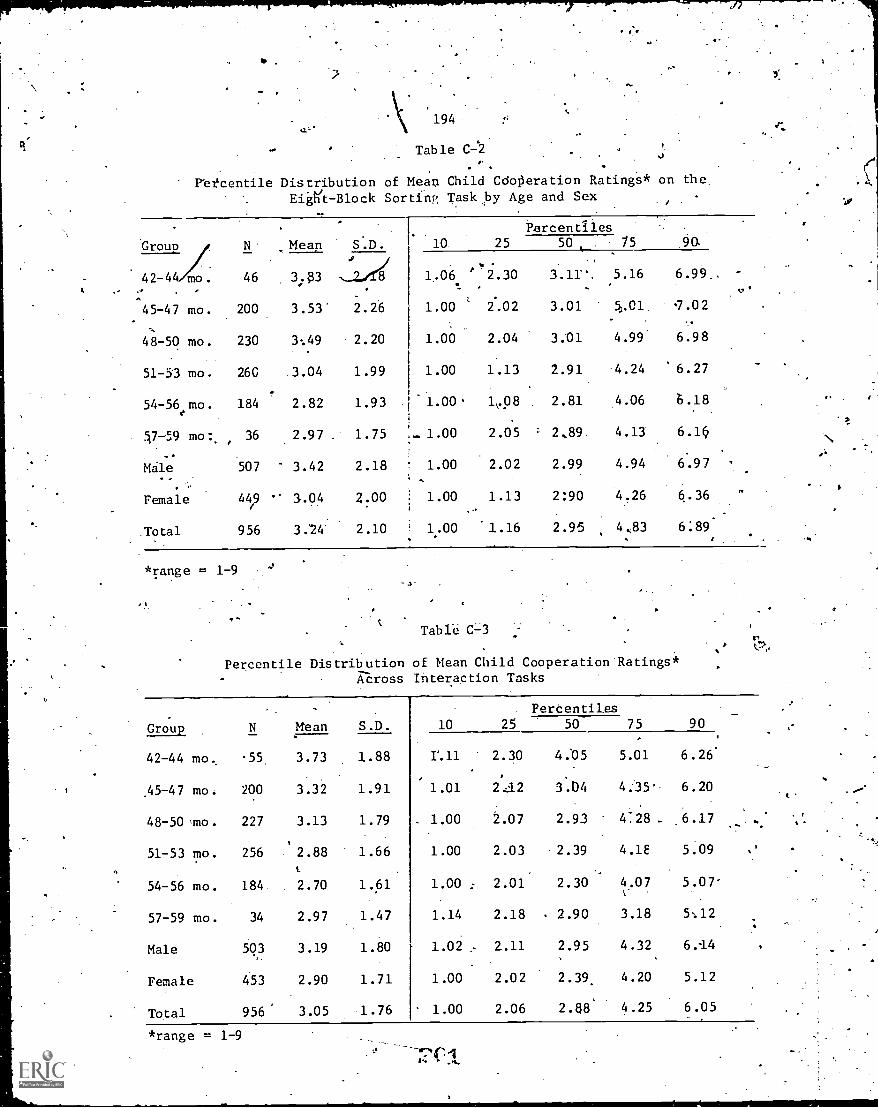
194
Table C -2
es.
P'er'centile Distribution of Mean Child CdoPeration Ratings* on the.Eie't-Block Sortiir Task by Age and Sex
Group N Mean S.D. 10ie
42-44,4 . 46 3;83 -:_z,A 8 1.06.. , ..A
45-47 mo. 200 3.53 2.26 1.00
48-50 mo. 230 3:49 2.20 1.00
51 -5'3 mo. 26G .3.04 1.99 1.00
54-56emo. 184 2.82 1.93 1.00.
7 -5.9 mo: 36 2.97 1.75 ,- 1.00
Male .3.42 2.18 1.00
Female 44,9 .- 3.04 2.00 1.00
Total 956 3.24 2.10 1.00
*range = 1-9-a
Percentiles25 50 75 90.
1 : 2.30
2.02
2.04
1.13
1\.08
2.05
2.02
1.13
'1.16
3.11" 5.16 6.99..A
3.01 .01 7.02
3.01 4.99 6.98
2.91 4.24 '6.27
2.81 4.06 b.18
- 2,89 4.13 6.4
2.99 4.94 6.97
2:90 4.26 6.36
2.95 4,83 6.89'
Table C-3
Percentile Distribution of Mean Child Cooperation Ratings*Across Interaction Tasks
Mean S.D. 10 25
Percentiles75 9050
42-44 mo. -55 3.73 1.88 1'.11 2.30 4.05 5.01 6.26
.45-47 mo. 200 3.32 1.91 1.01 242 3.04 4.35' 6.20
48-50,mo. 227 3.13 1.79 1.00 2.07 2.93 4728 . .6.17
51-53 mo. 256 '2.88 1.66 1.00 2.03 2.39 4.1E 5.09
ti
54-56 mo. 184. 2.70 1.61 1.00: 2.01 2.30 4.07 5.07-
57-59 mo. 34 2.97 1.47 1.14 2.18 2.90 3.18 5:12
Male 503 3.19 1.80 1.02 - 2.11 2.95 4.32 6.14
Female 453 2.90 1.71 1.00 2.02 2.39. 4.20 5.12
Total 956' 3.05 1.76 1.00 2.06 2.88' 4.25 6.05
*range = 1-9
C
1,
. 195
') ..,As themean ratings by age indicate, the youngest children .,in the sample
texhibited the most inattention and resistance, but overall the children appeared
.
tuned in 'to the ta.3k. 5 As,wculd be expected, cooperation decreased from task 1
to task 2, but this issomewhat confounded by the fact, that the Eight-Block
Sorting Tak.'is. a more demanding One. Girls, on the average, were rated as
,more cooperative, but the difference between groups was negligible.
Future analyses will investigate relationships between the child's cooper-.
ation and specific maternal behaviors during the teaching session as .well as
the predictive power for estimating the child's behavior in other learning
situations.
lo
t
-r
I
oak
Motor Inhibition Test
0
Purpose
The Motor Inhibition Test was one-of several measures of .impulse control
administered in this study. As a group, these measures permit investigation.
of'the dimensionality of impulsivity and of its implications for intellectual
performance in young disadvantaged children:
Task Description
,-,'Thetest required the child to perform three motor acts-walking a line,..
....----- 0 ,
drawing'a line, .and winding a toy jeep up to the rear of a,etoy tow truck:
.. . ( .v..,/
.
He practiced each-act and then repeated it as slowly as he could. Maccobyl;\ ,
0
° .Dowley, Haan. and Degerman (1965) found, with middle-class nursery school" ., C
P, . C.
children, that the time taken under the. "sloW" instruction was,hign y..r,- rre-- .
, 116..
._ ...._ .
acrossacrosg tasks and'that it was positively related to IQ. -.Their,results,.-.,.,,,t
were replicate'd by Massari, Hayweiser, and Meyer (1969) withloWer-class
preschool chbldien, and by Ward (1968b) with eight-gear -oict middle-plass
sqboys. The-ability to .'slow down a response thus ;appears to be either a cm-
:.
ponent of general 1rite4lectual'ability, or a style Which ,cohtributes to
performance on intellectuWtasks. This ability has also been found to be-
related' to individual differpnces iii rleflection-impulsivity (Kagan., .kosman,
Day, Albert, & Phillips, 1964; Ward, 1968a).
..Scoting: .
1
. .
1 , ...
The data consist of slx,score.8--for each of three subtests, log (X.+ 1). (A,
of the time taken on the practice'tpial and on the "slow"-instruction trial.
196
197
line and draw-a-line--the intercorrelation was .50, indicating the presencek
of such a dimension. The third subtest, in which the child had dzkwind a toy
jeep up to the back of a tow truck, showed lower correlations with\he first
two, approximately .25. The lowel relation may have been due to a combination
of th,:, greater demands this subtest made on the cnild's coordination--the winch
of thc tow truck was poorly designed and difficult to manipulate smoothly--
and on the tester's skill--the truck had to be held steady, and children had
to be kept from reversing the direction in which they were winding, at the
same time the tester was attempting to time the task.
, .
Practice and slow times from each subtest were related around .50,
reflecting shared method variance; but there was little cbnsistency-dmOng
. .
practice times: those from the walking and drawing subtests coirelated!.17
over.the sample, while time from the truck subtest had near zero correlations
with time from each of the others.
Correlational results showed no sex differences; for example, walk-a-'
line, slowly and draw=a-Iine slowly_ correlated .51 for males and .49 for
females.- Partialling age out of the correlations also had no effect.
Conclusions
These results suggest that the most appropriate motor inhibition score
from this test is the average of standardized (and log transformed) slow
times from the walking and drawing subtests. The truck subtest results will
be discarded, and the test as given in future years of this study will not
include this subtest. The lack of intertask consistency'in practice time
indicates that. there is no need to "correct" the motor inhibition score for
practice time.
204
Sample. Characteristics
Several features of these data are noteworthy. First, there were no
differences in results associated with the child's age or sex. Over the six
trials, age correlated with log time from -.08 to .14, while sex correlated
.02 to .05.
Second, children in' the present sample performed the motor acts rela-
tively.quick1,y. The meanntimber of secondg to complete the walking subtest
under slow instructions "was 6.4; for drawing, it was 5.9; and for the tow
truck, it was 50.0. It is clear, therefore, that there is ample opportunity
for further, development in these children of the ability to slow down a motor
response.
Finally, instructions to perform the act slowly did lead children to
perform more olowly on the second trial than on the practice trial for each
task. Mean time scores under slow instructions represented an increase over
practice times of 23% for the tow truck subtest, 36% for the walking subtest,
and .1111 for the drawing task. Moreover, when the sample was divided into six
three-month-age groups, an increase in mean times from first to secondtrial
was found oh each subtest for every age level. Thus, although the change in
performance under the slow instruction was not large in absolute terms, it
was highly consistent, and even the youngest_ children were able to conform
to the task demand.
Score Characteristics1
--Correlations among the slow administration time scores were examined to
determine whether all three sub tests did in fact contribute to a single.
dimension of ability to inhibit response. For two of the subtests--walk-a-
205o
Open Field Test
Purpose
Most tests require the child to perform a narrowly defined task, and
provide for step-by-step control over his activity.by the tester. It is
possible that there are important dimensions of behavior which are measured
poorly or not at all in such situations, and which might be assessed by
observing the child in a relatively unstructured play environment. Such
dimensions would include both cognitive variables (e.g., complexity and
duration of play activities) and personal-social ones (e.g.', style in coping
with an unfamiliar situation). The Open Field Test provided such a setting.
Task Description
After a child was halfway through one conventional test battery, he was
brought into a new tes-t-ing room. He was shown ten standard play objects
arranged around the room; these were two dolls (one dark-skinned, one light),
a truck, alphabet blocks, "Rising Towers" (more complex plastic building
blocks), clay, crayons, felt-tipped markers, plain paper, and a coloring
book. He was told that he could do anything he wanted with the toys. The
tester seated herself in one corner of the room and remained. there for ten
minutes, initiating no interaction with the child and responding minimally
to any overtures he made. During each thirty-second period of the test, she
recorded and described every play activity involving each objedt, along with
a variety Of nonplay activities.
199
b'
200-
Scoring and Sample-Characteristics
Scores were developed to assess 1) the quality and quantity of play
activities with the test objectsy 2) the nature of verbalizations directed
toward tl'e tester ur the child himself and 3) nonplay activities such as
attempting to leave the testing room or approaChing the tester.>
Three aspects of the child's play activities with the ten objects were
measured. The first of these was the number of half-minute periods out of
the twenty during which he engaged in any play activities. This score did
not discriminate well among.children; the mean number of periods of play for
-----the entire sample was 18.70\ (S.D. = 3.84), and the median was 19.85. The
"typical" child, then, remained involved in play throughout virtually the
ez?tire test period.. -
The second aspect was mean complexity of play. All activities with die,
objects were coded into one of fOurilevels" Level 1 play involved only
attending to a play object; level 2, holding or manipulating it; level 3,
playing with one Object alone; and level 4, using two or more objects in an
integrative activity. The complexity score is the mean level taken over all
play activities recorded. This procedure made possible-an objective and
relatively straightforward approach to complexity of play, yielding scores
whose ranking of subjects closely agreed with intuitive judgments of complex-
ity. An adequate range of scores was obtained: over the entire sample, mean
complexity of play was 3.10 (S.D. = .32), and the median was 2.98.
Third, the duration of sequences of activity engaged in by the child was
measured. A "simple" sequence was defined as a series of half-minute periods
during which the child continued without interruption to play with the same
object. Length of the--'longest such sequence, possibly a measure of the child's
201
capacity for involvement in a_self-iiposed task, averaged 14.40 of the 20 time
periods (S.D. = 5.32; median = 14%89). A comparable score was obtained for
"complex" activity sequencessequences in which at least part of the time was
. -
spent in play involving an integration of two -or more of she'objects . However,
only slightly more than one-third or the sample engagecf.in any play at this
Cs
level of complexity; therefore the most reasonable score involving complex
activity sequences is simply whether or not any such sequences occurred for the
child.
The remaining sco:.es all concera nonplay activities during the testing
session. The tester'recorded all verbalizations by the child, categorizing
them as directed either toward the tester or toward the child himself. Scores
were obtained for each of these major categories, and also for several sub-
categories within each. Both of the major categories yielded usable although
skeWed, distributions when scored for the number of thirty-second periods
during which the child spoke. For child verbalizations directed to the tester,
the overall mean was 2.21 (S.D. = 3.75), and the median was 0.44. The least
talkative 25% of the sample directed no verbalizations.to the tester, while
the most talkative 25% spoke to her in 3.06 or more observation intervals.
Similarly, for verbalizations made by the child for his own benefit, the over-
all mean waq 2.09 (S.D. = 3.98), and the median was 0.31. The least vocal
25% Of the sample did not talk to themselves at all, while the most vocal
did so in 2.45 or more of the twenty periods.
Subcategories of verbalizations occurred infrequently. For child verba-
lizations directed to the tester, the following distinctions were made: (a)
attempting to direct tester's attention to the task; (b) seeking help or direc-
tion; (c) attempting to discontinue the task; (d) other verbalizing, including
F.
202
uontask-oriented-conversation as well as unclassifiable verbaqizations.. For
self-directed verbalizations, the distinctions were these: (a) task-related,
(b) nontask- related, and (c) unclassifiable. -With the'exception of the
. -
unclassifiablesubcategories, none of these occurred with a median frequency.
larger than .10 of twenty observation periods.
The three remaining scores obtained also represented rare events. These
.were (a) number of periods during which. the child approached or remained with
the tester; (b) number of periods in which he made an overt attempt to-end the
task or to le.we the testing room; and (c) number of periods in which he engageds.
in no overt activity, remaining inactive and inattentive. None of these scores
had a median frequency of more than .07 out of twenty periods.
Of the scores examined above,, five, because of their greater variability
in these data, merit most attention in further analyses. These are mean com--
plexity of pl:;y, length of longest simple sequence, presence or absence of
complex sequences, verbalization directed toward the tester, and verbalization
directed by the child to himself. None of these showed notable differences with
age or with sex, although there Las a tendency for males to have somewhat higher
scores than females on mean complexity of play: For males, M = 3.17 S.D. =
0,35; for females, M = 3.03, S.D. = 0.27.
Reliability
Several types of reliability are relevant to this situation-7the relia-
bility of the child's behavior, the recording of this behavior by the tester,
and that of the interpretation of the written record to provide .cores. An
estimate of the reliability of the behavior was obtained by scoring first
Insert p. 207
I
Peabody Picture Vocabulary Test
Purpose
The "Peabody" is one of the best known and most widely used verbal
tests for the age group of interest. There are two forms,A and B, each
containing 150 vocabulary items. The same response booklet is used with
both forms; i.e., for a given item one of the four pictures present,ed is the
"right" answer to the word presented on Form A and another picture in the
same set is the "right" answer to the word stimulu-s on Form B (Dunn, 1965).
Vocabulary is a major component of many. "general intelligence" tests.
For Form L of the Stanford-Binet, the reported correlation between the score
on the 16-item vocabulary subtest (Year IV) and total score was .74 (McNemar,
1942). The uncorrected correlation between the vocabulary score and the
Full Scale Score for four-year-olds on the WPPSI was .71 (Wechsler, 1967).
Task Description
The Peabody was administered in two ways to' the Longitudinal Study sample:'
1. In the standard way, to obtain an estimate of receptive vocabulary,
the stimulus word is presented orally and the child is required to
point to one of four piCtured choices.. Testing is terminated.
after S makes six errors on eight consecutive items. For the
Longitudinal. Study administration, the maximum. 'lumber of words
administered included the first 75 stimulus words; E began always
with the practice items followed by item 1. Form A was used.
2. In a modified form, so as to obtain an estimate'of productive vocab-
ulary, E pointed to one of the four pictures on a page and asked the
203
204
child to tell what it was or, in the case of verbs, to say what the
child (or the children) in the picture was doing. The first 75 items
. of Form B were used.
Scoring
On Form A, each ite was scored as follows: correct, incorrect, child
refused to respond, or ind terminate response. A total correct score was
obtained for each child up to the point where he made six errors on eight
consecutive items. In addltion,.each child received scores based on the
percentage of verbs correctly identified out of those attempted (total possible
number in the first-75 items of Form A is 14) and the percentage of nouns
correctly identified out of those attempted (there are 61'nouns in the first
75 items).
More than one word could serve as a corredt response to an item in the
modified version of Form B. Therefore, lists of acceptable synonyms were
generated, and the child was given credit if he produced any one of the
acceptable responses_for an item. Three scores were given: total correct,
percent verbs correct out of verbs attempted, and percent nouns correct out of
nouns attempted. There were 14 verbs and 61.nouns. For the present
structural analyses, total scores only were used.
Sample Characteristics
The mean total correct score for the conventional administration of
Form A was 26.34 (N = 1198 for the four sites combined); the standard deviation
was 12.85. Reliability (alpha coefficient) for 1451 cases was .96. Given
the cut-off criterion in the test, this estimate is probably inflated. The
alternate form reliability given in the test manual is .77 for children in
the age range 4;70 to 4-5.

205
The mean percentages of verbs correct/verbs attempted was 57 (standard
deviation 26) and of nouns correct/ncuns attempted was 73 (standard deviation
11). The N's were 1439 and 1449, respectively.
Mean total scores on Form A increased consistently across the six age
classifications (in three month intervals), but by varying amounts, ranging
from .32 to 3.13. The results are summarized below:
Table 1
Percentile Distributions of Total Score on Form A by Age
Age Mean S.D. 10 25
Percentiles
50 75 90
42-44 mo. 68 22.84 10.45 10.58. 15.30 20.85 30.10 36.39
45-57 mo. 273 23.50 11.95 9.45 14.33 21.83 .31.56 40.46
48-50 mo. 276 25.17 12.66 9.93 14.64 23.81 34.17 44.19
51-53 mo. 313 28.30 13.32 11.18 17.86- 26.76 38.85 47.01
54-56 mo. 217 28.62 13.43 11.73 17.48 26.50 39.53 48.34
57-59 mo. 51 30.72 11.37 13.63 22.88. 31.16 40.92 44.46
Total 1198 26.34 12.85 10.55 15.91 24.43 36.05 45.21
Girls and boys performed at a highly similar level; Mean = 26.8 (S.D. = 1210)
for girls as compared with a mean of 25.9 (S.D. = 13.10) for boys.
When Form B was administered as a productive vocabulary test, the mean
total correct score was 19.12 with a standard deviation of 8.91 for 991 cases.
The reliability (alpha coefficient) was .93.
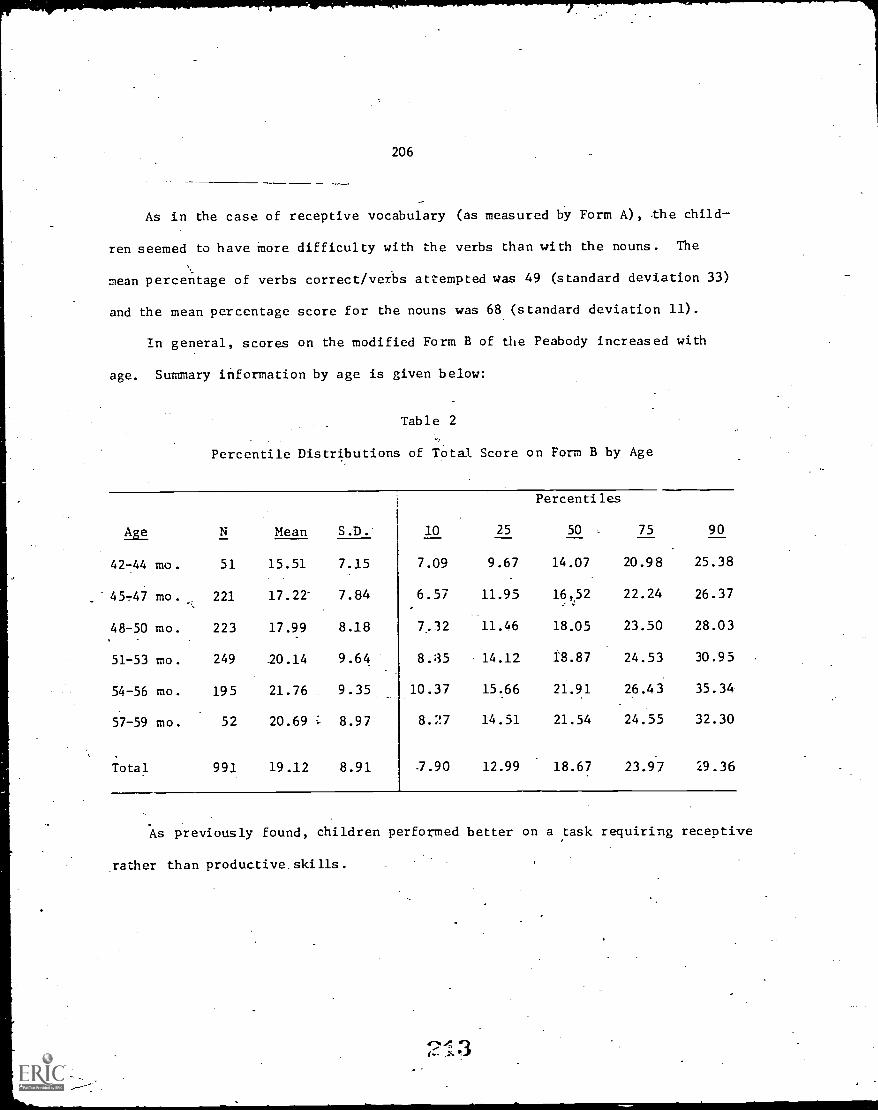
206
As in the case of receptive vocabulary (as measured by Form A), the child-
ren seemed to have more difficulty with the verbs than with the nouns. The
mean percentage of verbs correct/verbs attempted was 49 (standard deviation 33)
and the mean percentage score for the nouns was 68 (standard deviation 11).
In general, scores on the modified Form B of the Peabody increased with
age. Summary information by age is given below:
Table 2
Percentile Distributions of Total Score on Form B by Age
Age Mean S.D. 10 25
Percentiles
50 75 90
42-44 mo. 51 15.51 7.15 7.09 9.67 14.07 20.98 25.38
4547 mo. 221 17.22- 7.84 6.57 11.95 16.52 22.24 26.37
48-50 mo. 223 17.99 8.18 7.32 11.46 18.05 23.50 28.03
51-53 mo. 249 20.14 9.64 8.35 14.12 18.87 24.53 30.95
54-56 mo. 195 21.76 9.35 10.37 15.66 21.91 26.43 35.34
57-59 mo. 52 20.69 ; 8.97 8.27 14.51 21.54 24.55 32.30
Total 991 19.12 8.91 -7.90 12.99 18.67 23.97 29.36
As previously found, children performed better on a task requiring receptive
rather than productive skills.
207
versus second half of the test for a sample of 100 ramdomly drawn cases. For
the several scores chosen to represent the task, split-half reliability coeffi-
cients were .61 for mean complexity of play, .64 for presence-absence of com-
plex activity sequences, .81 for verbalization directed at the tester, d .73
for self-directed verbalization. This procedure was not appropriate for asses-
sing the reliability of the length of sequence score.
Reliability of recording was obtained by having two judges simultaneously
record the Open Field behavior cf each of eight children. Over all categories
of behavior recorded, the judges agreed exactly--i.e., on the occurrence of a
given behavior in a given time period--on 80.2% of the behaviors recorded. The
same index calculated over activities involving the ten play objects indicated
88.0% agreement, while that calculated over non-play activities was 41.5%.
Thus, behaviors involving the play objects were recorded with reasonable
reliability; the rarer non-play activities were less adequately observed.
Finally, reliability of coding--converting the tallies and descriptions
on the answer sheets to the coded form from which computer-calculated scores
were derived--was assessed. Here, each coder showed between 88% and 93% of
possible agreements with a "standard" coding over twenty practice cases.-
9 -
Picture Completion (WPPSI)
Purpose
The Picture Completion subtest of the Wechsler Preschool and Primary
Scale of Intelligence is a downward extension of the identically named sub
test of the Wechsler Intelligence Scale for Children. Half of the items are
taken directly from the WISC and half are new (Wechsler, 1962). In studies
by Goodenough and Karp (1961) and by Cohen (1959) the WISC Picture Ccmpletion
subtest helped to define a factor. interpreted as analytical functioning. It
was incruded-in dhelresent study in the hope that it would, along with the
Preschool Embedded Figures Test, mark such a factor of analytical functioning.
Task Description
The subtest consists of 23 pictures, each of which has some important
portion missing. The child is asked to name or indicate the missing part in
each picture. Testing proceeds through all 23 pictures or until there have
been 5 consecutive failures.
Scoring
Summed.scores were obtained for correct verbal responses, correct nonverbal
responsec, and total cor,-ect (including items marked correct but where insuffi
cient information was recorded to determine the verbal versus nonverbal nature
of the response). Other scores obtained but not analyzed due to their infre
quency of occurrence or lack of range were number of repeats, number of elabora
tions, total task time, and number of indeterminate (not scorable) responses.
.1,-)A7tr
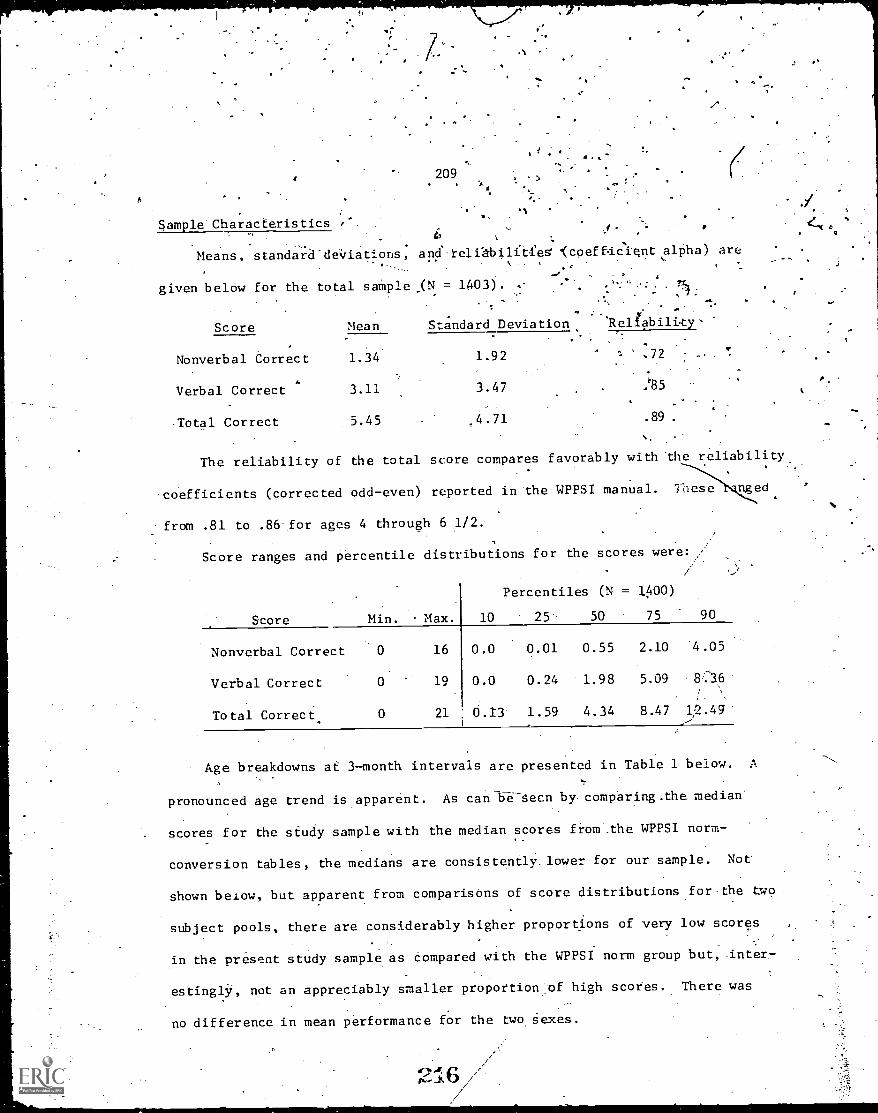
, ? : .: !
209.. -'
'I
.. -) -
,Sample-Characteristics ,".
.
.
Means, standard deviations, and-teli".gbilit4:es. .(coeff4Cient alpha) are9
. t.. .
w..0
.04
given below for the total sample .(N = 1403). ..- ."....: . n....
-
Score Mean Standard Deviation Itelfabili.ty
Nonverbal Correct 1.34 1.92 .72
Verbal Correct 3.11 3.47 .'85
Total Correct 5.45 .4.71 .89 .
The reliability of the total score compares favorably with the reliability.
coefficients (corrected odd-even) reported in'the WPPSI manual.
from .81 to .86-for ages 4 through 6 1/2.
Mese
Score ranges and percentile distributions for the scores were:
nged
Percentiles (N = 1400)
Score Min. Max. 10 25- 50 75 90
Nonverbal Correct 0 16 0.0 0.01 0.55 2.10 4.05
Verbal Correct 0 19 0.0 0.24 1.98 5.09 8.36
Total Correct 0 21 0.13 1.59 4.34 8.47 12.49'--
Age breakdowns at 3-month intervals are presented in Table 1 below. A
pronounced age trend isapparent. As canh-d-gecn by comparing_the median'
scores for the study sample with the median scores fiom_the WPPSI norm-,
conversion tables, the medians are consistently._ lower for our sample. Not
shown below, but apparent from comparisons of score distributions for the two
subject pools, there are considerably higher proportions of very low scores
in the present study sample as Compared with the WPPSI norm group but, .inter.-
estinglY, not an appreciably smaller proportion of high scores. There was
no difference in mean performance for the two sexes.
t
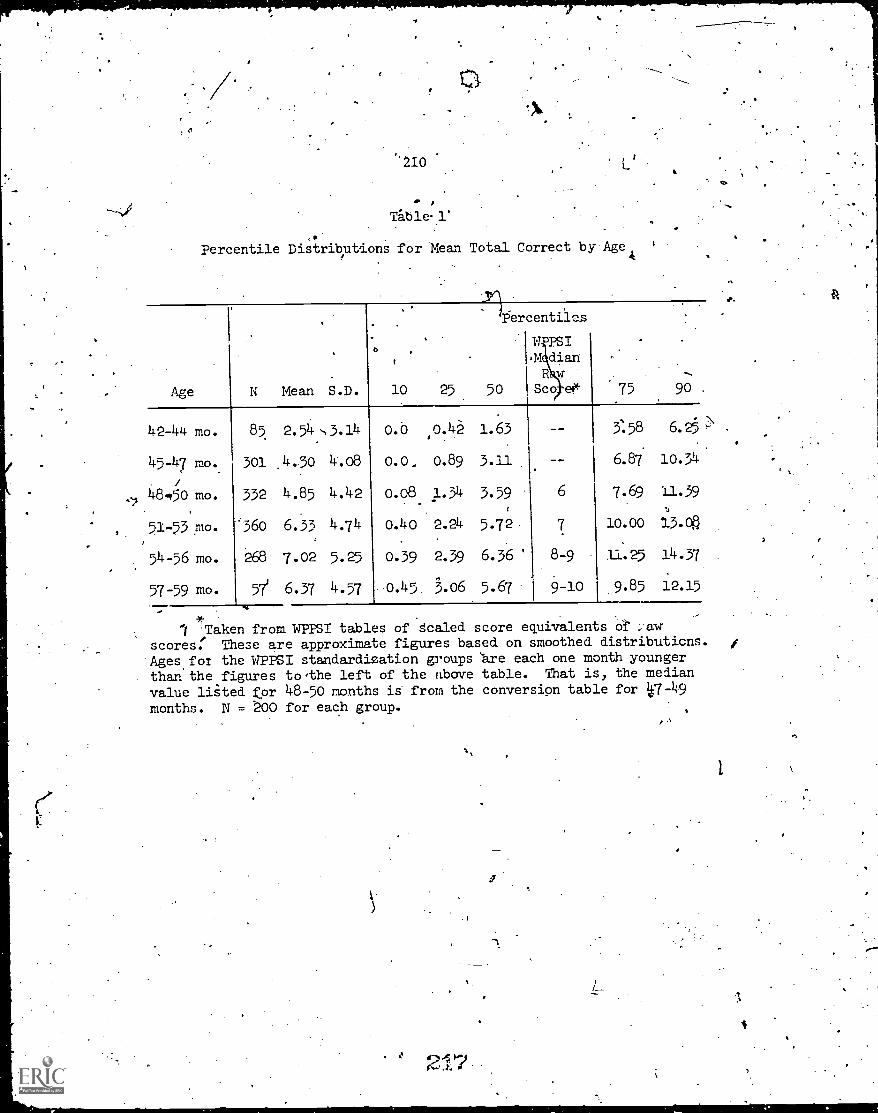
''210
,
Table 1'
Percentile Distributions for Mean Total Correct by Age '
Age N Mean S.D. 10 25
42-44 mo. 85 2.54 5.14 o.o ,0.4
45-47 mo.. 301 4.30 4.08 0.0, 0.89
48,50 mo. 332 4.85 4.42 0.08. 1.34
51-55 mo. '360 6.33 4.74 0.40 2.24
54-56 mo. 268 7.02 5.25 0.39 2.39
57-59 mo. 5'e 6.37 4.57 0.45 S.06
Percentiles
W PSIM dianR w
50 Sco eK
1.63
3.11
3.59
5.72
6.36
5.67
6
7
8-9
9-10
if..
1 'Taken from WPPSI tables of Scaledscores.
. These are approximate figures baAges for the WPPSI standardization groupsthan the figures tothe left of the abovevalue liited ftor 48-50 months is from the
months. N = 200 for each group.
d.
75 90
3:58 6.25
6.87 10.34
7.69 11.39
10.00 15.05
11.25 14.37
9.85 12.15
score equivalents of awsed on smoothed distributions.are each one month youngertable. That is, the medianconversion table for i7-49
rPreschool Embedded, Figures Test.
,Purpose
T
The Preschool Embedded Figures Test (doaterg,.1969) is onel!of several
embedded-figures measures of field dependence-independence .oe'analytical. 4
functioning. Several studies <Cohen,A.957; 1959.; Goodenough & Karp, 1961;
Karp, 1963) have found separate' verbal, attention- concentration, and analy.
c
tical functioning-factors in the Wechsler scales. :More recent studies
persohal communidationl. Witkin, . Faterson, Goodenough, 6,:BirnbAUM,
'1966) reported that among.individuals classified as mildly retarded, a
, .
stattligg number...of indivi.duals were foUnd whos_"verbal coMprehension".factor
scores were suite low but who had near normal prorated IQs'on.the "analytical"
.factoi.. Apparently the "retarded" label was applied as a function-of the,
.verbal comprehension f the child and independently. of his level of°.
, analytical Vinctioaing. In view of such findings,it seemed judicious to 'Attempt
to measure analytical functioning independently of verbal comprehension.
Task Des criptioh
The test contains 27 items, 3 practice items and 24' test items, in each.
of which is embedded a simple equilateral triangle. The child is presented
a card on which is printed the small triangle and shown how to trace/his .
fingers along the edges of the triangle. He is thy shoWn, one at a time,
three practice .figures in which the triangle is embedded, asked to indicate
the simple figure, and, having. done so, to run hig fingers along'its sides.
,The child is taken through the three practice items a maximum of three .
times. If he fails to meet the criterion of two coarect items on either
211
218
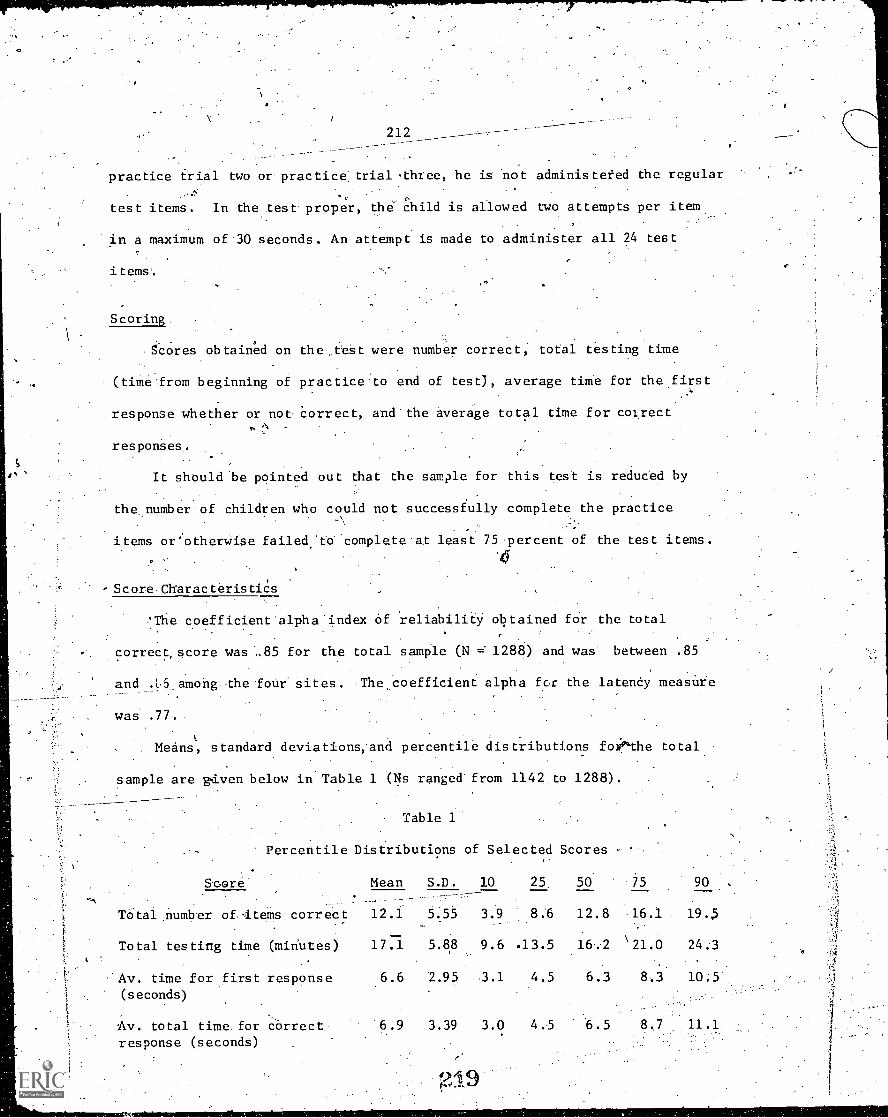
.
212
practice trial two or practice trial -three, he is not administered the regular
test items. In the test proper, the child is allowed two attempts per item
in a maximum of 30 seconds. An attempt is made to administer all 24 test
i t ems .
Scoring.
Scores obtained on the ,test were number correct; total testing time
(time from beginning of practice to end of test), average time for the first
response whether or note Correct, and the average total time for correct
responses.
It should be pointed out that the sanyle for this test is reduced by
the number. of children who could not successfully complete the practice
items or'otherwise failed 'to complete.at least 75 percent of the test items.
ScoreCharacteristiCs
'The coefficient alpha index Of reliability obtained for the total
correct, score was ..85 for the total sample (N =" 1288) and was between .85
and .16 among the four sites. The coefficient alpha for the latendy measure
was .77.
Means, standard deviations, 'and percentile distributions foio°the total
sample are given below in Table 1 (Ns ranged' from 1142 to 1288).
Table 1
Percentile Distributions of Selected Scores
Soore Mean S.D. 10 25 50 75 90 .-
Total number of -items correct 12.1 5.55 3.9 8.6 12.8 16.1 19.5
To tal testing time (minutes) 17.1 5.88 9.6 .13.5 16 .2 '21.0 24.3
Av. time for first response 6.6 '2.95 .3.1 4.5 6.3 8.3 10.5(seconds)
...
Av. total time. for correct 6:9 3.39 3.0 4..5response (seconds)
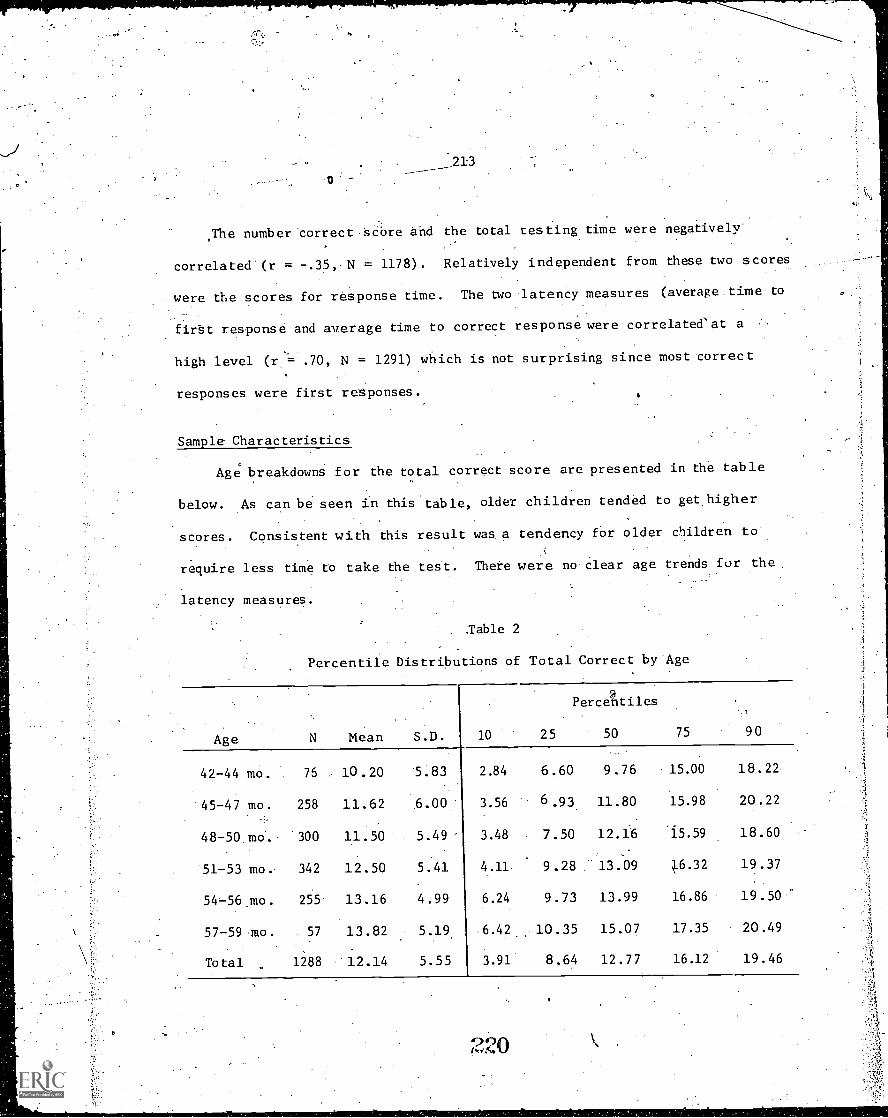
21:3
The number correct score and the total testing time were negatively'
correlated (r = -.35, N = 1178). Relatively independent from these two scores
were the scores for response time. The two latency measures (average time to
first response and average time to correct response were correlated' at a
high level ( = .70, N = 1291) which is not surprising since most correct
responses were first responses.
Sample Characteristics
Age breakdowns for the total correct score are presented in the table
below. As can be seen in this table, older children tended to get.higher
scores. Consistent with this result was a tendency for older children to
require less time to take the test. There were no clear age trends for the
latency measures.
.Table 2
Percentile Distributions of Total Correct by 'Age
Age N Mean S.D.
42-44 mo. 75 10.20 5.83
45-47 mo. 258 11.62 6.00
48-50 mo. 300 11.50 5.49
51-53 mo. 342 12.50 5.41
54-56 mo. 255 13.16 4.99
57-59 mo. 57 13.82 5.19
Total 1288 12.14 5.55
Percentiles
10 25 50 75 90
2.84 6.60 9.76
3.56 6.93 11.80
3.48 7.50 12.16
4 .11 9.28 13.09
6.24 9.73 13.99
15.00
15.98
'15.59
116.32
16.86
6.42 15.07 17.35
3.91 8.64 12.77 16.12
18.22
20.22
18.60
19.37
19.50
20.49
19.46
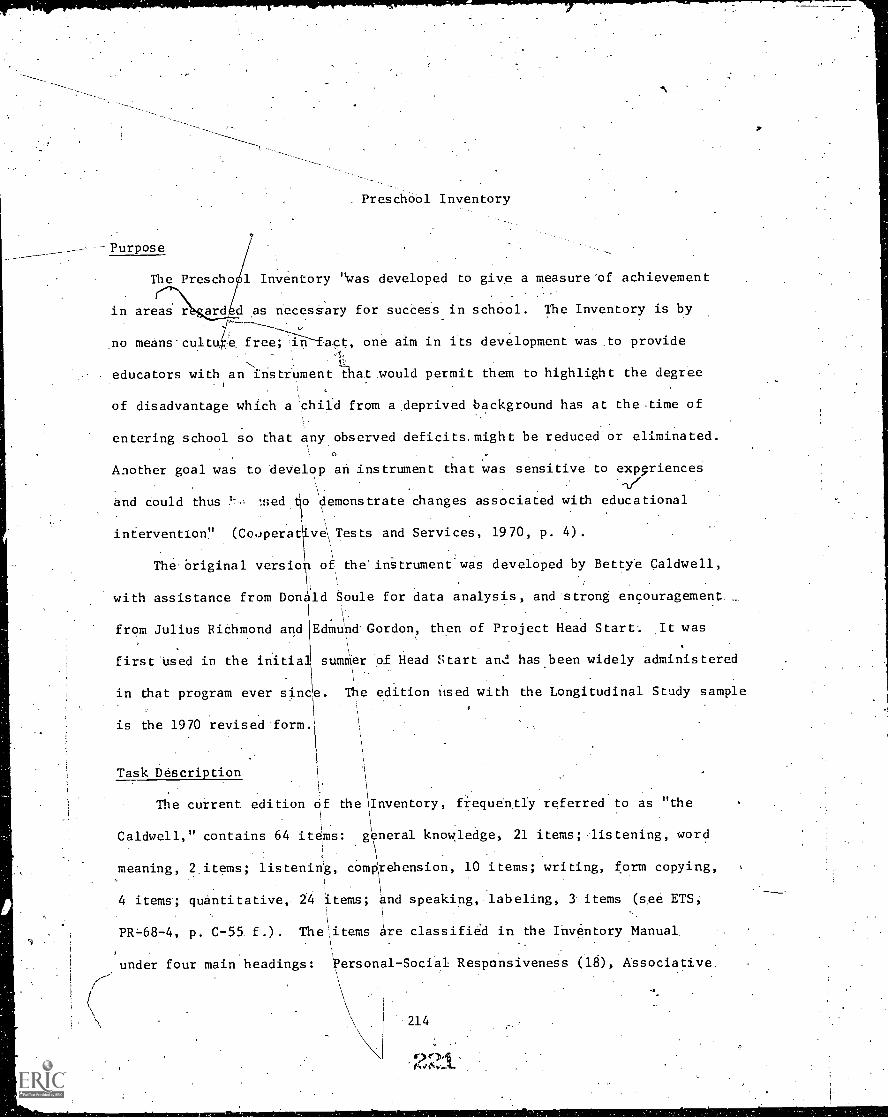
. PreschOol Inventory
-Purpose
The Prescho 1 Inventory was developed to give a measure-of achievement
in areas. r as necethary for success in school. The Inventory is by
.no means.cult free;.iiifeet, one aim in its development was .to provide
educators with an instrument that would permit them to highlight the degree
of disadvantage which a 'child from a deprived background has at the -time of
entering school so that any observed deficits. might be reduced'or eliminated.
.-
Another goal was to deVelop an instrument that was sensitive to experiences-xy/
7.,and could thus , :Bed to demonstrate c6aogea associated with educationalI \
\
intervention!' (Cooperat e\ Tests and Services, 1970, p. 4).
The.Original versio of the'intrument.was developed by Bettye Caldwell,
7with assistance from Donald Soule for data analysis, and strong encouragement.
from Julius Richmond and Edmund. Gordon, ehen of Project Head Start.. .It was
.
first nsed in the initiall summer of Head start and hasbeen widely administered
in that program ever since. The edition used with the Longitudinal -Study sample
is the 1970 revised form.
1
Task Description 1 ,
,
\l'
The current edition Of the\Inventory, frequently referred to as "the1
1
Caldwell," contains 64 items: general knowledge, 21 items;.listening, word
meaning, 2 items; listening, comprehension, 10 items; writing, form copying,
.
4 items; quantitative, 24 Items; and speaking, labeling, 3. items (see ETS,
\
.
I
PR=68-4, p. C-55 f.). Theitems are classified in the Inventory Manual\
1
under four main headings: Personal-Social Responsiveness (18), Associative
214
7
215
Vocabulary (12), Concept `Activation- Numerical (15), and Concept Activation-
Sensory .(19) . The majority of the items require an oral response from the child
(e.g., "What does a dentist do?"), but some items require perceptual and/or
motor responses (e.g., copying, following directions in manipulating objects,
pointing to a body part) .
Scoring
EactLitem was scored as follows: right, wrong, .child said "don't know,"
child refused to answer, or indeterminate. The following scores were tabulated:
total number of items correct, total number of items in which E had to repeat
the instruction or question, total number of items to which S gav@ multiple
answers, total number of "don't know" responses, total number of items to which
'S gave elaborated responses, total number of refusals to answer_. In a future.
technical report, the characteristics and interrelationships. of all of these
.scores will be discussed, but the present. overall analyses concentrate on
total correct score or, where appropriate, total correct score minus the score
on the four form reproduction items. Factor analyses did not support use of
s eparace subscores.
Sample Characteristics
For a total of 1474 cases in the four sites combined, the mean total correct
score was 27.92 and the standard deviation was 11.91. The mean "don't know"
score was 2.54 and the mean refusal score was 3.67.
Reliability (alpha coefficient) for 1467 cases was .92. Reliabilities for
the standardization sample for the 1970 edition of the Inventory ranged from .88
for three- year -olds to .92 for children aged 5 years 6 months to 6 years 5. months . .1
0
.1'4
A
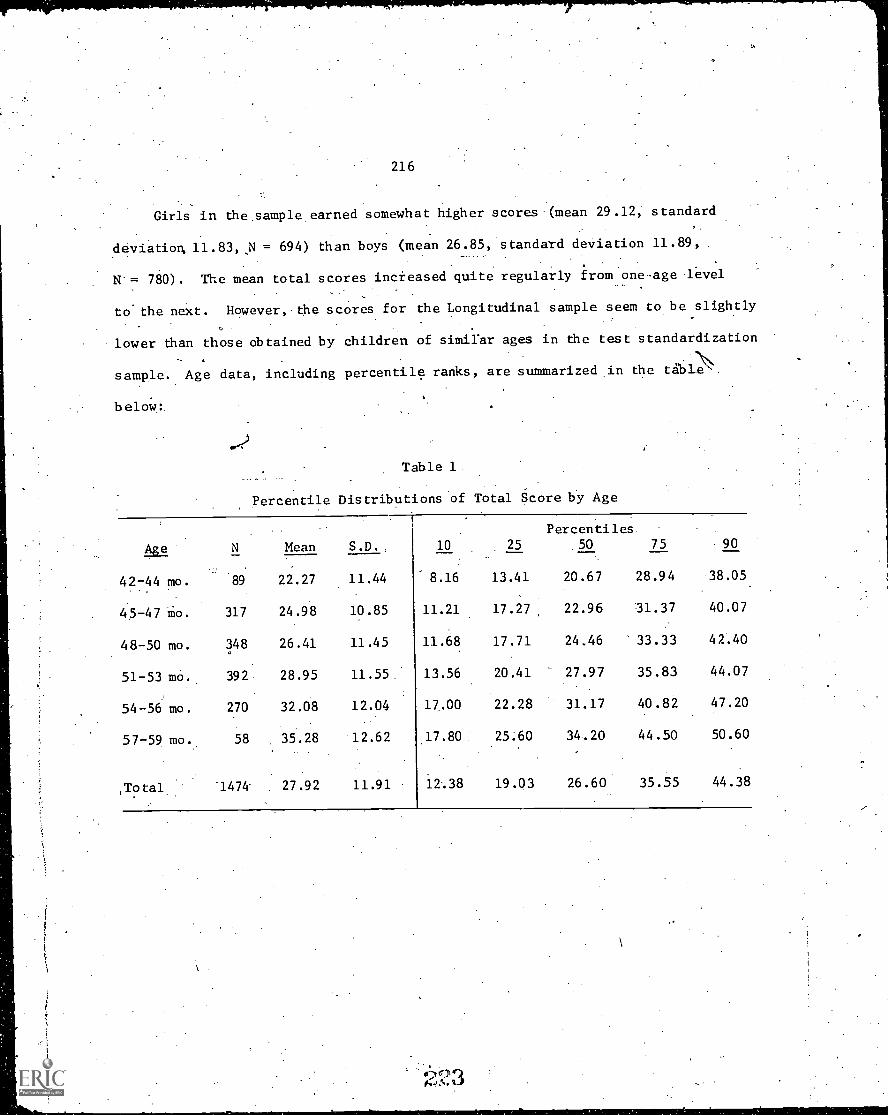
216
Girls in the sample earned somewhat higher scores (mean 29.12, standard
deviation, 11.83,_N = 694) than boys (mean 26.85, standard deviation 11.89,
N-= 780). The mean total scores increased quite regularly from oneage level
to. the next. However, the scores for the Longitudinal sample seem to be slightly
lower than those obtained by children of simirar ages in the test standardization
sample. Age data, including percentile ranks, are summarized in the tgbl
below.
Table 1
Percentile Distributions of Total Score by Age
Awe N Mean S.D., 10 25
Percentiles50 75 90
42-44 mo. '89 22.27 11.44 8.16 13.41 20.67 28.94 38.05
45-47 Mo. 317 24.98 10.85 11.21 17.27, 22.96 31.37 40.07
48-50 mo. 348 26.41 11.45 11.68 17.71 24.46 33.33 42.40
51-53 mo. 392 28.95 11.55 13.56 20.41 27.97 35.83 44.07
54-56 mo. 270 32.08 12.04 17.00 22.28 31.17 40.82 47.20
57-59 mo. 58 35.28 12.62 17.80 25.60 34.20 44.50 50.60
,Total '1474 27.92 11.91 12-.38 19.03 26.60 35.55 44.38
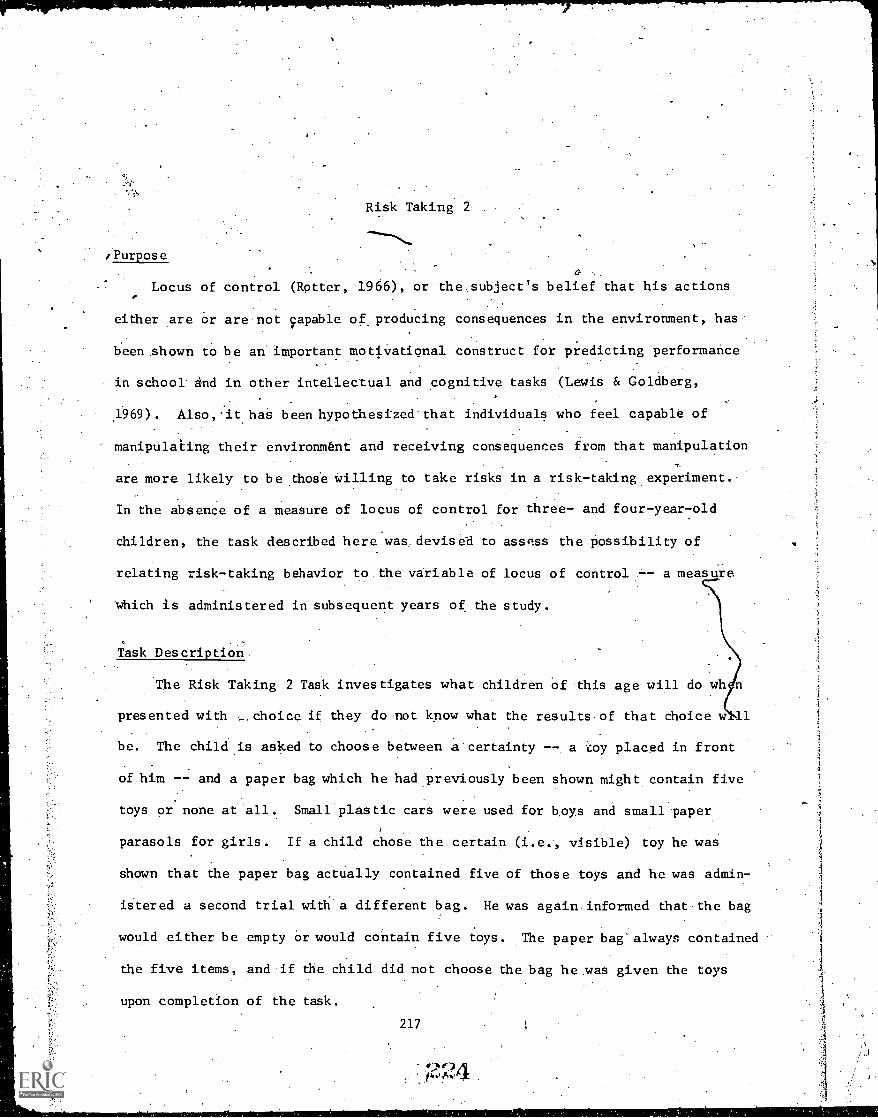
Risk Taking 2
1Purpose
Locus of control (Rotter, 1966), or the subject's belief that his actions
either are
been .shown
Cr are not capable of producing
to be an important motivational
in school and
,1969) . Also,
manipulahng
consequences in the environment, has
construct for predicting performance
in other intellectual and cognitive tasks (Lewis & Goldberg,
it has been hypothesized that individuals who feel capable of
their environment and receiving consequences from that manipulation-r-
are more likely to be those willing to take risks in a risk-taking experiment.
In the absence of a measure of locus of control for three- and four-year-old
children, the task described here was devised to assess the possibility of
relating risk-taking behavior to the variable of locus of control -- a measure
which is administered in subsequent years of the study.
Task Description
The Risk Taking 2 Task investigates what children of this age will do wh
presented with ...choice if they do not know what the results of that choice w 11
be. The child is asked to choose between a certainty -- a 'toy placed in front
of him -- and a paper bag which he had previously been shown might contain five
toys or none at all. Small plastic cars were used for boys and small paper
parasols for girls. If a child chose the certain (i.e., visible) toy he was
shown that the paper bag actually contained five of those toys and he was admin-
istered a second trial with a different bag. He was again informed that bag
would either be empty or would contain five toys. The paper bag' always contained
the five items, and if the child did not choose the bag he was given the toys
upon completion of the task.
217
11.0 Alb.
1
1
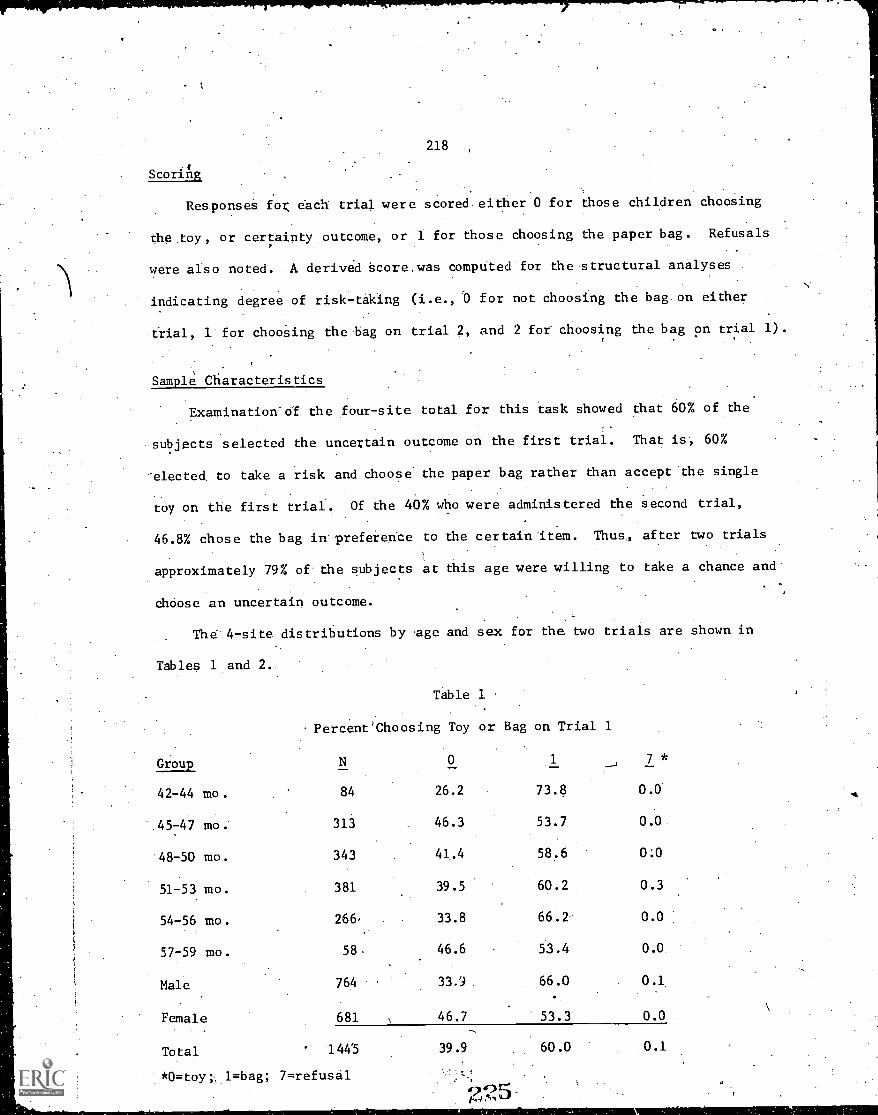
218
Scoring
Responses for each trial were scored either 0 for those children choosing
the toy, or certainty outcome, or 1 for those choosing the paper bag. Refusals
were also noted. A derived Score.was computed for the structural analyses
indicating degree of risk-taking (i.e., '0 for not choosing the bag on either
trial, 1 for chooSing the 'bag on trial 2, and 2 for- choosing the bag on trial 1).
Sample Characteristics
Examination-cd the four-site total for this task showed that 60% of the
subjects selected the uncertain outcome on the first trial. That is-, 60%
-elected, to take a risk and choose the paper bag rather than accept 'the single
toy on the first trial. Of the 40% who were administered the second trial,
46.8% chose the bag in' preference to the certain item. Thus, after two trials
approximately 79% of the subjects at this age were willing to take a chance and
choose an uncertain outcome.
The 4-site distributions by -age and sex for the. two trials are shown in
Tables 1 and 2.
Table 1
Percent' Choosing Toy or Bag on Trial 1
Group N 0 1 7 *
42-44 mo. 84 26.2 73.8 0.0
45-47 mo. 313 46.3 53.7 0.0
48-50 mo. 343 41.4 58.6 0:0
51-53 mo. 381 39.5 60.2 0.3
54-56 mo. 266, 33.8 66.2 0.0
57-59 mo. 58. 46.6 53.4 0.0
Male 764 33.9 66.0 0.1
Female 681 46.7 53.3 0.0
Total ' 1443 39.9 60.0 0.1
*0=toy; 1=bag; 7=refusal
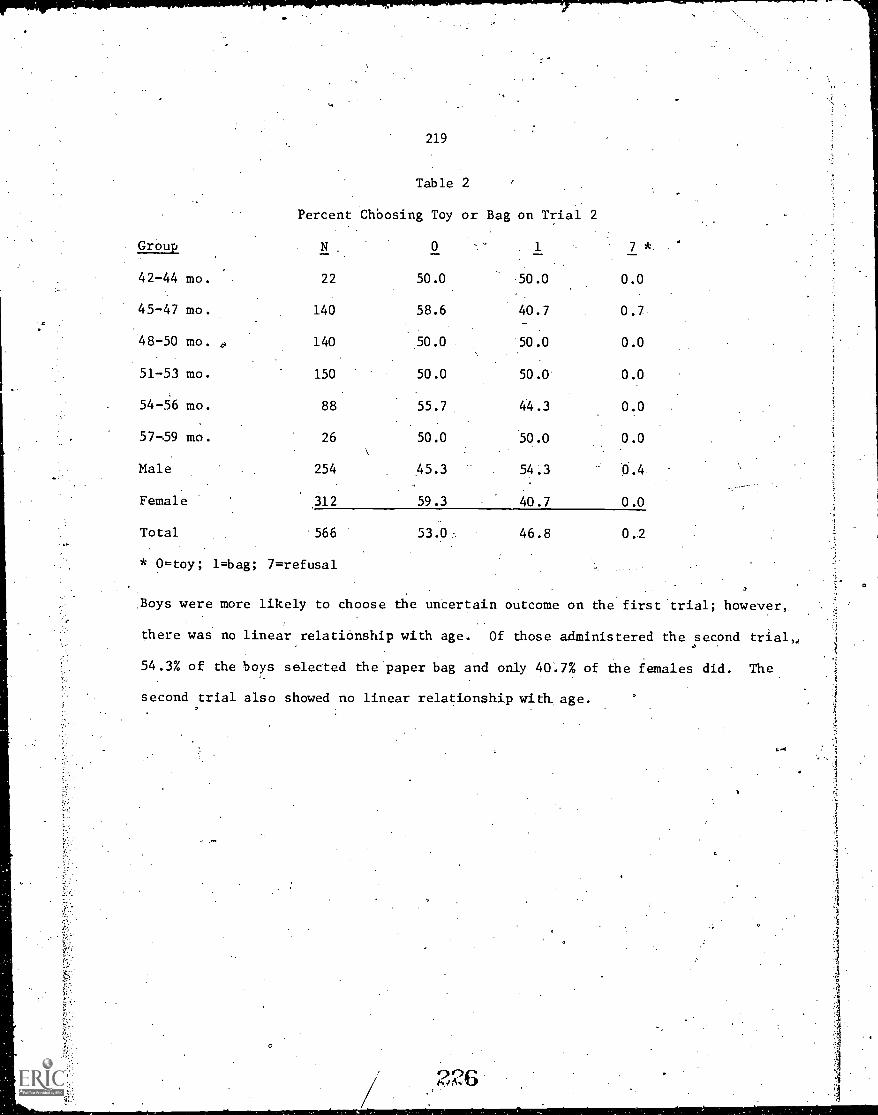
219
Table 2
Percent Chbosing Toy or Bag on Trial 2
Group 0 1 7 *
42-44 mo. 22 50.0 50.0 0.0
45-47 mo. 140 58.6 40.7 0.7
48-50 mo. 140 50.0 50.0 0.0
51-53 mo. 150 50.0 50.0 0.0
54-56 mo. 88 55.7 44.3 0.0
57-59 mo. 26 50.0 50.0 0.0
Male 254 45.3 54.3 0.4
Female 312 59.3 40.7 0.0
Total 566 53.0 46.8 0..2
* 0=toy; 1=bag; 7=refusal
Boys were more likely to choose the uncertain outcome on the first trial; however,
there was no linear relationship with age. Of those administered the second trial
54.3% of the boys selected the paper bag and only 40.7% of the females did. The
second trial also showed no linear relationship with, age.
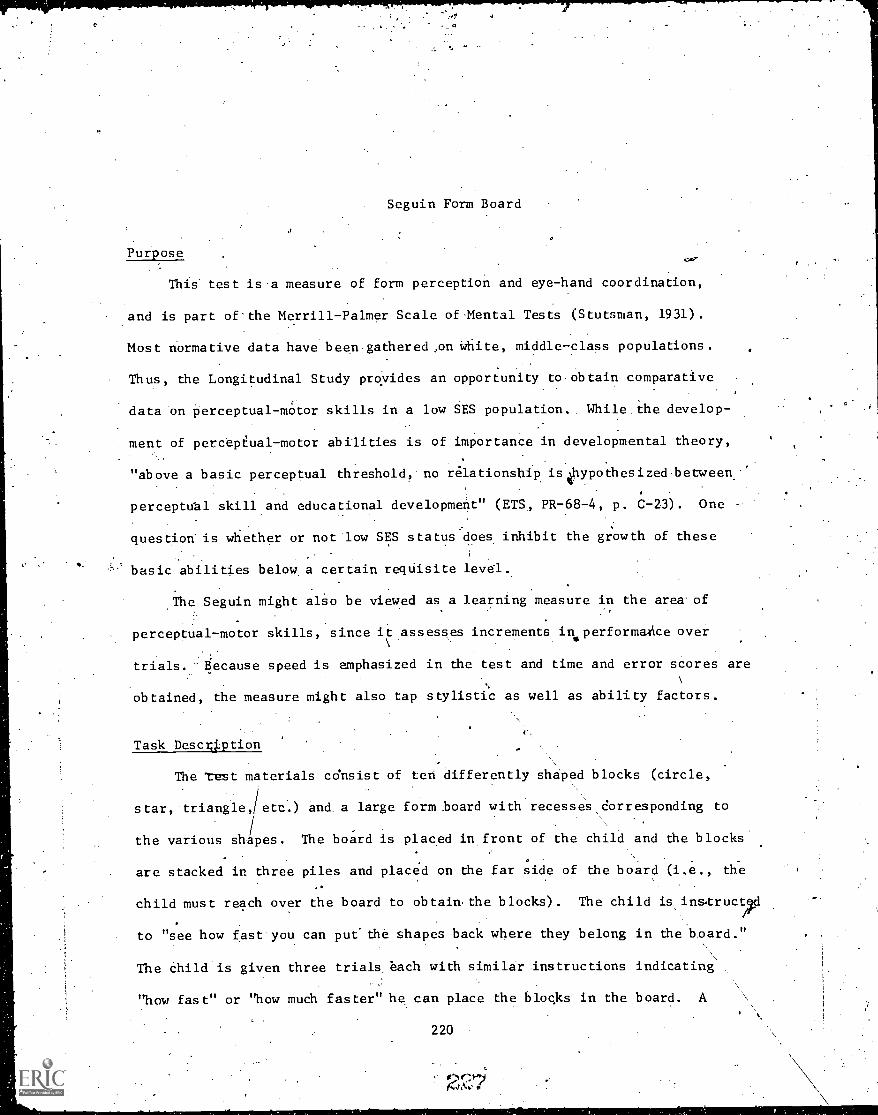
..
Seguin Form Board
Purpose
This test is a measure of form perception and eye-hand coordination,
and is part of'the Merrill-Palmer Scale ofMental Tests (Stutsman, 1931).
Most normative data have been gathered,on white, middle-class populations.
Thus, the Longitudinal Study provides an opportunity to obtain comparative
data on perceptual-motor skills in a low SES population. While the develop-
ment of percepival-motor abilities is of importance in developmental theory,
"above a basic perceptual threshold, no relationship isihypothesized between'
perceptual skill and educational development" (ETS, PR-68-4, p. &.23). One
question is whether or not low SES status-does inhibit the growth of these1
basic abilities below. a certain requisite level.
The Seguin might also be viewed as a learning measure in the area of
perceptual-motor skills, since it assesses increments in performaAce over
trials.' Because speed is emphasized in the test and time and error scores are
obtained, the measure might also tap stylistic as well as ability factors.
Task Descqption
The 'test materials consist of ten differently shaped blocks (circle,
star,.triangledetc..) and. a large form board with recesses Corresponding to
the various shapes. The board is placed in front of the child and the blocks'
are stacked in three piles and placed on the far side of the board (i.e., the
child must reach over the board to obtain the blocks). The child is instruct,
to "see how fast you can put-the shapes back where they belong in the board."
The child is given three trials each with similar instructions indicating
"how fast" or "how much faster" he. can place the blocks in the board. A
220
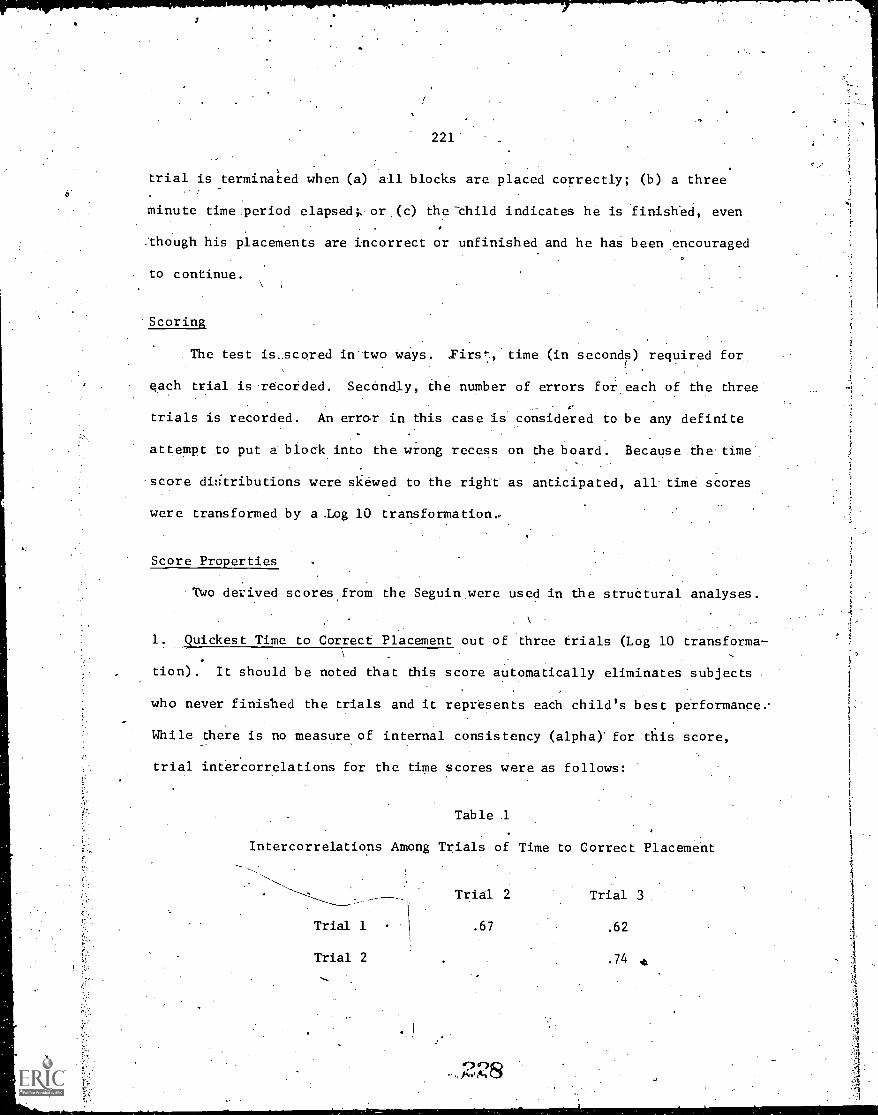
0
221
trial is terminated when (a) all blocks are placed correctly; (b) a three
minute time .period elapsed;, or (c) the child indicates he is finished, even
:though his placements are incorrect or unfinished and he has been encouraged
to continue.
.Scoring
The test is:scored in'two ways.. Yirst, time (in seconds) required for
each trial is recorded. Secondly, the number of errors for each of the three
trials is recorded. An error in this case is considered to be any definite
attempt to put a block into the wrong recess on the board. Because the-time.
.score diftributions were skewed to the right as anticipated, all time scores
were transformed by a .Log 10 transformation..
Score Properties
Two derived scores from the Seguin were used in the structural analyses.
1. Quickest Time to Correct Placement out of three trials (Log 10 transforma-
tion). It should be noted that this score automatically eliminates subjects
who never finished the trials and it represents each child's best performance..
While there is no measure of internal consistency (alpha)* for this score,
trial intercorrelations for the time scores were as follows:
Table 1
Intercorrelations Among Trials of Time to Correct Placemeht
Trial 2 Trial 3
Trial 1I .67 .62
.74 .eTrial 2
9°Q,
t.
1
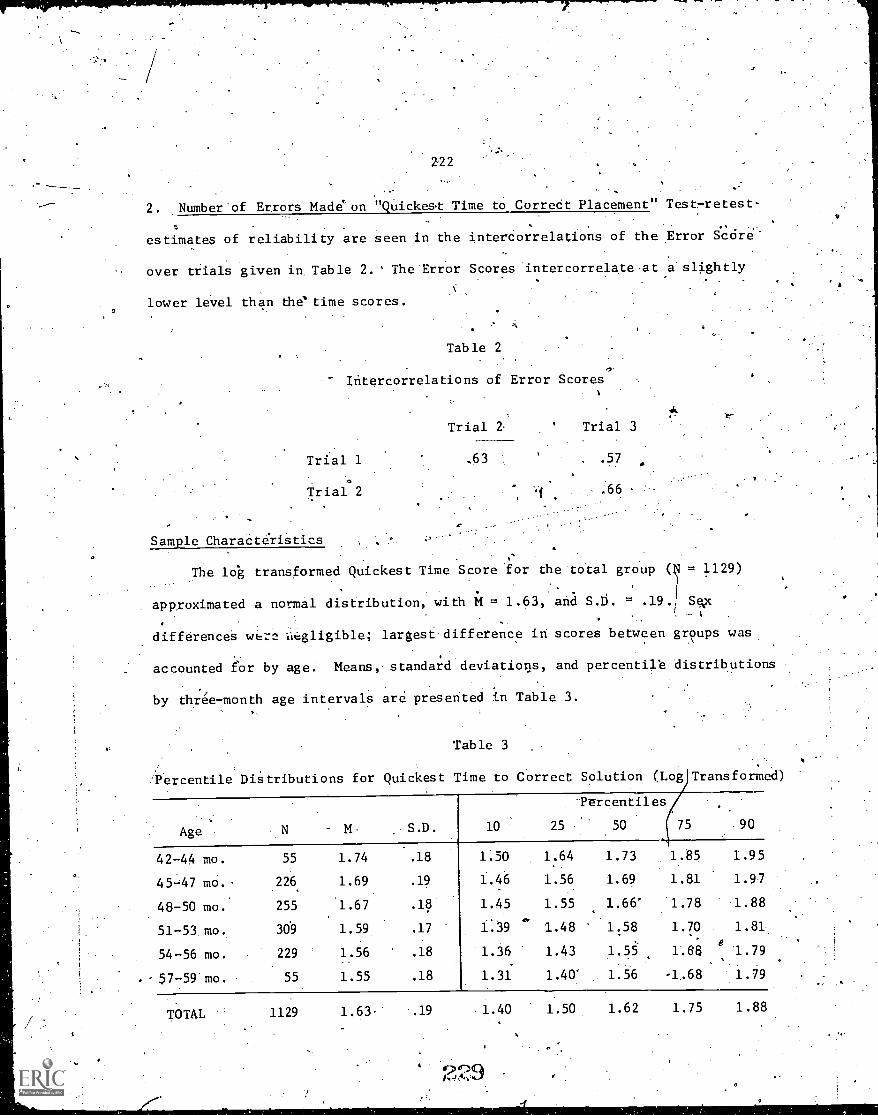
222
2. Number .of Errors Made on "Quickes,t Time to Correct Placement" Test- retest-
estimates of reliability are seen in the intercorrelations of the Error gccire'
over trials given in. Table 2. The Error Scores intercorrelate at a slightly
lower level than the' time scores.
Table 2
Intercorrelations of Error Scores
Trial 1
.
Trial 2
Sample Characteristics
Trial
.63
Trial 3
. .57
.66
The lok transformed Quickest Time Score for the total group ( = 1129)
approximated a normal distribution, with M = 1.63, and S.D. = .19.1.
differences wer.2. negligible; largest difference in scores between groups was
accounted for by age. Means, standard deviations, and percentile distributions
by three-month age intervals are presented in Table 3.
Table 3
/Percentile DiStributions for Quickest Time to Correct Solution (Log Transformed)
Age N M S.D.
42-44 mo. 55 1.74 .18
45-47 mo. 226. 1.69 .19
48-50 mo. 255 1.67 .18
51-53 mo. 309 1.59 .17
54-56 mo. 229 1.56 .18
. 57-59 mo. 55 1.55 .18
75 90
1.50 1.64 1.73 1.85 1.95
1.46 1.56 1.69 1.81 1.97
1.45 1.55 1.66' 1.78 1.88
1:39 1.48 1..58 1.70 1.81
1.36 1.43 1.55 1.68 1.79
1.31 1.40' 1.56 -1.68 1.79
TOTAL 1129 1.63 .19 1.40 1.50 1.62 1.75 1.88
229
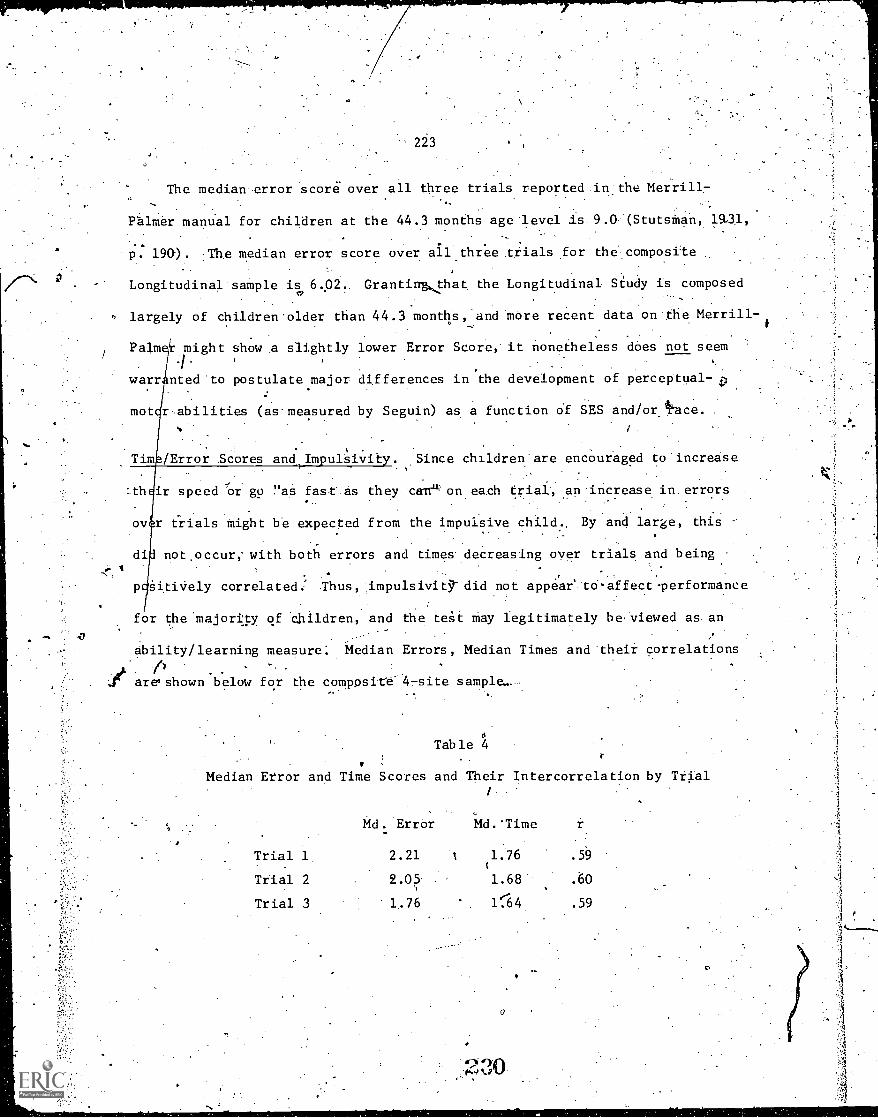
223
The median error score over all three trials reported in the Merrill.-
Phlmer manual for children at the 44.3 months age level is 9.0 (Stutsman, 1931,
p. 190). The median error score over all three trials for the composite
Longitudinal sample is Granting.that the Longitudinal Study is composed
largely of children-older than 44.3 months, and more recent data on the Merrill-1
°
Palmer might show .a slightly lower Error Score, it nonetheless does not seem
4warranted to postulate major differences in the development of perceptual-
mot r abilities (as-measured by Seguin) as a function of SES and/or. Face.
Tim /Error Scores and Im ulsivit Since children are encouraged to increase
Lth ir speed 'or go ."as fast-as they ca-n-"' on each trial, an increase in. errors
..
ov r trials might be expected from the impulsive child.. By and large, thisII
di. not .occur,' with both errors and times decreasing over trials and being
SitiVely correlated: Thus, impulsivity did not appear' tdaffect -performance
for the 'majority of children, and the test may legitimately be. Viewed as an
Median Errors, Median Times and 'their correlationsability/learning
./) . .
-. .
area shown below for the composite" 4 -site sample--.
measure:
Tab le 4
Median Error and Time Scores and Their Intercorrelation by Trial/
M
Trial 1
Trial 2
Trial 3
. Error
2.21
2.05
1.76
Md. 'Time
1.76t
1.68
'.--l64
r
.59
.60
.59
a
') t.9)0

Purpose
SigelMbject Categorization Test
The Sigel Object Categorization -Test (SOCT) is a method of assessing
A . ..
young children ' s classification, behaviors Basically, the task assesses,fl
the criteria children. AventS into categories.;,
F ample, given an array of familiar objects,. we ask two questions: "(1)
Can- .
the child createA Aategory:And,giea::ra iOnale for i,t, and (2) what is_.,,
'..,the criterion he uses,. e.g, Identical= eieMenti'l,Anch as cOlorform or lunC'--. -
tion, etc, (Sigel and Olmsted, 1468),.,
..
has revealed that classificatiOn' bAhaviors'and styles vary withr --,
.
age, ,sex, type of materials, and personality characteristics of the child,
( Sigel 195319540965; Sigel, Andersofi- & :,.Shapiro; '1966; Sigel' & McBane,
,....\
190). Agediff.e_rences. LndiCate that '6,1aer children produCe a ilider.array of
.. .
-, ..
response styles. for eachitem, witk,yotoger. Ss exhibiting fewer overall responses,__, .
r....
more stimulus -bound eapOnsepand less verbalization of' rationales; HesS,.
Shipman, Brophy and Bear (i968, '1969):foiind classification responses and 'style
Positively related to maternal language -stYle,' and to vary as a junction of
age and social status. 'COmparing classification behaviors using .familiar.°' : '
two- and .three - dimensional stimuli has shown .discrepancies between aVilities
in young children to deal with both modes of presentation and has led to :work
investigating representational thought 1681-14e.)ier, .1971). fr
,The SOCT is of theoretical importance within a .developmental fraMework
as, it can ba used to investigate broadening of cognitive slcill, changes
classificatory ability over time, and stability or change of response style
o.
as the child matures.
224
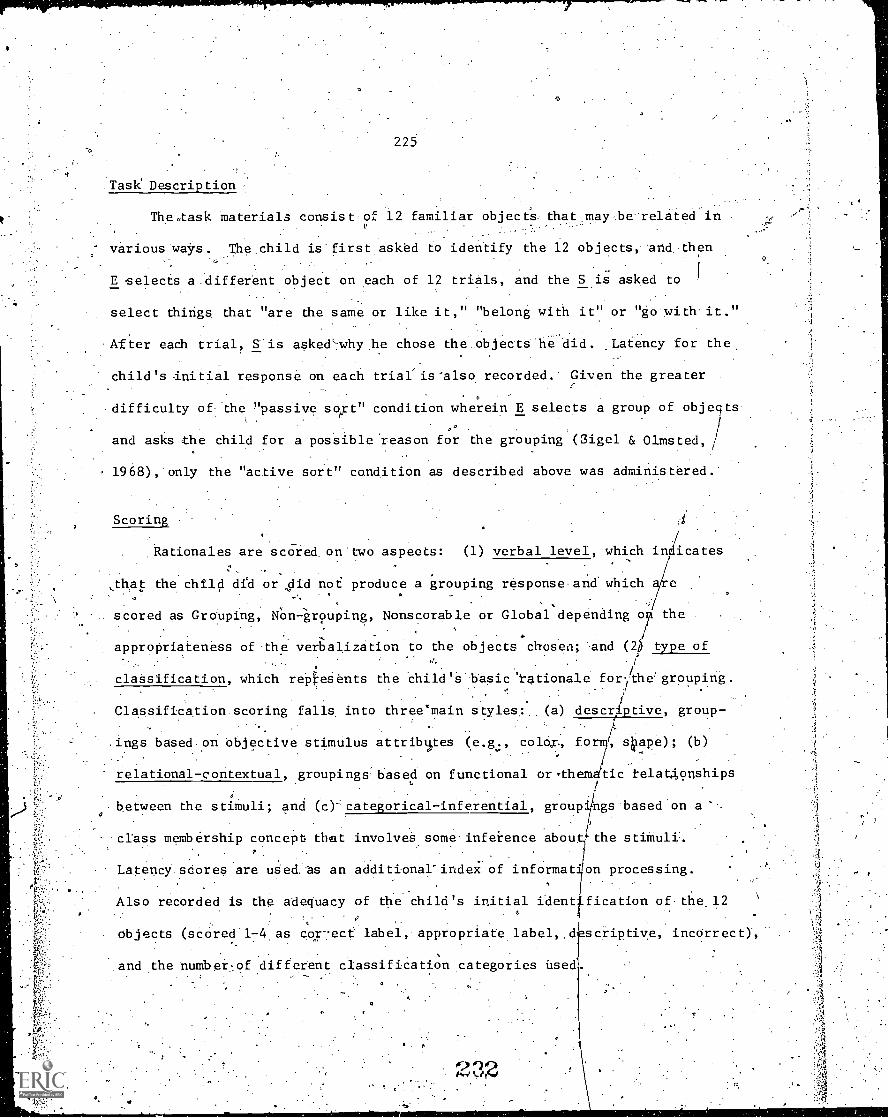
t'
225
Task' Description
The task materials consist of 12 familiar objects. that.mayberelated in_
variousWays. The child is'first asked to identify the 12 objects, and then
E selects a different object on each of 12 trials, and the S is asked to
select things that "are the same or like it," "belong with it" or "go with it."
After each trial, S is aske&-lahy he chose the objects-he-did. Latency for the,
child's-initial response on each trial is-also recorded.' Given the greater
.
difficulty of the "passive svt" condition wherein E selects a group of objects
and asks the child for a possible reason for the grouping (Sigel & Olmsted, /
1968), only the "active sort" condition as described above was administered.
Scoring
,Rationales are scOred. on'two aspects: (1) verbal level, which indicates. :
,that the child did or _did not produce a grouping responsean& which. .'. °
\
/scored as Grouping, Non-grouping, Nonscorable or Global depending'o the
7appropriateness of the verbalization to the objects chosea; and (2) type of
classification, which relie6ents the child's basic 'rationale for.ithe'g .r ouping.
..
I
Classification.scoring falls, into three main styles.: (a) descriptive, group-,
.ings based on objective stimulus attribttes (e g4, colcii, fo hape); (b)4.
d..' ..
relational-contextual, groupings based on functional or,themdtic telat.tonshipsi
between the stimuli; and (c)'categorical-inferential, group /rigs based on a '.-
class membership concept that involveS some infeience about .the stimuli.
_Latency scores are uded..as an additional-index of information processing.
.
Also recorded is the adequacy of the child's initial ident fication of.thel2.
- objects (scored 1-4 as cor-ece label, appropriate label,.d scriptive, incorrect),
and the nuMber..of different classification categories used.
»9
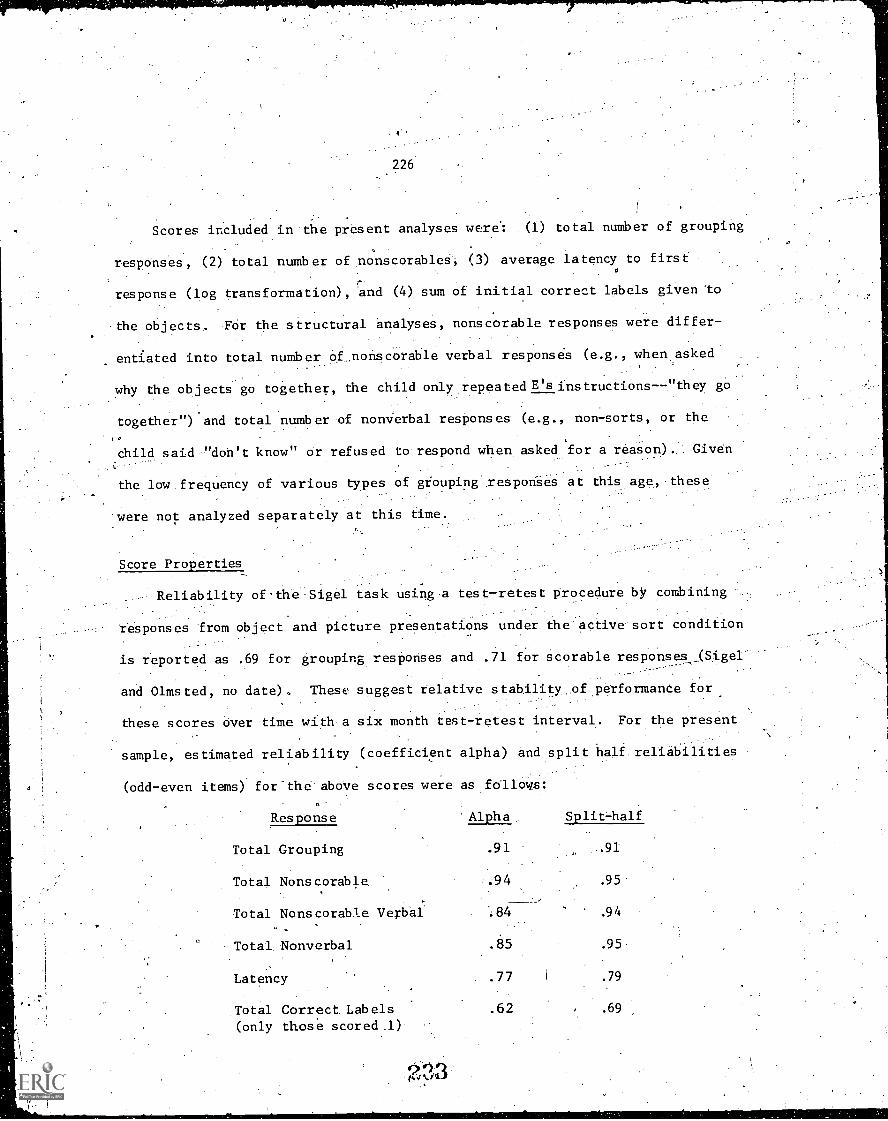
226
Scores included in the present analyses were: (1) total number of grouping
responses, (2) total number of nonscorables, (3) average latency to first
response (log transformation), and (4) sum of initial correct labels giVen 'to
the objects, For the structural analyses, nonscorable responses were differ
entiated into total number Of_noliscorable verbal responses (e.g., when asked
why the obiects go together, the child only repeated E's instructions--"they go
together") and total number of nonverbal responses (e.g., non-sorts, or the
child said "don't know" or refused to respond when asked for a reason). Given.-.
the low frequency of various types of grouping respon-seS at this age, these
were not analyzed separately at this time.
Score Properties
Reliability of stile Sigel task using a test-retest procedure by combining
responses from object and picture presentations under the active sort condition
is reported as .69 for grouping responses and .71 for scorable responses :..(.Sigel:
and Olmsted, no date) These suggest relative stability, f performance for
these scores over time with a six month test-retest interval. For the present
sample, estimated reliability (coefficient alpha) and split half. reliabilities
(odd-even items) for-the' above scores were as follo,:is:
Response Alpha .. Split -half
Total Grouping .91
Total Nonscorable .94 .95
Total Nonscorable Verbal .94
Total. Nonverbal .85
Latency .77 I .79
Total Correct. Labels .62 .69
(only those scored .1)
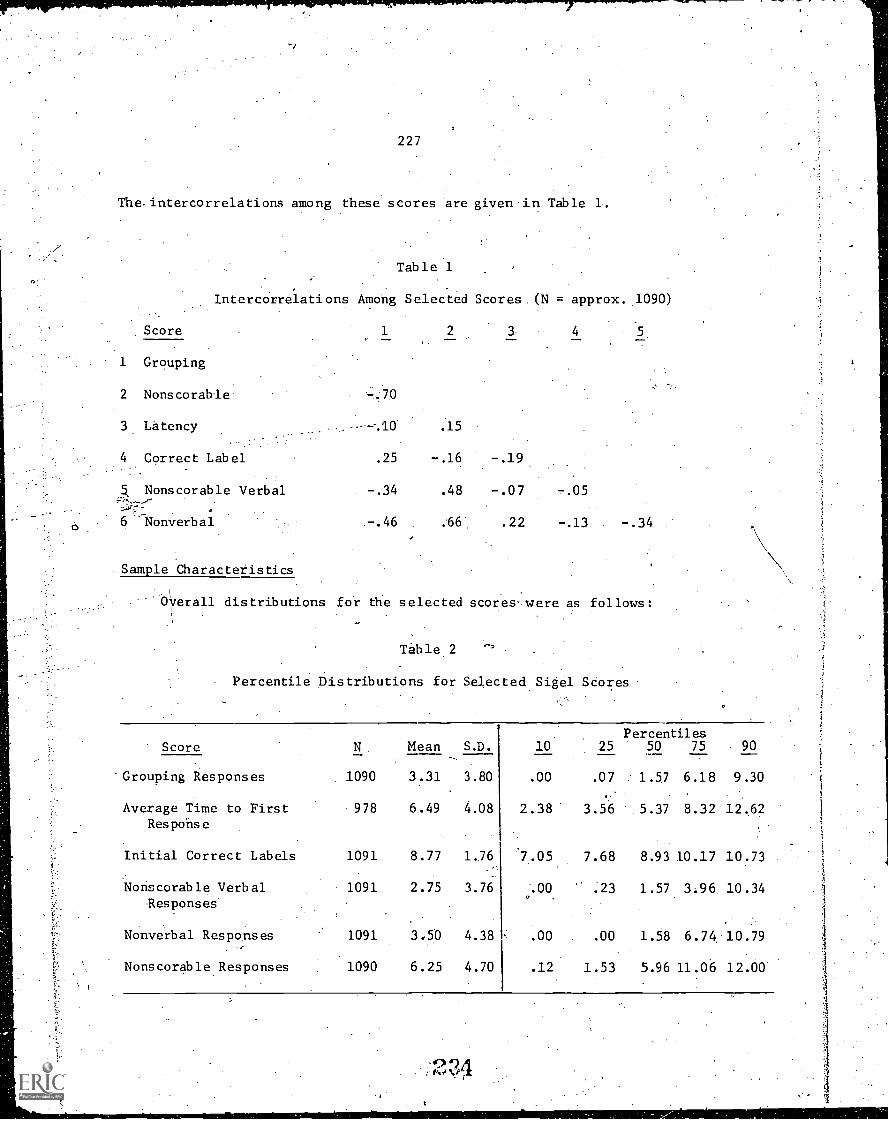
227
The.intercorrelations
1
2
3
4
6
among
Intercorrelations
Score
these scores are given in Table 1.
Table 1
Among Selected Scores = approx. 1090)
1 2 3. 4 5
.7:70
.15
.25 -.16 -.19.
-.34 .48 -.07 -.05
.-.46 .66 .22 -.13 -.34
Grouping
Nonscorable
Latency
Correct 14bel
Nonscorable Verbal
Nonverbal
Sample Characteristics
Olyerall distributions for the selected scores' were as follows:
Table 2
Percentile Distributions for Selected Sigel Scores
Score N. Mean S.D. 10 25Percentiles
50 .75 90
Grouping Responses 1090 3.31 3.80 .00 .07 1:57 6.18 9.30
Average Time to First 978 6.49 4.08 2.38 3.56 5.37 8.32 12.62Respohse
Initial Correct Labels 1091 8.77 1,76 7.05 7.68 8.93 10.17 10.73
Nonscorable Verbal 1091 2.75 3.76 :.00 .23 1.57 3.96 10.34Responses.
Nonverbal Responses 1091 3.50 4.38 .00 .00 1.58 6.74 10.79e
Nonscorable Responses 1090 6.25 4.70 .12 1.53 5.96 11.06 12.00
; vGr 1;i7
228
Although most children were able to label the objects correctly, few were
able to give appropriate verbal rationales for their sorts. Children who
repeatedly gave no response when a rationale was requested were frequently
incorrectly discontinued by the examiner. Also, the task was automatically
discontinued in cases where four consecutive "piling" responses or "no sort"
responses were given. Therefore, the frequency of nonscorable verbal and non-
verbal responses is actually underrepresented in this table.
Girls consistently gave slightly more grouping responses across sites,
but sex differences for this and other scores were negligible. Composite
data showed grouping responses to increase with age, but there were no con-
sistent age patterns for this or other scores across sites.
Future analyses will investigate: (1) relationships betsTeen the child's
cognitive environment (particularly maternal linguistic styles) nd his-ability
provide verbal rationales for sorting; (2) mode of categorizatT as a
"marker" of level of intellectual functioning; and (3) developments\ trends in
the child's preferred -response mode.
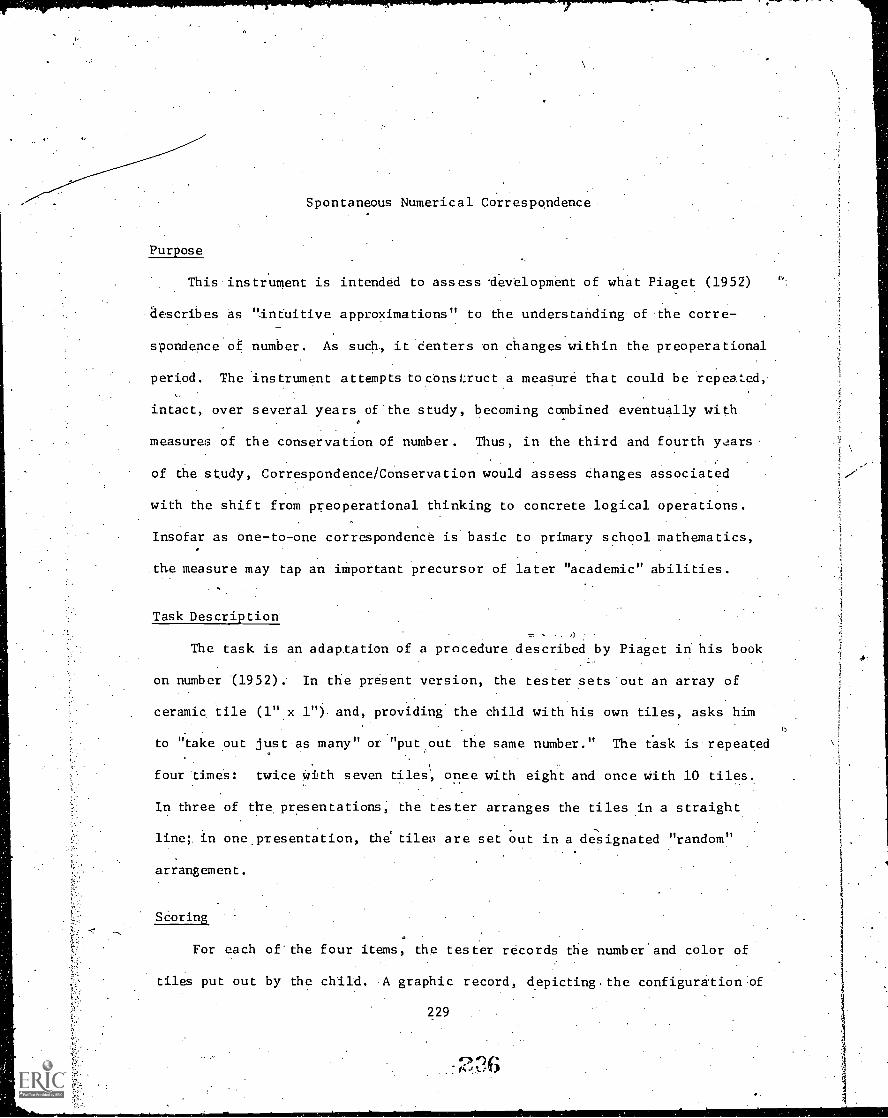
Purpose
Spontaneous Numerical Correspondence
This instrument is intended to assess -development of what Piaget (1952)
describes as "Intuitive approximations" to the understanding of the corre-
to.
spondence of number. As such, it 'Centers on changes within the preoperational
period. The Instrument attempts tocbnstruct a measure that could be repeated,4
intact, over several years of the study, becoming combined eventually with
measures of the conservation of number. Thus, in the third and fourth years
of the study, Correspondence/Conservation would assess changes associated
with the shift from preoperational thinking to concrete logical operations.
Insofar as one-to-one correspondence is basic to primary school mathematics,
the measure may tap an important precursor of later "academic" abilities. .A
Task Description.
The task is an adaptation of a procedure described by Piaget i his book46,
on number (1952). In the present version, the tester sets out an array of
ceramic, tile (1" x 1") and, providing' the child with his own tiles, asks him
to "take out just as many" or "put out the same number." The task is repeated
four times: twice with seven tiles, once with eight and once with 10 tiles.
In three of the, presentations, the tester arranges the tiles in a straight
line; in one presentation, the' tileu are set o ut in a designated "random"
arrangement.
Scoring
For each of'the four items, the tester records the number.and color of
tiles put out by the child. A graphic record, depicting. the configuration of
229
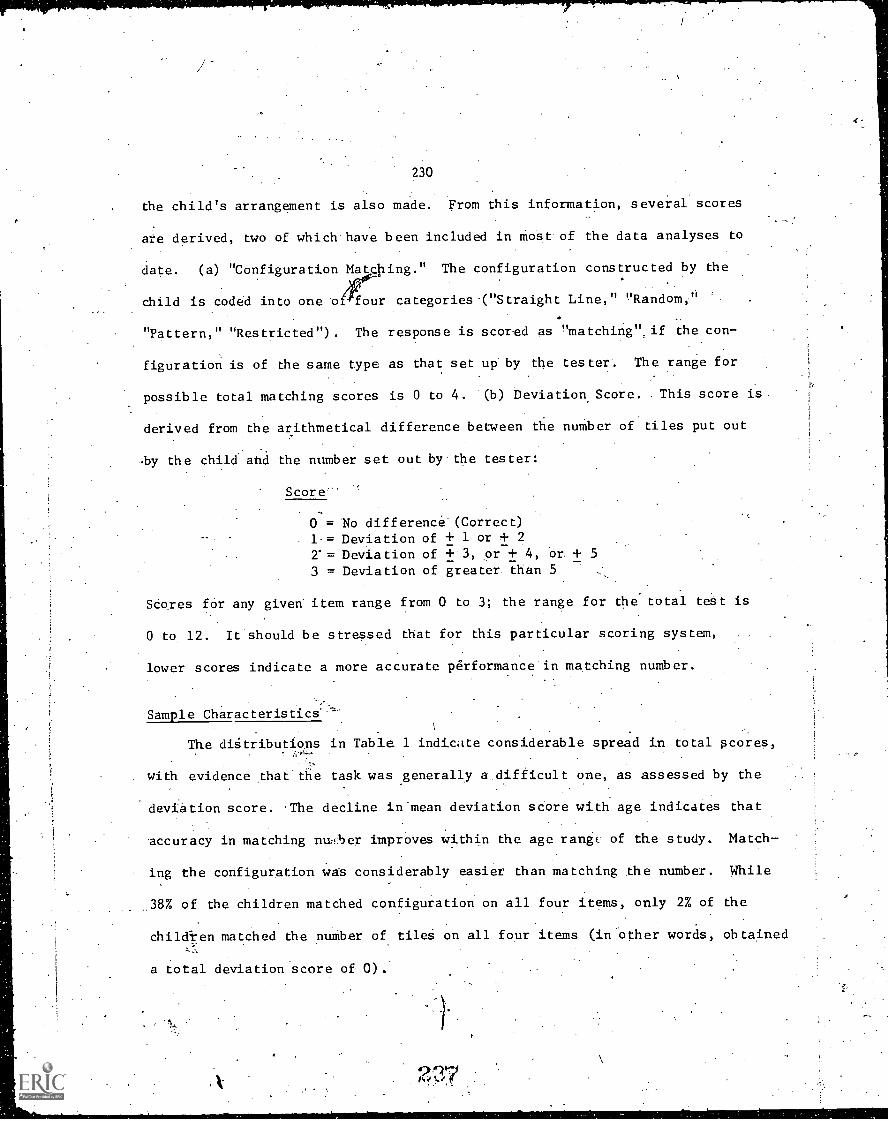
230
the child's arrangement is also made. From this information, several scores
are derived, two of which have been included in most of the data analyses to
date. (a) "Configuration Matolhing." The configuration constructed by the
child is coded into one o four categories-("Straight Line," "Random,"
"Pattern," "Restricted") . The response is scored as "matching ", if the con-
figuration is of the same type as that set up. by the tester. The range for
possible total matching scores is 0 to 4. (b) Deviation Score. . This score is
derived from the arithmetical difference between the number of tiles put out
.by the child. and the number set out by. the tester:
Score-
0 = No difference' (Correct)l.= Deviation of + 1 or + 22' = Deviation of + 3, or 4, or. + 5
3 = Deviation of greater than 5
Scoxes for any given item range from 0 to 3; the range for the total test is
0 to 12. It should be stressed that for this particular scoring system,
lower scores indicate a more accurate performance in matching number.
Sample Characteristics'
The digtributions in Table 1 indicate considerable spread in total scores,
with evidence that the task was generally a difficult one, as assessed by the
deviation score. The decline in-mean deviation score with age indicates that
accuracy in matching nu:!:ber improves within the age range of the study. Match-
ing the configuration was considerably easier than matching the number. While
38% of the children matched configuration on all four items, only 2% of the
children matched the number of tileg on all four items (in other words, obtained
a total deviation score of 0).
frV
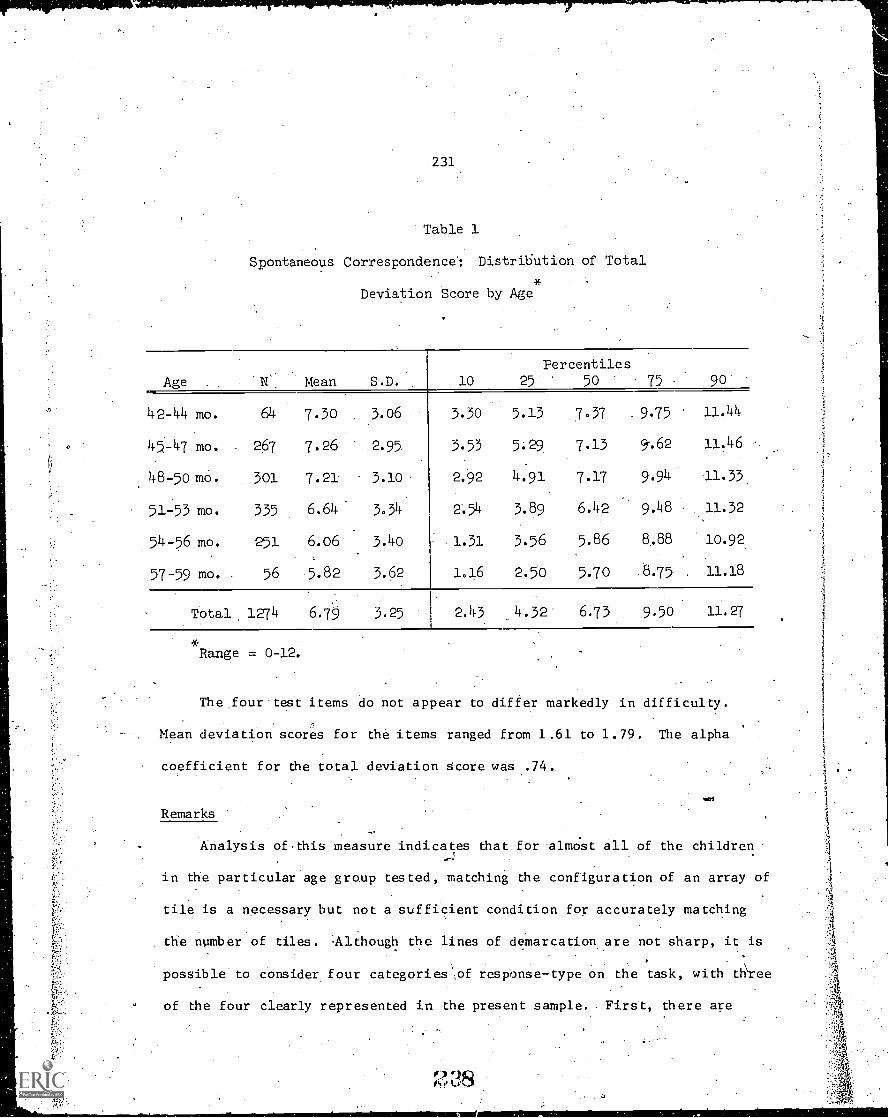
231
Table 1
Spontaneous Correspondence: Distribution of Total
Deviation Score by Age
Age N Mean S.D. 10
Percentiles25 50 75 90
42-44 mo. 64 7.30 3.06 3.3o 5.13 7.37 9.75 11.44
45-47 mo. 267 7.26 2.95 3.53 5.29 7.13 9.62 11.46
48-5o mo. 301 7.21 3.10 2.92 4.91 7.17 9.94 11.33
51-53 mo. 335 6.64 3.34 2.54 3.89 6.42 9.48 11.32
54-56 mo. 251 6.06 3.4o 1.31 3.56 5.86 8.88 10.92
57-59 mo. 56 5.82 3.62 1.16 2.50 5.70 8.75 11.18
Total 1274 6.79 3.25 2.43 4.32 6.73 9.50 11.27
Range = 0-12.
The four test items do not appear to differ markedly in difficulty.
Mean deviation scores for the items ranged from 1.61 to 1.79. The alpha
coefficient for the total deviation score was .74.
Remarks
Analysis of this measure indicates that for almost all of the children
in the particular age group tested, matching the configuration of an array of
tile is a necessary but not a sufficient condition for accurately matching
the number of tiles. Although the lines of demarcation are not sharp, it is
possible to consider four categories of response-type on the task, with three
of the four clearly represented in the present sample. . First, there are
232
children who respond to the tester's request by putting out a collection of
tiles, by sometimes emptying the box or by just taking out a few handfuls.
They comply with the request to "put out" tiles, but they generally do not
match the tester's arrangement in either number or configuration (low con-
figuration - highdeviatidn'scores). Secondly, there are many children who
took pains to match the configuration but who nevertheless were not very close
in matching number (high configuration - high deviation scores). Thirdly,
there are children who clearly matched configuration with a precision that
brought. with it a close, if not exact, matching in number high configuration
low deviation scores). 'Finally, there is a fourth type of performance which
is very rare in the present group, but which is.common in a considerably older,
group, in which-the correct number is put out but no effort is made to match
configuration (low configuration. - low deviation scores). These children simply
count out..the tiles in complying with a request to put Out the "same number."
The first three patterns of responding are reported by Piaget in his analysis
of development within the preoperational period. He interprets such responses
as reflecting an understanding of number that is essentially perceptual in
character.
TAMA General KnoWledge Test*
Purpose.
This test was devised specifically for the Longitudinal Study and
included for the following overlapping reasons: (a) General-knowledge is
one of the most prevalent operational definitions of "intelligence," and
general knowledge questions arefeatured in many of, the most respected
i7ntelligence,iests. '(b) Certain kinds of general knowledge are essential to
functioning in society, and .it. is one .of. the major responsibilities of the
school and home to see that children acquire these pieces of information.
(c) Other kinds of'information are important to communication, social inter-
action, and pleasure. (d) Some general knowledge is important as a base for
acquiring other general knowledge. (e) Inclusion of general knowledge measures
in the study allows'a more comprehensive assessment of explicit school-goals
than a measurement strategy limited to skills and aspects of personality and
social development. (See ETS, PR-68-4, p. C-64 f.) Successively more difficult
and comprehensive forms, vertically equated, were planned for use in later
years of the study.r
Task Description
The TAMA General Knowledge Test for 3 1/2- to 4-year-olds requires S to
point to the correct picture among,three pictures in response to a question
from E. For. example, S would be shown.Pictures of a spoon, a knife, and a
broom and asked, "Which of these is not safe to play with?" (78 percent of
the sample got that one. right and the .biserial correlation with total score
was :54.) The response mode for the TAMA contrasts with that for the
*TAMA was derived from the last names of the team responsible for developingthe test:- Masako Tanaka, Scarvia Anderson, Carolyn Massad, and Dolores Ahrens
233
'9'40
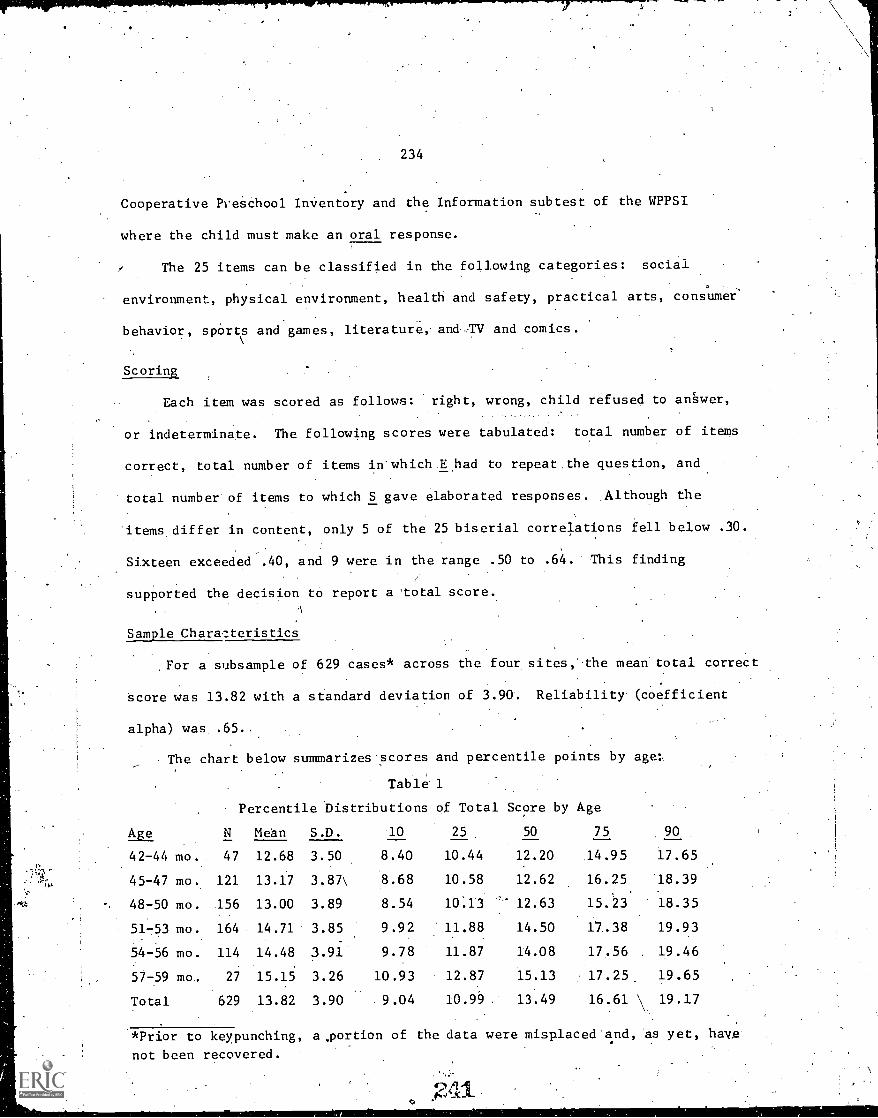
234
Cooperative Preschool Inventory and the Information subtest of the WPPSI
where the child must make an oral response.
The 25 items can be classified in the following categories: social
environment, physical environment, health and safety, practical arts, consumer
behavior, sports and games, literature,- and . -TV and comics.
Scoring
Each item was scored as follows: right, wrong, child refused to answer,.. .
or indeterminate. The following scores were tabulated: total number of items
correct, total number of items in' which .E .had to repeat the question, and
total number of items to which S gave elaborated responses. Although the
items differ in content, only 5 of the 25 biserial correlations fell below .30.
Sixteen exceeded .40, and 9 were in the range .50 to .64. This finding
supported the decision to report a 'total score.
Sample Charzteristics
For a subsample of 629 cases* across the four sites, the mean total correct
score was 13.82 with a standard deviation of 3.90. Reliability (coefficient
alpha) was .65...
The chart below summarizes scores and percentile points by age:
Table 1
Percentile Distributions of Total Score by Age
Age N Mean S.D. 10 25 50 75 90
42-44 mo. 47 12.68 3.50 8.40 10.44 12.20 14.95 17.65
45-47 mo. 121 13.17 3.87\ 8.68 10.58 12.62 16.25 18.39
48-50 mo. 156 13.00 3.89 8.54 10:13 12.63 15.23 18.35
51-53 mo. 164 14.71 3.85 9.92 11.88 14.50 17.38 19.93
54-56 mo. 114 14.48 3.91 9.78 11.87 14.08 17.56 19.46
57-59 mo. 27 15.15 3.26 10.93 12.87 15.13 17.25 19.65
Total 629 13.82 3.90 9.04 10.99 13.49 16.61 \ 19.17
*Prior to keypunching, a_portion of the data were misplaced and, as yet, have
not been recovered.
9 1
235
Except for a slight reversal !..n the 51 -53 and 54-56 month categories,
total score showed a linear relationship with'age. There was no difference,
however, in the mean performance of boys and girls (4ean=13.96 and 13.66,
.respectively).
Vigor 1 & 2
Purpos e
A child's vigor or level of physical energy may influence his performance
,on other tasks. 'The low-vigor child without "energy" to respond might be
regarded by a ester or, teacher as poOrly motivated, and the unusually energetic
r
child might be labeled as aggressive. Two vigor tasks were included in the
initial study year to determine the relationship, if any, of motor energy to
the cognitive areas under investigation. It was vigor rather. than mere muscular
strength or motivation to do what E asks which was hopefully being tapped.
It should be noted, however, that these measures are indices of "immediate"
in contrast to "sustained" energy whic would be measured differently and might
have different correlates.
Task Description
Two tasks, with two trialseach, were administered on different days to
obtain some overall measure of pthysiCal energy. _ On the Running Task the child
was asked to "run as last as you can when I say 'go'," a space of 12 feet being
marked off on the floor with lines drawn AO indicate starting and stopping
places.1
For. the Crank Turning Task the child was asked. to "turn the crank as fast'
as you can until I say 'stop'." It had previously been established that most
Children could turn the 'crank without difficulty.
Scoring
For the running task,.time was measured' to the. nearest .2 second. For
'crank turning, the number of complete revollitions in 15 seconds was recorded.
236
O

e.
237
Score Characteristics
.The4,relationship between the two vigor measures was slight, with r = -.24
between mean scores on each task. The correlations of trials 1 and 2 within
.
tasks were quite high, however, with-r = .71 for running and '.76 for crank
.turning.Duriug testing it was discovered that running. speed was affected.by
a number of other faciorssuch as fear of falling, 'tester differences in where......:
they stood, closeness of walls and doorS, etc. Given these confounding influences,
.and the low correlation betweentasks mean number of crank turns was the
vigol- measure used in the structural ana
Sample Characteristics
Th'e mean running time on trial l. across ill" 4 sites (N=1429) was 2.48. ,
seconds (S:D.=1,32); on tria1.2 it was 2.19'-(S.D.=1.15) . The trial 2 speed
was faster for all subgroups of children (classified by age and sex) across,
sites, cleatly indicating a practice effect. '
This practice effect was also, evident in'the tank twining. task. :sin the
15-second period, children on their first trial (N=1470) scored a mean of 10.59
turns (S.D.=1.48), while the mean number of turns for trial 2 was 11.79
(S.D. = 3.66).
Mean .running time and mean.numaer of crank turns are, presented in ;Tables
1 & 2 by:age and sex subgroups.4
T.
r:
244
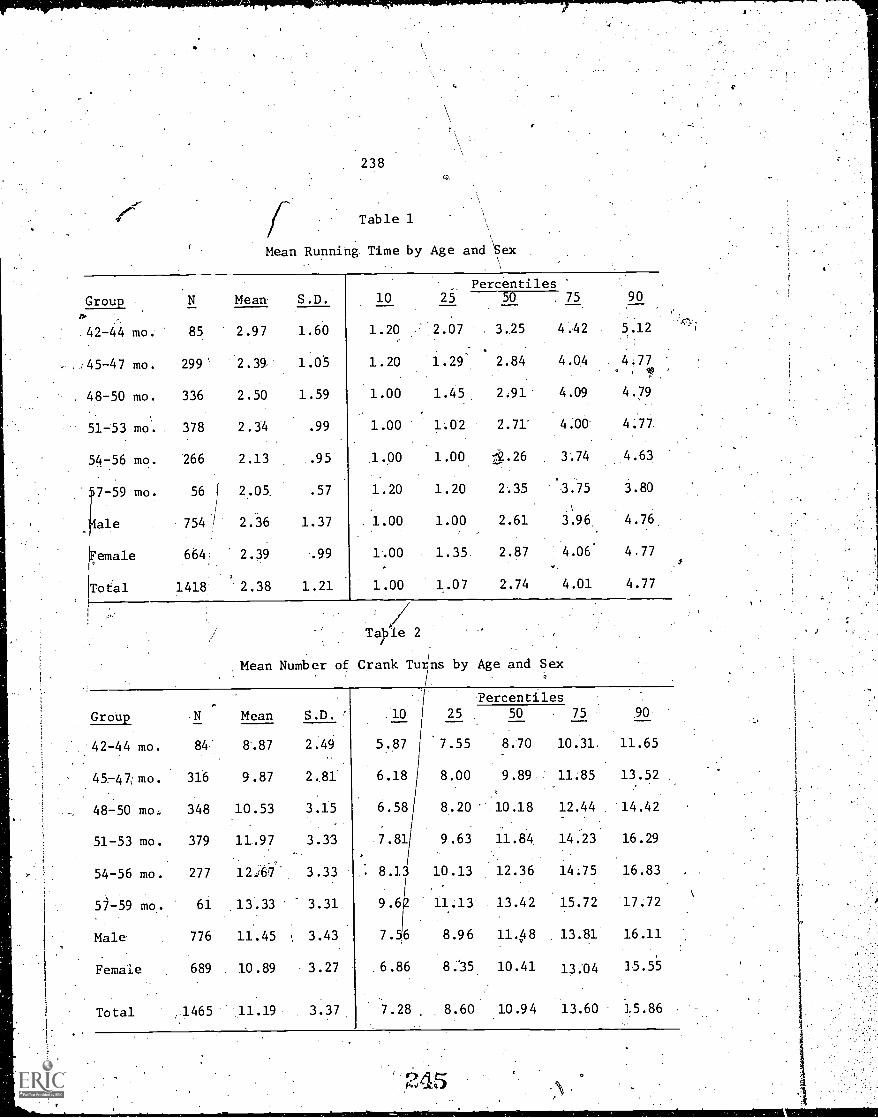
238
Table 1
Mean Running Time by Age and''Sex
\
21.211E N Mean S.D. 10 25Percentiles
50 75
42-44 mo. 85 2.97 1.60 1.20 2.07 3.25 4.42
45-47 mo. 299 2.39 1.05 1.20 1.29 2.84 4.04
48-50 mo. 336 2.50 1.59 1.00 1.45 2.91 4.09
51-53 mo. 378 2.34 .99 1.00 1.02 2.71" .4.0
54-56 mo. 266 2.13 .95 1.00 1.00 1.26 3.74
7-59 mo. 56 1 2.05. .57 1.20 1.20 2.35 3.75
ale 754 I 2.36 1.37 1.00 1.00 2.61 3.96
"Female 664; 2.39 -.99 1-.00 1.35. 2.87 4.06,
(Total 1418" 2.38 1.21 1.00 1.07 2'.74 4.01
I.i
Ta) ie 2
.Mean Number of Crank Tts by Age and Sex
90
5.12
4.77
4.79
4.77
4.63
3.80
4.76
4.77
4.77
Percentiles
Group Mean S.D. 10 25 50 75
42-44 mo. 84 8.87 2.49 5.87 '7.55 8.70 10.31
45-47, mo. 316 9.87 2.81 6.18 8.00 9.89 11.85
48-50 mo. 348 10.53 3.15 6.58 8.20 10.18 12.44
51-53 mo. 379 11.97 3.33 7.81 9.63 11.84 14.23
54-56 mo. 277 12.67 3.33 8.1 10.13 12.36 14.75
51-59 mo. 61 13.33 3.31 9.6 11.13 13.42 15.72
Male 776 11.45 3.43 7 6 8.96 11.48 13.81
Female 689 10.89 3.27 6.86 8:35 10.41 13.04
Total 1465 11.19 3.37 7.28 8.60 10.94 13.60
90
11.65
13.52
14.42
16.29
16.83
17.72
16.11
15.55
15.86
239
"I .
O
Score distributions by 3-month age intervals Show a clear increase in
V
scores with age, with older children running faser and turning the crank
handle more times than younger' -ones Boys showed more vigor on crank turning,
but sex differences in running were negligible. The age findings sugget that
these measures may be more influenced by muscle strength than originally
expected.
4 6
0
I
I
APPENDIX..0
SUPPLEMENTARY TABLES
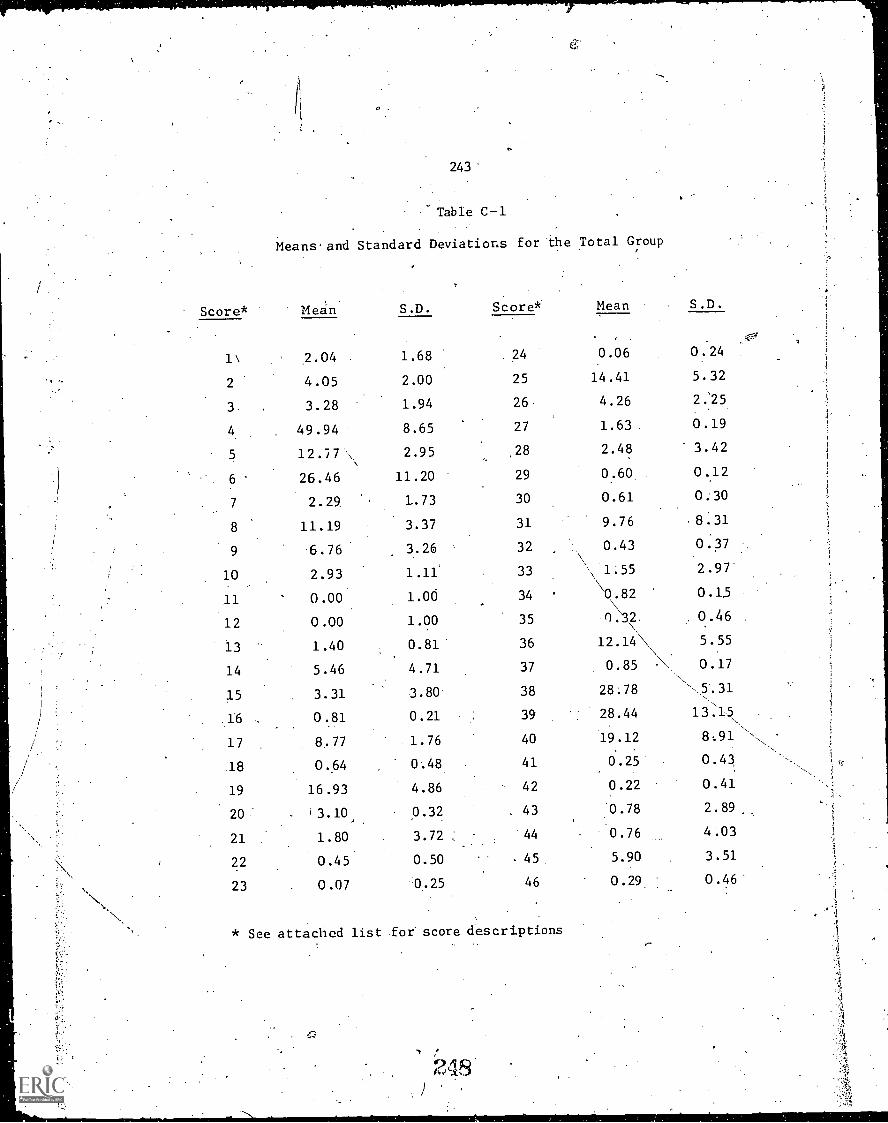
t
243
- Table C-1
Means' and Standard Deviations for the Total Group
Score* Mean S.D. Score* Mean
1\ 2.04 1.68 24 0.06
2 4.05 2.00 25 14.41
3. 3.28 1.94 26 4.26
4 49.94 8.65 27 1.63
5 12.17 , 2.95 28 2.48
6 26.46 11.20 29 0.60
7 2.29 1.73 30 0.61
8 11.19 3.37 31 9.76
9 6.76 3.26 32 0.43
10 2.93 1.11' 33 , 1.55
11 0.00 1.00..
34\0.82
12 0.00 1.00 35 0. 2
13 1.40 0.81 36 12.14
14 5.46 4.71 37 0.85
15 3.31 3.80 38 28.78
16 0.81 0.21 39 28.44
17 8.77 1.76 40 19.12
18 0.64 0.48 41 0.25
19 16.93 4.86 42 0.22
20 '3.10 0.32 43 0.78
21 1.80 3.72 . 44 0.76
22 0.45 0.50 45 5.90
23 0.07 0.25 46 0.29
* See attached list for score descriptions
S.D.
0.245.322.250.193.420.120.308.310.372.970.150.465.550.17
'- 5.31..
13.15.8..91 N0.430.41
2.89
4.033.51
0.46
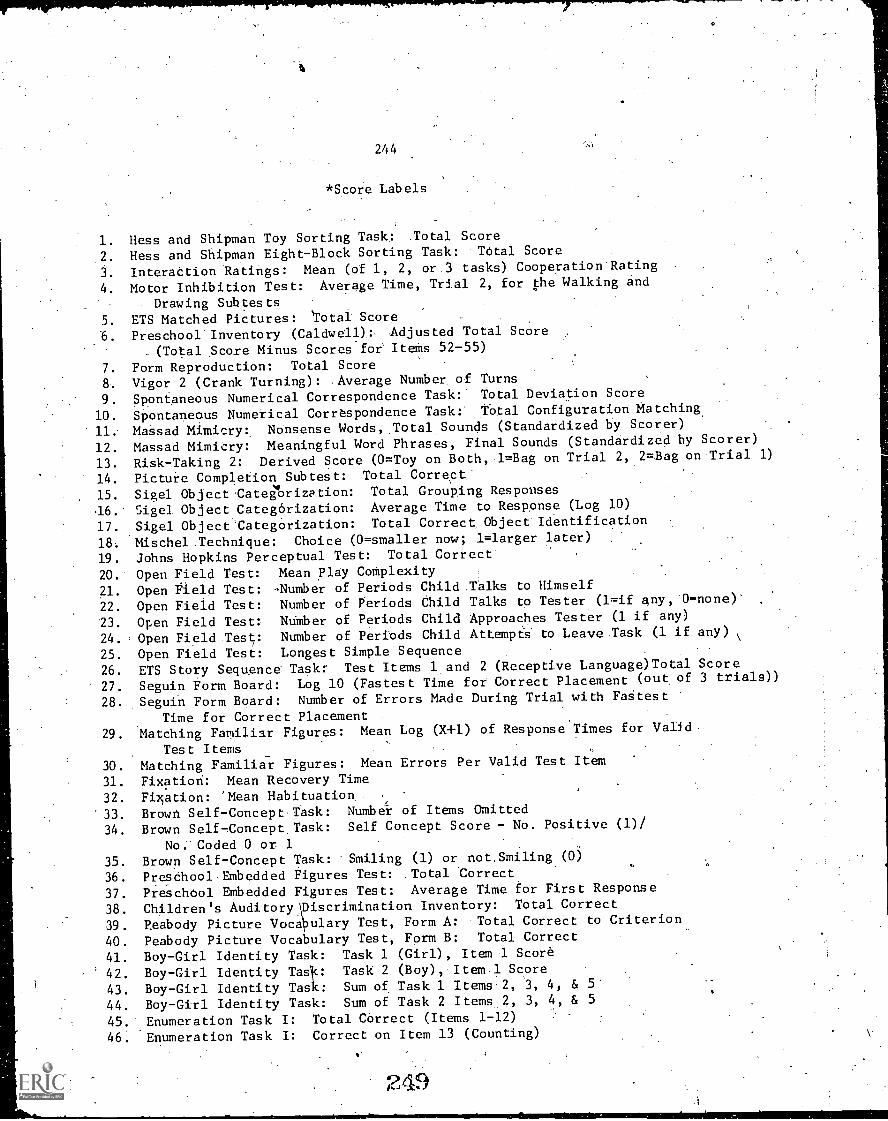
244
*Score Labels
1. Hess and Shipman Toy Sorting Task: Total Score
2. Hess and Shipman Eight-Block Sorting Task: Total Score
3. Interattion Ratings: Mean (of 1, 2, or 3 tasks) Cooperation Rating
4. Motor Inhibition Test: Average Time, Trial 2, for the Walking and
Drawing Subtests5. ETS Matched Pictures: 'Total Score
'6. Preschool Inventory (Caldwell): Adjusted Total Score
(Total Score Minus Scores for' Items 52-55)
7. Form Reproduction: Total Score
8. Vigor 2 (Crank Turning): Average Number of Turns
9. Spontaneous Numerical Correspondence Task: Total Deviation Score
10. Spontaneous Numerical Correspondence Task:' Total Configuration Matching.
11.' Massad Mimicry: Nonsense Words, Total. Sounds (Standardized by Scorer)
12. Massad Mimicry: Meaningful Word Phrases, Final Sounds (Standardized by Scorer)
13. Risk-Taking 2: Derived Score (0=Toy on Both, l =Bag on Trial 2, 2=Bag on Trial 1)
14. Picture Completion Subtest: Total Correct
15. Sigel ObjectCateitrization: Total Grouping Responses
.16. Sigel. Object Categorization: Average Time to Response (Log 10)
17. Sigel Object Categorization: Total Correct. Object Identification
18. Mischel Technique: Choice (0=smaller now; 1=larger later)
19. Johns Hopkins Perceptual Test: Total Correct
20.' Open Field Test: Mean Play CoMplexity
21. Open Field Test: 'Number of Periods Child Talks to Himself
22. Open Field Test: Number of Periods Child Talks to Tester (1=if any, 0 -none)
23. Open Field Test: Number of Periods Child Approaches Tester (1 if any)
24. Open Field Test: Number of Periods Child Attempts to Leave Task (1 if any)
25. Open Field Test: Longest Simple Sequence
26.. ETS Story Sequence' Task:' Test Items 1 and 2 (Receptive Language)Total Score
27. Seguin Form Board: Log 10 (Fastest Time for Correct Placement (out of 3 trials))
28. Seguin Form Board: Number of Errors Made During Trial with Fagtest
Time for Correct Placement29. Matching Familiar Figures: Mean Log (X+1) of Response Times for Valid
Test Items
30. Matching Familiar Figures: Mean Errors Per Valid Test Item
31. Fixation: Mean Recovery Time
32. Fixation: 'Mean Habituation
'33. Brown Self-Concept Task: Numbel. of Items Omitted
34. Brown Self - Concept. Task: Self Concept Score - No. Positive (1)/
No. Coded 0 or 135. Brown Self-Concept Task: Smiling (1) or not,Smiling (0)
.. .,
36. Preschool Embedded Figures Test: Total Correct
37. Preschool Embedded Figures Test: Average Time for First Response
38. Children's Auditory
\I
Discrimination Inventory: Total Correct
)39. Peabody Picture Voca ulary Test, Form A: Total Correct to Criterion
40. Peabody Picture Vocabulary Test, Form B: Total Correct
41. Boy-Girl Identity Task: Task 1 (Girl), Item '1 Score
42. Boy-Girl Identity 'resit: Task 2 (Boy), Item 1 Score
43. Boy-Girl Identity Task: Sum of Task 1 Items 2, 3, 4, & 5'
44. Boy-Girl Identity Task: Sum of Task 2 Items 2, 3, 4, & 5
45. Enumeration Task I: Total Correct (Items 1-12)
46. Enumeration Task I: Correct on Item 13 (Counting)
249
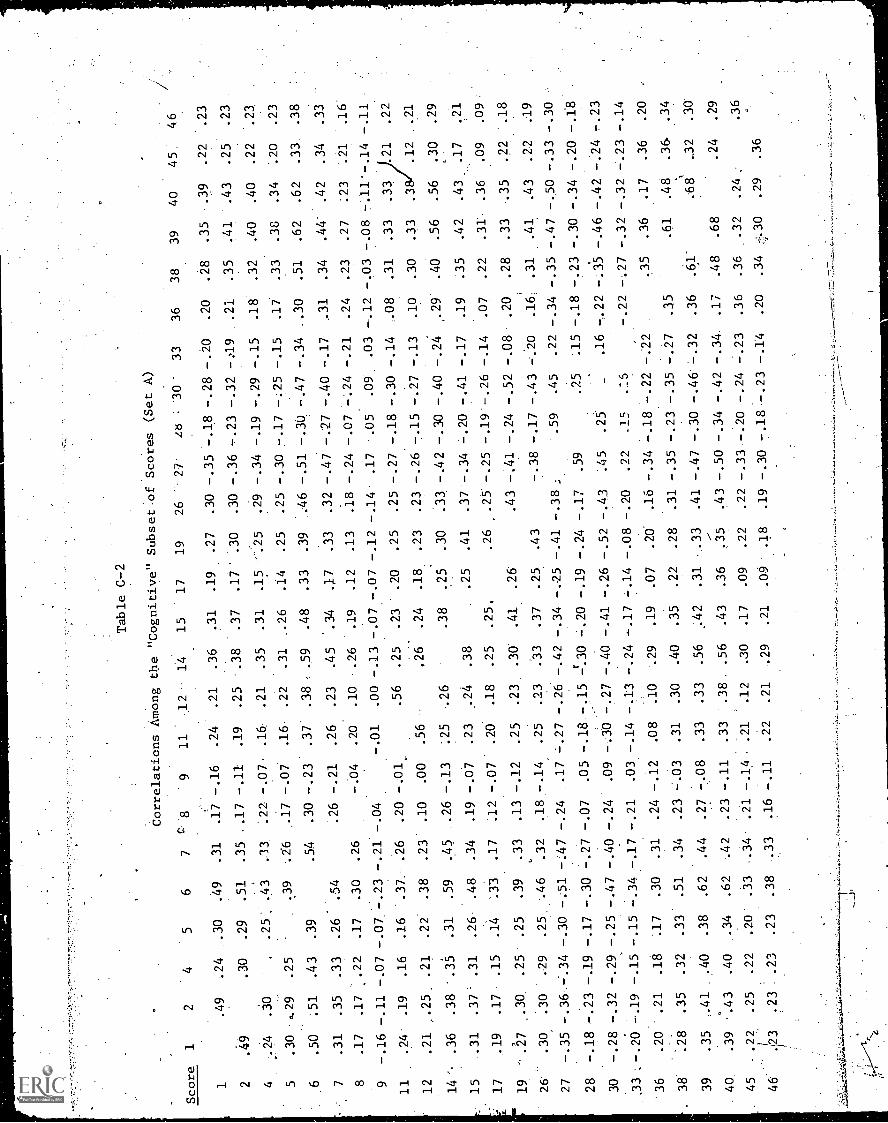
Table C-2
Correlations'Among the "Cognitive"
Subset-of Scores (Set A)
Score
12
45
67
89
11
12- 14
15
17
19
26
27
Lb
:'30-
33
36
38.
39
40
45.
46.
1.49
:24
.30
.49
.31
.17
--.16
.24
.21
.36
.31
.19
.27
.30 -.35-.18
-.28
-.20
.20
.28
.35
.39
.22
.23
2.49
.30
.29
.51
.35
..17
-.11
.19
.25
.38
.37
.17' .30
.30 -.36
-.23
-.32
-:19
.21
.35
.41
.43
.25
.23
4...24
.30
.
.25
.43
-33
.22
-.07
.16-
.21
.35
.31
.15
.25
.29 -.34
-.19
-.29
-.15
.18
.32
.40
.40
.22
.23
5.30
0.29
.25
..17
-.07
.16-
.22
.31
..26
.14
.25
.25 -.30
7.17
-;25
-.15
.17
.33
.38
.34
.20
.23
.6
.50
;51
.43
.39
.54
.30-.23
.37
.38, .59
.48
.33
.39
:46 -.51-.30
-.47
-.34
..30
.51
.62
.62
.33
.38
7.31
.35
.33
.26
.54
.26
-.21
.26
.23
.45
'.34
.17
.33
.32 -.47
-.27
-.40
-.17
,31
.34
.44'
.42
.34
.33
8.17
.17
.22
.17
.30
.26
-.04
.20
.10
.26
.19
.12
.13
.18 -.24
-.07-..24
-.21
.24
.23
.27
:23
.21
.16
9-.16
-.11
-.07
-.07
-.23 -.21
-.04
-.01
.00 -.13
-.07
-.07 -.12
-.14- .17
.05
.09
.03-.12
-.03
-.08
7.11'-.14
-.11
11
.24.
.19
.16
.16
.37.- .26
.20
-.01,
.56
.25
.23
.20
.25
.25 -.27
-.18
-.30
-.14
-08
.31
.33
.33
.21
.22
12
.21
,..25
.21
.22
.38
.23
.10
.00
.56
-.26
.24
.18
.23
.23 -.26
-.15
-.27
-.13
.10
.30
.33
.3
.12
.21
14' .36
.38
.35
.31
.59
.45
..26-.13
:25
..26
.38
.25
.30
.33 -.42
-.30
-.40
-.24
.29
.40
.56
.56
.30
.29
15
.31
.37
.31
.26.
.48
.34
.19
-.07
.2324
.38
.25
.41
.37 -.34
7.20
-.41
-.17
.19
:35
.42
.43
.17
.21
17
.19
.17
.15
.14
'.33
.17
:12
-.07
.20
.18
.25
.25.
.26
.25 -.25
-.19.-.26
-.14
.07
.22
.31.
.36
.09
.09
19 -.7
,.30.
.25
.25
.39
.33
.13
-.12
.25
.23. .30.
.41
.26
.43 -.41
-.24
-.52
-.08
.20
.28
.33
..35
26
.30
.30
.29
.25..46
.32
.18,-.14
.25
.23
.33
.37
.25
.43
-.38
-.17
-.43
-..20
.16:
.31
.41
.43
.22
.19
27
-.35
-.36.-..34
-.30
-:51 -.47
-.24
,.17
;-.27-.26 -.42
-.34
-.25 -.41
-.38;
.59
.45
.22
-.34
-.35
-.47
-.50
-.33
-.30
28
-.18
-.23
-.19
-.17
-.30 -.27
-.07
.05
-.18
-.15 2.30
-.20
-.19 -.24
-.17
.59
.25
:15
-.18
-.23
-.30
-.347.20
-.18
30
-.28
-.32
-.29
-.25
-.47 -.40
-.24
.09
-.30
-.27 --.40
-.41
-.26 -.52
-.43
:45
.25
.16-,22
-.35
-.46
-.42
-.24
.23
33
:-.20
-.19
-.15
-.15-.347.17
-.21
.03-.14
-.13 -.24
-.17
.14 -.08
-.20
.22
.1c
.:5
-.22
-.27
-.32
-.32
-..23
-.14
"36
.20
".21
.18
:17
.30
.31
.24
-.12
.08
.10
.29
.19
.07
.20.
.16 -.34
-.18
-.22
.35
.36
.17
.36
.20
38
.28
.35
.32
.33
.51
.34
.23-.03
.31
.30
.40
.35
.22
.28
.31 -.35
-.23
-.35
-.27
.35
.61
.48
.36
.34
39
.35
,41
..40
.38
.62
.44
.27-.08
.33
.33
.56
,42
.31 --33
.41 -.47
-.30
-.46.7.32
.36
.61'
..68
1
-32
.30.
.40.
.39.43
.40
.34
.62
.42
.23-.11
.33
.38
.56
.43
.36
.35
.43 -.50
-.34
-.42
-.34.
.17
.48
.68
.24
.29
45
.22
I
.25
.22
.20
.33
-.34.
.21
-.14,
.21
.12
.30
.17
.09
.22
.22 -.33
-.20
-.24
-.23
.36
.36
.32
.24..
.36
46
.23
1
.23
..23
.23
.38
.33
.16
-.11
.22
.21
.29
.21
.09
.18
.19 -.307.18-.23
-.14
.20
.34
.29
.36
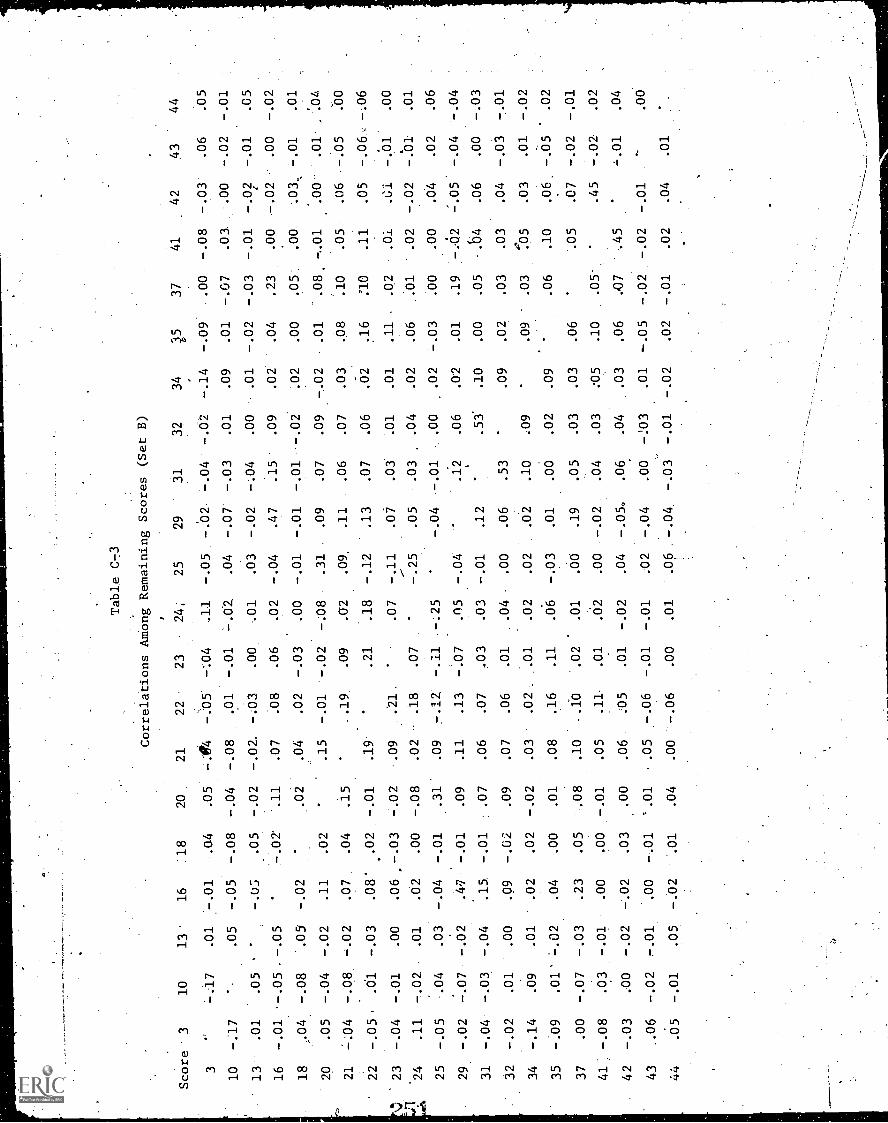
Table C73
Scor
e3
10l3
'16
1820
Cor
rela
tions
Am
ong
Rem
aini
ng S
core
s (S
et B
)
2122
2324
,25
2931
3234
3537
4142
4344
3-.
17.0
1.-
.01
.0.4
.05
-.94
-.05
--.0
4.1
1-.
05-.
02.'-.
04-.
02-.
14-.
09.0
0-.
08-.
03.0
6. 0
5
10-.
17-
.05
-.05
-.08
-.04
-.08
..01
-.01
:-.0
2..0
4-.
07'
-.03
.01
.09
.01
-.07
.03
.00
-.02
-.01
13.0
1.0
5.
'-.
0;.0
5-.
02-.
02.
-.03
.00
.01
.03
-.02
-.04
.00
.01
-.02
-.03
-.01
-.02
-.01
.05
16-.
01'-'
05-.
05-.
02.1
1.0
7.0
8.0
6.0
2-.
04.4
7.1
5.0
9.0
2.0
4.2
3:0
0-.
02.0
0-.
02
18.0
4-.
08.0
5-.
02.
.02
.04
.02
-.03
.00
-.01
-.01
-.01
-.02
-.0
2.0
0.0
5.0
0..0
3,-.
01.0
1
20.0
5-.
04-.
02.1
1.0
2.
.15
-.01
-.02
-.08
.31
.09
.07
.09
-.02
.01
,08.
.01
.00
.01.
,.0
zi
21-.
047.
08-.
02.0
7.0
4.1
5.1
9.0
9.0
2.0
9,.1
1.0
6.0
7.0
3.0
8.1
0.0
5.0
6-.
05.0
0
2.2
-.05
..0
.1-.
03.O
8'..0
2-.
01.1
9.2
1.1
8-.
12.1
3.0
7.0
6.0
2.1
6:1
0.1
1.0
5-.
06-
-.06
23-.
04-.
01.0
0.0
6,-.
03-.
02.0
9.2
1.
.07
-.11
.07
.03
.01
.01
.11
.02
.0i
.ei
-.01 .
.00
.
24.1
1-.
02.0
1.0
2.0
0-.
08.0
2-
.18
.07
-.25
.05
.03
.04
.02
.06
.01
.02
-.02
-.01
.01
25-.
05..0
4.0
3-.
04-.
01.3
1.0
97
. 12.
-.11
-.25
.-.
04-.
01.0
0.0
2-.
03.0
0.0
0.0
4.
.02
.06
29-.
02-.
07-.
02.4
7.
-.01
.09
.11
.13
-.07
.05
-.04
..1
2.0
6.0
2.0
1.1
9-.
452
:.05
-.04
-.04
31-.
04-.
03-.
04.1
5-.
01.0
7.0
6.0
7.0
3.0
3-.
01.1
2.
.53*
.10
.00
.05
- .b
4.0
6.0
0-.
03
32-.
02.0
1.0
0.0
9-.
02.0
9.0
7.0
6.0
1.0
4.0
0.0
6.5
3.0
9.0
2.0
3.0
3.0
4-.
03-.
01
34-.
1409
.01
.02
.02
-.02
.03
.02
'.01
.02
.02
.02
.10
.09
.09
.
.03
fos
.03
.01
-.02
'
35-.
0901
':-
.02
.04
.00
.01
.08
.16
.11
.0.6
-.03
.01
.00
.02
.09
.06
.10
.O6.
-.65
.02
37.0
0-.
07-.
03.2
3.0
5.0
8.1
0'
.10
.02
.
.01
.00
.19
.05
.03
.03
.06
.05
.07
-.02
-.01
41-.
08.0
3-.
01.0
0.0
0-.
01.0
5.1
1.0
0.0
1.0
2-.
02.0
4.0
3:0
5.1
0.0
5-.4
5-.
02.0
2
42-.
03.0
0-.
02-.
02.0
3.0
0.0
6.0
5.0
1-.
02.0
4-.
05.,
.06,
.04
.03
.06
.07
.45
.01
.04
43..0
6-.
02.0
1.0
0-.
01' .
01.0
5-.
06-.
01-.
01.0
2-.
04.0
0-:
03.0
1-.
05-.
02-.
02-.
01.0
0'
44
.65
-.01
.05
-.02
.01
.04
.00
-.06
.00
.01
.06
-.04
-.03
-.01
-.02
.02
-.01
.02
.04
.01
.
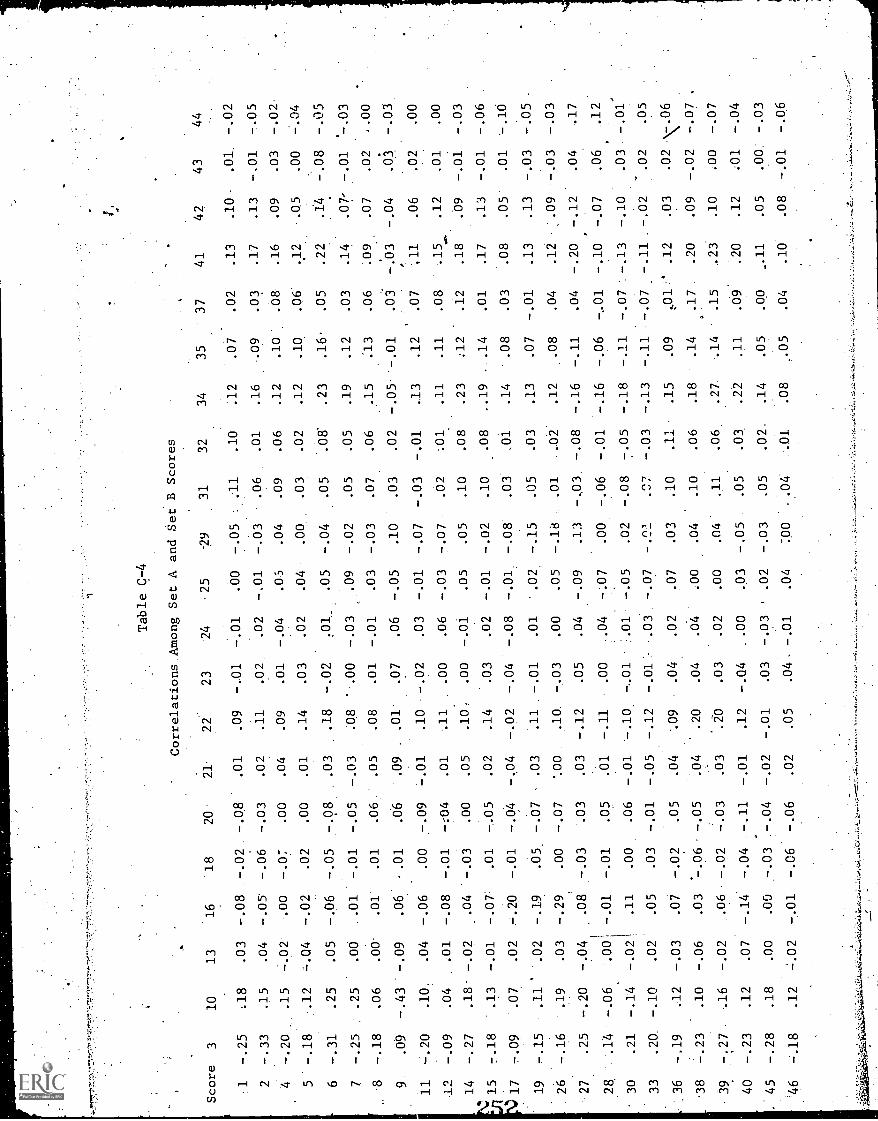
Table C -4
Correlations. Among Set A and Set B Scores
Score
310
13
16
'18
20
21.
22
23
24
.25
-29
31
32
34
35
37
41
42
43
44
1-.25
:18
.03
-.08
-.02
-.08
.01
.09
-.01
-.01
.00
-.05
Al
.10
.12
.07
.02
.13
.10
.01
-.02
2-.33
.15
.04
-.05
-.06
-.03
.02
.11
.02
.02
-.01
-.03
.06
.01
.16
.09
.03
.17
.13
-.01
-.05
4-.20
.15
-.02
.00
-.07
.00
.04
.09
.01
-.04
.05
.04
.09
.06
.12
.10.
.08
.16
.09
.03
-.02-
5-.18
.12
=.04
-.02
.02
.00
.01
.14
.03
.02
.04
.00
.03
.02
.12
.10
.06
.12
.05
.00
-.04
6-.31
.25
.05
-.06
-.05
-.08
.03
.18
-.02
.01.
.05
-.04
.05
.0T
.23
.16
.05
.22
.14
-.08
-.05
7-.25
.25
.00
.01
-.01
-.05
-.03
.08
.00
-.03
.09
-.02
.05
.05
.19
.12
.03
.14
.07'
-.01
'-.03
-8
-.18
.06
.00
.01
.01
.06
.05
.08
.01
-.01
.03
-.03
.07
.06
.15
:13
.06
.09
.07
.02
..00
9.09
-.43
-.09
.06
..01
.06
.09
.01
.07
.06
-.05
.10
.03
.02
-.05
-.01
.03
-.03
-.04
.03
-.03
11
-.20
.10.
.04
-.06
.00
-.09
-.01
.10
-.02
.03
-.01
-.07
-.03
-.01
.13
.12
.07
,11
.06
.02
.00
12
-.09
.04
.01
-.08
-.01
-:04
.01
.11
.00
.06
-.03
-.07
.02
.01
.11
.11
.08
.15
.12
.01
.00
14
-.27
.18
-.02
.04
-.03
.00
.05
.10,
.00
-.01
.05
.05
.10
.08
.23
:12
.12
.18
.09
-.01
-.03
15
7.18
.13
-.01
-.07
.01
-.05
.02
.14
.03
.02
-.01
-.02
.10
.08
..19
...14
.01
.17
.13
-.01
-.06
17
-.09
.07
.02
-.20
-.01
-.04
-.04
-.02
-.04
-.08
-.01
-.08
.03
.01
.14
.08
.03
.08
.05
.01
-.10
19
-.15
.11'
.02
-.19
.05.
-.07
.03
.11
-.01
.01
'.02
-.15
.05
.03
.13
.07
-.01
.13
.13
-.03
-.05
26
-.16
.19
.03
-.29
.00
-.07
%00
.10
-.03
.00
.05
-.18
.01
.02
.12
.08
.04
.12
.09
-.03
-.03
27
.25
-.20
-.04
.08
-.03
.03
.03
-.12
.05
.04
-.09
.13
-,03
-.08
-.16
-.11
.04
-.20
-.12
.04
.17
28
.14
-.06.
.001
-.01
-.01
.05
.01
-.11
.00
.04
-:07
.00
-.06
-.01
-.16
-.06
-..01
-.10
-.07
.06
.12
30
.21
-.14
-.02k
.11
.00
.06
-.01
-.10
-,01
.01
-.05
.02
-.08
-.05
-.18
-.11
-.07
-.13
-.10
.03
-.01
33
.20
-.10
.02
.05
.03
-.01
-.05
-.12
-.01
-.03
-.07
-.^1
.C7
-.03
-.13
-.11
-.07
-.11
-.02
.02
.05
36
-.19
.12
-.03
.07
-.02
.05
.04
'.09
.04
.02
.07
.03
.10
.11
.15
.09
..01.
'
.12
.03
.02\.Q6
-38
-.23
.10
-.06
.03
-.05
.04
.20
.04
.04
.00
.04
.10
.06
.18
.14
..17
.20
.09
-.02
-.07 .
39
-:27
.16
-.02
.06
-.02
-.03
.03
..20
.03
.02
.00
.04
.11
.06
.27
.14
.15
.23
.10
.00
-.07
40
-.23
.12
.07
-.14
-.04
-.11
-.01
.12
-.Q4
..00
.03
-.05
.05
.03
.22
.11
.09
.20
.12
.01
-.04
45
-.28
.18
.00
.00
-.03
-.04
-.02
-.01
.03
-.03
'
.02
-.03
.05
.02.
.14
.05
.00
_.11
.05
.00
-.03
46
-.18
.12
-.02
-.01
-.06
-.06
.02
.05
.04
-.01
.04
:00
.04
.01
.08
.05
.04
.10
.08
-.01
-.06
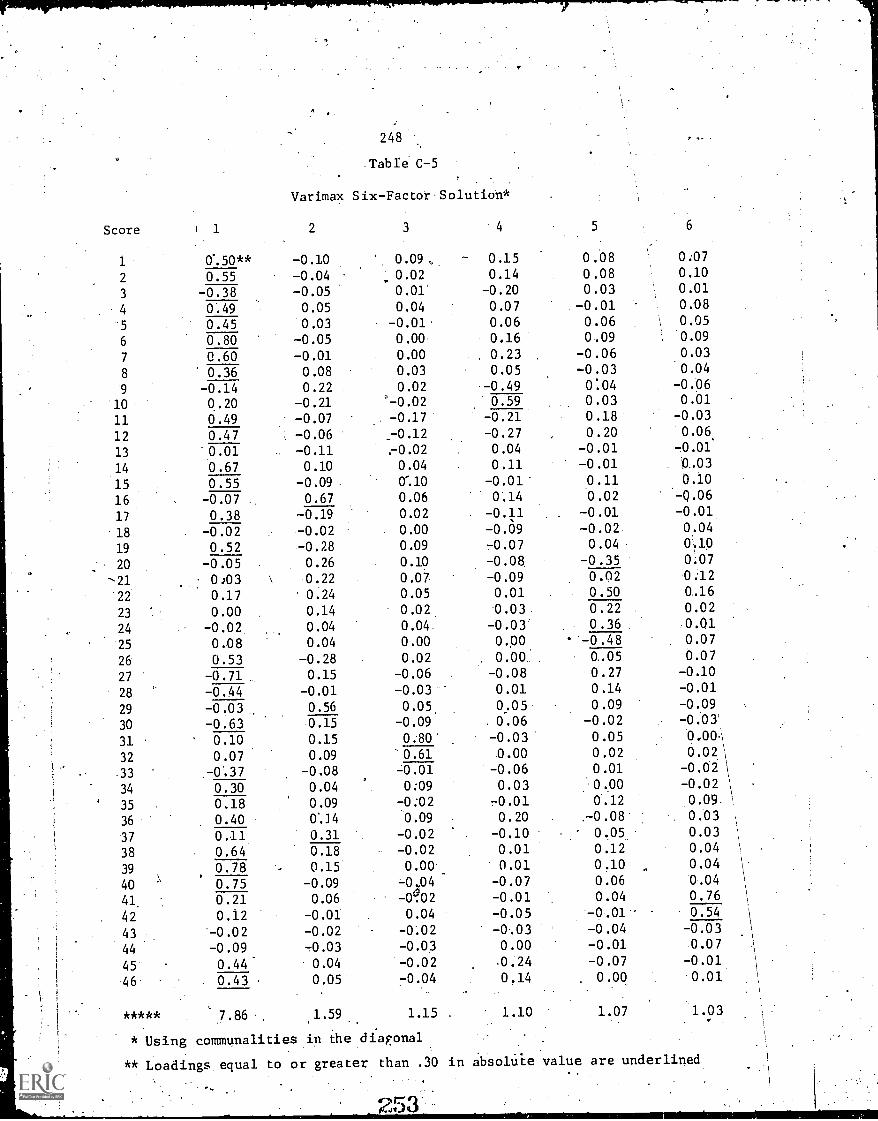
248',
.TabIe. C-5
Varimax Six-Factor. Solution*
Score 1 2 3 4
1 0%50** -0.10 0.09, 0.15 0.08 0.07
2 0.55 -0.04 0.02 0.14 0.08 0.10
3 -0.38 -0.05 0.01 -0.20 0.03 0.01
4 0.49 0.05 0.04 0.07 -0.01 0.08
'5 0.45 0.03 -0.01' 0.06 0.06 0.05
6 0.80 -0.05 0.00 0.16 0.09 0.09
7 0.60 -0.01 0.00 0.23 -0.06 0.03
8 0.36 0.08 0.03 0.05 -0.03 0.04
9 -0.14 0.22 0.02 -0.49 0:04 -0.06
10 0.20 -0.21 0-0.02 0.59 0.03 0.01
11 0.49 -0.07 -0.17 -0.21 0.18 -0.03
12 0.47 -0.06 -0.12 -0.27 0.20 0.06.
13 0.01 -0.11 .-0.02 0.04 -0.01 -0.01
14 0.67 0.10 0.04 0.11 -0.01 0.03
15 0.55 -0.09 0%10 -0.01 0.11 0.10
16 -0.07 0.67 0.06 0.14 0.02 -Q.06
17 0.38 -0.19 0.02 -0.11 -0.01 -0.01
18 -0.02 -0.02 0.00 -0.09 -0.02. 0.04
19 0.52 -0.28 0.09 -0.07 0.04 0.10
20 -0.05 0.26 0.10 -0.08 -0.35 0.07
-21 0.,03 0.22 0.07 -0.09 0.02 0.12
22 0.17 0.24 0.05 0.01 0.50 0.16
23 0.00 0.14 0.02 0.03 0.22 0.02
24 -0.02 0.04 0.04. -0.03 0.36 0.01
25 0.08 0.04 0.00 0.00 -0.48 0.07
26 0.53 -0.28 0.02 0.00 0.05 0.07
27 -0.71 0.15 -0.06 -0.08 0.27 -0.10
28 -0.44 -0.01 -0.03 0.01 0.14 -0.01
29 -0.03 0.56 0.05 0.09 -0.09
30 -0.63 0.15 -0,09 0.06 -0.02 -0.03
31 0.10 0.15 0.80' -0.03 0.05 MO.\
32 0.07 0.09 '0.61 0.00 0.02 0.02
-0.01.
33 -0,37 -0.08 -0.06 0.01 -0.02\
34 0.30 0.04 0:09 0.03 0.00 -0.02
35 0.18 0.09 -0:02 -0.01 0.12 0.09.
36 0.40 0.34 0.09 0.20 -0.08 0.03
37 0.11 0.31 -0.02 -0.10 0.05 0.03 \
38 0.64 0.18 -0.02 0.01 0.12 0.04
39 0.78 0.15 0.00 0.01 0.10 et 0.04
40 0.75 -0.09 -0.04 -0.07 0.06 0.04
41. 0.21 0.06 -0q02 -0.01 0.04 0.76
42 0.12 -0.01 0.04 -0.05 -0.01 0.54
43 -0.02 -0.02 -0.02 -0.03 -0.04 -0.03
44 -0.09 -0.03 -0.03 0.00 -0.01 0.07
45 0.44 0.04 -0.02 0.24 -0.07 -0.01
46 0.43 0.05' -0.04 0.14 . 0.00 0.01
***** 7.86 ,. 1.59 1.15 . 1.10 1.07 1.03- .
* Using communalities in the diagonal
** Loadings. equal to or greater than .30 in absolute value are underlined
253
APPENDIX D
PROJECT PERSONNEL FOR THE 1971-72 STUDY YEAR
254
251
Appendix D %
Project '!ersonnel for the 1971-72 Study Year
Project Director: Virginia C. Shipman
Assistant Director: David R. Lindstrom
ETS Administrative Advisory Committee: Herman F. Smith (ChairmanRobert L. Linn
Administration:
Executive Assistant: Susan Simosko
Administrative Assistant: James Towery
Coding Supervisor: Joan TysonFinancial Coordinator: Carol McKnight
Contract Consultants: Charlotte Farley, Gretchen Allen.
Field Operations:
Lee County, AlabamaTechnical Consultant: ,Ray PhillipsLocal Coordinator:. CarolynITamblynTesters and Classroom Observers
Portland, Oregon .
Local. Coordinators: Norma Hannam, Barbara Kerns
Testers and Classroom Observers
Trenton, New JerseyProject Liaison: Joyce Gant
Classroom Observers
Research:0
Marianne Amarel, Scarvia Anderson, Anne Bussis, Edward Chittenden,
Diran Dermen, Walter Emmerich, Robert Feldmesser, Lynn Gilbert,
.Carolyn Massad, Masako Tanaka, William.Ward, Ihor Wynnyckyj
Analysis:
Specialist for Design and Analysis: Albert E. Beaton
Coordinator of Analysis: John L. Barone
Assistants for Analysis: Thomas F. Dwyer, Norma Hvasta,Robert Patrick, Emily White
4
BIBLIOGRAPHY
Baldwin, A. L., Kalhoin,. J., 1-Breese, 'F. H. The appraisal of parent
behaviOr. Psychological Monographs, 1949, 63 (4, Whole No. 299),
Beaton, A. The use of special matrix operations in statistical calculus.
Princeton, N. J.: Educational Testing Service, 1964, RB-64-15.
Beery, H. E. Developmental Test of Visual-Motor Integration: Administration
and Scoring Manual. Chicago: Follett Education Corporation, 1967.
Beery, H. E. Visual-Motor Integration: Monograph. Chicago:. Follett
Educational Corporation,-1967.
Bereiter, C.,. & Engelmann, S. Teaching disadvantaged children, in the preschool.
Englewood-.Cliffs, N. J.: Prentice-Hall, 1966.
Bever, T. G. The nature of cerebral dominance in speech behavior of the
child and adult. Mechanisms of Language Development. New York: Academic
Press, 1970.
Birch, H. G., & Lefford, A. Intersensory development in children. Monographs
of the Society for Research in Child Development, 1963, 28 5, Serial
No. 89).
Birch, H. G., & Lefford, A. Visual differentiation; intersensory integration,
and voluntary motor control. Monographs of the Society for Research inChild Development, 1967, 32 (2,, Serial No. 110) .
Brown, B.' The assessment of self-concept among four-year-old Negro and white
children: A comparative study using the Brown IDS Self-Concept Referents
Test. Paper presented at the Eastern Psychological Association Meeting,
New York City, April 1966.
Brown, B. Personal communication, 1967.
Bruner, J. S., Olver, R. R., & Greenfield, P. M. Studies in cognitive growth.
New York: Wiley, 1966.
Buktenica, N. A. Relative contributions of auditory and visual perception to
first grade language learning. Unpublished doctoral dissertation,
University of Chicago, 1966.
Campbell, D. T.,1 Fiske,' D. W. nvergept and discriminant validation by the
multitrait- multimethod matrix. Psychological'Bulletin, 1959, 56, 81-105.
Carlson, A. B. Criteria for farm managers (Doctoral dissertationUniversity of Illinois) Urbana, Illinois: Uniyersity Microfilms, 1968
No. 68-1718.-,
253
.254
Carson; A. S., & Rabin, A. Verbal comprehension and communicati6n in Negro
and white children. Journal of Educational Psychology, 1960, 51, 47-51.
Cazden,.C. Some implications of research on language development for preschool
education. In Hess, R. D. & Bear, R. M. (Ed.), Early Education: Current
Theory, Research, and Practice. Chicago: Aldine Publishing Co., 1968.-
131-142.
Chase, C. I., & Pugh, R. C. Social class and performance on an intelligence
test. Journal of Educational Measurement, 1971, 81 (3), 197-202.
Clark, E. Ozenhosky, R. J., Barz, A. I.,. & O'Leary, J. V. Self-Concept
and vocabulary development in Negro and white preschool children. Paper,
presented.at the Eastern Psychological Assboiation Meeting, Boston,
April 1967.
Coates, S. W. Preschool Embedded Figures Test. 1969.
Coats, S., & Braumberg, P. M. The'factorial structure of the WPPSI between
the ages of 4 & 6 1/2. Unpublished study.
Cohen, J. The factor structure of the WAIS between early adulthood and old
.age. Journal of Consulting Psychology, 1.9.57, 24 283-290.
Cohen, J. The factorial structure of the WISC at ages 7-6, 10-6, and 13-6.
Journal of Consulting Psychology, 1959,.23, -285 -299.-.7777
Cooperative Tests and Service. Preschool Inventory Revised Edition.- 1970:
Handbook.. Princeton, N. Educational'Testing Service, 1970.
Cronbach, L. J. Essentials Of psychological testing.
Brothers, 1960.
New York: Harper &'
Damarinr,F. L., Jr., & Cattell, R. B. Personality factors in early childhood
ancrtheir relation to intelligence: Monographs of the Society for
Research in Child Development, 1968, 33 (6, Serial No. 122).
DeVries, R. .Constancy of generic identity in the years-three Qo sixty
Monograph of the Society for Research in Child Development, 1969, 34,
-(3, Serial No. 12').
Dunn, L. M. Expanded Manual for the Peabody Picture Vocabulary Test. Circle.
Tines, Minn.: American_Guidance Service,.1965.
"Educational Testing Seririce. Disadvantaged children and their first schol.
experiences: Theoretical considerations and measurement strategies.
. Princeton, N. J.: ETS, December 1968, PR-68-4. Prepared under
OEO.Contract 4206 and OED Grant C6-8256.
9M.7

I
255
Educational Testing Service.. Discrivantaged children and their first, schodlexperiences: From theory t perations. -PrinCeton, N. J.: ETS,
August 1969, PR-69-12 (2 Vols.).- Prepared under Grant H-8256, Departmentof Health, Education, and Welfare.
Educational Testing Service. Disadvantaged children and their first schoolexperiences: Preliminary description of the initial sample prior toschool enrollment."- Princeton, N. J.: ETS, August 1970, PR-70-20 (2.Vols.).Prepared under Grant CG-8256, Department of Health, Education, and Welfare.
,
Emmerich, W. Personality development and concepts of structure.' ChildDevelopment, 1968, 359, 671-690. :
.
Emmerich, W.' Disadvantaged children and their first school exberiences:..Structure and development of personal-social behaviors in preschoolsettings. Princeton, N. J.: Educational Testing Service, 1971,PR-71-20. Prepared under Grant H-8256,. Department of Health, Education,and Welfare.
Eska, B., &'Black, K. N. Conceptual tempo in young children. Child Develop-ment, 1971, 42, 5057516, j .
Ferguson, G. A. ,On learning and human ability. Canadian Journal of Psychology,1954, 8, 95-112. .
Ferguson,. C.. A. On transfer and the abilities of man. Canadian Journal ofPsychology, 1956, 10, 121-131:
Flavell, J. H. Developmental psychology of Jean Piaget. Pri1lcetLn, N. J.:Van Nostrand, 1963.
Fraser, C., Bellugi, U., & Brown,' R. Control of grammar in imitationcomprehension, and production. Journal of Verbal Learning and VerbalBehavior, 1963, 2, 121-135.
Frostig, M., Maslow, P., Lefever, D. W., & Whittlesly, J. B The MarianneFrostig Developmental Test of Visual Perception: 19631 standardization.Palo Alto, California: Consulting Psychologists PresS, 1964.
Garrett, H. E. A developmental theory of intelligence. Anerican Psychologist, .
1946, 1, 372-378.
'Goldberg,' S., Godfrey, L., & Lewis, M. Play behavior in he year-old .:nfant:Early sex differences...paper presented at,tlie Society for'Research.inChild- DevelOpment. Meeting, New. York, March 1967. /
,
'Goodenough, D. R., & karp, S. A. Field dependence and intellectual functioning.Journal of Abnormal and Social'Psychology, 1961; 63, 241-246.
Gordon, G.-.!
Personal correspondence; 1969.
Golden, M., Birns, B., Bridger,..W., & Moss, A. Socialclasa and .
differentiationAn.tOgnitive development among black preschool children..'Child Development, 1971,42, 37-45.
258
lt
e
256
Guilford, J. P. The nature of human intelligence. New York:. McGraw-Hill,
1967.
Halveraoh,.C.1., Jr., & Waldrop, M. F. Maternal behavior toward own and
other preschool children: The problem of "awnness.". Child Development,
1970,.41,' 839-845.
Hess, R.. D., & Shipman, V. C. Early experience and the socialization of
cognitive Modes in children. Child Development, 1965, 36; 869-886.
Hess R. D., Shipman, V. C., Brophy, J. E., & Bear, R. M. _The cognitiveenvironments of urban preschool children. Chicago: University' of
Chicago Press, 1968.
Hess, R. D., Shipman, V. C., Brophy, J. E., &.Bear,.R. M. The cognitive
environments of urban preschool children: Follow-up phase. Chicago:*
University. of Chicago Press, 1969.
Hildreth,'G. ., Griffithi, N. McGauvran, M. E. Metropolitan._ leadiness
Tests, Form. A. New York: Harcourt, Brace, and World, Inc., 1965.
Hunt, J. M. Intelligence and Experience. New York: 'Ronald Press, 1961.
Hurst, J. G. A factor analysis of the Merrill-Palmer with reference totheory and test construction. Educational and Psychological Measurement,
1960, 20, 519-532.
Kagan, J. Reflection impulsivity and reading ability in primary grade
chilcl-en. Child Development, 1965, 36, 609-628.
Kagan, J., & Lewis, M. Studies of attention in the human infant. Merrill -
Palmer. Quarterly, 1965, 1195-127.
Kagan,. J., Moss, H. A., & Sigel, 1.'E. ',Psychological significahce of stylesof conceptualization. In J. C. Wright and >Tr: Kagan (E4s.), Basic .
cognitive processes in children. Monographs'of the.Society for Research
in Child Development, 1963, 28 (2, Serial. No. .86.;, 73-112.
Kagan, J., Pearson, & Welch, L. Conceptual .impulsivity and indUctiVe-.,
reasoning. :Child' Development, 1966, 37, 583-594.
Kagan, J., Rosman, B. L., Day, D., Albert, J., & Phillips, W. Information
'processing in the child: Significance of analytf and reflection attitudes .
Psychological Monographs, 1964, 78 (1, Whole No.. 578).
Kdrp,S, A. 'Field dependence .and overcoming embeddedness. Journal of
, *. Consuming Psychology, ,1963q 27, 294-302.
4.! .7 , .
Katz,..1:- A catalogue of personality amOroaChes to Negrb.performance with.' research suggestions. JoUrhal of Social Issues, 19'69, 30, 13-28.
i. : Katz', J..
Y. Reflect on-impulsivity and color-form:sorting. Child Development,C
.
1977.,,42,'745-7 4..
../ .
h Val
MIlomallsMleink
257
Keeney, T. Young .childreWs.imitation of nonsense syllable strings, wordstrings, and grammatical sentences. Unpublished papet. .Educational'Testing.Service, 1969.
Kephart, N. C. The slow learner in th.classroom. Columbus, Ohio:
Charles E. Merrill Books, 1960'.
-
leKirk, S. A.,McCarthy, J. J., & Kirk, W. D. Illinois Test of Psycholinguistic
Abilities. Revised Edition, Urbana, Illinois, University of Illinois,1968.
Kohlberg, L. Stages in" children's conceptions of physical and socialobjects in the Years four to eight.. Unpublished manuscript, 1966. (a)
. \
Kohlberg, L. A cognitive-developmental analysis of ohildren.'s sex-roleconcepts and attitudes. In E.. E. Maccoby-(Ed.), The. development of
sex .differences.. Stanford, Cal.: Stanford University Press, 1966.82-173. (b)
Kohlberg, L. Early education: A cognitive- developmental view. ChildDevelopment, 1968, 39,. 1013-1062'. .
Koppitz, E. M. The Bender-Gestalt Test for Young Children. .New York:Grune and Stratton, 1964. 4
Lenneberg, E. H. Biological foundations of language. New York:
Wiley, 1967.
Lesser, G. S6'Fifer, G., ;&Clarki D. H. Mental.abilities of children fromdifferent social -class and\cultural groups. Monographs:6f the Societyfor Research in Child Development,: 1965 30 (4, Serial:No. 102).
Lewin, K. ..Field theory in social science. New Harper and Row, 1951.
Lewis, M.- The .cardiac response during infancy, In R. F, ThoMpson and.M. M. Patterson (Eds.) Methods in Physiological PsychOlogy, Vol. 4...Recording of Biodiectric. Activity. New York: Academy,Press, in press.
,e.
(
Lewis, M. Individual differences in the measurement of cognitive development.In J. Hellmuth (Ed.), Exceptional ',Infant, Vol. 2. New York: Brunner/Mazel, Inc.., 1971, 172-211..
. \ #Lewis, M:, & Goldberg, S: Perceptual-cognitive development in infancy: A
generalized expectancy model as a function of the mother-infantinteraction. Merrill-Palmer Quarterly of'Behavior & Development,1969, 15 (1), 81-100.
Lewis, M., Goldberg, S., & Campbell, H. A developmental study' of.learning -.
within the first three, years 'of life:4pResponse deqement to,a'redundantsignal.' Monographs of The Society for Research in,Child.Development,1970, 34 (9; Serial No. 133).
I
258 ;
I,
Lewis,., Rausch, M., Goldberg, S., & Dod,.C. /Error, response time-an& IQ:,
Sex differences in Ole cognitive style of preschool children. :
.'Perceptual and MotorlSkills, 1968, 26,. 563-568.
. ,
..
.
Lingoes,. J. C. An IBM 70?0 program for.Guttma -Lingoes small space analyses:
-1. Behavioral Science, ',1965, 10, 18.3-184.f
Lobap, W. Language proficiency and school training.. In ,I. E. KrumbOltz (Ed.),/
Learning and the educational process. Chicago, Illinois: Rand McNally,
1965. ,
/ I
Lucco, A.. .Thecuriosity behavior ol four-yar-old children: An exploratory
,study. Unpublished doctoral dissettat'on, University of Chicago, 1964.
Maccoby, E. E. What copying requires. Pa eiPresented at the mee ings of. .
the.Amer'ican Psycho ogical Associatio , Washington, D. C.1 SePtember 1967.
.
\
MacCoby, E. E., Dv ley` .:M., Hapan, J; WI, & Degerman, R. ActiVity level
and intellectual fuTtioning in no/ma preschool Children. /Child
Development, 1965, 36, 761-770. °/ \
1 /
Massari, D., Hayweiser, L., & Meyer,'W. Ac ivity level and intellectual
functioning in. depri ed preschool chil ren. DevelopmentaLPsychology,
.1969, 1, 286,290. c /
1
McCar'.:in, SisterRose.Ama a,.& Meyers, C.I.F. An exploration oi six semantic,
... ^ ,,,I.
'factbrs at first grade. MultivariateBeh vioral Research 1966, 1, 74-94.
. \ .1
,
McGaw, ., & JUreskog, K. G. Factori..
al invaria qe of,abilitypmeasures,in,-,
..gr ups differing-in intelligence and socio conomic status.-, Pr'nceton, N. J:: Ed cational Teting Sery ce4.1970, R13770-6.37-
McNemar,M. The revision f the Stanford-Binet S ale. BostOn: Houghton
: -. Mifflin, 1942.
\
1
Melton, R. S., Charlesworth, R., Tanaka, M. N,, Ro henbeg,i13. B., Pike, L.. W.,, .-
Bussis, A.'M., & Golli , E. S. Cognitive gro th in .prschool children..
Paper presented at the meetings of the-America Educational Rez.,earch
Association, Chicago' , February _1968. (Also ET Reseaxch Memorandum
. \ 68-43, Princeton, N. J1: Educational Testing S rviCei 1968.),,, .-,
,. \ , -.._..... ;
I
lljesser, S. Deflection-impu sivity:. stability'and sc ool Tailure.
\ Journal ofEduCationalTsy hology, 1970, 61,'487 490.1..: ,
\I-.
...Messick, S. Childrensa-'cogn4.ti e and perceptual &level pment. .In disadvantaged
\.. children and their firs school experiences: The re4Cal.considerations
\
and measurement atrate0,e6,.V Jolume 1., Princeton, .11. Educational
Testing-SerVice, -ncemblr, 1968, PR-68-4. Prepare \Under 0E0 Contract'
4206 and-Grant CG-825G, Pffice of Economic Opportun4y (ED 043 397.Y. :
I \l' /
259
Meyer, W. J. Personal communication, 1971.
Meyer, W. J. The development of representational competence. Paper presentedat Convention of International Society of the Study of BehavioralDevelopment, Nijmegen, The Netherlands, July, 1971.
Meyers, C. E., Dingman, H. F., Orpet, R. E., Sitker, E. G., & Watts, C.. A.Four ability-factor hypotheSes at three preliterate levels in normaland retarded children. Monographs of the Society for Research inChild Development, 1964, 29 (5).
Meyers,. C. E., Orpet, R. E., Atwell, A. A., & Dingman, H. F. Primary abilitiesat mental age six. Monographs of the Society for Research in ChildDevelopment, 1962, 27 (Whole No. 82).
Millham,J., Jacobson, L., & Berger, S. Effects of intelligence, informationproCessing, and mediation conditions on conceptull learning-' Journalof Educational Psychology, 1971, 62, 293-299..:
Mischel, W. Preference for delayed reward and social responsibility.Journal of Abnormal and Social Psychology, 1961, 62, 1-7.
Mischel, Gilligan, C. Delay of gratification, motivation,for theprohibited gratification and responses to temptation. Journal ofAbnormal and Social Psychology, 1964, 69, 411 -417.
Mischel, W., & Metzner, R.. Preference for delayed reward as a function ofage; IQ, and-Iength of, delay interval. Journal of Abnormal and SocialPsychology, 1962, 64, 425-431.
Moss; H. A. Sex', age and state as determinants of mother-infant interaction..MerrillPalmer Quarterly, 1967,.13, 19-36.
Osborn, J. Teaching a teaching language to disadvantaged children. In.M. A. Brottman.(Ed.), Language remediation for the disadvantaged pre-
. school child. Monographs of the Society for Research in ChildDevelopment, 1968, 33, 36-48:
Parisi,'D.' Development of syntactic comprehension in presdhool children asa function of socioeconomic level. Developmental Psychology, 1971, 5,186-189.
Pavenstedt, E. A comparison of the child-rearing environment of upper-lower-and very low-lower class families. American Journal of Orthopsychiatry,1965, 35, 89-98.
Piaget, J. The psychology of intelligence. New York: Harcourt, Brace, 1950.
Piaget, J. The child's conception of numbers. New York: Humanities, 1952.
260
Potter, M. C., & Levy, E. I. Spatial enumeration without counting.
Child Development, 1968, 39,' 265-272.
Ramsey, P. H., & Vane, J. R. A factor analytic study ofIthe Stanford-Biupt
with young children: Journal of School Psychology,:1970 8, 278 -284.
Raph, J. B. Language develOpment in socially disadvantaged children.
.Review of Educational Research, 1965, 35, 389-400.
Rosenberg, L. A., Rosenberg, A. M., & Stroud,,M. The Johns Hopkins Perceptual
Test: The development of a rapid-intelligence test for the preschool.
child. Paper presented at the meetings of the Eastern Psychological
Association, New York, April 1966.
Rotter, J. B. Generalized expectancies for internal versus external control
of reinforcement.' Psychological Monographs: General and Applied,
1966, 80, (1, WhOle No. 609),.
Settler, J. M., & Theye, F. Procedural, situational, & interpersonalvariables in individi7a1 intelligence testing. Psychological Bulletin,1967, 68, 347-360.
Sigel, I.- E,' Developmental trends in the abstraction ability of children.ChildDevelopment, 1953, 24, 131-144.
Sigel, I. E The dominance of meaning. Journal of Genetic Psychology, 1954,
85, 20..-207.
Sigel, I. E. Styles of categorization in elementary school children: The
role of sex differences and anxiety level. Paper presented at themeeting of the Society for Research in Child Development, Minneapolis,
.Minnesota, March, 1965.
Sigel, I. E. The distancing hypothesis: A hypothesis crucial to the
- development of representational competence. Paper presented at themeetings of the American. Psychological Association, 1968.
Sigel, I. E., Anderson, L. M., & Shapiro, H. Categorization behavior of
lower- and mlddle-class Negro preschool children: Differences in dealingwith representation of familiar objects. Journal of Negro Enucation,
,1966, 35, 218-229.
Sigel, I. E., & McBane, B. Cognitive competence and level of symbolization
among five-year-old children. In J. Hellmuth (Ed.), The disadvantagedChild, Vol. 1. Seattle, Washington: Spedial Child Publications, 1967,
435-453.
Sigel, I. E., & Olmsted, P. P. Modification of classificatory competence andlevel of representation among lower-class Negro kindergarten children.Report submitted to the Institute for Educational Developthent on researchsupported by 0E0 Head Start Subcontract No. 1410, November 1967.
(Mimeographed)
261
Sigel, I. E., & Olmsted, P. P. The development of classification and representa-tional cdrgpetence. Paper presented at K.he meeting of the American Edu-cational-Research Association, Chicago, February, 1968.
Sigel, I. E.) & Olmsted, P. P. Analysis of the Object Categorization Test andthe Picture Categorization Test for preschool children. Mimeo, nodate.
Slobin, D. I., & Welsh, C, A. Elicited imitation as a research ,tool indevelopmental psycholinguistics. An unpublished paper. University ofCalifornia at Berkeley,-.1967.
Stern,.C. Language competencies of young children. Young Children, 1966,22, 44-50.
Stevenson, H. W., Williams, A. M., Coleman,. E. Interrelations among learningand performance task in disadvantaged children.. Journal of EducationalPsychology, 1971, 62, (3), 179-184.
Stott, L. H.,Se Ball, R. S. Infant and preschool mental tests: review andevaluation. Monographs of the Society for Research in Child Development,1965, 30 (3, Serial No. 101). -a
Stutsman,.R, Guide for administering the Merrill-Palmer Scale'of Mental Tests.In Lewis M. Terman (Ed.),. Measurement and adjustment series. Part III.Mental Measurement of. Preschool Children. New York: Harcourt,. Brace,& World, Inc.,. 1931 and 1948. 139-262. Reprinted separately.
Tmenbaum, A. J. Social and Psychological Considerations in the Study ofthe Socially Disadvantaged. In P. A. Witty (Ed.), The Educationally
,Retarded and Disadvantaged. Sixty7sixth yearbook, Part I. Chicago, Ill.:National Society for the Study of Education, 1967, 45-63.
Thurstone, L. L. The nature of intelligence. New York: Harcourt, Brace &Company, 1926.
%
Thurstone, L. L. The nature of intelligence. New York: Harcourt, Brace,1950.
Tulkin, S. Race, class, family, and social achievement. Journal of PersonalitySocial Psychology, 1968, 9,.31 -37.
Wachs, T.,D., Uzgiris, S. C:, & Hunt, J. McV. Cognitive development in infantsof different age levels and from different backgrounds: An explanatoryinvestigation. Merrill-Palmer Quarterly, 1970, 17, (4), 283-317.
Ward, W. C. Reflection-impulsivity-in kindergarten children. Child Development,1968, 39, 867-874. (a).
Ward, W. C. Creativity in young children. Child Development, 1968, 39,7.37-754 (b).
4
262
Wasik, J. L., & Wasik, B. H. A comparative study of the-Wechsler Preschool
and Primary Scale of Intelligence (WPPSI) and the Wechsler Intelligence
Scale for Children (WISC) for culturally deprived children. Durham
Educational Improvement Program, 1970, 3, 157.
Weaver, S. J. Interim Report: Psycholinguistic abilities of culturally
deprived children. Unpublished manuscript. George Peabody College for.
Teachers, 1965.
Wechsler, D. ManUal for the Wechsler Preschool and.Primary.Scale of
Intelligence. New York: the Psychological Corporation, 1967..
Wechsler, D. Wechsler Preschool and Primary Scale of Intelligence
. New York: Psychological Corporation, 1967.
Weksel, W. Review of the "acquisition of language." (Monograph of the
Society for. Research in Child Development, 1964, 29). In Language, 1965,,,
41, 692-709.
Werner, H. Comparative-psychology of mental development. (Rev. ed.
New York: International Universities Press, 1957.
Wiley, R. C. The self-concept. Lincoln; Nebraska: University of Nebraska
Press, 1961.
Willerman, L., Broman, S. H.:& Fiedler, M, Infant delielopment, preschool IQ,
and social class. Child Development, 1970, 41, 69-77.
Witkin, H. A. Personal communication, 1971.
Witkin, H. A., Goodenough, D. R., & Karp, S. A. Stability of cognitive
style from childhood to young adulthood. Journal of Personality and
Social Psychology, 1967, 7, 291-300.
Witkin, H. A.,' Patterson', H. F., Goodenough, R., & Birnbaum, J. Cognitive
patterning in mildly retarded boys. Child Development, 1966,.37, 301-316.
Zigler, E. F. -Learning, development and social class in the socialization
process. In M. H. Marx (Ed.), Learning: Interaction. New York:
Macmillan, 1968.
- ,
Zigler, E. F., & Butterfield, 2: C. Motivational aspeCts.of IQ test
performance of culturally deprived nursery school children. .Child
Development, 1968, 39,. 1-14,