DOCUMENT RESUME AUTHOR Mitchell, Douglas E.; Destino, Tom; … · 2014-06-30 · DOCUMENT RESUME....
200
DOCUMENT RESUME ED 421 855 FL 025 347 AUTHOR Mitchell, Douglas E.; Destino, Tom; Karam, Rita TITLE Evaluation of English Language Development Programs in the Santa Ana Unified School District. A Report on Data System Reliability and Statistical Modeling of Program Impacts. INSTITUTION California Educational Research Cooperative, Riverside. PUB DATE 1997-09-00 NOTE 203p. PUB TYPE Reports Evaluative (142) EDRS PRICE MF01/PC09 Plus Postage. DESCRIPTORS Academic Achievement; Attendance Patterns; Change Strategies; *Data Processing; Educational Change; *English (Second Language); Information Systems; Language Fluency; Language Proficiency; *Limited English Speaking; Mathematics Instruction; Measurement Techniques; Organizational Change; Program Development; Program Effectiveness; Reading Skills; Research Needs; School Districts; *Second Language Programs; *Statistical Analysis ABSTRACT In response to concern about the effectiveness of programs for English-as-a-Second-Language students in California's schools, the Santa Ana Unified School District, in which over 80 percent of students are limited-English-proficient (LEP) conducted a study of both the operations and effectiveness of the district's language development program, using data accumulated over several years. The findings, documented in this report, cover five broad areas: information system reliability; language development services for LEP students; development of English fluency; impacts on reading and mathematics achievement; and an analysis of school attendance data. The report concludes with 14 recommendations for action in three areas: improving language development program effectiveness; improving data systems operations; and further study. Appended materials detail the technical aspects of the study. Contains 35 references. (MSE) ******************************************************************************** Reproductions supplied by EDRS are the best that can be made from the original document. ********************************************************************************
Transcript of DOCUMENT RESUME AUTHOR Mitchell, Douglas E.; Destino, Tom; … · 2014-06-30 · DOCUMENT RESUME....

DOCUMENT RESUME
ED 421 855 FL 025 347
AUTHOR Mitchell, Douglas E.; Destino, Tom; Karam, RitaTITLE Evaluation of English Language Development Programs in the
Santa Ana Unified School District. A Report on Data SystemReliability and Statistical Modeling of Program Impacts.
INSTITUTION California Educational Research Cooperative, Riverside.PUB DATE 1997-09-00NOTE 203p.
PUB TYPE Reports Evaluative (142)EDRS PRICE MF01/PC09 Plus Postage.DESCRIPTORS Academic Achievement; Attendance Patterns; Change
Strategies; *Data Processing; Educational Change; *English(Second Language); Information Systems; Language Fluency;Language Proficiency; *Limited English Speaking; MathematicsInstruction; Measurement Techniques; Organizational Change;Program Development; Program Effectiveness; Reading Skills;Research Needs; School Districts; *Second Language Programs;*Statistical Analysis
ABSTRACTIn response to concern about the effectiveness of programs
for English-as-a-Second-Language students in California's schools, the SantaAna Unified School District, in which over 80 percent of students arelimited-English-proficient (LEP) conducted a study of both the operations andeffectiveness of the district's language development program, using dataaccumulated over several years. The findings, documented in this report,cover five broad areas: information system reliability; language developmentservices for LEP students; development of English fluency; impacts on readingand mathematics achievement; and an analysis of school attendance data. Thereport concludes with 14 recommendations for action in three areas: improvinglanguage development program effectiveness; improving data systemsoperations; and further study. Appended materials detail the technicalaspects of the study. Contains 35 references. (MSE)
********************************************************************************
Reproductions supplied by EDRS are the best that can be madefrom the original document.
********************************************************************************

Evaluation of
English Language Development
Programs
in the
Santa Ana Unified School DistrictU.S . DEPARTMENT OF EDUCATION
Office of Educational Research and ImprovementEDUCATIONAL RESOURCES INFORMATION
CENTER (ERIC)Clt9his document has been reproduced as
received from the person or organizationoriginating it.
CI Minor changes have been made toimprove reproduction quality.A Report on Data System Reliability
And
Statistical Modeling of Program Impacts
Douglas E. MitchellTom DestinoRita Karam
California Educational Research CooperativeSchool of Education
University of California, Riverside
September, 1997
2
Points of view or opinions stated in thisdocument do not necessarily representofficial OERI position or policy.
PERMISSION TO REPRODUCE ANDDISSEMINATE THIS MATERIAL HAS
BEEN GRANTED BY
TO THE EDUCATIONAL RESOURCESINFORMATION CENTER (ERIC)
CALIFORNIA EDUCATIONALRESEARCH COOPERATIVE
UNIVERSITY OF CALIFORNIA, RIVERSIDE

THE CALIFORNIA EDUCATIONAL RESEARCH COOPERATIVE (CERC)
CERC is a unique partnership between county and local school systems and the School of Education at the University ofCalifornia, Riverside. It is designed to serve as a research and development center for sponsoring county offices of educationand local districts combining the professidnal experience and practical wisdom of practicing professionals with thetheoretical interests and research talents of the UCR School of Education faculty.
CERC is organized to pursue six broad goals. These goals serve the needs and interests of cooperating public schoolmembers and the University by providing:
Tangible practical support for school improvement Support for data-based decision-making among schoolleaders.
Proven stategies for resolving instructional,management, policy and planning issues facing publiceducation.
Valuable professional development opportunities for
Research, planning and evaluation activities that aremeaningfully interpreted and applied to school districtproblems.
Data analysis to assist in generating public support forcurrent and future school leaders. effective school programs.
In addition to conducting research in these areas, CERC publishes reports and briefs on a variety of educational issues.CERC also sponsors rezional workshops for local educational leaders.
Douglas E. MitchellProfessor of Education
Director
Ronald E. FranklinAssistant to the Directors
CERCExecutive Staff
Irving G. HendrickProfessor & Dean
School of Education. University of California, Riverside, CA 92521-0128
Rodney T. OgawaProfessor of Education
Director
Roseanna Barrón-LópezChief Administrative Officer
(909) 787-3026 FAX (909) 787-3491
CERC MEMBERS
SPONSORING OFFICES OF EDUCATION
Riverside County Office of Education San Bernardino County Superintendent of Schools
SPONSORING SCHOOL DISTRICTS
Baldy View ROPBannine UnifiedChaffey Joint Union HighDesert Center UnifiedDesert Mountain SELPAEast San Gabriel Valley ROPEtiwanda ElementaryHelendale ElementaryJurupa UnifiedManhattan Beach UnifiedMoreno Valley UnifiedOntario-Montclair School District
3
Oro Grande Elementary.Palos Verdes Peninsula UnifiedPerris Union HighRedlands UnifiedRiverside UnifiedSanta Ana UnifiedSan Jacinto UnifiedUC Riverside/Sherman PartnershipVal Verde UnifiedVictor ElementaryVictor Valley Union HighYucaipa-Calimesa Joint Unified

Evaluation of
English Language Development
Programs
in the
Santa Ana Unified School District
A Report on Data System Reliability
And
Statistical Modeling of Program Impacts
Douglas E. MitchellTom DestinoRita Karam
California Educational Research CooperativeSchool of Education
University of California, Riverside
September 1997

Table of Contents
I. Executive Summary
Background: Issues Confronting Bilingual Education Program Design
III. The Evaluation Study Process
IV. The Results of The Reliability Study
V. Bilingual Program Enrollments, Student and Teacher Characteristics
VI. Answering the Central Evaluation Study Questions
VII. Conclusions and Recommendations for Action
VIII. References
Appendices
A. SPSS Command Files
B. Variables used in Analysis, Description and Computation
C. Interview Protocal and Staff Interview List
D. Annual Survey
E. Scannable Forms
CERC @ UCR 09.'23'97
5English Language Development

Evaluation of English Language Development Programsin the
Santa Ana Unified School District
A Report on Data System Reliability and Statistical Modeling of Program Impacts
Douglas E. MitchellTom DestinoRita Karam
California Educational Research CooperativeSchool of Education
University of California, Riverside
I. Executive Summary
In 1974, the Supreme Court, in Lau v. Nichols (414 U.S. 563), upheld federal guidelinesstating that "Where inability to speak and understand the English language excludesnational origin-minority group children from effective participation in the educationalprogram offered by a school district, the district must take affirmative steps to rectify thelanguage deficiency in order to open its instructional program to these students." Inresponse to this ruling and statutory enactments by the states, professional educators haveworked to develop bilingual education programs intended to provide for the simultaneousexperience of English language acquisition and academic achievement for thispopulation.
In California. with the nation's largest non-English speaking population, bilingualeducation is both an educational concern and a highly charged political issue. Questionshave been raised about both the methods employed and the achievement level of thestudents enrolled in this program. Such questions were raised by the Board of Educationof the Santa Ana Unified School District (SAUSD), the governing body responsible forthe education of the children within the District's boundary - a district in which more thaneighty percent of the students are non-native English speakers (LEP). In order to findanswers the Board requested the assistance of the California Education ResearchCooperative (CERC) at the University of California, Riverside.
District and CERC staff met during the summer of 1996 and, following extendeddiscussion, an evaluation study design was prepared and presented to the SAUSD Boardof Education. The Board approved a contract with CERC to undertake a comprehensivereview and evaluation of both the operations and the effectiveness of the District'slanguage development programs using data that the District has accumul ated during thepast few years.
CERC @ UCR 1-1 09/23/97

A Design Team consisting of District and CERC staff was created to both ensurecontinuous communication and feedback and to expedite the evaluation process. It wasformed under the direction of the Superintendent, Dr. Mijares and led by the formerAssistant Superintendent, Dr. Vargas, and the current Assistant Superintendent, Dr.Davies. The Team met periodically to discuss various issues related to student programsand services, district management, and other critical elements that make up the contentsof this study. The CERC staff thanks the Design Team for their patience, diligence, andsupport durinu the course of this study.
The Santa Ana Unified District English Language Development Evaluation Study.
In order to meet the needs of the overwhelming majority of the students for whomEnglish is not their first language, the District's educational professionals have developedand implemented a variety of special programs. Some emphasize rapid immersion intoEnglish languazre instruction while others are designed to facilitate continued academiclearning within a student's native language, teaching English as a second language.Gathering and analyzing extensive data kept by the District to track services and students'development in each of these programs is the focus of this evaluation study. Specifically,the Board approved funding for two evaluation study components.
Component 1: Data Reliability and Validity
SAUSD has developed a data tracking system that has been designed to monitor students'language development and track the programs and services which they receive. Thissystem contains the critical indicators for documenting the influence of various languagedevelopment services on both academic and language attainment of LEP students. Thefirst component provided for examining the reliability and validity of the data collectedand maintained in the language development information management system todetermine whether data collection procedures were uniform, well understood by teachersand administrators, and consistent in their assessment and recording of student progress.Qualitative and quantitative methods of reliability were utilized to check the consistencywith which teachers assign bilingual programs, ELD levels and make recommendationsregarding reclassification and redesignation of LEP students. This was necessary sincefurther analyses depended on the quality of the data being analyzed and its reliability.
Component 2: Program and Service Effectiveness Modeling
Having validated the data, an evaluation of the effectiveness of specific languagedevelopment services and programs was undertaken. Both Suryival Analysis and GeneralLinear Modeling statistical techniques were used to 1) make quantitative estimates of thelength of time it takes students to move into high ELD levels and 2) evaluate theeffectiveness of various language development programs in meeting the needs ofstudents with different characteristics (i.e. various levels of language proficiency andprior academic preparation) as measured by academic growth and language attainment
CERC @ UCR 1-2 09/23/97

over a three year period. The remainder of this section presents an overview of the majorstudy findings and the general layout of this report.
Overview of Study Findings
The findings developed and documented in this report cover five broad areas. Theyinclude:
1) Information System Reliability
2) Language Development Services for LEP Students
3) The Development of English Fluency
4) Impacts on Reading and Mathematics Achievement
5) Analysis of School Attendance Data
A very brief summary of the findings in each area is presented here to orient readers ofthis report to the salient issues in the evaluation of English Language Developmentprograms and services.
On the Reliability of SAUSD Data Systems
1. The District uses a variety of methods to insure consistency in data collection andrecording. including training, one-on-one assistance to teachers and distribution ofguidelines defining variables and reporting procedures.
2. The District's annual Program Services survey tends to be seen by teachers primarilyas a reporting device student program adjustments are made more continuouslythroughout the year and are not always entered immediately into the trackingdatabase.
3. The administrative program categories reported in the Program Services annualsurvey do not accurately reflect the language development services students actuallyreceive. These administrative categories are based on a combination of programdesign and teacher certification factors that separate some students receiving similarservices and combine some groups receiving rather different services. Thus, studentsare classified into language development programs on the basis of the services beingprovided by their teachers Transitional Bilingual Education for those receivingnative language instruction and Immersion for those receiving sheltered instruction inEnglish. Those receiving neither are classified as "mainstream" students, thoseexperiencing both are labeled combined TBE & Immersion.
CERC @ UCR 1-3
809/23/97

4. Analysis of language level coding and the movement from one language level toanother indicate that annual reporting of student performance is too irregular. Largenumbers of students are all reported as moving from one level to another at the sametime, but staff are well aware that this movement is highly individualized
On SAUSD English Language Development Services for LEP Students
1. 18% of students are Native English speakers and receive no LEP services. 14% ofLEP students have attained Fluent status. Of the remaining two-thirds, about half(31% of all students) are receiving TBE, 14% immersion, and 10% combined TBE +
Immersion.
The TBE program serves the largest number of poverty children, more than 90%,immersion 80%, and the mainstream curriculum below the District average, between60 and 70%.
3. Native lang.uage instruction, a substantial factor in Transitional Bilingual Programs,drops dramatically during grades 2 and 3.
4. Immersion teachers are most highly certificated overall, but TBE group of teacherscontains widest range of certificated teachers, from highest to lowest.
On SAUSD English Language Development Program Impacts on Fluency
I. The averaee time it take students to move from one ELD level to another depends onwhich ELD level the student is at. It takes less time to move between the lowerlevels than the higher levels.
2. Factors such as grade level, ethnicity, special education, movement between schools,teacher characteristics and school cycles significantly influence the rate of languagedevelopment.
3. Students in either Transitional Bilingual Education or English Language Immersionprograms make substantially more rapid progress toward English fluency than dothose who remain in the educational mainstream program.
4. Students enter Transitional Bilingual Education programs with significantly lowerlevels of EnQlish fluency (a full language development level below their peers inother prouams) and these students make steady progress in closing the fluency gapduring their first three years. Later in their elementary experience, however, thesestudents tend to receive dramatically less native language support and to fall behindtheir peers in fluency development.
CERC @ UCR 1-4
909/23/97

5. Language development programs differ substantially in the effectiveness with whichthey facilitate movement across specific stages in language learning.
6. The movement of middle school students across the various language developmentlevels is typically slower than that for elementary students, high school students moveat about the same rate as elementary students.
On the Relationship Between ELD Programs and Student Reading and MathAchievement
I. There are significant differences in the achievement levels of students in the District'sfour languae development programs. However, this difference appear to beprimarily due to student intake rather than program effectiveness differences.
Children move from Spanish to English achievement testing at all grade levels 50%of those moving do so by the 6th grade.
3. Students taking their tests in Spanish substantially outperform those who take theirtests in English. Students moving from the Spanish SABE test to the Englishlanguage CTBS drop about 30 points in measured reading achievement this is theequivalent of about 2 grade levels. The drop in measured mathematics achievement,though smaller, is also quite dramatic.
4. Factors such as special education, movement between schools, test language,student's English Language development levels, primary Language developmentlevels, and ELD programs are important predictors in reading attainment.
5. Students ethnicity, test language, ELD program type, school cycle, ELD level, PLDlevel and movement between schools have significant impact on the rate of Mathattainment.
On the hifluence of ELD Programs on Student Absenteeism
1. Students' ELD program enrollment, ELD levels, transiency rate, overage, testlanguage. school cycle and poverty status significantly influence absenteeism.
Recommendations for Action
The report concludes with fourteen recommendations for action concerning three areas ofinterest. The rationale for each recommendation is presented in Section VII of the report.
1. Recommendations for Improving Language Development Prgram Effectiveness:
CERC @ UCR 1-5 09/23/97
1 0

1.1 Take steps to reaffirm District commitment to the two fundamental-goalsof education for all children: high levels of fluency in English and thehighest possible academic achievement. And declare a willingness toutilize whatever program models and instructional strategies mosteffectively lead to the realization of these goals.
1.2 Acknowledge the complexity of the language acquisition process, thediversity of student needs and the great variety of ways in which studentslearn and teachers teach. At the same time, reaffirm District respect forthe acquisition of fluency in all languages and treat student fluency in anon-English language as a valued asset to both their own education and tothe larger community.
1.3 Given the extended period of time required to reach fluency in Englishdocumented in this evaluation study and supported by other recent studiesof language acquisition, the District should carefully review the scope andsequence of the curriculum in each of its language development programsto make sure that students who will take five to seven years (or evenlonger) to reach full fluency have an opportunity to be exposed tomaterials that are challenging and interesting without overwhelming theirexisting language skills.
1.4 So long as the District seeks to utilize Transitional Bilingual Educationtechniques to support academic attainment for English language learnerswhile they make the transition to English fluency, it is important toconsider extending the transition period for two or more additional yearsto allow time for better development of English fluency.
1.5 Since children who enter Santa Ana schools sometime after theirkindergarten year and those who move from one school to another, tend tobe assigned to mainstream or mixed TBE and Immersion programs itwould be appropriate for the District to review assignment processes andsee if everything possible is being done to provide these children with themost appropriate possible educational programs.
1.6 Since teacher characteristics, including age, education and experience playa significant role in predicting program impacts on students, the Districtshould continue to attend closely to the placement of teachers in workassignments where they are most likely to be most helpful in facilitatingboth language fluency and academic attainment.
1.7 Since all of the language development programs utilized in Santa Anaoutperform the educational mainstream in facilitating both languagefluency and student achievement, it is important for the District to resist
CERC @ UCR 09/23/97

pressures to prematurely discontinue programs and rely on mainstreameducational services to meet student needs.
1.8 While it is essential that students be assessed in English to determine theirfluency and academic proficiency in English, the District should resistpressures to abandon testing student achievement in their native language.
2. Recommendations for Improving Data Systems Operations:
2.1 Combine the Program Services survey with the preparation of studentreport cards and add elementary grade report card data to the District'selectronic database. This shift in data collection would necessitate thedevelopment of a system of electronic report card preparation, which wefurther recommend.
2.2 Harmonize secondary school course information with the collection ofdata regarding the specific programs and services provided in elementaryschool programs.
2.3 On an annual basis, survey teachers, not about the services provided toeach student, but about their current level of training in languagedevelopment instruction and about their instructional practices.
2.4 Maintain reliable records regarding student assignment to variousadministrative program structures but, when collecting records onlanguage development program services, use teacher reporting categoriesthat distinguish clearly among services, leaving the collection ofinformation about teacher training and instructional practices to a separatedata collection process.
Monitor more precisely the characteristics of students assigned to variousinstructional services. Continue to analyze the ways in which familychoice and professional judgment affect how students with differentcharacteristics and educational needs are plated in different instructionalprograms.
3. Recommendations for Further Study
3.1 It is important for the District to continue in its study of the impact ofvarious English language development programs and services. Theevaluation findings presented in this report are based on a data trackingsystem that has yet to collect data on an entire cohort of students passingthrough District schools, and no direct observations of students, teachersand school operations were made.
CERC @ UCR 1-7
1209/23/97

The Design of This Report
Following this Executive Summary, the body of this evaluation report is divided into sixsections. Section II provides a theoretical and research based background to theevaluation study by highlighting four main themes visible in SAUSD. Section IIIdescribes the evaluation study process, i.e., the approach taken to the evaluation based onthe background provided in Section II and the data sets and variables used for analysis.Section IV presents the analysis of District data system reliability. This sectiondocuments the usability of various SAUSD data systems. Section V describes the natureof the student body, i.e., demographic features, and identifies the nature and size of thevarious instructional programs in which students are enrolled. Section VI presents themajor study fmdings, including the analysis of the types of services provided, the amountof time students take in proceeding to English language fluency and the relationshipbetween laneune fluency in reading and math. This section also discusses howprograms affect student engagement in school by focusing on the important topic ofattendance as an indicator of school engagement. Section VII summarizes the studyfindings and presents recommendations for policy and program adjustments suggested bythe study findings. The report ends with a series of methodological appendices that
review the technical details of the study.
CERC @ UCR 1-8
1309/23/97

II. Background: Issues Confronting Bilingual Education Program Design
During the last three decades intensive research and evaluation on programs for Englishlanguage learners in both Canada and the United States has generated significant insight into thechallenges and opportunities facing school leaders seeking to improve English LanguageDevelopment Programs in the public schools. Earlier research on language acquisition (at leastin the United States) did not focus on schooling, but on language development and intelligenceamong immigrant populations. Intelligence tests became popular during the early part of thiscentury as a means of predicting intellectual and academic attainment. As the use of these testsbecame more widespread, it was obvious that immigrants were performing poorly. Based on testdata, a substantial tzroup of psychologists concluded that poor performance reflected inferiorintelligence rather than a language-based interference with test taking. This interpretation sprangfrom the prevailina view of language competence. Mastering English was seen as synonymouswith vocabulary development memorizing isolated words a much simpler concept than thoseunderlying contemporary views of "communicative competence." This simplistic view lednaturally to a belief that performance problems encountered by people with limited Englishproficiency were evidence of genetic intelligence limitations. Some early researchers evenconcluded that since children of northern European families had less difficulty mastering Englishthey must be of superior intelligence. In contrast, psychologists giving more weight toexperience and less to heredity interpreted language performance problems to be the result of"interference" between native languages and the effort to learn English. While this kept themfrom equating lanauage facility with intelligence, their analyses still placed the problem withinthe mind of the individual. Early theorists gave little thought to the possibility that languagelearning is grounded in social and cultural experience rather than mental ability.
The Canadian experience differs in a number of respects from that in the United States. TheOfficial Languages Act of 1968-69 provided equal status for English and French at the level ofthe federal government. As a result, many English speaking middle-class parents took action toensure that their children would eventually become fully bilingual citizens. Though wary of thenegative aura associated with bilingualism in the U.S., Canadian parents sought to immerse theirchildren in a minority language, French. Their goal was maintenance of their children's Englishliteracy while facilitating French proficiency. Despite some early methodological problems(Hakuta, 1986), the foreign language immersion data from Canada began showing a surprisinglystrong positive relationship between bilingual fluency and measures of cognitive ability. Thesepositive findings changed the climate of program development and research in Canada bypointing to bilingual instruction as a positive learning environment (Cummins, 1978).
One factor supporting the more positive view of bilingual learning in Canada was, no doubt, theCanadian research emphasis on middle-class families seeking expanded language learningopportunities. This contrasts sharply with the continued U.S. emphasis on lower-class immigrantsocialization. Political interpretations of the importance of speaking one language or anotherplay an important role in many societies. Hakuta (1986, p. 43) assures us that choosing whethera child is to be raised a "monolingual" or a "bilingual" is not like "choosing a brand of diaper"a matter of indifference to neighbors and community leaders. Quite to the contrary, this choice istypically interpreted to be either an act of devotion and loyalty to a family's :lew land and culture
CERC @ UCR - 1 09/23/97

or as maintenance of traditional mores and values, continued loyalty to the "old country"cultures.
Theoretical Framework. Provided with both opportunity and incentive, most ethnic groupsinvolved in prolonged contact with other cultures and language groups will move toward acommon language. The usual pattern is for immigrants, minority and lower status groups toadopt the language of the dominant group. Sometimes it has taken several hundred years, ashappened with Gaelic in Great Britain. More often the shift comes over the span of threegenerations, as has been the case of European immigrants to Australia and European andMexican immigrants to the United States. The rate at which groups shift from native languagesto a majority language is currently being investigated by sociolinguists in the United States(Pease-Alvarez & Winsler, 1994).
While language shift is the norm, counter pressures often arise to encourage maintenance ofnative languages. Most school districts in the U.S. including SAUSD, have programs designedto encourage a shift to the majority language (Krashen, 1996). The phrase "bilingual education"as used in American public schools almost always refers to transitional programs designed toexpedite the shift to mainstream monolingual English classes as soon as children have masteredEnglish skills sufficiently. This transitional goal has proven harder to reach than originallyexpected. Nearly all recent bilingual program evaluation studies suggest that the longer childrenremain in native language instruction, the better will be their ultimate second languagedevelopment and the fuller their academic achievement. As will be discussed later, thesefindings are far from conclusive because of gaps in our knowledge regarding the nature oflearning in such programs. Designing programs to capitalize on the supportive value of nativelanguage instruction is proving quite difficult. Not only is public support for multi-lingualeducational programming rather weak, but is also difficult to find trained staff and adequatecurriculum material.
The Difference between Social and Academic Language. The first research examining the social(rather than solely the psychological) foundations of language acquisition was that of Skuttnab-Kangas (1976) who studies native Finnish speakers in Sweden. Building on her work, Cummins(1979, 1980, 1981a. 1981b) proposed one of the first theoretical models distinguishing thelearning of socially useful language skills from the development of language proficiencynecessary to cope with academic subject learning. In his early formulation of the distinction,Cummins labeled the acquisition of social language as Basic Interpersonal Communicative Skills(BICS) and called the skills needed for academic functioning Cognitive Academic LanguageProficiency (CALP) - two acronyms widely used by teachers and administrators as well as by theresearch community. Cummins, joined by others, has expressed concern that the use of theseacronyms has oversimplified the complex distinction to be drawn between face-to-faceconversational proficiency (BICS) and the more formal language system used to convey abstractideas and concepts in an educational setting (CALP).
In context-rich-face-to-face communication, the meaning of words and sentences is sociallydeveloped and interpreted though a wide range of non-verbal, contextual cues. Academic oraland written language, by contrast, relies primarily on abstract words and sentences with fewersocial and visual cues available to enhance its meaning. (Think of the difference between an
CERC @ UCR 09/23/97

animated conversation aimed at getting tourist directions in a strange city and the kind ofknowledge necessary to read a textbook on the chemical elements). In later works, Cumminselaborates his conception - distinguishing between "horizontal" and "vertical" dimensions to theproblem of langua2e complexity (Figure II.1). The horizontal dimension separates rich-texturedand socially embedded language settings from the abstract, context-reduced settingscharacteristic of academic learning. The vertical dimension distinguishes intellectuallyundemanding situations where simple facts and straightforward ideas dominate from
intellectuallychallengingenvironmentswhere complexideas and subtleconcepts areessential.Appropriate andproficient use oflanguage involvesall combinationsof contextualsupport andintellectualchallenge, ofcourse, but schoollearning dependsmost heavily onthe language skillsthat are hardest todevelop - thoseinvolving abstract
concepts used in contexts where contextual clues are relatively rare. To date, there has been nosystematic research to document where various school subject matter activities should be plottedon Cummins' horizontal and vertical dimensions. Consequently, this conceptually powerful mapis not yet incorporated into school curriculum and program design.
ContextEmbedded
Figure 11.1 Dimensions of Language Use(adapted from Cummins, 1994)
CognitivelyUndemanding
A
CognitivelyDemanding
ContextReduced
The Four Fundamental Issues in Language Learning
Four issues define the contribution of language learning research to school policy and programdevelopment. These issues are:
1. Whether the primary objective of language instruction can or should be to develop asingle common language for all citizens or to encourage children to become part of amulti-lingual society by retaining various non-English primary languages.
Whether having and using a non-English lan2uage interferes with the acquisition ofEnglish fluency or results in an additive reinforcement of learning by enrichingchildren's academic vocabulary.
CERC @ UCR II 3 09/23/97
3.{.3

3. Whether using native language instruction to build children's core academic subjectknowledge helps to build long-term academic success by keeping children in touchwith expected learning outcomes or only delays English language fluency byencouraging continued use of native languages.
4. Whether language development programs are more effective when special programstargeted exclusively on the needs of the English language learners are created, orwhen these students are provided with language and academic assistance serviceswithin mainstream educational programs.
Resolving these issues is made doubly difficult by the fact that public values as well as scientificevidence must be used to develop policy and programs to address them. Although the valuequestions remain the proper purview of school governance and policy making, recent advancesin research on language learning is shedding new light on each of these issues. While theevidence is still not as comprehensive or reliable, as we would like, researchers have documentedsome consequences of various program approaches and have established a framework forseparating empirical from value-based evaluation questions. In the following section wedelineate the central scientific and value dimensions of each issue and summarize the availablescientific evidence regarding consequences for schools and children.
Issue #1: Mono-lingual versus Multi-lingual Educational Goals
-Addressing the question of the ultimate goals of language instruction requires that public valuesand scientific evidence resolve the following questions:
The value question: Is it better to develop a multi-lingual society capable ofcommunicating across national borders and ethnic divisions or to assure a single commonlanguage for all citizens?
The scientific question: Do children who grow up speaking more than one languageexperience social success, and do they tend to have any more or less loyalty to theirnational cultures than mono-lingual citizens?
A clear cut answer to this scientific question in not possible at the present time, because theavailable evidence is sparse. However, Fernandez and Nielsen (1986) and Garcia (1981), foundpositive relationships between being raised bilingually in the U.S. and higher levels of self-esteem, more ambitious economic plans, greater assuredness of achieving such plans, and highergrades in college. Although these findings favor native language maintenance, interpreting sucha small number of studies as evidence that native language maintenance should be widelyadopted is both scientifically premature and insensitive to larger issues of civic values and publicpurpose.
In multi-lingual societies like the Grand Duchy of Luxembourg, where three "prestige"languages. Luxemberger, German, and French, have official status and specific purposes in thefabric of the nation, valuing all three languages is seen as being nationally loyal (Baetens
CERC @ UCR 09/23/97

Beardsmore & Lebrun, 1991). Further, speaking more than one language is viewed with socialapproval and certainly helps to promote social success. Individual citizens, and the society as awhole, have clear purposes for all three languages. As a result, the three languages are kept alivewithout substantial political debate. The situation is obviously different in the U. S. with regardto languages other than English. Minority groups, for both social and economic reasons, tend toshift to the English language rather quickly following entry into the social mainstream. Non-English languages are often lost after a couple of generations, and their maintenance is notessential to the preservation of minority cultures and ethnic identities as can be seen in the caseof the Chicano movement in the U.S.
Volumes have been written on the advantages of developing a multi-lingual/multi-culturalsociety in the United States. Rationales range from, "we will all get along better" to "it works inother countries-, almost always with an admonition to, "look at Europe." Unfortunately,statements such as these are generally offered in the absence of any supporting data. As war inthe former Yugoslavia, with its three official languages Serbo-Croation, Slovenian, andMacedonian and many dialects and unofficial languages clearly demonstrates, multi-lingualismis certainly no guarantee of harmony. The selection of an "official" language for use in society,or in the schools, has little to do with the character of the language itself it is a matter ofpolitics and public values.
Israel and Peru provide contrasting examples of what happens when policy makers seek tomandate the use of a specific national language. In Israel, social conditions and religiousattitudes toward Hebrew and the Promised Land made possible the rebirth of Hebrew as anational language. Though insistence on Hebrew as the official language created significantsocial tensions, the social forces at work in this country including religious cohesion and rapidimmigration from many different native language groups worked to make the language policysuccessful. The Velasco government in Peru was unable to overcome key social forces,however, and could not alter the language practices in this country. This government'spolitically motivated attempt to make Quechua the national language failed because governmentpolicy could not overcome the tendency for speaking this native tongue in public to be associatedwith being an Indian, with all the socioeconomic stigmatization associated with that status(Mannheim, 19841. The key to successful language development programs is not so much stronggovernmental policy or intensive school programs, but an understanding of the nature andoutcomes of relevant social forces (Bratt-Paulston, 1988). It is tempting to believe that schoolprograms can guarantee popular usage of a particular language. But, alas, school programselection is only one factor influencing the ultimate language choice for most ethnic groups. Tomake school proarams more potent forces, we need to get a better grasp on just what socialforces are at work and how they interact with community norms, political mandates andeducational programs.
Language is rarely the leading factor shaping cultural development. Rather, language followssocial development, mirroring societal conditions and human relationships. In all of the areas ofthe world where bilingual education programs have been subjected to systematic study, theevidence indicates that schools and schooling can facilitate existing social trends, but cannotreverse the impact of major social, economic, and political forces.
CERC @ UCR 09/23/97

With a few notable exceptions, the prevailing norm in language acquisition is for immigrantpopulations to shift, over a period of one to three generations, to the routine use of their newcountry's dominant language. In Santa Ana, with its broad support forcontinued use of Spanishin homes and neichborhoods, the shift to English may be slower than found in other settings, butthere is no reason to believe it will not happen. Support for English language fluency is not onlya priority concern in the public schools, it is supported politically and by the languagerequirements of hich paying jobs in the California economy. There are, of course, counterpressures. Many find English difficult to learn, many experience the demand to become Englishlanguage fluent as a threat to their traditional cultural identities, and many will use languageindependence as a rallying call to generate political power and public pressure for other reforms.Few would challenge the ethical principle that a minority group has the right to preserve its ownlanguage. Moreover, as the economy becomes increasingly global, many see the value ofpreserving and enhancing the language skills of the many linguistic sub-cultures in our Society.By the middle of the next century, it might turn out that one of America's greatest economicstrengths is its ability to nurture language diversity. This is where public values and scientificevidence meet linking the desire for a common culture with the demonstrable advantages ofmulti-lingual fluency.
Issue #2: Interference versus Reinforcement in Bilingual Learning
The value question: Should educational programs try to capitalize on the pre-existinglanguage capacities of students or urge the students to set aside their primary languageand concentrate on mastering a curriculum built entirely on the use of English languagevocabulary and syntax?
The scientific question: To what extent is language learning made easier or harder byencouraginc children to link new words and concepts in English with their pre-existingnative lancuage proficiency?
Does knowing one language, perhaps using it every day at home, interfere with or support theacquisition of a second one? This question is more complex than it might at first appear. Thereare, of course, the obvious differences in word meaning and syntax that can confuse a childtrying to acquire a new language. English has borrowed heavily from many different languages,but has not always preserved the original meanings of the words and phrases borrowed.Moreover, English syntactical rules regarding such matters as verb placement, the use of genderwords and countless other details can easily distract someone whose native language uses adifferent syntax. Additionally, training in any language attunes the human ear to some soundsand obscures others sound patterns that might interfere with recognition of the words andphrases of the new language. Even more important, interference could be cultural rather thanstructural or technical. Languages and language uses are differentially valued in every society.Some languages are seen as morally superior or more prestigious than others. When thishappens, the native speakers of the higher status group come to look upon adoption of theirlanguage as a test of the loyalty of less prestigious groups. And, for their part, the lessprestigious groups can come to see preservation of their language as a matter of ethnic pride orpersonal identity. This kind of interference may not limit the ability to learn a new language, butit certainly undercuts the motivation to do so.
CERC @ UCR 09/23/97

On the other side, it is easy to see that knowing one language could dramatically reinforce thelearning of a second. After all, becoming communicatively competent in any language requiresthat one master the concept of correspondence between speech and action, and develop at least arudimentary grasp of syntax and vocabulary. Additionally, to know a language is to knowsomething about the situations to which words are properly linked. Thatis, to know a languagerequires that one know something about the social and natural world to which it applies. Thus,the person who already has one language will have at his or her disposal the fund of knowledgethat was developed during the process of acquiring the first language.
Language*transfer the combination of reinforcement and interference processes was thedominant interest of researchers who launched the field of Second Language Acquisition. Theseresearchers (for example, Brown, 1973; Dulay and Burt, 1974) limited their studies togrammatical features and sequences, with the result that the work did not have a lasting impact.But while the work was active, several important insights were generated. First, it was foundthat language learning for native speakers is often quite different from the way non-nativespeakers appropriate the same language. Moreover, these differences in learning order do notdepend very much on which non-English language the second language learner has in his or herbackground. That is, having fluency in any non-English language affects the learning of Englishsubstantially and in roughly the same way for all prior languages. Finally, these researchersdemonstrated that individuals learning English as a second language tend to initially rely on theirnative language grammar or syntax rules, thus confronting different learning problems than donative speakers of English.
This line of research work was cut short by changes in the larger field of psychology. Because itrelied on behaviorist psychological assumptions about conditioning and reinforcement, ratherthan the more recent cognitive psychological concepts of communication and socialization, theissue of language transfer was greatly de-emphasized in research undertaken since about 1975.
When language acquisition research shifted toward the communicative features of language, andthe cognitive processes underlying language usage, classroom instructional systems were largelyignored. The primary exception to this trend appeared in some studies of how middle-classEnglish speaking. Canadians coped with French-Immersion instructional programs.
Selinker, Swain. and Dumas (1975) conducted an investigation of native English speaking seven-year-old children. They found a substantial number of transfer errors attributable to Englishgrammatical structures. In the context of Immersion program settings under study, classroomswere found to develop unique social and cultural features in which transfer errors from Englishwere more acceptable than they would be in situations involving interaction with native Frenchspeakers. These types of errors are so common to total Immersion programs that the term"immersion dialect" (Richard-Amato, 1996) has been used to refer to the language use patternsof students in such programs. The extent to which the specific patterns of interference found inCanada are reproduced in Structured-English Immersion programs like those being used in SantaAna Unified School District is unknown. Also unknown, therefore, is the effect these errorshave on the classroom proceedings and student achievement.
CERC @ UCR II - 7
2 009/23/97

Both Hakuta (1986) and Pica (1995) have urged careful study of the classroom and socialconditions under which second language reinforcement and interference occur. These scholarsbelieve that there is much yet to be learned about how to capitalize on positive transfer andovercome the nentive consequences of language interference.
Issue #3: Common Underlying Proficiencies versus Expedited English Fluency
The value question: Is it better to encourage children to explore academic subjects usingtheir native languages or should they concentrate almost exclusively on learning thenuances of English language communication?
The scientific question: If children devote a significant amount of time to acquiringacademic knowledge in a native language, does this learning transfer quickly andeffectively when English language skills improve?
Regardless of whether continuing use of non-English languages is socially approved, the basicfactual question is whether individuals working in two different languages keep their knowledgein separate mental domains and, therefore, have to re-learn concepts if they shift to a newlanguage. Or, as has been more recently argued, do individuals keep conceptual knowledge inthe same mental storehouse and make it available in whatever language they are using at anygiven moment? This issue is a bit more complex than it at first appears (Grosjean, 1982). Quiteobviously, at some level the human mind has a single storehouse for concepts and information.Otherwise, as Hakuta (1986) points out, it would be impossible to report in English on a trip toJapan during which no English was used. It is also easy to see that all languages are used inways that are, to some extent at least, independent. Otherwise, translation would amount tosimply substituting words 'without having to worry about misleading connotations or lostmeanings. A number of researchers are working to identify the specific situations in which thecommon underlyin2 mental processes can be counted upon to bring academic learning andlanguage acquisition together, and to delineate factors that are responsible for keeping languagesystems separate and distinct (see, Kolers, 1978; Paivio & Desrochers,1980; Paradis, 1980;Hakuta, 1986 and Bernhardt & Kamil, (1995).
Several recent studies of bilingual education and the experience of Limited English Proficientstudents leaves the impression that the independence-interdependence issue has been settled(Collier, 1989: Ramirez, Yuen, & Ramsey, 1991; Lindholm, 1991; Cummins, 1994). Theseauthors assert a common underlying structure to language proficiency, with only supreficialvocabulary, syntax and sentence structures separating their use. Cummins (1994) formulation ofthis concept is presented in Figure 11.2. To illustrate this view, once a person learns a concreteoperation (like addition or purchasing a loaf of bread) in one language, it is not necessary to re-learn the same idea again in a new language. Similarly, a complex concept (like government orjealousy) has been recognized in one's native language, it is transferred to another throughtranslation, not by learning it anew. Using proficiency test scores from two different languages,these researchers demonstrate that language interdependence is quite general. This can becriticized, howeN er. Troike (1981), for example, insists that transfer must be interpreted inrelation to the specific circumstances under which it takes place. Edelsky, Hudelson, Flores,
CERC @ UCR II - 8 09/23/97
21

Barkin, Altwerger. & Jilbert (1983) question the use of test performance data for determining theactual level of lanQuage proficiency and literacy.
Figure 11.2Perhaps the beststatement ofcurrent researchon this problem isprovided byBernhardt &Kamil (1995) intheir study ofsecond languagereadingdevelopment.These researchersconclude thatlearning to read ina second languageis more complex
than the argument over independence versus interdependence of languages acknowledges. Theysee the value of interdependent skills very much influenced by the relative level of literacy in aprimary language. They recommend careful study of just how literate a person needs to be inone language before it will help them with learning a second. Moreover, the contributions of thefirst language to the second probably also depend on the extent to which the language learner hasbecome literate in the second language.
Surface Features of Ll Surface Features of L2
(udapied from Cummins, 1994)
Issue #4: Targeting Services versus Integrating Learning
Up to this point we have been attending to underlying theoretical and conceptual issues, ratherthan the practical problems of language development proaram design. These theoretical issueslead to the development of language acquisition models that guide program design by showinghow language learning works. A fourth critical issue facing educators seeking to createappropriate English Language Development supports for children is the practical question ofprogram design. As with the other issues, this issue can be addressed either through deliberationon public values or through reflection on scientific analyses.
The value question: Should the special needs of English language learners be addressedby separation of student groups and targeting proerams and services on those withlanguage learning needs, or should lanQuage development be embedded within theeducational mainstream - meeting special needs of the English learners in the context oftheir enganment in the school's regular educational programs?
The scientific question: Is language learning facilitated most effectively by highlightingthe specific needs of English language learners and addressing them with specialprograms. or by providing these children with a sense of full integrat on and inclusion inthe regular school program?
CERC @ UCR 09/23/97

Concern with issues of bilingual education program design date from a report from the AmericanInstitutes of Research (Palo Alto, CA) almost 20 years ago. That study, known as the AIRReport, created a typology of language development programs, separating native languageinstructional programs, English as a Second Language approaches, and Immersion. It comparedbilingual programs with properly trained staff to mainstream programs finding that elementarystudents in bilingual education programs did not experience systematic enhancement ofreadingor mathematics achievement. Reactions to the Air Report were energized. Realizing that theycould no longer blame poor performance on lack of trained staff, bilingual educators sought tostrengthen their professionalism by creating new teacher education programs for bilingualteachers and advocating for the use of native languages for instruction. With the development ofmore sophisticated language development techniques and programs it becomes important torecognize that, -for bilingual education to be meaningfully evaluated, the variation in existingprogram characteristics will have to be thoroughly understood" (Hakuta, 1986, p. 222).
Researchers responding to publication of the AIR Report began to focus on the amount of timenecessary for LEP students to learn English and attain on-grade-level academic achievement.The results of this line of research indicate that immigrants between 8 and 12 years of age, withat least 2 years of native language schooling in their home country, take 5 to 7 years to reach thelevel of average performance by native English speakers (Collier, 1989; Cummins, 1994).Younger arrivals, with no schooling in their native language, may take even longer to reach thelevel of average performance by native speakers possibly more than 10 years. Instruction inthe native language for young children has recently been shown to be effective in helpingchildren make the transition to English-only instruction (Collier, 1995).
Models and Programs
In order to fully understand and evaluate English Language Development programs and servicesin Santa Ana (or anywhere else for that matter), it is important to distinguish between overall-models" of lanauage development and the specific "programs" in which students are enrolled(see Trueba, 1979: Hornberger, 1991). Programs are designed and implemented to meet a '
variety of goals and to accommodate important practical conditions. They must, for example,comply with governmental regulations, create workable teacher and student assignment systems,live within budgetary constraints, accommodate staff, space or material shortages, fit into thescheduling needs and supervision patterns required of other programs, etc. Instructional models,by contrast, are derived from the various beliefs about language acquisition and sound teachingpractices. Thinkina about models helps clarify issues and focus activities, but actual programsare never able to fully incorporate all the key features of any given instructional model. Modelsare defined by their goals with respect to language, culture, and society. Programs are definedby the ways in which they seek to meet the needs of students, teachers and school operations.
Alternative languaae development models developed by resolving the four issues reviewedabove are brouaht together in Figure 11.3. This figure shows the flow of language developmentstudents starting with the entry of non-native English language students into the schools (at theleft edge of the figure). Moving across the figure, students are assigned to one (or perhaps acombination) of seven alternative language development programs (shown in the central part of
CERC a UCR II - 10 09/23/97
23

the figure). Shown at the right side of the figure are the three goals of all language development:High Academic Achievement, Strong School Engagement, and Redesignation as Fluent EnglishProficient. The six numbered language development models shown in the central part of thefigure represent alternative ways of resolving (at least tentatively) the four fundamental languageacquisition issues discussed previously.
Figure 11.3: Alternative Models of English Language DevelopmentPrograms
The Challengeof Providing an
AppropriateEducation forStudents Who
Are Non-NativeEnglishSpeakers
A) Build onCommon
Proficiencies
B) Create aMulti-lingual
Society
C) OvercomeO'Interference &
Reinforce
D)0. Education
Mainstream
1) TBE(Target)
2) TLC(Integrate)
3) Native Languagefor Native speakers
(Target)
4) 2-way Immersion(Integrate)
5) ESL (Target)
6) Immersion(Integrate)
7) RegularClass
Assignmentfor All
AchievementEngagement
Redesignation
Though many different language development typologies are offered in the literature (seeMackey, 1972), none are grounded in the sort of theoretical analysis presented here. The firsttwo models, Transitional Bilingual Education and Transitional Language Classrooms, are logicalchoices whenever the primary objective is to build on the common underlying proficiencies thatallow students to learn important academic concepts using their primary language before making
CERC @ UCR II -
2 409/23/97

a shift to English. The first of these common proficiency models, Transitional BilingualEducation, resolves the fourth issue in favor of targeting services on language learners in specialprogram settings. Model #2 emphasizes integration of services into a regular classroom settingby maintaining a classroom environment that looks and feels more like mainstream instruction.
Models 3 and 4 on Figure 11.3 arise logically whenever primary emphasis is given to creating amulti-lingual society. When multi-lingualism is encouraeed using a targeted strategy, the resultis a program of primary language instruction for the speakers of various non-English languages.Those who embrace the integrated service model naturally turn to model #4 and generate Two-way Immersion programs.
Instructional models 5 and 6 follow the logic of overcoming primary language interference andreinforcing early English fluency. These models ESL and Structured Immersion concentrateprimarily on developing English language fluency on the assumption that overall academicachievement will follow the shift to the dominant language. The ESL programs emphasizetargeting instruction on students with specific needs, the Immersion model is designed to put thelanguage learning students directly into the mainstream.
The model numbered 7 represents placing students into the educational mainstream, providingthem with no special language development services. For many years this was the onlyplacement available. Due to staff shortages, or the beliefs of parents and school staff, thisremains an option for many schools.
The models associated with both the common proficiencies approach, marked A) in the figure,and the multi-lingual outcomes approach, marked B) in the figure, encourage maintenance of thechild's primary language. These models are characterized by classroom utilization of bothmajority and minority language with the assumption that using a minority language is not only aright for its speakers but a potential resource for majority language speakers (Ruiz, 1984).
When evaluatine the specific programs developed to implement these various models in SantaAna USD, it is important to remember that all students in the District are working toward thesame goals: proficiency in English, strong attachment to the learning process, and the highestpossible academic achievement. Regardless of program placement, all students are workingtoward redesignation to Fluent English Proficient (FEP).
At a practical level, only the TBE and Immersion models (models #1 and #6) are being used witha sufficiently large number of students in Santa Ana to permit meaningful evaluation. All of theother models are being tried in this District, but these two designs cover thousands of studentsand have been tracked over several years.
CERC @ UCR II 12 09/23/97

III. The Evaluation Study Process
This section describes the data utilized to conduct this evaluation study and the central questionsaddressed in the analysis of that data.
Although six different models of language development are identified in the literature onbilingual education (see Section II discussion of Figure 11.3), the vast majority of the LimitedEnglish Proficient students in Santa Ana USD are assigned to programs that rely on just two ofthese basic approaches English Language Immersion and Transitional Bilingual Education.Many students experience both of these instructional designs (usually by changing teachers orchanging schools). And a substantial number have only been exposed to "Mainstream"programs in which neither of these two English Language Development techniques are used.That is, nearly all students in Santa Ana USD have one of four basic language learningexperiences: 1) Transitional Bilingual Education (TBE), 2) English Language Immersion (ELI),3) mixed TBE and ELI, or 4) a Mainstream experience without specific language developmentsupport.
This study explores the character and effectiveness of the four types of language developmentprograms serving Santa Ana USD students. In assessing program differences, multiple factorsinfluencing student learning, such as ethnic background, home language, regularity ofattendance, school to school transiency, and teachers' training and experience are analyzed. Inaddition to assessing language development outcomes, the study also examines achievement inreading and mathematics as well as student engagement in schooling. Longitudinal tracking ofstudent program assignments and academic performance data enables us to estimate academicand language proficiency growth over time.
The study began with a thorough analysis of the information available for tracking languagedevelopment proarams and their effectiveness ascertaining the reliability of data systemoperations and the accuracy of data recording procedures. Once assured that available dataprovide a meaningful and reasonably accurate picture of language development programoperations, the study team developed statistical models for assessing the rate of languagedevelopment, the factors influencing it, and the extent to which language development influencesachievement and student engagement.
The Data Available for Evaluating Santa Ana USD Language Development Programs
Data were collected for this study utilizing interviews, analysis of District program guidelinesand other documents, and an extensive array of electronic file data from the District's two datamanagement systems (CASTS and SASI).
Interviews with central office personnel, school principals, bilingual resource teachers, datamanagement personnel and regular classroom teachers were undertaken to gather data on theextent to which staff shares a common understanding of the District's program designs and datamanagement systems. Program guidelines and other documents were reviewed to interpret thegoals of each proaram desian and to identify the procedures used to implement programs andcollect data trackina program performance.
CERC @ UCR III - 1 09/23/97
Santa Ana has developed a well-designed and comprehensive electronic data managementsystem which became the focal point for most data collection. This system monitors students'language development and academic achievement and tracks the programs and services that theyreceive. This tracking system relies on two different databases CASTS and SASI. CASTSkeeps information on elementary school students, traditional year middle school students andhigh school students, while SASI keeps information on year round middle school students. Table111.1 presents the data from these two databases that were used in the analysis.
These data were made available from the District's computer center and cover all studentsenrolled during the first trimester of the 1996-97 school year. Information on teacher educationand experiences was also obtained for school year 1996-97. Each data set was converted foranalysis using the standard Statistical Package for Social Sciences (SPSS). Data preparation,including restructuring data base file formats, translation of variables, construction of suitableindicators and statistical analysis was a highly complex technical undertaking. Specificprocedures are reported in Appendices A and B. Data from the SASI database (such asattendance codes) had to be recoded in a fashion consistent with information found in CASTS.All six data sets were matched by either student identification number or teacher names tointerconnect the data.
The Central Study Questions
Analysis of the data collected for this study was organized around seven central study questionscovering three issues of fundamental importance the reliability of the data system, the designand operation of language development programs, and the impact of language developmentprograms on fluency, achievement and school engagement. The techniques used to developanswers to the central study questions are briefly described here the answers themselves arepresented in the next three sections of this report.
Two Quesrions on Data Systein Reliability
Question #1 - Operational Reliability: To what extent is the data system wellunderstood, fully supported and commonly implemented across all students,teachers and schools?
As described in Section IV, the operational integrity of the LEP student tracking system wasexamined throuah interview and document analysis. A cross-section of key District staffmembers were asked to describe how they use the LEP tracking system and how they judge thequality of the information they enter into it and receive from it.
Question #2 - Record Reliability: Are data records complete, accurate andinternally consistent?
The quantitative data available froth District records were closely examined for reliability andconsistency, usin2 techniques outlined in Section IV.
CERC @ UCR III - 2 09/23/97

1
Table 11I.1: Data Bases Available for Analysis
Data Set Description VariablesAttendance 930,250 LEP, FEP and E0
records of daily & periodattendance for school year97
Student Id Period 0 through 9School Absence codes (forAbsence Date middle and secondaryAll day absent code only)
Test Results 631,632 LEP, FEP and EC)test scores on the CTBS andSABE standardized testinstruments for school years94 through 97.
Student Id Test FormTest Name Raw ScoresSub Test Name Grade Equivalent ScoreTest Date Normal Curve ScoreGrade Level Test was National Percentile ScoreTaken Scale ScoreTest Level
StudentDemographics
53, 932 LEP,TEP and EC)students enrolled in the 97school year
Student Id Current GradeCity Teacher NameState Date Started at DistrictZip Lunch DateBirth Date Lunch CodeBirth City Handicap CodeBirth State/Nation Special Education CodeSex Date Entered currentEthnic schoolCurrent School Enter codeLanguage Code Date Left school
Reason Left
LanguageDevelopmentProgram Data
552, 902 LEP records onPrograms and LanguageDevelopment levels for a 3ear duration were collected
from annual surveys (bubblesheet). Also the sameinformation was collected ona representative sample of2.500 students in a specialsurvey on 8/12/96 to getintermediate data
Student Id Start Date of LanguageProgram Codes Development CodesStart Date of Program End Date of LanguageAssignment Development CodesEnd Date of Program Service CodesAssignment Start Date of ServicesEnglish Language End Date of ServicesDevelopment Codes Redesignation to FEPPrimary Language Date of RedesignationDevelopment Codes
EnrollmentData
419,783 LEP, FEP and E0records on school enrollmentand release for school years93 through 97
Student Id DateSchool EnrollmentSchool Year ReleaseSchool Term Enrollment/Release
DescriptionTeacherPersonnel File
Data on more than 1,700members of teaching staff
Teacher Name School AssignmentGender Job TitleBirth Date Credential CodesHire Date Credential Category for
each Credential Code.
CERC @ UCR III - 3
,2
09/23/97

Three Questions on Language Development Program Design
Question #3 - Program Structures: What English Language Developmentproaram options are available for students in Santa Ana USD? How do theseproarams differ in their approach to promoting English fluency and studentachievement? How many students participate in each type of program?
As described in.Section II of this report, relying on administrative program classifications todocument the effectiveness of various English Language Development strategies is likely to bemisleading because teachers' classroom practices are often influenced by their actual skills andprofessional philosophies, rather than administrative program classifications. Some teacherswho are not formally certified to implement bilingual instructional programs may do so on thebasis of informal training, and teachers who strongly believe in an English Language Immersionor a Transitional Bilingual Education approach to language development may use the techniquesappropriate to their beliefs, rather more thoroughly than those implicit in an administrative-program definition. Thus, this question was addressed by relying on teacher reports of thelanguage development strategies they actually used. As described in Sections V and VI, findingsfrom this approach to program definition were compared with those that resulted from relianceon administrative program assignments ion critical areas.
Question #4 - Program Enrollment: To what extent do programs enroll studentswith different demographic characteristics?
If students were randomly assigned to language development programs in such a way that everyprogram had an identical mix of student demographic and background characteristics, evaluationof program effectiveness would be relatively easy. Since both parents and educators arereasonably confident that particular students will benefit much more from one program approachthan another, however, such an assignment system would not be professionally responsible orpolitically feasible. Students are assigned to programs on the basis of considered judgmentsabout which program features are most likely to meet their specific needs. Consequently, it isessential in undertaking an evaluation of program effectiveness that close attention is given to thedifferences in the students being served by each program type.
Conceptually, the evaluation problem boils down to this: if students are randomly assigned andprograms are differentially effective, highly effective programs will produce higher levels ofEnglish proficiency and greater student achievement in reading and mathematics. If, on the otherhand, students are differentially assigned to the most appropriate programs, and the programs arehighly effective in meeting their specific needs, students spending the same amount of time indifferent programs will be more or less equal in their levels of English fluency and academicachievement. While outcomes will be similar, however, differential program assignment willmean that programs differ most significantly in the types of students who enter them, rather thanin the levels of attainment reached when they leave.
For this reason, a crucial element in this evaluation study was careful documentation of thedifferences in the students entering each language development program.
CERC @ UCR III - 4 09/23/97
2 9

Question #5 - Teacher Assignment: Are there systematic differences in the typesof teachers working in each of the ELD programs?
Programs cannot be expected to be equally effective if the teachers who are assigned to themdiffer substantially. For this reason, statistical analysis of the extent to which teachers in the fourSanta Ana USD programs differ systematically in age, gender, experience, education andcertification was done. Limitations imposed by the distribution of missing data and the numberof different variables that can be entered simultaneously made it necessary to examine teacheriinpacts on lanoline program performance separately from the study of student demographicfactors.
Three Ouestions on Language Development Program Effectiveness
Question #6 - Impacts on the Time it Takes to Learn English: How long does ittake for students in various language development programs to become fluent inEnolish? In addition to program design, what demographic or school factorsinfluence the rate at which students achieve fluency? Do programs differ in theireffectiveness with different types of students? Are some program designs moreeffective at promoting initial literacy development, while others work better atmoving students from intermediate to more advanced levels of Englishproficiency?
The most important advance in our understanding of English language development programsproduced by this evaluation study was the recognition that all prior research has appliedinappropriate statistical models to the assessment of how long it takes to become Englishlanguage proficient. As described in more detail in Section VI, the time it takes for developmentof language proficiency cannot be appropriately estimated by averaging the amount of time ittakes for students who succeed in reaching this goal to do so. To estimate the time it takes toreach fluency in this way ignores the learning time taken by all those students who have not yetreached fluency at the end of any given study period.
The appropriate statistical technique for estimating the time it takes to reach fluency is the onedeveloped for studies in medical science. It is called "Survival Analysis" and estimates the timeit takes to move from one status to another (often in medicine from contracting a disease to dyingfrom it, hence the name survival analysis). Survival analysis was applied to the data from SantaAna USD's student tracking system in order to produce an accurate estimate of the time requiredto reach fluency and to examine the effects of program assignment and other factors on that time.If researchers were able to track a cohort of students over a very long period of time so that everychild has had enouoh time to develop full fluency, there would be no difference between theSurvival Analysis techniques used in this evaluation study and the "average time to fluency"calculations used in prior studies. But there are no studies that have tracked all students fromtheir initial encounter with English to the development of full fluency. It is for this reason thatestimates of the time it takes keep getting longer as researchers are able to follow students for alonger period of time.
CERC @ UCR III 5 09/23/97

Ouestion #7 - Impacts on Achievement: To what extent do language-development programs affect student achievement in reading and mathematics?To what extent are Santa Ana USD students able to read at grade level duringtheir elementary school years? Does measured achievement depend significantlyon the language in which students take an achievement test? What factors, inaddition to ELD program design, have a substantial impact on studentachievement?
Reading and mathematics achievement were studied using the District's CTBS and SABE testdata. Test performances for the last three years were examined in order to estimate the rate ofachievement growth for all students who have taken District tests more than once. The statisticaltechnique used to estimate the extent to which academic achievement in reading andmathematics is influenced by language development levels and enrollment in specific languagedevelopment proerams is called General Linear Model (GLM) analysis. This procedure allowsfor the use of both variables that divide students into groups (such as ethnic background,program enrollment or home language) and variables that affect individual students (such asabsenteeism, grade level or time not enrolled in Santa Ana schools).
GLM analysis makes it possible to estimate the certainty of conclusions regarding the influenceof various factors on achievement. Additionally, GLM analysis also estimates the amount ofchange in student achievement produced by each factor.
Question #8 - Impacts on Engagement in Schooling: To the extent that studentabsenteeism is an indicator of disengagement from schooling, is there anyevidence that language development programs differ in their ability to getstudents to become more fully engaged in school?
The final question addressed in this evaluation study is the extent to which languagedevelopment proarams influence student engagement in their schooling. While we would havepreferred a better measure of engagement, information on the rate of student absenteeism fromschool Was available, and could serve as a general indicator of engagement. Of course, there arefactors other than motivation that influence attendance, so this is not an ideal variable, but (as theanalysis presented in Section VI shows) there is reasonable evidence that language developmentplays an important role in student motivation.
CERC @ UCR III - 6 09/23/97
31

IV. The Results of the Reliability Study
The reliability study component of this evaluation examined the District's data systemsused to track Limited English Proficient programs and students. An interview strategywas used to assess the extent to which staff shares a common understanding of theDistrict's proaram designs and data management systems. A more quantitative approachwas used to examine the internal integrity of the data systems themselves. This reliabilitystudy was confined to an analysis of the District data systems used to track EnglishLanguage Development programs and services. The scope of work for this evaluationstudy did not cover documentation of teachers' actual classroom practices or independentassessment of students' learning activities and language or academic achievement levels.
The Interview Study of Data System Implementation
Reliability assessment began with a series of interviews with:
District design team members,central office personnel,school site administrators,ELD chairs, andbilingual resource teachers
to identify various data systems and program elements, and to determine if datacollection procedures were uniform, well understood among teachers and administratorsand consistent in assessment and recording of student progress (see Appendix C for adescription of interviewees). This review documented Santa Ana USD's uniquelycomprehensive data management system designed to track a broad array of importantindicators of student language and academic development. Interviews with school sitestaff, District office staff and District computer center personnel revealed a clear patternof respect for the importance of the data, and substantial care in generating and recordingrequired data elements. The most important data elements are collected using an annualsurvey soliciting teachers' judgments regarding the levels of English and primarylanguage proficiency for all students and asking them to report on the nature of languagedevelopment services provided to all students. Distributed once each year, this surveytracks the prozress of all Limited English Proficient students as they move throughvarious langune development stages toward re-designation as Fluent English Proficient.The surveys utilize scannable forms that are scanned at the District's computer center andentered into the District's comprehensive student database.
The District holds training sessions to train bilingual resource teachers on variabledefinitions and procedures for completing these annual surveys. The resource teacherstrain other teachers at each school site. The bilingual resource teachers are responsible toensure that the surveys are filled out correctly at their respective school sites. Teacherswho have problems completing the surveys receive one-on-one assistance from thebilingual resource teachers.
CERC @ UCR IV - 1 09/23/97
32

The District also provides documents that define and describe the criteria used for-
distinguishing. language development levels. These guidelines encourage uniformity andconsistency in student and program reporting. This information can be found in a Districtdocument entitled, LEP Student Program Services Database Information &Instructions (1995). The criteria used for distinguishing language development levelsaddress several widely recognized stages of language acquisition. These stages, referredto in the District document as the "language development progression," were used toanalyze the transition rate at which students moved toward English language fluency.The stages are known as the "W Codes" in the District documents and identified withthese codes on the annual survey. There are five codes for English languagedevelopment (WO-W4) and five codes for Primary or native language development (W5-W9). The coded levels have the same names for English and Primary languagedevelopment, with each stage characterized by several descriptors to guide teacherjudgment of student progress. The descriptors refer to student language learningbehaviors that can be observed by teachers in determining the precise stage or level ofeach student's proficiency. The five stages of English language development are listedbelow, together with some of the accompanying indicators of stage-appropriate languagebehavior.
Code Stage Name and DescriptorsWO Preproduction (ELD 1)
Uses physical responses, i.e., actions and gesturesResponds through performing an actionPoints to items or pictures
WI Early Production (ELD 2)Uses actions and gesturesSpeaks using one or two-word phrasesUses yes/no answers
Speech Emergence (ELD 3)Expands receptive vocabulary by following complex
directionsPlays simple gamesUses complete sentences
W3 Intermediate Fluency (ELD 4)Produces oral and written connective narrativesEngages in conversation, problem/solution, discussions,
debates, interviews, and extended dialoguesUses content area vocabulary
W4 Advanced Fluency (ELD 5)Fully conversantContinues enrollment in transitional/sheltered classes
CERC. @ UCR IV - 2 09/23/97
33

Placed in the mainstream of courses, based on studentproaress and teacher recommendation
In addition to recording teacher judgments regarding each student's languagedevelopment level, the Districts Program Services survey form (see Appendix D) recordsstudents' bilincual program assignment using a series of codes beginning with the letter"V," referred to as the "V Codes." These codes distinguish among seven differentlanguage development program options, as follows:
Code DescriptionVO TBE/Literacy/EASE Transitional Bilingual
Education (Native Language Instruction)V 1 TBE/TLC Transitional Language Class
(Transitional/Sheltered English)V2 ELD/Immersion/Sheltered With a Bilingual
Instructional Assistant in Native LaneuageV3 ELD/Immersion/Sheltered With a Bilingual
Instructional Assistant in other LanguageV4 ELD/Immersion/Sheltered No Bilingual
Instructional AssistantV5 ELD and Mainstream InstructionV6 Mainstream only
The program codes utilized on the District Program Services survey do not necessarilyreflect the services students actually receive. They are administrative program codes andwere created to record student classifications that correspond to program regulationsrather than teaching activities. California has created a variety of program requirementsand teacher credentials targeting the needs of English language learners and requiresschool districts to define program assignments in terms of whether these requirements arefulfilled. As a result, if students are receiving various bilingual instructional servicesfrom teachers who are not fully credentialled to offer them, they will be given a "V6Mainstream- or other V-Code corresponding to the teacher's credential status.
While this does not make District data any less reliable, it does change the way in whichstudents must be classified if we are to assess the effectiveness of the services theyreceive rather than of administrative program designations. In order to analyze thelanauage development services LEP students actually receive, it is necessary to utilizeboth the V-Code data and the information provided by teacher reports on the instructionalpractices used in their classrooms. This information is reported on the District surveyform as part of a series of "Y" and "Z" Service Codes. These codes are used to describethe extent to which teachers use native language, immersion teclmiques or mainstream.educational practices in reading and other subject areas.
The care the District staff has taken to train teachers, to use the same survey forms andprocedures from year to year, and to process and store the data reliably has helped toensure consistency and reliability in the assignment of ELD codes and monitoring of LEP
CERC @ UCR IV - 3 09/23/97
3 4

student reclassification and redesignation. Additionally, many bilingual resourceteachers have utilized on-line data system access to keep student information up to date.The frequency of information updating can be judged from the fact that 25 percent of theentries in the LEP database are entered at times other than the annual survey date.
The Quantitative Side of Reliabiliry Analysis
In addition to the interview-based review of data system operation and reliability, CERCstaff undertook a statistical reliability check aimed at measuring the extent to whichteachers use consistent definitions and procedures in recording student English languagedevelopment levels. A special administration of the District's Program Services surveywas done in Aueust 1996, covering a representative sample of 2,500 students. This wasdone in anticipation that it could be coordinated with the regular annual survey scheduledfor September. The September survey was expected to collect data on all of theapproximately 35,600 LEP students in the District including the 2,500 surveyed inAugust. This would have permitted a reliability check by comparing the August andSeptember reports of student ELD levels and services assignments (which would havebeen provided by different teachers within a brief span of time). Unfortunately, thecrush of accommodating class assignment and staffing changes brought on by theCalifornia Class Size Reduction Initiative forced significant delay on the annual surveywhich could not be completed until January, 1997. Since students are expected to movefrom one laneuage development level to another and to have services adjustedcommensurate with their learning, the time interval between August and the followingJanuary is too long for a rigorous reliability analysis. Comparison of these two data setsdoes indicate, however, that student data reporting is consistent and reasonable, withstudents generally advancing from one English language development level to the next ina timely fashion.
The most important conclusion to be drawn from the comparison of these two data sets is
that students move from one English language development level to another and receiveappropriate changes in their language programs throughout the year, not just at timeswhen the obligatory annual report is made. In most schools, interview data reveal LEPstudent achievement and language development needs are reviewed at the time trimesterreport cards are generated and program adjustments made based on those assessments.Some schools even maintain their own paper form or electronic databases in order totrack program changes more frequently. While school staff members recognize the valueof completing the District requested survey of program services, they tend to see it moreas a reporting device than as a tool to help them make decisions regarding programs andservices for LEP students. It is, therefore, recommended that the annual surveys becompleted every trimester at the same time the students' report cards are prepared.
Five additional issues were identified, while checking the data for reliability. First,service delivery to middle and high school students is not recorded on the annualProgram Services survey. This makes it impossible to perform some importantevaluation analyses for these students. For example, without program service data it is
CERC @ UCR IV - 4 09/23/97
35

not possible to assess the impact of langua2e development programs on the acadernicachievement of middle and high school students.
Second, for a large number of students the scale scores on CTBS and SABE tests are notavailable in the District database, making it necessary to limit analysis to normal curveequivalence (NCE) scores. These two scales are mathematically linked, so no real loss inachievement information was suffered. The primary difference between these twoscoring systems is that NCE scores are calculated in such a way that the average score forstudents at every grade level is 50 points. Scale scores, on the other hand, are constructedso that the expected average score goes up each year as students progress to highergrades. Percentile and grade-equivalence scores, which were available for analysis, areconvenient indices, but they are not suitable for statistical analysis of factors influencingachievement.
The NCE scores from CTBS and SABE are accurately norm-referenced and can be usedto effectively compare student achievement against grade-level expectations. That is, it isappropriate to compare CTBS and SABE scores among student groups and acrosslanguage development program designs.
Third, there were no standardized test data for kindergarten and first grade students foracademic year 1997. In previous years, first graders had been tested but scores on thesestudents have often been viewed as unreliable and they were dropped as a result. Thismeans that there are no academic achievement data available on more than 10 percent ofthe District students. These students, included in assessments of language developmentare dropped from analyses related to academic achievement.
Fourth, althoueh the data management system provides grade point averages for middleand high school students, it does not capture this information for the elementary students.Both the desien team and CERC staff agreed that obtaining student report card gradeswould be an important source of information regarding academic achievement. On apilot basis. CERC staff developed 11 data collection forms to match elementary reportcards used during the last three years. A feasibility study was made to determine if itwould be possible to use these forms to collect report card data on a sample of four orfive thousand LEP and English proficient students in grades K-5. (Copies of thescannable forms are in Appendix E). After pilot testing the process at one elementaryschool it was discovered that the amount of time required to reproduce this data wouldgreatly exceed the resources available for this evaluation study. It is recommended thatelectronic report cards be designed so that teacher judgment regarding student academicprogress can be captured as an important means of testing language developmentprogram effectiveness. Electronic report cards would permit automatic scanning of thisinformation into the District LEP database at the end of each trimester.
Fifth, we note that teachers do not track the exit dates for students' LanguageDevelopment levels with great consistency. For 4.504 students of the 35,678 students forwhom ELD levels are reported, the exit dates for one ELD level do not correspond tostarting dates for their next ELD level. To resolve this issue the exit date variable was
CERC@UCR IV - 5 09/23/97
36

dropped from the analysis and the end of each level was reset to correspond to thestarting date for the next level. Further, approximately 1,719 of the 35, 678 students werereclassified from a higher to a lower ELD level (that is, they have a start date for a lowerELD classification that is later in time). This indicates that teachers occasionallydecrease their estimates of student English proficiency by 1 or 2 levels. It is impossibleto know whether these lowered estimates of language proficiency are the result of earliererrors in recording or the result of the fact that judging student attainment is complex andmay change as teachers have more experience with a particular student. We developed arecoding scheme that was reviewed and approved by the Design Team to solve this
inconsistency.
The recoding scheme was based on the assumption that language proficiency itself doesnot diminish over time. Thus, in each of these cases we assigned the earliest reportedstarting date for the lowest ELD level achieved by the student. Then, each ELD levelassignment starting date for a student was compared to all lower ELD level assignmentdates, and kept only if it was more recent than the assignment dates corresponding to all
lower ELD levels.
Fortunately, each of the five reliability issues identified above was spread broadly acrossthe LEP database, keeping systematic distortion to a minimum. Where data werecollected and recorded, we estimate that at least 90 percent of all records are accurate andreliable for use in statistical analyses.
CERC @ UCR IV - 6 09/23/97

V. Bilingual Program Enrollments, Student and Teacher Characteristics
Before analyzing, the character and impact of various approaches to English LanguageDevelopment being utilized in Santa Ana USD, it is important to develop a general picture of thestudents enrolled in this large, urban and highly diverse community and to identify the nature andsize of the various instructional programs in which they are enrolled. The data files available forthis evaluation study contain records on 53,026 students enrolled in grades Kindergarten through12th grade. Nearly 90 percent of these students are of Hispanic origin, however all of the majorethnic groups tracked in the California Basic Education Data System (CBEDS) are represented.Students from various Asian backgrounds slightly outnumber the Whites (2,476 to 2,154).Blacks constitute a bit more than 1 percent of the student population, while Native American,Filipino and Pacific Island groups each represent substantially less than 1 percent.
Fewer than 20 percent of all SAUSD students are native English speakers. While Spanish is, byfar, the most common non-English language (spoken by almost two-thirds of the student body),at least 31 other languages are native to the remaining one-fifth of the students.
Just about three out of every four students lives in poverty.
More than half of the students (57 percent) attend year-round schools.
When it comes to English Language Development, the student body can be divided into fivedistinct groups. About one child in five (18%) are native English speakers and do not receiveservices for Limited English Proficient students. An additional 14 percent of the students haveattained Fluent English Proficient status and are not now receiving LEP services. Of theremaining two-thirds of the students, about half (31 percent of all students) are receivingTransitional Bilingual Education services. Fourteen percent have been receiving their EnglishLanguage Development support through Immersion programs, while about 10 percent of allstudents have received some combination of TBE and Immersion instruction.
Student Enrollment. Table V.1, below, shows the instructional service pattern at each ofthe District's 45 schools. In the left hand column are listed the school names. Across thecolumns of the table are shown the actual count and the percentage of each school's student bodybelonging to each of the five different language development groups.
As the table reveals, Limited English Proficient students are far from evenly distributed amongthe SAUSD schools. Although only 35 percent of the district students are enrolled inTransitional Bilingual Education programs, a number of schools are providing more than halftheir students with TBE services. To be exact, 19 of the 32 elementary schools in the districthave identified at least half of their students for Transitional Bilingual Education services (eitheralone or in combination with Immersion programs). In contrast, at least 50 percent of thestudents in four elementary schools (Muir, Greenville, Taft and Mitchell) and one intermediateschool (MacArthur) are not designated as Limited English Proficient and are not given anybilingual program services. In four other elementary schools (Jefferson, Madison, Martin andKing) the Non-LEP student group is larger than those in any one bilingual education programgroup. No high school has more than 15 percent of their students designated for TBE, all but one
CERC @ UCR V-1 05/21/9838

have less than half that number. While 16 percent of all students are being served in Immersionclasses, they are dispersed among schools in such a way that no school has more than half of itsstudents so designated.
Table V.1: Student Enrollment by School by ELD Program
Program Enrollment as Defined by Language Services Provided
SchoolNot LEP/FEP TBE TBE + Immer Immersion Mainstream LEP Mainstream FEP School Total
Count Percent Count Percent Count Percent Count Percent Count Percent Count Percent Count43 Pio Pico Elem 29
13799
109172
4 727473368588519
es 2944
121
76157
4 2586158122
158
3 1861
534745
2 1682836464
2 844883882
1,0061,115
50 Adams Elem 17 se 5 11 8 951 Diamond Elem 12 46 15 20 7 952 Edison Elem 12 62 8 13 5 654 Fremont Elem 16 49 15 15 4 655 Harvey Elem 58
195242360117
11 307616400323507
so 81
1554642
193
16 478214722652
9 21
472363343
4 356286
16850
6 5491,1571,1571,152
962
56 Hoover Elem 18 56 14 7 4 557 Jackson Elem 23 37 4 14 22 758 Jefferson Elem 37 33 4 23 3 1 5
59 Lincoln Elem 13 56 21 6 5 560 Lowell Elem 54
56320
403102
5 697476305252423
67 187166113220115
18 6282274071
6 405
481440
4 1724274383
2 1,0571,316
540972834
61 Madison Elem 44 37 13 6 o 262 Franklin Elem 4 59 22 5 9 563 Martin Elem 43 27 24 4 2 464 Monroe Elem 14 se 15 9 5 10
65 Monte Vista Elem 270474143408104
30 4838
775486376
53 621
31
88190
7 459
528083
5 43125as3327
5 161544310486
2 919771
1,0791,199
866
66 Muir Elem 77 1 o I 20 2067 Roosevelt Elam 14 75 3 5 3 468 Santiago Elem 37 44 8 7 3 969 Sepulveda Elem 13 48 24 11 3 1070 Greenville Elem 531
22616044656
76 11
704721
6293
2 1
591482816
o 80107111
379107
11 771249348
11 19991
4521055
22 8991,2001,2341,103
535
71 Washington Elem zo 84 5 10 1 872 Wilson Elem 13 61 12 9 4 473 Taft Elem so 1 3 42 4 1 9
75 Remington Elem 12 81 3 22 2 1 0
76 Mt View HS 41
27510444993
28 1
221
60396
1
26233
575
51
27736540
3 9827
361
146239
se 657
148450249
31 210310
1,3731,1742,092
77 Mitchell Elem 91 o 9 278 Sierra Intermediate 8 18 21 23 29 11
79 MacArthur Intermediate 62 8 5 5 20 3880 Lathrop Intermediate 5 21 31 29 13 1 2
81 Santa Ana HS 207314140244380
9 18868
407332339
8 16573
26237096
7 635620336355168
28 10381055406276565
48 529798276149390
1 9 2,7622,9281,8271,7261,938
82 Valley HS 15 3 3 29 50 2783 Carr Intermediate 9 28 17 22 26 1 5
84 Willard Intermediate 15 21 23 23 18 985 McFadden Intermediate 25 22 8 11 36 2086 Saddleback HS 469
1293295432
26 241682623
520
1 1831764
62
1 41738041835114
23 87518497522919
49 985197780848
35 2,7881,3752,592
425755
87 Spurgeon Intermediate 11 14 27 32 16 . 14
90 Century HS 18 1 4 23 54 3091 Cesar Chavez HS 16 7 10 67 2092 Kennedy Elem 4 70 8 15 3 /93 Heninger Elem 39
187107
33327
4 722531
601
373273
81 601226523
123
7 499
51
19432
6 17
6519
1661
2 28354661
19
3 915949889700835
94 Garfield Elem 20 58 13 1 7 495 Carver Elem 13 71 8 6 2 597 Walker Elem 5 se 4 30 3 998 King Elem ao 33 15 4 7 2
Total all Schools 9,431 21 16,117 35 5,059 11 7,110 16 7,865 17 7,213 1 4 53,026
Table V.2 rearranges the ELD program enrollment data by grade level. The data in this tabledemonstrate that student enrollment differs from year to year, as well as by school. The TBEprogram enrollment is much more heavily concentrated in the early elementary years (withgrades 1, 2 and 3 assigning more than half their students to Transitional program services).
CERC @ UCR V-2
3 3
05/21/98

Mainstrearo Fluent English Proficient enrollments go up steadily as the children get older, withmore than a third of all high school seniors being assigned to Mainstream FEP programs.Immersion and English only enrollments are more consistent across the grades.
Table V.2: Student Enrollment by Grade Level by ELD Program
Program defined language services provided Table Total
Not LEP/FEPProficiency TBE
TBE &Immersion Immersion
MainstreamLEP
MainstreamFE P
Count, Row % Count Row % Count Row % Count Row % Count Row % Count Row % Count Row %GRADE 0 2051 34.5% 2575 43.3% 46 .8% 480 8.1% 489 8.2% 301 5.1% 5942 100.0%
1 1277 22.1% 3073 53.3% 201 3.5% 514 8.9% 318 5.5% 386 6.7% 5769 100.0%
2 926 18.5% 2695 53.9% 318 6.4% 535 10.7% 167 3.3% 359 7.2% 5000 100.0%
3 808 17.6% 2403 52.4% 403 8.8% 476 10.4% 167 3.6% 332 7.2% 4589 100.0%
4 691 16.6% 1730 41.5% 830 19.9% 449 10.8% 135 3.2% 337 8.1% 4172 100.0%
5 725 17.6% 1388 33.8% 1026 25.0% 434 10.6% 142 3.5% 396 9.6% 4112 100.0%
6 535 13.5% 1048 26.5% 1056 26.7% 523 13.2% 288 7.3% 504 12.7% 3954 100.0%
7 520 13.3% 614 15.7% 716 18.3% 666 17.0% 758 19.4% 635 16.2% 3909 100.0%
8 485 13.3% 261 7.2% 143 3.9% 903 24.8% 1132 31.0% 724 19.8% 3648 100.0%
9 501 12.6% 120 3.0% 130 3.3% 982 24.7% 1366 34.4% 874 22.0% 3973 100.0%
10 401 12.0% 32 1.0% 119 3.6% 624 18.7% 1278 38.3% 883 26.5% 3337 100.0%
11 337 12.9% 108 4.1% 55 2.1% 371 14.2% 939 36.0% 801 30.7% 2611 100.0%
12 252 13.6% 70 3.8% 16 .9% 153 8.2% 687 37.0% 681 36.6% 1859 100.0%
Table Total9509 18.0% 16117 30.5% 5059 9.6% 7110 13.4% 7866 14.9% 7213 13.6% 53026 100.0%
Table V.3 breaks down the student enrollment data by the official administrative designationsused to classify all students. Seven of the columns in this table correspond to the V-Codes foundon the district bilingual services tracking survey form. The ninth column shows the count ofstudents not designated as Limited or Fluent English Proficient (the numbers in this column areidentical with those in the first column of Table V.1). Many more students in this table aredesignated as in "Mainstream Only" LEP programs (12,997 versus only 7,865 in Table V.1)because teachers not adequately credentialed for bilingual instruction are administrativelyclassified as serving mainstream programs, even if they use Transitional Bilingual or Immersioninstructional techniques. But for this shift, the information in this table closely parallels that seenin Table V.1. Note that on the basis of administrative classification, Jackson and Santiagoschools join Jefferson, Madison, Martin, Muir, Greenville, Taft, Mitchell and King as schoolswith relatively large English only enrollments. It is also important to recognize that Diamond,Edison, Lincoln, Franklin, Sepulveda and Walker schools all report a plurality of their studentsto be officially enrolled in mainstream programs, the teacher service delivery reports presented inTable V.1 indicate that most students in these schools are actually receiving TBE services.
Table V.4 maps the relationship between the two methods of English Language Developmentprogram definition. As this table reveals, three factors account for virtually all of thereclassification of students. First, a number of students in the administrative group labeled TBE(171) and TLC (670) also were reported to be receiving Immersion instructional services and aretherefore moved into the combined TBE & Immersion column. Second a somewhat larger groupof students administratively identified as in Immersion programs are reported to have received at
CERC @ UCR V-3 05/21/98

1
1
1
least some instruction in TBE programs and are thus classified as having been in both programs(1,814 from the Immersion + Native language aide group, 208 from the Immersion + bilingual
Table V.3: Student Enrollment by School in Programs Defined by V-Codes on Survey Form
V-Code Program in 97 Table Total
TBE - NativeTLC -
TransitionalImmersion +
NativeImmersion +
OtherImmersion
onlyMainstream
+ ELDMainstream
onlyFEP
MainstreamEng Only
Mainstream
CountRow
% CountRow% Count
Row% Count
Row% Count
Row% Count
Row% Count
Row% Count
Row% Count
Row% Count Row %
Pio Pico Elem 634 76% 107 13% 18 2% 5 1% 2 0% 4 0% 17 2% 15 2% 29 3% 844 100%Adams Elem 256 29% 160 18% 48 5% 18 2% 23 3% 11 1% 141 16% 81 9% 137 16% 883 100%Diamond Elem 140 16% 95 11% 131 15% 4 0% 13 1% 46 5% 269 31% 73 8% 99 11% 882 100%Edison Elem 240 24% 105 11% 77 8% 25 3% 3 0% 377 38% 57 6% 109 11% 1006 100%Fremont Elem 402 38% 103 10% 198 18% 29 3% 9 1% 1 0% 94 9% 63 6% 172 16% 1115 100%Harvey Elem 241 44% 68 13% 22 4% 1 0% 48 9% 1 0% 71 13% 33 6% 58 11% 549 100%Hoover Elem 383 34% 216 19% 102 9% 2 0% 42 4% 7 1% 141 12% 53 5% 195 17% 1157 100%Jackson Elem 197 20% 116 12% 92 9% 38 4% 20 2% 11 1% 175 18% 82 8% 242 25% 1157 100%Jefferson Elem 221 19% 16 1% 101 9% 90 8% 22 2% 10 1% 159 14% 160 14% 360 32% 1152 100%Uncoln Elem 260 28% 39 4% 148 16% 4 0% 12 1% 7 1% 315 33% 43 5% 117 12% 962 100%Lowell Elem 278 27% 357 35% 110 11% 41 4% 16 2% 30 3% 112 11% 17 2% 54 5% 1057 100%Madison Elem 274 21% 162 12% 79 6% 63 5% 81 6% 1 0% 69 5% 21 2% 563 43% 1316 100%Franklin Elem 89 18% 126 25% 70 14% 1 0% 7 1% 23 5% 141 28% 24 5% 20 4% 540 100%Martin Elem 149 15% 136 14% 143 15% 3 0% 43 4% 17 2% 27 3% 43 4% 403 42% 972 100%Monroe Elem 267 33% 80 10% 23 3% 103 13% 2 0% 163 20% 80 10% 102 12% 834 100%Monte Vista Elem 294 33% 69 8% 37 4% 17 2% 1 0% 37 4% 151 17% 15 2% 270 30% 919 100%Muir Elem 1 0% 1 0% 4 1% 1 0% 1 0% 33 5% 75 10% 138 19% 474 65% 771 100%Roosevelt Elem 550 53% 182 17% 60 6% 2 0% 6 1% 70 7% 33 3% 143 14% 1079 100%
Santiago Elem 202 17% 210 18% 14 1% 76 6% 7 1% 172 14% 102 9% 408 34% 1199 100%Sepulveda Elem 87 10% 130 15% 161 19% 5 1% 2 0% 19 2% 265 31% 82 10% 104 12% 866 100%Greenville Elem 1 0% 10 1% 76 9% 81 9% 195 22% 531 59% 899 100%Washington Elem 385 32% 226 19% 72 6% 11 1% 10 1% 9 1% 164 14% 89 7% 226 19% 1200 100%Wilson Elem 423 35% 258 22% 81 7% 3 0% 42 4% 17 1% 167 14% 44 4% 160 13% 1234 100%Taft Elem 1 0% 298 27% 30 3% 4 0% 3 0% 118 11% 190 17% 446 41% 1103 100%
Remington Elem 125 24% 108 20% 34 6% 15 3% 146 28% 44 8% 56 11% 535 100%MI View HS 1 1% 1 1% 29 15% 61 31% 65 33% 41 21% 210 100%
Mitchell Elem 1 0% 15 5% 7 2% 275 92% 310 100%Sierra Intermediate 17 1% 128 10% 247 19% 10 1% 19 1% 385 30% 284 22% 101 8% 104 8% 1373 100%
MacArthur Intermediate 51 4% 4 0% 1 0% 9 1% 20 2% 266 23% 369 32% 449 38% 1174 100%Lathorpe Intermediate 59 3% 60 3% 202 10% 97 5% 132 6% 732 35% 526 25% 180 9% 93 4% 2092 100%Santa Ana HS 29 1% 6 0% 9 0% 1 0% 632 23% 42 2% 1359 50% 441 16% 207 8% 2762 100%
Valley HS 3 0% 10 0% 8 0% 4 0% 201 7% 318 11% 1407 49% 613 21% 314 11% 2928 100%
Carr Intermediate 31 2% 160 9% 212 12% 7 0% 168 9% 217 12% 672 37% 199 11% 140 8% 1827 100%
Willard Intermediate 159 9% 38 2% 111 7% 4 0% 411 24% 185 11% 424 25% 123 7% 244 14% 1726 100%
Mcfadden Intermediate 2 0% 29 2% 17 1% 7 0% 17 1% 631 33% 509 26% 332 17% 380 20% 1938 100%
Saddleback HS 12 0% 241 9% 13 0% 8 0% 23 1% 1143 41% 853 31% 469 17% 2788 100%
Spurgeon Intermediate 27 2% 17 1% 374 27% 2 0% 15 1% 293 21% 367 27% 143 10% 129 9% 1375 100%Century HS 1 0% 209 8% 2 0% 27 1% 232 9% 1174 45% 609 24% 329 13% 2592 100%
Cesar Chavez HS 1 0% 2 0% 2 0% 32 8% 247 59% 80 19% 54 13% 425 100%
Kennedy Elem 289 39% 186 25% 59 8% 36 5% 13 2% 5 1% 110 15% 8 1% 32 4% 755 100%
Heninger Elem 494 55% 180 20% 55 6% 4 0% 18 2% 27 3% 56 6% 25 3% 39 4% 915 100%Garfield Elem 242 27k 200 22% 65 7% 1 0% 8 1% 22 2% 151 17% 34 4% 187 21% 949 100%Carver Elem 367 42% 184 21% 16 2% 1 0% 55 6% 1 0% 100 11% 46 5% 107 12% 889 100%
Walker Elem 141 21% 82 12% 80 12% 51 7% 1 0% 1 0% 235 34% 60 9% 33 5% 700 100%King Elem 106 13% 67 8% 68 8% 12 1% 53 6% 2 0% 179 22% 14 2% 327 39% 835 100%
Table Total 8093 16% 4503 9% 4114 8% 622 1% 2423 5% 3579 7% 12997 25% 6081 12% 9509 18% 53026 100%
aide with a different language program, and 1,037 from the Immersion only program). Third, thesubstantial number of students administratively classified as in one of the two mainstream
CERC @ UCR V-4
4 105/21/98
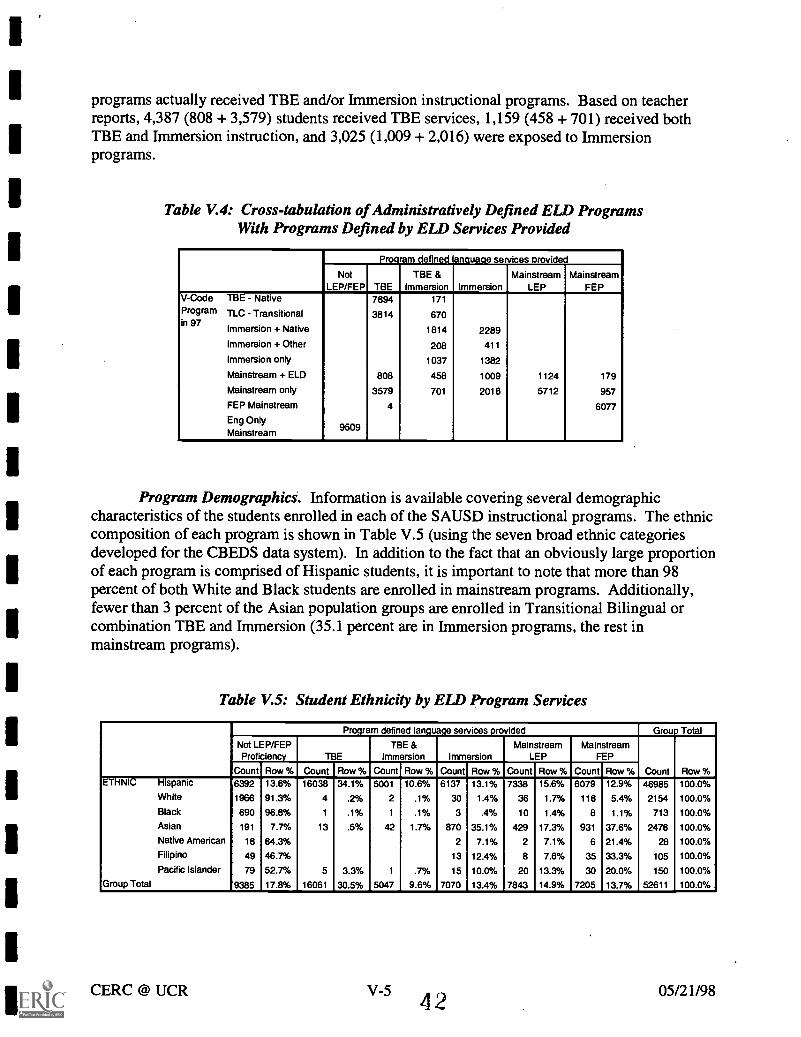
1
1
programs actually received TBE and/or Immersion instructional programs. Based on teacherreports, 4,387 (808 + 3,579) students received TBE services, 1,159 (458 + 701) received bothTBE and Immersion instruction, and 3,025 (1,009 + 2,016) were exposed to Immersionprograms.
Table V.4: Cross-tabulation of Administratively Defined ELD ProgramsWith Programs Defined by ELL) Services Provided
Program defined anguage services provided
NotLEP/FEP TBE
TBE &Immersion Immersion
MainstreamLEP
MainstreamFEP
V-Code TBE - Native 7894 171
Program TLC - Transitionalin 97
3814 670
Immersion + Native 1814 2289
Immersion + Other 208 411
Immersion only 1037 1382
Mainstream + EIS) 808 458 1009 1124 179
Mainstream only 3579 701 2016 5712 957
FEP Mainstream 4 6077
Eng OnlyMainstream 9509
Program Demographics. Information is available covering several demographiccharacteristics of the students enrolled in each of the SAUSD instructional programs. The ethniccomposition of each program is shown in Table V.5 (using the seven broad ethnic categoriesdeveloped for the CBEDS data system). In addition to the fact that an obviously large proportionof each program is comprised of Hispanic students, it is important to note that more than 98percent of both White and Black students are enrolled in mainstream programs. Additionally,fewer than 3 percent of the Asian population groups are enrolled in Transitional Bilingual orcombination TBE and Immersion (35.1 percent are in Immersion programs, the rest inmainstream programs).
Table V.5: Student Ethnicity by ELD Program Services
Program defined language services provided Group Total
Not LEP/FEPProficiency TBE
TBE &Immersion Immersion
MainstreamLEP
MainstreamFEP
Count Row %Count Row % Count Row % Count Row % Count Row % Count Row % Count Row %ETHNIC Hispanic 6392 13.6% 16038 34.1% 5001 10.6% 6137 13.1% 7338 15.6% 6079 12.9% 46985 100.0%
White 1966 91.3% 4 .2% 2 .1% 30 1.4% 36 1.7% 116 5.4% 2154 100.0%
Black 690 96.8% 1 .1% 1 .1% 3 .4% 10 1.4% 8 1.1% 713 100.0%
Asian 191 7.7% 13 .5% 42 1.7% 870 35.1% 429 17.3% 931 37.6% 2476 100.0%
Native American 18 64.3% 2 7.1% 2 7.1% 6 21.4% 28 100.0%
Filipino 49 46.7% 13 12.4% 8 7.6% 35 33.3% 105 100.0%
Pacific Islander 79 52.7% 5 3.3% 1 .7% 15 10.0% 20 13.3% 30 20.0% 150 100.0%
Group Total 9385 17.8% 16061 30.5% 5047 9.6% 7070 13.4% 7843 14.9% 7205 13.7% 52611 100.0%
CERC @ UCR V-54 2
05/21/98

With only 28 total students identified, the Native American population is too small to considerstudying independently. And the Filipino and Pacific Island groups are too small to support anyconclusions where evidence is at all mixed.
Table V.6 shows a breakdown of instructional program enrollment by the native language of thestudents. Not surprisingly, this data closely parallels the ethnic data just described. English onlystudents (with a single exception that is apparently a coding error) are not receiving LEPservices. About half of the Spanish speakers are in TBE or mixed TBE and Immersionprograms. Nearly half the Vietnamese speakers, about a third of the Cambodian and Laospeakers, and more than half of the students in the "All Other Languages" group have achievedFluent English Proficient status and are no longer receiving ELD services. This contrasts rathersharply with the 15.1 percent of native Spanish speakers and 22.5 percent of native Hmongspeakers who have been redesignated as FEP.
Table V.6: Student Languages by ELD Program Services(all language groups with more than 100 native speakers)
Program defined lanouage services provided Grou 3 Total
Not LEP/FEPProficiency TBE
TBE &Immersion Immersion
MainstreamLEP
MainstreamFEP
Count Row %Count Row % Count Row % Count Row % Count Row % Count Row % Count Row %Language English Onlygroup Spanish
Vietnamese
Cambodian
Lao
Hmong
Other Lang
Group Total
9509
9509
100.0%
18.0%
16103
5
1
3
3
16115
39.5%
.4%
1.0%
2.2%
.6%
30.5%
5016
22
10
5
2
4
5059
12.3%
1.9%
1.5%
4.8%
1.4%
.8%
9.6%
1
6117
438
302
35
72
143
7108
.0%
15.0%
37.0%
45.3%
33.3%
52.2%
28.4%
13.4%
7376
189
154
24
30
86
7859
18.1%
16.0%
23.1%
22.9%
21.7%
17.1%
14.9%
6140
529
200
40
31
268
7208
15.1%
44.7%
30.0%
38.1%
22.5%
53.2%
13.6%
9510
40752
1183
666
105
138
504
52858
100.0%
100.0%
100.0%
100.0%
100.0%
100.0%
100.0%
100.0%
As reported in Table V.7, poverty among the SAUSD students is not evenly spread across thevarious instructional programs. Three-quarters of all students are at or below the poverty line,but only half of those who are not LEP classified fall into this group. Transitional BilingualEducation programs serve the largest proportion of poverty children (more than 90 percent),while Immersion programs have an 80.7 percent rate and mainstream programs, a below average60 to 70 percent poverty rate.
Table V.7: Student Poverty Rates by ELD Program Services
Program defined language services provided Grou Total
Not LEP/FEP TBE & Mainstream MainstreamProficiency TBE Immersion Immersion LEP FEP
Count Col % Count Col % Count Col % Count Col % Count Col % Count Col % Count Col %,
Poverty Non-Poverty 4847 51.0% 1581 9.8% 469 9.3% 1374 19.3% 2364 30.1% 2995 41.5% 13630 25.8%Status Poverty 4662 49.0% 14536 90.2% 4590 90.7% 5736 80.7% 5502 69.9% 4218 58.5% 39244 74.2%Group Total _9509 100.0% 16117 100.0% 5059 100.0% 7110 100.0% 7866 100.0% 7213 100.0% 52874 100.0%
CERC @ UCR V-64 3
05/21/98
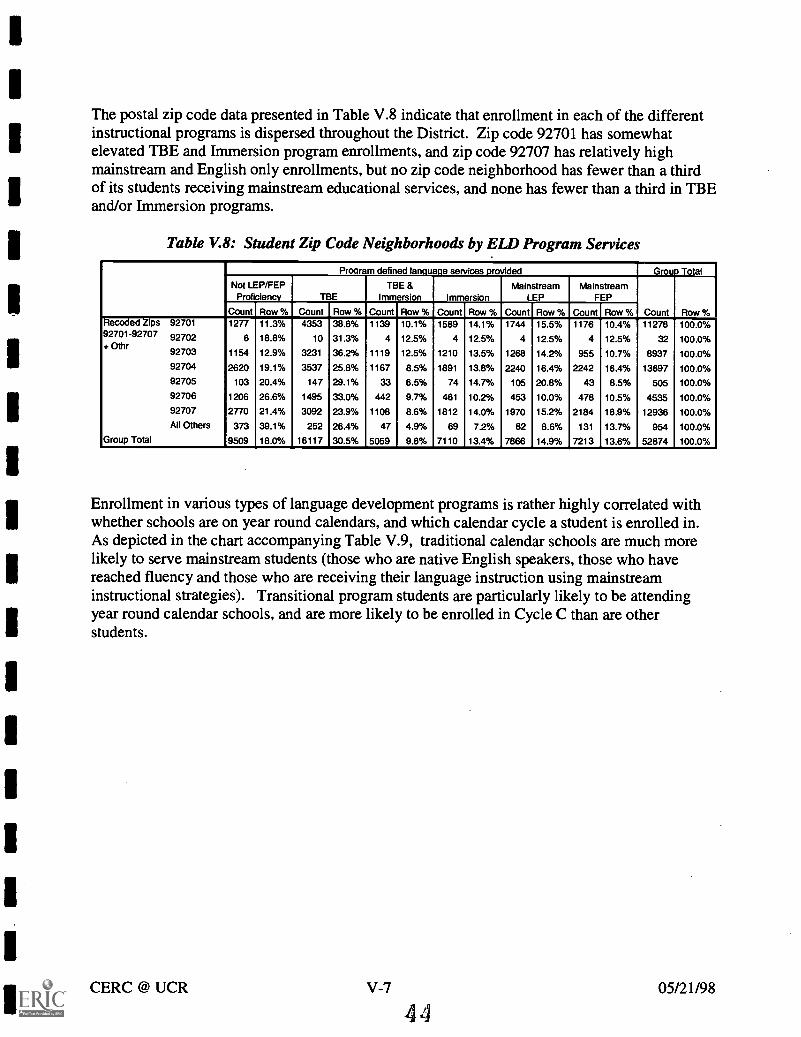
1
The postal zip code data presented in Table V.8 indicate that enrollment in each of the differentinstructional programs is dispersed throughout the District. Zip code 92701 has somewhatelevated TBE and Immersion program enrollments, and zip code 92707 has relatively highmainstream and English only enrollments, but no zip code neighborhood has fewer than a thirdof its students receiving mainstream educational services, and none has fewer than a third in TBEand/or Immersion programs.
Table V.8: Student Zip Code Neighborhoods by ELD Program Services
Program defined language services provided Group Total
Not LEP/FEPProficiency TBE
TBE &I mmersion I mmersion
MainstreamLEP
MainstreamFEP
Count Row %Count Row % Count Row % Count Row % Count Row % Count Row % Count Row %Recoded Zips 92701 1277 11.3% 4353 38.6% 1139 10.1% 1589 14.1% 1744 15.5% 1176 10.4% 11278 100.0%92701-92707 92702 6 18.8% 10 31.3% 4 12.5% 4 12.5% 4 12.5% 4 12.5% 32 100.0%+ Othr
92703 1154 12.9% 3231 36.2% 1119 12.5% 1210 13.5% 1268 14.2% 955 10.7% 8937 100.0%92704 2620 19.1% 3537 25.8% 1167 8.5% 1891 13.8% 2240 16.4% 2242 16.4% 13697 100.0%92705 103 20.4% 147 29.1% 33 6.5% 74 14.7% 105 20.8% 43 8.5% 505 100.0%92706 1206 26.6% 1495 33.0% 442 9.7% 461 10.2% 453 10.0% 478 10.5% 4535 100.0%92707 2770 21.4% 3092 23.9% 1108 8.6% 1812 14.0% 1970 15.2% 2184 16.9% 12936 100.0%All Others 373 39.1% 252 26.4% 47 4.9% 69 7.2% 82 8.6% 131 13.7% 954 100.0%
Group Total 9509 18.0% 16117 30.5% 5059 9.6% 7110 13.4% 7866 14.9% 7213 13.6% 52874 100.0%
Enrollment in various types of language development programs is rather highly correlated withwhether schools are on year round calendars, and which calendar cycle a student is enrolled in.As depicted in the chart accompanying Table V.9, traditional calendar schools are much morelikely to serve mainstream students (those who are native English speakers, those who havereached fluency and those who are receiving their language instruction using mainstreaminstructional strategies). Transitional program students are particularly likely to be attendingyear round calendar schools, and are more likely to be enrolled in Cycle C than are otherstudents.
CERC @ UCR V-7
4 405/21/98

100%
90%
80%
70%
60%
50%
40%
30%
20%
10%
0%
Cyde D
OCyde C
OCyde B
Cyde A
OTraditional
ELD Program Enrollment by School Calendar
Not LEP/FEPProficiency
TBE TBE & Immersion Immersion Mainstream LEP Mainstream FEP Total
1394 3514 1084 1223 665 591 8472
1014 4036 956 732 604 560 7902
938 2726 966 807 514 396 6347
888 2923 862 659 427 419 6178
4789 2432 1103 3609 5622 5141 22696
ELD Program
Table V.9: Year Round School Cycles by ELD Program Services
School Attendance Factors. Five variables bearing on student attendance andparticipation in school are available for analysis. The first is the transiency of students fromschool to school. While the average transiency rate does not differ substantially across ELDprograms, there are very substantial differences during the early elementary years. As shown inthe chart accompanying Table V.10, during the first four years of school students who areassigned to mainstream LEP programs are nearly twice as likely to move from school to schoolas are those who are in TBE programs and those whose native language is English. Studentswho move frequently are also more likely to be ones who receive mixed TBE and Immersionprograms no doubt because of the substantial differences in the prevalence of these programs atvarious school sites.
The second aspect of student attendance on which data are available has to do with absences. Asshown in Tables V.11 and V.12, the tendency to miss school is not evenly distributed across theELD program settings. Students who are assigned to TBE programs (either completely or incombination with Immersion instructional programs) have significantly fewer absences fromschool at both the elementary (where absences are recorded only in days) and secondary schools(where absences are recorded in periods and days the days were converted to periods for thistable). The improved attendance in these programs applies to both excused and unexcusedabsences.
CERC @ UCR V-8 05/21/98
4 5

Student Transiency: The proportion changing schools each yearby Grade and ELD Program Defined by Services Provided
0.45
co
o 0.40o
.c0 0.35cnisc 0.30
-61
2 0.250co 0.20t&e 0.15
0.10
0.05 -
--
I
K 2 3 4 5 6 7 8 9 10 11 2Averag
e
0 Not LEP/FEP 0.16 0.18 0.20 0.22 0.22 0.20 0.19 0.16 0.10 0.12 0.11 0.11 0.16 0.17
TBE 0.14 0.20 0.21 0 23 0.23 0.24 0.20 0.17 0.15 0.14 0.24 0.14 0.09 0.20
0 TBE & Immersion 0.29 0.24 0.26 0.23 0.21 0.22 0.19 0.19 0.24 0.11 0.11 0.15 0.05 0.21
13 Immersion 0.11 0.24 0.28 0.30 0.28 0.28 0.25 0.17 0.15 0.11 0.13 0.15 0.11 0.19
Mainstream LEP 0.35 0.43 0.38 0.40 0.45 0.30 0.18 0.21 0.19 0.17 0.17 0.17 0.18 0.22
0 Grade Average - N 0.16 0.21 0.23 0.24 0.24 0.23 0.20 0.18 0.16 0.14 0.15 0.15 0.16 0.20
CERC @ UCR
Grade Level
Table V.10: The Movement of Students from School to School
Average Elementary Student Day-Long Absenteeismby ELD Program Defined by ELD Services Provided
8.00
7.00
6.00
5.00
Days4.00
3.00
2.00
1.00 ^Not LEP/FEP
Proficiency TBETEE &
bnmersionImmersion
MainstreamLEP
Average
OTotal days absent - Elementary 6.97 5.80 5.39 622 6.81 8.15
Unaccamted days absent - Momentary 127 120 1.03 121 1.62 122ELD Program
Table V.11: Elementary School Absences
V-94
05/21/98

1
1
Periods
Average Secondary Student Period Absenteeismby ELD Program Defined by ELD Services Provided
140.00
120.00
100.00
80.00
60.00
40.00
20.00 -
Not LEP/FEPProficiency
TBETBE &
ImmersionImmersion
MainstreamLEP
Ave age
0 Total periods absent - Secondary 93.07 69.23 70.61 92.04 124.95 98.31
0 Unaccounted periods absent - Secondary 29.44 19.29 19 13 32.16
ELD Program
52.63 35.44
Table V.12: Secondary School Absences
A third dimension of school attendance is tardiness to class. Table V.13 reports the rate of dailytardiness for elementary students and of period tardiness for secondary students. Elementarytardiness is lowest in mainstream LEP instructional programs, while that is the program with thehighest tardiness rate among secondary students. Tardiness is more frequent at the lower gradelevels (K-2 in elementary schools and in the 6-8 intermediate grades).
Table V.13: Tardiness at all Grade Levels
Tardiness by Grade and ELD Program defined language services lrovided
Grade Unit of Recording Not LEP/FEP TBETBE &
Immersion ImmersionMainstream
LEPMainstream
FEPGrade
AverageK Days 2.45 2.27 4.65 2.83 2.06 3.02 2.421 Days 3.80 2.59 3.33 3.89 2.33 4.20 3.092 Days 3.75 2.24 1.97 3.20 2.14 3.74 2.713 Days 2.99 1.88 2.15 3.06 1.77 3.04 2.304 Days 2.55 1.74 2.21 2.06 1.99 2.55 2.085 Days 2.53 1.54 2.07 1.95 1.70 2.30 1.976 Periods 5.73 5.66 5.72 5.22 6.12 4.34 5.497 Periods 8.36 7.04 8.24 7.77 8.61 6.72 7.818 Periods 7.31 6.26 7.08 7.57 9.43 7.04 7.909 Periods 3.90 4.34 4.38 4.25 4.72 3.92 4.30
10 Periods 5.08 7.47 4.87 6.11 6.43 5.19 5.8411 Periods 6.21 5.20 6.65 6.50 7.08 6.93 6.7512 Periods 5.77 4.34 6.94 5.82 6.73 5.90 6.13
Avg Days Elementary 2.99 2.13 2.24 2.87 2.05 3.15 2.47Avg Periods Secondary 6.10 6.00 6.52 6.17 6.96 5.71 6.30
CERC @ UCR
4705/21/98
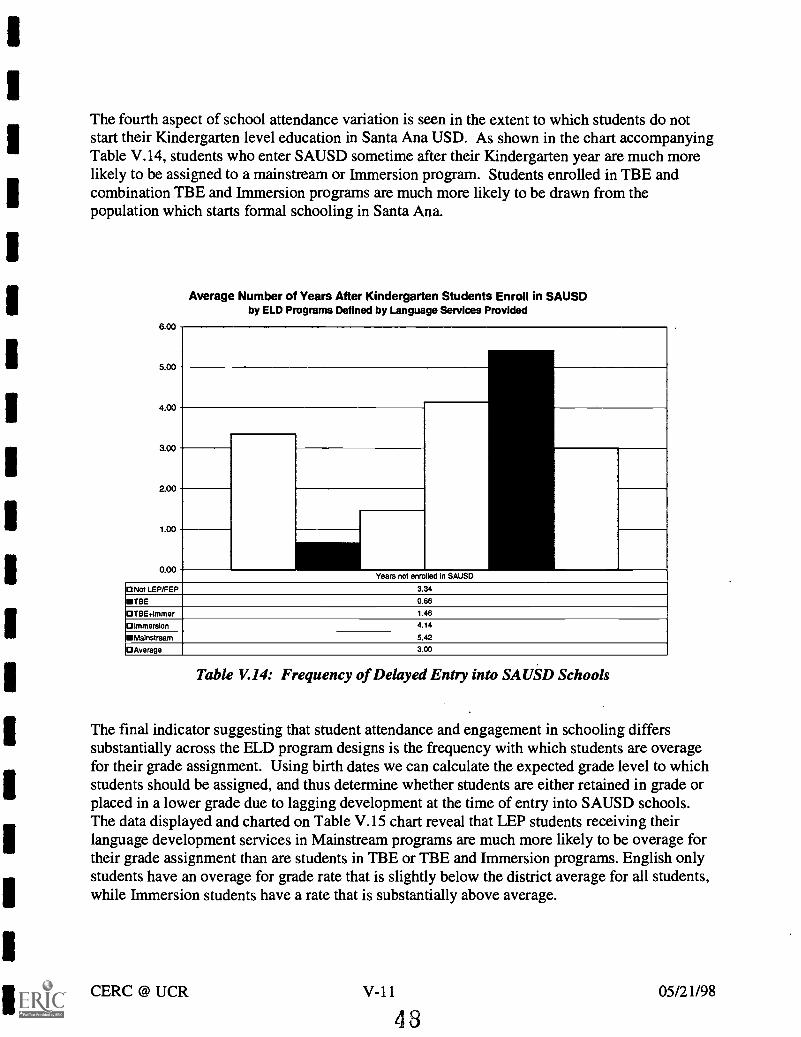
1
The fourth aspect of school attendance variation is seen in the extent to which students do notstart their Kindergarten level education in Santa Ma USD. As shown in the chart accompanyingTable V.14, students who enter SAUSD sometime after their Kindergarten year are much morelikely to be assigned to a mainstream or Immersion program. Students enrolled in TBE andcombination TBE and Immersion programs are much more likely to be drawn from thepopulation which starts formal schooling in Santa Ma.
Average Number of Years After Kindergarten Students Enroll in SAUSDby ELD Programs Defined by Language Services Provided
WAR.;
5.00
4.00
3.00
2.00
1.001
0.00
_
Years not enrolled In SAUSD
['Not LEP/FEP 3.34
TBE 0.68
OTBE+Immer 1.48
O Immersion 4.14
Mainstream 5.42
['Average 3.00
Table V.14: Frequency of Delayed Entry into SAUSD Schools
The final indicator suggesting that student attendance and engagement in schooling differssubstantially across the ELD program designs is the frequency with which students are overagefor their grade assignment. Using birth dates we can calculate the expected grade level to whichstudents should be assigned, and thus determine whether students are either retained in grade orplaced in a lower grade due to lagging development at the time of entry into SAUSD schools.The data displayed and charted on Table V.15 chart reveal that LEP students receiving theirlanguage development services in Mainstream programs are much more likely to be overage fortheir grade assignment than are students in TBE or TBE and Immersion programs. English onlystudents have an overage for grade rate that is slightly below the district average for all students,while Immersion students have a rate that is substantially above average.
CERC @ UCR v-i
4 3
05/21/98

1
1
Differences Among ELD Programs on Students Being Overage for Grade LevelPrograms Defined by Language Services Provided
V....!
0.45
0.40
g0.306
E0.25p.
& 0.20Eg4 0.15
0.10
0.05
0.00Overage to grade (yrs)
0 Not LEP/FEP 0.25
TEIE 0.17
1378E+Immer 0.23
['Immersion 0.42
Mainstream 0.47
['Average 0.28
ELD Programs
Table V.15: Frequency of Students Being Overage for Grade
Teacher Characteristics. Teachers as well as students are not randomly distributedamong the various ELD instructional programs at Santa Ana USD. As shown in Table V.16, theteachers providing Transitional Bilingual instruction are much younger than those whoseinstructional work follows the mainstream or Immersion approaches to English languagedevelopment.
As expected, the experience profile for SAUSD teachers follows closely their age. As shown inTable V.17, the least experienced teachers are providing TBE services while the mostexperienced are providing Immersion instruction.
CERC @ UCR V-12
4 305/21/98

45.00
44.00
43.00
42.00
41.00
40.00
39.00
38.00
37.00
la Teacher age In years
Teacher age in years by ELD Program Definedby ELD Services Provided
Not LEP/FEP TBE TBE & Immersion Immersion Mainstream LEP District Average
42.87 39.37 41.21 44.10 43.93 41.07
12.00
ELD Program
Table V.16: Teacher Age Distribution
Teacher experience in SAUSD in yearsby ELD Program Defined by ELD Services Provided
10.00 -
8.00 -
6.00 -
4.00 -
2.00 -
0.00Not LEP/FEP
11:1Teacher experience In years 10.21
TBE TBE & Immersion Immersion Mainstream LEP District Average
8.19 9.24 10.95 10.60 9.16
CERC @ UCR
ELD Program
Table V.17: SAUSD Teacher Experience
V-13 05/21/9850

Teacher gender also varies significantly across ELD program types. While just about 50 percentof the teaching work force is male and 50 percent female, fully 75 percent of all TBE teachersare female, while 84 percent of those providing mainstream instructional programs for LEPstudents are male (see Table V.18).
80%
70%
60%
50%
40%
30%
20%
10%
0%
Teacher gender by ELD Program Definedby ELD Services Provided
Not LEP/FEP TBE TBE & Immersion Immersion Mainstream LEP District Ave age
13 Percent Female 53% 75% 46% 33% 16% 50%
ELD Program
Table V.18: Teacher Gender
When it comes to education, there is not a lot of variation across the teaching staff. More thaneight of ten teachers hold a bachelors degree while nearly 15 percent have masters degrees. Lessthan one half of one percent hold either less than a bachelor degree or more than a masters.
There are some modest differences in the instructional practices of teachers with and without themasters degree. In keeping with their younger age and fewer years of working experience, onlyabout 11.9 percent of the TBE teachers hold masters degrees while all other instructionalprograms have more than the district wide average of 14 percent masters degree holders amongtheir ranks (see Table V.19).
CERC @ UCR V-14 05/21/98

Teacher Education Levels by ELD Program
...,.......
90.0
80.0
ga 70.0
1.5 60.0
EEt 50.0
tr1: 4o.o
tiE 30.0=
c..)
20.0
10.0
Not LEP/FEP TBE TBE & Immersion Immersion Mainstream LEP Mainstream FEP Average
0 Doctorate 0.6 0.0 1.4 0.7 0.2 0.6 0.4
0 Masters 15.6 11.9 16.6 15.5 15.1 16.1 14.0
Bachelor 83.6 88.1 82.1 83.8 84.2 83.2 85.5
0 Associate 0.1 - - - 0.5 0.1 0.1
CERC @ UCR
ELD Program
Table V.19: Teacher Education Levels
Teacher Certification by ELD Program
I W.11
i 90.0
a.r 80.0
..5.
2 70.0 -1---21 60.0
"5*E.
g
50.0
:. 40.0
i 300
g 20.00
10.0
-- ----
-
---
---,----
-
----
------
------
_-----
-
-
--
---.
-Not LEP/FEP TBE
TBE &Immersion
ImmersionMainstream
LEPMainstream
FEPAverage
OFC instr and FC ['ding 33.2 49.2 51.0 37.8 41.8 34.9 43.1
0 FC lost and FC cultural 16.4 4.9 18.0 25.3 9.5 18.6 12.2
Full Cred istmctional services 30.4 9.2 9.4 21.8 24.0 31.7 17.9
0 No Full cred 20.0 36.7 21.5 15.1 24.8 14.8 26.9
ELD Program
Table V.20: Teacher Certification
V-15 5 ,2 05/21/98

As shown in Table V.20, there is a greater difference in the distribution of credential types thanin the distribution of educational degrees. Interestingly, TBE program teachers are the mostdiverse group. The have both the largest percentage of bi-lingually certificated and the secondlargest percentage of not yet fully certified teachers. Among teachers serving LEP students, thehnmersion teachers are least likely to hold full bilingual credentials, but they are also least likelyto be less than fully certified to teach.
Having summarized the overall character of the Santa Ana USD student body and provided alittle information about the teachers who serve them, we turn now to providing direct answers tothe central study questions addressed in this program evaluation.
CERC @ UCR V-16 05/21/98

VI. Answering the Major Evaluation Study Questions
We turn now to the central evaluation questions in this study. How is English languagedevelopment being pursued in SAUSD classrooms, and what impact do these languagedevelopment techniques have on English (or primary language) fluency, reading and mathachievement, and participation in schooling?
Instructional Techniques Used in ELD Programs
For children in kindergarten through grade 5, the District's annual survey collects a substantialbody of information on the instructional services provided within various ELD program options.Indeed, as described previously, the differences in the way reading is taught provide the mostreliable indicators of whether children are in Transitional Bilingual Education or Immersionprograms.
Table VI.1: Instructional Language UseReading Instructional Language by Grade by ELD Program
TBE TBE & Immersion Immersion Mainstream LEP TotalGrade Language Count Col% Count Col% Count Col% Count Col% Count
Native 2,424 100% 21 46% 2445Transitional 1 2% 32 7% 84 100% 119Immersion 23 50% 407 93% 430Mainstream 1 2% 1
Grade Total 2,424 100% 46 439 84 29951 Native 2,973 100% 163 82% 3136
Transitional 5 0% 14 7% 110 22% 104 100% 237Immersion 23 12% 379 78% 402Mainstream 3 0% 3Grade Total 2,981 200 489 104 3778
2 Native 2,661 100% 269 85% 2930Transitional 5 0% 17 5% 357 69% 60 100% 450Immersion 28 9% 160 31% 188Mainstream 6 0% 3 1% 9Grade Total 2,672 317 517 60 3577
3 Native 2,333 98% 353 88% 2686Transitional 12 1% 27 7% 358 78% 79 100% 505Immersion 16 4% 102 22% 118Mainstream 44 2% 7 2% 51Grade Total 2,389 403 460 79 3360
4 Native 1,562 91% 707 85% 2269Transitional 45 3% 51 6% 354 81% 75 100% 564Immersion 45 5% 81 19% 126Mainstream 106 6% 25 3% 131
Grade Total 1,713 828 435 75 30905 Native 976 71% 616 60% 1592
Transitional 201 15% 193 19% 354 85% 88 100% 895Immersion 163 16% 64 15% 227Mainstream 199 14% 54 5% 253Grade Total 1,376 1,026 418 88 2967
All Grades Native 12,929 95% 2,129 75% - 15,058Transitional 268 2% 303 11% 1,565 57% 490 100% 2,770Immersion - 298 11% 1,193 43% - 1,491Mainstream 358 3% 90 3% - 448Total All 13,555 2,820 2,758 490 19,767
CERC @ UCR VI - 1
5 4
05/20/98
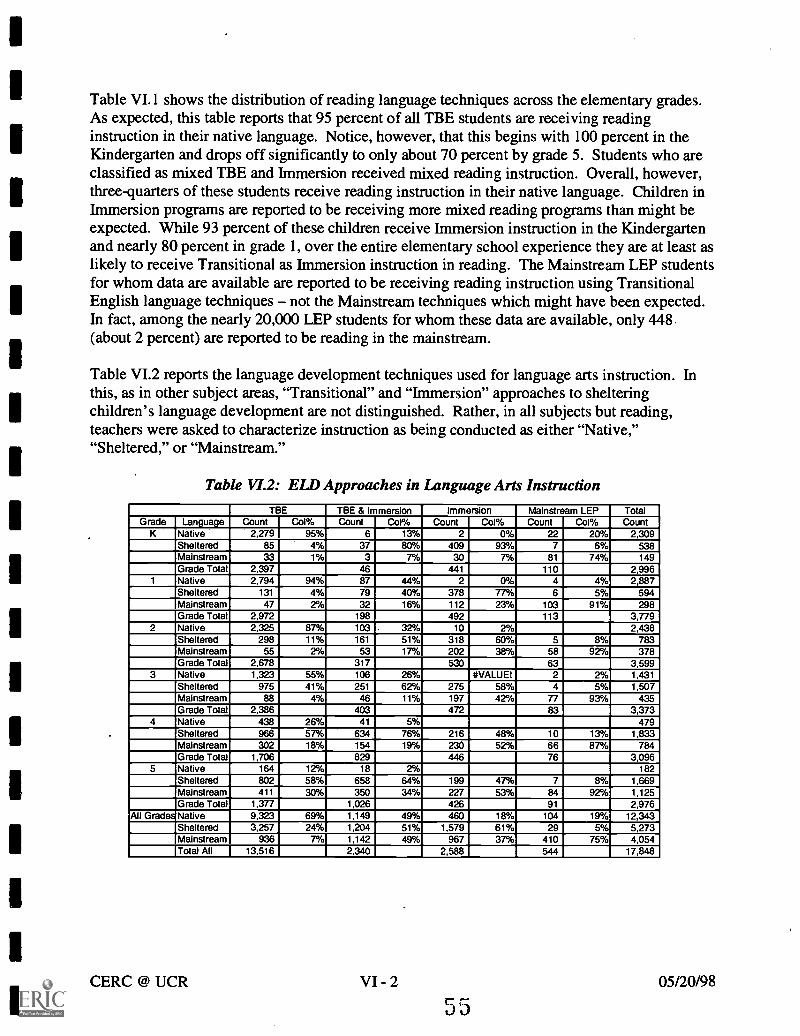
1
Table VI.1 shows the distribution of reading language techniques across the elementary grades.As expected, this table reports that 95 percent of all TBE students are receiving readinginstruction in their native language. Notice, however, that this begins with 100 percent in theKindergarten and drops off significantly to only about 70 percent by grade 5. Students who areclassified as mixed TBE and Immersion received mixed reading instruction. Overall, however,three-quarters of these students receive reading instruction in their native language. Children inImmersion programs are reported to be receiving more mixed reading programs than might beexpected. While 93 percent of these children receive Immersion instruction in the Kindergartenand nearly 80 percent in grade 1, over the entire elementary school experience they are at least aslikely to receive Transitional as Immersion instruction in reading. The Mainstream LEP studentsfor whom data are available are reported to be receiving reading instruction using TransitionalEnglish language techniques - not the Mainstream techniques which might have been expected.In fact, among the nearly 20,000 LEP students for whom these data are available, only 448,(about 2 percent) are reported to be reading in the mainstream.
Table VI.2 reports the language development techniques used for language arts instruction. Inthis, as in other subject areas, "Transitional" and "Immersion" approaches to shelteringchildren's language development are not distinguished. Rather, in all subjects but reading,teachers were asked to characterize instruction as being conducted as either "Native,""Sheltered," or "Mainstream."
Table VI.2: ELD Approaches in Language Arts Instruction
TBE TBE & Immersion Immersion Mainstream LEP TotalGrade Language Count Col% Count Col% Count Col% Count Col% Count
Native 2,279 95% 6 1 3% 2 0% 22 20% 2,309Sheltered 85 4% 37 80% 409 93% 7 6% 538Mainstream 33 1% 3 7% 30 7% 81 74% 149Grade Total 2,397 46 441 110 2,996
1 Native 2,794 94% 87 44% 2 0% 4 4% 2,887Sheltered 131 4% 79 40% 378 7 7% 6 5% 594Mainstream 47 2% 32 16% 112 23% 103 91% 298Grade Total 2,972 198 492 113 3,779
2 Native 2,325 87% 103 32% 10 2% 2,438Sheltered 298 11% 161 51% 318 60% 5 8% 783Mainstream 55 2% 53 17% 202 38% 58 92% 378Grade Total 2,678 317 530 63 3,599
3 Native 1,323 55% 106 26% *VALUE! 2 2% 1,431Sheltered 975 41% 251 62% 275 58% 4 5% 1,507Mainstream 88 4% 46 11% 197 42% 77 93% 435Grade Total 2,386 403 472 83 3,373
4 Native 438 26% 41 5% 479Sheltered 966 57% 634 76% 216 48% 10 13% 1,833Mainstream 302 18% 154 19% 230 52% 66 87% 784Grade Total 1,706 829 446 76 3,096
5 Native 164 12% 18 2% 182Sheltered 802 58% 658 64% 199 47% 7 8% 1,669Mainstream 411 30% 350 34% 227 53% 84 92% 1,125Grade Total 1,377 1,026 426 91 2,976
All Grades Native 9,323 69% 1,149 49% 460 18% 104 19% 12,343Sheltered 3,257 24% 1,204 51% 1,579 61% 29 5% 5,273Mainstream 936 7% 1,142 49% 967 37% 410 75% 4,054Total All 13,516 2,340 2,588 544 17,848
CERC @ UCR VI - 2
5505/20/98

Close study of Table VI.2 will reveal that Native Language instruction is utilized almostexclusively in the Transitional Bilingual and combined TBE & Immersion programs.Additionally, as Table VI.3 and the attached chart show, the use of Native Language servicesdrops dramatically starting in grade 3. By the 5th grade, fewer than one TBE student in eight isusing native language during language arts instruction.
Instructional Language Used In Language Arts Instructionin TBE Program by Grade
11"/ /0
90%
80%
70%
60%
50°/e
40%
20%
0%
,.
K 1 2 3 4 5 .Average
0 Native 95% 94% 87% 55% 26% 12% 69%
Sheltered 4% 4% 11% 41% 57% 58% 24%
0 Mainstream 1% 2% 2% 4% 18% 30% 7%
Table VL3: Instructional Language Use during Language Arts Instruction
Tables VI.4, VI.5 and VI.6 report the language development approaches used for mathematics,science and social studies instruction, respectively. In each case, the tables confirm the generalpicture presented in the case of language arts instruction. Very little native language instructionis used outside the Transitional Bilingual programs, and there is a sharp decline in nativelanguage instruction for all children starting in the second or third grade. By grade 5 nativelanguage instruction is used for subject matter instruction in fewer than 10 percent of theclassrooms. At the same time fewer than 50 percent of all children are reading at grade level bythe end of grade 2.
CERC @ UCR VI 3 05/20/98
5

1
Table VI.4: Instructional Language Use in Math Instruction
Mathematics Instructional Language by Grade by ELD ProgramTBE TBE & Immersion Immersion Mainstream LEP Total
Grade Language Count Col% Count Col% Count Col% Count Col% CountNative 2,307 93% 1 2% 5 1% 22 20% 2,335Sheltered 129 5% 37 80% 406 92% 5 4% 577Mainstream 34 1% 8 17% 32 7% 85 76% 161Grade Total 2,470 46 443 112 3,073
1 Native 2,411 81% 35 18% 1 0% 4 4% 2,451Sheltered 518 17% 129 65% 366 74% 6 5% 1,019Mainstream 52 2% 34 17% 125 25% 103 91% 318Grade Total 2,981 198 492 113 3,788
2 Native 1,687 63% 48 15% 10 2% 1,745Sheltered 914 34% 205 64% 317 60% 4 6% 1,441Mainstream 88 3% 65 20% 205 39% 59 94% 427Grade Total 2,689 318 532 63 3,613
3 Native 660 28% 35 9% 1 1% 696Sheltered 1,595 67% 307 76% 267 56% 5 6% 2,176Mainstream 135 6% 61 15% 206 44% 77 93% 506Grade Total 2,390 403 473 83 3,378
4 Native 273 16% 13 2% 1 0% 287Sheltered 1,156 68% 656 79% 215 48% 10 13% 2,044Mainstream 279 16% 160 19% 230 52% 66 87% 768Grade Total 1,708 829 446 76 3,099
5 Native 135 10% 4 0% 139Sheltered 824 60% 641 62% 186 44% 5 5% 1,658Mainstream 423 31% 381 37% 241 56% 87 95% 1,186Grade Total 1,382 1,026 427 92 2,983
All Grades Native 7,473 55% 136 5% 17 1% 27 5% 7,653Sheltered 5,136 38% 1,975 70% 1,757 62% 35 6% 8,915Mainstream 1,011 7% 709 25% 1,039 37% 477 88% 3,366Total All 13,620 2,820 2,813 539 19,934
Table VLS: Instructional Language Use in Science Instruction
Science Instructional Language by Grade by ELD ProgramTBE TBE & Immersion Immersion Mainstream LEP Total
Grade Language Count Col% Count Col% Count Col% Count Col% CountK Native 2,213 92% 1 2% 5 1% 22 20% 2,241
Sheltered 153 6% 42 91% 403 92% 6 5% 604Mainstream 33 1% 3 7% 32 7% 82 75% 152Grade Total 2,399 46 440 110 2,997
1 Native 2,216 74% 24 12% 1 0% 1 1% 2,242Sheltered 706 24% 140 71% 372 76% 6 5% 1,224Mainstream 55 2% 34 17% 118 24% 103 94% 314Grade Total 2,977 198 491 110 3,780
2 Native 1,473 55% 47 15% 10 2% 1,530Sheltered 1,113 41% 202 64% 314 59% 5 8% 1,635Mainstream 102 4% 69 22% 207 39% 58 92% 446Grade Total 2,688 318 531 63 3,611
3 Native 576 24% 16 4% 1 1% 593Sheltered 1,685 71% 327 81% 288 61% 5 6% 2,307Mainstream 127 5% 60 15% 184 39% 76 93% 474Grade Total 2,388 403 472 82 3,374
4 Native 229 13% 7 1% 236Sheltered 1,205 71% 664 80% 228 51% 11 14% 2,115Mainstream 274 16% 158 19% 218 49% 65 86% 747Grade Total 1,708 829 446 76 3,098
5 Native 120 9% 2 0% 122Sheltered 839 61% 696 68% 203 48% 8 9% 1,748Mainstream 418 30% 328 32% 224 52% 84 91% 1,108Grade Total 1,377 1,026 427 92 2,978
All Grades Native 6,827 50% 97 3% 16 1% 24 5% 6,964Sheltered 5,701 42% 2,071 73% 1,808 64% 41 8% 9,633Mainstream 1,009 7% 652 23% 983 35% 468 88% 3,241Total All 13,537 2,820 2,807 533 19,838
CERC @ UCR VI - 4
5705/20/98
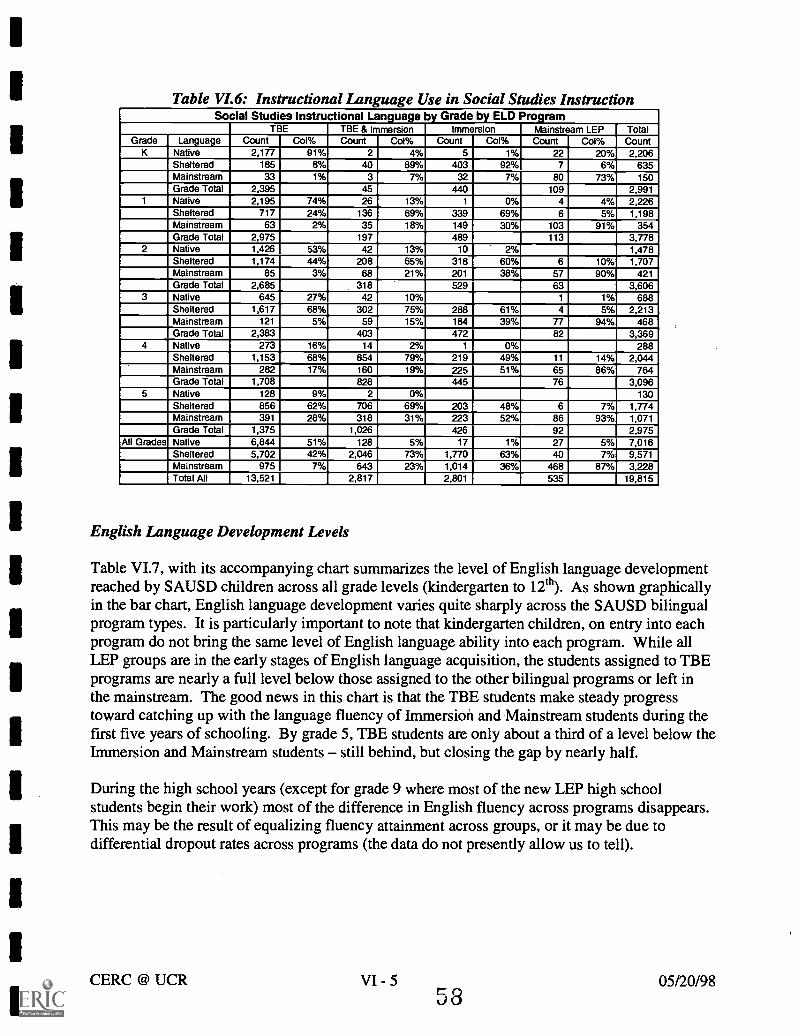
Table VI.6: Instructional Lan ua e Use in Social Studies InstructionSocial Studies Instructional Language by Grade by ELD Program
TBE TBE & Immersion Immersion Mainstream LEP TotalGrade Language Count Col% Count Col% Count Col% Count Col% Count
K Native 2,177 91% 2 4% 5 1% 22 20% 2,206Sheltered 185 8% 40 89% 403 92% 7 6% 635Mainstream 33 1% 3 7% 32 7% 80 73% 150Grade Total 2,395 45 440 109 2,991
1 Native 2,195 74% 26 13% 1 0% 4 4% 2,226Sheltered 717 24% 136 69% 339 69% 6 5% 1,198Mainstream 63 2% 35 18% 149 30% 103 91% 354Grade Total 2,975 197 489 113 3,778
2 Native 1,426 53% 42 13% 10 1,478Sheltered 1,174 44% 208 65% 318 60% 6 10% 1,707Mainstream 85 3% 68 21% 201 38% 57 90% 421Grade Total 2,685 318 529 63 3,606
3 Native 645 27% 42 10% 1 1% 688Sheltered 1,617 68% 302 75% 288 61% 4 5% 2,213Mainstream 121 5% 59 15% 184 39% 77 94% 468Grade Total 2,383 403 472 82 3,369
4 Native 273 16% 14 2% 1 0% 288Sheltered 1,153 68% 654 79% 219 49% 11 14% 2,044Mainstream 282 17% 160 19% 225 51% 65 86% 764Grade Total 1,708 828 445 76 3,096
5 Native 128 9% 2 0% 130Sheltered 856 62% 706 69% 203 48% 6 7% 1,774Mainstream 391 28% 318 31% 223 52% 86 93% 1,071Grade Total 1,375 1,026 426 92 2,975
All Grades Native 6,844 51% 128 5% 17 1% 27 5% 7,016Sheltered 5,702 42% 2,046 73% 1,770 63% ao 7% 9,571Mainstream 975 7% 643 23% 1,014 36% 468 87% 3,228Total All 13,521 2,817 2,801 535 19,815
English Language Development Levels
Table VI.7, with its accompanying chart summarizes the level of English language developmentreached by SAUSD children across all grade levels (kindergarten to 12th). As shown graphicallyin the bar chart, English language development varies quite sharply across the SAUSD bilingualprogram types. It is particularly important to note that kindergarten children, on entry into eachprogram do not bring the same level of English language ability into each program. While allLEP groups are in the early stages of English language acquisition, the students assigned to TBEprograms are nearly a full level below those assigned to the other bilingual programs or left inthe mainstream. The good news in this chart is that the TBE students make steady progresstoward catching up with the language fluency of Immersion and Mainstream students during thefirst five years of schooling. By grade 5, TBE students are only about a third of a level below theImmersion and Mainstream students - still behind, but closing the gap by nearly half.
During the high school years (except for grade 9 where most of the new LEP high schoolstudents begin their work) most of the difference in English fluency across programs disappears.This may be the result of equalizing fluency attainment across groups, or it may be due todifferential dropout rates across programs (the data do not presently allow us to tell).
CERC @ UCR VI - 5 05/20/9858

English Language Development Levels in 1997by ELD Program and Grade
,I ,,,,5.00
4.50
4.00
3.50
3.00
2.50
2.00
1.50
1.00 TIH1 1Kgtn Grade1 Grade2 Grade3 Grade4 Grade5 Grade6 Grade7 Grade8 Grade9 Gradel 0 Gradel 1 Gradel 2 Avg
0 THE 1.23 1.94 2.46 3.02 3.41 3.81 3.86 3.79 3.20 4.09 4.34 4.90 5.00 2.66
MI TBE & Immersion 1.98 2.38 2.93 3.38 3.68 4.09 4.02 3.96 3.82 2.67 3.84 4.73 5.00 3.74
el Immersion 2.18 2.84 3.24 3.66 4.14 4.42 4.16 4.19 4.44 3.52 4 08 4.59 4.90 3.82
CI Mainstream LEP 1.89 2.38 2.95 3.34 3.85 4.13 4.25 4.34 4.58 4.91 4.96 4.95 4.99 4.59
Grade Average 1.41 2.10 2.63 3.17 3.62 4.04 4.06 4.15 4.39 4 33 4.68 4.91 5.06 3.49
Table VI.7 English Language Development Levels by Program and Grade
Children's development in their primary non-English languages is depicted in Table VI.8 and itsaccompanying chart. (Data are too sparse after grade 8 to be reliable). As this table reveals,
Table VL8: Average Primary Language Development Levelsby Grade by ELD Program
,I,Ilf
4.00
3.00
2. 00
1.00 11111111 I I IIII1Kgtn Grade 1 Grade2 Grade3 Grade4 Grade5 Grade6 Grade7 Grade8 Avg
DTBE 2.65 3.09 3.39 3.74 4.01 4.13 4.13 4.11 4.03 3.47
TBE & Immersion 2.64 3.01 3.35 3.84 4.01 4.18 4.18 4.18 3.64 3.97
CI Immersion 3.05 3.28 2.94 3.29 3.50 3.77 4.04 4.07 4.14 3.56
D Mainstream LEP 2.46 2.78 3.08 3.76 3.64 4.18 4.11 4.36 4.67 3.73
Grade Average 2.68 3.09 3.34 3.72 3.96 4.12 4.15 4.19 3.97 3.59
CERC @ UCR VI - 6
5 905/20/98

children in Immersion programs begin school with greater than average fluency in their primarylanguage, but by grade 2 fall somewhat below the District-wide average. All student groupsmake steady progress in their native languages so that by grade 6 all are reported to have reachedintermediate fluency levels.
The six small charts on the next page (Tables VI.9a to VI.9f) provide a more detailed picture ofthe English Language development characteristic of children in each of the District ELDprograms in kindergarten through grade 5. As these charts make clear, nearly 70 percent of allLEP children entering SAUSD are at the pre-production level in English. Only about 7 percent(one child in fifteen) have reached the speech emergence level. By the end of grade 1 nearly 50percent of the students have reached the early production level. The speech emergence level isthe most prevalent in both rd and 3"I grades, and few students get beyond intermediate fluencyby the end of their fifth grade year. Immersion programs produce the largest number of studentswho are prepared for redesignation as Fluent English Proficient, but only about one LEP studentin fifteen reaches redesignation before leaving elementary school.
As will be documented in more detail below, these data suggest that English fluency is verydemanding and takes most students more years than they spend in their entire elementaryeducation.
Table VI.10 provides a succinct summary of the language development of elementary agechildren in Santa Ma. The graph associated with this table shows that Mainstream LEP studentshave the highest language development levels in English, and are right behind the children whohave received both TBE and Immersion instruction in their native language. It should beremembered that this graph does not indicate that no ELD program or a mixed program ofTBE and Immersion are the most effective means of nurturing language proficiency. To thecontrary, as data presented below will show, these programs have higher language attainmentbecause they receive children whose language skills are higher to begin with. It is a tribute tothe professional judgment of the SAUSD staff that children with the least language skill arethe ones who are most often placed in the Transitional Bilingual Programs where nativelanguage services are most prevalent. Immersion programs both start and end with thehighest functioning students. As will be shown shortly, both TBE and Immersion programsare superior to the Mainstream when it comes to assisting English language learners to reachhigher levels of proficiency.
CERC @ UCR VI - 7 05/20/986 0

Tables VI.9a to W.9f: English Language Proftciency by Grade Levelof Grade 1 Students at Each Language DevelopmentPercent of Kindergarten Students at Each Language Development Percent
LLevel by ELD Program Enrollment evel by ELD Program Enrollment
100%
90%
OD%
70%
00%
60%
40%
20%
20%
10%
0% ITHE 713604e00 bnrna6.13n 16400550014.EP Total
121,64-Pwo BO% HT% 22% 44% ID%
Erly P50440 Is% 44% 45% 23%
0400611 Ernroono 2% 23% 25% 20% 0%
1:1164465021015 Fluency 0% 2% 7% 1% 1%
161604516600 Fluency 0% t% 4% 0%
1313061601210643
VI.9a
IL5125.2530.153n
Eauty PlocketIon
1740011 Emergencehternweliato Fluency
040050461 Row!113Rodesipx100
TEIE TBE606.044 Immoxion MainenwnLEP27% 14% 6% 19%
64% 42% 22% 33%
10% 30% 55% 40%
2% 7% 10% 8%
0% 0% I% I%
23%
23%
6%
0%
VI.9b
Percent of Grade 2 Students at Each Language Development Percent of Grade 3 Students at Each Language DevelopmentLevel by ELD Program Enrollment Level by ELD Program Enrollment
100%
90%
03%
70%
03%
60%
40%
33%
20%
10%
0%
Pre-ProlctionE arly Piaduelion13Spe046 Emergence1355500d04 Fkoncy
Advancal FlancyRadosimated
IiTBE41=144 InTnersion IlairollevrtEP
9% 5% 6% 9%
41% 23% 11% 15%
43% 60% 40% 60%
0% 31% 15%
0% 4% 6% CI%
0%
VI.9c
100%
90%
130%
70%
03%
TO%
40%
30%
20%
10%
0% 3 I In LTata A600001 bnnterson MainstraantEP
171.452606130601 6% 1% 2% 10%
35% Eady Produclian 113% 10% 4% 1%
46% 6:113pmeh Elnerperce 40% 47% 35% 40%
11% InIcanedale Fluency 28% 33% 40% 31%
I% lArteanD00 FLoney 1% 0% 5% 10%
0% 175010450n004 0% 5416 1%
VI.9d
Percent of Grade 4 Students at Each Language Development Percent of Grade 5 Students at Each Language DevelopmentLevel by ELD Program Enrollment Level by ELD Program Enrollment
no%
go%
go%
100%
23%
03%
70%
DO%
50%
40%
30%
20%
10%
0%
OPr.Pcoludicn.13! 000060n
C,1145313Emenaerce090,no1410 RamAdverced Fluency
131,1050406%d
Total
4%
15%
40%
2%
1%
70%
60%
40%
30%
20%
10%
I .1474-5 Itrjr 111-7-11TTBE TBE4.101m Innen= MairsteantEP dal TBE TBE.Irnmer hrImenrion
4% 115 1% 1% 2% 131355114005050n 2% 0% IX 3%
10% 6% _70% NEarly 26061000. 7% 2% 2% 3%
22% 15% 60% Speech Emagerce 22% 15% 62% 4%
44% 57% 55% 03% 49% 0 tnlonneelaft %am/ 53% 03% 42% 50%
0% 7% 15% 19% I% Aeka6%0 Fluency 12% 113% 23% 33%
IX 1% 2% OREdelimaIed 15% 4% 1%
VI.9e
CERC @ UCR
VI.9f
Ta00
I%
4%
17%
54%
17X
7%
VI - 8 05/20/98
61
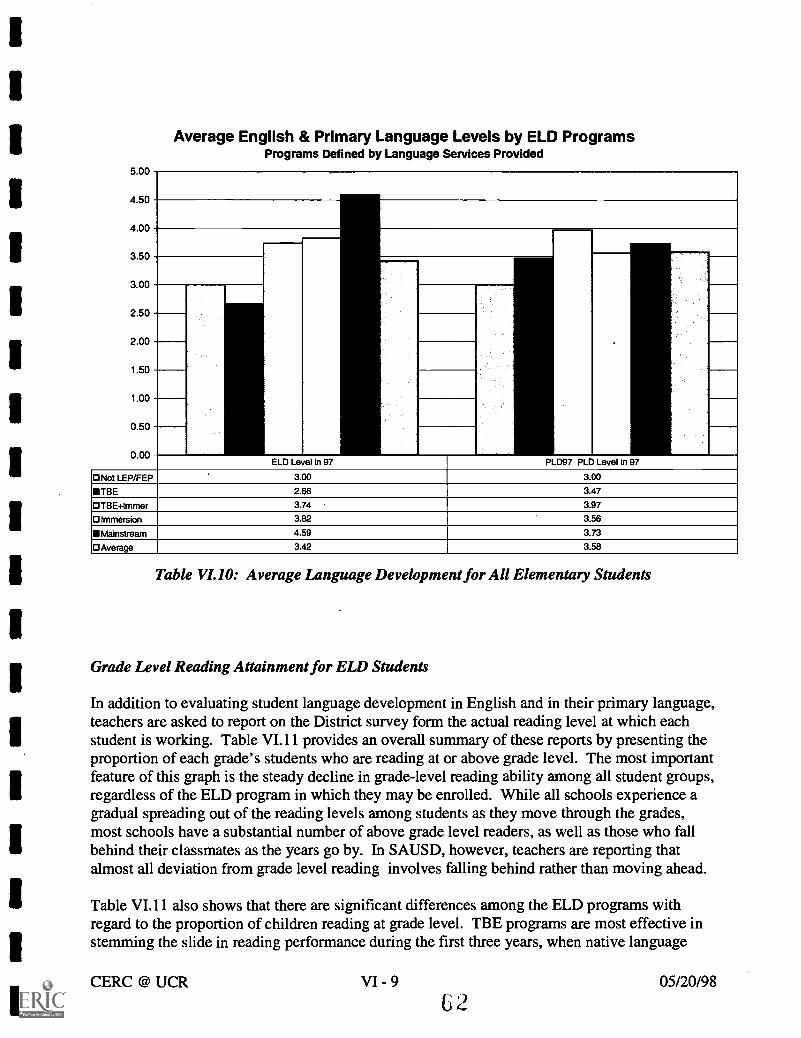
Average English & Primary Language Levels by ELD ProgramsPrograms Defined by Language Services Provided
: 7 A.A.1
4.50
4.00
3.50
3.00
.
2.50
2.00
1.50
1.00
0.50
0.00ELD Level in 97 PLD97 PLD Level in 97
0 Not LEP/FEP.
3.00 3.00
TBE 2.66 3.47
OTBE+Immer 3.74 3.97
Olmmersion 3.82 3.56
Mainstream 4.59 3.73
DAverage 3.42 358
Table VL10: Average Language Development for All Elementary Students
Grade Level Reading Attainment for ELD Students
In addition to evaluating student language development in English and in their primary language,teachers are asked to report on the District survey form the actual reading level at which eachstudent is working. Table VI.11 provides an overall summary of these reports by presenting theproportion of each grade's students who are reading at or above grade level. The most importantfeature of this graph is the steady decline in grade-level reading ability among all student groups,regardless of the ELD program in which they may be enrolled. While all schools experience agradual spreading out of the reading levels among students as they move through the grades,most schools have a substantial number of above grade level readers, as well as those who fallbehind their classmates as the years go by. In SAUSD, however, teachers are reporting thatalmost all deviation from grade level reading involves falling behind rather than moving ahead.
Table VI.11 also shows that there are significant differences among the ELD programs withregard to the proportion of children reading at grade level. TBE programs are most effective instemming the slide in reading performance during the first three years, when native language
CERC @ UCR VI - 9 05/20/98' 2

1
1
instruction is being most widely used. Mainstream students have the toughest time. Afterstarting out at or above the levels of the students assigned to specific ELD programs, theydecline most rapidly, and have the fewest at-grade level readers by the second grade. In grades 4and 5, Immersion and combined TBE and Immersion instructional strategies are proving mosteffective in supporting grade level reading attainment. These programs, however, offer nosubstantial improvement over mainstream programs which offer no ELD services during theseuPper elementary years. By fifth grade, the highest performing readers are in the mainstreamprograms.
Percent of Pupils Reading at Grade Level by Gradeby ELD Program defined by services provided
i ll4.1 /0
90%
80%
70%
60%
50%
30%
20%
10%
0%K/Illiterate Gradel Grade2 Grade3 Grade4 Grade5
0Mainstream 99% 60% 31% 33% 29% 32%
Immersion 99% 65% 38% 34% 32% 25%
OTBE+Immer 90% 55% 45% 42% 29% 26%
OTBE 99% 61% 51% 46% 18% 14%
Total 99% 61% 48% 44% 23% 20%
Table VI.11: Grade Level Reading Performance by ELD Program
The six small charts accompanying Tables VI.12a thruogh VI.12f provide detailed grade bygrade look at the reading levels attained by all LEP students. As these graphs make abundantlyclear, mainstream students languish badly during the first three years, with more than 20 percentof the mainstream students still reading at the kindergarten level when they complete grade 3.
TBE programs, which falter when students are moved into English instruction beginning withgrades 3 or 4, nevertheless have the smallest number of students who fall three or more gradelevels behind by the fifth grade.
CERC @ UCR VI - 10 05/20/98
6 3

I I ' I
M=MMIZZ=M1========311M=1=1E3=1=E2MM:21=anmml===m:::mmrmm::m ma!rff=21=::::!MIMM:MMCZEMM:2Mmu:;:mmammoimrmomm::mm
- . .
11
II II IIM=EN1=111BM=1:=MIE:=EllE=IM71"4!".1MIONNEOMEM==i1====:::::=M:IMMEMENIUMniZIMIMEZ=M=MIMS:MINIE:!IM2M MINIMM[13:7=111M12=====1;::=MMMMMMM=INIM2MGri=11MIMIZEMIIMTMM:IMMT=IM:3EM:2M
mown I II 1IN:=11112=11=:=======1111
'
ro dr4=:::=1.:ZEMINIEniMCET5M=MMEM=Min=1::MMMENEWZM101 B1=1==111==:=M32IMMENI111=1:MMOIMMIM.11 EINII3311M::::MM=MIMEZMM:2M!E!!M=ZZMMIMMMIMIE::71ElEi!MMMMI!M
ik.11 III I IIM:=EMZ=MMT=M11=MONE=IMIC=MM=MCIMETMIM2MIMMIIIIIME2==1:12=CIZIEMIM32=========l1M=M11CIIMIIIIIIMM!M=E:M=M:MMIMMIMEMM:Z!MM:2Mnirmmi======:::=mnmma2mm:::=1
1 11 1 1 I PMI Il 111 IN Inal=MEM=M1=====:=MIZ=Ma2=3MM7'PiMMMIIMEMM::::fl22=M:2===IMMINMS3=El==11M:ZM==========IEME =21=1=1M12M=EIRMINIMINE========IINrE:=1321=0========M:::!M ME:2MMMEMEM::M=ESMEM=2=IMIMM2:MCitIMEMMS2M=Z2===:=ME:=M::::1MMMIMI=3:2===IM=Z7MEME2=M:2MM!!=1111===M:7=11==MNIMZ!!MMWZM==l1MMEIZMMEZMEMEIMMICIM==M1=2!!
I I :

1
1
1
Because of the importance of this issue of grade-level reading attainment, we preformed a checkon the distribution of reading levels attained during the elementary school years by groupingstudents according to their administrative program assignments (the V-Codes on the DistrictSurvey Form). Table VI.13 parallels Table VIA 1 in presenting the proportion of each programgroup's students who are functioning at or above grade level in reading.
Percent of Students Reading at Grade Levelby V-Code Specified ELD Program
111,1 /0
90%
80%
70%
60%
50%
40%
30%
20%
10%
0%KAlliterate Gradel Grade2 Grade3 Grade4 Grade5
0 TBE 99% 60% 51% 39% 9% 2%
smc 99% 70% 50% 55% 19% 14%
13 lmm+Native 98% 62% 37% 33% 20% 17%
13 lmm+Other 100% 70% 48% 39% 37% 32%
inim Only 100% 76% 44% 41% 46% 35%
D Main+ELD 35% 42% 52% 56% 26% 45%
II Mainstream 99% 60% 45% 41% 29% 20%
0 Total 99% 61% 48% 43% 23% 20%
Table VW: Grade Level Reading Attainment among Administrative Program Groups
The picture presented by this graph is quite similar to that found in Table VI.11 a steadydecline in reading level attainment, with TBE students doing very well through grade 3 and thendropping sharply in grades 4 and 5. The apparent bright spot in this graph is the strongperformance by the "Immersion Only" students in grade 4 and the Mainstream plus ELD supportgroup in grade 5. As noted earlier, howeirer, many students in the mainstream groups areactually receiving TBE or Immersion instruction by teachers who are not fully credentialledand when these students are reclassified according to the services they actually receive, thosewho are getting only mainstream services do not fare very well. Indeed, reclassifying thesestudents raises the TBE performance and lowers the mainstream performance.
CERC @ UCR VI - 12 05/20/98
6 5

Achievement in Reading and Mathematics
We turn next to a review of reading and mathematics attainment among SAUSD students whoparticipate in various English language development programs. As described in an earliersection of this report, comparing academic attainment levels among native speakers of diverselanguages, across school grade levels and program assignments is far from a perfect science.Thus, the findings presented in this sub-section should be viewed cautiously and should be reliedupon for policy making only when corroborated with other data.
Standardized achievement test scores for 1997 are available on about 30 thousand SAUSDstudents, with comparable numbers tested in previous years. Most LEP students begin by takingthe Spanish language version of the District test (the SABE) and, as they become more fluent inEnglish make the transition to the English CTBS version. Table IV.14 presents readingachievement NCE scores from both SABE and CTBS test versions, by grade level and by ELDprogram for all students (including the English only students who have never been classified asLEP and the non-native speakers classified as Fluent English Proficient (FEP)). As shown in theright hand column of Table IV.14, the number of SABE takers outnumbers those who take theEnglish version of the examination until grade 4. From that point on, the peicentage of studentstaking the CTBS version climbs steadily. The non-LEP/FEP students, of course, only take theEnglish language CTBS, as do those LEP students whose native language is not Spanish.
While a more complete analysis of these scores will be presented below, we note a few importantfeatures of this table. First, the highest overall averages were produced by mainstream FEPstudents. High performance by this group should not be seen as remarkable, however, becausestudents must score well on the District test in order to be redesignated from Limited to FluentEnglish Proficient. Since the bottom 25 to 33 percent of test takers remain classified among theLEP student groups until they bring up their scores it would be most unusual if the redesignatedstudents did not score particularly well. What is important is that this group's average score(45.88) remains a bit below the expected mid-point on the two district tests (which is 50.00). Wenote that the next highest scores were earned by the TBE student group a group which startswith the lowest language ability of all groups in the district. As later analysis will document, amajor reason for the high average scores for this group is the frequency with which they take theSpanish language version of the test. Overall, students in Santa Ana score much better on theSpanish than on the English language version of the test.
The lowest achievement scores are those of the Immersion students, but they are closelyclustered with the TBE & Immersion students and the Mthnstream LEP students.
CERC @ UCR VI - 13 05/20/98
6 6

Table VL14: Reading Achievement in NCE Scores Measured by the SABE and CTBS Testsby Grade and ELD Program defined language services provided
Not LEP/FEP TBE TBE & Immersion Immersion Mainstream LEP Mainstream FEP Grade Level Average:Grade Lan uage Mean N Mean N Mean N Mean N Mean N Mean N Mean
1 SABE . 58.06 2,649 56.04 109 34.00 2 49.11 123 59.79 29 57.61 2,912CTBS 38.53 638 27.15 47 28.12 66 28.48 436 32.68 124 39.97 326 34.95 1,637Average 38.53 638 57.52 2,696 45.51 175 28.51 438 40.86 247 41.59 355 49.46 4,549
2 SABE . 51.91 2,366 49.24 162 54.33 6 48.00 46 55.91 23 51.72 2,603CTBS 38.17 559 27.93 54 28.06 124 30.08 456 28.24 74 41.58 316 34.92 1,583Average 38.17 559 51.38 2,420 40.06 286 30.40 462 35.82 120 42.55 339 45.36 4,186
3 SABE . 53.99 1,863 52.17 157 16.00 3 55.11 37 59.29 14 53.85 2,074CTBS 43.01 522 35.33 330 32.66 201 33.54 411 34.10 100 45.73 297 38.39 1,861Average 43.01 522 51.18 2,193 41.22 358 33.41 414 39.77 137 46.34 311 46.54 3,935SABE . 48.83 745 50.50 185 27.33 3 44.05 20 46.00 1 48.99 954CTBS 39.17 509 25.85 846 26.03 594 28.19 387 27.82 85 41.70 317 30.59 2,738Average 39.17 509 36.61 1,591 31.84 779 28.19 390 30.91 105 41.71 318 35.34 3,692
5 SABE . 40.95 291 40.20 87 71.00 1 41.00 7 . 40.86 386CTBS 39.61 539 24.94 1,005 25.36 890 29.43 393 28.35 97 45.74 384 30.49 3,308Average 39.61 539 28.54 1,296 26.68 977 29.54 394 29.20 104 45.74 384 31.58 3,694
6 SABE . 30.72 144 26.05 135 19.61 31 24.14 21 . 27.36 331CTBS 40.81 396 24.51 772 21.02 829 25.54 412 28.15 210 44.45 485 29.16 3,104Average 40.81 396 25.49 916 21.73 964 25.12 443 27.78 231 44.45 485 28.98 3,435
7 SABE . 4.14 97 8.59 22 13.17 29 38.52 23 . 10.87 171CTBS 45.01 403 26.52 431 21.28 627 26.25 567 30.37 625 48.33 609 32.56 3,262Average 45.01 403 22.41 528 20.85 649 25.61 596 30.66 648 48.33 609 31.48 3,433
8 SABE . 3.54 91 1.78 23 13.35 26 30.78 32 . 9.85 172CTBS 51.14 391 24.57 141 19.40 109 24.91 792 31.56 947 52.05 701 36.25 3,081Average 51.14 391 16.32 232 16.33 132 24.55 818 31.53 979 52.05 701 34.85 3,253
9 SABE . 25.46 24 33.61 46 47.97 203 31.67 3 83.00 1 43.58 277CTBS 41.82 302 21.13 62 14.38 56 21.54 584 27.28 1,105 46.44 811 32.58 2,920Average 41.82 302 22.34 86 23.05 102 28.36 787 27.29 1,108 46.48 812 33.53 3,197
10 SABE . 28.35 17 32.64 42 46.00 2 . 31.89 61CTBS 44.53 283 22.95 22 18.33 75 21.42 491 29.43 1,063 47.75 798 34.55 2,732Average 44.53 283 22.95 22 20.18 92 22.31 533 29.46 1,065 47.75 798 34.49 2,793
11 SABE . 53.00 1 . 53.00 1
CTBS 38.03 244 17.91 90 12.68 44 18.73 306 24.14 758 44.24 698 31.01 2,140Average 38.03 244 17.91 90 12.68 44 18.84 307 24.14 758 44.24 698 31.02 2,141
12 SABECTBS 42.23 158 17.69 65 8.17 12 17.87 127 21.72 510 41.90 517 30.91 1,389Average 42.23 158 17.69 65 8.17 12 17.87 127 21.72 510 41.90 517 30.91 1,389
Mathematics achievement scores are reported in Table VI.15. As in the case of reading, this testis given more frequently in Spanish than in English during ,first three years. Students taking thetest in Spanish (the SABE) tend to outscore those who take it in English, up until about the 5thgrade. While math achievement scores are a bit closer together, the same pattern of higherscores for Mainstream FEP students, English only students and TBE program participantsfollowed by significantly lower scores for the TBE & Immersion, the Immersion and theMainstream LEP students. With an average score of 48.00, the redesignated Mainstream FEPstudents score close to the national average of 50.00. The low achieving students who do notqualify for redesignation certainly contribute significantly to the lower averages for bilingualprogram students.
CERC @ UCR VI -.14 05/20/98
6 7

Table VI.15: Mathematics Achievement Scores1997 Math Achievement in NCS Scores
by Grade and ELD Program defined language services providedNot LEP/FE P TBE TBE & Immersion Immersion Mainstream LEP Mainstream FEP Grade Average
Grade Language Mean N Mean N Mean N Mean N Mean N Mean N Mean N1 SABE . 50.64 2649 52.07 109 27.00 2 46.20 123 61.97 29 50.60 2912
CTBS 42.30 638 36.36 47 32.06 66 40.26 436 37.79 124 47.02 326 41.77 1637Average 42.30 638 50.39 2696 44.53 175 40.20 438 41.98 247 48.24 355 47.42 4549
2 SABE 48.41 2366 44.09 162 56.67 6 41.07 46 58.35 23 48.12 2603CTBS 43.39 559 41.72 54 37.61 124 41.02 456 37.80 74 47.66 316 42.79 1583Average 43.39 559 48.27 2420 41.28 286 41.23 462 39.05 120 48.39 339 46.11 4186SABE . 47.54 1863 42.59 157 27.33 3 39.68 37 57.79 14 47.07 2074CTBS 45.35 522 40.41 330 35.12 201 38.87 411 39.70 100 50.87 297 42.52 1861Average 45.35 522 46.47 2193 38.40 358 38.78 414 39.69 137 51.18 311 44.91 3935
4 SABE . 42.25 745 43.44 185 40.00 3 32.90 20 38.00 1 42.28 954CTBS 43.66 509 33.33 846 31.89 594 39.09 387 38.08 85 51.12 317 37.96 2738Average 43.66 509 37.51 1591 34.64 779 39.09 390 37.10 105 51.08 318 39.08 3692SABE . 32.53 291 32.60 87 61.00 1 34.14 7 . 32.65 386CTBS 43.93 539 31.89 1005 32.62 890 38.93 393 36.20 97 52.15 384 37.36 3308Average 43.93 539 32.03 1296 32.61 977 38.99 394 36.06 104 52.15 384 36.87 3694SABE 26.83 144 21.65 135 18.74 31 19.71 21 . 23.51 331
CTBS 42.62 396 31.26 772 27.33 829 32.80 412 31.69 210 48.85 485 34.64 3104Average 42.62 396 30.56 916 26.53 964 31.82 443 30.60 231 48.85 485 33.57 3435
7 SABE . 4.05 97 7.32 22 8.93 29 31.13 23 . 8.94 171
CTBS 42.35 403 30.30 431 25.03 627 31.02 567 32.47 625 50.32 609 35.05 3262Average 42.35 403 25.48 528 24.43 649 29.94 596 32.42 648 50.32 609 33.75 3433
8 SABE . 3.44 91 3.22 23 10.65 26 26.47 32 . 8.78 172CTBS 44.76 391 26.74 141 21.39 109 26.05 792 32.19 947 49.59 701 35.53 3081Average 44.76 391 17.60 232 18.23 132 25.56 818 32.00 979 49.59 701 34.12 3253
9 SABE . 9.71 24 26.59 46 35.37 203 20.00 3 76.00 1 31.67 277CTBS 37.90 302 24.95 62 20.30 56 26.29 584 28.86 1105 46.42 811 33.91 2920Average 37.90 302 20.70 86 23.14 102 28.63 787 28.83 1108 46.46 812 33.72 3197
10 SABE . . 14.18 17 26.38 42 32.50 2 . 23.18 61
CTBS 40.93 283 24.23 22 21.40 75 27.99 491 30.77 1063 47.27 798 35.83 2732Average 40.93 283 24.23 22 20.07 92 27.86 533 30.78 1065 47.27 798 35.56 2793
11 SABE . . . 1.00 1 . . 1.00 1
CTBS 35.14 244 28.49 90 22.00 44 31.10 306 29.74 758 44.83 698 35.26 2140Average 35.14 244 28.49 90 22.00 44 31.00 307 29.74 758 44.83 698 35.25 2141
12 SABECTBS 37.62 158 29.43 65 19.92 12 31.00 127 28.77 510 42.79 517 35.15 1389Average 37.62 158 29.43 65 19.92 12 31.00 127 28.77 510 42.79 517 35.15 1389
How Long Does It Take to Become Fluent in English?
The most important - and one of the most difficult - questions in any evaluation of Englishlanguage development programs is to estimate how long it takes for children to become fluent inEnglish and how much that time table is lengthened or shortened by program design, studentcircumstances and school contexts. As we noted in Section In of this report, previouslypublished evaluation and research on this question has been seriously flawed by using thewrong statistical techniques for estimation. Virtually all studies - certainly all those beingreferenced in recent policy debates on the overall value of bilingual education programs -have attempted to cakulate the time it takes to become fluent by including in their estimatesonly those children who have successfully made the transition into English fluency. Byleaving out of the estimation process all those children who have been attempting to learnEnglish, but who have not yet reached fluency, these studies very seriously under estimate thetime it takes to reach fluency. (The statistical techniques typically used produce the same type oftime estimate error you would get if you averaged the times of the first one hundred finishers of
CERC @ UCR VI - 15
8805/20/98

the Boston Marathon and then concluded that this is the average time it takes to run this gruelingrace. If only the fastest runners are included in the estimation, it becomes easy to erroneouslyconclude that the thousands of other runners are unmotivated, performing inadequately or havebad training programs.)
The two most serious consequences of using flawed statistical techniques to estimate languagelearning time have been: a) the discovery that every time data from longer term studies isanalyzed it appears that children have taken a longer time to become fluent in a second language,and b) an unfounded belief that younger children are more adept at language learning and canchange languages more quickly.
As described more fully in Section III, the appropriate technique for estimating the time tocompletion of a process that moves individuals from one status (Limited English Proficient) toanother (Fluent English Proficient) is a technique developed for medical research known as"Survival Analysis." Survival analysis takes into account the two special features of this kind ofchange process. It has a procedure for handling "censored" cases (where individuals have starteda change process, but have not completed it at the time a study ends). And it also is designed tomake appropriate interpretation of the characteristic S-shaped distribution of transition times fora large population (that is where a few of those undergoing change move very rapidly, followedby a large number moving in the middle-range times and trailed by the smaller number who willtake extra time).
While survival analysis is a bit more complex than other techniques for estimating the length oftime for transition into English language fluency, its ability to improve the accuracy of theresulting estimates makes it important to apply and interpret.
We begin by noting that the rate at which children in Santa Ana schools shift from the Spanishlanguage SABE test to the English language CTBS displays the characteristic S-shapeddistribution of a survival process. Notice, in Table VI.16 that very few children shift over toEnglish during the first two or three grades, followed by a rapid rise in the number that shift
during grades four, five and six and a gradualslowing trend during the secondary years.Table VI.16: Canada* e Pereeta f Students
Dansitloning from £4BELo CT134 grad e s I &owls
12 for academie yews 94 through 97
1 vi.
80
60
40
20
01 2 3 4 5 6 7 8 9 10 11 12
pet crEs 6.1 13.2 284 38.9 52.1 65.3 75.4 83.7 87.6 95 98.6 100
Grade Level
CERC @ UCR
The statistical technique known as survival analysiscalculates the rate at which children move from onestatus to another (in this case from one level ofEnglish fluency to the next) by examining theproportion of those who succeed in moving amongall who have an opportunity to move during eachtime period. In this evaluation study, time wascalculated in months, so the survival analysiscalculated what proportion of the students moved tothe next language fluency level during each monthfollowing their initial classification at each languagedevelopment level.
VI 16 05/20/98
6 9

As noted throughout this report, English fluency progress for Santa Ana USD students ismonitored across six distinct stages or levels:
1. Pre-Production,2. Early Production,3. Speech Emergence,4. Intermediate Fluency,5. Advanced Fluency, and6. Redesignated as FEP
This means that students have up to five opportunities to advance up the fluency ladder fromPre-Production to Early Production, from Early Production to Speech Emergence, etc. The timetaken to move up from each level to the next can be estimated from the data available.Unfortunately, since the District's LEP database has only been in full operation for about threeyears, there are only a few cases of students whose movement has been tracked across the entireset of six stages. Most students have moved only two or three levels during the period ofdetailed tracking. Therefore, when survival analysis is used to estimate the movement across allsix stages, different students will be providing the data at each of the different stages. Thiswould not be a serious problem if English language development programs were well establishedand standardized. District staff have been working diligently during the last few years, however,to improve the design and the effectiveness of programs. Thus, as longer term data becomeavailable we may discover that there are significant shifts in the amount of time it takes forstudents to move through the various fluency stages. Nevertheless, when applied to the availabledata, survival analysis provides a powerful and accurate estimate of the amount of time typicallytaken to move from Pre-Production to Redesignation as Fluent English Proficient.
The charts shown on the next page (Tables VI.17a through VI.17e) present the "survivalfunctions" for the movement of SAUSD students through each of the six English languagefluency stages. The lines on each chart represent the students in each of the District's four ELDprograms. The movement of the students receiving Transitional Bilingual Education (TBE) isshown with a dashed red line. Those receiving mixed TBE and Immersion services are shownwith a dotted green line. Immersion program students are tracked with a blue dashed line. Andthe movement of LEP students receiving only mainstream support services is shown with a solidpink line.
The vertical axis of each chart shows the proportion of students still in the earlier stage ofEnglish fluency. The horizontal axis tracks the number of months that have elapsed since thestudents were first identified as having reached the starting stage. Thus, the lines for all fourELD program groups start in the upper left corner of each chart, indicating that all students wereat the starting fluency stage when timekeeping began. As the months pass (moving from left toright on each chart) the proportion of the students remaining at the beginning fluency level ineach program is repeatedly plotted on the chart. The more rapidly students move from onefluency level to the next, the more rapidly the line for that group of students moves from the topto the bottom of the chart. Thus, for example, in Table VI.17a, the lines representing TBE,combined TBE & Immersion, and Immersion program students all descend more rapidly than the
CERC @ UCR VI - 177 0
05/20/98

Tables VI.17a through VI.17e: Charting Movement from One Fluency Level to the Next
Time: Pre-Production to Early Prod.
for each ELD Program
Without controlling for other variables1.0
.8
.6
.4
.2
0.0.Mtn
12 18 24 30
Months since classified Pre-Production
36
ELD Programs
a Mainstream LEP
o Immersion
o TBE & Immersion
o TBE
Median: 15.38 mo
VI.17a
Time:Speech Emerg to Intermediate Fluency
for each ELD Program
W ithout controlling for other variables1.0
.e
.6
.4
.2
0.06 12 18 24 30 36
ELD Programs
o M ainstream LEPIM
Immersion
o TBE & Immersionin Io TBE
Median: 28.01 months
Months since classified Speech Emergence
CERC @ UCR
VL17c
Time: Early Prod to Speech Emerg.
for each ELD Program
Without controlling for other variables1.0
.8
.6
.4
.2
0.0
low%
12 18 24 30 36
Months since classified Early Production
ELD Programs
o Mainstream LEP=I
Immersion
TBE & trnorsion
TBE
Median: 18.08 rronths
VI.17b
Time: Intermediate to Advanced Fluency
for each ELD Program
Without controlling for other %enables1.0
.8
.6
.4
.2
0.0
i_
. _ , -1/4 a h
1 I
a 1
I
..... .....' 1
A
6 12 16 24
Manths since classified interrnediate
Time: Advanced to Redesignation
for each ELD Program
Without controlling for other variables1.0
6 12 18 24 30
Months since classified Advanced
VI - 18
36
71
ELD ProgramsI=1o Mainstream LEP
Immersion
o TBE & Immersion11917.12
o TBEMedian: 31+ months
VI.17e
36
Ftograrre
ainstream LEP
mersion
E & Immersion
ian: 32+ months
VI.17d
05/20/98

line for the Mainstream LEP student group, indicating quite graphically that students in each ofthe three program designs move more rapidly from the Pre-Production to Early Production stage.
Shown at the lower right hand corner of each chart is the survival analysis estimate of the mediantime for students to move between the fluency levels being examined. The median time is thetime needed for 50 percent of the students to move from one level to the next. As shown inTable VI.17a, the median time for movement from the Pre-Production level to Early Productionof English is 15.38 months. That is 50 percent of the students who enter SAUSD at the Pre-Production level will be reclassified as Early Production fluent in just over 15 months. The other50 percent will take longer. In fact, as the tracking lines on this chart show, substantially lessthan 50 percent of the Mainstream LEP students move to Early Production by the 15th , or eventhe 18th month. Indeed, only about 50 percent of the Mainstream LEP students reach the EarlyProduction level by the end of the 32 months of data available from the District's LEP database.By contrast, TBE, TBE & Immersion and Immersion students advance about 60 percent of theirstudents to Early Production by the 18th month, and have less than 30 percent of their studentsstill at the Pre-Production level at the end of 32 months. TBE programs bring the total remainingin the Pre-Production level below 15 percent by the end of the tracking period.
Close study of the charts shown in Tables IV.17b through IV.17e show that the students move atdifferent rates across the various fluency stages. It takes just over 18 months for 50 percent ofthose students who reach Early Production to move on to the Speech Emergence level.Movement from Speech Emergence to Intermediate Fluency takes just over 28 months.Movements across the last two steps Intermediate to Advanced Fluency and Advanced Fluencyto Redesignation take sufficiently long that the District's LEP database is not able to provideaccurate estimates. It is clear that median time for movement from Intermediate to AdvancedFluency is at least 32 months, and from Advanced to Redesignation at least 31 months, but thesetimes are too close to the end of the tracking time period to be confident that they are notsignificantly underestimating the actual time the typical student will take.
Careful examination of the charts also reveals that the various ELD programs do not have thesame level of effectiveness in facilitating student language fluency growth at each stage in theprocess. While the students in TBE programs move slightly more rapidly from Pre-Productionto Early Production, and again from Advanced Fluency to Redesignation, the Immersion has thebest time moving students from Early Production to Speech Emergence. There is almost nodifference among programs in the movement from Speech Emergence to Intermediate Fluencyand the Mainstream LEP students move the most rapidly from Intermediate to AdvancedFluency. This mixed pattern of results leads to two conclusions:
a) Different ELD program approaches are more effective in addressing some types oflanguage development than others. That is, a single ELD program design is probablynot the best way to move students through all stages of English language acquisition.Different instructional designs probably help at different stages in the process.
b) Since students are not randomly assigned to ELD program types, it is not appropriateto think of the time data as proving that one program is globally more effective thananother. Analysis of this question will require close study of the differences in
CERC @ UCR VI - 19 05/20/98
7 2

program intakes. And even then, care should be taken in making programadjustments.
The simplest estimate of the time it takes for students who enter public schools to move throughall the steps from Pre-Production to Redesignation would be to add together the median timesshown on Tables VI.17a through VI.17f. This total (15.38 + 18.08 + 28.01 + at least 32.00 + atleast 31.00) yields an estimated time of English language proficiency development of at least124.47 months (about ten and a third years). This is quite a bit longer than recent publishedestimates that have been running in the five to seven year range. Additionally, these estimates
Tables VI.18a-c: Two Stage Language Development
Time: Pre-Production to Speech Emerg
for each ELD Program
Without controlling for other variables
include many students who entered SantaAna schools well after their kindergartenyear and who may have special learningproblems. One check on this lengthyestimate of the time to reach full Englishfluency can be made by examining howlong it takes for those students whose recordcontains movement across multiple stagesto move two or more steps.
As shown in Tables VI.18a through VI.18c,there are sufficient numbers of studentsmoving through multiple stages to makereasonably reliable estimates of how longit takes to move two languagedevelopment levels.
The survival analysis estimate formovement from the Pre-Production,through Early Production and to theSpeech Emergence stage is 23.82 months(nearly two years, but considerably lessthan the 33.44 months estimated byconsidering the movements one level at atime).
The estimated time to move from EarlyProduction to Intermediate Fluency is28.51 months. While considerably more than two years, this estimate is also well below the46.09 months produced when estimates for the two separate stages are added together.
1.0
.8
.6
.4
.2
0.0
,
"F:
1190 6 12 18 24 30 36
Months since classified Pre-Production
ELD Programs=====
o Mainstream LEP
Itmersion
TBE& Immersion
Time: Early Production to Intermediate
for each ELD Program
without controlling for other variables1.0
8
.8
.4
.2
sz-zir.
_............... ..
TBE
Median: 23.82 months
VI.18a
a D Programs
Mainstream LEP
Immersion
TBE & ImmersionMIMEO
TBE
0.0 Median: 28.51 months0 6 12 18 24 30 36
Months since classified Early ProductionVI.18b
CERC @ UCR VI - 20
7 3
05/20/98
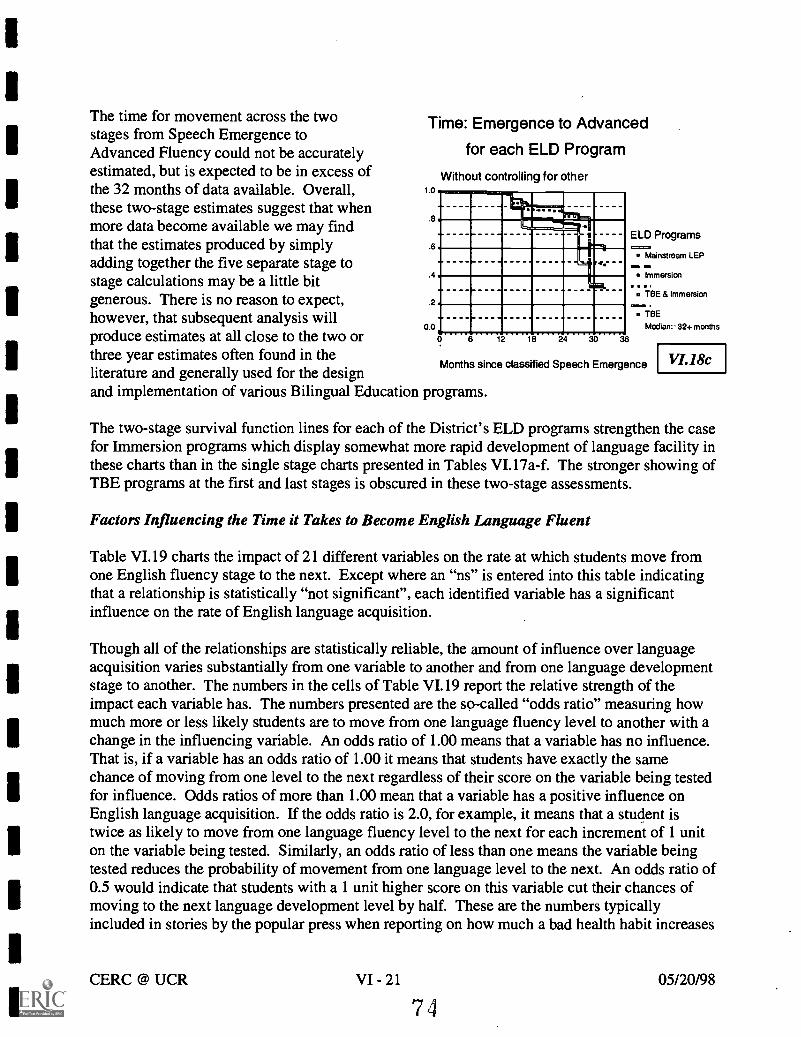
1
1
The time for movement across the twostages from Speech Emergence toAdvanced Fluency could not be accuratelyestimated, but is expected to be in excess ofthe 32 months of data available. Overall, to
these two-stage estimates suggest that when.8
more data become available we may findthat the estimates produced by simply 6
adding together the five separate stage to.4stage calculations may be a little bit
generous. There is no reason to expect, 2
however, that subsequent analysis will0.0
produce estimates at all close to the two orthree year estimates often found in theliterature and generally used for the designand implementation of various Bilingual Education programs.
Time: Emergence to Advanced
for each ELD Program
Without controlling for other
a .....-.
..... - - -
. m- - - _
1
In
- L _... . ,
. T1
M.....0 6 12 18 24 30 36
Months since classified Speech Emergence
Programs
ainstream LEP
mersion
E a Immersion
edian: 32+ months
VI.18c
The two-stage survival function lines for each of the District's ELD programs strengthen the casefor Immersion programs which display somewhat more rapid development of language facility inthese charts than in the single stage charts presented in Tables VI.17a-f. The stronger showing ofTBE programs at the first and last stages is obscured in these two-stage assessments.
Factors Influencing the Time it Takes to Become English Language Fluent
Table VI.19 charts the impact of 21 different variables on the rate at which students move fromone English fluency stage to the next. Except where an "ns" is entered into this table indicatingthat a relationship is statistically "not significant", each identified variable has a significantinfluence on the rate of English language acquisition.
Though all of the relationships are statistically reliable, the amount of influence over languageacquisition varies substantially from one variable to another and from one language developmentstage to another. The numbers in the cells of Table VI.19 report the relative strength of theimpact each variable has. The numbers presented are the so-called "odds ratio" measuring howmuch more or less likely students are to move from one language fluency level to another with achange in the influencing variable. An odds ratio of 1.00 means that a variable has no influence.That is, if a variable has an odds ratio of 1.00 it means that students have exactly the samechance of moving from one level to the next regardless of their score on the variable being testedfor influence. Odds ratios of more than 1.00 mean that a variable has a positive influence onEnglish language acquisition. If the odds ratio is 2.0, for example, it means that a student istwice as likely to move from one language fluency level to the next for each increment of 1 uniton the variable being tested. Similarly, an odds ratio of less than one means the variable beingtested reduces the probability of movement from one language level to the next. An odds ratio of0.5 would indicate that students with a 1 unit higher score on this variable cut their chances ofmoving to the next language development level by half. These are the numbers typicallyincluded in stories by the popular press when reporting on how much a bad health habit increases
CERC @ UCR VI - 21
7 4
05/20/98

chances of heart attack or cancer and how much things like air bags can reduce the chances oftraffic fatalities.
Table VI.19: Variables Affecting the Rate of Language Acquisition
Variables Influencing the Probablity of Moving from One Lan uage to the Next
Student Variables
ere-PlOdUCtial
toEarly
Produstion
re-Production
toSPesch
Emergenas
tartyProdudion
toSPosch
Emergence
baIIyProduction
toIntermediate
Fluency
Speed)Emergence
toIntermediate
Ruery
SpeechEmergence
toAdvancedFluency
InteimediateFluency
toAdvancedFluency
IntermediateFluzeny
toRedesignaticn
AdvancedRuceny
toRedesignation kerage
Continuous VariablesGrade 0.92 0.78 0.77 0.76 0.78 0.85 0.87 1.07 0.84Time in SAUSD Schools 0.92 0.98 0.76 0.76 0.74 0.81 0.79 0.72 0.97 0.82Days Absent from School 0.99 0.99 0.99 0.99 0.98 0.98 0.99 0.99 1.001 0.99Years not in SAUSD 0.95 1.02 0.95 0.91 0.94 1.07 1.14 1.11 1.02Months in Current School 1.005 1.009 0.99 0.99 ns 1.005 1.007 n.S 1.03 1.01Moved Schools at least Once 0.76 0.79 0.77 0.8 0.79 0.8 0.85 0.86 0.67 0.79School to School Transiency 0.74 076 0.87 ns no no no 1.2 no 0.94Poverty Status 0.89 0.93 1.23 1.35 1.44 1.62 1.38 1.28 1.92 1.39Overage for Grade 0.89 0.94 0.85 0.82 0.8 0.74 0.94 0.89 1.55 0.94Special Education Certified 0.56 0.53 0.56 0.62 0.42 0.37 0.54 0.58 0.25 0.48Handicapped 0.55 0.53 0.57 0.63 0.41 0.37 0.54 0.57 0.25 0.48Categorical VariablesGender
Female Reference Reference Reference Reference Reference Reference Reference Reference ReferenceMale ns RS ns no no no no n.S no
EthnicityHspanic Reference Reference Reference Reference Reference Reference Reference Reference Reference
Asian ns ns 0.45 0.48 0.3 0.32 0.36 0.35 0.3 0.37All Others ns ns 0.81 0.88 0.13 0.12 0.31 0.34 missing 0.43
Native LanguageSpanish Reference Reference Reference Reference Reference Reference Reference Reference Reference
Pacific Rim Languages 1.34 1.52 0.45 0.44 0.33 0.32 0.44 0.43 0.29 0.53All Others 6.85 0.02 0.34 0.57 missing rtissing missing missing missing 0.31
YRE CycleTau:Nona! Reference Reference Reference Reference Reference Reference Reference Reference Reference
Cyde A 0.92 0.75 1.16 1.24 1.28 1.58 rtS 0.70 no 1.12Cycle B 0.87 0.75 1.02 1.05 1.08 1.36 no 0.77 ns 1.01Cycle C 0.80 0.75 0.99 0.95 1.30 1.74 no 0.76 no 1.08Cyde D 0.95 0.74 1.05 1.14 1.13 1.33 no 0.76 n.S 1.03
Neighborhood of ResidenceZp 92701 Reference Reference Reference Reference Reference Reference Reference Reference ReferenceZp 92702 0.57 0.77 0.88 0.95 1.02 0.80 no ns ns 0.88Zip 92703 0.86 0.90 0.93 0.89 0.93 0.99 no no no 0.93Zp 92704 0.84 0.84 0.85 0.83 0.83 0.83 no no rtS 0.84Zp 92705 0.74 0.99 0.71 0.71 0.93 1.06 no no no 0.88Zp 92706 1.59 1.56 0.87 0.76 1.08 1.21 no no no 1.10Zp 92707 1.07 1.17 0.85 0.83 0.79 0.85 no no no 0.90All Others 0.79 0.85 0.68 0.65 0.91 0.76 no ns no 0.77
Teacher Vadables
Age ns no 0.99 0.98 0.99 0.99 0.99 0.99 0.94 0.98Gender 0.87 ns 0.59 0.52 0.59 0.64 0.71 0.72 ItS 0.63Everience 1.01 no 0.98 0.98 0.99 0.99 0.97 0.97 ns 0.98Education 1.15 1.21 no no no 1.30 1.32 no 1.28Certification 1.05 1.03 0.96 0.96 0.94 0.95 0.90 0.90 0.43 0.88
The tested variables described in Table VI.19 are clustered into three groups. The top of thetable presents 11 student characteristics that change along a scale measured as differences in
CERC @ UCR VI - 22
7505/20/98

amount (where having a score of 2 means that the student has more of this characteristic thanhaving a score of 1).
In the bottom section of the table are teacher characteristics. Each student was assigned avariable value on the basis of the value on each variable which his or her teacher possessed. Theonly students with whom it was possible to associate teacher characteristics were elementarystudents (since secondary students have more than one teacher their teacher characteristics couldnot be analyzed).
In the middle section of the table are five student characteristics in which students belong todiscrete groups (like ethnic or gender groups). In this case, having a score of 2 does not meanhaving more of some characteristic than having a score of one, it just means the student belongsto a different group. These discrete grouping variables are a bit more complicated to evaluatethan the ones with regular scales. To interpret the impact of these variables, it is necessary toselect a "reference" group and then assess the probability of advancing in fluency relative to thereference group. For the ethnicity variable, for example, the very large group of ethnic Hispanicswere selected as a reference group and this variable was evaluated by examining whether otherstudents are more or less likely to move to the next fluency level than the Hispanic referencegroup.
In the right hand column of the table the average influence of each variable is reported. The cellsin the large central part of the table report the odds ratio for movement from one languagedevelopment level to the higher or to a level two stages more advanced, as indicated at the top ofeach column.
As the entries across the middle rows of the table indicate, student gender has no measurableeffect on language development at any level. This variable was retained because of the generalinterest in whether schools are providing girls and boys with equal educational opportunities. Inregard to language development, at least, Santa Ana schools have clear evidence that sex equityhas been realized.
Though it is tempting to just look at the overall average effect of these variables in order toconclude whether they are supporting or interfering with language development, the numbers inthe middle columns show that more than half of them (12 to be exact) have different effects atdifferent stages of the language acquisition process. Most often, the reversal of effect for thesevariables occurs at one end or the other of the language development process. The influence ofthe student's grade level (the first variable on the table) illustrates this tendency. As childrenadvance in grade, their movement through the various stages of language acquisition tends toslow down, except for the movement from advanced fluency to redesignation and a FluentEnglish Proficient student. The rate of movement from the earliest Pre-Production level to theEarly Production level drops by about 8 percent (the odds ratio is .92) for each grade the childadvances without making this crucial language development step. In the middle levels oflanguage development the price of delayed movement is a bit higher. No doubt, this fact ispartly the result of program designs curriculum materials and instructional activities are gearedto addressing language development during the first three or four years of schooling. Childrenwho fall behind the expected rate of progress probably find themselves caught in the dilemma of
CERC @ UCR VI - 23 05/20/98

trying to keep up with the language development process while being expected to shift theirattention to more content oriented learning tasks. The total amount of time students have spentin SAUSD schools (which closely parallels their grade level) bears a similar relationship tolanguage development.
Six variables have a consistently negative impact on the rate of English language development.They include, in order of the magnitude of their impact:
1. EthnicityThe language development rate of LEP students from Asian countries and thosefrom non-Hispanic backgrounds have a consistently harder time moving along thelanguage development process (overall odds ratio of .37 for Asians, .43 forothers).
2. Home LanguageBeing a native speaker of a non-English language other than Spanish has a nearlyidentical effect, except that these students make very rapid progress at the veryfirst step moving from Pre-Production to Early Production of English.
3. Special Education (the overall odds ratio for each of these variables is about .48)Special status students (educationally handicapped or certified for specialeducation), as would be expected, have a harder than average time with Englishlanguage development on average, they move through the language stages atonly about half the rate of their peers.
4. Transiency Rate (average odds ratio of .79).Language development programs lose about 21 percent of their effectiveness forstudents who move from one school to another.
5. Teacher Age (average odds ration is .96)Students assigned to older teachers are slower to advance in ELD levels.
6. Teacher Gender (average odds ratio is .63)Students assigned to male teachers are slower to advance in ELD levels.
Increased education among teachers has a strong positive impact on language acquisition at boththe early and late stages, raising the probability that students will move out of the Pre-Productionstage by 15 to 21 percent, and improving the chances of their reaching Advanced Fluency orRedesignation by about 30 percent.
All of the attendance cycles in Year Round Schools, when compared with traditional calendarschools have consistently positive results during the middle stages of language acquisition, andgenerally lower rates of movement at the lowest and highest stages.
Student residential neighborhoods, as measured by postal zip codes, have significant, but oftenmixed impact on language acquisition.
CERC @ UCR VI - 24 05/20/98
7 7
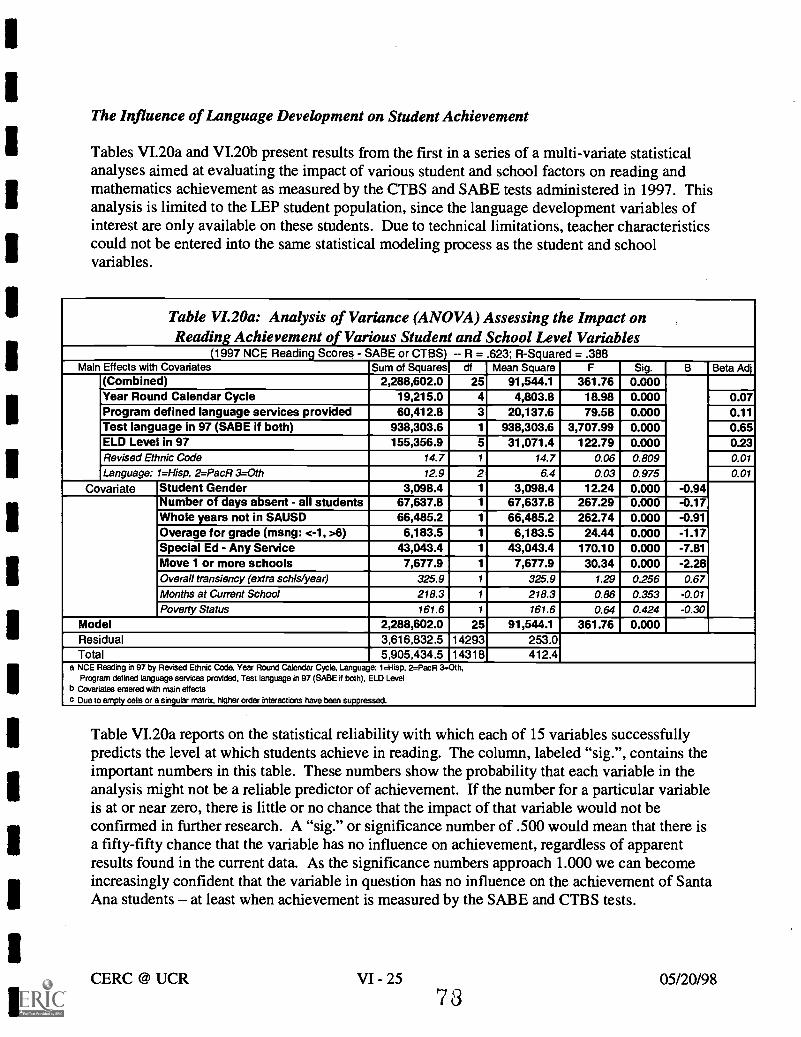
1
1
The Influence of Language Development on Student Achievement
Tables VI.20a and VI.20b present results from the first in a series of a multi-variate statisticalanalyses aimed at evaluating the impact of various student and school factors on reading andmathematics achievement as measured by the CTBS and SABE tests administered in 1997. Thisanalysis is limited to the LEP student population, since the language development variables ofinterest are only available on these students. Due to technical limitations, teacher characteristicscould not be entered into the same statistical modeling process as the student and schoolvariables.
Table VL20a: Analysis of Variance (ANOVA) Assessing the Impact onReading Achievement of Various Student and School Level Variables
(1997 NCE Reading Scores - SABE or CTBS), -- R = .623; R-Squared = .388Main Effects with Covariates Sum of Squares df Mean Square F Sig. B Beta Adj
(Combined) 2,288,602.0 25 91,544.1 361.76 0.000Year Round Calendar Cycle 19,215.0 4 4,803.8 18.98 0.000 0.07Program defined language services provided 60,412.8 3 20,137.6 79.58 0.000 0.11Test language in 97 (SABE if both) 938,303.6 1 938,303.6 3,707.99 0.000 0.65ELD Level in 97 155,356.9 5 31,071.4 122.79 0.000 0.23Revised Ethnic Code 14.7 1 14.7 0.06 0.809 0.01
Language: 1=Hisp, 2=PacR 3.0th 12.9 2 6.4 0.03 0.975 0.01
Covariate Student Gender 3,098.4 1 3,098.4 12.24 0.000 -0.94Number of days absent - all students 67,637.8 1 67,637.8 267.29 0.000 -0.17Whole years not in SAUSD 66,485.2 1 66,485.2 262.74 0.000 -0.91Overage for grade (msng: <-1, >6) 6,183.5 1 6,183.5 24.44 0.000 -1.17Special Ed - Any Service 43,043.4 1 43,043.4 170.10 0.000 -7.81Move 1 or more schools 7,677.9 1 7,677.9 30.34 0.000 -2.28Overall transiency (extra schls/year) 325.9 1 325.9 1.29 0.256 0.67Months at Current School 218.3 1 218.3 0.86 0.353 -0.01
Poverty Status 161.6 1 161.6 0.64 0.424 -0.30Model 2,288,602.0 25 91,544.1 361.76 0.000Residual 3,616,832.5 14293 253.0Total 5,905,434.5 14318 412.4
a NCE Reading in 97 by Revised Ethnic Ccde, Year Round Calendar Cycle, Language: 11isp, 2=PacR 3.0th,Program defined language services provided, Test language in 97 (SABE If both), ELD Level
b Covariates entered with main effectsc Due to empty cells or a singular matrix, higher order interactions have been suppressed.
Table VI.20a reports on the statistical reliability with which each of 15 variables successfullypredicts the level at which students achieve in reading. The column, labeled "sig.", contains theimportant numbers in this table. These numbers show the probability that each variable in theanalysis might not be a reliable predictor of achievement. If the number for a particular variableis at or near zero, there is little or no chance that the impact of that variable would not beconfirmed in further research. A "sig." or significance number of .500 would mean that there isa fifty-fifty chance that the variable has no influence on achievement, regardless of apparentresults found in the current data. As the significance numbers approach 1.000 we can becomeincreasingly confident that the variable in question has no influence on the achievement of SantaAna students - at least when achievement is measured by the SABE and CTBS tests.
CERC @ UCR VI - 257 3
05/20/98

Five of the variables in this analysis have significance values indicating that they probably haveno bearing on student achievement in reading. These non-significant variables include: thestudents' ethnic backgrounds, native language, poverty status, months enrolled in their currentschool, and overall transiency (that is moving from school to school). Note, however, that thereare two different measures of transiency in this analysis. The second transiency variablecompares all students that changed schools at least once during the last five years (not countingmoves from elementary to middle or middle to high school) with those whose education was notdisrupted by any school changes. This latter variable is a strong and reliable predictor of readingachievement.
The remaining ten variables including the students' English language fluency levels all havesignificance scores of .000, indicating that they are highly reliable predictors of studentachievement in reading.
Since we are assured by the significance scores that these ten variables are reliable predictors ofachievement, can we estimate how much each variable may have? For the answer to thisquestion, we turn to the column labeled "B" on Table VI.20a and the data presented in TableVI.20b. A measure of the magnitude of effect each of the seven variables that change in degreeor magnitude (rather than serving to classify students into distinct groups) is reported in the nextto last column of Table VI.20a. The so-called "B" scores for all of these continuous variables(i.e. those varying by amount or degree) is the average amount that achievement test scoreschange for each one unit of change in the predictor variable.
As might be expected, among the highly reliable predictors of reading achievement, the "B"score for the variable indicating whether students are certified for special education is the largest.Since this variable has only the values of 0 (for students not certified for special education) and 1for those that are, the -7.81 B-score for this variable means that students in special educationprograms score nearly 8 points below their regular education peers on the District's readingachievement examination. Students who change schools at least once in five years are prone toscore about two and a quarter point below their non-transient peers.
Absenteeism also erodes reading achievement. Students lose, on average about 116th of an NCSpoint on their reading test for every day they miss.
Achievement loss is further eroded for students who do not enter SAUSD at the start of theirschooling. For every year past kindergarten that they enter District schools, students loose about9/10ths of a point on the test.
Finally, boys score less well on the reading test than girls; .94 points less on the average.
To assess the magnitude of the impact on student reading achievement produced by thecategorical variables shown on Table VI.20a we must refer to the numbers on Table VI.20b. Thenumbers on this table provide three kinds of information for each student group. The firstcolumn (labeled "N") reports the number of students in each sub-group. Thus, for example, thetable shows that 13,769 Hispanic students took the reading tests, as compared with 550 studentsof Asian heritage and only 45 students from all other backgrounds.
CERC @ UCR VI - 26 05/20/98
7 9

1
1
Table 14.20b: Mean and Deviation Reading Test Scores on Student Groups(1997 NCE Reading Scores - SABE and CTBS)
Predicted Mean DeviationAdjusted for Adjusted forFactors and Factors and
N Unadjusted Covariates Unadjusted CovariatesRevised Ethnic Code Hispanic 13,769 32.79 32.62 0.18 0.01
Asian 550 28.90 32.69 -3.71 0.08Other 45 23.71 28.21 -8.90 -4.40
Year Round Traditional 7,229 28.43 33.70 -4.18 1.09Calendar Cycle Cycle A 1,555 39.82 33.17 7.21 0.56
Cycle B 1,650 36.36 32.24 3.75 -0.37Cycle C 1,993 36.00 29.78 3.39 -2.83Cycle D 1,937 35.75 31.31 3.14 -1.30
Language Hispanic 13,767 32.79 32.57 0.18 -0.05Pacific Rim 584 28.63 33.67 -3.98 1.06Other 13 19.23 32.90 -13.38 0.29
Program TBE 4,864 43.09 32.99 10.48 0.38TBE & Immersion 2,201 27.91 28.29 -4.70 -4.32Immersion 3,348 25.65 31.63 -6.96 -0.98Mainstream LEP 3,951 28.23 35.38 -4.39 2.77
Test language in 97 SABE 4,074 50.41 53.53 17.80 20.92(SABE if both) CTBS 10,290 25.57 24.33 -7.05 -8.28ELD Level in 97 Pre-Production 687 42.62 23.27 10.00
-
-9.34Early Production 1,715 45.88 26.93 13.27 -5.68Speech Emergence 2,683 37.04 28.44 4.43 -4.17Intermediate Fluency 3,278 28.11 32.18 -4.50 -0.43Advanced Fluency 5,392 27.22 36.79 -5.39 4.18Redesignated 609 36.41 42.84 3.80 10.23
a. NCE Reading in 97 by Revised Ethnic Code, Year Round Calendar Cycle, Language, Program,Test language in 97 (SABE if both), ELD Level
Next to the number of students column are two columns containing overall reading achievementtest score averages for each group. The first of these two columns contains the "Unadjusted"means - the simple average of all test scores from the group identified at the left side of the table.The second column of mean scores is the so-called "Adjusted" mean - the average reading scoremembers of this student group would get if they were not affected by any of the other variablesin the study. The last two columns on the table show the "Deviation" scores, the differencebetween the scores for students in each group and the overall average all students.
These numbers are perhaps most easily understood in relation to the language of the test taken byeach student (shown just above the ELD Level data at the bottom of the table). As shown in thenumber of students column, 4,074 LEP students took the reading test in Spanish (the SABE)while 10,290 took the test in English (the CTBS). The average score on the Spanish languagetest, for all students, was 50.4072 just above the national norm of 50 points. Students takingthe test in English, by contrast scored an average of only 25.5654 more than 24 points belowthe Spanish language test takers. As seen earlier in our discussion of Table VI.14, this very large
CERC @ UCR VI - 278 0
05/20/98

difference is found at all grade levels and in all bilingual programs. Moreover, as shown in thecolumn listing adjusted mean scores, the difference is even more dramatic than the unadjustedtest scores would suggest. When other differences between the Spanish and English languagetest takers are considered, the difference in overall reading performance jumps to more than 29NCE points substantially more than two years of academic growth. This difference is not onlytrue for the total student population, it is also found when we consider only those students whohave taken both the Spanish and English version of the tests. Whenever students shift over totake the examination in English they appear to be achieving far less reading fluency than thatmeasured on the Spanish language examination.
This loss in measured reading achievement does not apply to every single student who shiftsfrom Spanish to English, of course. But it is found in such a large majority that we mustconclude that either the tests are highly biased or that children moving to the English languageversion of the examination are actually much better readers than their scores on the EnglishCTBS would indicate. (Discussions with the test maker, CTB McGraw, indicate that these twotest are normed in such a way that a score of 50.00 on each test means that students have reachedthe same level of reading competency in the language of the test and that differences inperformance across the tests reflect differences in language development, not overall readingability).
Nearly as powerful as the test language in predicting student performance levels is the teacherreported English Language Development level for each student. As shown at the bottom ofTable VI.20b, students do better (on whatever reading test they take) with each new level ofEnglish language fluency. Students at the Pre-Production in English score more than 9 pointsbelow the average on the reading exam even if they take the examination in Spanish. Studentswho have been redesignated score about 10 points above average. The other ELD levels arespread out between these end points, with a positive advantage accruing only to students whoreach the Advanced Fluency level or above.
It is especially important to remember that the small differences between language and ethnicgroups shown on this table are not statistically reliable and should not be considered indicators ofreal differences in reading attainment.
As indicated near the middle of the table, the four different ELD programs have significantlydifferent effects on student reading outcomes. The biggest deviation from the general studentpopulation is that for students who have mixed TBE and Immersion program experiences. Thesestudents score more than 4 points below other students after their test scores are adjusted forother factors (including the test language). The biggest positive reading margin was obtained bystudents in Mainstream LEP programs who were not provided with any specific ELD programsupport services. It must be remembered, however, that student placement typically followscareful professional deliberation and family consultation, so that students left in the educationalmainstream are almost certainly those judged to be the most able and with the strongest familysupport.
Year Round Education, while reliably linked to reading achievement, does not have aparticularly dramatic effect. Students in traditional calendar schools have about a 1 point
CERC @ UCR VI - 28 6105/20/98
advantage, and children on Cycle C nearly a 3 point disadvantage, but these numbers are smallcompared to ELD levels and test language differences.
Two additional pieces of information found on Table VI.20a present a broad overview of thestatistical model presented above. The last column of this table (labeled "Beta Adj") reports aset of statistics that enable us to see the relative importance of each of the student groupingfactors in predicting their level of reading achievement. The column reports the BetaCoefficients (adjusted for factors and covariates) for each factor in the study. These scores arestandardized in a way that makes it appropriate to directly compare the value for one groupingvariable against the value for others.
That is, the value of .65 for the Test Language variable, when compared with the value of .23 forthe ELD Level in 97, indicates that the difference in performance between Spanish and Englishlanguage test takers is nearly three times as great as the differences among the various languagedevelopment levels (.651.23 = 2.80).
Finally, near the top of Table VI.20a statistical measures characterizing the overall power of thevariables studied in this analysis to predict student achievement in reading are reported. Thevalue of the "R-Squared" number is a measure of the overall ability of all the variables studied inthese tables to predict how well students will perform on their reading assessment test. Thevalue of .388 means that these variables account for nearly 40 percent (38.8 percent to be exact)of all reading achievement differences a very powerful finding, more powerful than is usuallyfound in this type of evaluation study.
The influence of Primary Language Development on Reading Achievement in English?
Tables VI.21a and VI.21b present an analysis of the same reading test data just discussed. Theonly difference between the analyses in this set of tables and that presented in Tables VI.20a-b isthe inclusion of the level of Primary Language Development reported for each student.
As shown in Table VI.21a, the Primary Language Development variable, "PLD Level in 97,"makes a highly significant additional contribution to explaining the level of reading achievementamong Santa Ana students. Except for the reliability of the Overage for Grade variable,inclusion of this variable does not change the reliability of any other indicators in the model.The Overage variable continues to predict about the same amount of change in readingattainment, but with this model the significance level is only .075, meaning that about 75 timesin a thousand this finding would be the result of chance variations in the particular sample ofstudents being studied.
CERC @ UCR VI - 29 05/20/98
8 2

Table VI.21a: Analysis of Variance (ANOVA) Assessing the Impact onReading Achievement including Primary Language Levels(1997 NCE Reading Scores SABE or CTBS) R = .647; R-Squared = .419
Main Effects with Covariates Sum of Squares df Mean Square F Sig. B Beta Adj(Combined) 1,512,127.4 30 50,404.2 169.27 0.000Year Round Calendar Cycle 18,832.8 4 4,708.2 15.81 0.000 0.08Program defined language services provided 19,655.6 3 6,551.9 22.00 0.000 0.08Test language in 97 (SABE if both) 675,313.8 1 675,313.8 2,267.93 0.000 0.65ELD Level m 97 54,287.5 5 10,857.5 36.46 0.000 0.16PLD Level in 97 18917.909 4 4,729.5 15.883 0.000 0.08Revised Ethnic Code 79.2 1 79.2 0.13 0.715 0.02Language: 1=i-lisp, 2=PacR 3=Oth 497.6 2 248.8 0.84 0.433 0.01
Covariate Student Gender 12,938.9 1 12,938.9 43.45 0.000 -2.72Number of days absent - all students 20,609.7 1 20,609.7 69.21 0.000 -0.27Whole years not in SAUSD 58,510.3 1 58,510.3 196.50 0.000 -2.11Overage for grade (msng: <-1, >6) 942.7 1 942.7 3.17 0.075 -0.83Special Ed - Any Service 24,241.3 1 24,241.3 81.41 0.000 -8.84Move 1 or more schools 7,693.6 1 7,693.6 25.84 0.000 -3.17Overall transiency (extra schls/year) 746.8 1 746.8 2.51 0.113 1.33
Months at Current School 18.8 1 18.8 0.06 0.802 0.80Poverty Status 1.2 1 1.2 0.00 0.950 0.04
Model 1,512,127.4 30 50,404.2 169.27 0.000Residual 2,098,065.7 7046 297.8Total 3,610,193.1 7076 510.2
a NCE Reading in 97 by Revised Ethnic Code, Year Round Calendar Cy Cle, Language: 1=Hisp, 2=PacR 3=0th,Program defined language services provided, Test language in 97 (SABE if both), ELD Level
h Covajiales entered with main effectsc Due to empty cells or a singular matrix, higher order interacticns have been suppressed.
Table VI.2 lb provides documentation of the extent to which reading achievement is influencedby a student's level of fluency in his/her primary language. The effect for the 84 Pre-Productionstudents is essentially zero, but for the larger groups with primary language fluency levelsranging from Early Production to Advanced Fluency, we find a steady increase in achievementscores as with each advance in language fluency. The range is considerably smaller than thatassociated with English fluency - the Early Production group falls about 5 points below theoverall test mean while the Advanced Fluency group is a little over 2-1/2 points above theoverall test average.
CERC @ UCR VI - 30 Q0 05/20/98

Table VL21b: Mean and Deviation Reading Test Scores with PLD Levels(1997 NCE Reading Scores -- SABE and CTBS)
N
Predicted Mean Deviation
Unadjusted
Adjusted forFactors andCovariates Unadjusted
Adjusted forFactors andCovariates
Revised Ethnic Code Hispanic 6,957 39.00 38.80 0.15 -0.05Asian 112 29.97 41.76 -8.87 2.91Other 8 32.75 41.92 -6.10 3.07
Year Round Traditional 1,519 35.82 41.06 -3.03 2.21Calendar Cycle Cycle A 1,263 42.74 40.11 3.89 1.26
Cycle B 1,335 38.80 38.84 -0.05 -0.01Cycle C 1,553 38.40 36.24 -0.44 -2.61Cycle D 1,407 39.16 38.21 0.31 -0.63
Language Hispanic 6,954 39.01 38.87 0.16 0.02Pacific Rim 122 29.92 38.01 -8.93 -0.84Other 1 1.00 14.63 -37.85 -24.22
Program TBE 4,350 45.19 39.95 6.34 1.10TBE & Immersion 1,711 29.60 35.69 -9.24 -3.15Immersion 694 25.90 39.30 -12.95 0.45Mainstream LEP 322 30.16 39.81 -8.68 0.96
Test language in 97 SABE 3,673 51.50 52.98 12.65 14.14(SABE if both) CTBS 3,404 25.20 23.59 -13.65 -15.25ELD Level in 97 Pre-Production 489 42.85 31.53 4.00 -7.32
Early Production 1,460 49.02 36.65 10.17 -2.20Speech Emergence 2,072 41.78 37.41 2.93 -1.44Intermediate Fluency 2,010 31.49 40.14 -7.36 1.29Advanced Fluency 759 29.34 44.36 -9.51 5.52Redesignated 287 35.83 49.24 -3.02 10.39
PLD Level in 97 Pre-Production 84 37.35 38.93 -1.50 0.08Early Production 417 39.47 33.51 0.62 -5.33Speech Emergence 1,931 42.48 37.47 3.63 -1.37Intermediate Fluency 3,175 39.42 39.19 0.58 0.34Advanced Fluency 1,470 32.75 41.42 -6.10 2.57
a. NCE Reading in 97 by Revised Ethnic Code, Year Round Calendar Cycle, Language, Program,Test language in 97 (SABE if both), ELD Level
Once again, the last column in Table VI.21a reports the relative power of each of the factorsdescribed on Table VI.21b in predicting reading achievement. As before, the test language is, byfar, the most potent predictor, followed by English language development level and then primarylanguage development level. The influence of ELD program enrollment remains significant, butis fourth place behind test language and the two language development level indicators. The "R"and "R-Squared" values reported at the top of Table VI.21a re-evaluates the power of the entiremodel. The ability to explain differences in reading achievement level goes up from the previousmodel's .388 to an R-squared value of .419, a gain of a little over 3 percent in explanatorypower. That is, we will on average be 3 percent more accurate in predicting a child's overallreading achievement scores if we know how fluent they are in their primary language.
CERC @ UCR VI - 318 4
05/20/98

This may not seem like a lot of difference, but it is comparable to the margin of differenceseparating winners and losers in most popular elections, and is larger than the winning margin inmost professional sports.
How about Language Fluency Influence on Mathematics Achievement?
Tables VI.22a & b and VI.23a & b are exactly parallel with the reading achievement analysesjust reviewed, except that the dependent variable in each case is the rate of mathematics ratherthan reading achievement.
There are a number of modest differences between reading and mathematics achievementpatterns among SAUSD students. As with reading, student gender does not influence mathachievement, and transiency beyond the first school to school move does not further erodeachievement. However, both student ethnicity and poverty status influence significantly the rateof math attainment.
Table VI.22a: Analysis of Variance (ANOVA) Assessing the Impact onMathematics Achievement of Various Student and School Level Variables
(1997 NCE Mathematics Scores SABE or CTBS) R = .461; R-Squared = .212Main Effects with Covariates Sum of Squares df Mean Square F Sig. B Beta Adj
(Combined) 2,288,602.0 25 91,544.1 361.76 0.000Year Round Calendar Cycle 19,215.0 4 4,803.8 18.98 0.000 0.07Program defined language services provided 60,412.8 3 20,137.6 79.58 0.000 0.11Test language in 97 (SABE if both) 938,303.6 1 938,303.6 3,707.99 0.000 0.65ELD Level in 97 155,356.9 5 31,071.4 122.79 0.000 0.23Revised Ethnic Code 14.7 1 14.7 0.06 0.809 0.01Language: 1=Hisp, 2=PacR 3=Oth 12.9 2 6.4 0.03 0.975 0.01
Covariate Student Gender 3,098.4 1 3,098.4 12.24 0.000 -0.94Number of days absent - all students 67,637.8 1 67,637.8 267.29 0.000 -0.17Whole years not in SAUSD 66,485.2 1 66,485.2 262.74 0.000 -0.91Overage for grade (msng: <-1, >6) 6,183.5 1 6,183.5 24.44 0.000 -1.17Special Ed - Any Service 43,043.4 1 43,043.4 170.10 0.000 -7.81Move 1 or more schools 7,677.9 1 7,677.9 30.34 0.000 -2.28Overall transiency (extra schls/year) 325.9 1 325.9 1.29 0.256 0.67Months at Current School 218.3 1 218.3 0.86 0.353 -0.01Poverty Status 161.6 1 161.6 0.64 0.424 -0.30
Model 2,288,602.0 25 91,544.1 361.76 0.000Residual 3,616,832.5 14293 253.0Total 5,905,434.5 14318 412.4
a NCE Reading in 97 by Revised Ethnic Code, Year Round Calendar Cycle, Language: 1=Hisp, 2=PacR 3=0th,Program defined language services provided, Test language In 97 (SABE if both), ELD Level
b Covarlates entered with main effectsc Due to empty cells or a singular matrix, higher order Interactions have been suppressed.
Table VI.22b documents the magnitude of the influence of the variables described in the tableabove.
CERC @ UCR VI - 32 05/20/98

The difference in scores between the English language CTBS and the Spanish SABE is not aslarge as in the case of reading. Only about 16 NCE points (a bit more than a year's academicattainment) separate the two tests in mathematics.
The influence of ELD Programs is similar to that for reading - students in Mainstream LEPprograms are above the district average, but TBE students now get the highest scores of anyprogram group. Students who experience both TBE and Immersion programs suffer the most inmathematics as well as reading achievement.
Traditional calendar schools lead in math achievement as they do in reading.
And English language development levels have about the same impact on math as on readingachievement. The Pre-Production students have scores nearly 10 points below average while theRedesignated students have scores more than 10 points above average.
Table VI.22b: Mean and Deviation Mathematics Test Scores on Student Groups(1997 NCE Mathematics Scores - SABE and CTBS)
Predicted Mean DeviationAdjusted for Adjusted forFactors and Factors and
N Unadjusted Covariates Unadjusted CovariatesRevised Ethnic Code Hispanic 13,769 33.57 33.71 -0.53 -0.40
Asian 550 47.93 44.51 13.82 10.41Other 45 28.11 27.82 -5.99 -6.29
Year Round Traditional 7,229 31.86 36.40 -2.24 2.30Calendar Cycle Cycle A 1,555 39.10 33.27 5.00 -0.83
Cycle B 1,650 37.24 33.71 3.13 -0.39Cycle C 1,993 35.06 29.69 0.96 -4.41Cycle D 1,937 34.82 31.05 0.71 -3.05
Language Hispanic 13,767 33.57 33.88 -0.53 -0.23Pacific Rim 584 46.87 39.46 12.77 5.36Other 13 24.54 33.99 -9.56 -0.12
Program TBE 4,864 40.89 36.28 6.78 2.18TBE & Immersion 2,201 30.61 30.93 -3.49 -3.17Immersion 3,348 30.47 32.88 -3.63 -1.22Mainstream LEP 3,951 30.77 34.22 -3.33 0.12
Test language in 97 SABE 4,074 43.56 45.71 9.46 11.61(SABE if both) CTBS 10,290 30.36 29.51 -3.74 -4.59ELD Level in 97 Pre-Production 687 35.21 24.43 1.11 -9.67
Early Production 1,715 41.20 29.26 7.10 -4.84Speech Emergence 2,683 36.31 30.59 2.21 -3.51Intermediate Fluency 3,278 32.11 33.78 -1.99 -0.32Advanced Fluency 5,392 30.96 37.62 -3.14 3.52Redesignated 609 41.65 44.72 7.54 10.61
a. NCE Reading in 97 by Revised Ethnic Code, Year Round Calendar Cycle, Language, Program,Test language in 97 (SABE if both), ELD Level
CERC @ UCR VI - 33
8 G
05/20/98
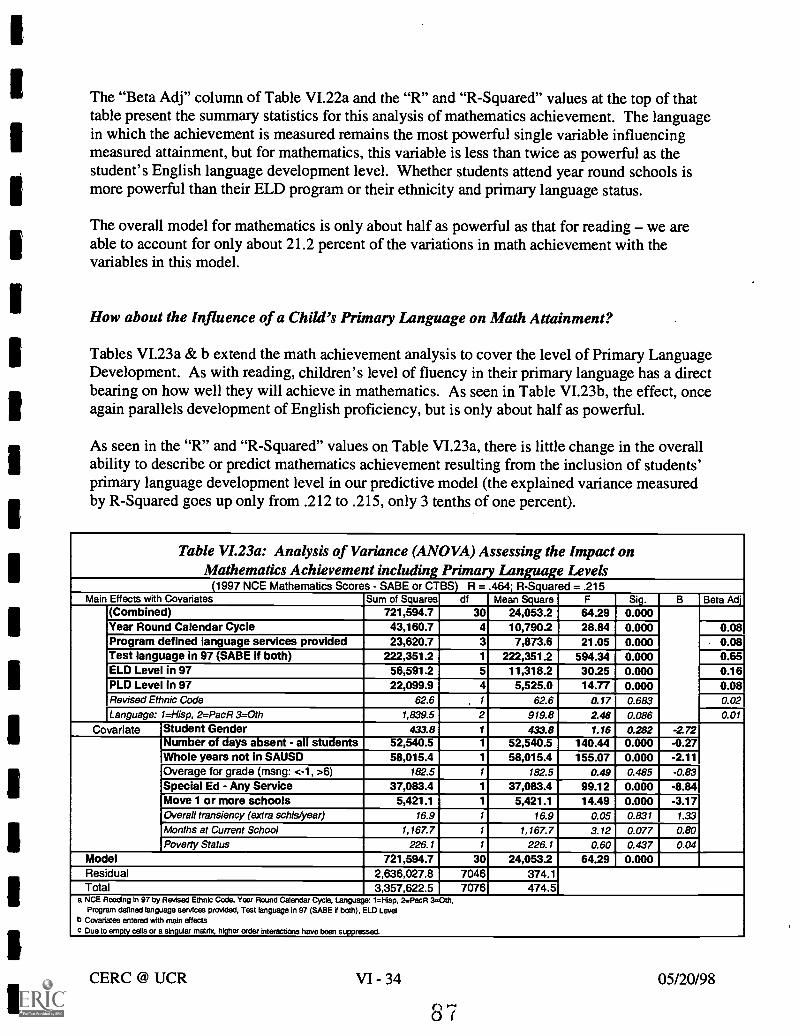
The "Beta Adj" column of Table VI.22a and the "R" and "R-Squared" values at the top of thattable present the summary statistics for this analysis of mathematics achievement. The languagein which the achievement is measured remains the most powerful single variable influencingmeasured attainment, but for mathematics, this variable is less than twice as powerful as thestudent's English language development level. Whether students attend year round schools ismore powerful than their ELD program or their ethnicity and primary language status.
The overall model for mathematics is only about half as powerful as that for reading we areable to account for only about 21.2 percent of the variations in math achievement with thevariables in this model.
How about the Influence of a Child's Primary Language on Math Attainment?
Tables VI.23a & b extend the math achievement analysis to cover the level of Primary LanguageDevelopment. As with reading, children's level of fluency in their primary language has a directbearing on how well they will achieve in mathematics. As seen in Table VI.23b, the effect, onceagain parallels development of English proficiency, but is only about half as powerful.
As seen in the "R" and "R-Squared" values on Table VI.23a, there is little change in the overallability to describe or predict mathematics achievement resulting from the inclusion of students'primary language development level in our predictive model (the explained variance measuredby R-Squared goes up only from .212 to .215, only 3 tenths of one percent).
Table VI.23a: Analysis of Variance (ANOVA) Assessing the Impact onMathematics Achievement including Primary Language Levels
(1997 NCE Mathematics Scores - SABE or CTBS) R = .464; R-Squared = .215Main Effects with Covariates Sum of Squares df Mean Square F Sig. B Beta Adj
(Combined) 721,594.7 30 24,053.2 64.29 0.000Year Round Calendar Cycle 43,160.7 4 10,790.2 28.84 0.000 0.08Program defined language services provided 23,620.7 3 7,873.6 21.05 0.000 0.08Test language in 97 (SABE if both) 222,351.2 1 222,351.2 594.34 0.000 0.65ELD Level in 97 56,591.2 5 11,318.2 30.25 0.000 0.16PLD Level In 97 22,099.9 4 5,525.0 14.77 0.000 0.08Revised Ethnic Code 62.6 1 62.6 0.17 0.683 0.02Language: 1=Hisp, 2=PacR 3=Oth 1,839.5 2 919.8 2.46 0.086 0.01
Covariate Student Gender 433.8 1 433.8 1.16 0282 -2.72Number of days absent - all students 52,540.5 1 52,540.5 140.44 0.000 -0.27Whole years not in SAUSD 58,015.4 1 58,015.4 155.07 0.000 -2.11Overage for grade (msng: <-1, >6) 182.5 1 182.5 0.49 0.485 -0.83Special Ed - Any Service 37,083.4 1 37,083.4 99.12 0.000 -8.84Move 1 or more schools 5,421.1 1 5,421.1 14.49 0.000 -3.17Overall transiency (extra schls/year) 16.9 1 16.9 0.05 0.831 1.33
Months at Current School 1,167.7 1 1,167.7 3.12 0.077 0.80Poverty Status 226.1 1 226.1 0.60 0.437 0.04
Model 721,594.7 30 24,053.2 64.29 0.000Residual 2,636,027.8 7046 374.1Total 3,357,622.5 7076 474.5
a NCE Reading in 97 by Revised Ethnic Code, Year Round Calendar Cycle, Language: 1=1-lisp, 2.PacR 3.-.0th,Program defined language services provided, Test language In 97 (SABE if both), ELD Level
b Covariates entered with main effectsc Due to empty cells or a singular mahlx, higher onier Interactions have been suppressed.
CERC @ UCR VI - 34 05/20/98

1
Table VI.23b: Mean and Deviation Mathematics Test Scores with PLD(1997 NCE Reading Scores - SABE and CTBS)
Predicted Mean DeviationAdjusted for Adjusted forFactors and Factors and
N Unadjusted Covariates Unadjusted CovariatesRevised Ethnic Code Hispanic 6,957 38.33 38.40 -0.11 -0.04
Asian 112 45.55 41.01 7.11 2.57Other 8 38.38 38.38 -0.07 -0.07
Year Round Traditional 1,519 38.61 42.70 0.16 4.25Calendar Cycle Cycle A 1,263 41.08 38.84 2.63 0.39
Cycle B 1,335 38.74 38.73 0.29 0.28Cycle C 1,553 36.70 35.03 -1.75 -3.42Cycle D 1,407 37.56 37.01 -0.89 -1.44
Language Hispanic 6,954 38.33 38.28 -0.12 -0.17Pacific Rim 122 45.52 48.13 7.07 9.68Other 1 1.00 8.44 -37.45 -30.01
Program TBE 4,350 42.22 39.70 3.77 1.26TBE & Immersion 1,711 32.08 35.29 -6.37 -3.16Immersion 694 33.44 39.69 -5.01 1.24Mainstream LEP 322 32.16 35.58 -6.29 -2.87
Test language in 97 SABE 3,673 45.05 46.56 6.61 8.11(SABE if both) CTBS 3,404 31.31 29.69 -7.13 -8.75ELD Level in 97 Pre-Production 489 35.25 30.60 -3.20 -7.84
Early Production 1,460 43.74 36.63 5.29 -1.81Speech Emergence 2,072 39.89 37.25 1.45 -1.20Intermediate Fluency 2,010 34.80 39.52 -3.64 1.08Advanced Fluency 759 34.79 43.20 -3.65 4.75Redesignated 287 41.70 49.57 3.26 11.13
PLD Level in 97 Pre-Production 84 32.37 36.87 -6.08 -1.58Early Production 417 34.06 31.94 -4.38 -6.51Speech Emergence 1,931 40.30 37.39 1.85 -1.05Intermediate Fluency 3,175 39.20 38.84 0.76 0.39Advanced Fluency 1,470 35.96 40.91 -2.48 2.47
a. NCE Reading in 97 by Revised Ethnic Code, Year Round Calendar Cycle, Language, Program,Test language in 97 (SABE if both), ELD Level
Assessing Factors Influencing Student Engagement in the Schools
In previous sections of this report we have looked at student absenteeism as a possible source ofreduced achievement and as a factor that might slow the development of English languagefluency. As noted, absenteeism does play a statistically reliable, if quite modest role inpredicting student language development and achievement. In the final series of tables in thisreport, we turn to examining whether, treating absenteeism as a measure of student engagementin their schooling District programs can be found to play any significant role in raising studentengagement and reducing absenteeism.
CERC @ UCR VI - 35 05/20/9886

1
1
Tables VI.24a and VI.24b present the same type of multi-variate statistical analysis ofabsenteeism as was previously applied to reading and mathematics achievement.
Table VL24a: Analysis of Variance (ANOVA) Assessing the Impact onStudent Absenteeism
(Number of Days Absent - All Students) R = .463; R-Squared = 215Main Effects with Covariates Sum of Squares df Mean Square F Sig. B Beta Adj
(Combined) 888,088.1 25 35,523.5 189.30 0.000Year Round Calendar Cycle 9,524.6 4 2,381.2 12.69 0.000 0.065Program defined language services provided 6,301.2 3 2,100.4 11.19 0.000 0.052Test language in 97 (SABE if both) 4,838.8 1 4,838.8 25.79 0.000 0.045ELD Level in 97 16,070.6 5 3,214.1 17.13 0.000 0.071Revised Ethnic Code 284.1 1 284.1 1.51 0.219 0.032Language: 1=Hisp, 2=PacR 3.0th 618.2 2 309.1 1.65 0.193 0.048
Covariate Student Gender 69.2 1 69.2 0.37 0.544 0.13Whole years not in SAUSD 58,960.0 1 58,960.0 314.19 0.000 0.77Overage for grade (msng: <-1, >6) 130,084.9 1 130,084.9 693.19 0.000 4.61Special Ed - Any Service 155.8 1 155.8 0.83 0.362 0.37Move 1 or more schools 38,385.2 1 38,385.2 204.55 0.000 4.51Overall transiency (extra schls/year) 879.6 1 879.6 4.69 0.030 -0.89Months at Current School 175.0 1 175.0 0.93 0.334 -0.01Poverty Status 46,420.0 1 46,420.0 247.36 0.000 -4.43
Model 888,088.1 25 35,523.5 189.30 0.000Residual 3,251,584.6 17327 187.7Total 4,139,672.7 17352 238.6
a NCE Reading In 97 by RmAsed Ethnic Code, Year Round Calendar Cycle Language 1=Hisp, 2=PacR 3=0th,Program defined language services provided, Test language In 97 (SABE If both), ELD Level
b Covanates entered with main effectsc Due to empty cells or a singular matrix, higher order Interacticos have been suppressed.
As shown in Table VI.24a, absenteeism is significantly influenced by student ELD programenrollments as well as by their English language development levels. Absenteeism is notsignificantly different among different ethnic groups or across different primary languagegroups, however. As with reading and mathematics achievement, absenteeism is also influencedby a number of factors unrelated to language development. As with other issues under study, wefound no differences between the rates of absence for boys and girls.
Notable among the predictor variables whose "B" scores are reported on the above table is thefact that absenteeism goes up quite sharply when students move from school to school (anaverage of about 4.5 days of increased absence for the moving students). Students who areoverage for their grade placement are also likely to be absent for an additional 4.6 days. Povertystudents, by contrast, are less likely to be absent from school. On average they miss 4.4 fewerdays than other students each year.
Table VI.24b presents the magnitude of impact measures for the grouping variables whosestatistical reliability was assessed in the table above.
Traditional calendar students are more likely to miss school than children on any of the four YearRound Education tracks.
CERC @ UCR VI - 36 05/20/988 9
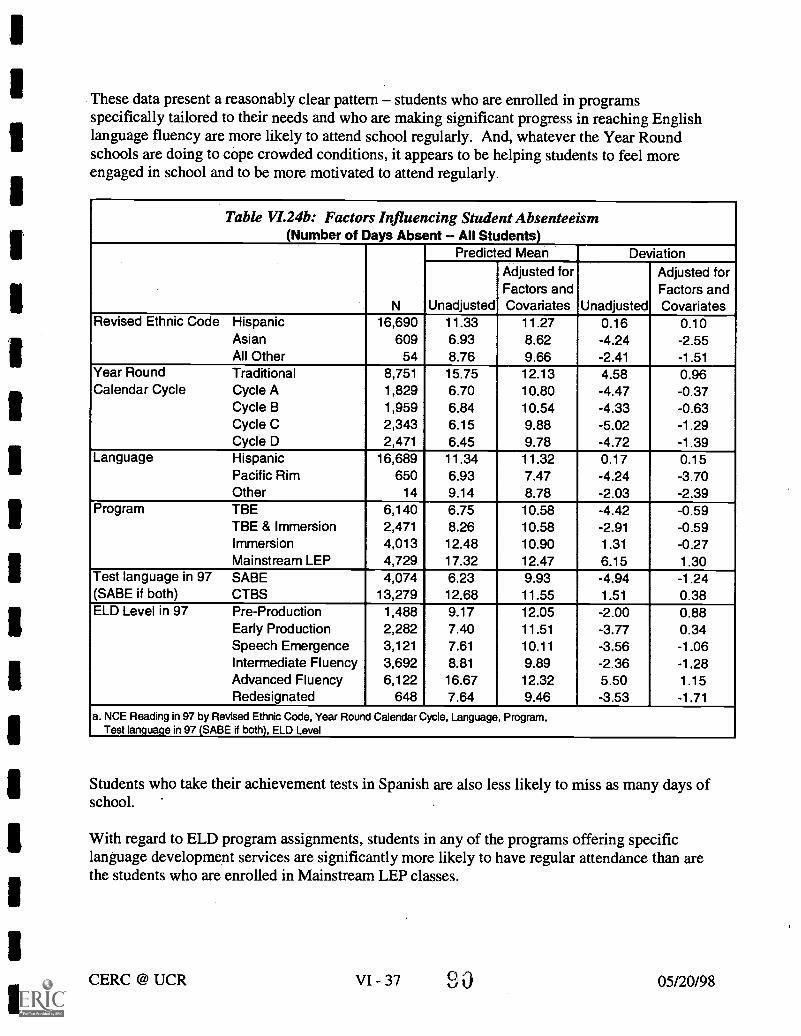
These data present a reasonably clear pattern - students who are enrolled in programsspecifically tailored to their needs and who are making significant progress in reaching Englishlanguage fluency are more likely to attend school regularly. And, whatever the Year Roundschools are doing to cope crowded conditions, it appears to be helping students to feel moreengaged in school and to be more motivated to attend regularly.
Table VI.24b: Factors Influencing Student Absenteeism(Number of Days Absent - All Students)
Predicted Mean DeviationAdjusted for Adjusted forFactors and Factors and
N Unadjusted Covariates Unadjusted CovariatesRevised Ethnic Code Hispanic 16,690 11.33 11.27 0.16 0.10
Asian 609 6.93 8.62 -4.24 -2.55All Other 54 8.76 9.66 -2.41 -1.51
Year Round Traditional 8,751 15.75 12.13 4.58 0.96Calendar Cycle Cycle A 1,829 6.70 10.80 -4.47 -0.37
Cycle B 1,959 6.84 10.54 -4.33 -0.63Cycle C 2,343 6.15 9.88 -5.02 -1.29Cycle D 2,471 6.45 9.78 -4.72 -1.39
Language Hispanic 16,689 11.34 11.32 0.17 0.15Pacific Rim 650 6.93 7.47 -4.24 -3.70Other 14 9.14 8.78 -2.03 -2.39
Program TBE 6,140 6.75 10.58 -4.42 -0.59TBE & Immersion 2,471 8.26 10.58 -2.91 -0.59Immersion 4,013 12.48 10.90 1.31 -0.27Mainstream LEP 4,729 17.32 12.47 6.15 1.30
Test language in 97 SABE 4,074 6.23 9.93 -4.94 -1.24(SABE if both) CTBS 13,279 12.68 11.55 1.51 0.38ELD Level in 97 Pre-Production 1,488 9.17 12.05 -2.00 0.88
Early Production 2,282 7.40 11.51 -3.77 0.34Speech Emergence 3,121 7.61 10.11 -3.56 -1.06Intermediate Fluency 3,692 8.81 9.89 -2.36 -1.28Advanced Fluency 6,122 16.67 12.32 5.50 1.15Redesignated 648 7.64 9.46 -3.53 -1.71
a. NCE Reading in 97 by Revised Ethnic Code, Year Round Calendar Cycle, Language, Program,Test language in 97 (SABE if both), ELD Level
Students who take their achievement tests in Spanish are also less likely to miss as many days ofschool.
With regard to ELD program assignments, students in any of the programs offering specificlanguage development services are significantly more likely to have regular attendance than arethe students who are enrolled in Mainstream LEP classes.
CERC @ UCR VI - 37 S 05/20/98

The relative influence of each of the significant factors is shown in Table VI.24c. Student ELDlevels provide the strongest predictor of their absenteeism rate, but this factor is closely followedby the Year Round cycle they attend and the ELD program in which they are enrolled.
As shown in Table VI.24d, the factors reviewed here explain about 21 percent of all attendancevariance. This leaves a lot of unexplained attendance variation, but represents a good starttoward establishing a link between school program design and student attendance.
CERC @ UCR VI - 3891
05/20/98
VII. Conclusions and Recommendations
The major findings and conclusions documented in previous sections of this report aresummarized in this section. and a series of recommendations offered to assist Santa Ana USD inresponding appropriately to these findings. The findings and conclusions reported here should be
viewed as provisional and tentative awaiting corroboration through systematic observation ofstudents, teachers and school site operations. Moreover, as the findings themselves makeabundantly clear, the three years of data available in the District's LEP database do not cover asufficiently long period of time to be sure that we would not find important new sources ofinsight and policy .quidance from a more extended study. For this reason the CERC staff hascarefully documented data management and analysis procedures used in this study so that they
can be incorporated into an ongoing systematic review of District language developmentprograms.
Findings and Conclusions
Findings and conclusions are summarized under five headings: a) the reliability of the studentinformation management system, b) the nature of language development services provided toSanta Ana USD students, c) the development of English language fluency, d) the links betweenlanguage learning and achievement in reading and mathematics, and e) the influence of language
development on student engagement in school.
A. Conclusions Regarding Information System Reliability
1. Interviews with key District staff confirm that the nature and purposes of the DistrictEnglish Language Development programs are well understood and that the need forcareful data reporting is appreciated.
2. The District uses a variety of methods to insure consistency in data collection andrecording. including training, one-on-one assistance to teachers and distribution ofguidelines defining variables and reporting procedures.
3. The District's annual Program Services survey tends to be seen by teachers primarily as areporting device student program adjustments are made more continuously throughoutthe year and are not always entered immediately into the tracking database.
4. More than 90% of the data records in all files appear to be reliable in the sense that theyreflect use of the data system as designed. Some steps could be taken to improvereliability they are discussed below, in the recommendations sub-section.
CERC @ UCR VII - 1 09/23/97
9 2

5. When teachers report on the English fluency level of students they sometimes reduce theestimated level of fluency after a student has spent some time at a higher stage. It is notpossible to determine whether these reassessments result from difficulties teachers withonly modest training may have in estimating proficiency, misunderstanding of thedefinition of various levels by some teachers or the loss in proficiencies previouslyattained.
6. The administrative program categories reported in the Program Services annual survey do
not accurately reflect the language development services students actually receive. Theseadministrative categories are based on a combination of program design and teachercertification factors that separate some students receiving similar services and combinesome groups receiving rather different services. Thus, students are classified intolanguage development programs on the basis of the services being provided by theirteachers Transitional Bilingual Education for those receiving native languageinstruction and Immersion for those receiving sheltered instruction in English. Thosereceiving neither are classified as "mainstream" students, those experiencing both arelabeled combined TBE & Immersion.
7. Analysis of language level coding and the movement from one language level to anotherindicate that annual reporting of student performance is too irregular. Large numbers ofstudents are all reported as moving from one level to another at the same time, but staffsare well aware that this movement is highly individualized.
8. While not strictly an issue of data system reliability, we note that accurate data on studentprogram assignments, language development and specific services has been accumulatingfor only approximately three years. This means that it is difficult to reach definitiveconclusions regarding processes that may take much longer to complete.
B. Conclusions Regarding Language Development Services for LEP Students
1. 18% of students are Native English speakers and receive no LEP services. 14% of LEPstudents have attained Fluent status. Of the remaining two-thirds, about half (31% of allstudents ) are receiving TBE, 14% Immersion, and 10% combined TBE + Immersion.
2. The TBE program serves the largest number of poverty children, more than 90%,Immersion 80%, and the mainstream curriculum below the District average, between 60and 70%.
3. Native language instruction, a substantial factor in Transitional Bilingual Programs, dropsdramatically during grades 2 and 3. Santa Ana TBE programs are appropriatelycharacterized as "Early Exit TBE Programs" because of the extent to which nativelanguage support stops after grade 3. The end of native language instructional supportcorresponds directly with a sharp drop in reading levels for TBE students.
CERC @ UCR VII - 2 09/23/979 3
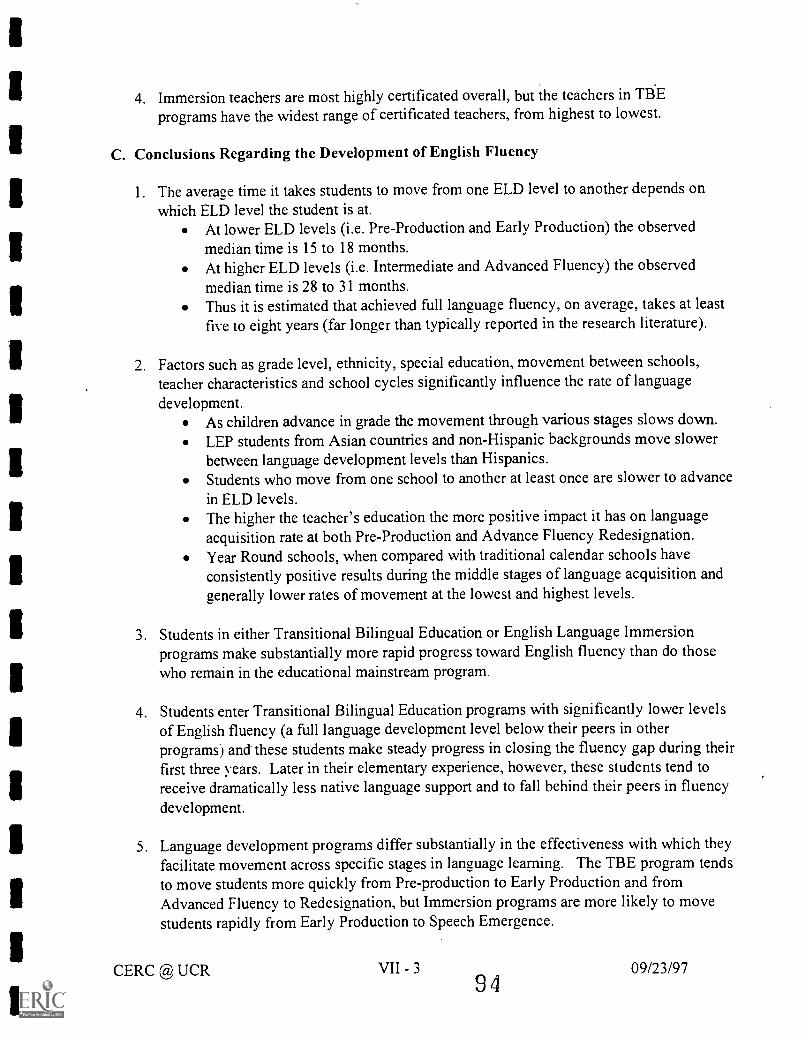
4. Immersion teachers are most highly certificated overall, but the teachers in TBEprograms have the widest range of certificated teachers, from highest to lowest.
C. Conclusions Regarding the Development of English Fluency
1. The average time it takes students to move from one ELD level to another depends onwhich ELD level the student is at.
At lower ELD levels (i.e. Pre-Production and Early Production) the observedmedian time is 15 to 18 months.At higher ELD levels (i.e. Intermediate and Advanced Fluency) the observedmedian time is 28 to 31 months.Thus it is estimated that achieved full language fluency, on average, takes at leastfive to eight years (far longer than typically reported in the research literature).
2. Factors such as grade level, ethnicity, special education, movement between schools,teacher characteristics and school cycles significantly influence the rate of languagedevelopment.
As children advance in grade the movement through various stages slows down.LEP students from Asian countries and non-Hispanic backgrounds move slowerbetween language development levels than Hispanics.Students who move from one school to another at least once are slower to advancein ELD levels.The higher the teacher's education the more positive impact it has on languageacquisition rate at both Pre-Production and Advance Fluency Redesignation.Year Round schools, when compared with traditional calendar schools haveconsistently positive results during the middle stages of language acquisition andgenerally lower rates of movement at the lowest and highest levels.
3. Students in either Transitional Bilingual Education or English Language Immersionprograms make substantially more rapid progress toward English fluency than do thosewho remain in the educational mainstream program.
4. Students enter Transitional Bilingual Education programs with significantly lower levelsof English fluency (a full language development level below their peers in otherprograms) and these students make steady progress in closing the fluency gap during theirfirst three years. Later in their elementary experience, however, these students tend toreceive dramatically less native language support and to fall behind their peers in fluencydevelopment.
5. Language development programs differ substantially in the effectiveness with which theyfacilitate movement across specific stages in language learning. The TBE program tendsto move students more quickly from Pre-production to Early Production and fromAdvanced Fluency to Redesignation, but Immersion programs are more likely to movestudents rapidly from Early Production to Speech Emergence.
CERC @ UCR VII - 3 09/23/979 4

6. The movement of middle school students across the various language development levelsis typically slower than that for elementary students, high school students move at aboutthe same rate as elementary students (this contrasts with current District program designsthat project more rapid language fluency development in the upper grades).
D. Conclusions from an Analysis of Reading and Mathematics Achievement Data
1. There are sianificant differences in the achievement levels of students in the District'sfour language development programs.
la. However, the achievement differences appear to be primarily due to intake, rather than
program effectiveness differences, program differences are substantially reduced whendemographic and school experience factors are entered into the analysis.
2. Children move from Spanish to English achievement testing at all grade levels 50% ofthose moving do so by the 6" grade.
3. Factors such as movement between schools, test language, student's English Languagedevelopment levels, primary Language development levels, and ELD programs areimportant predictors in reading attainment.
Students who change schools at least once in 5 years score below their non-transientpeers on the reading test.Students taking their Reading tests in Spanish score, on average, 30 NCE pointshigher than students taking their tests in English. This is the equivalent of about 2grade levels.Students do better on reading tests with each new level of English language fluency.Students with higher PLD levels score higher on the Reading test.LEP students in mainstream programs score higher on Reading tests than students inother bilingual programs. However, this is mostly due to student characteristics andnot procgam differences.
4. Students' ethnicity, test language, ELD program type, school cycle, ELD level, PLD leveland movement between schools have significant impact on the rate of Math attainment.
Students taking their Math test in Spanish score, on average, 16 NCE points higherthan students taking their test in English.TBE students have the highest math scores of any program group.The students attending traditional calendar year schools tend to have higher in Mathachievement.The hicther the students' ELD and PLD levels the higher they score on Mathachievement test.Students who change schools at least once in five years score below their non-transient peers.LEP students from Asian countries score higher on the Math test than Hispanics.
CERC @ UCR VII - 4 09/23/979 5

5. As is typically the case, prior attainment is a powerful predictor of subsequent test scores
for all students.
E. Conclusions from an Analysis of School Attendance Data
1. Students ELD program enrollment, ELD levels, transiency rate, overage, test language,
school cycle and poverty status significantly influence absenteeism.
2. The more srudents move between schools the more they are absent.
3. Students who are overage for their grade level are more likely to be absent from school.
4. Students in any of the programs offering specific language development services are
more likely to have regular attendance than students in mainstream LEP.
5. Traditional calendar students are more likely to miss school than students of any of the
four Year Round Tracks.
6. Students who take their test in Spanish miss fewer days of school than students takingtheir test in English.
7. Poverty students are less likely to be absent from school than students who do not receivefree/reduced lunch services.
Recommendations for Action
Reviewing the overall findings from this evaluation study in the light of extended discussionswith Santa Ana USD Evaluation Design Team members and the theoretical and empiricalinsights gleaned from a thorough review of the language development research literature, weoffer 14 recommendations to the School Board and professional staff of the District.
1. Recommendations for Improving Language Development Prgram Effectiveness:
1.1 Take steps to reaffirm District commitment to the two fundamental goals of educationfor all children: high levels of fluency in English and the highest possible academicachievement. And declare a willingness to utilize whatever program models andinstructional strategies most effectively lead to the realization of these goals.
This may seem like a matter which will be taken for granted and not in need of any action byDistrict officials. In our judgment this is not the case, however. The use of native languageinstruction has become so politically sensitive in recent years that many families and manyteachers are fearful that decisions are being made on the basis of prejudic a or politicalinfluence rather than an acceptance of the best available evidence regarding program
CERC @ UCR VII - 5 09/23/97
98

effectiveness and student learning outcomes. Reaffirming the willingness of the SchoolBoard and the professional staff to follow objective evidence will help maintain confidencein whatever program or policy changes are adopted.
1.2 Acknowledge the complexity of the language acquisition process, the diversity ofstudent needs and the great variety of ways in which students learn and teachers teach.At the same time, reaffirm District respect for the acquisition of fluency in alllanguages and treat student fluency in a non-English language as a valued asset toboth their own education and to the larger community.
Here again, many will think this to be a matter understood by everyone and not in need ofexplicit attention by District leaders. Our observations and our reading of the languagedevelopment literature strongly indicate, however, that many groups and individuals areseeking to create or impose a single mode of learning on all students and a single approach toteaching on all teachers. While the one best way of achieving English fluency combined withoptimal academic achievement may one day be discovered, the evidence in this study pointsto the appropriateness of tailoring educational programs to diverse student needs and learning
styles.
Feeling a pressure to integrate new immigrants into the culture and the economy of SouthernCalifornia, it is easy for some observers to view fluency in a language other than English asan impediment rather than an asset to learning and citizenship. In fact, however, increasingfluency in a non-English language contributes much to the ability to succeed, both in learningEnglish and in academic achievement. Additionally, the next generation of Americans willneed to be fluent in a broad array of non-English languages in order to compete successfullyin a global economy. School leaders can do much to help students, their families and thelarger community recognize the value of fluency in any language, and see this as a gatewayto English fluency rather than a barrier.
1.3 Given the extended period of time required to reach fluency in English documented inthis evaluation study and supported by other recent studies of language acquisition,the District should carefully review the scope and sequence of the curriculum in eachof its language development programs to make sure that students who will take five toseven years (or even longer) to reach full fluency have an opportunity to be exposedto materials that are challenging and interesting without overwhelming their existinglangune skills.
As discussed at length in the body of this report, thefailure to use statistical SurvivalAnalysis to model language learning has led to a very unfortunate belief that full languagefluency can be achieved by students much more rapidly than is actually the case. There is noevidence to support an argument that the time to reach full fluency in Santa Ana is beingsignificantly retarded by weak instructional programs. While there is always room forprogram improvement, program analysts and evaluators have persistently and dramaticallyunderestimated the time it takes to achieve language fluency through the use of faultystatistical models. We do not really expect English speaking students to become fluent in
CERC @ UCR VII - 6
9 7
09/23/97

some other language as a result of a two-year course of study in a secondary school, and thereis not much reason to expect non-native English students in Santa Ana to move more rapidlyinto English fluency. Native English speakers, even the most able and most highlymotivated, expect to take more than three years to be able to utilize another language formore than rudimentary social discourse. The situation is made all the more serious for nativeSpanish speakers in Santa Ana because of the extent to which daily social and businesstransactions can be conducted entirely in that language.
1.4 So long as the District seeks to utilize Transitional Bilingual Education techniques tosupport academic attainment for English language learners while they make thetransition to English fluency, it is important to consider extending the transitionperiod for two or more additional years to allow time for better development ofEnglish fluency.
Native language instruction in various academic subjects is discontinued in the second orthird grade for most Transitional Bilingual Education students. This discontinuance ofservices, and the accompanying shift from Spanish to English language testing ofstudentachievement results in about a two year loss in measured achievement for students. Thisdramatic loss in measured achievement for students is probably quite demoralizing, andunfairly represents their actual academic abilities. Above all, the loss in measuredachievement indicates that students in these grades have still not acquired mastery ofacademic English language concepts and constructs sufficiently to make sure and steadylearning progress in the educational mainstream.
1.5 Since children who enter Santa Ana schools sometime after their kindergarten yearand those who move from one school to another, tend to be assigned to mainstream ormixed TBE and Immersion programs it would be appropriate for the District toreview assignment processes and see if everything possible is being done to providethese children with the most appropriate possible educational programs.
The placement of children who start their schooling in Santa Ana is clearly being closelyattended by families and the school staff. These children are being placed in programs thatfit their special needs to such an extent that the various Santa Ana programs serve verydifferent student population groups. Moreover, fitting newcomers into ongoing programs is aconstant challenge to the professional staff. Nevertheless, the statistical frequency withwhich latecomers and highly transient students are doing less well than those who enter earlyand stay in one place leads us to urge special care in the placement of these children.
1.6 Since teacher characteristics, including age, education and experience play asignificant role in predicting program impacts on students, the District shouldcontinue to attend closely to the placement of teachers in work assignments wherethey are most likely to be most helpful in facilitating both language fluency andacademic attainment.
CERC @ UCR VII - 7
9809/23/97

No doubt, teacher effectiveness depends more on intrinsic motivation, supportive -workingconditions, adequate supervision and access to needed materials than on their demographiccharacteristics or prior training. Nevertheless, the strength of association between teachercharacteristics and program impacts suggests that assignment is an important part of anoverall strategy for improving school programs.
1.7 Since all of the language development programs utilized in Santa Ana outperform theeducational mainstream in facilitating both language fluency and studentachievement, it is important for the District to resist pressures to prematurelydiscontinue programs and rely on mainstream educational services to meet studentneeds.
Again, there is certainly room for program improvement. And there is little doubt that some
programs could be discontinued without undermining educational quality. But the evidenceexamined in this evaluation study clearly point to the superiority of planned languagedevelopment programs over the educational mainstream.
1.8 While it is essential that students be assessed in English to determine their fluencyand academic proficiency in English, the District should resist pressures to abandontesting student achievement in their native language.
Everyone should recognize that, in the long run, children need to learn how to performacademic tasks in English and to score well on English language achievement tests. Becausefull English fluency takes much longer than previously thought, and because students appearmuch less academically competent when tested in English before they have reached fullfluency, it will be very difficult for the District to monitor program effects and makeadjustments' in academic and language development instructional programs if achievementdata in students' native languages is not available.
2. Recommendations for Improving Data Systems Operations:
2.1 Combine the Program Services survey with the preparation of student report cardsand add elementary grade report card data to the District's electronic database. Thisshift in data collection would necessitate the development of a system of electronicreport card preparation, which we further recommend.
There are four reasons for making this recommendation. First, by collecting studentlanguage development data every trimester it will be possible to get a much more preciseestimate of how long it takes to move from one language development level to another. Thecurrent method of collecting the data through an annual survey creates a situation in whichstudents may have advanced in English fluency several months before their movement isrecorded and made available for analysis. Second, since teachers and other school site staffmembers generally consider program adjustments for children in relation to the end of atrimester grading period, the collection of data would be made at a time when programassignments are under active consideration and, therefore, teacher judgments freshly
CERC @ UCR VII - 8 09/23/97
9 9

considered. Third, this would relieve teachers of the burden of having to go through each
student's record to prepare a report they would be able to combine reporting with reportcard preparation. Finally, if this shift is accomplished in conjunction with the adoption of asystem of electronic report card preparation, an important variable now missing in ourevaluation study (teacher judgment regarding students' academic achievements) could be
included in furure program evaluations.
2.7 Harmonize secondary school course information with the collection of data regardingthe specific programs and services provided in elementary school programs.
The present data collection system ends the collection of information about the specificlanguage development techniques and services being provided with fifth grade. This makesit impossible to monitor the effectiveness of program support services into the secondaryschool years. where language development remains a complex and challenging educationaltask. If electronic report card preparation, already being utilized in the District's middle andhigh schools. could contain standard indicators of the language development techniques in
use effective evaluation of program design options would be possible at this level.
2.3 On an annual basis, survey teachers, not about the services provided to each student,but about their current level of training in language development instruction and
about their instructional practices.
A very brief survey of teacher practices would go far in permitting the District to make much
more precise judgments about the effectiveness of various language development options.The current system of reporting on whether individual students receive native language,sheltered English or mainstream instruction in various subject areas is quite helpful, to be
sure. In accordance with recommendation #3, however, this information would be bettergenerated through a system that captures report card data. Attending exclusively to studentservices does not give a clear picture of program design and implementation. It would behelpful to know what kinds of language sheltering techniques teachers find useful, whethercurriculum materials are seen as adequate to instructional needs and whether they believeImmersion or Transitional Bilingual techniques are more successful in reaching the children
for whom they are responsible.
2.4 Maintain reliable records regarding student assignment to various administrativeprogram structures but, when collecting records on language development programservices, use teacher reporting categories that distinguish clearly among services,leavin2 the collection of information about teacher training and instructional practicesto a separate data collection process.
The present District survey of Program Services classifies students into programs that aredeveloped to meet a variety of regulations and funding requirements. Though cruciallyimportant to District administration and fiscal planning, these categories do not provide asufficiently precise record of actual instructional services to provide a proper foundation forprogram evaluation. By tracking teacher training and credentialling separately from the
CERC @ UCR VII - 9
10009/23/97

record of student program assignments, both administrative and program evaluation needscould be met.
2.5 Monitor more precisely the characteristics of students assigned to variousinstructional services. Continue to analyze the ways in which family choice andprofessional judgment affect how students with different characteristics andeducational needs are placed in different instructional programs.
Given the ethical and professional responsibility of the District to provide the mostappropriate educational setting for each student, it is not possible to approach the evaluationof language development programs by looking exclusively at the outcomes attained. Wemust look at the characteristics of the students enrolled in each program and then determinewhich programs work best for various student groups. While a substantial group of highlypredictive indicators are already being collected on all students in the District, a systematicsearch is needed to identify the student characteristics that are most strongly linked toprogram effects. Student and family interests and preferences should be considered, alongwith better indicators of previous educational experiences and teacher judgments aboutstudent learning styles and temperaments.
3. Recommendations for Further Study
3.1 It is important for the District to continue in its study of the impact of various Englishlanguage development programs and services. The evaluation findings presented inthis report are based on a data tracking system that has yet to collect data on an entirecohort of students passing through District schools, and no direct observations ofstudents, teachers and school operations were made.
Santa Ana has an important role to play in the development of reliable knowledge aboutEnglish language acquisition and the programs supporting academic attainment by LimitedEnglish Proficient students. Bilingual education programs have become the focus of intensepolitical debate, and it is vitally important that this debate be conducted with reliableinformation. Unfortunately, the literature on bilingual education is characterized by hastygeneralizations and inappropriate data analysis teclmiques. Santa Ana USD has constructed atruly outstanding language development data system and can play an important role inproviding trustworthy data and careful analysis of the needs of English language learners.An ongoing program of research and evaluation would provide an invaluable service to theDistrict, the State and the Nation. It could lead to informed policymaking, programdevelopment and family selection of educational opportunities for their children.
CERC @ UCR VII -10
10109/23/97

1
I.
References
Baeten-Beardsmore, H. & Lebrun, N. (1991). Trilingual education in the Grand Duchy ofLuxembourg. In 0. Garcia (Ed.), Bilingual education: Focusschrift in honor of Joshua AFishman (pp. 107-122). Philadelphia: John Benjamins Publishing Company.
Bratt-Paulston, C. (Ed.). (1988). International handbook of bilingualism and bilingual education.New York: Greenwood Press.
Brown, R. (1973). Development of the first language in the human species. AmericanPsychologist, 28, 97-106.
Collier, V. P. (1989). How long? A synthesis of research on academic achievement in a secondlanguage. TESOL Quarterly, 23(3), 509-531.
Cummins, J. (1978). Metalinguistic development of children in bilingual education programs:Data from Irish and Canadian Ukrainian-English Programs. In M, Paradis (Ed.), TheFourth Lucas Forum 1977 (pp. 127-138). Columbia, SC: Hornbeam Press.
Cummins, J. (1979). Linguistic interdependence and the educational development of bilingualchildren. Review of Educational Research, 19, 222-251.
Cummins, J. (1980). The entry and exit fallacy in bilingual education. NABE Journal, 4(3), 25-60.
Cummins, J. (1981a). Age on arrival and immigrant second language learning in Canada: Areassessment. Applied Linguistics, 2, 132-149.
Cummins, J. (1981b). The role of primary language development in promoting educationalsuccess for language minority students. In California Department of Education (Ed.),Schooling and language minority students: A theoretical framework (pp. 3-49). LosAngeles, CA: Evaluation, Dissemination, and Assessment Center, California StateUniversity, Los Angeles..
. .
Cummins, ..J.-(1994). Primary language instruction and the education of language minoritystudents. In C. Leyba (Ed.), Schooling and language minority students: A theoreticalframework (pp. 3-46). (2nd. Ed.). Los Angeles, CA: Evaluation, Dissemination, andAssessment Center, California State University, Los Angeles.
Dulay, H. & Burt, M. K. (1974). Natural sequences in child second language acquisition.Language Learning, 24, 37-53.
Edelsky, C., Hudelson, S., Flores, B., Barkin, F., Altwerger, B., & Filbert, K. (1983).Semilingualism and language deficit. Applied Linguistics, 4, 1-22.
ernhardt, E. B. & Kamil, M. L. (1995). Interpreting relationships between LI and L2 reading:Consolidating the Linguistic threshold and the linguistic interdependence hypotheses.Applied Linguistics, 16(1), 15-34.
Fernandez, R. M. & Nielsen, F. (1986). Bilingualism and Hispanic scholastic achievement:Some baseline results. Social Science Research, 15, 43-70.
Gandara, P. (1997). Review of the research on instruction of limited English proficient students.The University of California, Davis.
Garcia, H. D. C. (1981). Bilingualism, confidence and college achievement. Center for theSocial Organization of Schools: Johns Hopkins University.
Grosjean, F. (1982). Life with two languages: An introduction to bilingualism. Cambridge,MA. Harvard University Press.
102

Hakuta, K. (1986). The mirror of language: The debate on bilingualism. New York: BasicBooks.
Hornberger. N. H. (1991). Extending enrichment bilingual education: Revisiting typologies andredirecting policy. In 0. Garcia (Ed.), Bilingual education: Focusschrift in honor ofJoshua A. Fishman (pp. 215-234). Philadelphia: John Benjamins Publishing Company.
Kolers, P. (1978). On the representations of experience. In D. Gerver & H. Sinaiko (Eds.),Language interpretations and communication. New York: Plenum Press.
Lessow-Hurley, J. (1996). The foundations of dual language instruction. (2nd edition). WhitePlains, NY: Longman.
Mackey, W. F. (1972). A typology of bilingual education. In J. A. Fishman (Ed.), Advances inthe sociology of languages (pp. 413-432). The Hague: Mouton.
Mannheim, B. (1984). Una nacion acorrolada: Southern Peruvian Quechua language planningand politics in historical perspective. Language in Society, 13, 291-309.
Paivio, A. & Desrochers, A. (1980). A dual-coding approach to bilingual memory. CanadianJournal of Psychology, 34, 388-99.
Paradis, M. (1980). Language and thought in bilinguals. In W. McCormack & H. J. Izzo(Eds.), The sixth LACUS forum. Columbia, SC: Hornbeam Press.
Pease-Alvarez, L., & Winsler, A. (1994). Cuando el maestro no habla espaftol: Children'sbilingual language practices in the classroom. TESOL Quarterly, 28(3), 507-535.
Rarnirez, D., Yuen, S. D., & Ramsey, D. R. (1991). Final Report: Longitudinal study of Englishimmersion strategy, early-exit and late-exit transitional bilingual education programs forlanguage-minority children. (Department of Education Contract No. 300-87-0156). SanMateo, CA: Aguirre International.
Richard-Amato, P. (1996). Making it happen: Interaction in the second language classroom.(2nd edition). New York: Longman.
Ruiz, R. (1984). Orientations in language planning. NABE Journal:8, 15-34.Selinker, L., Swain, M., & Dumas, G. (1975). The interlanguage hypothesis extended to
children. Language Learning, 25, 139-52.Shin, F. H., & Krashen, S. D. (1996). Teacher attitudes toward the principles of bilingual
education and toward students' participation in bilingual programs: Same or different?Bilingual Research Journal, 20(1), 45-54.
Skutnabb-Kangas, T. & Toukomaa, P. (1976). Teaching migrant children's mother tongue andlearning the language of the host country. Helsinki: The Finnish National Commission forUNESCO.
Thomas, W., & Collier, V. P. (1997). School effectiveness for language minority students.George Washington University: National Clearinghouse for Bilingual Education.
Troike, R. (1978). Research evidence for the effectiveness of bilingual education. NABEJournal 3(1), 13-24.
Trueba, H. T. (1979). Bilingual education models: Types and designs. In H. T. Trueba & C.Barnett-Mizrahi (Eds.), Bilingual multicultural education and the professional from theoryto practice (pp. 54-73). Rowley, MA: Newbury House.

APPENDIX A
Data Command Files: Data Set Defmition,Variable Recoding and Computation
1

Comments.Attendance File DefinitionSET
BLANKS=SYSMIS BLANKS=SYSMISUNDEFINED=WARN.
DATA LISTFILE='c:\Share\SAIJSD data\SAUSD Eng raw data\UCOOAT.dae FIXED RECORDS=1 TABLE /1
stndid 1-6 abscdte 7-12 allday 13-13(A) period() I4-14(A) periodl 15-15(A) period2 16-16(A) period3 17-17(A)period4 18-18(A) period5 I9-19(A) period6 20-20(A) period7 21-21(A) period822-22(A) period9 23-23(A)
EXECUTE.Value labels allday period() periodl period2 period3 period4period5 period6 period7 period8 period9 'A' 'Unexcused Absence'
'B"School Business''C"Contract''D' 'Funeral''E"Excused Personal''F 'Field Trip''H' 'Homebound'T 'Illness''T 'Jury Duty''K' 'Tardy UnExcused''L' 'Tardy''M' 'Medical Appointment''N' 'No show''Q"Quarantine''R' 'Remove Code''S"Suspension'7 'Truant''LT 'Unaccounted''VP 'Withold ADA''X' 'Excused Absence''1JV 'Elm and MS Unverified Abscence'TR' 'Elem and MS Truant''TA' 'Elem and MS Tardy''0"Othert
'MS unexcusar'V' 'Activity'.
******************Comments: Recoding Abscenses for elementary and Middle*****************DO IF (schltypF 1) .
RECODEallday period0 periodl period2 period3 period4 period5 period6 period7period8 period9 CA'=1TV) CH'="TR) (7=PIA) .
END W .
EXECUTE .
DO IF (schInme=78) .
RECODEallday period() periodl period2 period3 period4 period5 period6 period7period8 period9 CA'='UV') CO'='0') ('R'=11V) (T=TA') ('U'='UN')('V'='V') .
END IF .EXECUTE .
A-1

DO IF (schInme=80) .RECODE
allday period() period I period2 period3 period4 period5 period6 period7period8 period9 ('A'='UNP) ('O'=.0') ('W=TR) (T=TA') ('U'='UN')('V'='V')
END IF .
EXECUTE .
DO IF (schInme=83) .
RECODEallday period0 period I period2 period3 period4 period5 period6 period7period8 period9 ('A'='UV') ('O'='0') ('W=TR') (T'='TA') ('U'='UN')('V'='V') .
END IF .
EXECUTE .
DO IF (schlnrne=87) .RECODE
allday period() periodl period2 period3 period4 period5 period6 period7period8 period9 CA'='UNr) ('O'='0') ('R'=TR') (TI=TA) ('U'='UN')('v=v)
END IF .EXECUTE .
****************Comments: Computing number of absences, unexcused and tardiness ************COUNTaldyabs = allday ('B') allday CC') allday allday (E)allday CF1 allday allday (r) allday CJ1 allday CM,allday CA') allday CQ') allday CS') allday (r)aliday allday CW1 allday CX) ailday ('UV) allday ('m)allday allday ('UN') allday CV') .
VARIABLE LABELS aldyabs 'All day abscences' .
EXECUTE .
COUNTPrdabs = period() periodl period2 period3 period4 period5 period6 period7period8 ('B) period0 periodl period2 period3 period4 period5 period6period7 period8 ('C') period() periodl period2 period3 period4 period5period6 period*/ period8 (D') period() periodl period2 period3 period4period5 period6 period7 period8 CE') period() periodl period2 period3period4 period5 period6 period7 period8 ('F') period0 periodl period2period3 period4 period5 period6 period7 period8 ('H) period0 periodlperiod2 period3 period4 period5 period6 period7 period8 ('r) period0period( period2 period3 period4 period5 period6 period7 period8 ('J')period() periodl period2 period3 period4 period5 period6 period7 period8('M') period() periodl period2 period3 period4 period5 period6 period7period8 ('A') period() periodl period2 period3 period4 period5 period6period7 period8 ('M) period0 periodl period2 period3 period4 period5period6 period7 period8 CQ') period0 periodl period2 period3 period4period5 period6 period7 period8 CS') period() periodl period2 period3period4 period5 period6 period7 period8 cr ) period() periodl period2period3 period4 period5 period6 period7 period8 ('U') period() periodlperiod2 period3 period4 period5 period6 period7 period8 ('W') period()period( period2 period3 period4 period5 period6 period7 period8 ('X')period() period( period2 period3 period4 period5 period6 period7 period8('UV') period0 period I period2 period3 period4 period5 period6 period7period8 (TR') period() period( period2 period3 period4 period5 period6
A-2
10G

penod7 period8 ('O') period() periodl period2 period3 period4 period5penod6 period7 period8 ('UN') period() periodl period2 period3 period4period5 periocl6 period7 period8 ('V') .
VARIABLE LABELS Prdabs 'Period abscences'EXECUTE .
COUNTaldyunex allday ('A') allday CS') allday (7)allday ('U') allday ('UV) allday (TR') allday CUN') .
VARIABLE LABELS aldyunex 'all day unaccounted abscences' .
EXECUTE .
COUNTaldytard = allday ('K') allday (12) allday (TA') .
VARIABLE LABELS aldytard 'All day tardy' .EXECUTE .
*********Comments: Recoding all day abscences for middle and secondary into periods************DO IF (schltyp gt 1) .
RECODEaldyabs(1=7) INTO Nwaldabs .
END IF .
EXECUTE .
DO IF (schltyp gt 1) .
RECODEaldrinex(1=7) INTO Nwaldunx .
END IF .
EXECUTE .
COMPUTE MsHsPabs = SUM(nwaldabs,prdabs) .EXECUTE .
COMPUTE MsHsPunx = SUM(nwaldunx.prdunex) .
E.XECUTE .
DO rF (schltyp=1) .
RECODEaldyabs(1=1) INTO Elemabs .
END IF .
VARIABLE LABELS Elemabs 'Number of abscensec for elementary students'.EXECUTE .
DO EF (schltyp=1) .
RECODEaldyunex( 1= 1) INTO Elemunx .
END IF.VARIABLE LABELS Elemunx 'Unaccounted Abscences for elementary students'.EXECUTE .
DO EF (schltyp=1) .
RECODEaldytard(1=1) INTO elemtrdy..
END IF .
EXECUTE .
107A-3

DO IF (schltyp gt 1) .
RECODEaldytard(1=1) INTO MsHstrd .
END IF .
VARIABLE LABELS MsElstrd 'Number of tardinesses for Ms and Hs'.EXECUTE .
RECODEmshspabs(0=SYSMIS) (1 thru 8=1) INTO mshsdabs .
VARIABLE LABELS mshsdabs 'Number of days middle and High school absent'.EXECUTE .
RECODEmshspunx(12=SYSMIS) (1 thru 8=1) INTO mshsdunx .
VARIABLE LABELS mshsdunx 'Number of days of unaccounted abscences for Middle'+' School and High School students'.
EXECUTE .
RECODEprdtard(l:SYSMIS) (1 thni 6=1) INTO MsHsdtrd .
EXECUTE .
AGGREGATE/OUTFILE='cAShareattnAGGR2.SAV'/BREAK=stndid/elemab_1 = SUM(elemabs) Ielezntr 1 = SUM(elemtrdy) /elemun_l =SUM(elemunx) Imshspa 1 = SUM(mshspabs) Imshspu 1 = SUM(mshspunx) finshsda_1= SUM(mshsdabs) /mshsdu_1 = SUM(mshsdunx) /msb.sdt 1 = SUM(mshsdtxd)
Iprdtar_1 = SUM(prdtard).
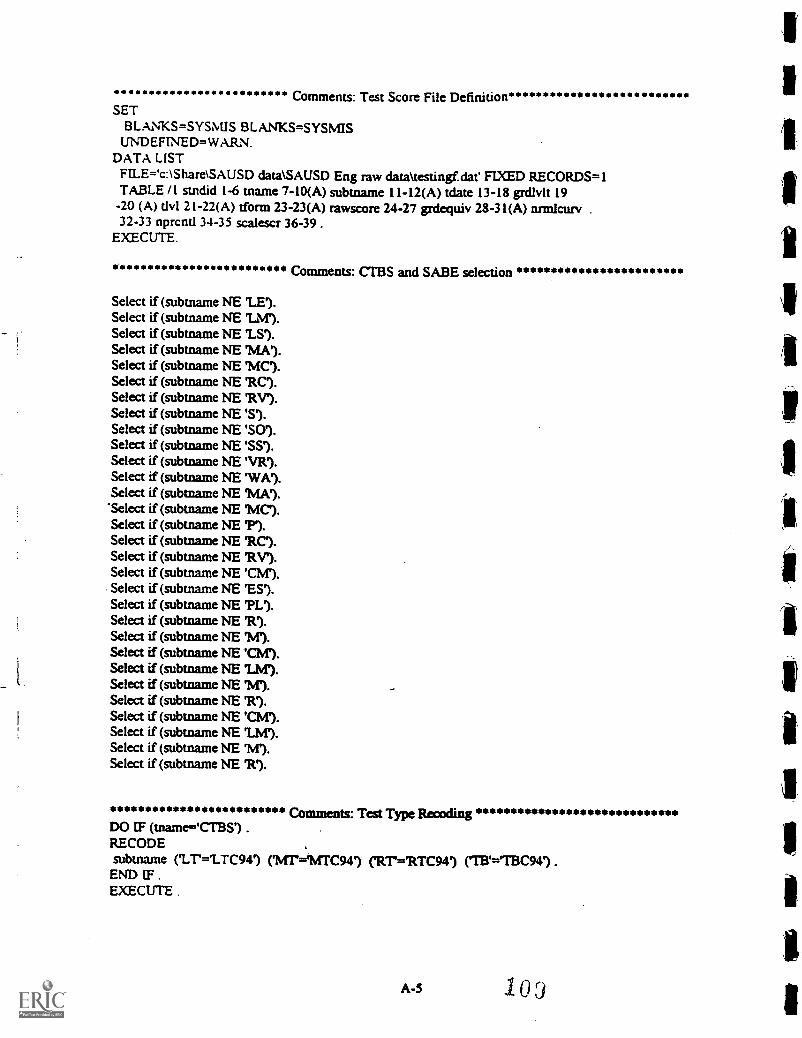
Comments: Test Score File DefinitionSET
BLANKS=SYSMIS BLANKS=SYSMISUNDEFINED=WARN.
DATA LISTFILE='c:\Share\SAUSD data\SAIJSD Eng raw data\ testingfdat' FIXED RECORDS=1TABLE /1 stndid 1-6 tname 7-10(A) subtname 11-12(A) tdate 13-18 grdlvlt 19-20 (A) tivl 21-22(A) tform 23-23(A) rawscore 24-27 grdequiv 28-31(A) nrmlcurv .
32-33 nprcntl 34-35 scalescr 36-39 .
EXECUTE.
***** *** ***** *** ***** **L-omments: CTBS and SABE selection ****************** ***** *
Select if (subtname NE 'LE).Select if (subtname NE 'LM).Select if (subtname NE 'LS).Select if (subtname NE 'MA').Select if (subtname NE 'MC).Select if (subtname NE RC).Select if (subtname NE RV).Select if (subtname NE 'S').Select if (subtname NE 'S0').Select if (subtname NE 'SS').Select if (subtname NE 'VR').Select if (subtname NE WA).Select if (subtname NE 'MA').
Select if (subtname NE 'MC).Select if (subtname NE 7).Select if (subtaame NE RC).Select if (subtname NE 'RV').Select if (subtname NE 'CM').Select if (subtname NE 'ES').Select if (subtname NE 'PL).Select if (subtname NE 'R').Select if (subtname NE 'M').Select if (subtname NE 'CM).Select if (subtname NE 'LM').Select if (subtname NE 'My).Select if (subtname NE 'R').Select if (subtname NE 'CM').Select if (subtname NE 'LM').Select if (subtname NE 'M').Select if (subtname NE R').
***********************. comments: Test Type Recoding *4141*********************DO IF (tname='CTBS') .
RECODEsubtname CLT=ITC941 CMI'='MTC941 CRT%---RTC94) CTB'="IBC941 .
END IF .
EXECUTE .
A-5 1Qj

DO IF (tname='SABE')RECODE
subtnazne ('LT=ITS94') ('MT='MTS94') ('RT=RTS94') (TEV=TBS94') .
END IFEXECUTE .
RECODEsubtname (ITC94'=ITC9402') (M1'C94'='MTC9402') ('RTC94'=IITC9402')CTBC94'=TBC9402') ('LTS94'='LTS9402') CMTS94'=IMTS9402')(RTS94.--RTS9402') (TBS94'=TBS9402') .
EXECUTE .
RECODEsubtname (ITC94'='LTC9403') (MTC94'='MTC9403') ('RTC94'=IRTC9403)(TBC94'---113C9403') ('LTS94'=ITS9403') ('MTS94'=IMTS94031)(RTS94'='RTS9403') (TBS94'="IBS9403') .
EXECUTE .
RECODEsubtname (1-TC94'='LTC9410') ('MTC94'='MTC9410') (RTC94'=1RTC94101)('IBC94'='TBC9410') ('LTS94'='LTS9410') (MTS94'=14.4TS94101)('RTS94'=RTS9410) (TBS94'='TBS9410') .
EXECUTE .
RECODEsubtname (ITC94'='LTC9412) (MTC94'='MTC9412) (RTC94'=12TC9412)(TBC94'="113C9412') ('LTS94'='LTS9412') ('MTS94'='MTS9412')CRTS94'='RTS9412') (TBS94'='T8S9412) .
EXECUTE .
DO IF (tname='C1BS') .
RECODEsubtname (7..T=1LTC95') (MT=1MTC95) (RT=RTC95') (1B`=TBC95) .
END IF .
EXECUTE .
DO IF (tname='SABE) .
RECODEsubtname (IT'='LTS95') CMT1='MTS95) (RT'='RTS95') (TB1='TBS95).
END IF .
EXECUTE .
RECODEsubtname (ITC95'=ITC9502) (MTC95'='MTC9502) (RTC95'=1RTC95021)('IBC95.=TBC95021) ('LTS951='LTS9502') ('MTS951='MTS9502')(RTS95'='RTS9502) (TBS95'=IBS9502") .
EXECUTE .
RECODEsubtname ('LTC95'=ITC9504) ('MTC95'=1/ITC9504) ('RTC95'=1RTC9504)("TBC95'="THC9504) (LTS95'='LTS9504) (MTS95'='MTS9504)('RTS95'=7.TS9504') CTBS95'='T8S9504') .
EXECUTE .
RECODEsubtname (ITC95'='LTC9511') ('MTC95'='MTC9511.1) CRTC95'="RTC9511)('IBC95'='TBC9511') ('LTS95'='LTS9511') (MTS95'='MTS95111)(RTS95'=RTS95 1 I') ('TBS95'='TBS9511') .
EXECUTE .

RECODEsubtname ('LTC95'='LTC9512') CMTC95'='MTC9512') ('RTC95'='RTC9512')(TBC95'=TBC9512') ('LTS95'='LTS9512') ('MTS95'='MTS9512')('RTS95'=RTS9512') (TBS95'='TBS9512')
EXECUTEDO IF (tnante='CTBS') .
RECODEsubtname ('LT=ITC96') ('MT&MTC96') ('RT'='RTC96') ('TI3'=113C96') .
END EF .
EXECUTE .
DO IF (tname='SABED .
RECODEsubtnarne (IT='LTS96') (114T1='MTS96') CRT=RTS96) (78'='TBS96').
END 1F .
EXECUTE .
RECODEsubtname (1-TC96'=1.TC9602) (MTC96'=MTC96021) (RTC96'='RTC9602')(TBC96=TBC9602) (LTS96'=ITS9602) (MTS96'='MTS9602')(RTS96'='RTS9602) (TBS96'='TBS9602') .
EXECUTE.RECODE
subtname ('LTC96'='LTC9604) CMTC96'=MTC9604) (RTC96wRTC9604')(T8C96'="TBC9604) ('LTS96'=1..TS96041) ('MTS96'='MTS9604')(RTS96'='RTS9604) (TBS96'=TBS9604) .
EXECUTE .
************************* comments: Transposing Data **********************************
File Type GroupedFile='C:\Share\SAUSD data\english only data\englscalescore960424.dat'Record=#rec 7-13(A) case=stndid 1-6Wild=nowarnMissing=nowarn.Record Typel.TC9604Data List /LTC9604 17-18.Record Type 'MTC9604'.Data List /MTC9604 17-18.Record Type RTC9604'.Data List 1RTC9604 17-18.Record Type TBC9604Data List aBC9604 17-18.Record Type 'LTS9604'.Data List /LTS9604 17-18.Record Type 'MTS9604'.Data List /M1S9604 17-18.Record Type 'RTS9604Data List /RTS9604 17-18.Record Type TBS9604'.Data List /TBS9604 17-18.Record type other skip.End File Type.Execute.
illA-7

Comments: Demographic File Definition****** *********** ***SET
BLANKS=SYSMIS BLANKS=SYSMISUNDEFINED=WARN.
DATA LISTFILE='c: \Share\SAUSD data\LEP and FEP datalstudent.file; l'FIXED RECORDS=1 TABLE /1stid 1-6 addressl 7-31(A) address2 32-41(A) city 42-59(A) state 60-61(A)zip 62-70 bdate 71-76 bcity 77-94(A) bstate 95-97(A) sex 98-98(A) ethnic 99-99 school 100-101(A) language 102-103 grade 104-105 teacher 106-135(A)strtdte 136-141 lncdte 142-147 lnchcde 148-148(A) hndicap 149-149(A)specled 150-152 entrdtel 153-158 entrcdel 159-161(A) entrdte2 162-167entrcde2 168-170(A) entrdte3 171-176 entrcde3 177-179(A) leavdtel 180-185leavcdel 186-188(A) leavdte2 189-194 leavcde2 195-197(A) leavdte3 198-203leavcde3 204-206(A) .
EXECUTE.
Variable Labels lnchcde 'Lunch code?Hndicap 'Handicap?specled 'Special Education?entrcdel 'Codes for entering school the first time?entrcde2 'Codes for entering school the second time?Leavcdel 'Codes for leaving school the first time'/BDate 'Birth date'/Strtdte Date Started in district'/Entrdtel Date entered in school the first time?Entrdte2 Date entered in school second time/Leavdtel Date Left school'.
Value Labels Sex 'M''F' 'Female?Ethnic 1 'Hispanic'2 'White'3 'Black'4 'Asian'5 'Native American'6 'Filipino'7 'Pacific Islandef/School 'A6"Adams cycl A''A7' 'Adams cycle b''A8"Adams cycle C.'A9"Adams cylce D''SI"Carver Cylce A''S2"Carver Cycle B''S3"Carver Cycle C''S4"Carver Cycle D' .
'Al' 'Diamond Cycle A''A2' 'Diamond Cycle B''A3' Diamond Cycle C''A4' 'Diamond Cycle D''B l' 'Edison Cycle A''62' 'Edison Cycle B'113"Edison Cycle C''134"Edison Cycle D''62"Franklin T'
A4 112
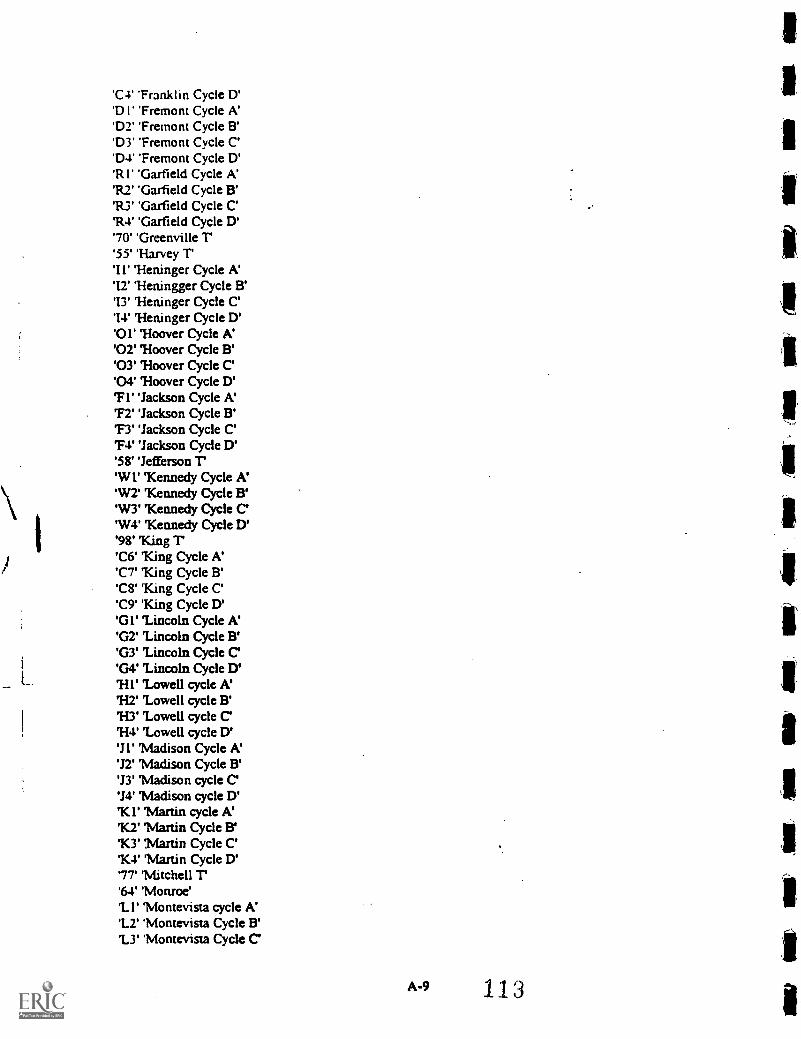
'C4"Franklm Cycle D''D l"Fremont Cycle A''D2"Fremont Cycle B''D3"Fremont Cycle C''D4"Fremont Cycle D''RI"Garfield Cycle A''R2"Garfield Cycle B''R3"Garfield Cycle C''R4"Garfield Cycle D''70"Greenville T''55"Harvey T11"Heninger Cycle A'12' 'Heningger Cycle B'13' 'Heninger Cycle C'14' 'Heninger Cycle D''01' 'Hoover Cycle A''02' 'Hoover Cycle B''03' 'Hoover Cycle C''04' 'Hoover Cycle D'TI"Jackson Cycle A''F2"Jackson Cycle B''F3"Jackson Cycle C'74"Jackson Cycle D''58"Jefferson T'W l' 'Kennedy Cycle A''W2' 'Kennedy Cycle B''W3' 'Kennedy Cycle C''W4' 'Kennedy Cycle D''98' 'King T''C6"King Cycle A''C7' 'King Cycle B''CfrKing Cycle C''C9' 'King Cycle D''01' 'Lincoln Cycle A''02' 'Lincoln Cycle B''03' 'Lincoln Cycle C''G4' 'Lincoln Cycle D''HI' 'Lowell cycle A''H2"Lowell cycle B'113"Lowell cycle C''114' 'Lowell cycle D''JP 'Madison Cycle A''12"Madison Cycle B''13"Madison cycle C''14"Madison cycle D'TIC1"Martin cycle A''K2"Martin Cycle B'1(3' ',Martin Cycle C'1(4' 'Martin Cycle D''77"Mitchell r'64"Monroe''L 1"Montevista cycle A''L2"Montevista Cycle B''L3"Montevista Cycle C'
A-9 113

'14"Montevista Cycle D''66"Muir'P l"Pio Pico cycle A''P2"Pio Pico cycle B''P3"Pio Pico cycle C''P4' Pio Pico cycle D''75"Remington T'Ml"Roosevelt cycle A'Iv12' 'Roosevelt cycle B''M3"Roosevelt Cycle C''M4"Roosevelt rycle D''68"Santiago r'H6"Sepulveda Cycle A''H7"Sepulveda Cycle B''118"Sepulveda Cycle C''H9"Sepulveda Cycle D''73' 'Taft r'42' Thorpe T'56"Walker Cycle A''57"Walker Cycle B''58"Walker Cycle C''89"Walker Cycle D''Zl"Washington cycle A''Z2"Washington cycle B''Z3"Washington cycle C'Z4"Washington Cycle D''Nl"Wilson Cycle A''N2"Wilson Cycle B''N3"Wilson Cycle C''N4"Wilson Cycle D'D6"Carr Cycle A'D7"Carr Cycle B''D8"Carr Cycle C''D9"Carr Cycle D'
'Lathrope cycle A''L7' 'Lathrope cycle B''L8' 'Lathrope cycle C''L9' 'Lathrope cycel D''79' 'MacArthur T'85"Macfadden''S6"Sierra cycle A''S7"Sierra Cycle B''S8"Sierra Cycle C''S9"Sierra Cycle D'rE6"Spurgeon Cycle A'S7"Spurgeon Cycle B'rE8"Spurgeon Cycle C''59"Spurgeon Cycle D''84"Willard79"Indpend stdy''91"Ceaser Chavez''90"Century''76"Mount View''86"Saddleback'
A-10 114

'31"Santa Ana''32"Valley''27' 'ROP''F7"Phoenix House int''F8"Phoenix House HS''26"Indpependent stdy hs''EX' 'Expelled students'/
Language 90 'LEP other'33 'LEP American Indian'11 'LEP Arabic'37 'LEP Armenian'39 'LEP Burmese'13 'LEP Cantonese'81 'LEP Chinese Other'41 'LEP Croatian'43 'LEP Dutch'0 'English Only'15 'LEP Farsi'83 'LEP Filipino other'45 'LEP French'47 'LEP German'49 'LEP Greek'51 'LEP Guamanian'53 'LEP Hebrew'55 'LEP Hindi'9 'LEP Hmong'57 'LEP Hungarian'17 'LEP Ilocano'59 'LEP Indonesian'61 'LEP Italian'19 'LEP Japanese'5 'LEP Khmer Cambodian'21 'LEP Korean'7 'LEP Lao'35 'LEP Lau Language group'23 'LEP Mandarin'77 'LEP Pashto'79 'LEP Polish'25 'LEP Portugese'63 'LEP Punjabi'65 'LEP Russian '27 'LEP Samoan'67 'LEP Serbian'1 'LEP Spanish'
29 'LEP Tagalog'69 'LEP Tha?73 'LEP Tongan'71 1-EP Turkish'31 'LEP Urdu'3 'LEP Vietnamese'
75 'LEP Visayan'9 I 'FE? other'
34 'FEP American Indian'12 'FEP Arabic'
A-11 115

38 'FE? Armenian'40 'FEP Burmese'14 'FE? Cantonese'82 'FEP Chinese Other'42 'FEP Croatian'44 'FEP Dutch'16 'FE? Farsi'84 'FEP Filipino other'46 'FE? French'48 'FEP German'50 'FEP Greek'52 'FEP Guamanian'54 'FEP Hebrew'56 'FEP Hindi'10 TEP Hmong'58 'FEP Hungarian'18 'FEP Ilocano'60 'FEP Indonesian'62 'FE? Italian'20 TEP Japanese'6 'FEP Khmer Cambodian'22 PEP Korean'8 'FEP Lao'36 PEP Lau Language group'24 'FEP Mandarin'78 'FEP Pashto'80 'FEP Polish'26 'FEP Portugese'64 'FEP Punjabi'66 'FEP Russian '28 'FEP Samoan'68 'FE? Serbian'2 'FEP Spanish'
30 PEP Tagalog70 'FEP Thai'74 PEP Tongan'72 PEP Turkish'32 'FEP Urdu'4 'FEP Vietnamese'76 PEP Visayan'/
Lnchcde 'A' 'Free AFDC''B' 'Temp reduced''C' Denied''F 'Free Lunch'7 'Paid Denied''R"Reduced Lunch'
Temp Free'/Hndicap 'Yes?specled 410 'Designated instruction and services'420 'Resource Specialist Program RSP'430 'Special Day classess public'431 'Special Day classess public sep'440 'Non public school day NPS'441 'Non public school residential CA'
A-12

442 'Non public schoo residential non CA'471 'Public residential school'473 'Correctional facility'475 'State Hospital'476 'Development Center'477 'Community Project'479 'Teaching HospitaT/
entrcdel entrcde2 entrcde3 'BP' 'Between districts permit''NC"New Student out of country''NS' 'New Student out of State''RA"Returning from alternative program''RE"Regular enrollment''RN' 'Returning not currently enrolled''RS' 'Re enter to a specific school'-TC 'Transfer from another CA school''RP' 'Transfer at parents request''WS' 'Moved within SAUSD'/
Leavcdel Leavcde2 Leavcde3 'DE' 'Deceased'DR' Dropout''EP 'Expelled''ET 'Exempt parents request''FW 'Full time work experience''GR"Graduated''HE' 'Health''HT' 'Home Teaching''LC' 'Moved out of Country''LS' 'Moved out of State''MC' 'Moved within State''MG' 'Mid year graduate''MV'Moved'NS' 'No show''PA"GED or CHSPE Passed'PB"Inter district Permit'PW' 'Intra district Permit''RC 'Released from compulsory education''RU' 'Runaway''ST 'Student record requested''TA' 'Transfer to adult education''T7 'Transfer to alternative program''UN' 'Unknown''WS' 'Moved within district'.
** ******** ********************** %-umment: Date Computations************************
COMPUTE Byear = TRUNC(Bdate/10000) .VARIABLE LABELS Byear 'Birthday Yeae .
EXECUTE .
COMPUTE Bmonth = TRUNC(Bdate/100)-(100.Byear).VARIABLE LABELS Bmonth 'Birthday Month' .
EXECUTE .
COMPUTE BDay = (Bdate-(1000013year)-(100*Bmonth)).VARIABLE LABELS BDay 'Birthday Day' .
EXECUTE
A-13 1 1 7

COMPUTE Brthdte = DATE.MDY(bmonth.bday.byear)EXECUTECompute Strtyr= TRUNC(strtdte/10000) .VARIABLE LABELS Strtyr 'Year started'EXECUTE .COMPUTE Strtmo = TRUNC(strtdte/100)-(100*Strtyr).VARIABLE LABELS Stmno 'Month started' .
EXECUTE .COMPUTE strtday = (strtdte-(10000*strtyr)-(100*Strtmo)).VARIABLE LABELS strtday Day Started' .EXECUTE .COMPUTE Datestrt = DATE.MDY(strtmo,strtday.strtyr) .EXECUTE .Compute Inchyr= TRUNC(Incdte/10000) .VARIABLE LABELS lnchyr 'Year luch aid started' .EXECUTE .COMPUTE lnchmo = TRUNC(Incdte/100)-(100411nchyr).VARIABLE LABELS lnchmo 'Month lunch aid started' .EXECUTE .
COMPUTE Inchday = (Incdte-(10000*Inchyr)-(100411nchmo)).VARIABLE LABELS lnchday 'Day lunch aie Started' .EXECUTE .COMPUTE Datelnch = DATE.MDY(Inchmo,lnchday,1nchyr) .EXECUTE .Compute entrlyr= TRUNC(entrdte1/10000) .VARIABLE LABELS entrlyr 'Enter1 yea? .EXECUTE .COMPUTE entrlmo = TRUNC(entidte1/100)-(10trentrlyr).VARIABLE LABELS entrlmo 'enterl month' .EXECUTE .
COMPUTE entrlday = (entrdte1-(10000*entr1yr)-(100*entr1mo)).VARIABLE LABELS entrlday 'entrlday' .EXECUTE .
COMPUTE Datentrl = DATE.MDY(entrlmo,entrlday,entrlyr) .EXECUTE .
Compute entr2yr= TRUNC(entrdte2/10000) .VARIABLE LABELS entr2yr 'Enter2 yea? .EXECUTE .
COMPUTE entr2mo = TRUNC(entrdte2/100)-(100*entr2yr).VARIABLE LABELS entr2mo 'enter2 month' .EXECUTE .COMPUTE entr2day = (entrdte2-(10000*entr2yr)-(100*entr2mo)).VARIABLE LABELS entr2day 'entr2day' .EXECUTE .COMPUTE Datentr2 = DATE.MDY(entr2mo.entr2day,entr2yr) .EXECUTE .
Compute entr3r= TRUNC(entrdte3/10000) .VARIABLE LABELS entr3yr 'Enter3 yea? .EXECUTE .
COMPUTE entr3mo = TRIINC(entrdte3/100)-(100oentr3yr).VARIABLE LABELS entr2mo 'enter2 month' .EXECUTE .
A-14 113
COMPUTE entr3day = (entrdte3-(10000entr3yr)-( lOOsentr3mo)).VARIABLE LABELS entr3day 'ent.r3day..EXECUTE .
COMPUTE Datentr3 = DATE.MDY(entr3mo.entr3day.entr3yr) .
EXECUTE .
Compute leavlyr-- TRUNC(leavdte1/10000) .
VARIABLE LABELS leav lyr 'leavel year' .
EXECUTE .
COMPUTE leavlmo = TRUNC(leavdte1/100)-(100*leavlyr).VARIABLE LABELS leav Imo 'leave! month' .
EXECUTE .
COMPUTE leavlday = (leavdtel-(10000*leavlyr)-(100*leav Imo)).VARIABLE LABELS leavIday 'leave I day' .
EXECUTE .
COMPUTE Datleavl = DATE.MDY(leav I mo,leav 1 day,leav lyr) .EXECUTE .
Compute leav2yr= TRUNC(leavdte2/10000) .
VARIABLE LABELS leav2yr 'leave2 year' .EXECUTE .
COMPUTE leav2mo = TRUNC(leavdte2/100X100*leav2yr).VARIABLE LABELS leav2mo leave2 month' .EXECUTE .
COMPUTE leav2day = (leavdte2-(10000*leav2yrX100*leav2mo)).VARIABLE LABELS leav2day leave2 day' .EXECUTE .
COMPUTE Datleav2 = DATE.MDY(leav2mo,leav2day.leav2yr) .EXECUTE .
Compute leav3yr= TRUNC(leavdte3/10000) .
VARIABLE LABELS leav3yr leave3 year' .EXECUTE .
COMPUTE leav3mo = TRUNC(leavdte3/100)-(100*leav3yr).VARIABLE LABELS leav3mo leave3 month' .
EXECUTE .
COMPUTE leav3day = (1eavdte3-(10000*1eav3yrX100*leav3mo)).VARIABLE LABELS leav3day leave3 day' .EXECUTE .
COMPUTE Datleav3 = DATE.MDY(leav3mo,leav3day,leav3yr) .EXECUTE .
******Cornments: English Language Proficiency Compulation*******
Recode Language (90,33,11,37,39,13,81,41.43,15,83,45,47,49,51,53,55,9,57,17.59.61.19.5.21.7,35,23.77.79.25.63.65,27.67,1,29.69,73.71.31.3.75=1)(91.34.12.38,40,14,82,42.44.16.84.46.48,50,52.54.56.10,58,18.60,62.20.6.22,8,36.24,78.80.26,64,66.28.68.2.30.70.74.72.32.4.76=2) (0=3)into Profcncy.
Variable Labels Profcncy 'Language Proficiency.Value Labels Profcncy MEP'
2TEP'3'English only'.
119A-15
t
Comments. School Level Computation*******
Recode School (A6'.'A71:448'.'A9'=50)('S I VS2'.'S3'.'S4'=95)('AlVA2VA3'.'Ax=5 l)('B 1 V132'.113'.134'=52)('62'.'04'=62)('Dl'.1)2'.'D3'.D4'=54)(R1'.112'.113'.1t4'=94)(10'=70X'55'=55)
C58'=58)(' W W2'.' W3 W4'=92)('98'.*C6'.'C7VC8VC9'=98)('G '.112'.1i3'.'H4'=60)(71',72'.73',74'=61)(X1','K2',"K3'.'K4'=63)(77'=77)(64'=64)('L(166'=66)(1131'.'P2'.'P3'.'P4'=43)(15'=75)('M '.'M2','M3','M4'=67)('68.---68)('H6'.'H7'.1-18'.'H9'=69)(13'=73)('42 .'=42)(136'.'B7' .'138';B9'=97)('Zl'.'Z2',73',24'=71)(1/41',742',743',IN4'=72)CD6','1)7VD8'.'D9'=83)('L6'.1.71,11.8','L9'=80X'79'=79)('85'=85)('S6'.'S7'.'S8'.'S9'=78)('E6VE7VE8VE9'=87)C84'=84)('911=91)('90'=90)(16'=76)('86'=86)(111'=81)('82'=82)into schlnme.
Variable Labels schlnme 'Name of school for all cycles'.Value Labels schhune 50'Adams Elem'
95'Carver Elem'5 l'Diamond Elem'52'Edison Elem'62'Frank1in Elem'54Tremont Elem'94'Garfield Elem'70'Greenville Elem'55'Harvey Elem'93'Heninger Elem'56'Hoover Elem'57'Jackson Elem'58'Jefferson Elem'92'Kennedy Elem'98'King Elem'59'Lincoln Elem'60'Lowell Elem'6 Madison Elem'63'Martin Elene77'Mitchell Elem'64'Monroe Elem'651Monte Vista Elem'66'Muir Elem'43Tio Pico Elem'75'Rernington Elem'67'Roosevelt Elem'68'Santiago Elem'69'Sepulveda Elem'73'Taft Elem'421Thorpe Elem'97'Walker Elem'71'Washington Elem'72'Wilson Elem'83'Carr Intermediate'80'Lathorpe Intermediate'79'MacArthur Intermediate'
A-16r) 0

85'Mcfadden Intermediate'78'S ierra Intermediate'87'Spurgeon Intermediate'84'Willard Intermediate'91'Cesar Chavez HS'90'Century HS'76'Mt View HS'86'Saddleback HS'8 l'Santa Ana HS'82'Valley HS'.
Recode schlnine(50,95.5 1.52,62,54,94,70,55,93,56,57,58,92,98,59,60,61,63,77.64,65,66,43,75,67,68,69,73,42,97,71,72=1)(83,80,79,85,78.87,84=2)(91,90,76,86,81,82=3)into schltyp.
Variable Labels schltyp 'Type of School'.Value Labels schltyp l'Elementary'
2'Middle'3'High School'.
**************************Commentsmemo hic variables Recoding***********************
AUTORECODEVARIABLES=Inchcde /INTO frlunch/PRINT.
RECODEfrlunch (1=0) (2=0) (3=1) (4-0) (5=1) (6-0) .
variable labelsfrlunch "Poverty Status".
value labelsfrlunch 1 "Poverty"
0 "Non-Poverty".EXECUTE .
RECODEethnic(1=1) (4=2) (SYSMIS=SYSMIS) (ELSE=3) INTO Eth Rev .
VARIABLE LABELS Eth Rev 'Revised Ethnic Code'.VALUE LABELS Eth_rev
1 "Hispanic"2 "Asian"3 "All Other".
RECODEschool(42`=0) (55'.=0) (58'=0) (62'=0) (64'=0) (66=0) (70'=0)(73') ("753) (76') (17') (79') (1813) (112'..))(84'0) ("85'*3) (86') (VOW)) (91') (981=0) (AP=1)(A2'=2) ('A3'=3) (A4'=4) (A6'...1) (A71=2) (A81=3) (A9=4)('B l'= l) ('B2'=2) (B6'=1) (B3L=3) ('B4'=4) (B71=2) (138'=3)(11:19'=4) (C4'=4) ('C6'=1) (C8'=3) (C9'=4) (D1'..1)(132'=2) (D3'=3) (134'=4) (D6'.=1) (137'..2) (D8'=3) (D9'...4)(E6'=1) (E7'=2) (E8'=3) (E9'=4) (71'=1) ('F2'=2) (F3'=3)(F4'=4) (G1'=1) (G2'=2) (G3'=3) (G4'=4) (Hr=1) (H2'=2)

('H3'=3) ('H4'=4) ('H6'=1) ('1-17=2) ('H8'=3) ('H9'=4) ('IP=1)Cl2'=2) ('I3'=3) (14'=4) ('12'=2) ('J3'=3) ('14'=4)('K l'= I) ('K2'=2) ('K3'=3) C1(4'=4) (L l'=1) ('L2'=2) ('L3'=3)(L4'=4) ('L6'=1) ('L7'=2) (18'=3) ('L9'=4) ('M 1 '=1) ('M2'=2)('M3'=3) ('M4'=4) ('N1'=1) ('N2'=2) ('N3'=3) ('N4'=4) ('Or=1)(02'=2) ('03'=3) ('04'=4) ('P F=1) ('P2'=2) (P3'=3) ('P4'=4)(RP= l) ('R2'=2) ('R3'=3) ('R41=4) ('SF=1) ('S2'=2) ('S3'=3)('S4'=4) ('S6'=l) ('S7'=2) ('S8'=3) ('S9'=4) ('W1'=1) CW2'=2)('W3'=3) ('W4'=4) ('Z 1 '=1) ('Z2'=2) ('Z3'=3) ('Z4'=4) INTO Cycle .
VARIABLE LABELS Cycle 'Cycle (0=Trad, 1=A, 2=13...)'.EXECUTE .
compute overage = (enddate - brthdte)/(60*60*24*365.24) - 5 - (10/12) - grade.variable labels overage "Overage for grade (msng: <-1, >6)".missing values overage lowest thru -1, 6 thru highestCompute DISITIME = (enddate - datestrt)/(60*60*244165.24)EXECUTE .
RECODEzip(92701=1) (92702=2) (92703=3) (92704=4) (92705=5) (92706=6) (92707=7)(Lowest thru 92708) (92708 tluu 926804826=8) (927010000 thru927019991) (927030000 thru 927039993) (927060000 thru 927069996)(927070000 thru 927079999=7) (927040000 thru 927049994) (ELSE=8) INTOzipcode .
VARIABLE LABELS zipcode 'Receded Zips 92701-92707 + °the.EXECUTE .
RECODEspecled(Lowest thru 431=1) (ELSE=0) INTO SPED .
VARIABLE LABELS SPED 'Special Ed - Any Seivice'.EXECUTE .
RECODElanguage(0=0) (MISSING=SYSMIS) (1 thru 2=1) (3 thru 4=2) (5 thru 6=3) (7 thru8=4) (9 thru 1(:=5) (ELSE=6) INTO langcode .
VARIABLE LABELS langcode 'Language group'.value labels langcode
0 'English Only"1 "Spanish"2 "Vietnamese"3 "Cambodian"4 "Lao"5 "Hmong"6 "Other Lang".
Value Labels Zipcode1 "92701"2 *92702"3 "92703"4 "92704"5 "92705"6 "92706"7 "92707"8 "All Others".
EXECUTE .
RECODE
A-18 I 2 2

bprogcde(0 aim 1=1) (2 thru 4=2) (5 thru 6=3) INTO Progtype .
VARIABLE LABELS Progtype Type of Program'.value labels progtype
1 "Transitional"2 "Immersion"3 "Mainstream".
EXECUTE .
SAVE OUTFILE='d: \SantaAnaProject\SAUSDCompleteRev2.sav*/DROP datex12 datex22 datex41 datex51 datey02 datey22 datey72 datey92 datez02 datez22
datleav3 leavdte3 1tc9504 Itc9504g Itc9504sIts9402 1ts9402g 1ts9402s 1ts9403 1ts9403g Its9403s lts9410 1ts9410s 1ts9410g lts9412 lts9412g
lts9412s Its9502 Its9502g Its9502sIts9504 Its9504g 11s9504s Its9511 Its9511g 1ts95 1 Is lts9512 1ts9512g Its9512s 1ts9602 Its9602g Its9602smtc9504 mtc9504g mtc9504s oa_err rtc9504rtc9504g rtc9504s tbc9504 tbc9504g tbc9504s tbs9402 tbs9402g tbs9402s tbs9403 tbs9403g tbs9403stbs9410 tbs9410g tbs9410s tbs9412 tbs9412gtbs9412s tbs9502 tbs9502g tbs9502s tbs9504 tbs9504g tbs9504s tbs9511 tbs9511g tbs9511s ths9512tbs9512g tbs9512s 1bs9602 tbs9602g tbs9602stbs9704 tbs9704g tbs9704s
/COMPRESSED.
***************Comments: Program Service Data Transpost'don*** **********
File Type GroupedFile'CAShare\SAUSD data\SAUSD all students\progservicecdes.dat'Record=#rec 7-9(A) case=stndid 1-6Wild=nowarnMissing=nowarn.Record type 'XOData List /XO 17-22.Record type 'XO1'.Data List /X01 17-22.Record Type 'XlData List /X1 17-22.Record Type 'XII'.Data List /X11 17-22.Record Type 'X12'.Data List /X12 17-22.Record Type 'X2 '.Data List /X2 17-22.Record Type 'X21'.Data List /X21 17-22.Record Type 'X22'.Data List /X22 17-22.Record Type 'X3 '.Data List /X3 17-22.Record Type 'X31'.Data List /X31 17-22.Record Type 'X4 '.Data List 1X4 17-22.Record Type 'X41'.Data List 1X4 I 17-22.Record Type 'X5 '.
123A-19

1
I.
Data List 1X5 17-22.Record Type 'X51'.Data List /X51 17-22.Record Type 'X6 '.Data List 1X6 17-22.Record Type 'X7 '.Data List /X7 17-22.Record Type 'X8 '.Data List /X8 17-22.Record Type 'X9 '.Data List /X9 17-22.Record Type 'YOData List /Y0 17-22.Record Type 'YO1'.Data List /Y01 17-22.Record Type T02'.Data List /Y02 17-22.Record Type T1 '.Data List /Y1 17-22.Record Type T11'.Data List /Y11 17-22.Record Type 'Y2 '.Data List P/2 17-22.Record Type 'Y21'.Data List /Y21 17-22.Record Type 'Y22'.Data List /Y22 17-22.Record Type rY3Data List /Y3 17-22.Record Type 'Y31'.Data List /Y31 17-22.Record Type 'Y4 '.Data List /Y4 17-22.Record Type 'Y41'.Data List /Y41 17-22.Record Type 'Y5 '.Data List /Y5 17-22.Record Type 'Y51'.Data List 1Y51 17-22.Record Type 'Y6 '.Data List /16 17-22.Record Type 'Y61'.Data List /Y61 17-22.Record Type 'Y7 '.Data List I17 17-22.Record Type T71'.Data List IY71 17-22.Record Type 'Y72'.Data List /Y72 17-22.Record Type 'Y8 '.Data List /Y8 17-22.Record Type T8 I'.Data List /Y81 17-22.Record Type T9 '.
A-20

Data List /Y9 17-22.Record Type 'Y91'.Data List /Y91 17-22.Record Type 'Y92'.Data List /Y92 17-22.Record Type 'ZOData List /Z0 17-22.Record Type 701'.Data List IZO1 17-22.Record Type 'Z02'.Data List 1Z02 17-22.Record Type 'ZlData List /21 17-22.Record Type 'Zll'.Data List /Z11 17-22.Record Type 72 '.Data List /Z2 17-22.Record Type 721'.Data List /Z21 17-22.Record Type 722'.Data List /Z22 17-22.Record Type 'Z3 '.Data List 173 17-22.Record Type '731'.Data List /Z31 17-22.Record Type 74 '.Data List /Z4 17-22.Record Type 'Z41'.Data List /Z41 17-22.Record Type 75 '.Data List /Z5 17-22.Record Type 'Z51'.Data List /Z51 17-22.Record type other skip.End File Type.Execute.
***********Comments: Program Service Dates
Compute x0yr--Trunc(x0/10000).Compute x0mo=Trunc(x0/100X100*x0yr).Compute x0day=(x0-(10000ox0yr)-(10041x0mo)).COMPUTE Datex0 = DATE.MDY(x0m0,x0day,x0yr)EXECUTE .
Compute x0 lyr=Trunc(x01/10000).Compute xOlmo=Tnmc(x01/100X100*xOlyr).Compute xOldar(x01-(1000041x01yr)-(100*xOlmo)).COMPUTE Datex01 = DATE.MDY(xOlmo,x0Iday,x01yr) .
EXECUTE .
Compute xlyr=Trunc(x1/10000).Compute xl mo=Trunc(x1/100)-(100*x lyr).Compute xlday-(x1-(1000041x1yr)-(100*xlmo)).COMPUTE Datexl DATE.MDY(x1mo.xIday,x1yr) .
EXECUTE .
A-21 123

Compute x t I yr=Trunc(.x ill t0000).Compute xtlmo=Trunc(x11/100)-(10(rx llyr).Compute x t tdarqx 1-( 1000007(1 tyr)-(100*xl tmo)).COMPUTE DatexiL = D ATE.MDY(x 1 t mo.xl Iday.x 1 1 yr) .
EXECUTECompute xl2y1=Trunc( x 12110000).Compute xl2mo=Trunc( x12/100)4 1 00*x12yr).Compute xl2dar(x12410000*x12yr)-(100*xl2mo)).COMPUTE Datex12 = DATE.MDY(x12mo,x12day.x12yr) .
EXECUTE .
Compute x2yr-Trunc(x2/10000).Compute x2 mo=Trunc(x2/ 100)-(100*x2yr).Compute x2dar-(x2410000*x2yr)-(100*x2mo)).COMPUTE Datex2 = DATE.MDY(x2mo,x2day,x2yr) .
EXECUTE .Compute x2 lyr=Tninc(x21/10000).Compute x2Imo=Trunc(x21/100)-(100*x21yr).Compute x2Iday=(x21410000*x21yr)-(100*x2 mo.COMPUTE Datex2 1 = DATE.MDY(x2 1 mo.x2 Iday,x21yr) .EXECUTE .
Compute x22yr--Tninc(x22/10000).Compute x22mo=Trunc(x22/100)-(100*x22yr).Compute x22day=(x22410000*x22yrX100*x22mo)).COMPUTE Datex22 = DATE.MDY(x22mo,x22day,x22yr) .
EXECUTE .
Compute x3yr=Trunc(x3/10000).Compute x3mo=Tnmc(x3/100X100*x3yr).Compute x3day=(x3410000*x3yr)-(100*x3mo)).COMPUTE Datex3 = DATE.MDY(x3mo.x3day,x3yr) .
EXECUTE .
Compute x3 lyr-=Tnmc(x3 1/10000).Compute x31mo=Trunc(x3 1/100)-(100*x3 lyr).Compute x31day=(x31410000*x3 lyr)-(100*x3 Imo)).COMPUTE Datex31 = DATE.MDY(x3 Imo,x3Iday,x31yr) .
EXECUTE .
Compute x4yr=Trunc(x4/10000).Compute x4mo=Trunc(x4/100)-(100*x4yr).Compute x4day=(x4410000*x4yr)-(100*x4mo)).COMPUTE Datex4 = DATE.MDY(x4mo,x4day.x4yr) .
EXECUTE .
Compute x4 lyr=Trunc(x41/10000).Compute x41mcTrunc(x41/100)-(100*x4 lyr).Compute x4 I day=(x41-(10000*x4 lyr)-(100*x4 I mo)).COMPUTE Datex4 I .= DATE.MDY(x4Imo.x4Iday,x41yr) .EXECUTE .
Compute x5yr=Trunc(x5/10000).Compute x5 mo=Trunc(x5/100)-(100*x5yr).Compute x5dar(x5410000*x5yr)-(100*x5mo)).COMPUTE Datex5 = DATE.MDY(x5mo,x5day,x5yr) .EXECUTE .
A-22 126

Compute x5 lyr=Trunc(x51/10000).Compute x5Imo=Trunc(x51/100)-(10045(51yr).Compute x5 lday=(x51-(10000*x5 lyr)-(100*x51mo)).COMPUTE Datex51 = DATE.MDY(x51mo.x5 lday.x5 lyr)
.
EXECUTE .
Compute x6yr=Trunc(x6/10000).Compute x6mo=Trunc(x6/100)-(100*x6yr).Compute x6dar(x6-(10000*x6yr)-(100*x6mo)).COMPUTE Datex6 = DATE.MDY(x6nto,x6day,x6yr) .
EXECUTE .
Compute x7yr--Trunc(x7/10000).Compute x7mo=Trunc(x7/100)-(100*x7yr).Compute x7day=(x7-(10000*x7yr)-(100*x7mo)).COMPUTE Datex7 = DATE.MDY(x7mo,x7day,x7yr) .
EXECUTE .
Compute x8yr=Trunc(x8/10000).Compute x8mo=Tmnc(x8/100)-(100*x8yr).Compute xlIday=(x8-(10000*xsyr)-(10041x8mo)).COMPUTE Datex8 = DATE.MDY(x8mo,x8day,x8yr) .
EXECUTE .
Compute x9yr=Trunc(x9/10000).Compute x9mo=Trunc(x9/100)-(100*x9yr).Compute x9dar(x9-(1000010x9yr)-(100*x9mo)).COMPUTE Datex9 = DATE.MDY(x9mo,x9day,x9yr) .
EXECUTE .
Compute yOyr=Trunc(y0/10000).Compute yOmo=Trunc(y0/100)-(100*y0yr).Compute yOdar(y0-(10000*y0yrX100*yOmo)).COMPUTE Dater!) = DATE.MDY(yOmo,y0day,y0yr) .
EXECUTE .
Compute y0 lyr=Trunc(y01/10000).Compute yO1mo=Trunc(y01/100)-(10041y1Hr).Compute yOlda)=(y01-(10000*y01yr)-(10041y0 Imo)).COMPUTE Datey01 = DATE.MDY(y01mo,y4)1day,y01yr) .
EXECUTE .
Compute y02yr=Trunc(y02/10000).Compute yO2mo=Tnmc(y02/100)-(1003902yr).Compute yO2day=(y02-(10000*y02yr)-(10010y02mo)).COMPUTE Datey02 = DATE.MDY(y02mo,y02day,y02yr) .
EXECUTE .
Compute ylyr=--Tnmc(y1/10000).Compute ylmo=Trunc(y1/100)-(100*y lyr).Compute y 1 day=(y1-(10000*y lyr)-(100*y 1 mo)).COMPUTE Dateyl = DATE.MDY(ylmo.ylday,ylyr) .
EXECUTE .
Compute yllyr=Trunc(y11/10000).CompUte yllmo=Trunc(y11/100)-(100*y 1 lyr).Compute yl Idar(y11-(10000*yllyr)-(100syl I mo)).COMPUTE Datey II = DATE.MDY(y 1 Imo,y1 Iday,y11yr) .
EXECUTE .Compute y2yr--Trunc(y2/10000).Compute y2mo=Trunc(y2/100)-(100*y2yr).
A-23'2 7

Compute y2day=(y2-( 10000*y2yr)-( 100*y2mo)).COMPUTE Datey2 = DATE.MDY(y2mo.y2day.y2yr) .
EXECUTECompute y2lyr--Trunc(y 21/10000).Compute y2lmo=Trunc(y21/100)-(100*y2 lyr).Compute y21day-=(y21-( 10000*y21yr)-(100sy21mo)).COMPUTE Datey21 = DATE.M.Dry21mo,y21day,y2 lyr) .
EXECUTE .
Compute y22yr=Trunc(y22/10000).Compute y22mo=Trunc(y221 100)-(100*y22yr).Compute y22day=(y22-(10000*y22yr)-(100*y22mo)).COMPUTE Datey22 = DATE.MDY(y22mo,y22day.y22yr) .
EXECUTE .
Compute y3r=:Trunc(y3/10000).Compute y3 mo=Trunc(y3/100)-(100*y3yr).Compute y3dar(y3-(10000*y3yr)-(100*y3 mo)).COMPUTE Datey3 = DATE.MDY(y3mo,y3day,y3yr) .
EXECUTE .
Compute y3 lyr=Trunc(y31/10000).Compute y3lmo=Trunc(y31/100)-(100*y3 lyr).Compute y3 lday=(y31-(10000*y31yr)-(100*y3lmo)).COMPUTE Datey31 = DATE.MDY(y3 lmo,y31day,y3 lyr) .
EXECUTE .
Compute y4yr=Trunc(y4/10000).Compute y4mo=Trunc(y4/100)-(100*y4yr).Compute y4dar(y4-(10000*y4yr)-(100*y4mo)).COMPUTE Datey4 = DATE.MDY(y4mo,y4day,y4yr) .
EXECUTE .
Compute y41yr=Trunc(y41/10000).Compute y4lmo=Trunc(y41/100)-(100*y41yr).Compute y41darly41-(10000*y41yr)-(100*y41mo)).COMPUTE Datey41 = DATE.MDY(y4lmo,y41day,y41.yr) .EXECUTE .
Compute y5yr=Trunc(y5110000).Compute y5mo=Trunc(y5/100)-(10041y5yr).Compute y5dar(y5-(10000*y5yr)-(10041y5mo)).COMPUTE Datey5 = DATE.MDY(y5mo,y5day,y5yr) .
EXECUTE .
Compute y5 lyr---Trunc(y51/10000).Compute y51mo=Trunc(y51/100)-(100*y51)1r).Compute y51dar--(y51-(10000*y5 lyr)-(100*y5lmo)).COMPUTE Datey51 = DATE.MDY(y5lmo,y51day,y5lyr) .
EXECUTE .
Compute y6yr=Trunc(y6/10000).Compute y6mo=Trunc(y6/100)-(100*y6yr).Compute y6clariy6-(10000*y6yr)-(100*y6mo)).COMPUTE Datey6 = DATE.MDY(y6mo.y6day,y6yr) .
EXECUTE .
Compute y61yr.Trunc(y61/10000).Compute y6Imo=Trunc(y61/100)-(100*y6 lyr).
A-24
Compute y6Iday=q61-(10000*y61yr)-(10045,61mo)).COMPUTE Datey61 = D ATE. MDY(y6lmo.y61day.y61yr)
.
EXECUTECompute y7yr=Trunc(y7/10000).Compute ylmo=Trunc(y7/100)-(100*y7yr).Compute y7dar--(y7-(10000*y7yr)-(100*y7mo)).COMPUTE Datey7 = DATE.MDY(y7mo,y7day,y7yr) .
EXECUTE .
Compute y7 lyr--Trunc(y71/10000).Compute y7Imo=Trunc(y71/100)-(100*y71yr).Compute y71darly71410000*y7 lyr)-(100*y7 Imo)).COMPUTE Datey71 = DATE.MDY(y71mo,y71day,y71yr) .
EXECUTE .
Compute y72yr=Trunc(y72/10000).Compute y72mo=Trunc(y72/100)-(100*y72yr).Compute y72dar(y72-(10000*y72yr)-(100*y72mo)).COMPUTE Datey72 = DATE.MDY(y72mo,y72day,y72yr) .
EXECUTE .
Compute y8r=Tninc(y8/10000).Compute y8mo=Trunc(y8/100)-(100*y8yr).Compute y8dar(y8-(10000*y8yr)-(100*y8mo)).COMPUTE Datey8 = DATE.MDY(y8mo,y8day,y8yr) .
EXECUTE .
Compute y8 lyr=Trunc(y81/10000).Compute y8lmo=Trunc(y81/100)-(100*y8 lyr).Compute y81day=(y81-(10000*y81yr)-(100*y81mo)).COMPUTE Datey81 = DATE.MDY(y8lmo,y8 lday,y81yr) .
EXECUTE .
Compute y9yr=Trunc(y9/10000).Compute y9mo=Tnmc(y9/100X100*y9yr).Compute y9dar(y9-(10000*y9yr)-(100*y9mo)).COMPUTE Datey9 = DATE.MDY(y9mo,y9day,y9yr) .
EXECUTE .
Compute y9 lyr=Trunc(y91/10000).Compute y9 lmo=Tnmc(y91/100)-(100*y91yr).Compute y91day=(y91-(10000*y91yr)-(100*y91mo)).COMPUTE Datey91 = DATE.MDY(y9lmo,y91day,y9lyr) .
EXECUTE .
Compute y92yr--Trunc(y92/10000).Compute y92 mo=Trunc(y92/100)-(100 sy92yr).Compute y92dar (y92-(10000*y92yr)-(100sy92mo)).COMPUTE Datey92 = DATE.MDY(y92mo,y92day,y92yr) .EXECUTE .
Compute zOr=Trunc(z0/10000).Compute z0mo=Trunc(z0/100)-(100*z0yr).Compute z0dar(z0-((0000*z0yr)-(100*zOmo)).COMPUTE Datez0 = DATE.MDY(z0mo.z0day.z0yr) .
EXECUTE .
Compute zOlyr=Trunc(z01/10000).Compute zOlmo=Trunc(z01/100)-(100*z0 lyr).
A-25`,?9

I.
1
Compute zOlday=( zOt -(10000*zOlyr)-(100*zOlmo)).COMPUTE DacezOl D ATE. MDY(zolmo.zOlday.z0 lyr) .
EXECUTECompute z02yr--Trunc( z02/10000).Compute z02mo=Tninc(z02/ l00)-(100*zO2yr).Compute zO2day=(z02-(1000041z02yr)-(100*z02mo)).COMPUTE Datez02 = DATE.MDY(z02mo,z02day,z02yr) .
EXECUTE .
Compute zIr-=Trunc(z1/10000).Compute z1mo=Trunc(z 1/100)( 100*z1yr).Compute z I dar(z1410000 *zlyr)-(100*zImo)).COMPUTE Datezl = DATE.MDY(zImo,z1day,z I yr) .
EXECUTE .
Compute z1 lyr=Trunc(z11/10000).Compute zIlmo=Trunc(z11/100)-(100*z I lyr).Compute zl Idar(z11-(10000.z1 lyr)-(10041z1 Imo)).COMPUTE Datez11 = DATE.MDY(zIlmo,z 1 Iday,z1lyr) .
EXECUTE .
Compute z2yr=Trunc(z2/10000).Compute z2mo=Trunc(z2/100)-(10041z2yr).Compute z2dar(z2-(10000*z2yr)-(100*z2mo)).COMPUTE Datez2 = DATE.MDY(z2mo,72day,z2yr) .
EXECUTE .
Compute z2lyr=Tnmc(z21/10000).Compute z2lmo=Trunc(z21/100X100*z21yr).Compute z21day=(z21-(10000*z21yr)-(100*z2 Imo)).COMPUTE Datez21 = DATE.MDY(z2lmo,z2Iday,z2 lyr) .
EXECUTE .
Compute z22yr=Trunc(z22/10000).Compute z22mo=nunc(z22/100)-(100*z22yr).Compute z22dar-(z22-(10000*z22yrX10041z22mo)).COMPUTE Datez22 = DATE.MDY(z22mo,z22day.z22yr) .
EXECUTE .
Compute z3yr=Trunc(z3/10000).Compute z3mo=Trunc(z3/100X100*z3yr).Compute z3dar(z3-(10000.z.3yr)-(100*z3mo)).COMPUTE Datez3 = DATE.MDY(z3mo,z3day,z3yr) .
EXECUTE .
Compute z3 lyr=Trunc(z31/10000).Compute z3lmo=Trunc(z31/100)4100*23 lyr).Compute z3Idar(z31-(10000*7.31yr)-(10011..31mo)).COMPUTE Datez31 = DATE.MDY(z3lmoa3 Idaya31yr) .
EXECUTE .
Compute z4yr=Trunc(z4/10000).Compute z4mo=Trunc(z4/100)4 100*z4yr).Compute z4day=(z4-(10000*z4yr)-(100*z4mo)).COMPUTE Datez4 = DATE.MDY(z4mo.z4day,z4yr) .
EXECUTE .
Compute z4lyr--Trunc(z41/10000).Compute z4Imo=Trunc(z41/100)4 100.z4lyr).
A-26 130
Compute z4 day=( z4I-( 1000041z4 lyr)-( 100*z41 mo)).COMPUTE Datez41 = DATE.MDY(z4 lmo.z4 lday.z4 lyr) .
EXECUTE .
Compute z5yr=Trunc(z5/10000).Compute z5mo=Trunc(z5/100)-(100*z5yr).Compute z5dar(z5-(10000*z5yr)-(100*z5mo)).COMPUTE Datez5 = DATE.MDY(z5mo,z5day.z5yr) .
EXECUTE .
Compute z5 tyr=Trunc(z51/10000).Compute z5lmo=Trunc(z51/100)-(1.00*z5tyr).Compute z51dar(z51-(10000*z51yr)-(100*z51mo)).COMPUTE Datez31 = DATE.MDY(z5 1 mo,z51day.z5 lyr) .
EXECUTE .
***********Commments: Program Service Recoding******4****41
RECODEprogcde(Y0'=1) ('Y1'=2) CZ5'=3) ('Y2'=4) ('X0'=5) (X1'=6) ('X2'=7)('X3'=8) ('X4'=9) ('X5'=10) ('X6'=11) CX7'=12) ('X8'=13) ('X9'=14)(Y3'=15) ('Y4'=16) ('Y5'=17) ('Y6'=18) ('Y7'=19) ('Y8'=20) ("Y9'=21)CZO'=22) (71'=23) ('Z2'=24) (7.3'=25) ('Z4'=26)
INTO Prognw..EXECUTE .
USE ALL.COMPUTE filter_S=(dummyl=stid and prognw=dprog).VARIABLE LABEL filter S 'dummyl=stid and prognw--dprog (FILTER)'.VALUE LABELS filter_S 0 'Not Selected' I 'Selected'.FORMAT filter_S (11.0).FILTER BY filter S.EXECUTE .
USE ALL.COMPUTE filter S=(sti&dummyl and prognvpdprog and strtprog=dendprog).VARIABLE LABEL filter S 'sti&dummyl and prognvrdprog and strtprordendprog'+' (FILTER)'.
VALUE LABELS filter S 0 'Not Selected' 1 'Selected'.FORMAT filter_S (11.0).FILTER BY filter_S.EXECUTE .
DO EF (stid=dstid and prognw=dprognw) .
RECODEprogcde ('Y0'="/01') (7.51='Z51') (rY2'.0Y21')('X0'='XO I ') ('X l'='X I 1') ('X2'='X21') ('X3'='X31') ('X4'='X41')('X5'='X5 ') ('X6'=1X6 I') ('X7'='X7 I') CX8'='X81') ('X9'='X91')('Y3'='Y31') ('Y4'=1Y41') ('Y5'='Y51') ('Y6'='Y61') ('Y7'="/71')('Y8'='Y81') ('Y9'='Y91') (20'='ZO I') ('Z 1 '='Z11') (7.2'='Z21')('Z3'='Z3 I') (24'='Z4 I') .
END IF .
A-27 V.3

EXECUTE
DO IF (stid=dstid and prognw=dprognw) .
RECODEprognw (1=100) (2=200) (3=30) (4=40)(5=50) (6=60) (7=70) (8=80) (9=90)(10=1000) (11=110) (12=120) (13=130) (14=140)(15=150) (16=160) (17=170) (18=180) (19=190)(20=2000) (21=210) (22=220) (23=230) (24=240)(25=250) (26=260) .
END EF .
EXECUTE .
Comments: Computations of Redesignation Dates**********
Compute flsyr=Trunc(fls/10000).Compute flsmo=Trunc(f1s/100)-(100q1syr).Compute flsdar(fls-(10000*flsyr)-(100*fismo)).COMPUTE Datefls = DATE.MDY(flsmo,f1sday,f1sYr) .
EXECUTE .
Compute f2sr=Trunc(f2s/10000).Compute f2smo=Tnmc(f2s/100X100*f2syr).Compute f2sdar(f/s-(1000042syr)-(100n2smo)).COMPUTE Datef2s = DATE.MDY(f2smo,f2sday,f2syr) .
EXECUTE .
Compute Dsyr=Trunc(f)s/10000).Compute f3smo=Trunc(f3s/100)-(100413syr).Corapute f3sdar(f3s-(10000*f3syrX100*f3smo)).COMPUTE Datef3s = DATE.MDY(f3smo.f)sday,f3sYr) -
EXECUTE .
Compute f4syr=Trunc(f4s/10000).Compute f4smo=Trunc(f4s/100)-(100q4syr).Compute f4sday=(f4s-(10000*f4syr)-(100'''f4smo)).COMPUTE Datef4s = DATE.MDY(f4sino,f4sday,f4syr) .
EXECUTE .
Compute f5syr=Trunc(f5s/10000).Compute f5smo=Tranc(f5s/100)-(100*Bsyr).Compute f5sdar(f5s-(10000*f5syr)-(100*f5smo)).COMPUTE Datef5s = DATE.MDY(f5smo,f5sday,f5syr) .EXECUTE .
4gs******sai**41.0********Comments: Bilingual program Data Transposition**********40*******File Type GroupedFile='CAShare\SAUSD data\SAUSD all students\progstrtv0-v6sorted.deRecord=#rec 7-9(A) casstndid 1-6Wild=nowarnMissing=nowam.Record Type 'VOData List NO 14-19.Record Type 'VO1'.
A-28 132

Data List /V01 14-19.Record Type 'V I '.
Data List IVI 14-19.Record Type 'V I I'.Data List /VI I 14-19.Record Type 'VE2'.Data List /V12 14-19.Record Type 'V2 '.Data List 1V2 14-19.Record Type 'V21'.Data List /V21 14-19.Record Type 'V3 '.Data List /V3 14-19.Record Type 'V31'.Data List /V31 14-19.Record Type 'V4 '.Data List /V4 14-19.Record Type 'V41'.Data List /V41 14-19.Record Type 'V5'.Data List /V5 14-19.Record Type 'V51'.Data List /V51 14-19.Record Type 'V6 '.Data List /V6 14-19.Record Type 'V61'.Data List /V61 14-19.Record Type 'V62'.Data List 1V62 14-19.Record type other skip.End File Type.Execute.
****************Comment: Bilingual Program Dates Cal 'on*************
Compute v0syr=Trunc(v0s/10000).Compute v0smo=Tnmc(v0s/100)-(100190syr).Compute v0sdar(v0s-(l0000svOsyr)-(100svOsmo)).COMPUTE DatevOs = DA1E.MDY(vOsmo,v0sday,v0syr) .
EXECUTE .
Compute v0 l syr=Trunc(v0 I s/I0000).Compute v0 lsmo=Trunc(v0 Is/100)-(100*W lsyr).Compute v0 I sday=041s-(10000*v0 Isyr)-(10041v0 lsmo)).COMP= Datev0 Is = DATE.MDY(v0lsmo,v0Isday,v0 I syr) .
EXECUTE .
Compute v lsyr=Trunc(v ls/10000).Compute v lsmo=Trunc(v Is/100)-(100*v lsyr).Compute v I sdar(vls-(10000*vlsyr)-(100*vIsmo)).COMPUTE Datev Is = DATE.MDY(v lsmo,v lsday,v lsyr) .
EXECUTE .
Compute v I I syr=Trunc(v ls/10000).Compute v I I smo=Trunc(v lls/100)-(10041v1 I syr).Compute v IL sdar(v I ls-(10000*v1 lsyr)-(100svl lsmo)).COMPUTE Datev I Is = DATE.MDY(vl lsino,vl lsday,v lsyr) .
133A-29
EXECUTECompute v2syt--Trunc(vls/10000).Compute v2smo=Trunc(v2s/100)-(100v2syr).Compute v2sday=(v2s-(10000*v2syr)-(100*v2smo)).COMPUTE Datev2s = DATE. MD Y(v2smo.v2sday.v2syr) .
EXECUTE .
Compute v2Isyr=Trunc(v2Is/10000).Compute v2Ismo=Trunc(v21s/100)-(100*v2 Isyr).Compute v2Isdar(v2Is-(10000*v21syr)-(100*v2Ismo)).COMPUTE Datev21s = D ATE. MDY(v21smo.v2Isday.v21sYr)EXECUTE .
Compute v3syr=Trunc(v3s/10000).Compute v3smo=Trunc(v3s/100)-(100*v3syr).Compute v3sdar(v3s-(10000*v3syr)-(100*v3smo)).COMPUTE Datev3s = DATE.MDY(v3smo,v3sdayy3syr) .EXECUTE .
Compute v3 lsyr---Trunc(v3 ls/10000).Compute v31smo=Trunc(v31s/100)410041v31syr).Compute v3Isday=(v31s-(10000*v31syr)-(100*v3 lsmo)).COMPUTE Datev3 ls = DATE.MDY(v3 lsmo,v3 lsday,v3 lsyr) .EXECUTE .
Compute v4syr=Trunc(v4s/10000).Compute v4smo=Trunc(v4s/100)-(100*v4syr).Compute v4sdar (v4s-(10000*v4syrX100*v4smo)).COMPUTE Datev4s = DATE.MDY(v4smo,v4sday,v4syr) .
EXECUTE .
. Compute v41syr=Trunc(v41s/10000).Compute v41smo=Trunc(v4 ls/100X100*v4 lsyr).Compute v41sday=(v41s-(1000041v41syr)-(100*v41smo)).COMPUTE Datev4ls = DATE.MDY(v41smo,v41sday,v41syr) .EXECUTE .
Compute v5syr=Trunc(v5s/10000).Compute v5smo=Trunc(v5s/100)-(100*v5syr).Compute v5sday=(v5s-(10000*v5syr)-(100*v5smo)).COMPUTE Datev5s = DATE.MDY(v5smoy5sday,v5syr) .EXECUTE .
Compute v5 lsyr=Trunc(v51s/10000).Compute v51smo=Trunc(v51s/100X100.v51syr).Compute v51sdar(v51s-(10000*v51syr)-(100*v51smo)).COMPUTE Datev5 ls = DATE.MDY(v5Ismo,v51sdayy5lsyr) .EXECUTE .
Compute v6sr=Trunc(v6s/10000).Compute v6smo=Trunc(v6s/100)-(10011v6syr).Compute v6sdar(v6s-(10000*v6syr)-(100*v6smo)).COMPUTE Datev6s = DATE.MDY(v6smo,v6sday,v6syr) .
EXECUTE .
Compute v61syr=Trunc(v6 1s/10000).Compute v61smo=Trunc(v6 I s/100)-(100*v61syr).Compute v6Isday=(v61s-(10000*v61syr)-(100*v6Ismo)).COMPUTE Datev6 is = DATE.MDY(v6 stno,v6 Isday,v6 Isyr) .
134A-30

EXECUTECompute v62syr=Trunc(v62s/10000).Compute v62smo=Trunc(v62s/I00)-(100*v62syr).Compute v62sdarlv62s-(10000*v62syr)-(100*v62smo)).COMPUTE Datev62s = DATE.MDY(v62smo.v62stlay.v62sr)EXECUTE .
Comments:Computations of Current Bilingual Program Assignment***********
COMPUTE MaxV = MAX(v0s,v0 I s,v1s,v11s,v2s,v21s.v3s,v31s,v4s.v41s,v5s.v5 Is.v6s,v6Is.v62s) .
EXECUTE .
DO IF (maxv = vOs or maxv = vOls) .
RECODEbprogcde (SYSM1S=0) .
END EF .
EXECUTE .
DO IF (maxv = vls or maxv = vlls) .
RECODEbprogcde (SYSMIS=1) .
END IF .
EXECUTE .
DO IF (maxv = v2s or maxv = v21s) .
RECODEbprogcde (SYSMIS=2) .
END IF .
EXECUTE .
DO EF (maxv = v3s or maxv = v3 Is) .
RECODEbprogcde (SYSMIS=3) .
END LF .
EXECUTE .
DO IF (maxv = v4s or maxv = v41s) .
RECODEbprogcde (SYSMES=4) .
END IF .
EXECUTE .
DO IF (maxv = v5s or maxv = v51s) .RECODE
bprogcde (SYSM1S=5) .
END IF .
EXECUTE .
DO IF (maxv = v6s or maxv = v61s or maxv=v62s) .
RECODEbpropde (SYSM1S=6) .
END IF..
EXECUTE .
Comments: Computation of Earliest Bilingual Program Assignment
COMPUTE MinV = Min(v0s,vOls,v1s,v11s,v2s.v2Is.v3s,v3 ls,v4s.v41s.v5s.
A-31133

v5 Is.v6s.v6 Is.v62s)
EXECUTE .
DO (F (minv = vOs or minv = v0 Is) .
RECODEminbprog (SYSMIS=0)
.
END IF .
EXECUTE .
DO IF (minv = vls or minv = vl Is) .
RECODEminbprog (SYSMIS=1) .
END IF .
EXECUTE .
DO EF (minv = v2s or minv = v21s) .
RECODEminbprog (SYSMIS=2) .
END IF .
EMCUTE .
DO IF (minv = v3s or minv = v31s) .
RECODEminbprog (SYSMIS=3) .
END IF .
EXECUTE .
DO IF (minv = v4s or minv = v41s) .RECODEminbprog (SYSMIS=4) .
END IF .
EXECUTE .
DO IF (minv = v5s or minv = v510 .RECODE
minbprog (SYSMIS=5) .END IF .
EXECUTE .
DO IF (rninv = v6s or minv = v61s or minv=v62s) .RECODEminbprog (SYSMIS=6) .
END IF .
EXECUTE .
************Comment: Program Enrollment Sequence*******************.***********s**Vector #v(15).Vector Order(15).compute #v(1) = vOs.if (vOs > 0) order(1) = I.
compute #v(2) = vOls.if (v0 ls > 0) order(2) = 2.
compute #v(3) = vls.if (v Is > 0) order(3) = 3.
compute #v(4) = vl Is.if (v l Is > 0) order(4) = 4.
compute #v(5) = v2s.if (v2s > 0) order(5) = 5.
compute #v(6) = v2 ls.if (v2 Is > 0) order(6) = 6.
compute th/(7). v3s.
A-32 136

if (v3s > 0) order(7) = 7.compute *v(8) = v3 Is.if (v3 Is > 0) order(8) = 8.
compute *v(9) = v4s.if (v4s > 0) order(9) = 9.
compute itv(10) = v41s.if (v4 Is > 0) order(10) = 10.
compute ttv(11) = v5s.if (v5s > 0) order( II) = 11.
compute Ov(12) = v51.s.if (v5 Is > 0) order(12) = 12.
compute th(13) = v6s.if (v6s > 0) order(13) = 13.
compute ttv(14) = v61s.if (v6 Is > 0) order(14) = 14.
compute #v(15) = v62s.if (v62s > 0) order(15) = 15.loop #1 = 1 to 15.loop ttj = 15 to #I by -1.if (missing(#v(tti))) #v(#i) = 9999999.do if #v(#j) < #v(#i) .
compute #hold = #v(t).compute #v(#j) = #v(#i).compute #v(#i) = #hold.compute #hold = order(#1).compute order(#j) = order(#i).compute order(A) = #hold.end if.
end loop.end loop.execute.
************Comment: Time in Program ***************************************
Vector #v(15).vector #td(11).vector p_time(11).compute #v(1) = datevOs.compute #v(2) = datev0 ls.compute #v(3) = datevls.compute #v(4) = datevl ls.compute #v(5) datev2s.compute #v(6) = datev2 ls.compute #v(7) = datev3s.compute #v(8) = datev3 ls.compute #v(9) = datcv4s.compute #v(10) = datev41s.compute #v(11) = datev5s.compute #v(t2) = datev5compute #v(13) = datev6s.compute Ov( 14 ) = datev6 Is.compute #v(15) = datev62s.compute #td(1) tst9402.
A-33

compute 4td(2) = tst9403.compute #td(3) = tst9410.compute #td(4) = tst9412.compute *td(5) = tst9502.compute #td(6) = tst9504.compute Otd(7) = tst9511.compute #td(8) = tst9512.compute #td(9) = tst9602.compute #td(10) = tst9604.compute #td(11) = tst9704.loop #I = 1 to I 1.loop #j = 5 to I by -1.if (#j = 5) = order5.if (#j = 4) #k = order4.if (#j = 3) #k = order3.if (#j = 2) #k = order2.if (#j = 1) #k = order 1 .
do if missing(p_time(#i)) and #k > 0.if (#v(#k) < #td(#1)) p_time(#i) = (#td(#i) - #v(#k))/(60*60*24*30).
end if.end loop.end loop.execute.
****************************cumments: Bilingual Date Calculanuns*************************COMPUTE datevOs = DATE.DMY((vOs-(100*trunc(v0s/100))),(TRUNC(vOs/100)-(100*trunc(vOs/10000))),TRUNC(vOs/10000)) .
COMPUTE datev0 1 s = DATE.DMY((v0 1 s-(100*uunc(v0 1 s/100))),(TRUNC(v0 ls/100)-(100*trunc(vOls/10000))),TRUNC(vOls/10000)) .
COMPUTE datev 1 s = DATE.DMY((v Is-(100*trunc(v1s/100))),(TRUNC(v1s/100)-(100*trunc(v 1 s110000))),TRUNC (v Is/10000)) .
COMPUTE datev 1 Is = DATE.DMY((v11s-(100*trunc(v 1 1 s/100))), (TRUNC(v 1 1 s/100)-(100*trunc(vIls/10000))),TRUNC(v11s/10000)) .COMPUTE datev2s = DATE.DMY((v2s-(100*trunc(v2s/100))),(TRLINC(v2s/100)-(100*trunc(v2s/10000))),TRUNC(v2s/10000)) .
COMPUTE datev2 ls = DATE.DMY((v21s-(100*trunc(v21s/100))),(TRUNC(v21s/100)-(100*trunc(v21s/10000))),TRUNC(v21s/10000)) .COMPUTE datev3s = DATE.DMY((v3s-(100*trunc(v3s/100))),(TRUNC(v351 100)-(100*trunc(v3s/10000))),TRUNC(v3s/10000)) .
COMPUTE datev3 1 s = DATE.DMY((v31s-(100*trunc(v31s/100))),(TRUNC(v31s/100)-(100*trunc(v31s/10000))),TRUNC(v31s/10000)) .
COMPUTE datev4s = DATE.DMY((v4s-(100*trunc(v4s/100))),(TRUNC(v4s/100)-(100*trunc(v4s/10000))),TRUNC(v4s/10000)) .
COMPUTE datev4 Is = DATE.DMY((v41s-(100*trunc(v4 1 s/100))),(TRUINIC(v4 1 s/100)-(100*trunc(v41s/10000))),TRUNC(v41s/10000)) .
COMPUTE datev5s = DATE.DMY((v5s-(100*tninc(v5s/100))),(TRUNC(v5s/100)-(100*trunc(v5s/10000))),TRUNC(v5s/10000)) .
COMPUTE datev5 Is = DATE: DMY((v51s-(100*trunc(v5 ls/100))),(TRUNC(v51s/100)-(100*tiunc(v51s/10000))).TRUNC(v51s/10000)) .
COMPUTE datev6s = DATE.DMY((v6s-(100*trunc(v6s/100))),(TRUNC(v6s/100)-(100*trunc(v6s/10000))).TRUNC(v6s/ l0000)) .
COMPUTE datev6 1 s = DATE. DMY((v61s-( 100*trunc(v61s/100))).(TRUNC(v61s/100)-( 100*trunc(v6 I s/10000))),TRUNC(v61s/10000)) .
A-34 133

COMPUTE datev62s = DATE.DMY((v62s-(1100suntic(v62s/100))MTRUNC(v62s/100)-( I i)04' trunc(v62s/ I 0000))).TRUNC(v62s/10000))EXECUTE .
Comment: ELD and pip Data Transpostinew******************************
File Type GroupedFile='C:\Share\SAUSD data\SAUSD all students\progstrtwO-w9sorted.dat'Record=#rec 7-9(A) case=stndid 1-6Wild=nowarnMissing=nowarn.Record Type 'WO '.Data List /WO 14-19.Record Type 'W01'.Data List /W01 14-19.Record Type 'W02'.Data List /W02 14-19.Record Type 'W1 '.Data List /W1 14-19.Record Type 'W11'.Data List /W11 14-19.Record Type V12'.Data List /W12 14-19.Record Type 'W2 '.Data List /W2 14-19.Record Type 'W21'.Data List /W21 14-19.Record Type 'W22'.Data List 1W22 14-19.Record Type W3 '.Data List /W3 14-19.Record Type 'W31'.Data List /W31 14-19.Record Type 'W32'.Data List /W32 14-19.Record Type 'W4 '.Data List /W4 14-19.Record Type 'W41'.Data List /W41 14-19.Record Type 'W42'.Data List /W42 14-19.Record Type 'W43'.Data List /W43 14-19.Record Type 'W5 '.Data List /W5 14-19.Record Type 'W51'.Data List /W51 14-19.Record Type 'W52'.Data List /W52 14-19.Record Type 'W6 '.Data List /W6 14-19.Record Type 'W61'.Data List /W6 14-19.Record Type 'W62'.
A-35 133

Data List /W62 14-19.Record Type 'W7Data List /W7 14-19.Record Type 'W71'.Data List /W71 14-19.Record Type 'W72'.Data List /W72 14-19.Record Type 'W8 '.Data List 1W8 14-19.Record Type 'W81'.Data List /W81 14-19.Record Type 'W82'.Data List 1W82 14-19.Record Type 'W9 '.Data List /W9 14-19.Record Type 'W91'.Data List /W91 14-19.Record Type 'W92'.Data List 1W92 14-19.Record type other skip.End File Type.Execute.
************CommCDt: Recoding w0-w5 dates in ascending order*********
Compute MaxsMax (w0s,w01s).Compute Max1=Max (wls,wIls,w12s).Compute Max2=Max (w2s,w21s,w22s).Compute Max3=Max (w3s,w31s,w32s).Compute Max4=Max (w4s,w41s,w42s,w43s).
IF (u0s gt 1) viOsnw = MIN(w0s,w01s,wls,w11s,w12s,w2s,w21s,w22s,w3s,w31s,w32s,w4s,w41s,w42s,w43s) .
EXECUTE .
Do If (wls > 1).Do If (sysmis (wOsnw)).Compute w1snin(w1s,w1ls,w12s,w2s,s2 ls,v22s,w3s,w3ls,w32s,w4s,w4ls,w42s,w43s).Else IF (wls gt wOsnw).Compute wlsnwr--wls.Else IF (w Is LE wOsnw and wl Is gt wOsnw).Compute wlsnwil Is.End if.End if.
Compute MaxOlnw=Max(wOsnw,wlsnw).
Do If (w2s > 1).Do If (sysmis (vAsnw) and sysmis (wlsnw)).Compute w2snw=Min(w2s.w21s,w22s,w3s,w3 ls,w32s,w4s,w4 Is,w42s,w43s).Else IF (w2s gt MaxOlnw).Compute w2snw=w2s.Else IF (w2s LE MaxOlnw and w2IS gt MaxOlnw).
A-36 140

Compute w2snw=Min(w2ls.w22s).End if.End if
Compute Max012nw=Max (u)snw.w lsnw.w2snw).
Do If (w3s > 1).Do If (sysmis (wOsnw) and sysmis (wlsnw) and sysmis (w2snw)).Compute w3snw=Min(w3s.w3 Is.w32s.w4s,w41s,w42s,w43s).Else IF (w3s gt Max012nw).Compute w3snw=w3s.Else IF (w3s LE Ma.x012nw and w31S gt Max012nw).Compute w3sn%=w3 Is.Else if (w3s LE Max012nw and w31S LE Max012nw and w32s gt Max012nw).Compute w3snw=w32s.End itEnd if.
Compute Mx0123nwr-Max (wOsnw,w1snwm2snw,w3snw).
Do If (w4s > 1).Do If (sysmis (wOsnw) and sysmis (wlsnw) and sysmis (w2snw) and sysmis (w3snw)).Compute w4snw=Min(w4s,w41s,w42s,w43s).Else IF (w4s gt Mx0123nw).Compute w4snw=w4s.Else IF (w4s LE Mx0123nw and w41S gt Mx0123nw).Compute w4smv=w41s.Else if (w4s LE Mx0123nw and w41S LE Mx0123nw and w42s gt Mx0123nw).Compute w4snw=w42s.Else if (w4s LE Mx0123nw and w41S LE Mx0123nw and w42s LE Mx0123nw andw43s gt Mx0123nw).Compute w4snw=w43s.End if.End if.
If (max0 GE wIsnw)wlsnw=0.If (max() GE w2snw)w2snw=0.If (max° GE w3snw)w3snw=0.If (maxi) GE w4snw)w4snw.
(maxl GE w2snw)w2snw.If (maxl GE w3snw)w3snw.If (maxl GE w4snw)w4snw=0.If (max2 GE w3snw)w3snw-41.
(max2 GE w4snw)w4snw.If (max3 GE w4snw)w4snw.
Compute Max4e=Max(w4e,w4 le,w42e,w43e).
Compute w0sym-Trunc(wOsnw/10000).Compute lAsmo=Tnmc(wesnw/100)-(100'w0syr).Compute wOsday=(wOsnw-(10000'w0syr)-(100ew0smo)).COMPUTE Datew0s = DATE.MDY(w0smo.w0sday.w0syr) .EXECUTE .
A-37
141

Compute wlsyr=Trunc(wlsnw/10000Compute wIsmo=Trunct wlsnw/100)-(100*w I sr).Compute wIsdar---(wIsnw-(10000*wlsyr)-(100*w I smo)).COMPUTE Datewls = D ATE. MDY(w I smo.w I sday.wlsyr) .
EXECUTE .
Compute w2syr--,Trunc(w2snw/10000).Compute w2smo=Trunc(w2snw/100)-(1004'w2syr).Compute w2sdar(w2snw-(10000*w2syr)-(100*w2smo)).COMPUTE Datew2s = DATE.MDY(w2smo.w2sday,w2syr) .EXECUTE .
Compute w3syr=Trunc(w3snw/10000).Compute w3smo=Trunc(w3snw/100)-(100*w3syr).Compute w3sdar(w3snw-(1000041w3syr)-(10010w3smo)).COMPUTE Datew3s = DATE.MDY(w3smo,w3sday,w3syr) .EXECUTE .
Compute w4syr-Tnmc(w4snw/10000).Compute w4smo=Tnmc(w4snw/100)-(100*w4syr).Compute w4sdar(w4snw-(10000*w4syrX100*w4smo)).COMPUTE Datew4s = DATE.MDY(w4smo,w4sday,w4syr) .EXMCUTE .
Compute w4yrTninc(max4e/10000).Compute w4moe=Tmnc(max4e1100X10041w4yre).Compute w4daye=(max4e-(10000*w4yre)-(100*w4moe)).COMPUTE Datew4e = DATE.MDY(w4moe,w4daye,w4yre) .EXECUTE .
Compute dwOw1=datew1s-datew0s.Compute mnthw0wl=(dwOw1/86400)/30.
Compute dw0w2=datew2s-datew0s.Compute mnthw0W2=(dw4)w2/86400)/30.
Compute dwOw3=datew3s-datew0s.Compute mnthwOw3=(dwOw3/86400)/30.
Compute dwOw4=datew4s-datew0s.Compute mnthwOw4=(dwOw4/86400)/30.
Compute dw1w2=datew2s-datewls.Compute mnthw1w2=(dw1w2/86400)/30.
Compute dw1w3=datew3s-datewls.Compute mnthw1w3=(dw1w3/86400)/30.
Compute dw1w4=datew4s-datewls.Compute mnthw1w4=(dw1w4/86400)/30.
Compute dw2w3=datew3s-datew2s.
A-38

Compute mnthw2w3=(dw2w)/86400)/30.
Compute dw2w4=datew4s-datew2s.Compute mnthw2w4=(dw2w4/86400)/30.
Compute dw3w4=datew4s-datew3s.Compute mnthw3w4=(dw3w4/86400)/30.
Compute dw4w4e=datew4e-datew4s.Compute mntw4w4e=(dw4w4e/86400)/30.
************Comments:Recoding w5-w9 dates in ascending order*********"*
Compute MaX5=Max (w5s,w51s).Compute Max6=Max (w6s,w61s).Compute Max7=Max (w7s,w71s).Compute Max8=Max (w8s,w81s).Compute Max9=Max (w9s,w91s).
IF (w5s gt 1) wisnw = MIN(w5s,w51s,w6s,v6ls,w7s,w71s,w8s,w81s,w9s,w9ls).
EXECUTE .
Do If (w6s > 1).Do If (sysmis (w5snw)).Compute w6snw=Min(w6s,w6 1 s,W7s,w71s,w8s,w8ls,w9s,w9ls).Else IF (w6s gt w5snw).Compute w6sms=w6s.Else IF (w6s LE w5snw and w6ls gt w5snw).Compute w6snw=w6 Is.End ifEnd if.
Compute Max56nw=Max(w5snw,w6snw).
Do If (w7s > 1).Do If (sysmis (w5snw) and srmis (w6snw)).Compute wlsnw=Min(w7s,w71s,w8s,w8ls,w9s,w9ls).Else IF (wls gt Max56nw).Compute w7snw=w7s.Else IF (w7s LE Max56nw and w7ls gt Max56nw).Compute w7snw=w71s.End if.End if.
Compute Max567nw,---Max (w5snw,w6snw,w7snw).
Do If (w8s > 1).Do If (sysmis (w5snw) and sysmis (w6snw) and sysmis (w7snw)).Compute w8snw=Min(w8s,w8ls,w9s,w91s).Else IF (w8s gt Max567nw).Compute w8snw=w85.
A-39
143

Else IF (w8s LE Max567nw and w81S gt Max567nw).Compute w8snw=w31s.End if.End if
Compute Mx5678nw=Max (w5snw.w6snw.w7snw.w8snw).
Do If (w9s > 1).Do If (sysmis (w5snw) and sysmis (w6snw) and sysmis (w7snw) and sysmis (w8snw)).Compute w9snw=Min(w9s.w9 Is).Else IF (w9s gt Mx5678nw).Compute w9snw=w9s.Else IF (w9s LE Mx5678nw and w9 Is gt Mx5678nw).Compute w9str4,91s.End ifEnd if
If (max5 GE w6snw)w6snw.If (max5 GE w7snw)w7snw=0.If (max5 GE w8snw)w8snw=0.If (max5 GE w9snw)w9snw=0.If (max6 GE w7snw)w7snv -r=0.If (max6 GE w8snw)w8snw=0.If (max6 GE w9snw)w9saw=0.If (max7 GE w8snw)w8saw=-0.If (max7 GE w9snw)w9snw=0.If (max8 GE w9snw)w9snw.--0.
Compute w5syr=Trunc(w5snw/10000).Compute w5smo=Tninc(w5snw/100)-(100*w5sYr).Compute w5sdar(w5snw-(10000*w5syr)-(100*w5smo)).COMPUTE Datew5s = DATE.MDY(w5smo,w5sday,w5syr) .
EXECUTE .
Compute w6syr----Trunc(w6snw/10000).Compute w6smo=Trunc(w6snw/100)-(100*w6syr).Compute w6sdar(w6snw-(1000010w6syr)-(100*w6smo)).COMPUTE Datew6s = DATE.MDY(w6smo,w6sday,w6syr) .EXECUTE .
Compute w7syr=Trunc(w7snw/10000).Compute w7smo=Trunc(w7snw/100)-(100*-vi7syr).Compute w7sdar(w7snw-(10000*w7syr)-(100*w7smo)).COMPUTE Datew7s = DATE.MDY(w7smo,w7sday,w7syr) .EXECUTE .
Compute w8syr=Trunc(w8snw/10000).Compute w8smo=Trunc(w8snw/100)-(10010w8syr).Compute w8sdar(w8snw-(10000*w8syr)-(100*w8smo)).COMPUTE Datew8s = DATE.MDY(w8smo,w8sday,w8syr) .
EXECUTE .
Compute w9sr=Trunc(w9snw/10000).Compute w9smo=Trunc(w9snw/100)-(100*w9syr).Compute w9sdar---(w9snw-( 10000*w9syrH100*w9smo)).COMPUTE Datew9s = DATE.MDY(w9smo,w9sday.w9sYr) -
EXECUTE .
A-4014 4

Compute Max9e=Max(w9e.w9 le).Compute w9yre=Trunc(max9e/l0000).Compute w9moe=Trunc(max9e/ 00)-(100*w9yre).Compute w9daye=(max9e-(I00004'w9yre)-( lOOw9moe)).COMPUTE Datew9e = DATE.MDY(w9moe,w9daye,w9yre) .
EXECUTE .
Compute dw5w6=datew6s-datew5s.Compute mnthw5w6=(dw5w6/86400)/30.
Compute dw5w7=datew7s-datew5s.Compute mnthw5w7=(dw5w7186400)/30.
Compute dw5w8=datew8s-datew5s.Compute mnthw5w8=(dw5w8/86400)/30.
Compute dw5w9=datew9s-datew5s.Compute mnthw5w(dw5w9/86400)/30.
Compute dw6w7=datew7s-datew6s.Compute mnthw6w7=(dw6w7/86400)/30.
Compute dw6w8=datew8s-datew6s.Compute mnthw6w8=(dw6w8/86400)/30.
Compute dw6wdatew9s-datew6s.Compute mnthw6w9=(dw6w9/86400)/30.
Compute dw7w8=datevt8s-datew7s.Compute mnthw7w8=(dw7w8/86400)/30.
Compute dw7w9=datew9s-datew7s.Compute mnthw7w9=(dw7w9/86400)/30.
Compute dw8w9=datew9s-datew8s.Compute mnthw8w9=(dw8w9/86400)/30.
Compute dw9w9e=datew9e-datew9s.Compute nantw9w9(dw9w9e/86400)/30.
********Comments: Recoding of Survey Data and Computation of Censored Data compute**********enddate = date.mdy(5,1,97).COMPUTE rdesdate = datefls .
IF (missing(rdesdate)) rdesdate = datens.IF (missing(rdesdate)) rdesdate = datef3s.IF (missing(rdesdate)) rdesdate = datef4s.IF (missing(rdesdate)) rdesdate = datef5s.
compute #m0 = min(datewls.datew2s,datew3s,datew4s,rdesdate).compute #ml min(datew2s,datew3s,datew4s,rdesdate).compute #m2 min(datew3s,datew4s,rdesdate).compute #m3 min(datew4s,rdesdate).
A-41 1 5

compute 4m5 = mi n(datev 6s.datew7s.datew8s,datew9compute #m6 = min(datew7s.datew8s.datew9s).compute #m7 = min(datew8s.datew9s).if(duMsrvy < datew0s I (missing(datew0s) & (dwOsrvyif(dwIsmy < datew Is (missing(datew Is) & (dw lsrvyif(dw2srvy < datew2s Onissing(datew2s) & (dw2srvyif(dw3srvy < datew3s I (missing(datew3s) & (dw3srvyif(dw4srvy < datew4s I (rnissing(datew4s) & (dw4srvydw4sny.if(dw5srvy < datew5s I (rnissing(datew5s) & (dw5srvyif(dw6srvy < datew6s I Onissing(datew6s) & (dw6srvyif(dw7srvy < datew7s I Onissing(datew7s) & (dw7srvyif(dw8srvy < datew8s I (missing(datew8s) & (dw8srvydw8srvy.if(dw9srvy < datew9s I (missing(datew9s) & (dw9srvyexecute.
s).
< #m0 I missing(#m0)))) datew0s = dwOsrvy.< #ml I missing(#mI)))) datew Is = dw 1 srvy.< otm2 I rnissing(#m2)))) datew2s = dw2srvy.< #rn3 I missing(#m3)))) datew3s = dw3srvy.< rdesdate I missing(rdesdate)))) datew4s =
< #m5 I missing(#m5)))) datew5s = dw5srvy.< #m6 I missing(#m6)))) datew6s = dw6sny.< #m7 I missing(#m7)))) datew7s = dw7srvy.< datew9s I missing(datew9s)))) datew8s =
> 0))) datew9s = dw9srvy.
compute mnthwOw 1 = Ssysmis.compute mnthwOw2 = Ssysmis.compute mnthwOw3 = Ssysmis.compute mnthwOw4 = Ssysmis.compute mnthwOrd = Ssysmis.compute mnthw1w2 = Ssysmis.compute mnthw1w3 = Ssysmis.compute mnthw1w4 = Ssysmis.compute mnthwl rd = Ssysmis.
mnthw2w3compute mnthw2w4 = Ssysmis.compute mnthw2rd = Ssysmis.compute mnthw3w4 = Ssysmis.compute mnthw3rd = Ssysmis.compute mnthw4rd = Ssysmis.IF (datew0s > 1 and datewls > 1) MNTHWOW1 = (datewls - datew0s)/(60*60*24*30).LF (datew0s > 1 and datew2s > 1) MNTHWOW2 = (datew2s - datew0sy(604160*24*30).IF (datew0s > 1 and datew3s .> 1) MNTHWOW3 = (datew3s - datew0s)/(604160.24*30).IF (datew0s > 1 and datew4s > 1) MNTHWOW4 = (datew4s - datew0s)/(60*60*24*30).IF (datew0s > 1 and rdesdate > 1) MnthwOrd = (rdadate - datew0s)/(60.60*24*30).IF (datewls > 1 and datew2s > 1) MNTHW1W2 = (datew2s - datewls)/(60*60*24*30).IF (datewls > 1 and datew3s > 1) MNTHW1W3 = (datew3s - datewls)/(60*60*24*30).IF (datewls > I and datew4s > 1) MNTHW1W4 = (datew4s - datewls)/(60*60*24*30).IF (datew Is > 1 and rdesdate > 1) MnthwIrd = (rdesdate - datewls)/(60*60*24*30).IF (datew2s > 1 and datew3s > 1) MNTHW2W3 = (datew3s - datew2s)/(60*60*24*30).IF (datew2s > I and datew4s > 1) MNTHW2W4 = (datew4s - datew2s)/(60*60*24*30).IF (datew2s > 1 and rdesdate > 1) Mnthw2rd = (rdesdate - datew2s)/(60*60*24*30).IF (datew3s > 1 and datew4s > 1) MNTHW3W4 = (datew4s - datew3s)/(60*60*24*30).IF (datew3s > 1 and rdesdate > 1) Mnthw3rd = (rdesdate - datew3s)/(60*60*24*30).IF (datew4s > 1 and rdesdate > 1) Mnthw4rd = (rdesdate - datew4s)/(60*60*24*30).compute status0 = 0.compute statusl = 0.compute status2 = 0.compute status3 = 0.compute status4 = 0.IF (mnthwOwl> 0 or mnthwOw2 > 0 or mnthwOw3 > 0 or mnthwOw4 > 0 or mnthwOrd > 0) status() = 1 .IF (mnthw1w2 > 0 or mnthw1w3 > 0 or mnthwlw4 > 0 or tnnthwIrd > 0) statusl = 1.
AI2 146

IF ( rnnthw2w3 > t) or innthw2w4 > 0 or mnthw2rd > 0) status2 = 1 .
IF (mnthw3w4 > 0 or mnthw3rd > 0) status3 = 1 .
if (mnthw4rd > 0) status4 = 1.value labelsstatus() statusl status2 status3 status40 "Censored" I "Moved Up".
if (datew0s > 1 & sysmis(MEAN(datewls, datew2s, datew3s, datew4s, rdesdate))) wOcensor = 1.if (datewls > L & sysmis(mean(datew2s, datew3s, datew4s, rdesdate))) wlcensor = 1.if (datew2s > L & sysmis(mean(datew3s, datew4s, rdesdate))) w2censor =1.if (datew3s > 1 & sysmis(mean(datew4s, rdesdate))) w3censor = 1.if (datew4s > 1 & sysmis(rdesdate)) w4censor = 1.value labelswOcensor w lcensor w2censor w3censor w4censor1 "Ceniored at Level".
DO IF (wOcensor = 1) .
compute mnthwOwl = (enddate - datew0s)/(60*60*24*30) .
compute mnthwOw2 mnthwOwl.compute mnthw0w3 = mnthwOwl.compute mnthwOw4 = mnthwOwl.compute mnthwOrd = mnthwOwl.
END IF.DO IF (w1censor = 1).compute mnthw1w2 = (enddate - datewls)/(60*60*24*30) .
compute mnthw1w3 = mnthw1w2.compute mnthw1w4 = mnthw1w2.compute mnthwIrd = mnthw1w2.
END IF.DO IF (w2censor = 1).compute mnthw2w3 = (enddate - datew2s)/(60*60*24*30) .
compute mnthw2w4 = mnthw2w3.compute mnthw2rd = mnthw2w3.
END IF.DO IF (w3censor = 1).compute mnthw3w4 = (enddate - datew3s)/(60*604144130) .compute mnthw3rd = mnthw3w4.
END IF.DO IF (w4censor = 1).compute mnthw4rd = (enddate - datew4s)/(604160424*30) .
END IF.execute.RECODE
mnthwOrd mnthwIrd mnthw2rd mnthw3rd mnthw4rd (Lowest thru 0=SYSMIS)EXECUTE .
******4.*************Cemm.nrs: Defining Transiency Fdelp****************************
SETBLANKS=SYSMIS BLANKS=SYSMIS
UNDEFINED=WARN.DATA LIST
FILE&c:\Share\SAUSD data\transrte.dats FIXED RECORDS=1 TABLE /1 stndid 1-6 schl 7-8(A) schlyr 9-10 scltrm 11-11 date 12-17 recortyp 18-19(A) code 20-22(A) .
EXECUTE.
A-43 4 7
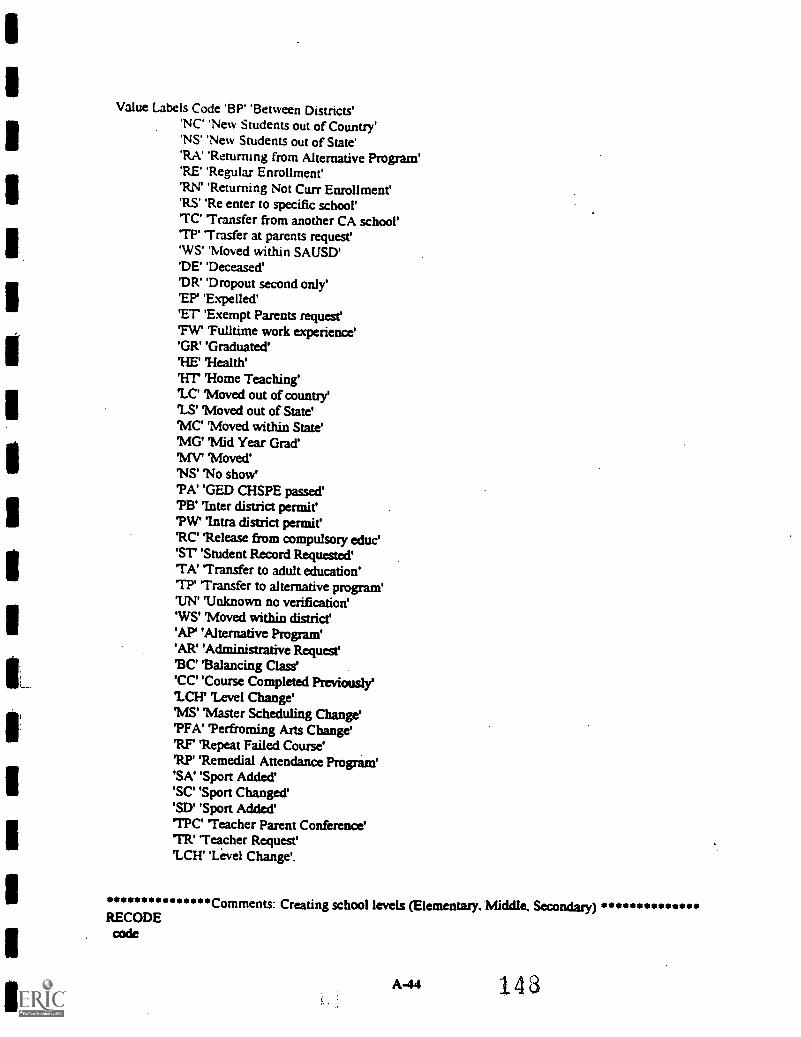
I.
111L.
Value Labels Code 'BP' 'Between Districts''NC' 'New Students out of Country''NS' 'New Students out of State''RA"Returning from Alternative Program''RE"Regular Enrollment''RN' 'Returning Not Curr Enrollment''RS"Re enter to specific school''TC' 'Transfer from another CA school''TP' 'Trasfer at parents request''WS"Moved within SAUSD''DE"Deceased''DR"Dropout second only''EP"Expelled''ET 'Exempt Parents request''FW 'Fulltime work experience''GR"Graduated''HE' 'Health''HT 'Home Teaching''LC' 'Moved out of country''LS' 'Moved out of State''MC' 'Moved within State''MG' 'Mid Year Grad''MV' 'Moved''NS' 'No show'?A"GED CHSPE passed'?B' Inter district permit'PW Intra district permit'11C"Release from compulsory educ''ST' 'Student Record Requested''TA' "Transfer to adult education'TP' Transfer to alternative program''UN' 'Unknown no verification''WS' 'Moved within district''AF 'Alternative Program''AR"Administrative Request''BC' 'Balancing Class''CC"Course Completed Previously'ICH"Level Change''MS' 'Master Scheduling Change'?FA' 'Perfroming Arts Change''RF' 'Repeat Failed Course''RP"Remedial Attendance Program''SA"Sport Added''SC"Sport Changed''SD"Sport Added''TPC' 'Teacher Parent Conference''TTR' Teacher Request''LCH"Level Change'.
******* ******* *Comments: Creating school levels (Elementary. Middle, Secondary) **************RECODEcode
A-44 143

('ACC'=1) ('AP'=2) ('AR'=3) ('BP'=4) ,('CC'=5) ('DE'=6) ('DR'=7)CEP'=8) ('ET=9) ('FC'=10) ('FW'= I I) ('GR'= 12) ('HE=13) ('HT=14)('LC'=15) ('LS'=16) ('MC'=17) ('MG'=18) CMS'=19) ('MV=20) ('NC'=21)('NS'=22) CP7'=23 (P9'=24) ('PB'=25) (PR'=26) (PW=27)
('RA'=28) CRC'=291 ('RE'=30) ('RS'=31) ('RU'=32) ('TN=33) ('TC=34)(TP'=35) ('TR'=36) ('UN'=37) ('WS'=38) INTO Codenw..
EXECUTE .
Recode Schl('A 1'.'A2'.'A3'.'A4'=51)('51'=51)('54'=54)('B 1 '.'B2',"B3VB4'=52)(62'.'C4'=62)('D 1 '.D2',D3','D4'=54)('R I ','R2',113','R4'=94)('70'=70)('55'=55)
('58'=58)('W l','W2','W3'.'W4'=92)('98';C6';C7VC8';C9'=98)('01'.'02','03','G4'=59)('H1',112',113','H4'=60)('J1'32'33','.14'=61)('K 1'I(2','K3','K4'=63)('77'=77)('64'=64)('L1',1.2',13','L4'=65)('66'=66)(P 1',P2',133','P4'=43)('75=75)(VM11,1v12VM3',144'=67)('68'=68)(116',717',118',749'=69)C69'=69)(13'=73X'42'=42)(136',137',138',119'=97)(`Z1',7.2',7.3',74'=71X'N1','N2','N3','N4'=72)('D6',V7',D8',D9'=83)('L6',1.71,'Llr,'L9'=80X191=79)('85'=85)('S6','S7'.'S8','S9'=78)CE6','E7' ,'ESVE9'=87)C841=84)('9 l'=91)('901=90)(176'=76)(16'=86)(11'=81)('82'=82)(183'=83)C87'=87)('95'=95)into schlnme.
Recode schInme(50,95,51,52,62,54,94,70,55,93,56,57,58.92,98,59,60,61,63,77.64,65,66,43,75,67,68,69,73,42.97,71.72=1)(83,80,79,85,78,87,84=2)(91,90,76,86,81,82=3)into schltyp.
Variable Labels schltyp 'Type of School'.Value Labels schltyp rElementary'
2'Middle'3'High School'.
USE ALL.
COMPUTE filter_S=(codenw31 and dummyl=stndid and dschlyr--schlyr anddschInme=schlnme and dcode=codenw).
VARIABLE LABEL filter $ 'codenw30=1 and dummyl=stndid and dschlyr=schlyr' dschlnme=schlnme and dcode=codenw (FILTER)'.VALUE LABELS filter." 0 'Not Selected' 1 'Selected'.FORMAT filter_S ((1.0).FILTER BY filter_S.EXECUTE .
COMPUTE Dschlnme = LAG(schlnme)EXECUTE .
COMPUTE Dummyl = LAG(stndid) .
EXECUTE .
USE ALL.COMPUTE filter S=(codenw=30 and dummyl=stndid and dschInme=schInme).VARIABLE LABEL filter_S 'codenw=30 and dummyl=stndid and dschInme=schInme+' (FILTER)'.
VALUE LABELS filter_S 0 'Not Selected' 1 'Selected'.FORMAT filter_S ((1.0).
A-45
149

FILTER BY filter_SEXECUTE
COMPUTE Dschlnme = LAG(schInme)EXECUTECOMPUTE Dummy I = LAG(stndid) .
EXECUTE .
COMPUTE Dcodenw = LAG(codenw) .
EXECUTE .
COMPUTE Dschlyr = LAG(schlyr) .
EXECUTE .
COMPUTE Ddate = LAG(date) .
EXECUTE .
USE ALL.COMPUTE filter_S=(stndid=dummyl and dschInme=schInme and dcodenw--codenw andddate=date).
VARIABLE LABEL filter S 'stndicfr-dummy I and dschInme=schInme and'+' dcodenvr--codenw and ddatL--date (FILTER)'.
VALUE LABELS filter S 0 'Not Selected' 1 'Selected'.FORMAT filter_S (MO).FILTER BY filter S.EXECUTE .
Temporary.Select if (sysmis(relend)).Frequencies variables=stndid.COMPUTE Dschlnme = LAG(schInme) .
EXECUTE .
COMPUTE Dummyl = LAG(stndid) .
EXECUTE .
COMPUTE Dcodenw = LAG(codenw) .
EXECUTE .
COMPUTE Dschlyr = LAG(schlyr) .
EXECUTE .
COMMTE Ddate = LAG(date) .
EXECUTE .
USE ALL.COMPUTE filter S=(dummyl=stndid and dschInmenchInme).VARIABLE LABEL filter S 'clummyl=stndid and dschInme=schInme (FILTER)'.VALUE LABELS filter S 0 'Not Selected' I 'Selected'.FORMAT filter_S (fLO).FILTER BY filter_S.EXECUTE .
USE ALL.COMPUTE filter_S=(dummyl=stndid and dschlnme=schInme and dschlyr=scblyr).VARIABLE LABEL filter S 'clummyl=stndid and dschInme=schInme and'+' dschlyr=schlyr (FILTER)'.
VALUE LABELS filter_S 0 'Not Selected' I 'Selected'.FORMAT filter_S (fl.0).FILTER BY filter_S.EXECUTE .
IF (dummy l=stndid) diffdte = date-ddate .
EXECUTE .
A-46 150

Temporary.Select if (stnschl= 1 ).Frequencies vanables=diffdte.Temporary.Select if (stnschl= 1 ).Frequencies vanables=codenw.
Teacher info Definition******************
Variable label TBDATE 'Teacher Birth Date'THDATE Teacher Date of Hire'EDUCLVL 'Education level of teacher'
CRCODE1. CRCODE2. schlnmeCRCODE3,CRCODE4. CRCODE5, CRCODE6 'Credential Code'
CRCATG I. CRCATG2. CRCATG3,CRCATG4, CRCATG5, CRCATG6 'Credential Category'.
Value Labels EDUCLVL 'A"Associate''B' 'Bachelor''C"Credential''M' 'Master''F 'Doctorate?
Crcatgl, Crcatg2, Crcatg3, Crcatg4, Crcatg5, Crcatg6'A' 'Life''B"Clear''C"Prelimanry''D' Partial Fulfillment''E' 'Emergency''F Provisional''G' 'Temp County Certificate''H' 'Intern''I"1 Yr non-renewable''J' Professional Clear''K"Supplementary Authoriz''L"Comm College DSPS Waiver'It"Restricted''W' 'Waiver''Z"Conditional Life?
CRCODE1, CRCODE2, CRCODE3,CRCODE4, CRCODE5, CRCODE6'AA"Administrative Savices''AB"Voc FT-SUPV and Coordination''AC"STD Adminstntion''AD"Standard Supervision''AE"General Admin''AF 'Secondary Admin''AG' 'Elementary Admin''AFL' 'Sec Admin Trd and indust ed''ArSecondary Supervision''AT 'Elementary Supervision''AK' 'Vocational Supervisor''AL"Supervisor Credential''AO"Child Well ATTD Supervisor''BA"Mult Subj Bil EMPH BCC''BB"Single Sub bil EM141''BC"Bil Cat of Compt'
151A-47

'BD"1:3 I Cross Cult Spec''BE"Lang Dev Spec Cert''BF' 'Bil Cert of Assess Comp''BG"BCC'BH"BCC'BI"BCC III''BrBCC IV''BK"LDS'BL"LDS Grandfathered''BM"Enroll in Biling Prog''BN"LDS Passed exam'1110"CLAD multi subj''BP"CLAD Cross Cult Lang acad dev''BQ' 'BCLAD Biling Cross Cult Lang A''CA"Child Dev prmt w supervision''CC' 'Develop Center Permit''CD"Chld Dev Pnnt chngd back''CE"Spec Center Permit''CF 'EC 8360 Preschl 12 units w HE'DA' 'LTD Driver Trng Lab only Ryan''DB' 'Driver Trng Ryan Desig Subj'DC"F T Public Safe & Accd prey dr'DD"Public Safety Accd prey Dr Ed''DE"Gen and STD w units Dr Ed and Trn''EA"General Adult Education''EB"Adult ED Lip Rdg Hard of Heari''EC"SDS Adult Educ F T or P'HA' 'Healthy Services Specialist'1EB"School Physician P 1''HC' 'Nurse STD Desig Subj'RID"Clin Psychol STd Des Health''HE"Sch Nurse Health and Dev''HF' 'School Physician License only''HG"Schl optometrist health and dev.HH 'Schl optometrist License only'Ht 'Schl Audiometrist License only'
'HT 'Schl Audiologist License only''LA' 'Librarian Lib Media Tchr Ryan'ILB"SiD Librarian Elem K-9 K-12''LC"STD Librarian Sec K-9 K-12''LD"STD ECE Librarian K-3 K-12''LE"Librarian STD LTD SPEC PREOCIF'LF 'General Librarianship''MA"Gifted Specialist'Tv1B"Mathematics Specialist''MC' 'Health Specialist''MD"Agriculture Specialist''ME' 'Military Science''MF 'SID Design Sub Aviation''MG' 'Milit Drill STD Des Subj''MH"S1D DES FT PT Bus ED''MT 'DES Subj FT Foreign Language STD''MK"DEs Subj Afro American STD''ML"Special Sec Aviation'
A-48

'MM"Special Sec Art''MN"Spec Sec Bus Ed FT or PT''N,Q3' 'Spec Sec Homemaking''MR"Spec Sec indust Arts''MS"Spec Sec Music''MT"Spec Sec Music Limited Serv''MU"Nursng ED Usk filth ED Spec Sec''MV' 'Special Sec Physical Ed'MW"Special Sec Speech Arts'PA"Ryan Pupil Personnel'PB"Psychologist PPS Ryan'PC"Basic PPS Standard'PD"Psychometrist PPS STD DES SERV'PE"Psychologist PPS SID DES Service'PF 'Soc Worker PPS STD Des Service'PG' Pupil Pers Basic General'PH Psychometrist PPS General''Pr 'Psychol PPS General''Pr 'Schl PSychol General FT PTPK"School Psychom General''RA' 'Reading Spec Ryan''RB' 'RDG Spec Miller Unruh''RC' 'Rstr RDG Spec MU RDG Spec''SA"Visually MCP Specialist''SB"Learning HDCP Specialist''SC' Physically HDCP Specialist''SD"Severely HDCP Specialist''SE"Commun HDCP Specicialiste'SG' 'Emerg Clirl Rehab w Spec CI Aut''SH 'Clin Rehab Lang Spch & Hearing''SI"Clin Rehab Lang Spch Hrg Audio''Sr 'Clint Rthab Orientat and Mobility''SK' 'Resource Spec Cert of Competen''SL"Adaptive Physical Education''SM' 'Clin Rehab Audiology Only''SN' 'Visually HDCP STD elem''SO' 'Visually HDCP STD Sec''SF 'Visually HDCP Restricted''SR"Visually HDCP in mobility''SS' 'Deaf and Hard of Hear STD dem''ST 'Deaf and Hard of Hear STD sec'
'RSTR Deaf and Hard of Hearing''SV' 'RSTR Deaf and Blind and LTD Spec PRP''SX 'Speech and Hear HDCP SID ekm''SY' 'Speech and Hearing HDCP STD Sec''SZ' 'RSTR Speech and Hearing Therapy''TA' 'Multiple Subject'TB"Single Subject'TC"Early Childhood Educ Spec'ID' 'Emergency Limited Assignment'TE' 'Emergency Limited Authorization'Tr 'Emergency 30 day substitute''TG"Standard Elementary''TH' 'Standard Secondary'
A49 153

'TI"Earl Childhood Education'1.1"KG Pninary''TK"General Elem''TL"Elem and Junior High''TM"Junior High''TN"General Secondary''TO"Exchange Teacher'TP' 'Sojourn Teacher''TR"Eminence''TS"ED code 44258B sunset June30 92'IT 'Int Schl 6 12 units w elem CRED'TU"Int Schl 6 12 units w sec cred'TV 1-ligh Schl 9 18 units with cred ec'TW 'Int schl core block assign'TX 'HS Competitive Atheletics Ec'TY' 'Spec Skills Comm on Assign Aut'TZ' 'Non cred unique skills''VA"Voc FT Deisgnated Subject''VB"Voc FT Designated Subject''VC"Spec Subj FT DES SUB.! Ryan''VD' PT STD Designated Subjects''VE"Voc Agriculture STD Design Sub'
'Voc Agriculture Special Sec''VI"Voc CLS A TRD IND PB SV ED SP'VT 'Voc Cls B TRD TECh Sub RLT SPE'VK"Voc Cls CI CRD TRD IN PBL SPEC''VL"Voc Cls D TRD IN PBL SRV ED SP'VM' 'Indus and voc SDS FT and PT''VO"Indus Arts and occup SDS FT PT'XA' 'Mentally Retarded STD elem LTD''CB' 'Mentally Retarded STD Sec LTD''XC' 'Educable mental retard STD elem''XD"STD SEC educable Mr K-12''XE' 'Res Educable mentally retarded''XF 'Res trainable mentally retarded''XG"Orthopedically HDCP SID elem''XH' 'Orhopedically HDCP STD sec'la' 'Restricted Orthopedically MCP''XT 'Visually HDCP Except Child''XK' Deaf and Hard hearing Except Child''XL"Speech Corr and Lip Reading Except C''XNA' 'Mentally retarded Except Child''XN' 'Orthopedically IIDCP except child''XO"Corr of Speech Defects Aphasia'
Tchg of the Blind Spec See'XR' TChg of the Part Sight Spec SE''XS' Tchg of the Deaf Spec sec''XT 'Tchg LIP RDG Spec Sec''XU' TChg of Mentally retarded Spec'.
Variable label TBDATE 'Teacher Birth Date'THDATE 'Teacher Date of Hire'EDUCLVL 'Education level of teacher'
CRCODE I. CRCODE2. schlnme
A-50
15 4

CRCODE3.CRCODE4. CRCODE5. CRCODE6 'Credential Code'CRCATG t. CRC ATG2. CRC ATG3.CRCATG4. CRCATG5. CRCATG6 'Credential Category'.
Value Labels EDUCLVL 'A"Associate''B"Bachelor''C"Credential''M"Master'13"Doctorate7
Crcatgl, Crcarg2. Crcatg3. Crcatg4, Crcatg5, Crcatg6'A"Life''B"Clear''C"Prelimanry'D"Partial Fulfillment''E"Emergency''F' Provisional''G' Temp County Certificate''H' 'Intern'T '1 Yr non-renewable''T Professional Clear''K"Supplementary Authoriz'V 'Comm College DSPS Waiver''R' 'Restricted''W' 'Waiver'2"Conditional Life'/
CRCODE1, CRCODE2. CRCODE3.CRCODE4, CRCODE5. CRCODE6'AA"Administrative Services''AB"Voc FT-SUPV and Coordination''AC"STD Adminstration''AD"Standard Supervision''AE"General Admin''AF 'Secondary Admin''AG' 'Elementary Adrnin''AH"Sec Admin Trd and indust ed''AI"Secondary Supervision''AT 'Elementary Supervision''AK' 'Vocational Supervisor''AL"Supervisor Credential''AO"Child We If ATM Supervisor''BA' 'Mu It Subj Bil EMPH BCC''BB"Single Sub bil EMPIr'BC' 'Bil Cert of Compt''ED' 'Bil Cross Cult Spec''BE"Lang Dev Spec Cert'BF' 'Bil Cert of Assess Comp''SO' 'BCC I''BIT BCC II''BI' 'BCC'Br 'BCC IV'BK' 'LDS I''EL' 'LDS Grandfathered'`BM"Enroll in Biting Prog''BN 'LDS Passed exam'130"CLAD multi subj''BP"CLAD Cross Cult Lang acad dev'
A-51 5 3

'BQ"BCLAD Biling Cross Cult Lang A''CA"Child Dev prmt w supervision''CC"Develop Center Permit''CD"Chld Dev Print chngd back''CE"Spec Center Permit''CF"EC 8360 Preschl 12 units w HE''DA"LTD Driver Trng Lab only Ryan''DB"Driver Trng Ryan Desig Subj'DC"F T Public Safe & Accd prey dr''DD"Public Safety Accd prey Dr Ed''DE"Gen and STD w units Dr Ed and Tm''EA"General Adult Education''EB"Adult ED Lip Rdg Hard of Heari''EC"SDS Adult Educ F T or P'HA' 'Healthy Services Specialist''HB"School Physician P T'HC' 'Nurse STD Desig Subj''FiD"Clin Psychol STd Des Health''HE"Sch Nurse Health and Dev''HF 'School Physician License only''HG"Schl optometrist health and dev''HH"Schl optometrist License only''HI"Schl Audiomenist License only''HT 'Schl Audiologist License only''LA' 'Librarian Lib Media Tchr Ryan''LB"STD Librarian Elem K-9K-12''LC"STD Librarian Sec K-9 IC42''LD"STD ECE Librarian K-3 IC42''LE' 'Librarian STD LTD SPEC PREOOP''LF 'General Librarianship''MA"Gifted Specialist''MB"Mathematics Specialist''MC' 'Health Specialist''MD"Agriculture Specialist''ME' 'Military Science''MF' 'S'ID Design Sub Aviation''MG' 'Mint Drill S'ID Des Subj''MH"S'ID DES FT PT Bus ED''MI' DES Subj FT Foreign Language STD''MK' DEs Subj Afro American STD''ML"Special Sec Aviation''Mlsif 'Special Sec Art''MN"Spec Sec Bus Ed FT or PT''MP"Spec Sec Homemaking'`MR"Spec Sec indust Arts''MS"Spec Sec Music''MT 'Spec Sec Music Limited Serie'MU' 'Nursng ED INc Filth ED Spec Sec''MV' 'Special Sec Physical Ed''MW' 'Special Sec Speech Arts''PA"Ryan Pupil Personnel'PB"Psychologist PPS Ryan''PC"Basic PPS Standard''PD"Psychometrist PPS STD DES SERV'
A-52 156

'PE"Psychologist PPS STD DES Service''PF"Soc Worker PPS STD Des Service'PG"Pupil Pers Basic General'TH"Psychometrist PPS General''PI"Psychol PPS General''Pl"Schl PSychol General FT PT''PK' 'School Psychom General''RA"Reading Spec Ryan'RB"RDG Spec Miller Unruh'RC"Rstr RDG Spec MU RDG Spec''SA"Visually HDCP Specialist''SB"Learning HDCP Specialist''SC"Physically HDCP Specialist''SD"Severely HDCP Specialist''SE"Commun HDCP Specicialist''SG' 'Emerg Clin Rehab w Spec CI Aue
'Clin Rehab Lang Spch & Hearing''SI"Clin Rehab Lang Spch Hrg Audio''ST 'Clint Rehab Orientat and Mobility''SK' 'Resource Spec Cert of Competen''SL"Adaptive Physical Education''SM' 'Clin Rehab Audiology Only''SN' 'Visually HDCP STD elem'`SO"Visually HDCP STD Sec''SP' 'Visually HDCP Restricted''SR"Visually }MCP in mobility''SS' 'Deaf and Hard of Hear SID elem''ST 'Deaf and Hard of Hear STD sec''SU' 'RSTR Deaf and Hard of Hearing''SV' 'RSTR Deaf and Blind and LTD Spec PRP'SX' 'Speech and Hear HDCP STD elem''SY' 'Speech and Hearing HDCP STD Sec''SZ"RSTR Speech and Hearing Therapy''TA' 'Multiple Subject''TB"Single Subject''TC' 'Early Childhood Educ Spec''TD' 'Emergency Limited Assignment'TE' 'Emergency Limited Authorization''TF 'Emergency 30 day substitute''TG"Standard Elementary'TH' 'Standard Secondary'TT 'Early Childhood Education'11' 'KG Primary''TK"General Elem''TL' 'Elem and Junior High''TM' 'Junior High'TN"General Secondary''TO' 'Exchange Teacher'IP 'Sojourn Teacher'TR"Eminence''TS"ED code 44258B sunset June30 92''TT 'Int Schl 6 12 units w elem CRED''TU"Int Schl 6 12 units w sec cred''TV' 'High Schl 9 18 units with cred ec'
A-53 157

TW"Int schl core block assign''TX"HS Competitive Atheletics Ec''TY"Spec Skills Comm on Assign Aut''TZ"Non cred unique skills'VA"Voc FT Deisgnated Subject''VB"Voc PT Designated Subject''VC' 'Spec Subj FT DES SUBJ Ryan''VD"PT STD Designated Subjects''VE"Voc Agriculture STD Design Sub''VW 'Voc Agriculture Special Sec''VI"Voc CLS A TRD IND PB SV ED SP''VT 'Voc Cls B TRD TECh Sub RLT SPE''VK"Voc Cls Cl CRD TRD 11%1PBL SPEC''VL"Voc Cls D TRD EN PBL SRV ED SP''VM' 'Indus and voc SDS FT and pr'VO"Indus Arts and occup SDS FT PT'XA' 'Mentally Retarded SID elem LTD''XB' 'Mentally Retarded STD Sec LTD''XC' 'Educable mental retard SID elem''XD"STD SEC educable Mr K-12''XE' 'Res Educable mentally retarded''XF' 'Res trainable mentally retarded'WG"Orthopedically HDCP STD elem'
'Orhopedically HDCP STD sec''XI' 'Restricted Orthopedically HDCP''XT 'Visually HDCP Except Child'1CK' 'Deaf and Hard hearing Except Child''XL"Speech Corr and Lip Reading Except C''XM' 'Mentally retarded Except Child''XN"Orthopedically HDCP except child''XO"Corr of Speech Defects Aphasia''XP' Tchg of the Blind Spec Sec''XR' 'TChg of the Part Sight Spec SE''XS' Tchg of the Deaf Spec sec''XT Tchg LT RDG Spec Sec''XV TChg of Mentally retarded Spec'.
************Comments: Recoding Teacher information**************RECODEeduclvl ('A'='1') ('B'='2') ('M'='3') ('P'='41) .
EXECUTE .
Value Label educlvl I 'Associate'2 'Bachelor'3 'Masters'4 'Doctorate'.
RECODEcrcatgl crcatgIcrcatg3 crcatg4 crcatg5 crcatg6 (CONVERT)('A'=1) ('B'=1) (T=1) ('C'=2) ('E'=2) ('G'=2) ('lit=2) (Ihr=2)INTO crcatnw L crcatnw2 crcat3 nw crcatnw4 crcatnw5 crcatnvAS .
EXECUTE .
Value Label crcatnw 1 crcatnw2 crcat3nw crcatnw4crcatnw5 crcatnw6 !Tully credentialed'
21Not Fully cred'.
A-54 153

RECODEcrcodel crcode2 crcode3 crcode4 crcode5 crcode6(BA'=1) ('BC'=1) ('BD'=1) ('BG'=1) ('BI-P=1) (1:11'=1) ('BT=1)('BQ'=1) ('8K=2) ('BO'=2) ('BP'=2) (13E'=2) ('BL'-2) (SN'=2)('EC=3) ('SB'=3) ('HT=4) ('LE'=4) ('MA'=3) (rPC'=3) ('RA'=3)(TIB'=3) ('SB'=3) (SC'=3) ('VA'=3) ('TC=3) (PA'=4) ('XN4'=3)('SD'=3) ('SE'=3) ('SK'=3) ('SS'=3) ('SLP=3) ('SS'=3) ('SZ'=3)(TA'=3) (78'=3) (TF'=3) (TG'=3) (TH'=3) (IT=3) ('TT=3)("TK'=3) (TN1=3) (TP'=3) ('VB'=3) ('XC'=3) ('XG'=3) ('XN3)('W=3) ('AA'=4) ('CC=4) (CD'=4) ('SG'=4) INTO crcodnwl crcodnw2crcodnw3 crcodnw4 crcodnw5. crcodnw6 .
EXECUTE .
Value Labels crcodnwl crcodnw2 crcodnw3 crcodnw4crcodnw5 crcodnw6 1 'Bilingual Credential'
2 'Cultural Sensitivity credential'3 'Other instructional credentials'4 'Non instructional credentials'.
***********Comments: Creating Teacher categories in Subject and type of credentials **************
COUNTFCR = crcatnw 1 crcatnw2 crcat3nw crcatnw4 crcatnw5 crcatnw6 (1) .
EXECUTE .COUNTNFCR = crcatnwl crcatnw2 crcat3nw crcatnw4 crcatnw5 crcatnw6 (2) .
EXECUTE .
COUNTFbiling = crcodnwl crcodnw2 crcodnw3 crcodnw4 crcodnw5 crcodnw6 (1) .
EXECUTE .
COUNTNFbiling = crcodnwl crcodnw2 crcodnw3 crcodnw4 crcodnw5 crcodnw6 (5) .
EXECUTE .COUNT
Fcultr = crcodnwl crcodnw2 crcodnw3 crcodnw4 crcodnw5 crcodnw6 (2) .EXECUTE .
COUNTNFcultr = crcodnw 1 crcodnw2 crcodnw3 .crcodnw4 txcodnw5 crcodnw6 (6) .
EXECUTE .
COUNTFinstr = crcodnw 1 crcodnw2 crcodnw3 crcodnw4 crcodnw5 crcodnw6 (3) .
EXECUTE .
COUNTNFinstr = crcodnw 1 crcodnw2 crcodnw3 crcodnw4 crcodnw5 crcodnw6 (7) .
EXECUTE .
Do IF (nfcr ge 1 and fcr eq 0).Compute group=1.Else if (Finstr ge 1 and (crcodnw l=1 or crcodnw2=1 or crcodnw3=1. or crcodnw4=1or crcodnw5=1 or crcodnw6=1)).Compute group=3.Else if (Finstr ge 1 and (crcodnw1=5 or crcodnw2=5 or crcodnw3=5 or crcodnw4=5or crcodnw5=5 or crcodnw6=5)).
.15jA-55

Compute group=4.Else if (Finstr ge 1 and (crcodnwl=2 or crcodnw2=2or crcodnw5=2 or crcodnw6=2)).Compute group=5.Else if (Finstr ge 1 and (crcodnw1=6 or crcodnw2=6or crcodnw5=6 or crcodnw6=6)).Compute peup=6.Else if (Finstr ge 1).Compute group=2.End ifValue Labels group l 'No Full cred'
2'Full Cred istructional services'3'FC instr and FC biling'5'FC inst and FC cultural'.
or crcodnw3=2 or crcodnw4=2
or crcodnw3=6 or crcodnw4=6
******************Coraments: Recoded riew teacher categories in Ascending Order***************
RECODEgroup(1=1) (2=2) (5=3) (3=4) INTO groupie .
VARIABLE LABELS grouprc 'Groups recoded in order for analysis'.EXECUTE .
Value Labels grouprc 1No Full cred'2Tull Cred istructional services'3TC inst and FC cultural'4TC instr and FC Wine.
** ***** ***********Comments: Calculating Transition Rate from SABE to CTI3S******************Vector #ct(11).Vector #sa(11).Compute #ct(1)=RTC9402g.Compute #ct(2)=RTC9403g.Compute #ct(3)=RTC9410g.Compute #ct(4)=RTC9412g.Compute #ct(5)=RTC9502g.Compute #ct(6Ssysmis.Compute #ct(7)=RTC9511g.Compute #ct(8)=RTC9512g.Compute #ct(9)=RTC9602g.Compute #ct(10)=RTC9604g.Compute #ct(11)=RTC9704g.Compute #sa(1)=RTS9402g.Compute #sa(2)=RTS9403g.Compute #sa(3)=RTS9410g.Compute #sa(4)=RTS9412g.Compute #sa(5)=RTS9502g.Compute #sa(6)=RTS9504g.Compute #sa(7)=RTS9511g.Compute #sa(8)=RTS9512g.Compute #sa(9)=RTS9602g.Compute #sa(10)=RTS9604g.Compute #sa(11)=RTS9704g.
A-56 160

Loop #i=1 to 11.If (#sa(#i)>0)#k=#1.end loop.compute #j=O.Loop #i= to #K By -1.If (#ct(#i)>0)#j=#i.End loop.
Compute Tgrade=#ct(#j).
COMMENT *** THIS IS Variable calculations.sps.
COMIvIENT *** CALCULATE PROGRAM CODES FOR NON-LEP.
W (missing(bprogcde) & profcncy = 2) bprogcde = 8 .
IF (rnissing(bprogcde) & profcncy = 3) bprogcde = 9 .
COMMENT *** RECODE ORDER VARIABLE TO LIMIT TO THE SEVEN PROGRAMS.
RECODEorderl order2 order3 order4 order5 (2=1) (4=3) (6=5) (8=7) (19)(12=11) (14=13) (15=13) .
Value labelsorderl order2 order3 order4 order51 "TBE - Native Language"3 "TLC - Sheltered English"5 "Immersion - Native"7 "Immersion - Non-Native"9 "Immersion - No aide"11 "ELD Mainstream"13 "Mainstream only".
COMMENT **** Replace READING PROGRAM CODES IF SURVEY DATE PRECEDES FIRSTRECORDED DATE.
if (dy0srvy < datey0 I missing(datey0)) datey0 = dy0srvy.if (dylsrvy < datey 1 I missing(datey1)) dateyl = dylsrvy.if (dy2srvy < datey2 I missing(datey2)) datey2 = dy2srvy.if (dz5srvy < datez5 I missing(datez5)) datez5 = dz5srvy.execute.
COMMENT **** CALCULATE LATEST READING SERVICE CODE.
compute #y0 = max(datey0.datey01).compute #y = max(datey 1,datey11).compute #y2 = max(datey2.datey21).compute #z5 = max(datez5.datez51).compute readpgm = Ssysmis.do if mean (#y0.#yl.i.z5.#y2) > 0.
compute #yy = max(#y0,#y 1.#z5.#y2).(ISYY = tO) readp8m = 1.
if (#yy = #y1) readpgm = 2.
A-57 161
if (#yy = friz5) readpgm = 3.if (r*yy = gty readpgm = 4.
end if.variable labels readpgm "Latest Reading Service Code".value labels readpgm
"YO Native Language"2 "Y1 Transitional English"3 "Z5 Sheltered Immersion"4 "Y2 Mainstream English".
COMMENT *"* SET IDENTIFY CURRENT PLD LEVEL FOR EACH CURRENT ELD LEVEL.
If(datew5s > 0 & datew0s > 0) pldeld0 = 0.If(datew6s > 0 1 datew Is > 0) pldeldl = 0.If(datew7s > 0 1 datew2s > 0) pldeld2 = 0.If(datew8s > 0 & datew3s > 0) pldeld3 = 0.If(datew9s > 0 1 datew4s > 0) pldeld4 = 0.IF(datew5s <= datew0s) pldeld0 = 1.IF(datew5s <= datew Is) pldeldl = 1.IF(datew5s <= datew2s) pldeld2 = 1.TF(datew5s <= datew3s) pldeld3 = 1.IF(datew5s <= datew4s) pldeld4 = 1.IF(datew6s <= datew0s) pldeld0 = 2.IF(datew6s <= datewls) pldeldl = 2.IF(datew6s <= datew2s) pldeld2 = 2.EF(datew6s <= datew3s) pldeld3 = 2.IF(datew6s <= datew4s) pldeld4 = 2.IF(datew7s <= datew0s) pldeld0 = 3.IF(datew7s <= datewls) pldeldl = 3.IF(datew7s <= datew2s) pldeld2 = 3.IF(datew7s <= datew3s) pldeld3 = 3.IF(datew7s <= datew4s) pldeld4 = 3.W(datew8s <= datew0s) pldeld0 = 4.IF(datew8s <= datew Is) pldeldl = 4.IF(datew8s <= datew2s) pldeld2 = 4.IF(datew8s <= datew3s) pldeld3 = 4.IF(datew8s <= datew4s) pldeld4 = 4.IF(datew9s <= datew0s) pldeld0 = 5.IF(datew9s <= datewls) pldeldl = 5.IF(datew9s <= datew2s) pldeld2 = 5.IF(datew9s <= datew3s) pldeld3 = 5.IF(datew9s <= datew4s) pldeld4 = 5.variable labels
pldeld0 "PLD Level at Start of WO"pldeldl "PLD Level at Start of WI"pldeld2 "PLD Level at Start of W2"pldeld3 "PLD Level at Start of W3"pldeld4 "PLD Level at Start of W4".*
value labels pldeld0 pldeldl pldeld2 pldeld3 pldeld40 "PLD Dates too late"
"PLD Pre-Production"2 "PLD Early Production"3 "PLD Emergence"4 "PLD Intermediate"
A-58162

5 "PLD Advanced".compute disttime = (enddate - datestrt)/(604160024365.24).variable labels disttime "Time in SAUSD Schools".if(rtc9704 > -1 & rts9704 > -1) bothtestcompute lastrdnc = rts9704.if(missing(lastrdnc)) lastrdnc = rtc9704.variable labels lastrdnc "Last reading test NCE (SABE if both)".value labels lastrdnc 1 "SABE" 2 "CTBS".RECODE
rts9704(SYSMIS=SYSMIS) (ELSE=1) INTO lasttest .
if(missing(lasttest) & rtc9704 > -1) lasttest =2.1f(datew5s > 0 ) p1d9704 = 0.IF(datew5s <= tst9704) p1d9704 = 1.IF(datew6s <= tst9704) p1d9704 = 2.IF(datew7s <= tst9704) p1d9704 = 3.1F(datew8s <= tst9704) p1d9704 = 4.1F(datew9s <= tst9704) p1d9704 = 5.
COMMENT I'm CREATE NEW PROGRAM VARIABLE FROM READING PROGRAM DATA.
compute newtbe = Ssysmis.compute newimm = $sysmisif(datey0 > 0 I datey1 > 0 l datevOs > 01 datevls > 0) newtbe = 1.if(datev2s > 0 1 datev3s >0 1 datev4s >01 d2tez5 > 0) newimm = 1.variable labels newtbe "TBE defmed by vO, vl, y0 & yl"
/newimm "Immersion defined by v234 or z5".if(profcncy < 3) lepfep =1.variable label lepfep "Language profiency = 1 or 2".recode newtbe newimm lepfep (sysmis=0).compute newprgm = 0.if(lepfep =1) newprgm = 4.if(newimm = 1) newprgm = 3.if(newtbe =1) newprgm = 1.if(newtbe = 1 & newimm =1) newprgm = 2.DO IF (MISSING(profcncy)) .
RECODE newprgm (ELSE=SYSMIS) .
END IF .ignewprgm = 4 & profcncy =2) newprgm = 5.variable labels newprgm "Program defined by bubble sheet data".value labels newprgm
0 "Not LEP/FEP Proficiency"1 "TBEvO,vl,yOoryP2 "TBE & Immersion"3 "Immersion = v234 or z5"4 "Mainstream LEP"5 "Mainstream FEP".
COMMENT **** CALCULATE ELD LEVEL RATE OF PROGRESS.
count fiN = datev0s.datew1 s.datew2s,datew3s,datew4s (missing).compute #N = 5 - ON.compute #XY = sum(datevAs.2*clatewls,311datew2s.4*datew3s.5datew4s)/(60560.24365.24).compute #sx = 0.
A-59163
if(datewos>0) $SX = #SXif(datewls>0) #SX = #SX +2.if(datew2s>0) #SX =#SX +3.if(datew3s>0) #SX = $SX +4.if(datew4s>0) #SX = #SX + 5.compute #SX..x =0.if(datevA90) #SXX = #S;GX +1.tf(datewls>0) #SXX = #S)Pa + 4.if(datew2s>0) #SXX =#SXX + 9.if(datew3s>0) #S)0C = #SXX 4" 16.if(datew4s>0) #SLX = #SXX + 25.compute #SY = stun(datew0s.datewls,datew2s.datew3s.datew40/(60*60*24365.24).compute eldrate = (#N*#XY - #SX*#SY)/(#Ns#S)X #SX*#SX).variable label eldrate "Rate of ELD growth in Yrs/Lvl".count #14p = datew5s,datew6s,datew7s,datew8s,datew9s (missing).compute #Np = 5 - #Np.compute #XYp = sum(datew5s,2*datew6s,3*datew7s,4*datew8s,5*datew9s)/(60*60*24*365.24).compute #SXp =O.if(datew5s>0) #SXp = #SXp +1.if(datew6s>0) #SXp = #SXp +2.if(datew7s>0) #SXp =#SXp +3.if(datew8s>0) #SXp = #SXp +4.if(datew9s>0) #SXp = #SXp + 5.compute #SXxp = 0.if(datew5s>0) #SXXp = #SXXp +1.if(datew6s>0) #SXXp = #SXXp + 4.if(datew7s>0) #SXXp =1SSXXp + 9.if(datew8s>0) #S3O(p = #SXXp + 16.if(datew9s>0) #SXXp = #SXXp + 25.compute #SYp = sum(datew5s,datew6s,datev7s,datew8s,datew9s)/(60*60*24*365.24).compute pldrate = (i#Np*OCYp - #SXp*#SYp)/(#Np*#SXXp - #SXp*#SXp).variable label pldrate "Rate of PLD growth in Yrs/Lvl"..descriptives eldrate pldrate.
COMMENT *** CREATE ELD9704 outdated variable.
if(datew0s <= tst9704) eld9704 = 1.if(datewls < tst9704) e1d9704 = 2.if(datew2s < 1st9704) eld9704 = 3.if(datew3s <= tst9704) eld9704 = 4.if(datew4s <= tst9704) e1d9704 = 5.if(rdesdate <= tst9704) e1d9704 = 6.variable labels e1d9704 "ELD level at 97 test date".value labels e1d9704
1 "WO Pre-Production"2 "W I Early Production"3 "W2 Speech Emergence"4 "W3 Intermediate Fluency"5 "W4 Advanced Fluency"6 "Redesignated FEP".
value labels lasttest I "SABE" 2 -cras-.
COMMENT **** CREATE CTBS AND SABE GROWTH RATES
A-6° 164

compute rtc_rate = Ssysmis.compute rts_rate = Ssysmis.Vector #XX(11).Vector #YY( I I).vector #ZZ(11).
compute CCX(1) = tst9402/(606024*365.24).compute #KX(2) = tst9403/(60*60*24*365.24).compute #XX(3) = tst9410/(60*60*24*365.24).compute #KX(4) = tst9412/(60604124365.24).compute #XX(5) = tst95021(60*60*24*365.24).Compute CC-X(6) = tst9504/(60*60*24*365.24).compute OCX(7) = tst95111(60*60*24*365.24).compute #XX(8) = tst9512/(60*60*24*365.24).compute CCX(9) = tst96021(60*60*24*365.24).compute #XX(I0) = tst9604/(60*60*24*365.24).compute #XX(11) = tst9704/(60*60*24*365.24).compute #YY(1) = rtc9402.compute #YY(2) = rtc9403.compute #YY(3) = rtc9410.compute #YY(4) = rtc9412.compute #YY(5) = rtc9502.compute #YY(6) = Ssysmis.compute #YY(7) = rtc9511.compute #YY(8) = rtc9512.compute #YY(9) = rtc9602.compute #YY(10) = rtc9604.compute #YY(11) = rtc9704.compute #ZZ(1) = rts9402.compute #ZZ(2) = rts9403.compute #ZZ(3) = rts9410.compute #ZZ(4) = rts9412.compute #ZZ(5) = rts9502.compute #ZZ(6) = rts9504.compute #ZZ(7) = rts9511.compute #ZZ(8) = rts9512.compute #ZZ(9) = rts9602.compute #ZZ(10) = rts9604.compute #ZZ(11) = rts9704.
compute #KS = 0.compute #KC = 0.compute #SumXS = 0.compute #SurnXS2 = 0.compute #SumXC = 0.compute #SumXC2 = 0.compute #SumY = 0.compute #SumZ = 0.compute #SumXY = 0.compute #SumXZ = 0.loop #1 = 1 to 11.
Do If (0YY(#1) > -1).compute #KC = #KC + 1.compute #SumXC = #SumXC + #XX(#I).compute #SumXC2 #SumXC2 + #30C(#1) * #XX(#I).compute #SumY = #SumY #YY(#I).
A-6 I 165

compute 14SumXY = #SuinXY + #LX(#I)*#YY(#I).End if.Do IF (0Z.Z(#1) > - 1).
compute #KS = #KS + 1compute #SumXS = #SumXS + #XX(C).compute #SumXS2 = #SumXS2 + #XX(#I) #XX(#1).compute #SumZ = #SumZ + #ZZ(#1).compute #SumXZ = #SumXZ + #XX(#I)*#ZZ(#1).
End if.end loop.IF(#KS > 1) rts_rate = (#KS*#SumXZ - #SumXS*#StimZ)/(#KS*#SumXS2 - #SumXS*#SumXS).variable label rts_rate "Rate of SABE growth in NCEs/Yr".IF(#KC > 1) rtc_rate = (#KC*#SumXY - #SumXC*#SumY)/(#KC*#SumXC2 - #SumXC*#SumXC).variable label rtc_rate "Rate of CTBS growth in NCEs/Yr*.DESCRIPTIVES
VARIABLES=rts_rate rtc_rate /STATISTICS=MEAN STDDEV MIN MAX .
Vector XX( 11).Vector YY(11).vector ZZ(11).
computecomputecomputecomputecomputecomputecomputecomputecomputecomputecomputecomputecomputecomputecomputecomputecomputecomputecomputecomputecomputecomputecomputecomputecomputecomputecomputecomputecomputecomputecomputecomputecompute
)0C(1) = tst9402/(60*60*24*365.24).XX(2) = 1st9403/(60*60*24*365.24).30C(3) = tst94101(60*60*24*365.24).XX(4) = 1st9412/(60*60*24*365.24).
X(5) = tst9502/(60*60*24*365.24).XX(6) = tst9504/(60*60*24*365.24).30C(7) = tst9511/(60*60*24*365.24).XX(8) = tst9512/(60*60*24*365.24).XX(9) = tst9602/(60*60*24*365.24).XX(10) = tst9604/(60*60*24*365.24).XX( 11) = tst97041(60*60*24*365.24).YY(1) = rtc9402.YY(2) = rtc9403.YY(3) = rtc9410.YY(4) = rtc9412.YY(5) = rtc9502.YY(6) = Ssysmis.YY(7) = rtc9511.YY(8) = rtc9512.YY(9) = rtc9602.YY(10) = rtc9604.YY(11) = rtc9704.ZZ(1) = rts9402.ZZ(2) = rts9403.ZZ(3) = rts9410.ZZ(4) = r1s9412.ZZ(5) = rts9502.ZZ(6) = rts9504.ZZ(7) = rts9511.ZZ(8) = rts9512.72(9) = rts9602.ZZ( 10) = rts9604.72(11) = rts9704.
A-62166

compute KS = 0.compute KC = 0.compute Sum.X = 0.compute SumY = 0.compute SumZ = 0.compute StunXY = 0.compute SumXZ = 0.compute SumX2 = 0.loop 1 = 1 to I I.
If (YY(I) > -1) KC = KC + 1.EF (ZZ(I) > - 1) KS = KS + 1.compute SumX = SumX + )0C(I).compute SumX2 = SumX2 + (MC(I) *If (YY(I) > -1) SumY = SumY + YY(I).IF(YY(I) > -1) SumXY = SumXY + 30C(I)*YY(I).IF(ZZ(I) > -1) SumZ = SumZ + ZZ(I).IF(ZZ(I) > -1) SurnXZ = SumXZ + XX(I)*ZZ(I).
end loop.compute rts_rate = (KS*SumXY SumX*SumY)/(KS*SumX2 - Suna*SumX).variable label rts_rate "Rate of SABE growth in NCEs/Yr".compute rtc_rate = (KC*SumXZ - SumX*SumZ)/(I(C*SumX2 - SumX*SumX).variable label rtc_rate "Rate of CTBS growth in NCEs/Yr".DESCR1PTIVESVARIABLES=rts_rate rtc_rate /STATISTICS=MEAN STDDEV MIN MAX .
IF (KS < 2) rts_rate = Ssysmis .
IF (KC < 2) nc_rate = $sysmis .
EXECUTE .
COMMENT ** THIS IS Variable calculations 2.sps.
COMMENT "* CREATE READING GROWTH RATE, COMBINING CTBS & SABE RATES.
compute readrate = Ssysmis.compute rdratesc Ssysmis.variable labels
readrate "Reading achievement rate (SABE if both)"rdratesc "Readrate based on SABE(1) or CTBS(2)".
COMPUTE readrate = rts_rate .
W (missing(readrate)) readrate = rtc_rate .
IF (rts_rate > -2000) rdratesc = 1 .
IF (missing(rdratesc) & rtc_rate > -2000) rdratesc = 2.DESCRIPTIVES
VAR1ABLES=readrate rdratesc/STATISTICS=MEAN STDDEV MIN MAX .
RECODEreadrate (Lowest thru -50=SYSMIS) (50 thru Highest=SYSMIS) .
EXECUTE .
COMMENT *" COMPUTE READING AND MATH LEVELS FOR 97, 96 & 95.
compute read97 = rts9704.if (rts9704 > -100) test97 = 1.do if missing(read97).
compute read97 = rtc9704.
A-63

compute test97 = 2.end if.compute math97 = mts9704.if missing( math97) math97 = mtc9704.execute.compute read96 = rts9604.if (rts9604 > -100) test96 = 1.do if missing(read96).
compute read96 = rts9602.compute test96 = 1.
end if.do if missing(read96).
compute read96 = rts9511.compute test96 = 1.
end if.do if ntissing(read96).
compute read96 = rts9512.compute test96 = 1.
end if.do if missing(read96).
compute read96 = rtc9604.compute test96 = 2.
end if.do if missing(read96).
compute read96 = rtc9602.compute test96 = 2.
end ifdo if missing(read96).
compute read96 = rtc9512.compute test96 = 2.
end ifexecute.compute math96 = mts9604.if(mts9604 > -100) test96 = 1.do if missing(math96).
compute math96 = mts9602.compute test96 = 1.
end if.do if missing(math96).
compute math96 = mts9511.compute test96 = 1.
end if.do if missing(math96).
compute math96 = mts9512.compute test96 = 1.
end ifdo if missing(math96).
compute math96 = mtc9604.compute test96 = 2.
end if.do if missing(math96).
compute math96 = mtc9602.compute test% = 2.
end if

do if missing( math96).compute math96 = mtc9512.compute test96 = 2.
end ifexecute.compute read95 = rts9504.if (rts9504 > -100) test95 = 1.do if missing(read95).
compute read95 = rts9410.compute test95 = 1.
end if.do if missing(read95).
compute read95 = rts9502.compute test95 = 1.
end ifdo if missing(read95).
compute read95 = rts9412.compute test95 = 1.
end ifdo if missing(read95).
compute read95 = rtc9410.compute test95 = 2.
end ifdo if missing(read95).
compute read95 = rtc9502.compute test95 = 2.
end ifdo if missing(read95).
compute read95 = rtc9412.compute test95 = 2.
end ifexecute.compute math95 = mts9504.if (mts9504 > -100) test95 = 1.do if missing(math95).
compute math95 = mts9410.compute test95 = 1.
end ifdo if missing(math95).
compute math95 = mts9502.compute test95 = 1.
end ifdo if missing(math95).
compute math95 = mts94I2.compute test95 = 1.
end ifdo if missing(math95).
compute math95 mtc9410.compute test95 = 2.
end ifdo if missing(math95).
compute math95 = mtc9502.compute test95 33 2.
end if

do if missing(math95).compute math95 = mtc9412.compute test95 = 2.
end ifvariable labels
read97 "NCE Reading in 97"read96 "NCE Reading in 96"read95 "NCE Reading in 95"math97 "NCE Math in 97"math96 "NCE Math in 96"math95 "NCE Math in 95"test97 "Test language in 97 (SABE if both)"test96 "Test language in 96 (SABE if both)"test95 'test language in 95 (SABE if both)".
Value labels Test97. Test96, Test951 "SASE"2 "CTBS".
execute.
COMMENT *** COMPUTE ELD LEVELS FOR 97, 96 & 95.
compute eld95 = Ssysmis.compute e1d96 = Ssysmis.compute e1d97 = Ssysmis.compute p1d95 = Ssysmis.compute p1d96 = Ssysmis.compute pld97 = Ssysmis.compute #D 1 = date. mdy(7,1,1997).compute #D2 = date.mdy(7,1,1996).compute #1)3 = date.mdy(7,1,1995).if (min(datew0s.datewls,datew2s.datew3s,datew4s,rdesdate) < #D1) eld97 = 1.if (min(datew0s,datew I s.datew2s,datew3s,datew4s,rdesdate) <= #132) e1d96 = 1.if (min(datew0s.datewls.datew2s,datew3s.datew4s,rdesclate) <= #133) e1d95 = 1.if (datewls <= #D1) e1d97 = 2.if (datewls <= #D2) e1d96 = 2.if (datewls <= #D3) e1d95 = 2.if (datew2s <= #D1) e1d97 = 3.if (datew2s <= #D2) e1d96 = 3.if (datew2s <= #1)3) e1d95 = 3.if (datew3s < #1)1) e1d97 = 4.if (datew3s <= #D2) e1d96 = 4.if (datew3s <= #D3) e1d95 = 4.if (datew4s <= #131) e1d97 = 5.if (datew4s <= #D2) eld96 = 5.if (datew4s <= #D3) e1d95 = 5.if (rdesdate <= #D1) eld97 = 6.if (rdesdate <= #132) e1d96 = 6.if (rdesdate <= #133) eld95 = 6.if (min(datew5s,datew6s,datew7s,datew&s.datew9s) <= #D1) pld97 = 1.if (min(datew5s.datew6s,datew7s,datew8s,datew9s) <= #D2) pld96 = 1.if (min(datew5s.datew6s.datew7s,datew8s,datew9s) <= #D3) p1d95 = 1.if (datew6s <= OD 1) p1d97 = 2.if (datew6s <= #1)2) p1d96 = 2.if (datew6s <= #133) pld95 = 2.
170A-66
if (datew7s <= #Dl) p1d97 = 3.if (datew7s <= aD2) p1d96 = 3.if (datew7s <= #D3) p1d95 = 3.if (datew8s <= #D ) p1d97 = 1.if (datew8s <= #D2) p1d96 = 4.if (datew8s <= #D3) pld95 = 4.if (datew9s <= #1)1) p1d97 = 5.if (datew9s <= #D2) p1d96 = 5.if (datew9s <= #D3) pld95 = 5.execute.variable labels.
e1d95 "ELD Level in 95"eld96 "ELD Level in 96"e1d97 "ELD Level in 97"pld95 "PLD Level in 95"pld96 "PLD Level in 96'p1d97 "PLD Level in 97".
value labelse1d95 e1d96 e1d97 p1d95 p1d96 pld971 "Pre-Production"2 "Early Production"3 "Speech Emergence" .
4 "Intermediate Fluency"5 "Advanced Fluency"6 'Redesignated".
EXECUTE.
COMMENT *** ADJUST DATEXO THROUGH DATEX9 FOR SURVEY DATA.
if (dx0srvy < datex0 I missing(datex0)) datex0 = dx0srvy.if (dx 1 srvy < datex I I missing(datex1)) datex 1 = dxlsrvy.if (dx2srvy < datex2 I tnissing(datex2)) datex2 = dx2srvy.if (dx3srvy < datex3 I missing(datex3)) datex3 = dx3srvy.if (dx4srvy < datex4 I missing(datex4)) datex4 = dx4srvy.if (dx5srry < datex5 I missing(datex5)) datex5 = dx5srvy.if (dx6srvy < datex6 I missing(datex6)) datex6 = dx6srvy.if (dx7srvy < datex7 I missing(datex7)) datex7 = dx7srvy.if (dx8srvy < datex8 I missing(datex8)) datex8 = dx8srvy.if (dx9srvy < datex9 I missing(datex9)) datex9 = dx9srvy.
COMMENT *** COMPUTE READING LEVEL 97, 96, 95.
compute #D 1 = date. mdy(7,1,1997)compute #D2 = date. mdy(7, 1, 1996)compute #1)3 = date. mdy(7,1,1995)if( min(datex0.datex0 1, datex 1,datexlatex9) <= #D1) rd1v197 = 0. '.
if(min(date.x0,datex01.datex .datexlatex9) <= #D2) rdIv196 = 0.if( min( datex0.datex0 Ldatex l.datexlatex9) <= #1)3) rdIv195 = 0.
1,datex2,datex21.datex3,datex31,datex4,datex5,datex6,datex7,datex8,d
1, datex2,datex2 1. datex3 ,datex31,datex4,datex5,datex6,datex7,datex8,d
1, datex2,datex2 1,datex3,datex3 1,datex4.datex5,datex6.datex7,datex8,d
A-67
171

if (max(datexo (Amex l) <= #D1 & datexl > 0) rd1v197 la 1.if (max(datexO l.datex I) <= #D2 & datexl > 0) rdlvl96 = 1.if (max(datexOl.datexl) <= #D3 & datexl > 0) rd1v195 = 1.if (max(datex11..datex2) <= #D1 & datex2 > 0) rdlvl97 = 2.if (ma.x(datex l 1 .datex2) <= #D2 & datex2 > 0) rd1v196 = 2.i.f(ma.x(datex[ <= #D3 & datex2 > 0) rd1v195 = 2.if (max(datex21.datex3) <= #D1 & datex3 > 0) rd1v197 = 3.if (max(datex21.datex3) <= #D2 & datex3 > 0) rd1v196 = 3.if (rnax(datex21.datex3) <= #D3 & datex3 > 0) rd1v195 = 3.if (ma.x(datex31.datex4) <= #D1 & datex4 > 0) rd1v197 = 4.if (max(datex3 1 slatex4) <= #D2 & datex4 > 0) rd1v196 = 4.if (max(datex31.datex4) <= #D3 & datex4 > 0) rd1v195 = 4.if (datex5 <= #D1) rd1v197 = 5.if (datex5 <= #D2) rdlvl96 = 5.if (datex5 <= #D3) rd1v195 = 5.if (datex6 <= #D 1) rd1v197 = 6.if (datex6 <= #D2) rd1v196 = 6.if (datex6 <= #D3) rd1v195 = 6.if (datex7 <= #D1) rdlvl97 = 7.if (datex7 <= #D2) rd1v196 = 7.if (datex7 <= #D3) rd1v195 = 7.if (datex8 <= #D1) rd1v197 = 8.if (datex8 <= #D2) rd1v196 = 8.if (datex8 <= #D3) rd1v195 = 8.if (datex9 <= #D1) rd1v197 = 9.if (datex9 <= #D2) rd1v196 = 9.if (datex9 <= #D3) rd1v195 = 9.variable labels
rdlvl97 "97. Reading Level"rd1v196 "96 Reading Level"rd1v195 "95 Reading Level".
value labelsrd1v197 rd1v196 rd1v1950 "XO K/Illiterate"1 "Xl Gradel"2 "X2 Grade2"3 "X3 Grade3"4 "X4 Grade4"5 "X5 Grade5"6 "X6 Grade6"7 "X7 Grade7"8 "XS Grade8"9 "X9 Grade9".
execute.
COMMENT ** UPDATE SUBJECT PROGRAMS FROM SURVEY DATA.
if (dy3srvy < datey3 I missing(datey3)) datey3 = dy3srvy.if (dy4srvy < datey4 I missing(datey4)) datey4 = dy4srvy.
(dy5srvy < datey5 I missing(datey5)) datey5 dy5srvy.if (dy6srvy < datey6 I missing(datey6)) datey6 dy6srvy.if (dy7srvy < datey7 I missing(datey7)) datey7 = dy7srvy.if (dyilsrvy < datey8 I missing(datey8)) datey8 = dy8srvy.
(dy9sndy < datey9 I missing(datey9)) datey9 dy9srvy.
A-68 17 2

if ( dz I srvy < datez I I tnissing(datez I )) datez I = dz Isrvy.if (dz2srvy < datez2 I missing(datez2)) datez2 = dasrvy.if (dz)srvy < datez3 I missing(datez3)) datez3 = dz3srvy.
( dz4stvy < datez4 I missing(datez4)) datez4 = dz4srvy.
COMMENT *** COMPUTE SUBJECT SERVICE LEVELS FOR 97, 96 AND 95.
compute #D I = date.mdy(7.1,1997).compute #1)2 = date. mdy(7.1,1996).compute #D3 = date. mdy(7.1.1995).if (min(datey3.datey3 I .datey4.datey41.datey5,datey51) <= OfD 1) mthlv197 = 1.if (min(datey3,datey31.datey4slatey41.datey5,datey51) <= #132) mthlv196 = 1.if (min(datey3.datey31.datey4,datey41,datey5,datey51) <= #133) mthiv195 = 1.if (max(datey31,datey4) <= #D1 & datey4 > 0) mthlv197 = 2.if (max(datey31.datey4) <= #D2 & datey4 > 0) mthlv196 = 2.if (max(datey31,datey4) <= #1)3 & datey4 > 0) mthlv195 = 2.if (max(datey41.datey5) <= #1)1 & datey5 > 0) mthlv197 = 3.if (max(datey41.datey5) <= #1)2 & datey5 > 0) mthlv196 = 3.if (max(datey41,datey5) <= #133 & datey5 > 0) mthlv195 = 3.compute #1)1 = date.mdy(7,1,1997).compute #1)2 = date.mdy(7,1,1996).compute #D3 = date.mdy(7,1,1995).if (min(datey6,datey61,datey7,datey71,datey8,datey81) < #D1) sciIv197 = 1.if (min(datey6,datey61,datey7,datey71,datey8,datey81) <= #D2) scilv196 = 1.if (min(datey6.datey61,datey7,datey71.datey8.datey81) <= #D3) scilv195 = 1.if (max(datey61,datey7) <= #1)1 & datey7 > 0) scilv197 = 2.if (max(datey61,datey7) <= #132 & datey7 > 0) scilv196 = 2.if (max(datey61,datey7) <= #D3 & datey7 > 0) scilv195 = 2.if (max(datey71,datey8) <= #131 & datey8 > 0) scilv197 = 3.if (max(datey71.datey8) <= #D2 & datey8 > 0) scilv196 = 3.if (rnax(datey71,datey8) <= #D3 & datey8 > 0) scilv195 = 3.compute 4131 = date.rndy(7,1.1997).compute #D2 = date.mdy(7,1,1996).compute #I)3 = date.mdy(7,1,1995).if (min(datey9.datey91.clatez0,datez01.datezl.datez11) <= #D1) soc1v197 = 1.if (min(datey9,datey91,datez0,datez01,datezl,datez11) <= #1)2) soctv196 = 1.if (min(datey9,datey91,datez0,datez01,datezl,datez11) <= #D3) soclv195 = 1.if (max(datey91,datez0) <= #D1 & datez0 > 0) soclv197 = 2.if (max(datey91.datez0) <= #D2 & datez0 > 0) soc1v196 = 2.if (max(datey91,datez0) <= #D3 & datez0 > 0) soclv195 = 2.if (max(datez01,datez1) <= #D1 & datezl > 0) soclv197 = 3.if (max(datez0 Islatez1) <= OfD2 & datezl > 0) soclv196 = 3.if (max(datez01,datez1) <= #D3 & datezl > 0) soclv195 = 3.compute #131 = date.mdy(7,1,1997).compute #D2 = date.mdy(7,1,1996).compute #D3 = date.mdy(7.1,1995).if (min(datez2.datez21.datez3.datez31.datez4,datez41) <= #D1) Inglv197 = 1.if (min(datez2.datez2Islatez3.datez31,datez4,cfatez41) <= #132) Inglv196 = 1.if (min(datez2.datez21.datez3.datez31,datez4,datez4 I) <= #D3) Ingtv195 = 1.if (max(datez21.datez3) <= #1)1 & datez3 > 0) Inglv197 = 2.if (max(datez21.datez3) <= #1)2 & clatez3 > 0) IngIvI96 = 2.if (max(datez21,datez3) <= #133 & datez3 > 0) Inglv195 = 2.if (max(datez3 1 slatez4) <= #1)1 & datez4 > 0) Inglv197 = 3.if (max(datez3 1 statez4) <= #D2 & datez4 > 0) Inglv196 = 3.
173A-69

if (mamdatez.3 1.datez4) <= #D3 & datez4 > 0) lnglvl95 = 3.variable labels
mthlvI97 "97 Math Level"mthlvl96 "96 Math Level"mthlvl95 "95 Math Level"scilv197 "97 Science Level"scilvI96 "96 Science Level"scilvl95 "95 Science Level"soclv197 "97 SocStudies Level"soclv196 "96 SocStudies Level"soclvl95 "95 SocStudies Level"lnglv197 "97 LangArts Level"Inglvl96 "96 LangA,rts Level"Inglv195 "95 LangArts Level".
value labelsmthlv197 mthlv196 mthlv195scilvl97 scilv196 scilv195soclv197 soclvl96 soclvl95lnglv197 Inglv196 lnglv1951 "Native"2 "Sheltered"3 "Mainstream".
exeCUte.
compute #1)1 = date.mdy(7,1.1997).compute #132 = date.mdy(7,1,1996).compute #133 = date. mdy(7,1,1995).if (datey0 <= #D1) Native97 = 1.if (datey0 <= #D2) Native96 = 1.if (datey0 <= #1)3) Native95 = 1.if (dateyl <= #1)1) Trans97 = 1.if (datey1 <= #D2) Trans96 = I.if (dateyl <= #D3) Trans95 = 1.if (datey2 <= #D1) Main97 = 1.if (datey2 <= #132) Main96 = 1.if (datey2 <= #1)3) Main95 = 1.if (datez5 <= #131) Immer97 = 1.if (datez5 <= #D2) Immer96 = 1.if (datez5 <= #D3) Immer95 = 1.variable labels
Native97 "97 in Native Reading"Native96 "96 in Native Reuling"Native95 "95 in Native Reading"Trans97 "97 in Transition Reading'.Trans96 "96 in Transition Reading"Trans95 "95 in Transition Reading'Ma1n97 "97 in Mainstream Reading"Ma1n96 "96 in Mainstream Reading'Ma1n95 "95 in Mainstream Reading"Immer97 "97 in Immersion Reading'Immer96 "96 in Immersion Reading"Immer95 "95 in Immersion Reading'.
value labelsNative97 Native96 Native95
A-70 174

Trans97 Trans96 Trans95Mam97 Main96 Ma1n95Immer97 Immer96 Immer950 "No"1 'Yes".
execute.
LI (mean(datey0.datey01) > 0) Nativ 1st = 0.If (Max(datey0.datey01) < Max(dateyl.datey I 1.datey2.datey21,datez5,datez51)) Nativist = 1.if (mean(datey 1 slatey11) > 0) Translst = 0.If (max(dateyl.datey11) < max(datey0,datey91,datey2,datey21,datez5,datez51)) Translst = 1.if (mean(datey2,datey21) > 0) Mainlst = 0.if (max(datey2,datey21) < max(datey0,datey01,dateyl,datey 1 I,datez5,datez51)) Mainlst = 1.if (mean(datez5,datez5 I) > 0) Immerlst = 0.if (max(datez5,datez51) < max(datey0,datey01,datey 1,datey 1 1,datey2,datey21)) Immerlst = 1.variable labels
Nativist "Native reading is first"Trans Ist "Transition reading is first"MainIst "Mainstream reading is first"Immer 1st "Immersion reading is first".
value labelsNativ Ist Translst Mainlst linmerlst 0 "No" 1 "Yes".
if (mean(datey0,datey01) > 0 & missing(native97)) native97.if (mean(datey0,datey01) > 0 & missing(native96)) native96.if (mean(datey0,datey01) > 0 & missing(native95)) native95.if (mean(dateyl,datey11) > 0 & missing(trans97)) txans97.if (mean(dateyl,datey11) > 0 & missing(trans96)) trans96-*0.if (mean(datey Islatey11) > 0 & missing(trans95)) trans95=0.if (mean(datey2.datey21) > 0 & rnissing(main97)) main97=0.if (mean(datey2.datey21) > 0 & missing(main96)) main96).if (mean(datey2.datey21) > 0 & missing(main95)) main95.if (mean(datez5,datez51) > 0 & missing(immer97)) imnier97.if (mean(datez5,datez51) > 0 & missing(immer96)) immer96=0.if (mean(datez5,datez5 I) > 0 & missing(immer95)) immer95.
execute.
compute #D1 = date.mdy(7,1,1997).compute #D2 = date.mdy(7,1,1996).compute #D3 = date.mdy(7,1,1995).if (min(datey0,datey01,dateyl,dateyll.datey2,datey21,datez5,datez51) <= #D1) rdpgm97 = 5.if (min(datey0.datey01.datey1,datey11,datey2,datey21.datez&datez51) <= #D2) rdpgm96 = 5.if (min(datey0datey01,dateyl,datey11,datey2,datey21,datez&datez51) <= #D3) rdpgm95 = 5.if (max(datez5slatez51) <= #D1) rdpgm97 = 4.if (max(datez5,datez51) <= #D2) rdpgm96 = 4.if (max(datez5,datez51) <= #D3) rdpgm95 = 4.if (max(datey2slatey21) <= #D1) rdpgm97 = 2.if (max(datey2,datey21) <= #D2) rdpgm96 = 2.if (max(datey2.datey2 ) <= #D3) rdpgm95 = 2.if (ma.x(datey0.datey0l) <= #D1) rdpgm97 = 1.
175A-71

if (max(datey0.datey0 1) <= #D2) rdpgm96 1.
if (max(datey0.datey01) <= #D3) rdpgm95 I.if ( ma.x(datey l,datey1 l.datey0.datey0 ) <= #1)1 & max(datez5.datez5 l) >= #D I) rdpgm97 = 3.if ( ma.x( dateyl.datey1 1 ,datey0.datey01) <= #D2 & max(datez.5.datez51) >= #D2) rdpgm96 = 3.if (max(datey l.datey ll,datey0.datey0 ) <= #D3 & max(datez5.datez5 l) >= #D3) rdpgrn95 = 3.value labels
rdpgm97 rdpgm96 rdpgm951 "Native"2 "Transitional"3 "TBE & Immersion"4 "Immersion"5 "Mainstream".
execute.
compute grade97 = rts9704g.if missing(grade97) grade97 = mtc9704g.compute grade96 = rts9604g.if missing(grade96) grade96 = r1s9602g.if missing(grade96) grade96 = rts9511g.if missing(grade96) grade96 = rts9512g.if missing(grade96) grade96 = mtc9604g.if missing(grade96) grade96 = mtc9602g.if missing(grade96) grade96 = mtc9512g.compute grade95 = rts9504g.if missing(grade95) grade95 = rts9410g.if missing(grade95) grade95 = rts9502g.if missing(grade95) grade95 = rts9412g.if missing(grade95) grade95 = mtc9410g.if missing(grade95) grade95 = mtc9502g.if missing(grade95) grade95 = mtc9412g.execute.
COMMENT *** FIX V CODES FOR SURVEY DATA.
IF(dvOsrvy < datevOs I missing(datev0s)) datevOs = dvOsrvy.7(dvlsrvy < datev Is I missing(datevls)) datevls = dvlswy.IF(dv2srvy < datev2s I missing(datev2s)) datev2s = dv2srvy.1F(dv3srvy < datev3s I missing(datev3s)) datev3s = dv3srvy.IF(dv4srvy < datev4s I missing(datev4s)) datev4s = dv4srvy.IF(dv5srvy < datev5s I missing(datev5s)) datev5s = dv5srvy.IF(dv6srvy < datev6s I missing(datev6s)) datev6s = dv6srvy.
COMMENT *** CALCULATE V-CODE PROGRAM ENROLLMENT 97, 96, 95.
compute biling97 = Ssysmis.compute biling96 = Ssysmis.compute biling95 = Ssysmis.compute #D1 = date. mdy(7.1,1997).compute #D2 = date. mdy(7. 1.1996).compute #D3 = date.mdy(7.1,1995).Vector #v(15).Vector #P(15).compute #v( I) = datevOs.
A-72176
if (datev)s > 0) #P(1) = 0.compute the(2) = datevO Is.
if (datev0 Is > 0) e(2) = 0.compute #v( 3) = datev Is.
if (datev Is > 0) #P(3) = 1.
compute #.v(4) = datev 1 Is.if (datev 1 Is > 0) #P(4) = I.
compute t*v(5) = datev2s.if (datev2s > 0) #P(5) = 2.
compute #v(6) = datev2 Is.if (datev2 Is > 0) #P(6) = 2.
compute #v(7) = datev3s.if (datev3s > 0) tir(7) = 3.
compute #v(8) = datev3 Is.if (datev3 ls > 0) #P(8) = 3.
compute #v(9) = datev4s.if (datev4s > 0) #P(9) = 4.
compute #v(10) = datev41s.if (datev41s > 0) #P(10) = 4.
compute #v( 11) = datev5s.if (datev5s > 0) #P(11) = 5.
compute #v( 12) = datev51s.if (datev51s > 0) #P(12) = 5.
compute #v(13) = datev6s.if (datev6s > 0) #P(13) = 6.
compute #v(14) = datev61s.if (datev61s > 0) #P(14) = 6.
compute #v(15) = datev62s.if (datev62s > 0) #P(15) = 6.
loop #1 = 1 to 15.loop #j = 15 to #1 by -1.
if (rnissing(#v(#i))) #v(#i) = 10E100.do if #v(#j) < #v(#i) .
compute #hold = #v(#j).compute #v(#3) = #v(fh).compute #v(#i) = #hold.compute #hold = #P(#j).compute #P(#j) = #P(#i).compute #P(#i) = #hold.
end ifend loop.end loop.loop #I = 1 to 15.
if (#v(#i) < #D1) biling97 = #P(#1).if (#v(#i) < #D2) biling96 = #P(#I).if (#v(#i) < #D3) biling95 = #P(#1).
end loop.Variable labels
biling97 "V-Code Program in 97"biling96 "V-Code Program in 96"biling95 "V-Code Program in 95".
value labelsbiling97 biling96 biling950 "TBE - Native"
A-73 177

I "TLC - Transitional"2 "Immersion - Native"3 "Immersion Other'4 "Immersion only"5 "Mainstream ELD"6 "Mainstream only"7 "FEE' Mainstream"8 "Eng Only Mainstream".
execute.
variable labelsmnthwOwl "Months ELD Pre-Production to Early Production"tnnthv4w2 "Months ELD Pre-Production to Emergence"mnthw0w3 "Months ELD Pre-Production to Intermediate"mnthwOw4 "Months ELI) Pre-Production to Advanced"mnthwOrd "Months ELD Pre-Production to Redesignated"mnthw1w2 "Months ELD Early to Emergence"mnthw1w3 "Months ELD Early to Intermediate"mnthw1w4 "Months ELD Early to Advanced"mnthwlrd "Months ELD Early to Redesignated"mnthw2w3 "Months ELD Emergence to Intermediate"mnthw2w4 "Months ELD Emergence to Advanced"mnthw2rd "Months ELD Emergence to Redesignated"nuathw3w4 "Months ELD Intermediate to Advanced"mnthw3rd "Months ELD Intermediate to Redesignated"mnthw4rd "Months ELI) Advanced to Redesignated".
Variable lablesrdpgm97 "Reading Services in 97"rdpgm96 "Reading Services in 96"rdpgm95 "Reading Services in 95".
compute #yr = trunc(thdate/10000).compute #mo = trunc(thdate/100) - 100*#yr.compute #da = thdate - 10000*#yr - 100*#mo.compute texper = (enddate - date.mdy(#mo,#daftyr))/(60*60*24365.24).compute #yr = trunc(tbdate/10000).compute #mo = trunc(tbdate./100) - 100*#yr.compute #da = tbdate - 100*#mo - 10000*#yr.compute t_age = (enddate - date.mdy(#mo,#da,#yr))/(60*60*24*365.24).variable labels texper "Teacher experience in years"&age 'Teacher age in years".execute.
if (disttime >= 5) elemtrns = elemtrns/5.if (disttime >= 4 & disttime< 5) elemtrns = elemtrns/4.if (disttime >= 3 & disttime < 4) elemtrns = elemtrns/3.if (disttime >= 2 & disttime < 3) elemtrns = elemtrns/2.if (disttime >= 5) midltrns = midltrns/5.if (disttime >= 4 & disnime< 5) midltrns = midltrns/4.if (disttime >= 3 & disttime < 4) midltrns = midltrns/3.
A-74 173

if (disttime >= 2 & disttime < 3) midltrns midltrns/2.if (disttime >= 5) sectrns = sectrns/5.if (disttime >= 4 & disttime< 5) sectrns = sectrns/3.if (disttime >= 3 & disttime < 4) sectrns sectrns/3.if (disttime >= 2 & disttime < 3) sectrns sectrns/2.execute.variable labels
elerntrns "Elementary Transiency (schls/year)"midltrns Middle Schl Transiency (schls/year)"sectrns "Secondary Schl Transiency (schls/year)'.
comment **** Calculate days absent for all age groups
compute abs_days = Ssysmis.compute abs_days = ab_d_el.if (missing(abs_days)) abs days = ab_pmshsf7.variable label absdays "Number of days ethnic absent - all students".execute.
A-75I 7

APPENDIX B
Variable Description and Computation

Variables Created for Analysis
I- Student Characteristics/Intakes
1- Poverty indicator: Poverty status of students was based on whether students were onFree/Reduced Lunch Services. Students who did not receive any Free/Reduced Lunchservices were coded as '0' =Non-poverty. Those who did received a l'=Poverty.
2- Handicap was coded as l' for students who had no handicap code and 2 for students whohad any handicap code.
3- The Neighborhood Social Economic characteristics was computed from the students'residential zip codes. Students with the same zip codes were grouped together under onecode. Zip codes were coded as '1'=92701, '2'=92702, l'=92703, '4'=92704, '5'=92705,'6'=92706, '7'=92707, '8'=All others.
4- Length of time spent in the district was computed by subtracting the date students enrolled inthe school district from the project end date (5/1/97) .
5- Overage for grade placement indicator was computed by subtracting student's age from apredetermined maximum expected age for the student's current grade level which wasestimated by using 5 years as the appropriate age for students in Kindergarten. An overagevalue less than -1 and greater than 6 was set to missing.
6- Gender was coded as '1' for males and '2' for females.
7- Ethnicity: SAUSD served various ethnic groups. In cases were small number of studentsbelonged to certain ethnic groups an 'Other' category was created to combine these groups.Ethnicity was, thus recoded as, '1'= Itspanic, '2'=Asian , '3'=White, '4'=All other.
8- Attendance: Attendance information on each student was recoded into three main categories,Excused absences, Unaccounted/Unexcused Absences and Tardiness. The Excused absencecategory included excuses such as illness, field trip and school business. The unaccountedabsence included, unexcused and unverified absences and truancies. The tardiness categoryincluded both excused and unexcused tardiness. The number ofoccurrences for eachcategory for academic year 1997 was calculated separately for elementary students andcombined for middle and high school students since attendance at the elementary level wasreported based on 'all day', while at the middle and high school levels attendance wasreported by 'period' and 'days'. The all day absences for middle and high schools studentswere converted to periods (1 all day absence = 7 periods).

9- Program Movements. This tracks the movement of LEP students between various bilingualprograms. This was determined by counting the number of times students were assigneddifferent bilingual program codes in a little less than three years.
El- School Context
1- School Cycle: SAUSD has both traditional and round year schools. Schools fallingunder each type were grouped together '0'=traditional and '1'=year round.
/- School Track: Tracks for year round schools were coded as '1'=A, '2'=B, '3'=C, '4'=D.
3- School: Different tracks of the same school were grouped under one code.
4- Class Size: This variable was determined by counting the number of students that had thesame school code, grade level and teacher name.
5- Transiency Rate: The number of times students enrolled in a different school at each of theelementary, middle and high school levels were counted for school years 1993 through 1997.The number of transiency for each school level was then added for each student to get a totaltransiency estimate. The total number of transiency then was readjusted by subtracting thenumber of times students moved between school levels (movement between elementary,middle school and high school levels) and by dividing the result by the number ofyears astudent has been in the school district. The number ofyears a student has been in the districtwas computed by subtracting the earliest date students enrolled in a SAUSD school during thepast five years from the project end date (5/1/97).
6- Teacher education: Teacher education was recoded as ' l'=AA, '2'=BA', '3'='Credential','4'=Master', '5'=Doctorate. Teachers who did not report any education level, but reportedhaving credentials were recoded as having a BA.
7- Teacher credentials and experience: Teachers type of trainings were categorized into bilingualtrainings (e.g. BCC and LDS), cultural sensitivity trainings (e.g. CLAD), other instructionaltrainings (e.g. Standard elementary, standard secondary, Multiple subject and single subject) andnon instructional trainings (e.g. Administrative Service). Teachers' types of credentials werecategorized into Fully credentialed (e.g. Life, Clear) and Not Fully credentialed (e.g. PartialFulfillment, Emergency and Provisional). The training categories and the credential categorieswere combined together to classify teachers into the following groups: '1'=No Full credentials,'2'=Full credentials in instructional training only, '3'=Full credentials in instructional and culturalsensitivity training only, '4' = Full credentials in instructional and bilingual training only'.

III- Language urosrams
I - Language program assignments: Student Language program assignments for each year weredetermined by the bilingual program codes on the annual survey (bubble sheet). However,since these codes combine both the type of bilingual programs and teacher credentials,language program assignments were determined from these codes as well as the type ofservices students were getting over a period of approximately three years.
2- Program Service: The current program service assignments were determined from theprogram service codes on the 1997 annual survey (bubble sheet).
EV- Outcomes
1 - Student Redesignation Date: This information was obtained from the annual survey (bubblesheet). In cases where the students' redesignation dates were missing and their monitoring dateswere not available, we considered the earliest monitoring dates as the redesignation dates.
2- English language development level: In the process of calculating ELD rate, the start and enddates of students' ELD level assignments were recoded since the dates on which students' ELDlevels ended did not correspond to the dates on which their next ELD levels started. Thus theearliest reported starting date for the lowest ELD level achieved by a student was assigned tothat student. This was based on the assumption that language proficiency does not diminish overtime. Each ELD level assignment starting date for a student was then compared to all lower ELDlevel assignment dates . An assigned ELD level starting date was kept only if it was more recentthan the assignment dates corresponding to all lower ELD levels. Otherwise, it was recoded asmissing. In computing the number of months it took students to move through different ELDlevels, the end date of and ELD level was always assumed to coincide with the benning of thenext higher ELD level.a- The number of months elapsed between various ELD level classifications for a student
was computed by subtracting the date on which a student was assigned an ELD level from thedate on which the same student was assigned the next higher ELD level. Since there are fivedifferent ELD levels (WO through W4) and a redesignation date, fifteen different possibilitiesexist for calculating the time between different ELD level classifications. For example, WanLEP student entered SAUSD in 1994 and was assigned ELD level WO and then was assignedELD level W1 in 1995, ELD level W2 in 1996 and ELD level W4 in 1997, the number ofmonths elapsed between each classification was computed by subtracting (i) the assignmentdate of WO from each of Wl, W2 and W4 (ii) the assignment date of W1 from each of W2and W4 (iii) the assignment date of W2 from W4 (iv) the assignment date of W4 from theredesignation date if the student was redisgnated to FEP. Since the student was not assignedto ELD level W3 the time variable (number of months from W3 to W4) was set to missing.Although students should move through one ELD level at a time there were cases in the database where some ELD levels were skipped. The time variables related to the skipped ELDlevels were set to missing. For students who did not leave their most recent assigned ELDlevel, the date of assignment was subtracted from the project end date (5/1/97) in order to get
183B-3
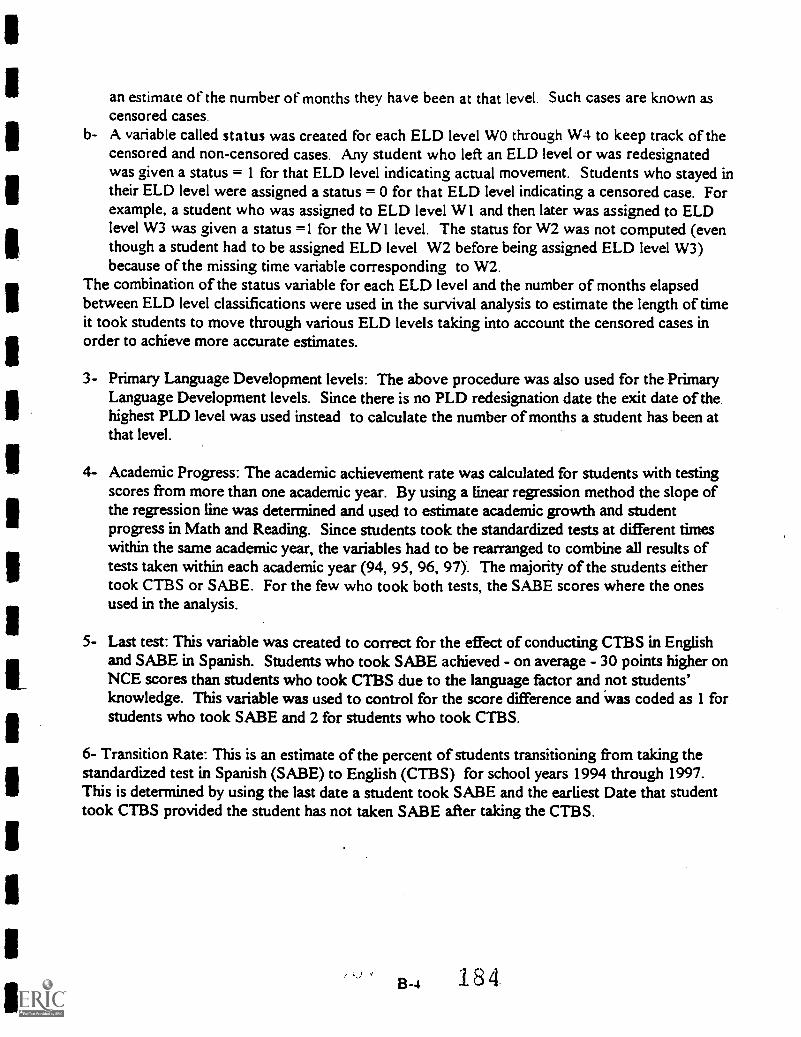
an estimate of the number of months they have been at that level Such cases are known ascensored cases.
b- A variable called status was created for each ELD level WO through W4 to keep track of thecensored and non-censored cases. Any student who left an ELD level or was redesignatedwas given a status = 1 for that ELD level indicating actual movement. Students who stayed intheir ELD level were assigned a status = 0 for that ELD level indicating a censored case. Forexample, a student who was assigned to ELD level WI and then later was assigned to ELDlevel W3 was given a status =I for the WI level. The status for W2 was not computed (eventhough a student had to be assigned ELD level W2 before being assigned ELD level W3)because of the missing time variable corresponding to W2.
The combination of the status variable for each ELD level and the number of months elapsedbetween ELD level classifications were used in the survival analysis to estimate the length of timeit took students to move through various ELD levels taking into account the censored cases inorder to achieve more accurate estimates.
3- Primary Language Development levels: The above procedure was also used for the PrimaryLanguage Development levels. Since there is no PLD redesignation date the exit date of thehighest PLD level was used instead to calculate the number of months a student has been atthat level.
4- Academic Progress: The academic achievement rate was calculated for students with testingscores from more than one academic year. By using a linear regression method the slope ofthe regression line was determined and used to estimate academic growth and studentprogress in Math and Reading. Since students took the standardized tests at different timeswithin the same academic year, the variables had to be rearranged to combine all results oftests taken within each academic year (94, 95, 96, 97). The majority of the students eithertook CTBS or SABE. For the few who took both tests, the SABE scores where the onesused in the analysis.
5- Last test: This variable was created to correct for the effect of conducting CTBS in Englishand SABE in Spanish. Students who took SABE achieved - on average - 30 points higher onNCE scores than students who took CTBS due to the language factor and not students'knowledge. This variable was used to control for the score difference and was coded as 1 forstudents who took SABE and 2 for students who took CTBS.
6- Transition Rate: This is an estimate of the percent of students transitioning from taking thestandardized test in Spanish (SABE) to English (CTBS) for school years 1994 through 1997.This is determined by using the last date a student took SABE and the earliest Date that studenttook CTBS provided the student has not taken SABE after taking the CTBS.
B-4 184

APPENDIX C
District and School Interviews
IL
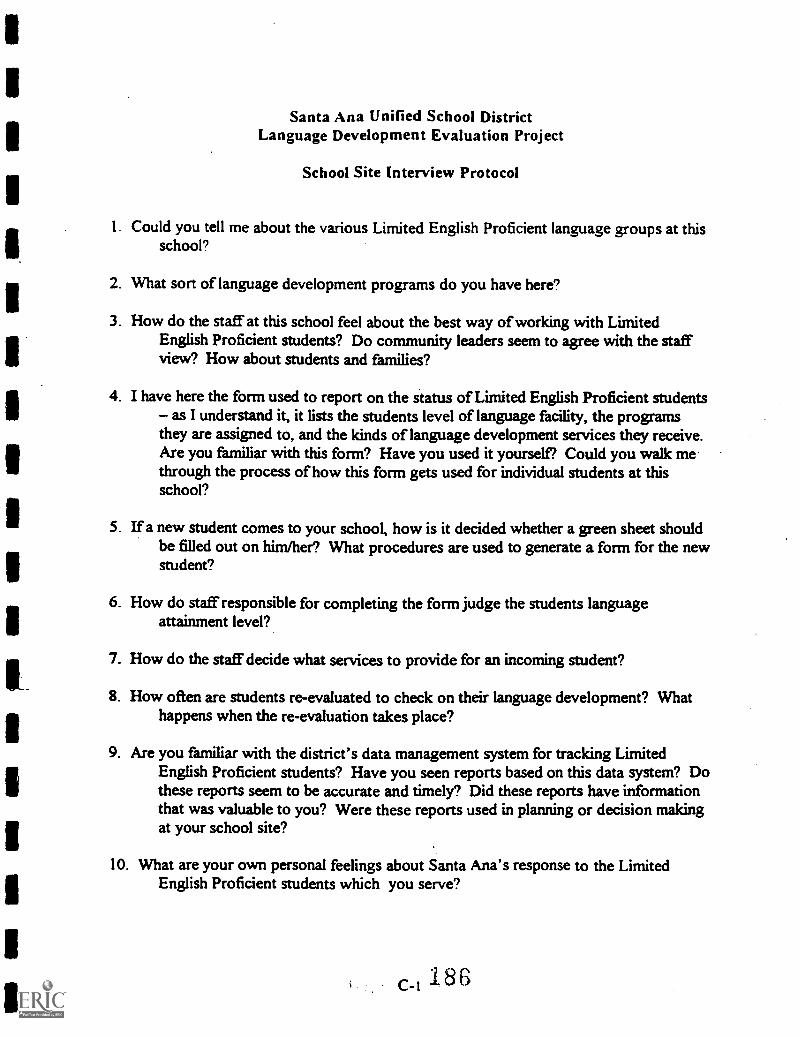
Santa Ana Unified School DistrictLanguage Development Evaluation Project
School Site Interview Protocol
1. Could you tell me about the various Limited English Proficient language groups at thisschool?
2. What sort of language development programs do you have here?
3. How do the staff at this school feel about the best way of working with LimitedEnglish Proficient students? Do community leaders seem to agree with the staffview? How about students and families?
4. I have here the form used to report on the status of Limited English Proficient studentsas I understand it, it lists the students level of language facility, the programs
they are assigned to, and the kinds of language development services they receive.Are you familiar with this form? Have you used it yourself? Could you walk methrough the process of how this form gets used for individual students at thisschool?
5. If a new student comes to your school, how is it decided whether a green sheet shouldbe filled out on him/her? What procedures are used to generate a form for the newstudent?
6. How do staff responsible for completing the form judge the students languageattainment level?
7. How do the staff decide what services to provide for an incoming student?
8. How often are students re-evaluated to check on their language development? Whathappens when the re-evaluation takes place?
9. Are you familiar with the district's data management system for tracking LimitedEnglish Proficient students? Have you seen reports based on this data system? Dothese reports seem to be accurate and timely? Did these reports have informationthat was valuable to you? Were these reports used in planning or decision makingat your school site?
10. What are your own personal feelings about Santa Ana's response to the LimitedEnglish Proficient students which you serve?

School and Central Office Interviews
Central Office Interviews School Interviews
Assistant Superintendent. Support Services
Director, Special Education
Coordinator, Special Education
Director, ELD/Bilingual Programs
Coordinator, Southeast Asian/Pacific Islander Student Programs
Coordinator, Migrant Education
Coordinator, Student Achievement Programs
Deputy Administrator, Elememary Division
Director, Student Success Team
Bilingual Resource Teacher
Director, Discipline Services
Program Analyst, Information Technology Center
Director, Information Technology Center
No Pico Elementary
Roosevelt Elementary
Taft Elementary
Jefferson Elementary
Heninger Elementary
Sierra Intermediate
Spurgeon Intermediate
Willard Intermediate
Valley High School
Century High School
1
1
1 LEP Student Program Services: Annual Survey
APPENDIX D
188

NAME:
DOE:LANG COOE:
OFFICE USE ONLY
REDESIGNATED TO FEP
EC rerO hler II0 Tier III8 Monitor. Year 1150 Monitor. Year 2.811 Monitor. Year 3
BASE PROGRAM
YIS:
LEP STUDENT PROGRAM SERVICESSanta Ana Unified School District
TEACHER:NATIONAL ORIGIN:GATE ARRIVED IN USA:
ISCHOOL I
NUMBERISCHOOL YEAR I STUDENT P.O. 3
aci
A
TEACHERS SHIHATURE:
PROGRAM CODES: (bubble only one)TBE/UTERACY/EASE - TRANSITIONAL BILINGUAL EDUCATION (NATIVE LANGUAGE INSTRUCTION)TBE/TLC - TRANSITIONAL LANGUAGE CLASS (TRANSITIONAL/SHELTERED ENGLISH)
0 ELD/IMMERSION/SHELTERED - WITH A BILINGUAL INSTRUCTIONAL ASSISTANT IN NATIVE LANGUAGEELD/IMMERSION/SHELTERED - WTTH A BILINGUAL INSTRUCTIONAL ASSISTANT IN OTHER LANGUAGEELD/IMMERSION/SHELTERED - NO BILINGUAL INSTRUCTIONAL ASSISTANT
0 ELD AND MAINSTREAM INSTRUCTIONMAINSTREAM ONLY
LANGUAGE DEVELOPMENT CODES: (bubble one n each group)
English Language Development Primary Language Development
LEP PRG: ELD 1 (Pre-Produ:tion) 0 LEP PRG: PLD 1 (Pre-Production)0 LEP PRG: ELD 2 (Early Production) 0 LEP PRG: PLD 2 (Early Production)
LEP PRG: ELD 3 (Speech Emergence) 0 LEP PRG: PLD 3 (Speech Emergence)LEP PRG: ELD 4 (Intermediate Fluency) 0 LEP PRG: PLD 4 (Intermediate Fluency)LEP PRG: ELD 5 (Advanced Fluency) 0 LEP PRG: PLD 5 (Advanced Fluency)
SERVICE CODES: (bubble one in each group)c ID READING: NATIVE LANGUAGE %.OS READING: TRANSMONAL ENGLISH i*0 READING: SHELTERED ENGUSHAMMERSION.-
t. READING: MAINSTREAM ENGLISH0 READING LEV: KINDER/ILLITERATE0 READING LEV: GRADE 1.-
: 0 READING LEV: GRADE 20 READING LEV: GRADE 30 READING LEV: GRADE 4-
READING LEV: GRADE 5-READING LEV: GRADE 6
0 READING LEV: GRADE 7 .READING LEV: GRADE
C READING LEV: GRADE 9
MAT1t NATIVE LANGUAGE I"S MATH: SHELTERED ENGUSHL0 MATH: MAINSTREAM ENGLISH0 SCIENCE NATIVE LANGUAGE0 SCIENCE: SHELTERED ENGLISH -
- 0 SCIENCE: MAINSTREAM ENGLISHJo SOCIAL STUDIES: NATIVE LANGUAGE
3 SOCIAL STUDIES: SHELTERED ENGLISHZ13 SOCIAL STUDIES: MAINSTREAM ENGUSHa LANG. ARTS: NATIVE LANGUAGE -ZS LANG. ARTS: SHELTERED ENGLISH8 LANG. ARTS: MAINSTREAM ENGLISH -
SHEET mir.NUMBER
g01.010011101111 DOME c. =CsMIAMI 00 NOT YAM IN MS AREA
ij
78420 1JCC806 (REV: 2(95)
MT COTT AWL& LE D- 1 is a
awe mows Ncs 61111101702n1 111304 Mond At

APPENDIX E
Report Cards Scannable Forms(Grades K through 5)
190

Mus
icP
anic
ipat
es in
act
iviti
es to
dev
elop
ski
lls in
rhy
thm
,m
elod
y aw
aren
ess,
form
and
style
Jnd
expr
essk
e Q
ualit
y00
OS
ON
0 +
0 -
An
I: ve
limem
s w
ith li
ne, s
hape
, col
or, s
pam
and
text
ure
in a
9rie
tv o
f an
activ
ities
0 0
0 S
()N
0 +
0 -
Dra
mat
ic P
lay
ilani
cipa
tes
in r
ole
play
, cha
nts,
nur
sery
rhy
mes
,gl
ipzI
gQ (
1_01
._11
NC
it_a_
--
Tot
al A
ttend
ance
(F
or th
e en
tire
acad
emic
year
)
Porten! 11
741-
Ca1
s-01
160
1101
8010
011
1011
1213
141
0 00
000
0000
000
00E
xcus
ed A
bsen
ces
110,
1I
bollo
ho14
u1su
f44
:117
4101
901
110
1112
1314
1
0 00
000
0000
0000
0U
nexc
used
Abs
ence
s
1.1
IIlu
buR
alsu
l 140
1748
4190
II
I16
16(6
1
o 00
000
00
1516
1213
191
0000
015
1617
1119
100
000
88)1
6161
61
fairl
y1.
..1 1
110
1101
14Z
1s01
fauf
r4ko
l9o1
I10
1112
1314
1 1s
1617
1219
1
0 00
000
0000
0000
0 00
0000
191
I11
10
1111
111111
E-1
Cal
iforn
ia E
duca
tion
Res
earc
h C
oope
rativ
e / S
anta
Ana
Uni
fied
Sch
ool D
im w
r
Tra
nscr
iptio
n F
orm
- K
G(A
cade
mie
yea
rs 9
4-95
, 95-
95, 9
6-97
)
The
tran
scrip
tion
form
s ar
e de
sign
ed fo
r co
llect
ing
grad
e po
int a
xera
ges
for
LEP
. FE
P
and
Eng
lish
only
spe
akin
g st
uden
ts fr
om th
eP
upil
Pro
gres
s R
epor
ts u
sed
at ih
e
elem
enta
ry s
choo
ls. T
he P
upil
Pro
gres
s R
epor
ts a
refo
und
in th
e st
uden
t CU
M fi
les.
The
sam
ple
of s
tude
nts,
for
who
m in
form
atio
n w
illbe
col
lect
ed, i
s be
ing
dun
II
rand
omly
from
sch
ool C
UM
file
s. T
he s
tude
ntC
UM
file
s al
eac
h sc
hool
are
file
d
clas
s co
rres
pond
ing
to th
e te
ache
r na
me
prin
ted
onea
ch tr
ansc
riptio
n fo
rm W
e lim
e
prov
ided
you
with
tran
scrip
tion
form
s w
hich
hav
epr
eprin
ted
stud
ent n
ames
. Ple
ase
find
the
CU
M fi
les
for
thes
e pa
rtic
ular
stu
dent
s.
For
eac
h of
the
sele
cted
CU
M fi
les
tran
scrib
eth
e P
upil
Pro
gres
s R
epor
t
Info
rmat
ion
for
acad
emic
yea
rs 9
4-93
, 93-
96, a
nd 9
6-97
(thi
rd tr
imes
ter-
only
) to
the
Uan
scrip
tion
form
s.U
se a
sep
arat
e tr
ansc
riptio
n fo
rm fo
r ea
chac
adem
ic y
ear.
Be
sure
to u
se th
e ap
prop
riate
tran
scrip
tion
form
with
the
corr
ect s
choo
l and
teac
her
nam
es fo
r ea
ch s
tude
nt.
Writ
e do
wn
the
stud
ent i
dent
ifica
tion
num
ber
onth
e fo
rm a
nd d
arke
n th
e bu
bble
s
corr
espo
ndin
g to
it.
Mak
e su
m th
at e
ach
Item
on
the
form
has
bee
nan
swer
ed. I
f an
ansn
er is
mis
sing
,
plea
se le
ave
the
corr
espo
ndin
g bu
bble
em
pty.
For
Indi
catin
g st
uden
t atte
ndan
ce, p
leas
eda
rken
the
bubb
le(s
) th
at c
orre
spon
ds to
the
num
ber
of d
ays
abse
nt fo
r th
e en
tire
scho
ol y
ear.
Whe
re n
eces
sary
dar
ken
mul
tiple
bub
bles
to in
dica
te th
e re
quire
d va
lue.
Alth
ough
you
are
tran
scrib
ing
grad
es fr
om th
e th
ird tr
imes
ter
only
, ple
ase
be s
ure
toad
d th
e nu
mbe
r of
day
s
abse
nt fo
r th
e en
tire
scho
ol y
ear
and
dark
en th
ebu
bble
s ac
cord
ingl
y.
Use
eith
er b
lack
ink
or a
02
penc
il to
dar
ken
the
bubb
les.
Do
not u
se r
ed in
k.
f
Stu
dent
Iden
tific
atio
n N
umbe
r:
Id N
umbe
r0immlinlInl 6 1E1131
IIIgagi
ta
tiN9
11
11
11
11
11
192
I M
I I
11 I
MN
MI
UM
MI
MI
=I
1M
ON
IIN
N I
M

NM
OM
MN
1111
Th
alII
IIII
MI
NO
MO
M M
I W
M M
I
For
Off
ice
Use
Onl
y
I ti
111
1)14
1I
6117
1 44
01 I
1111
1211
3114
1151
1161
1711
8119
1201
0 00
000
0000
000
0000
0
193
Cal
ifor
nia
Edu
catio
n R
esea
rch
Coo
pera
tive
/ San
ta A
na U
nifi
ed S
choo
lD
istr
ict
Lin
ked
Ert
gibk
Pro
fici
ent
Tre
essc
ripl
ion
Form
- G
rade
s 1,
2, 3
(Am
en*
Yea
r 94
-91)
Bef
ore
com
plet
ing
this
fan
o, p
leas
e be
sur
e to
rea
d th
e T
each
erIn
stru
ctio
n Sh
eet t
hat
is in
you
r en
velo
pe. T
be tr
ansc
ript
ion
form
s ir
e de
sign
ed f
or c
olle
ctin
g gr
ade
poin
t
aver
ages
for
LE
P. F
EP
and
Eng
lish
only
spe
akin
gst
uden
ts f
rom
the
Pupi
l Pro
gres
s
Rep
orts
use
d at
the
elem
enta
ry s
choo
ls. T
he P
upil
Prog
ress
Rep
orts
are
foun
d in
the
stud
ent C
UM
file
s.
The
sam
ple
of s
tude
nts,
for
who
m in
form
atio
n w
ill b
e co
llect
ed, i
s be
ing*s
unra
ndom
ly f
rom
sch
ool C
UM
file
s. T
he s
tude
nt C
UM
file
s at
eac
h sc
hool
are
file
d by
Cla
n co
rres
pond
ing
to th
e te
ache
r na
me
prin
ted
on e
ach
tran
scri
ptio
nfo
nn. P
leas
e
find
the
CU
M f
iles
for
thes
e pa
rtic
ular
stu
dent
s.Fo
r ea
ch o
f th
e se
lect
ed C
UM
file
s tr
ansc
ribe
the
Pupi
l Pro
gres
s R
epor
tIn
form
atio
n fo
r ac
adem
ic y
ears
94-
93, 9
5-96
, and
96-
97 (
thir
dtr
imes
ter
only
) to
the
tran
scip
tion
form
s.U
se a
sep
arat
e tr
ansc
ript
ion
form
for
eac
h ac
adem
ic y
ear.
Be
sure
to u
se th
e ap
prop
riat
e tr
ansc
ript
ion
fern
s w
ith th
e co
rrec
t lan
guag
e st
atus
,L
EP,
FE
P, a
nd E
nglis
h-on
ly a
nd th
e co
rrec
t yea
r.-
*
Wri
te d
own
the
stud
ent I
dent
ific
atio
n nu
mbe
r on
the
form
and
dar
ken
the
corr
espo
ndin
g bu
bble
'.M
ake
sure
that
eac
h be
nt o
n th
e fo
rm h
as b
een
answ
ered
. If
an a
nsw
eris
mis
sing
,
plea
se le
ave
the
corr
espo
ndin
g bu
bble
em
pty.
If th
e in
form
atio
n on
the
form
doe
s
not a
pply
to a
par
ilaila
r st
uden
t, th
en f
ill in
the
corr
espo
ndin
g"N
A"
bubb
le o
r
leav
e th
e bu
bble
bla
nk.
For
indi
catin
g st
uden
t atte
ndan
ce, p
leas
e da
rken
the
bubb
le(s
) th
at c
orre
spon
ds to
the
num
ber
of d
ays
abse
nt f
or th
e en
tire
scho
ol y
ear.
Whe
re n
eces
sary
dark
en
mul
tiple
bub
bles
to in
dica
te th
e re
quir
ed v
alue
. Alth
ough
you
arc
tran
scri
bing
grad
es f
rom
the
thir
d tr
imes
ter
only
, ple
ase
be s
ure
toad
d th
e nu
mbe
r of
day
s
abse
nt f
or th
e en
tire
scho
ol y
ear
and
dark
en th
e bu
bble
s ac
cord
ingl
y.If
the
thir
d
trim
este
r gr
ades
are
mis
sing
for
any
giv
en y
ear,
then
igno
re th
eat
tend
ance
info
rmat
ion
on th
at f
orm
.U
se e
ither
bla
ck in
k or
a I
n pe
ncil
to d
arke
n th
e bu
bble
s. D
o no
t use
red
ink.
Stud
ent I
dent
ific
atio
n N
umbe
r:
E-2
id N
umbe
r0M
EM
= 6
'Inn
0460
100
rI
BE
ST
CO
PY
AV
AIL
AB
LE
194
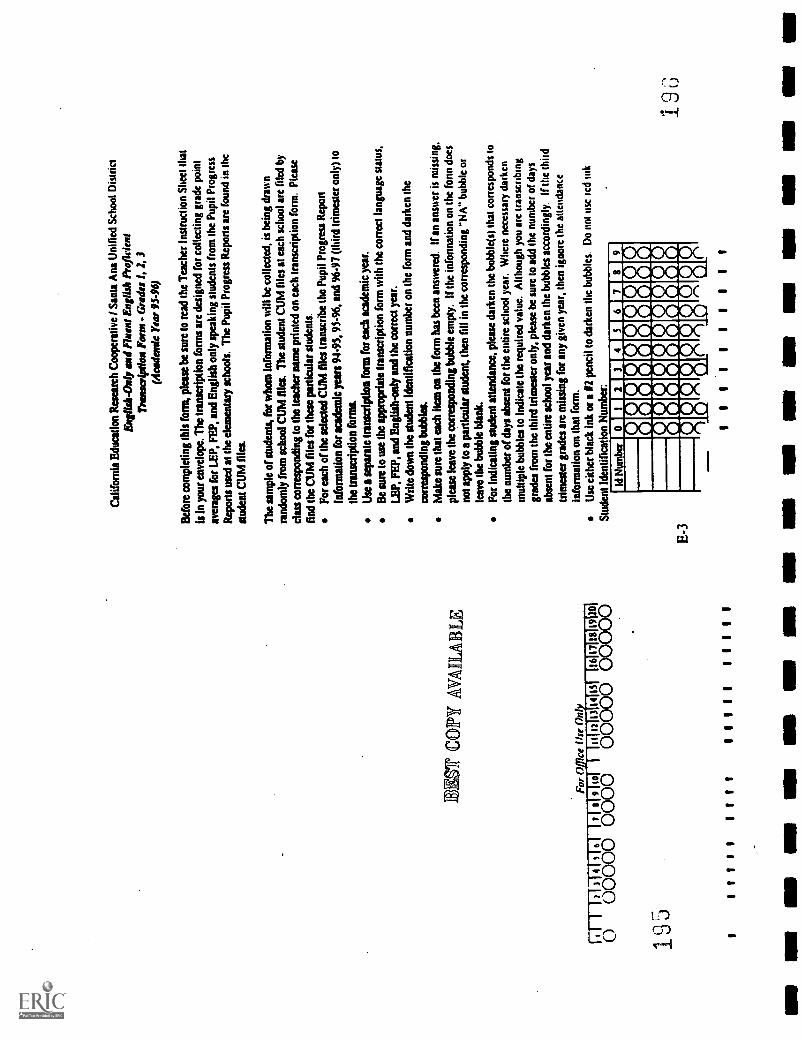
MS
T C
OP
Y A
VM
LAB
LE
I .1
111
1314
1,1.
117
111:
1:11
"01e
n(12
3411
s
000
000
0000
000
00
1 5
1161
1711
8119
18
1111
111
1111
111
1111
1
E-3
Cal
iforn
ia E
duca
tion
Res
earc
h C
oope
rativ
e / S
anta
Ana
Uni
fied
Sch
ool D
istr
ict
Eng
lish-
Onl
y an
d flu
ent E
nglis
h P
rofic
ient
Tra
nscr
iptio
n F
orm
- G
rade
s 1,
2,3
(Aca
dem
ic Y
ear
95-9
6)
Bef
ore
com
plet
ing
this
form
, ple
ase
be s
ure
to r
ead
the
Tea
cher
Inst
ruct
ion
She
et th
at
is in
you
r en
velo
pe. T
he tr
ansc
riptio
n fo
rms
are
desi
gned
for
colle
ctin
g gr
ade
poin
t
aver
ages
for
LEP
, FE
P, a
nd E
nglis
h on
ly s
peak
ing
stud
ents
from
the
Pup
il P
rogr
ess
Rep
orts
use
d at
the
elem
enta
ry s
choo
ls. T
he P
upil
Pro
gres
s R
epor
ts a
re fo
und
in th
e
stud
ent C
UM
file
s.
The
sam
ple
of s
tude
nts,
for
who
m In
form
atio
n w
ill b
e co
llect
ed, i
s be
ing
draw
nra
ndom
ly fr
om s
choo
l CU
M fi
les.
The
stu
dent
CU
M fi
les
at e
ach
scho
ol a
re fi
led
bycl
ass
corr
espo
ndin
g to
the
teac
her
nam
e pr
inte
d on
eac
h tr
ansc
riptio
n fo
rm. P
leas
e
find
the
CU
M fi
les
for
thes
e pa
rtku
lar
stud
ents
.F
or e
ach
of th
e se
lect
ed C
UM
file
s tr
ansc
ribe
the
Pup
il P
rogr
ess
Rep
onln
fOrM
atio
n fo
r ac
adem
ic y
ears
94-
95, 9
5-96
, and
96-
97 (
third
trim
este
r on
ly)
to
the
tran
scrip
tion
form
&U
se 1
1 se
para
te tr
ansc
riptio
n fO
rell
fOr
Mt a
cade
mic
yea
r.B
e su
re to
use
the
appr
opria
te tr
ansc
riptio
n fo
rm w
ith th
e co
rrec
t lan
guag
e st
atus
,
LEP
, FE
P, a
nd E
nglis
h-on
ly a
nd th
e co
rrec
t yea
r.W
rite
dow
n th
e st
uden
t ide
ntifi
catio
n nu
mbe
r on
the
form
and
dar
ken
the
corr
espo
ndin
g bu
bble
s.M
ake
sure
that
eac
h ite
m o
n th
e fo
rm h
as b
een
answ
ered
. Ira
n an
swer
is m
issi
ng,
plea
se le
ave
the
corr
espo
ndin
g bu
bble
em
pty.
If th
e in
form
atio
n on
the
fonn
doe
s
not a
pply
to a
par
ticul
ar s
tude
nt, t
hen
fill i
n th
e co
rres
pond
ing
"NA
" bu
bble
Of
leav
e th
e bu
bble
bla
nk.
For
Indi
catin
g st
uden
t atte
ndan
ce, p
leas
e da
rken
the
bubb
le(s
) th
at c
orre
spon
ds to
the
num
ber
of d
ays
abse
nt fo
r th
e en
tire
scho
ol y
ear.
Whe
re n
eces
sary
dar
ken
mul
tiple
bub
bles
to in
dica
te th
e re
quire
d va
lue.
Alth
ough
you
are
tran
scrib
ing
grad
es fr
om th
e th
ird tr
imes
ter
only
, ple
ase
be s
ure
to a
dd th
e nu
mbe
r of
day
s
abse
nt fo
r th
e en
tire
scho
ol y
ear
and
dark
en th
e bu
bble
s ac
cord
ingl
y. If
the
third
trim
este
r gr
ades
are
mis
sing
for
any
give
n ye
ar, t
hen
igno
re th
e at
tend
ance
info
rmat
ion
on th
at fo
rm.
Use
eith
er b
lack
ink
or a
in p
enci
l to
dark
en th
e bu
bble
s. D
o no
t use
red
ink
St
It Id
entif
icat
ion
Num
ber:
Id N
umbe
r0
I2
34
36
78
9
ri0.6
0000
.M
irriN
FT
IPiri
riil r
irir
iFlP
iPP
M
eL
e Le
ei SIe
II
Si 01e
11
11
11
11
11
1 9
(3
INN
NM
UR
MB
MI
MI
OM
MI
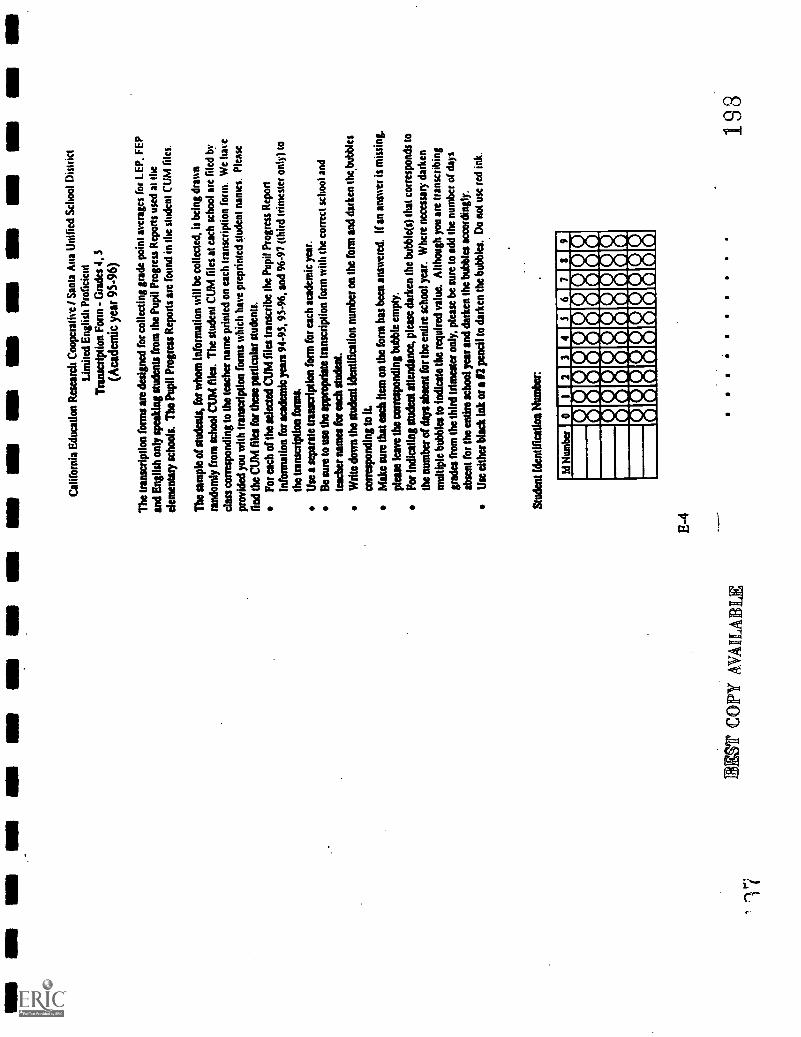
IN N
M N
MN
M -
a a
MB
MI
a IM
IIIM
MM
I
E-4
DE
M C
OPY
AV
AIL
AB
Cal
ifor
nia
Edu
catio
n R
eses
rch
Coo
pera
tive
/ San
ta A
na U
nifi
ed S
choo
l Dis
tric
tL
imite
d E
nglis
h Pr
ofic
ient
Tra
nscr
iptio
n Fo
rm -
Gra
des
4, 3
(Aca
dem
ic y
ear
95-9
6)
The
tran
scri
ptio
n fo
rms
are
desi
gned
for
col
lect
ing
grad
e po
int a
vera
ges
for
LE
P.FE
P
and
Eng
lish
only
spe
akin
g st
uden
ts f
rom
the
Pupi
l Pro
gres
s R
epor
ts u
sed
at th
eel
emen
tary
sch
ools
. The
Pup
il Pr
ogre
ss R
epor
ts a
re f
ound
in th
e st
uden
t CU
M f
iles
The
sam
ple
of s
tude
rds,
for
who
m in
form
atio
n w
ill b
e co
llect
ed, i
s be
ing
draw
nra
ndom
ly f
rom
sch
ool C
UM
file
s. T
he s
tude
nt C
UM
file
s at
eac
h :s
hoot
are
file
dby
doss
cor
resp
ondi
ng to
the
teac
her
nam
e pr
inte
d on
eac
h tr
ansc
ript
ion
form
. We
have
prov
ided
you
with
tran
scri
ptio
n fo
rms
whi
ch h
ave
prep
rint
ed s
tude
nt n
ames
Ple
ase
find
the
CU
M f
iles
for
thes
e pa
rtic
ular
stu
dent
s.Fo
r ea
ch o
f th
e se
lect
ed C
UM
file
s tr
ansc
ribe
the
Pupi
l Pro
gres
s R
epor
tIn
form
atio
n fo
r ac
adem
ic y
ears
94-
93, 9
3-96
, and
96-
97 (
thir
d tr
imes
ter
only
) to
the
tran
scri
ptio
n fo
rms.
Use
a s
epar
ate
tran
scri
ptio
n fo
rm f
or e
ach
acad
emic
yea
r.B
e su
re to
use
the
appr
opri
ate
tran
scri
ptio
n fo
rm w
ith th
e co
rrec
t sch
ool a
ndre
iche
r na
mes
far
esc
h st
uden
t.W
rite
dow
n th
e st
uden
t ide
ntif
icat
ion
num
ber
on th
e fo
rm a
nd d
arke
nth
e,bu
lkle
s
corn
spon
ding
to I
LM
ake
sure
that
eac
h ite
m o
n th
e fo
nn h
as b
een
answ
ered
. If
an a
nsw
er is
mis
sing
.
plea
se le
ave
the
corr
espo
ndin
g bu
bble
em
pty.
For
indi
catin
g st
uden
t atte
ndan
ce, p
leas
e da
rken
the
bubb
le(s
) th
at c
orre
spon
ds to
the
num
ber
of d
ays
&bu
nt f
or tb
c en
tire
scho
ol y
ear.
Whe
re n
eces
sary
dar
ken
mul
tiple
bub
bles
to in
dica
te th
e re
quir
ed v
alue
. Alth
ough
you
are
tran
scri
bing
grad
es f
rom
the
thir
d tr
imes
ter
only
, ple
ase
be s
ure
to a
dd th
e nu
mbe
r of
day
sab
sent
for
the
entir
e sc
hool
yes
r an
d da
rken
the
bubb
les
acco
rdin
gly.
Use
eith
er b
lack
Ink
or
02 p
enci
l to
dark
en th
e bu
bble
s. D
o no
r us
e re
d in
k.
Stud
ent I
dent
ific
atio
n N
umbe
r:
Id N
umbe
r0
1111
1111
1131
11 6
min
[4:1
Mt]
titi
198
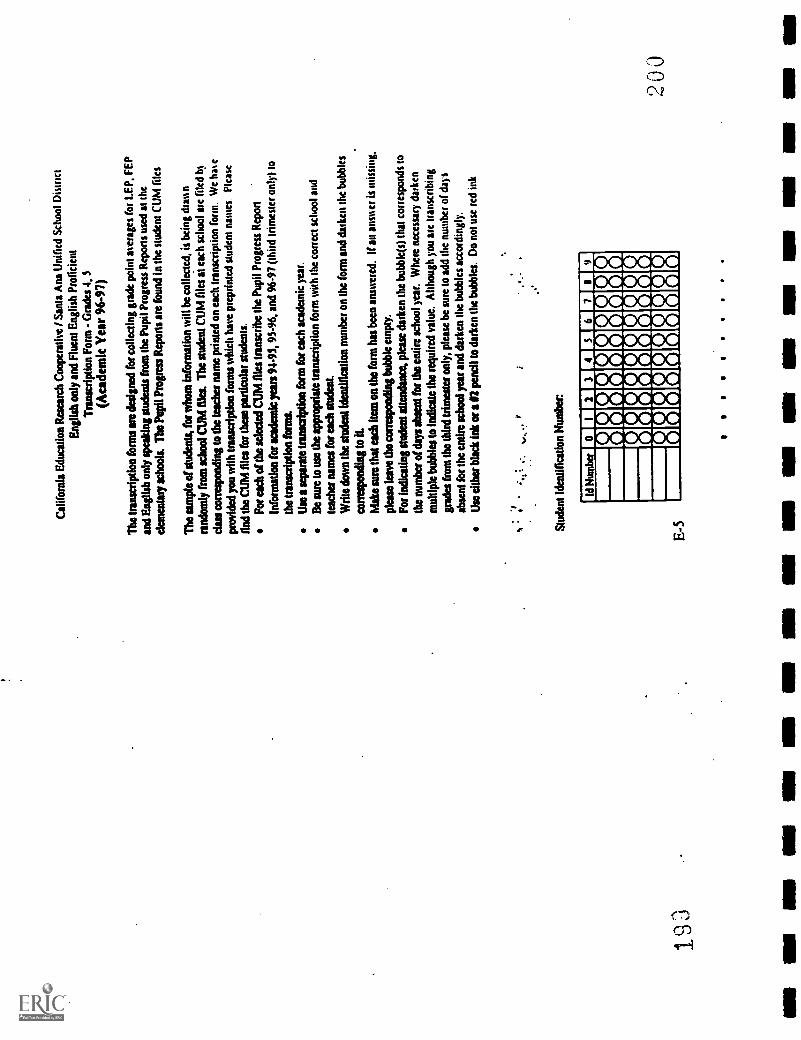
1 9
3
Cal
iforn
ia E
duca
tion
Res
earc
h C
oope
rativ
e / S
anta
Ana
Uni
fied
Sch
ool D
istr
ict
Eng
lish
only
and
Flu
ent E
nglis
h P
rofic
ient
Tra
nscr
iptio
n F
orm
- G
rade
s 4,
5(A
cade
mic
Yea
r 96
-97)
The
tran
scrip
tion
form
s ar
e de
sign
ed fo
r co
llect
ing
grad
e po
int a
vera
ges
for
LEP
. FE
Pan
d E
nglis
h on
ly s
peak
ing
stud
ents
from
the
Pup
il P
rogr
ess
Rep
orts
use
d at
the
elem
enta
ry s
choo
ls. T
he P
upil
Pro
gres
s R
epon
s ar
e fo
und
in th
e st
uden
t CU
M fi
les
The
sam
ple
of s
tude
nts,
for
who
m in
form
atio
n w
in b
e co
llect
ed, i
s be
ing
(Min
nra
ndom
ly fr
om s
choo
l CU
M fi
les.
The
stu
dent
CU
M fi
les
at e
ach
scho
ol a
re ti
led
In
duo
corr
espo
ndin
g to
the
teac
her
nam
e pr
inte
d on
eac
h tr
ansc
riptio
n fo
rm. W
eha
te
prov
ided
you
with
tran
scrip
tion
form
s w
hich
hav
e pr
eprin
ted
stud
ent n
ames
Ple
ase
find
the
CU
M fi
les
for
thes
e pa
rtic
ular
stu
dent
s.F
or e
ach
of th
e se
lect
ed C
UM
file
s tr
ansc
ribe
the
Pup
il P
rogr
ess
Rep
ort
Info
rmat
ion
for
acad
emic
yea
rs 9
443,
93-
96, a
nd 9
6-97
(th
ird tr
imes
ter
onl))
to
the
tran
scrip
tion
form
s.U
se a
sep
arat
e tr
ansc
riptio
n fo
rm fo
r ea
ch a
cade
mic
yea
r.
Be
sure
to u
se th
e ap
prop
riate
tran
scrip
tion
form
with
the
corr
ect s
choo
l and
teac
her
nam
es fo
r ea
ch s
tude
nt.
Writ
e do
wn
the
stud
ent i
dent
ifica
tion
num
ber
on th
e fo
rm a
nd d
arke
n th
e bu
bble
s
corr
espo
ndin
g to
it.
Mak
e su
re th
at e
ach
item
on
the
form
has
bee
n an
swer
ed. i
f an
answ
er is
mis
sing
,
plea
se le
ave
the
corr
espo
ndin
g bu
bble
em
pty.
For
indi
catin
g st
uden
t atte
ndan
ce, p
leas
e da
rken
the
bubb
lgs)
that
cor
resp
onds
to
the
num
ber
of d
ays
abse
nt fo
r th
e en
tire
scho
ol y
ear.
Whe
re n
eces
sary
dar
ken
mul
tiple
bub
bles
to in
dica
te th
e re
quire
d va
lue.
Alth
ough
you
are
tran
scrib
ing
grad
es fr
om th
e th
ird tr
imes
ter
only
, ple
ase
be s
ure
to a
dd th
e nu
mbe
r of
day
s
abse
nt fo
r th
e en
tire
scho
ol y
ear
and
dark
en th
e bu
bble
s ac
cord
ingl
y.U
se e
ither
bla
ck in
k or
a II
pen
cil t
o da
rken
the
bubb
les.
Do
not u
se r
ed in
k
Stu
dent
iden
tific
atio
n N
umbe
r
E-5
Id H
umbe
r0
I2
34
36
75
9
......
....
ti 61
61
61 P
Ati
200
IN U
N N
M M
NM
I NM
NB
INN
MI N
M

APPENDIX FReferences
201

References
Baeten-Bedrdsmore. H. & Lebrun. N. (1991). Trilingual education in the Grand Duchy ofLuxembourg. In 0. Garcia (Ed.). Bilingual education. Focusschrift in honor ofJoshua AFishman (pp. 107-122). Philadelphia: John Benjamins Publishing Company.
Bratt-Paulston, C. (Ed.). (1988). International handbook of bilingualism and bilingual education.New York: Greenwood Press.
Brown, R. (1973). Development of the first language in the human species. AmericanPsychologist. 28 97-106.
CoWer, V. P. (1989). How long? A synthesis of research on academic achievement in a secondlanguage. TESOL Quarterly. 23(3), 509-531.
Cummins, J. (1978). Metalinguistic development of children in bilingual education programs:Data from Irish and Canadian Ukrainian-English Programs. In M, Paradis (Ed.), TheFourth Lucas Forum 1977 (pp. 127-138). Columbia, SC: Hornbeam Press.
Cummins; J. (1979). Linguistic interdependence and the educational development of bilingualchildren. Review of Educational Research. 19, 222-251.
Cummins, J. (1980). The entry and exit fallacy in bilingual education. NABE Journal. 4(3), 25-60.
Cummins, J. (1981a). Age on arrival and immigrant second language learning in Canada: Areassessment. Applied Linguistics, 2, 132-149.
Cummins, J. (1981b). The role of primary language development in promoting educationalsuccess for language minority students. In California Department of Education (Ed.),Schooling and language minority students: A theoretical framework (pp. 3-49). LosAngeles, CA: Evaluation, Dissemination, and Assessment Center, California StateUniversity, Los Angeles.
Curnmins, J. (1994). Primary language instruction and the education of language minoritystudents. In C. Leyba (Ed.), Schooling and language minority students: A theoreticalframework (pp. 3-46). (2nd. Ed.). Los Angeles, CA: Evaluation, Dissemination, andAssessment Center, California State University, Los Angeles.
Dulay, H. & Burt, M. K. (1974). Natural sequences in child second language acquisition.Language Learning, 24, 37-53.
Edelsky, C., Hudelson, S., Flores, B., Barkin, F., Altwerger, B., & filbert, K. (1983).Semilingualism and language deficit. Applied Linguistics. 4, 1-22.
ernhardt, E. B. & Kamil, M. L. (1995). Interpreting relationships between L 1 and L2 reading:Consolidating the Linguistic threshold and the linguistic interdependence hypotheses.Applied Linguistics, 16(1), 15-34.
Fernandez, R. M. & Nielsen, F. (1986). Bilingualism and Hispanic scholastic achievement:Some baseline results. Social Science Research, 15, 43-70.
Gandira, P. (1997). Review of the research on instruction of limited English proficient students.The University of California, Davis.
Garcia, H. D. C. (1981). Bilingualism, confidence and college achievement. Center for theSocial Organization of Schools: Johns Hopkins University.
Grosjean, F. (1982). Life with two languages: An introduction to bilingualism. Cambridge,MA. Harvard University Press.
F-1
202

Hakuta. K. (1986) The mirror of language The debate on bilingualism New York. BasicBooks
Hornberger. N. H. (1991). Extending enrichment bilingual education. Revisiting typologies andredirecting policy. In 0. Garcia (Ed.), Bilingual education. Focusschrift in honor ofJoshua A. Fishman (pp 215-234). Philadelphia: John Benjamins Publishing Company.
Kolers, P. (1978). On the representations of experience. In D. Gerver & H. Sinaiko (Eds.),Language interpretations and communication. New York: Plenum Press.
Lessow-Hurley. J. (1996). The foundations of dual language instruction. (2nd edition). WhitePlains, NY. Longman.
Mackey, W. F. (1972). A typology of bilingual education. In J. A. Fishman (Ed.), Advances inthe sociology of languages (pp. 413-432).. The Hague: Mouton.
Mannheim, B. (1984). Una nacion acorrolada: Southern Peruvian Quechua language planningand politics in historical perspective. Language in Society, 13, 291-309.
Paivio, A. & Desrochers, A. (1980). A dual-coding approach to bilingual memory. CanadianJournal of Psychology, 34, 388-99.
Paradis, M. (1980). Language and thought in bilinguals. In W. McCormack & H. J. Izzo(Eds.), The sixth LACUS forum. Columbia, SC: Hornbeam Press.
Pease-Alvarez, L., & Winsler, A. (1994). Cuando el maestro no habla espailol: Children'sbilingual language practices in the classroom. TESOL Quarterly. 28(3), 507-535.
Ramirez, D., Yuen, S. D., & Ramsey, D. R. (1991). Final Report: Longitudinal study of Englishimmersion strategy. earlv-exit and late-exit transitional bilingual education programs forlanguage-minority children. (Department of Education Contract No. 300-87-0156). SanMateo, CA: Aguirre International.
Richard-Amato, P. (1996). Making it happen: Interaction in the second language classroom.(2nd edition). New York: Longman.
Ruiz, R. (1984). Orientations in language planning. NABE Journal. 8, 15-34.Selinker, L., Swain, M., & Dumas, G. (1975). The interlanguage hypothesis extended to
children. Language Learning, 25, 139-52.Shin, F. H., & Krashen, S. D. (1996). Teacher attitudes toward the principles of bilingual
education and toward students' participation in bilingual programs: Same or different?Bilingual Research Journal. 20(1), 45-54.
Skutnabb-Kangas, T. & Toukomaa, P. (1976). Teaching migrant children's mother tongue andlearning the language of the host country. Helsinki: The Finnish National Commission forUNESCO.
Thomas, W., & Collier, V. P. (1997). School effectiveness for language minority students.George Washington University: National Clearinghouse for Bilingual Education.
Troike, R. (1978). Research evidence for the effectiveness of bilingual education. NABEJournal 3(1), 13-24.
Trueba, H. T. (1979). Bilingual education models: Types and designs. In H. T. Tnieba & C.Barnett-Ncurahi (Eds.), Bilin al ulticultura education and the rofess'onal from theoto practice (pp. 54-73). Rowley, MA: Newbury Hquse.
F-?
203

up 5.34 q-U.S. Department of Education
Office of Educational Research and Improvement (OERI)National Library of Education (NLE)
Educational Resources Information Center (ERIC)
REPRODUCTION RELEASE(Specific Document)
I. DOCUMENT IDENTIFICATION:
Title: EVALUATION OF ENGLISH LANGUAGE DEVELOPMENT PROGRAMS IN THE SANTA ANA UNIFIEDSCHOOL DISTRICT: A REPORT ON DATA SYSTEM RELiABILITY AND STATISTICAL MODELING OFVW-IC:RAM TMPACTS
Author(s): DOUGLAS E . MITCHELL , TOM DE S T INO , RITA KARAM
Corporate Source: Pubfication Date:
CALIFORNIA EDUCATIONAL RESEARCH COOPERATIVE (CERC) '1\1StfttlE101'970UNTVTIRSTTV nF CALTWIRNTA, RTUFRCT1IF
II. REPRODUCTION RELEASE:In order to disseminate as widely as possible timely and significant materials of interest to the educational community, documents announced in the
monthly abstract journal of the ERIC system, Resources In Educabbn (R1E), are usually made available to users in microfiche, reproduced paper copy,and electronic media, and sold through the ERIC Document Reproduction Service (EDRS). Credit is given to the source of each document, and, ifreproduction release is granted, one of the following notices is affored to the document.
If permission is granted to reproduce and disseminate the identified document, please CHECK ONE of the following three options and sign at the bottomof the page.
The sample sticker shown below will beaffixed to all Level 1 documents
1
PERMISSION TO REPRODUCE ANDDISSEMINATE THIS MATERIAL HAS
BEEN GRANTED BY
TO THE EDUCATIONAL RESOURCESINFORMATION CENTER (ERIC)
Level 1
VACheck here for Level 1 release, permitting reproductionand dissemination in microfiche or other ERIC archival
media (e.g., electronic) and paper copy.
Sighere,-*plea
The sample sticker shown below will beaffixed to all Level 2A documents
PERMISSION TO REPRODUCE ANDDISSEMINATE THIS MATERIAL IN
MICROFICHE, AND IN ELECTRONIC MEDIAFOR ERIC COLLECTION SUBSCRIBERS ONLY,
HAS BEEN GRANTED BY
2A
\e
TO THE EDUCATIONAL RESOURCESINFORMATION CENTER (ERIC)
Level 2A
Check here for Level 2A release, permitting reproductionand dissemination in microfiche and in electronic media
for ERIC archival collection subsolbers only
The sample sticker shown below will beaffixed to all Level 28 documents
PERMISSION TO REPRODUCE ANDDISSEMINATE THIS MATERIAL IN
MICROFICHE ONLY HAS BEEN GRANTED BY
2B
TO THE EDUCATIONAL RESOURCESINFORMATION CENTER (ERIC)
Levet 28
Check here for Level 2B release. permitfingreproduction and dissemination in mianfiche only
Documents will be processed ea indicated provided reproduction quality permits.If permission to reproduce is granted, but no box is checked, documents will be processed et Level 1.
I hereby grant to the Educational Resources Information Center (ERIC) nonexclusive permission to reproduce and disseminate this documentas indicated above. Reproduction from the ERIC microfiche or electronic media by persons other than ERIC employees and its systemcontractors requires permission from the copyright holder. Exception is made for non-profit reproduction by libraries and other service agenciesto satisfy informati needs of educators in response to discrete inquiries.
L , RIVERS IDE , CA 9 25 21
Printed Name/Position/Title:
JANE ZYKdAISKI PUBLICATIONTelephone: FAX:
909-787-3026 909-787-3491,i4151ef51114ltd.dMOWSKI@UCR . 6-1-98
(over)

III. DOCUMENT AVAILABILITY INFORMATION (FROM NON-ERIC SOURCE):
If permission to reproduce is not granted to ERIC, or, if you wish ERIC to cite the availability of the document from another source, pleaseprovide the following information regarding the availability of the document. (ERIC will not announce a document unless it is publiclyavailable, and a dependable source can be specified. Contributors should also be aware that ERIC selection criteria are significantly morestringent for documents that cannot be made available through EDRS.)
Publisher/Distributor:
Address:
Price:
IV. REFERRAL OF ERIC TO COPYRIGHT/REPRODUCTION RIGHTS HOLDER:
If the right to grant this reproduction release is held by someone other than the addressee, please provide the appropriate name andaddress:
Name:
Address:
V. WHERE TO SEND THIS FORM:
Send this form to the following ERIC Clearinghouse:THE UNIVERSITY OF MARYLAND
ERIC CLEARINGHOUSE ON ASSESSMENT AND EVALUATION1129 SHRIVER LAB, CAMPUS DRIVE
COLLEGE PARK, MD 20742-5701Attn: Acquisitions
However, if solicited by the ERIC Facility, or if making an unsolicited contribution to ERIC, return this form (and the document beingcontributed) to:
ERIC Processing and Reference Facility1100 West Street, rd Floor
Laurel, Maryland 20707-3598
Telephone: 301-497-4080Toll Free: 800-799-3742
FAX: 301-953-0263e-mall: [email protected]
WWW: http://ericfac.piccard.csc.com
EFF-088 (Rev. 9/97)PREVIOUS VERSIONS OF THIS FORM ARE OBSOLETE.