DOCUMENT DE TRAVAIL N° 415
29
DOCUMENT DE TRAVAIL N° 415 DIRECTION GÉNÉRALE DES ÉTUDES ET DES RELATIONS INTERNATIONALES THE IMPACT OF A ‘SODA TAX’ ON PRICES. EVIDENCE FROM FRENCH MICRO DATA Nicoletta Berardi, Patrick Sevestre, Marine Tepaut and Alexandre Vigneron December 2012
Transcript of DOCUMENT DE TRAVAIL N° 415

DOCUMENT
DE TRAVAIL
N° 415
DIRECTION GÉNÉRALE DES ÉTUDES ET DES RELATIONS INTERNATIONALES
THE IMPACT OF A ‘SODA TAX’ ON PRICES.
EVIDENCE FROM FRENCH MICRO DATA
Nicoletta Berardi, Patrick Sevestre, Marine Tepaut and Alexandre Vigneron
December 2012

DIRECTION GÉNÉRALE DES ÉTUDES ET DES RELATIONS INTERNATIONALES
THE IMPACT OF A ‘SODA TAX’ ON PRICES.
EVIDENCE FROM FRENCH MICRO DATA
Nicoletta Berardi, Patrick Sevestre, Marine Tepaut and Alexandre Vigneron
December 2012
Les Documents de travail reflètent les idées personnelles de leurs auteurs et n'expriment pas
nécessairement la position de la Banque de France. Ce document est disponible sur le site internet de la
Banque de France « www.banque-france.fr ».
Working Papers reflect the opinions of the authors and do not necessarily express the views of the Banque
de France. This document is available on the Banque de France Website “www.banque-france.fr”.

The impact of a ‘soda tax’ on prices.Evidence from French micro data
N�������� B����∗, P���� S������†
M���� T�����‡, A������� V������§¶
December 19, 2012
∗Banque de France.†Banque de France and Université de Paris I - Panthéon Sorbonne.‡Université de Paris I - Panthéon Sorbonne.§Université Paris-Est Créteil¶The authors wish to thank Prixing, the start-up that provided us with the data used in this paper
and in particular Eric Larchevêque, the owner and CEO of the company. Special thanks too to CélineBonnet, Pauline Givord, Vincent Requillart and Julio Rotemberg as well as to numerous colleagues fromthe Banque de France for their comments on the first draft of this paper. Errors and shortcomings areour own. The views expressed in this paper are those of the authors and do not necessarily representthose of their institutions.
1
n805472
Zone de texte

Résumé : A partir d’une base de données constituée de centaines de milliers d’observa-tions sur le prix de boissons non alcoolisées vendues dans plus de 800 supermarchés enFrance, nous évaluons l’impact de la ‘taxe soda’, instituée depuis le 1er Janvier 2012, surle prix des boissons concernées, à savoir les boissons contenant du sucre ajouté ou desédulcorants . L’approche retenue, en "différence de différences", nous permet de montrerque la taxe a progressivement été repercutée dans le prix de ces boissons au cours des cinqpremiers mois de l’annnée 2012. Toutefois, alors qu’en Juin 2012, la taxe était totalementrépercutée dans le prix des sodas, la taxe n’a été répercutée qu’à environ 85% pour lesboissons aux fruits et les eaux aromatisées. Nous montrons également que l’impact de lataxe sur les prix a été différent selon les groupes de distribution et selon les marques deboissons.
Mots-clés: Taxe d’accise, boisson, sucre ajouté, incidence, ajustement de prix.
Codes JEL : C31, D22, H22, L81
Abstract : Based on a unique database consisting of hundreds of thousands of non-alcoholic beverage price records collected in about 800 supermarkets in France, we eval-uate the impact on prices of the soda tax, an excise on drinks with added sugar orsweetener, introduced in January 2012 in France. We adopt a difference in differencesapproach and find that the tax was passed-through to consumer prices gradually over thefirst semester of 2012. After 6 months, the tax was fully shifted to soda prices while thepass-through to prices of fruit drinks and flavored waters was not complete. We also findthat the impact of this tax was different across retailing groups and beverage brands.
Keywords: Excise tax, beverage, added sugar, tax incidence, price adjustment.
JEL codes : C31, D22, H22, L81
2

1 Introduction
In August 2011, the French government decided to set a new tax on sodas, based onthe claim that drinks containing added sugar are unhealthy and that their consumptionshould be discouraged. A similar tax already existed in some countries, like Denmark,Finland and Hungary and in many US states (OECD, 2012; Bridging the Gap Program,2011). The French Parliament decided to extend this tax to "light" soft drinks contain-ing sweeteners. Thus, the tax concerns all non-alcoholic beverages with added sugar orsweetener, and notably sodas, fruit drinks and flavoured waters. Moreover, while thegovernment initial project was to set the tax at 3.58 euros per hectoliter, the Parliamentdecided to double this tax, which was eventually voted to be 7.16 euros per hectoliter.1
This corresponds to about 11 euro cents for a 1.5 liter of soda, i.e. about 6% of theaverage price of sodas. This tax was effective from January 1st, 2012.
The aim of this paper is to evaluate the impact of this tax on the price of the threemain categories of concerned drinks: (i) sodas (including cola, energy, tonic and other softdrinks), (ii) flavoured waters, and (iii) fruit drinks and ready-to-drink teas. Our analysisallows the tax effect to be heterogeneous, not only across different product categories, butalso across retailing groups and beverage brands. Moreover, because different retailinggroups may have had different price adjustment strategies and/or timing, each dimensionof potential heterogeneity is interacted with time dummies to allow for different pricereactions over time.
This paper adds to the still sparse literature on the impact of sugar sweetened beverage(SSB) excise taxes on prices. Indeed, quite surprisingly, the increased interest in theexpected impact of SSB taxes on soft-drinks consumption and, consequently, on healthor obesity (e.g. see Brownell et al. 2009; Dharmasena and Capps, 2010; Finkelstein et al.,2012; Jacobson and Brownell, 2000; Lin et al., 2010; Smith et al., 2010) did not inducea corresponding flow of research regarding the impact of an SSB tax on soda prices.The impact of a ‘soda tax’ on obesity and health has been most often estimated underthe assumption of a full pass-through of the tax to prices. If we except the paper byBesley and Rosen (1999) who considered the impact of sales taxes on the prices of a largenumber of products in US states, it is only very recently that Bergman and Hansen (2012)and Bonnet and Requillart (2012) provided an empirical assessment of the pass-throughof a ‘soda tax’ to prices. However, beyond these two studies, a few other empiricalpapers consider the impact of specific excise taxes on prices either for alcoholic beverages(Kenkel, 2005; Young and Bieliska-Kwapisz, 2001) or cigarettes (Hanson and Sullivan,2009; De Cicca, Kenkel and Liu, 2010; Chiuo and Muehlegger, 2012; Harding, Leibtagand Lovenheim, 2012).
In order to evaluate the extent of the pass-through of the French ‘soda tax’ to prices,we apply a difference in differences approach to a unique data set made of about 52,000price trajectories, refering to very specific non-alcoholic beverages (defined by their brand,quantity, packaging, etc. and individually identified by their bar code) sold in specificoutlets (defined by their name -i.e., distribution chain-, their retailing group and their
1Law number 2011-1977, passed on December 28th, 2011.
3
address). Overall, the prices of 850 different beverage products sold in one or more of the800 supermarkets present in the dataset are followed from August 2011 to June 2012.These data were collected and made available to us by Prixing, a start-up companyproviding consumers with a free mobile price comparator.2 We find that, after 6 months,the tax was fully shifted to soda prices while the pass-through to prices of fruit drinksand flavoured waters was not complete. Moreover, our results point to some significantdifferences in the pass-through across retailing groups as well as across beverage brands.
The remaining of the paper is structured as follows: Section 2 provides a brief liter-ature review abouth the pass-through of excise taxes to prices. A detailed presentationof our data and of the difference in differences approach we use is provided in Section3. Our main results are presented and discussed in Section 4 while Section 5 contains anumber of robustness checks. Section 6 concludes.
2 Soft-drinks excise taxes and prices. A brief litera-
ture review
The theoretical literature regarding the impact of excise taxes on prices in markets withperfect competition is unambiguous: in most cases, i.e., with a standard upward slopingsupply curve and a downward sloping demand, there is undershifting of the tax to prices,i.e. prices increase by less than the tax. In this context, the smaller the elasticity ofdemand, the larger the pass-through of the tax to prices. Only if demand is totallyinelastic or if the suppply curve is infinitely elastic (i.e., marginal costs are constant),the tax will be fully passed-through to prices (e.g. see Fullerton and Metcalf, 2002).Things are less obvious when goods are sold on markets where imperfect competitionprevails. Depending on the nature of competition, on the characteristics of demand andon those of production costs, excise taxes may be either undershifted, fully shifted or evenovershifted to prices. It is also important to distinguish between short-run and long-runeffects as, in the long run, firms entries and exits have an influence on the way the taximpacts prices (e.g., see Stern, 1987; Delipalla and Keen, 1992; Anderson et al., 2001).Since non-alcoholic beverages can be considered to be highly differentiated products whichnotably differ from each other in terms of taste and quality, and because our interest isin the impact of the ‘soda tax’ on prices over the months just following its introduction,we may here restrict our attention to results regarding the short-run impact of excisetaxes on prices on markets with differentiated products. Anderson et al. (2001) haveshown than in such markets, if firms compete in prices and if the elasticity of demand isconstant, an excise tax is overshifted into prices (see also Fullerton and Metcalf, 2002).Fullerton and Metcalf (2002) also consider the case of differentiated products but in acontext of spatial competition: firms are not all symmetric competitors: the intensity ofcompetition is stronger with firms selling "close" products than with those selling "fardistant" products. They show that, in that case, an excise tax is fully passed-through toproducer prices (and over-shifted to consumer prices as long as an ad valorem tax alsoapplies).
2See http://www.prixing.fr/
4

The theoretical literature thus emphasizes the possibility of over-shifting excise taxesto prices on market with differentiated products. Is this prediction corroborated by ex-isting empirical studies regarding the impact of sugar-sweetened beverage (SSB) taxeson prices? There are unfortunately very few papers considering explicitly this issue, atleast regarding a SSB tax. Indeed, as previously mentioned, the growing empirical lit-erature about the expected impact of SSB taxes on soft-drinks consumption and healthor obesity (e.g. see Brownell et al. 2009; Dharmasena and Capps, 2011; Finkelstein etal., 2012; Jacobson and Brownell, 2000; Lin et al., 2011; Smith et al., 2010) has notbeen accompanied by a corresponding increase in research regarding the impact of SSBtaxes on prices. Two recent papers by Bergman and Hansen (2012) and Bonnet and Re-quillart (2012) are, however, explicitly devoted to this question. Bergman and Hansen(2012) evaluate the impact of various excise tax variations on alcoholic and non-alcoholicbeverage prices in Denmark. Based on the analysis of micro price data used by StatisticsDenmark to compute the Danish Consumer Price Index, they come to the conclusion thatthe two increases in the soft drink tax that occurred in 1998 and 2001 were over-shiftedto consumer prices. Using a quite different approach, Bonnet and Requillart (2012) cometo the same conclusion. They specify a structural model where competition is horizontal(between producers on the one hand, and between retailers on the other hand), as wellas vertical (between producers and retailers) and show, using simulations, that an exciseSSB tax is likely to be over-shifted to prices. Beyond these two studies, a few empiricalstudies consider the more general question of the impact of specific consumption taxeson prices. Besley and Rosen (1999) have considered the impact of sales taxes on a largenumber of products in US States. They also outline an over-shifting of these taxes to sodaprices. The conclusions that can be drawn from other studies devoted to the impact ofexcise taxes on prices are more diverse. Although Kenkel (2005) and Young and Bieliska-Kwapisz (2001) also conclude to over-shifting of taxes to alcoholic beverage prices, as doHanson and Sullivan (2009) regarding cigarette prices, De Cicca, Kenkel and Liu (2010)find full shifting while Chiou and Muehlegger (2010) and Harding et al. (2012) findunder-shifting.
3 The data and the model
The data we use for assessing the impact of the ‘soda tax’ implemented in France sinceJanuary 1st, 2012, have been collected by Prixing, a price comparator available on mobilesand on the internet. These data mainly cover grocery products sold in "drives", a typeof retailing outlet that recently developed in France. A "drive" is a place where youcollect the goods you have previously ordered on the internet. However, this retailingchannel differs from the "usual" internet retailers in that prices are exactly those youwould pay if you went shopping in the physical store (most "drives" are associated witha supermarket). The main difference is that the range of products available in "drives"can be smaller than that available in the supermarket itself. This form of retailing hasincreased quite significantly over the last two years in France. While there were around500 drives in France at the end of 2010, their number doubled at the end of 2011 and abouttripled by the end of the first semester of 2012 to reach about 1500 outlets (RayonBoissons,2012; Caussil, 2012).
5

In order to "feed" its price comparator, Prixing has elaborated automatic proceduresallowing to collect price lists from these drives for a large array of products. Indeed,the initial databases we have been given access to contains prices of more than 100,000products sold in "drive" outlets, representing altogether almost 80 millions price spellscovering the period March 2010 to September 2012.3 The range of products for whichprices are collected is broadly that available in supermarkets, i.e. with a strong predom-inance of food products (almost two thirds of collected prices), non-durable householdgoods such as washing-up liquid or dishwasher detergent (around 12%) and personal careproducts (around 10%). Prices of clothes and household appliances are also recordedthough for a much more limited number of items. As of June 2012, these prices werecollected in about 1500 drives located in France, most often on a daily basis. However,when the price collection process started, in March 2010, the number of drives was smallerand the price collection not necessarily made on a daily basis. Moreover, not all retailinggroups developed this form of retail distribution at the same pace. Indeed, one of themajor retailing distribution groups in France lagged behind regarding the opening of thistype of outlet while a smaller player offered this option in most of its supermarkets, evenin small ones. Our sample of drives (although almost exhaustive) thus did not necessarilyprovide a representative picture of sales at the aggregate level, especially in the beginningof the period. Then, in order to ensure the representativity of our results, we re-weightedobservations according to the market shares of product brands and of retailing groups atthe national level (see Appendix A for details). Once this is done, we may reasonablyexpect our results to be representative since, as documented in Anderton et al. (2011),France is one of the European countries where retail distribution is highly concentratedin supermarkets, especially regarding grocery products.4 Indeed, hypermarkets and su-permarkets represent about 75% of the French grocery market (respectively over 40% forhypermarkets and slightly less than 35% for supermarkets).
Due to technical problems, the first waves of collected price spells were often subject tomeasurement errors regarding the beginning and end dates of the spells and/or regardingthe classification of products. We then decided to limit our analysis to price data availablefrom August 2011 until the end of June 2012. This left us with about 52 millions spellsstarting in August 2011 or later. Because our focus in this paper is on the ‘soda tax’, werestricted the sample to non-alcoholic beverages, and more specifically to three categoriesof products: (i) sodas (including cola, energy, tonic and other soft drinks), (ii) waters,(iii) fruit drinks and ready-to-drink teas. The resulting "beverage sample" containsmore than 2 millions price spells associated with about 1700 beverages. This samplestill contained spells with inconsistent start and end dates (i.e. a start date posteriorto the end date) which we discarded. Moreover, due to the presence of some missinginformation and outliers regarding in particular prices or the quantity content of theproduct, some more trimming had to be done. We considered the empirical distributions
3By the end of April 2012, we were provided with a first database covering the period March 2010 tomid-April 2012. We then obtained, in October 2012, a second database that covers the period April toSeptember 2012. The availability of exact identifiers of both products and "drive" outlets allowed us tomerge these two datasets.
4In Italy and Spain grocery shops are on average characterized by one third of French surface andreal sales per store. In Germany surfaces are larger, but real sales per store and square meter anywaylower.
6
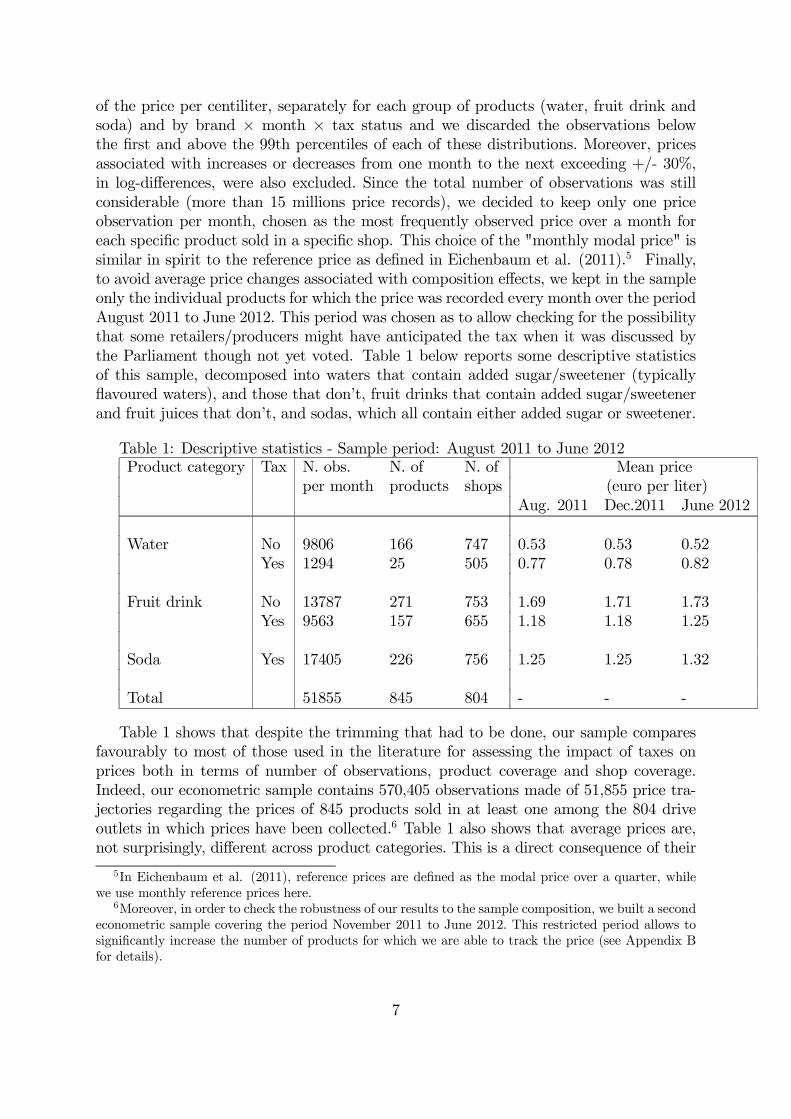
of the price per centiliter, separately for each group of products (water, fruit drink andsoda) and by brand × month × tax status and we discarded the observations belowthe first and above the 99th percentiles of each of these distributions. Moreover, pricesassociated with increases or decreases from one month to the next exceeding +/- 30%,in log-differences, were also excluded. Since the total number of observations was stillconsiderable (more than 15 millions price records), we decided to keep only one priceobservation per month, chosen as the most frequently observed price over a month foreach specific product sold in a specific shop. This choice of the "monthly modal price" issimilar in spirit to the reference price as defined in Eichenbaum et al. (2011).5 Finally,to avoid average price changes associated with composition effects, we kept in the sampleonly the individual products for which the price was recorded every month over the periodAugust 2011 to June 2012. This period was chosen as to allow checking for the possibilitythat some retailers/producers might have anticipated the tax when it was discussed bythe Parliament though not yet voted. Table 1 below reports some descriptive statisticsof this sample, decomposed into waters that contain added sugar/sweetener (typicallyflavoured waters), and those that don’t, fruit drinks that contain added sugar/sweetenerand fruit juices that don’t, and sodas, which all contain either added sugar or sweetener.
Table 1: Descriptive statistics - Sample period: August 2011 to June 2012Product category Tax N. obs. N. of N. of Mean price
per month products shops (euro per liter)Aug. 2011 Dec.2011 June 2012
Water No 9806 166 747 0.53 0.53 0.52Yes 1294 25 505 0.77 0.78 0.82
Fruit drink No 13787 271 753 1.69 1.71 1.73Yes 9563 157 655 1.18 1.18 1.25
Soda Yes 17405 226 756 1.25 1.25 1.32
Total 51855 845 804 - - -
Table 1 shows that despite the trimming that had to be done, our sample comparesfavourably to most of those used in the literature for assessing the impact of taxes onprices both in terms of number of observations, product coverage and shop coverage.Indeed, our econometric sample contains 570,405 observations made of 51,855 price tra-jectories regarding the prices of 845 products sold in at least one among the 804 driveoutlets in which prices have been collected.6 Table 1 also shows that average prices are,not surprisingly, different across product categories. This is a direct consequence of their
5In Eichenbaum et al. (2011), reference prices are defined as the modal price over a quarter, whilewe use monthly reference prices here.
6Moreover, in order to check the robustness of our results to the sample composition, we built a secondeconometric sample covering the period November 2011 to June 2012. This restricted period allows tosignificantly increase the number of products for which we are able to track the price (see Appendix Bfor details).
7

specific characteristics: pure fruit juices are higher quality products than "ordinary" bev-erages with a fruit flavour. Similarly, aromatized/flavoured waters are more sophisticatedproducts than "simple" waters. Figure 1 below shows the monthly evolution, betweenAugust 2011 and June 2012, of the average normalized price per centiliter for each groupof products (waters, fruit drinks and sodas), split between those that contain addedsugar/sweetener and are thus liable to the tax, and those that don’t. For each productcategory, prices on this graph are expressed in differences from the average price of thecategory as of December 2011. In the absence of any other factor that might induce pricechange, a full pass-through of the tax would then correspond to a price increrase of 0,0716euros per liter. This graph then clearly shows that, except for pure fruit juices and, to alower extent, for flavoured waters, the average price trajectory was remarkably flat beforethe introduction of the tax while it started to strongly increase from January onward forthose products which are liable to the tax.
Figure 1: Evolution of the average prices of non-alcoholic drinksbetween August 2011 and June 2012
These elements call for the use of the difference in differences approach, which accountsfor such differences as well as for those associated with the brand and other specificcharacteristics of the products and shops (marketing policy, local competition, etc.).Indeed, the difference-in-differences approach relies on the possibility to compare, beforeand after the introduction of the tax, the price of products that had ex ante similardynamics, some of which are liable for the ‘soda tax’ after January 2012 (the ‘treated’group) and others are not (the ‘control’ group). The implementation of the difference indifferences approach relies on the estimation of the following econometric model:
Pijt =3∑
τ=jan,feb,mar,apr,may,jun
βτ Ditτ + λt + αi + δj + εijt
8

where Pijt is the monthly modal price per centiliter of product i sold in shop j at time t;the dummy variableDitτ equals 1 when product i is liable to the tax, i.e. it contains addedsugar or sweetener and the period is between January and June 2012, while it equals 0otherwise. λt, αi and δj are fixed effects corresponding respectively to the months underreview (August 2011 to June 2012), to product characteristics (including whether theyinclude added sugar or sweetener or not) and to shop characteristics (retailing group,location, local competition, etc.). In this approach, the identification of the tax effectrelies on the hypothesis that the tax had not been introduced, the price of the two groupsof products would have evolved in a similar way. Note however that, since sodas are allliable to the tax, the control group for this category of products consists of the prices ofthe same products before January 2012. Given the very flat profile of soda prices beforeJanuary 2012 (see the graph above), this is a quite reasonable assumption.
4 The impact of the ‘soda tax’ on prices
Have producers and retailers passed the ‘soda tax’ through to consumer prices andto which extent? This section aims at providing an answer to this question, both onaverage but also by considering the possibility of differences across retailing groups and/orbeverage brands.
4.1 The average pass-through: magnitude and timing
Table 2 below reports, for the three categories of products we consider, the average impactof the tax on prices of products that are liable to the tax.7 To allow for lags in the reactionof producers/retailers in the transmission of the tax to prices, we have allowed this effectto be gradual over the first semester of 2012.
Table 2 : Average pass-through in cents per liter(August 2011 - June 2012 sample)Product January February March April May JuneWater 3.7 4.5 5.1 5.6 6.1 5.9
(0.2) (0.3) (0.4) (0.4) (0.5) (0.4)
Fruit drink 2.4 3.2 4.4 4.4 3.7 3.8(0.6) (0.6) (0.2) (0.3) (0.3) (0.3)
Soda 3.5 5.4 6.6 7.1 7.2 7.0(0.5) (0.7) (0.4) (0.2) (0.2) (0.2)
Note: all regressions contain month, shop and product fixed effects.Standard errors, clustered by shop, are given in parentheses.
The first point to notice is that, in contrast with the few results available in theliterature about the impact of SSB taxes on prices, we do not get any indication of a
7Because the main objects of interest of this paper are the coefficient βτ, which estimate the price
effect of the tax, the tables below do not report other parameter estimates. The full estimation resultsare available on request.
9
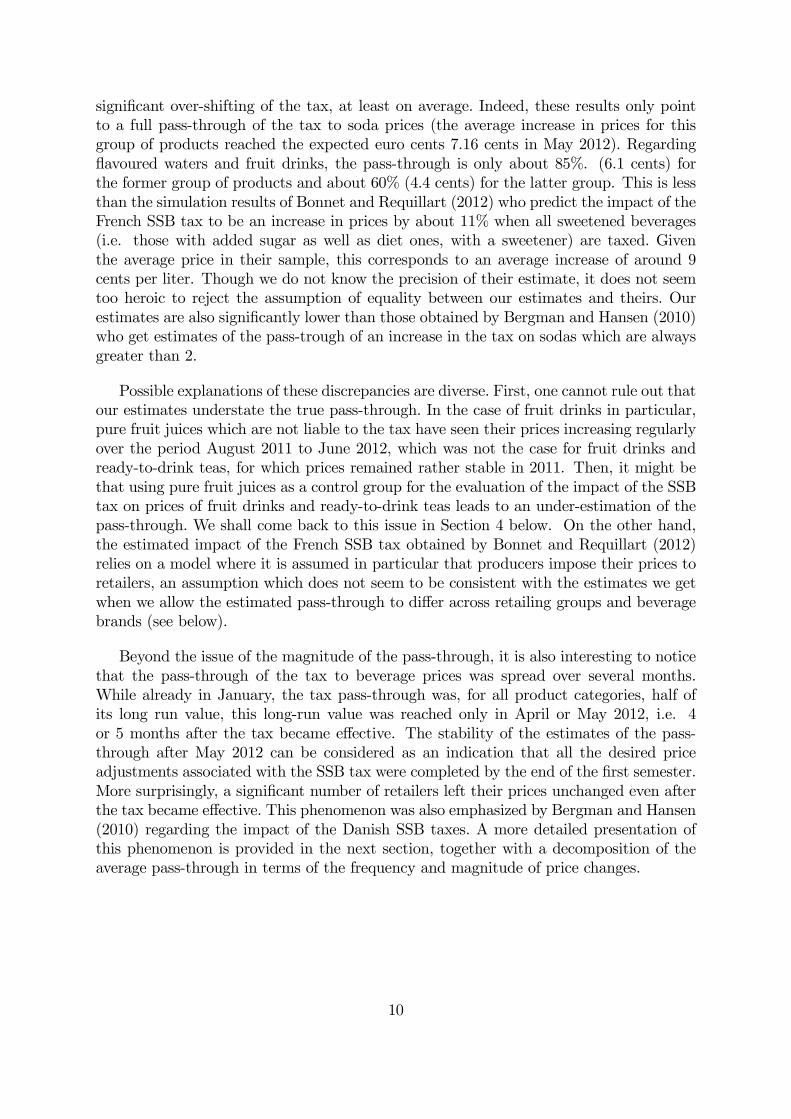
significant over-shifting of the tax, at least on average. Indeed, these results only pointto a full pass-through of the tax to soda prices (the average increase in prices for thisgroup of products reached the expected euro cents 7.16 cents in May 2012). Regardingflavoured waters and fruit drinks, the pass-through is only about 85%. (6.1 cents) forthe former group of products and about 60% (4.4 cents) for the latter group. This is lessthan the simulation results of Bonnet and Requillart (2012) who predict the impact of theFrench SSB tax to be an increase in prices by about 11% when all sweetened beverages(i.e. those with added sugar as well as diet ones, with a sweetener) are taxed. Giventhe average price in their sample, this corresponds to an average increase of around 9cents per liter. Though we do not know the precision of their estimate, it does not seemtoo heroic to reject the assumption of equality between our estimates and theirs. Ourestimates are also significantly lower than those obtained by Bergman and Hansen (2010)who get estimates of the pass-trough of an increase in the tax on sodas which are alwaysgreater than 2.
Possible explanations of these discrepancies are diverse. First, one cannot rule out thatour estimates understate the true pass-through. In the case of fruit drinks in particular,pure fruit juices which are not liable to the tax have seen their prices increasing regularlyover the period August 2011 to June 2012, which was not the case for fruit drinks andready-to-drink teas, for which prices remained rather stable in 2011. Then, it might bethat using pure fruit juices as a control group for the evaluation of the impact of the SSBtax on prices of fruit drinks and ready-to-drink teas leads to an under-estimation of thepass-through. We shall come back to this issue in Section 4 below. On the other hand,the estimated impact of the French SSB tax obtained by Bonnet and Requillart (2012)relies on a model where it is assumed in particular that producers impose their prices toretailers, an assumption which does not seem to be consistent with the estimates we getwhen we allow the estimated pass-through to differ across retailing groups and beveragebrands (see below).
Beyond the issue of the magnitude of the pass-through, it is also interesting to noticethat the pass-through of the tax to beverage prices was spread over several months.While already in January, the tax pass-through was, for all product categories, half ofits long run value, this long-run value was reached only in April or May 2012, i.e. 4or 5 months after the tax became effective. The stability of the estimates of the pass-through after May 2012 can be considered as an indication that all the desired priceadjustments associated with the SSB tax were completed by the end of the first semester.More surprisingly, a significant number of retailers left their prices unchanged even afterthe tax became effective. This phenomenon was also emphasized by Bergman and Hansen(2010) regarding the impact of the Danish SSB taxes. A more detailed presentation ofthis phenomenon is provided in the next section, together with a decomposition of theaverage pass-through in terms of the frequency and magnitude of price changes.
10
4.2 Assessing the intensive and extensive margins of the pass-
through
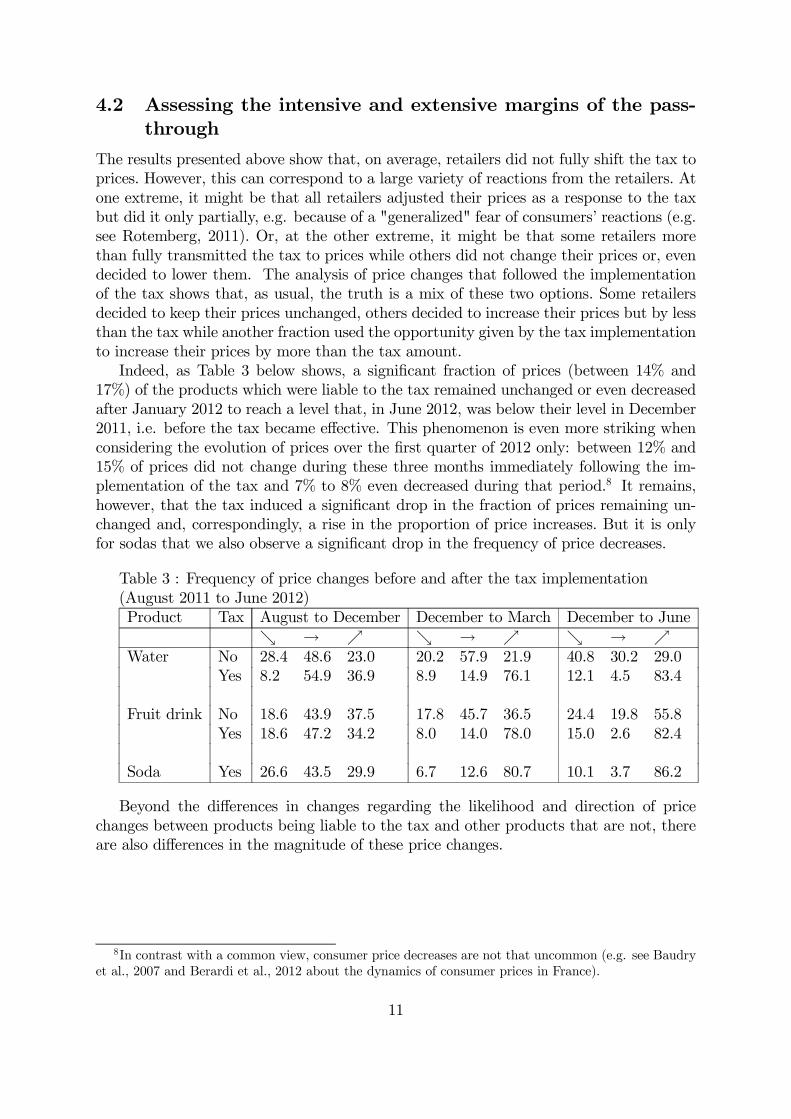
The results presented above show that, on average, retailers did not fully shift the tax toprices. However, this can correspond to a large variety of reactions from the retailers. Atone extreme, it might be that all retailers adjusted their prices as a response to the taxbut did it only partially, e.g. because of a "generalized" fear of consumers’ reactions (e.g.see Rotemberg, 2011). Or, at the other extreme, it might be that some retailers morethan fully transmitted the tax to prices while others did not change their prices or, evendecided to lower them. The analysis of price changes that followed the implementationof the tax shows that, as usual, the truth is a mix of these two options. Some retailersdecided to keep their prices unchanged, others decided to increase their prices but by lessthan the tax while another fraction used the opportunity given by the tax implementationto increase their prices by more than the tax amount.
Indeed, as Table 3 below shows, a significant fraction of prices (between 14% and17%) of the products which were liable to the tax remained unchanged or even decreasedafter January 2012 to reach a level that, in June 2012, was below their level in December2011, i.e. before the tax became effective. This phenomenon is even more striking whenconsidering the evolution of prices over the first quarter of 2012 only: between 12% and15% of prices did not change during these three months immediately following the im-plementation of the tax and 7% to 8% even decreased during that period.8 It remains,however, that the tax induced a significant drop in the fraction of prices remaining un-changed and, correspondingly, a rise in the proportion of price increases. But it is onlyfor sodas that we also observe a significant drop in the frequency of price decreases.
Table 3 : Frequency of price changes before and after the tax implementation(August 2011 to June 2012)Product Tax August to December December to March December to June
ց → ր ց → ր ց → ր
Water No 28.4 48.6 23.0 20.2 57.9 21.9 40.8 30.2 29.0Yes 8.2 54.9 36.9 8.9 14.9 76.1 12.1 4.5 83.4
Fruit drink No 18.6 43.9 37.5 17.8 45.7 36.5 24.4 19.8 55.8Yes 18.6 47.2 34.2 8.0 14.0 78.0 15.0 2.6 82.4
Soda Yes 26.6 43.5 29.9 6.7 12.6 80.7 10.1 3.7 86.2
Beyond the differences in changes regarding the likelihood and direction of pricechanges between products being liable to the tax and other products that are not, thereare also differences in the magnitude of these price changes.
8In contrast with a common view, consumer price decreases are not that uncommon (e.g. see Baudryet al., 2007 and Berardi et al., 2012 about the dynamics of consumer prices in France).
11

Table 4 : Average magnitude of price changes(between August 2011 and June 2012)Product Tax August to December December to March December to June
ց ր ց ր ց ր
Water No -1.8 1.8 -3.6 1.8 -3.2 2.4Yes -2.1 2.8 -1.5 5.9 -2.9 6.2
Fruit drink No -6.3 7.5 -6.7 5.1 -8.4 7.0Yes -5.3 3.3 -5.1 7.8 -5.4 8.5
Soda Yes -3.5 3.1 -4.9 8.6 -6.4 8.9
Not surprisingly, products that are liable to the tax exhibit larger price increases afterJanuary than they did before. They also exhibit stronger increases and smaller decreasesthan products which are not suject to the tax. A summmary of these alterations of thecharacteristics of prices changes associated with the implementation of the tax can beobtained applying a difference in differences approach to these frequency and magnitudeof price changes.
Table 5 : Tax-induced changes in the frequency and magnitude of price changes(January-June 2012 compared to August-December 2011)Product Frequency of Magnitude of
ց → ր ց ր
Water -8,5 -32.0 40.5 0.6 2.8Fruit drink -9,4 -20.5 29.9 2.0 5.7Soda -16,5 -39.8 56.3 -2.9 5.8
As expected, the tax induced a drop in the proportion of prices remaining stableor decreasing, corresponding to a significant rise in the proportion of price increases.Moreover, these changes were reinforced by a reduction of the size of price decreases(except for sodas) and by a larger magnitude of price increases. However, these changesunderlying the average pass-through of the tax to prices hide some significant differences,both across retailing groups and across beverage brands.
4.3 Heterogeneity of the pass-through across retailing groups
and beverage brands
As emphasized in Section 2, the expected impact of an excise tax on prices stronglydepends on the nature of competition that prevails on the market. Two features of theretail trade sector and of the beverage production sector seem to benefit from a large con-sensus. First, these markets are not perfectly competitive. Second, they provide more orless strongly differentiated goods (e.g. see, among many others, Gasmi et al., 1992; Cot-terill et al., 1996; Dube, 2005). Unfortunately, characterizing more precisely the natureof competition that prevails on these two markets is less obvious. Competition betweenretailers has several dimensions: a local one associated with the competition which pre-vails between outlets and their local competitors; but also a global one, stemming from
12

the overall size of their group and their capacity to negociate with producers throughtheir buying groups (e.g. see Bonnet and Requillart, 2011, Bonnet and Dubois, 2010,etc.). The nature of these vertical relationships also clearly depends on the relative sizeof the retailer and producer and are indirectly affected by the retailer position on its owndistribution market. The diversity of competitive situations is then likely to induce thesame diversity regarding the way retailers (and producers) of beverages have shifted theSSB tax to their prices. This is indeed what we observe when allowing the pass-throughof the tax to differ across retailing groups and beverage brands, as shown in the tablesbelow.
These tables provide estimates of the pass-through for the private label products ofeach retailing group, the pass-through for the three main national brands of each categoryof products (i.e. the three main national brands of flavoured waters; the three main brandsof fruit drinks and ready-to-drink teas and the three main brands of sodas) as well as thepass-through of other brands, taken as a whole. These estimates are obtained for eachretailing group separately. For the sake of readability of the tables, only the coefficientsmeasuring the pass-through, as of March 2012 and as of June 2012, are reported.
Table 6 : Pass-through by retailing group and beverage brand, flavoured waters(as of March 2012 and June 2012)
March 2012 June 2012Retailing group Retailing group
Brand A B C D E F A B C D E FPrivate label 7.6 - 3.1 5.1 2.5 7.8 6.9 - 4.4 6.7 4.0 5.7B1 1.0 2.1 1.1 -0.2 1.5 5.3B2 0.7 2.6 8.1 0.9 1.7 2.5B3 3.1 5.0 -0.3 2.5 7.4 2.8 4.0 -1.3 0.9 7.5Note: all regressions contain month, shop and product fixed effects.
Table 7 : Pass-through by retailing group and beverage brand, fruit drinks andready-to-drink teas (as of March 2012 and June 2012)
March 2012 June 2012Retailing group Retailing group
Brand A B C D E F A B C D E FPrivate label 8.7 3.3 8.5 8.2 1.9 8.2 8.3 8.7 8.5 9.7 6.7 9.2B4 7.7 4.8 7.5 3.2 4.5 3.2 7.3 2.8 8.4 -1.0 2.0 5.9B5 6.9 0.6 - 3.1 5.3 7.7 6.5 3.8 - 3.8 4.3 7.8B6 5.5 10.9 15.4 0.0 7.8 21.2 -6.5 8.9 20.8 -8.6 4.3 12.5Others 9.6 15.0 5.0 0.2 1.7 3.6 15.0 5.5 -0.8 6.4Note: all regressions contain month, shop and product fixed effects.
13

Table 8 : Pass-through by retailing group and beverage brand, sodas(as of March 2012 and June 2012)
March 2012 June 2012Retailing group Retailing group
Brand A B C D E F A B C D E FPrivate label 8.5 0.0 5.7 4.8 8.2 10.0 8.3 7.9 6.4 5.0 10.7 11.2B7 6.2 7.0 9.3 3.5 5.8 16.6 7.2 7.1 5.9 4.6 6.7 14.3B8 7.5 3.3 12.0 2.8 4.8 7.0 4.9 3.1 15.3 1.9 3.9 7.9B9 6.9 3.8 10.8 4.5 5.5 7.8 7.1 6.2 10.1 5.0 5.4 8.2Others 6.4 11.1 10.2 3.0 5.8 12.5 5.7 7.0 8.3 1.7 4.6 11.2Note: all regressions contain month, shop and product fixed effects.
Several observations can be drawn from this set of results. First, whatever the groupof products we consider, the ranking of retailing groups based on their pass-through isquite similar across beverage brands. In particular, two retailing groups (C and F) arecharacterized by quite high pass-through coefficients, indicating a propensity to overshiftthe tax to prices, sometimes quite strongly, for almost all products. On the other hand,two retailing groups (B and D) exhibit lower average pass-throughs together with somemore heterogeneity across groups of products. One of these two latter groups had actuallymarketed on the media its low pass-through of the ‘soda tax’ as a deliberate strategicchoice of reducing its margin to shelter its consumers. It is also worth noticing that thesetwo retailing groups with the lowest average pass-through are the two biggest players inthe retailing trade market. Therefore, it is also possible that they were able to obtain morefavou∈rable conditions when bargaining with their suppliers (e.g., large stocks boughtbefore the tax implementation or postponed price increases).
Another striking regularity that emerges from these results is that the pass-throughwas significantly higher for private labels than it was for other brands. In a very largemajority in cases, retailing groups increased more the price of their own brands that whatthey did for other brands. One possible explanation is that, given the lower prices and,possibly, margins of these products, retailers have less flexibility to absorb the excise taxand shelter their customers from this tax. This result is consistent with that obtainedby Bonnet and Requillart (2012) who also come to the conclusion that the French SSBtax was expected to have a stronger impact on private labels products than on nationalbrands. Allowing, for simplicity, the pass-through coefficient to vary only across the threecategories of brands (private label, leading national brand, other brands) confirms thisresult and also tends to show that the "size" of the market share of a brand may haveplayed a role in the bargaining between producers and retailers. For the three groups ofproducts we consider, "Other (small) brands" are the one with the lowest pass-through:
14

Table 9 : Pass-through by type of brand(August 2011 - June 2012 sample; )Product Private label Market leader Other brandsWater 4.5 2.0 -
(1.4) (1.4)
Fruit drink 8.8 4.2 4.0(0.2) (0.4) (1.5)
Soda 8.0 7.0 5.4(0.2) (0.2) (0.6)
Note: all regressions contain month, shop and product fixed effects.Standard errors, clustered by shop, are given in parentheses.
5 Robustness checks
In order to assess the reliability of the estimates provided in the previous sections, threetypes of robustness checks have been implemented. First, we have estimated our modelsusing a different definition of the "control groups". Indeed, as discussed above, in the caseof fruit drinks in particular, the evolution of prices between August and December 2011was different in the "treatment group" (fruit drinks and ready-to-drink teas) than whatthey were in the "control group" (fruit juices): prices of products from the former groupwere almost stable while those of the latter group increased regularly during that periodand kept doing so from January to June 2012. One may then wonder whether the lowdegree of pass-through estimated for this group of product might be the result of thesediverging trends in prices. The estimates provided in Table 10 below then rely on "simpledifferences", i.e. the impact of the pass-through is estimated only from differences in theprices of the products that are liable to the tax before and after the tax was implemented.Not surprisingly, the estimated pass-through increases significantly for fruit drinks withrespect to its previous estimate. Ignoring the increasing trend of pure fruit juices’ pricesinduced an under-estimation of this pass-through. Indeed, it is not sure that pure fruitjuices are the best control group in that the composition of these products (100% fruitjuice) clearly strongly differs from that of fruit drinks and ready-to-drink teas for whichthe main ingredient is water. This is why our prefered estimate of the pass-through forfruit drinks is this second estimate, based on a simple difference.
The opposite phenomenon occurs regarding flavoured waters. Indeed, the price of"standard" waters decreased during the second quarter of 2012 and this participatedin the estimation of the pass-through for flavoured waters. Considering that the maininput of flavoured waters remains the water itself, one should then consider that our firstestimate of the pass-through is more reliable as it takes into account the correspondingdecrease in the cost of a major input. Finally, since sodas have no untaxed equivalent, itis not surprising to get here the same estimate of the pass-through as before.
15

Table 10 : Simple difference average pass-through in cents per liter(August 2011 - June 2012 sample)Product January February March April May JuneWater 3.4 4.1 4.3 4.8 5.0 4.8
(2.3) (2.5) (2.1) (2.2) (2.1) (2.0)
Fruit drink 3.1 4.2 5.7 6.0 5.9 6.2(0.5) (0.6) (0.2) (0.2) (0.3) 0.3)
Soda 3.5 5.4 6.6 7.1 7.2 7.0(0.5) (0.7) (0.4) (0.2) (0.2) (0.2)
Note: all regressions contain month, shop and product fixed effects.Standard errors, clustered by shop, are given in parentheses.
Another feature of beverage prices that might have an influence on our assessment ofthe pass-through is the possibility that producers or retailers might have anticipated thedate of effectiveness of the tax and started raising their prices before January 2012. Inorder to check whether this might have been the case, we have estimated an alternativemodel allowing the price of products liable to the tax to increase from October 2011, i.e.when the Parliament started to discuss about this tax.
Table 11 : Average pass-through in cents per liter;model with anticipated price increases(August 2011 - June 2012 sample)Product Oct Nov Dec Jan Feb Mar Apr May JunWater 0.4 0.6 0.9 4.1 4.9 5.5 6.0 6.5 6.3
(0.1) (0.2) (0.2) (0.2) (0.3) (0.4) (0.5) (0.5) (0.4)
Fruit drink -0.7 -1.3 -1.2 1.8 2.5 3.8 3.7 3.0 3.1(0.2) (0.2) (0.3) (0.5) (0.6) (0.2) (0.4) (0.4) (0.4)
Soda -0.0 0.0 0.0 3.5 5.3 6.5 7.0 7.2 7.0(0.1) (0.1) (0.1) (0.5) (0.6) (0.3) (0.2) (0.2) (0.2)
Note: all regressions contain month, shop and product fixed effects.Standard errors, clustered by shop, are given in parentheses.
The results we obtain are provided in Table 11 below. They show that this phenom-enon marginally affected the price of flavoured waters only. For this group of products,we indeed observe a small increase in prices starting in October. However, the averagemagnitude of this increase is less than one euro cent per liter and has only a minor influ-ence on the assessment of the impact of the tax at the end of the first semester of 2012.On the contrary, allowing for this anticipation of the tax significantly lowers the estimateof the pass-through we get for fruit drinks. The reason clearly appears: those productshave seen their price increasing much less than those of the control group (pure fruitjuices) which, mechanically, induces a lower pass-through at the end of the period. Thisresult is a further argument to consider that the best estimate of the pass-through for
16

this category of products is the one given in Table 10 above, i.e. the one obtained fromsimple differences. Last but not least, the price of sodas, the products for which the taxwas clearly designed, remained remarkably stable before the tax became effective.
At this point, our prefered estimates of the pass-through are as follows: 6.5 forflavoured waters because it seems that prices of this group of products partly antici-pated the implementation of the tax; 6.2 for fruit drinks and ready-to-drink teas since,given the evolution of prices of pure fruit juices, the best control group for these productsseems to be their own prices before the tax was implemented. Finally, the pass-throughfor sodas is estimated at 7.2, corresponding to a full shifting of the tax to prices. Shouldthis absence of over-shifting come as a surprise? One possible explanation lies in theelasticity of demand for these products. Many studies have estimated the elasticity ofnon-alcoholic beverages consumption to prices to be significantly larger than 1, in ab-solute value (e.g. Bonnet and Requillart, 2011 and Bonnet and Dubois, 2010, on Frenchdata as well as Pofahl, Capps and Clauson, 2005 or Alviloa, Capps and Wu, 2010 on USdata). These studies also show that the price elasticity of demand for water is larger,in absolute value than those for the two other groups of products which appear to haverather close price elasticities. This provides a rationale to the differences in the estimatedpass-through between water, on the one hand, and fruit drinks and sodas on the otherhand. Moreover, the lower pass-through obtained for water may also stem from the factthat flavoured waters are more easily substituted by other products than fruit drinks andsodas. Indeed, "plain" waters exist and are cheaper than (taxed) flavoured waters. Thiscontrasts with the case of fruit drinks: "pure" fruit juices that exist as a substitute forfruit drinks are significantly more expensive, thus making the substitution more unlikely.In the case of sodas, the difficulty to find a close (and untaxed) substitute is even strongeras all sodas are liable to the tax and as the degree of product differentiation is quite highacross sodas.
Finally, we implemented a last robustness check by estimating our models on a differ-ent sample, starting in November 2011 rather than in August 2011. The rationale for thischoice is as follows: in most cases, the evolution of prices between August and December2011 was not that important so that taking instead as a reference the prices observedbetween November and December 2011 should not make a too big difference. However,the great advantage of taking such a shorter period is that this allows a huge increasein the product coverage. Indeed, the number of products continuously observed betweenNovember 2011 and June 2012 is much larger than that of products observed betweenAugust 2011 and June 2012. This "November to June" sample contains prices of 1019products sold in 958 shops, amounting in total to 1,056,416 observations, against 845products sold in 804 shops, amounting to 570,405 observations in our "August to June"sample. As the estimation results in Table 12 below show, the results we obtain withthis larger sample are qualitatively similar to those obtained with the sample coveringthe longer period. The highest pass-through is obtained for sodas while flavoured waterscome second and fruit drinks third in terms of the magnitude of the pass-through.
17

Table 12 : Average pass-through in cents per liter(November 2011 - June 2012 sample)Product January February March April May JuneWater 2.7 4.2 4.7 5.4 5.6 5.6
(1.4) (1.6) (1.6) (1.3) (1.2) (1.3)
Fruit drink 3.0 4.5 5.1 5.4 4.8 5.0(0.2) (0.3) (0.2) (0.2) (1.0) (1.0)
Soda 3.0 4.9 6.2 6.7 6.8 6.7(0.2) (0.3) (0.2) (0.1) (0.1) (0.1)
Note: all regressions contain month, shop and product fixed effects.Standard errors, clustered by shop, are given in parentheses.
Estimating the other models considered above also leads to similar estimates. Indeed,our preferred estimates of the pass-through obtained with this new sample amount to 5.7for flavoured waters with a model allowing for an anticipated impact of the tax (against6.5 with our August to June sample)9 Using our preferred simple difference estimatefor fruit drinks leads to an estimate of 6.4 (against 6.2 with the previous sample). Ourpreferred estimate for sodas being the one in Table 12, i.e. 6.8 (against 7.2 with ourprevious sample). Overall, these results confirm our main result: on average, the French‘soda tax’ was not fully passed-through to prices. However, as before, this conclusionmust be slightly qualified: some differences are worth being noticed across the differentgroups of products: pass-through was higher for sodas than for flavoured waters and fruitdrinks. Moreover, in most cases, retailing groups have overshifted the tax to the price oftheir private label products.
6 Conclusion
Following the implementation of a ‘soda tax’ in France on the 1st January, 2012, pricesof the beverages liable to the tax increased significantly. Using a difference in differencesapproach, we show that, on average, the tax has been fully shifted to prices of sodas,a category of products for which no close untaxed substitute product exists. Regardingthe two other groups of products liable to the tax, (flavoured waters and fruit drinks),our results show a slight under-shifting of the tax to prices: their prices increased byslighly more than 6 cents per liter, on average, to be compared with a tax set at 7.16euro cents per liter. The existence of untaxed substitutes may be an explanation of thisunder-shifting. Our results also point to a strong heterogeneity of the pass-through acrossretailing groups and brands. Some retailing groups have over-shifted the tax while othershad the opposite policy. However, a quite common feature of the pricing policy of theFrench retailing groups has been to over-shift the tax into the prices of their private labelproducts.
9since the sample starts in November, prices are asumed here to have started increasing from December2011.
18

7 References
Agro-Media (2012), "Part de marché, Leclerc leader des enseignes de grande distribution",available at
http://www.agro-media.fr/actualit%C3%A9/consommation/part-de-march%C3%A9-
leclerc-leader-des-enseignes-de-grande-distribution
Alviola, P.A., O. Capps Jr, X. Wu (2010) "Micro-Demand Systems Analysis of Non-Alcoholic Beverages in the United States: An Application of Econometric TechniquesDealing With Censoring," 2010 Annual Meeting, Agricultural and Applied EconomicsAssociation.
Anderson, S., A. De Palma and B. Kreider (2001), "Tax incidence in differentiatedproduct oligopoly", Journal of Public Economics, vol. 81, N◦2, pp. 173-192.
Anderton, R., et al. (2011), "Structural features of distributive trades and theirimpact on prices in the euro area", European Central Bank Occasional Paper Series 128.
Baudry, L., H. Le Bihan, P. Sevestre and S. Tarrieu (2007), "What do thirteen millionprice records have to say about consumer price rigidity?", Oxford Bulletin of Economicsand Statistics, vol. 69, N◦2, pp. 139—183.
Berardi, N., E. Gautier, and H. Le Bihan (2012), "Micro price rigidity in France: Newevidence from the recent period", Banque de France Working Paper.
Bergman, U.M. and N.L. Hansen (2012), "Are excise taxes on beverages fully passedthrough to prices? The Danish evidence", mimeo,
available at http://www.conferencedevelopments.com/files/Bergman-Hansen.pdf
Besley T. and H. Rosen (1999), "Sales taxes and prices: an empirical analysis", Na-tional Tax Journal, vol. 52, N◦2, pp. 157-178.
Bonnet, C. and P. Dubois (2010) "Non-linear contracting and endogenous buyer powerbetween manufacturers and retailers: empirical evidence on food retailing in France", TSEworking Paper N◦ 10− 189.
Bonnet, C. and V. Requillart (2010), "Is the EU sugar policy reform likely to increaseobesity?", Working Paper, Toulouse School of Economics
Bonnet, C. and V. Requillart (2011), "Strategic pricing and health price policies",TSE working Paper N◦ 11− 233.
Bonnet, C. and V. Requillart (2012), "Les effets de la réforme de la politique sucrièreet des politiques de taxation sur le marché des boissons sucrées", Cahiers de nutrition etde diététique, 47, pp. 35-41.
Bridging the Gap Program (2011), "State sales tax on regular, sugar-sweetened soda(as of July 1, 2011)", Robert Wood Johnson Foundation, available at
http://www.bridgingthegapresearch.org/_asset/zvh93o/
BTG_State_Soda_Sales_Tax_Jul012011_publuse_29Nov11.pdf.
Brownell, K. D., T. Farley, W. C. Willett, B. M. Popkin, F. J. Chaloupka, J. W.Thompson, and D. S. Ludwig (2009), "The public health and economic benefits of taxingsugar-sweetened beverages", New England Journal of Medecine, 361, pp. 1599-1605.
Caussil, J.N. (2012), "Avec 1 576 drives en France, l’armement des distributeurs sepoursuit", LSA, available at
http://www.lsa-conso.fr/avec-1-576-drives-en-france-l-armement-des-distributeurs-se-poursuit,132797
Chiou L. and E. Muehlegger (2010), "Consumer response to cigarette excise taxchanges", Harvard Kennedy School Research Working Paper June 2010
19

Cotterill, R.W., A.W. Franklin and L.Y. Ma (1996), "Measuring market power effectsin differentiated product industries: an application to the soft-drink industry", FoodMarketing Policy Center research report N◦32, University of Connecticut.
De Cicca, P., D. Kenkel and F. Liu, (2010), "Who pays cigarette taxes? The impactof consumer price search", NBER working paper N◦15942.
Delipalla, S. and M. Keen (1992), "The comparison between ad valorem and specifictaxation under imperfect competition", Journal of Public Economics, vol. 49, N◦3, pp.351-367.
Dharmasena, S. and O. Capps (2010), "On taxing sugar-sweetened beverages to com-bat the obesity problem", paper presented at the Agricultural and Applied EconomicsAssociation 2010 AAEA, CAES & WAEA Joint Annual Meeting, Denver, July 25-27,2010.
Dube, J.P. (2005), "Product differentiation and mergers in the carbonated soft drinkindustry", Journal of Economics and Management Industry, vol. 14, N◦14, pp. 879-904.
Eichenbaum, M., N. Jaimovich and S. Rebelo (2011), "Reference prices, costs andnominal rigidities", American Economic Review, vol. 101, pp. 234-262.
Finkelstein, E.A., C. Zhen, M. Bilger, J. Nonnemaker, A.M. Farooqui, J Tood (2012),"Implications of a sugar-sweetened beverage (SSB) tax when subsitutions to non-beverageitems are considered", Journal of Health Economics, fortcoming
Fullerton, D. and G. Metcalf (2002), "Tax incidence", in Handbook of Public Eco-nomics, vol. 4, A. Auerbach and M. Feldstein eds., Elsevier Science B.V.
Gagnon E., D. López-Salido, and N. Vincent (2012), "Individual Price Adjustmentalong the Extensive Margin", Board of Governors of the Federal Reserve System, Inter-national Finance Discussion Papers, Number 1052.
Gasmi, F., J.J. Laffont and Q. Vuong (1992), "Econometric analysis of collusive be-havior in a soft-drink market", Journal of Economics and Management Industry, vol. 12,N◦1, pp. 277-311
Hanson A. and R.Sullivan (2009), "The incidence of tobacco taxation: Evidence fromgeographic micro-level data", National Tax Journal, vol. 62, N◦4, pp. 677-698.
Harding, M., E. Leibtag and M.F. Lovenheim, (2012), "The heterogeneous geographicand socio-economic incidence of cigarette taxes: Evidence from Nielsen Homescan data",American Economic Journal, Economic Policy, vol. 4, N◦4, pp. 169-198.
Jacobson, M.F. and K.D. Brownell (2000), "Small taxes on soft drinks and snack foodto promote health", American Journal of Public Health, vol. 90, N◦6, pp. 854-857.
Kenkel D.S. (2005) "Are alcohol tax hikes fully passed through to prices? Evidencefrom Alaska", American Economic Review, vol. 95, N◦2, pp. 273-277.
Lin B.H., T.A. Smith and J.Y. Lee (2010), "Effects of taxing sugar-sweetened beverageand subsidizing milk: beverage consumption, nutrition, and obesity among US children",paper presented at the EAAE/AAEA seminar on ’the Economics of food, food choiceand health’, Freising, September 15-17, 2010.
Oecd (2012), "Obesity update 2012", available athttp://www.oecd.org/health/healthpoliciesanddata/49716427.pdfPofahl, G. M., O. Capps Jr, and A. Clauson (2005), "Demand for Non-Alcooholic
Beverages : Evidence from the ACNielsen Home Scan Panel", 2005 Annual Meeting,Agricultural and Applied Economics Association.
20
Powell, L. M., J. Chriqui, and F. J. Chaloupka (2009), "Associations between state-level soda taxes and adolescent body mass index", Journal of Adolescent Health, 45 (3),pp. 57-63.
RayonBoissons (2012), "Evolution du nombre de drives en France", Editions du Bois-baudry, available at
http://www.rayon-boissons.com/Chiffres-du-marche/Evolutions-du-nombre-de-drives-en-France-20303Rotemberg, J. (2011) "Fair pricing", Journal of the European Economic Association,
vol. 9, issue 5, pp.952—981.Smith T.A., B.H. Lin and J.Y. Lee (2010), "Taxing caloric sweetened beverages.
Potential effects on beverage consumption, calorie intake, and obesity", USDA EconomicResearch Report N◦100, July 2010.
Stern, N. (1987) "The effects of taxation, price control and government contracts inoligopoly and monopolistic competition", Journal of Public Economics, vol. 32, N◦2, pp.133-158.
Young, D.and A. Bieliska-Kwapisz (2002), "Alcohol taxes and beverage prices", Na-tional Tax Journal, vol. 55, N◦1, pp. 57-73.
21

8 Appendix A: More about the database
Table A1: Composition of the sample by retail chain and group.Retail chain N. of shops Retail group Group
"soda sample" market shareauchan 41 AUCHAN 10.9 %simply market 38 AUCHAN 10.9 %carrefour 2 CARREFOUR 18.7 %carrefour market 1 CARREFOUR 18.7 %casino 22 CASINO 5.0 %geant casino 62 CASINO 5.0 %leclerc 107 LECLERC 18.6 %intermarche 181 LES MOUSQUETAIRES 12.6 %ecomarche 3 LES MOUSQUETAIRES 12.6 %hyper u 43 SYSTEME U 9.2 %marche u 4 SYSTEME U 9.2 %super u 295 SYSTEME U 9.2 %u express 5 SYSTEME U 9.2 %Total 804 75.0%Sources: Prixing and, for retail groups market shares, Kantar Worldpanel cited by
Agro-media (2012) .
22

Table A2 : Composition of the sample by brand for watersBrand Market share N. of shops Products with Products with
added sugar no added sugaror sweetener nor sweetener
all private labels 20.1 % 509 x xcristaline 17.3 % 72 0 xevian 6.3 % 581 0 xvolvic 5.9 % 583 x xcontrex 5.0 % 485 x xsalvetat 5.0 % 447 0 xvittel 4.1 % 382 0 xbadoit 3.9 % 399 0 xhepar 2.7 % 122 0 xsan pellegrino 2.5 % 264 x xquezac 2.1 % 207 0 xst-yorre 1.9 % 181 0 xst amand 1.8 % 94 0 xcourmayeur 1.2 % 152 0 xvichy celestins 1.0 % 100 0 xrozana 0.8 % 128 0 xtaillefine 0.4 % 61 x 0perrier 0.1 % 364 0 xother brands 17.9 % 477 0 xSources: Prixing and, for brand market shares, RayonBoissons (2012). The figures
provided in the table combine market shares provided by RayonBoissons (2012) for plainwaters, sparkling waters and flavoured waters separately.
Private labels include : auchan, carrefour, casino, leclerc, intermarche and produit u.Other brands include : abatilles, aix les bains, arcens, carola, lisbeth, mont dore,
mont roucous, mont d’arrée, nestle, ogeu, pierval, plancoet, st antonin, spa, st alban,telle quelle, thonon, vals, vernière and wattwiller.
23
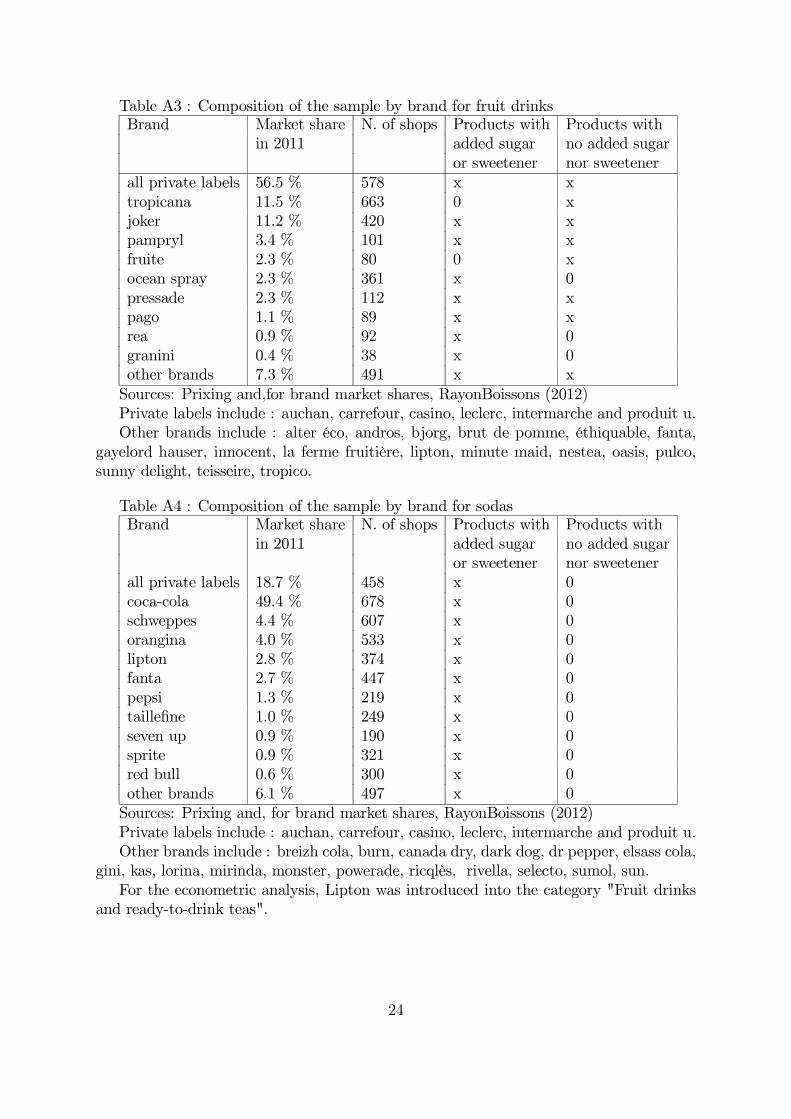
Table A3 : Composition of the sample by brand for fruit drinksBrand Market share N. of shops Products with Products with
in 2011 added sugar no added sugaror sweetener nor sweetener
all private labels 56.5 % 578 x xtropicana 11.5 % 663 0 xjoker 11.2 % 420 x xpampryl 3.4 % 101 x xfruite 2.3 % 80 0 xocean spray 2.3 % 361 x 0pressade 2.3 % 112 x xpago 1.1 % 89 x xrea 0.9 % 92 x 0granini 0.4 % 38 x 0other brands 7.3 % 491 x xSources: Prixing and,for brand market shares, RayonBoissons (2012)Private labels include : auchan, carrefour, casino, leclerc, intermarche and produit u.Other brands include : alter éco, andros, bjorg, brut de pomme, éthiquable, fanta,
gayelord hauser, innocent, la ferme fruitière, lipton, minute maid, nestea, oasis, pulco,sunny delight, teisseire, tropico.
Table A4 : Composition of the sample by brand for sodasBrand Market share N. of shops Products with Products with
in 2011 added sugar no added sugaror sweetener nor sweetener
all private labels 18.7 % 458 x 0coca-cola 49.4 % 678 x 0schweppes 4.4 % 607 x 0orangina 4.0 % 533 x 0lipton 2.8 % 374 x 0fanta 2.7 % 447 x 0pepsi 1.3 % 219 x 0taillefine 1.0 % 249 x 0seven up 0.9 % 190 x 0sprite 0.9 % 321 x 0red bull 0.6 % 300 x 0other brands 6.1 % 497 x 0Sources: Prixing and, for brand market shares, RayonBoissons (2012)Private labels include : auchan, carrefour, casino, leclerc, intermarche and produit u.Other brands include : breizh cola, burn, canada dry, dark dog, dr pepper, elsass cola,
gini, kas, lorina, mirinda, monster, powerade, ricqlès, rivella, selecto, sumol, sun.For the econometric analysis, Lipton was introduced into the category "Fruit drinks
and ready-to-drink teas".
24

As mentioned in the text, there are discrepancies between the number of observationsavailable for the various retail groups and for the product brands and their respectivemarket shares. In order to come to more representative results, we have re-weighted thesample observations. These weights have been defined as follows:
First, the weight ωij of a brand i in a retail chain j has been defined as the productof the brand market share MBi as given in Tables A2 to A4 by that of the retail chainMCj. In particular, the total market share of private labels has been split across retailchains by assuming that their respective market share is that of the retail chain itself:
ωij =MBi × MCj.
Second, this weight ωij has been divided by the number of observations available forthis particular brand in this particular retail chain :
ω∗ij = ωij / Nij
so that the weighted sample should be representative, at the national level, of boththe retail chains relative importance and that of brands.
Finally, to check whether starting our analysis in November 2011 rather than in Sep-tember did not give a biased view regarding the (absence of) average price variationsbefore January 2012, we have built the figure below which provides the average prices byproduct category split between products which are liable to the tax and those which arenot, from September 2011 to March 2012. It shows that the price stability observed inour econometric sample from November to December 2011 is a feature that was alreadyobserved before November. As stated in the text, we decided to restrict our period ofanalysis to November 2011-March 2012 in order to maximize the number of products andshops present in the sample (starting in September significantly reduces this number asthis imposes two more months of "continuous" presence).
25

9 Appendix B: Main characteristics of the alterna-
tive econometric sample
Table 1: Descriptive statistics. Sample November 2011 to June 2012Product Tax N. obs. N. of N. of Mean price
per month products shops (euro per liter)Nov. 2011 Dec. 2011 Jun. 2012
Water No 26244 195 955 0.49 0.49 0.49Yes 4152 32 865 0.80 0.81 0.86
Fruit drink No 34680 330 953 1.74 1.74 1.76Yes 23226 198 948 1.20 1.21 1.27
Soda Yes 43750 264 951 1.16 1.16 1.23
Figure A1: Evolution of the average prices of non-alcoholic drinksbetween November 2011 and June 2012
26

Documents de Travail
396. M. Bussiere and A. Ristiniemi, “Credit Ratings and Debt Crises,” September 2012
397. A. Monfort and F. Pegoraro, “Asset Pricing with Second-Order Esscher Transforms,” September 2012
398. S. Gabrieli, “Too-connected versus too-big-to-fail: banks’ network centrality and overnight interest rate,”
September 2012
399. Y. Kalantzis, R. Kambayashi and S. Lechevalier, “Wage and Productivity differentials in Japan. The Role of
Labor Market Mechanisms,” September 2012
400. F. Bec and M. Bessec, “Inventory Investment Dynamics and Recoveries: A Comparison of Manufacturing and
Retail Trade Sectors,” October 2012
401. P. Antipa, K. Barhoumi, V. Brunhes-Lesage and O. Darné, “Nowcasting German GDP: A comparison of bridge
and factor models,” October 2012
402. G. Gaballo, “Good Luck or Good Policy? An Expectational Theory of Macro-Volatility Switches,”
October 2012
403. J. Barthélemy and M. Marx, “Generalizing the Taylor Principle: New Comment,” October 2012
404. H. Fraisse and P. Frouté, “Households Debt Restructuring: Evidence from the French Experience,” October
2012
405. E. Kremp and P. Sevestre, “Did the crisis induce credit rationing for French SMEs?,” November 2012
406. P. Bacchetta, K. Benhima and Y. Kalantzis, “Capital Controls with International Reserve Accumulation: Can
this Be Optimal?,” November 2012
407. P. Andrade, E. Ghysels and J. Idier, “Tails of Inflation Forecasts and Tales of Monetary Policy,” November
2012
408. N. Berman, A. Berthou and J. Héricourt, “Export dynamics and sales at home,” November 2012
409. M. Bessec, “Short-term forecasts of French GDP: a dynamic factor model with targeted predictors,” November
2012
410. J. Carluccio and T. Fally, “Foreign Entry and Spillovers with Technological Incompatibilities in the Supply
Chain,” November 2012
411. T. Duprey, “Bank Ownership and Credit Cycle: the lower sensitivity of public bank lending to the business
cycle,” December 2012
412. O. Loisel, A. Pommeret and F. Portier, “Monetary Policy and Herd Behavior: Leaning Against Bubbles,”
December 2012
413. F. Collard, H. Dellas, B. Diba and O. Loisel, “Optimal Monetary and Prudential Policies,” December 2012
414. C. Gourieroux, J.-C. Heam and A. Monfort, “Bilateral Exposures and Systemic Solvency Risk,” December
2012
415. N. Berardi, P. Sevestre, M. Tepaut and Alexandre Vigneron, “The impact of a `soda tax' on prices. Evidence
from French micro data,” December 2012
Pour accéder à la liste complète des Documents de Travail publiés par la Banque de France veuillez consulter le site :
www.banque-france.fr
For a complete list of Working Papers published by the Banque de France, please visit the website:
www.banque-france.fr
Pour tous commentaires ou demandes sur les Documents de Travail, contacter la bibliothèque de la Direction Générale
des Études et des Relations Internationales à l'adresse suivante :
For any comment or enquiries on the Working Papers, contact the library of the Directorate General Economics and
International Relations at the following address :
BANQUE DE FRANCE
49- 1404 Labolog
75049 Paris Cedex 01
tél : 0033 (0)1 42 97 77 24 ou 01 42 92 63 40 ou 48 90 ou 69 81
email : [email protected]