Document 4 Asset Category – G&P Transformers · 66kV Transformer Table 1 – ED1 investment...
63
Document 4 Asset Category – G&P Transformers LPN Asset Stewardship Report 2014 Andrew Stephen
Transcript of Document 4 Asset Category – G&P Transformers · 66kV Transformer Table 1 – ED1 investment...
UK Power Networks (Operations) Limited. Registered in England and Wales. Registered No. 3870728. Registered Office: Newington House, 237 Southwark Bridge Road, London, SE1 6NP 1
Document 4 Asset Category – G&P Transformers LPN
Asset Stewardship Report
2014
Andrew Stephen
Asset Stewardship Report 2014 LPN Transformers Version 2.0 All of the cost numbers displayed in this document are before the application of on-going efficiencies and real price effects
UK Power Networks (Operations) Limited. Registered in England and Wales. Registered No. 3870728. Registered Office: Newington House, 237 Southwark Bridge Road, London, SE1 6NP 2
Approved by Richard Wakelen / Barry Hatton
Approved Date 03/03/2014
Document History
Version Date Details Originator Revision
Class Section Update
1.1 20/02/2014 Costs and volumes
updated Andrew Stephen
Minor
1.1, 1.3, 7.4.1, 7.4.2,
7.5.1, Appendix 5
1.2 20/02/2014
Appendix 7 amended to identify available scheme papers, Appendices 8,9 &
10 added
Andrew Stephen
Minor Appendices 7, 8, 9 &10
1.3 24/02/2014 Preface added Andrew Stephen
Minor Preface
1.4 25/02/2014 Update all HI data Andrew Stephen
Minor 1.3, 4.7,
7.2.1, 7.6.2, Appendix 2
1.5 26/02/2014
Remove risk matrices
Update data references
Andrew Stephen
Minor
7.6.2
Appendices
1.6 27/02/2014 HI Tables Updated Andrew Stephen
Minor 7.2.1
1.7 03/03/2014 Editing grammar Andrew Stephen
Minor Preface
1.8 03/03/2014 Reference to Appendix 9
added Andrew Stephen
Minor 1.3
2.0 04/03/2014 Approved by Barry Hatton Andrew Stephen
Major
Asset Stewardship Report 2014 LPN Transformers Version 2.0 All of the cost numbers displayed in this document are before the application of on-going efficiencies and real price effects
UK Power Networks (Operations) Limited. Registered in England and Wales. Registered No. 3870728. Registered Office: Newington House, 237 Southwark Bridge Road, London, SE1 6NP 3
Preface
UK Power Networks uses Asset Stewardship Reports (‘ASR’) to describe the optimum asset
management strategy and proposals for different groups of assets. This optimised asset
management strategy and plan details the levels of investment required and the targeted
interventions and outputs needed. Separate ASRs define the most efficient maintenance and
inspection regimes needed and all documents detail the new forms of innovation which are
required to maximise value, service and safety for all customers and staff throughout the
ED1 regulatory period. Outline proposals for the ED2 period are also included.
Each DNO has a suite of approximately 20 ASR’s. Although asset policy and strategy is
similar for the same assets in each DNO the detailed plans and investment proposals are
different for each DNO. There are also local issues which must be taken into account.
Accordingly each DNO has its own complete set of ASR documents.
A complete list of titles of the ASR’s, a summary of Capex and Opex investment is included
in ‘Document 20: Asset Stewardship Report: Capex/Opex Overview’. This document
also defines how costs and outputs in the various ASR’s build up UK Power Networks
‘NAMP’ (Network Asset Management Plan) and how the NAMP aligns with Ofgem’s ED1
RIGs tables and row numbers.
Where ‘HI’ or asset ‘Health Index’ information is included please note predicted ED1 profiles
are before any benefits from ‘Load driven investment.’
This ASR has also been updated to reflect the feedback from Ofgem on our July 2013 ED1
business plan submission. Accordingly to aid the reader three additional appendices have
been added. They are;
1. Appendix 8 Output NAMP/ED1 Business Plan Data Table Reconciliation: This
section explains the ‘line of sight’ between the UKPN Network Asset Management
Plan (NAMP) and the replacement volumes contained in the Ofgem RIGS tables.
The NAMP is the UKPN ten year rolling asset management investment plan. It is
used as the overarching plan to drive both direct and indirect Capex and Opex
interventions volumes and costs. The volume and cost data used in this ASR to
explain our investment plan is taken from the UK Power Networks NAMP. Appendix
8 explains how the NAMP outputs are translated into the Ofgem RIGS tables. The
translation of costs from the NAMP to the ED1 RIGS tables is more complex and it is
not possible to explain this in a simple table. This is because the costs of a project in
the ‘NAMP’ are allocated to a wide variety of tables and rows in the RIGS. For
example the costs of a typical switchgear replacement project will be allocated to a
range of different Ofgem ED1 RIGs tables and rows such as CV3 (Replacement),
CV5 (Refurbishment) CV6 (Civil works) and CV105 (Operational IT Technology and
Telecoms). However guidance notes of the destination RIGs tables for NAMP
expenditure are included in the table in the Section 1.1 of the Executive Summary of
each ASR.
2. Appendix 9 – Efficiency benchmarking with other DNO’s: This helps to inform
readers how UK Power Networks is positioned from a benchmarking position with

Asset Stewardship Report 2014 LPN Transformers Version 2.0 All of the cost numbers displayed in this document are before the application of on-going efficiencies and real price effects
UK Power Networks (Operations) Limited. Registered in England and Wales. Registered No. 3870728. Registered Office: Newington House, 237 Southwark Bridge Road, London, SE1 6NP 4
other DNO’s. It aims to show why we believe our investment plans in terms of both
volume and money is the right answer when compared to the industry, and why we
believe our asset replacement and refurbishment investment proposals are efficient
and effective and in the best interest for our customers.
3. Appendix 10 – Material changes since the July 2013 ED1 submission: This
section shows the differences between the ASR submitted in July 2013 and the ASR
submitted for the re-submission in March 2014. It aims to inform the reader about the
changes made to volumes and costs as a result of reviewing the plans submitted in
July 2013. Generally the number of changes made is very small, as we believe the
original plan submitted in July 2013 meets the requirements of a well justified plan.
However there are areas where we have identified further efficiencies and
improvements or recent events have driven us to amend our plans to protect
customer safety and service.
We have sought to avoid duplication in other ED1 documents, such as ‘Scheme Justification
Papers’, by referring the reader to key issues of asset policy and asset engineering which
are included in the appropriate ASR documents.
Asset Stewardship Report 2014 LPN Transformers Version 2.0 All of the cost numbers displayed in this document are before the application of on-going efficiencies and real price effects
UK Power Networks (Operations) Limited. Registered in England and Wales. Registered No. 3870728. Registered Office: Newington House, 237 Southwark Bridge Road, London, SE1 6NP 5
Contents Document History ............................................................................................................................................................ 2
1.0 Executive Summary LPN 132kV and EHV Transformers ............................................................ 7
1.1 Scope................................................................................................................................................................... 7
1.2 Investment Strategy ..................................................................................................................................... 8
1.3 ED1 Proposals ................................................................................................................................................. 8
1.4 Innovation ..................................................................................................................................................... 10
1.5 Risks and Opportunities .......................................................................................................................... 10
2.0 Description of 132kV and EHV Transformer Population ............................................................ 10
2.1 132kV Transformers ................................................................................................................................. 10
2.2 EHV Transformers ..................................................................................................................................... 11
3.0 Investment Drivers ........................................................................................................................................ 13
3.1 Condition Measures ................................................................................................................................... 13
3.2 Defects ............................................................................................................................................................ 14
3.3 Fault Rate ....................................................................................................................................................... 17
3.4 Asset Age ........................................................................................................................................................ 18
3.5 Condition Measurements ........................................................................................................................ 19
4.0 Asset Assessment ......................................................................................................................................... 22
4.1 Asset Health .................................................................................................................................................. 22
4.2 Asset Criticality ........................................................................................................................................... 24
4.3 Network Risk................................................................................................................................................ 24
4.4 Data Validation ............................................................................................................................................ 25
4.5 Data Completeness .................................................................................................................................... 25
4.6 Model Testing .............................................................................................................................................. 26
4.7 HI Profile ........................................................................................................................................................ 27
5.0 Intervention Policies ..................................................................................................................................... 29
5.1 Interventions: Description of Intervention Options .................................................................... 29
5.2 Policies: Preferred Interventions ........................................................................................................ 29
6.0 Innovation .......................................................................................................................................................... 31
7.0 ED1 Expenditure Requirements for 132kV/EHV Transformers ............................................. 31
7.1 Method ............................................................................................................................................................ 31
7.2 Constructing the Plan ............................................................................................................................... 32
7.3 Additional Considerations ...................................................................................................................... 34
7.4 Asset Volumes and Expenditure .......................................................................................................... 34
Asset Stewardship Report 2014 LPN Transformers Version 2.0 All of the cost numbers displayed in this document are before the application of on-going efficiencies and real price effects
UK Power Networks (Operations) Limited. Registered in England and Wales. Registered No. 3870728. Registered Office: Newington House, 237 Southwark Bridge Road, London, SE1 6NP 6
7.5 Commentary ................................................................................................................................................. 37
7.6 Sensitivity Analysis and Plan Validation .......................................................................................... 39
8.0 Deliverability ..................................................................................................................................................... 42
Appendices ...................................................................................................................................................................... 43
Appendix 1 – Age Profiles ..................................................................................................................................... 43
Appendix 2 – HI and Criticality Profiles .......................................................................................................... 44
Appendix 3 – Fault Data ......................................................................................................................................... 46
Appendix 4 – WLC Case Study ............................................................................................................................. 48
Appendix 5 NLRE Expenditure Plan ................................................................................................................. 50
Appendix 6 Sensitivity Analysis.......................................................................................................................... 56
Appendix 7 Named Schemes ................................................................................................................................ 59
Appendix 8 Output NAMP/ED1 Business Plan Data Table Reconciliation ....................................... 61
Appendix 9 Efficiency benchmarking with other DNOs ........................................................................... 62
Appendix 10 Material changes since the July 2013 ED1 submission.................................................. 63
Asset Stewardship Report 2014 LPN Transformers Version 2.0 All of the cost numbers displayed in this document are before the application of on-going efficiencies and real price effects
UK Power Networks (Operations) Limited. Registered in England and Wales. Registered No. 3870728. Registered Office: Newington House, 237 Southwark Bridge Road, London, SE1 6NP 7
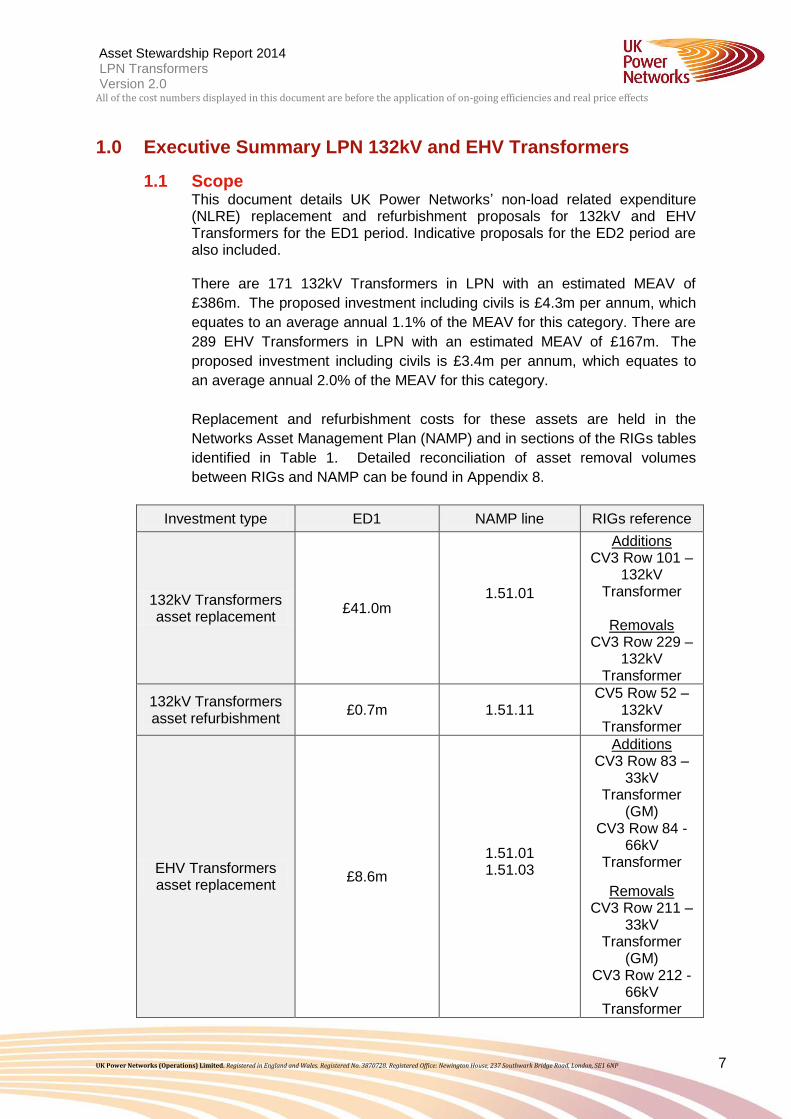
1.0 Executive Summary LPN 132kV and EHV Transformers
1.1 Scope This document details UK Power Networks’ non-load related expenditure (NLRE) replacement and refurbishment proposals for 132kV and EHV Transformers for the ED1 period. Indicative proposals for the ED2 period are also included. There are 171 132kV Transformers in LPN with an estimated MEAV of
£386m. The proposed investment including civils is £4.3m per annum, which
equates to an average annual 1.1% of the MEAV for this category. There are
289 EHV Transformers in LPN with an estimated MEAV of £167m. The
proposed investment including civils is £3.4m per annum, which equates to
an average annual 2.0% of the MEAV for this category.
Replacement and refurbishment costs for these assets are held in the
Networks Asset Management Plan (NAMP) and in sections of the RIGs tables
identified in Table 1. Detailed reconciliation of asset removal volumes
between RIGs and NAMP can be found in Appendix 8.
Investment type ED1 NAMP line RIGs reference
132kV Transformers asset replacement
£41.0m 1.51.01
Additions CV3 Row 101 –
132kV Transformer
Removals
CV3 Row 229 – 132kV
Transformer
132kV Transformers asset refurbishment
£0.7m 1.51.11 CV5 Row 52 –
132kV Transformer
EHV Transformers asset replacement
£8.6m
1.51.01 1.51.03
Additions CV3 Row 83 –
33kV Transformer
(GM) CV3 Row 84 -
66kV Transformer
Removals CV3 Row 211 –
33kV Transformer
(GM) CV3 Row 212 -
66kV Transformer
Asset Stewardship Report 2014 LPN Transformers Version 2.0 All of the cost numbers displayed in this document are before the application of on-going efficiencies and real price effects
UK Power Networks (Operations) Limited. Registered in England and Wales. Registered No. 3870728. Registered Office: Newington House, 237 Southwark Bridge Road, London, SE1 6NP 8
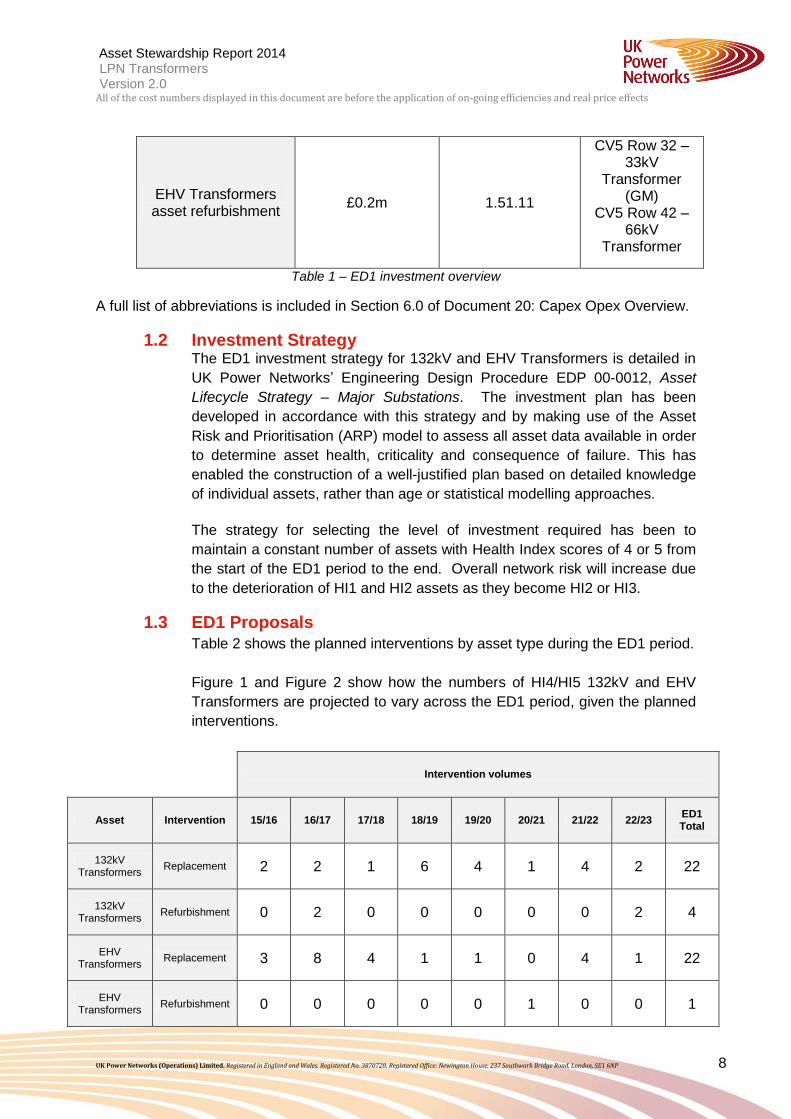
EHV Transformers asset refurbishment
£0.2m 1.51.11
CV5 Row 32 – 33kV
Transformer (GM)
CV5 Row 42 – 66kV
Transformer
Table 1 – ED1 investment overview
A full list of abbreviations is included in Section 6.0 of Document 20: Capex Opex Overview.
1.2 Investment Strategy The ED1 investment strategy for 132kV and EHV Transformers is detailed in
UK Power Networks’ Engineering Design Procedure EDP 00-0012, Asset
Lifecycle Strategy – Major Substations. The investment plan has been
developed in accordance with this strategy and by making use of the Asset
Risk and Prioritisation (ARP) model to assess all asset data available in order
to determine asset health, criticality and consequence of failure. This has
enabled the construction of a well-justified plan based on detailed knowledge
of individual assets, rather than age or statistical modelling approaches.
The strategy for selecting the level of investment required has been to
maintain a constant number of assets with Health Index scores of 4 or 5 from
the start of the ED1 period to the end. Overall network risk will increase due
to the deterioration of HI1 and HI2 assets as they become HI2 or HI3.
1.3 ED1 Proposals
Table 2 shows the planned interventions by asset type during the ED1 period.
Figure 1 and Figure 2 show how the numbers of HI4/HI5 132kV and EHV
Transformers are projected to vary across the ED1 period, given the planned
interventions.
Intervention volumes
Asset Intervention 15/16 16/17 17/18 18/19 19/20 20/21 21/22 22/23 ED1 Total
132kV Transformers
Replacement 2 2 1 6 4 1 4 2 22
132kV Transformers
Refurbishment 0 2 0 0 0 0 0 2 4
EHV Transformers
Replacement 3 8 4 1 1 0 4 1 22
EHV Transformers
Refurbishment 0 0 0 0 0 1 0 0 1

Asset Stewardship Report 2014 LPN Transformers Version 2.0 All of the cost numbers displayed in this document are before the application of on-going efficiencies and real price effects
UK Power Networks (Operations) Limited. Registered in England and Wales. Registered No. 3870728. Registered Office: Newington House, 237 Southwark Bridge Road, London, SE1 6NP 9
Table 2 – ED1 intervention volumes summary
Appendix 9 benchmarks our ED1 proposals with reference to other DNOs July 2013
submissions. It shows that for Grid and Primary Transformers we are proposing to
replace 7% of our assets while other DNOs were seeking funding to replace 10% of
these assets on average. This demonstrates the effectiveness of our asset risk
management systems and the value for money of our proposals.
Figure 1 – Projected 132kV Transformer HI4/HI5 profile
15
18
21
34
15
8 8
0
5
10
15
20
25
30
35
40
2012 2015 2018 2023
Vo
lum
e o
f H
I4/5
Tra
ns
form
ers
Without Investment
With Investment
Asset Stewardship Report 2014 LPN Transformers Version 2.0 All of the cost numbers displayed in this document are before the application of on-going efficiencies and real price effects
UK Power Networks (Operations) Limited. Registered in England and Wales. Registered No. 3870728. Registered Office: Newington House, 237 Southwark Bridge Road, London, SE1 6NP 10
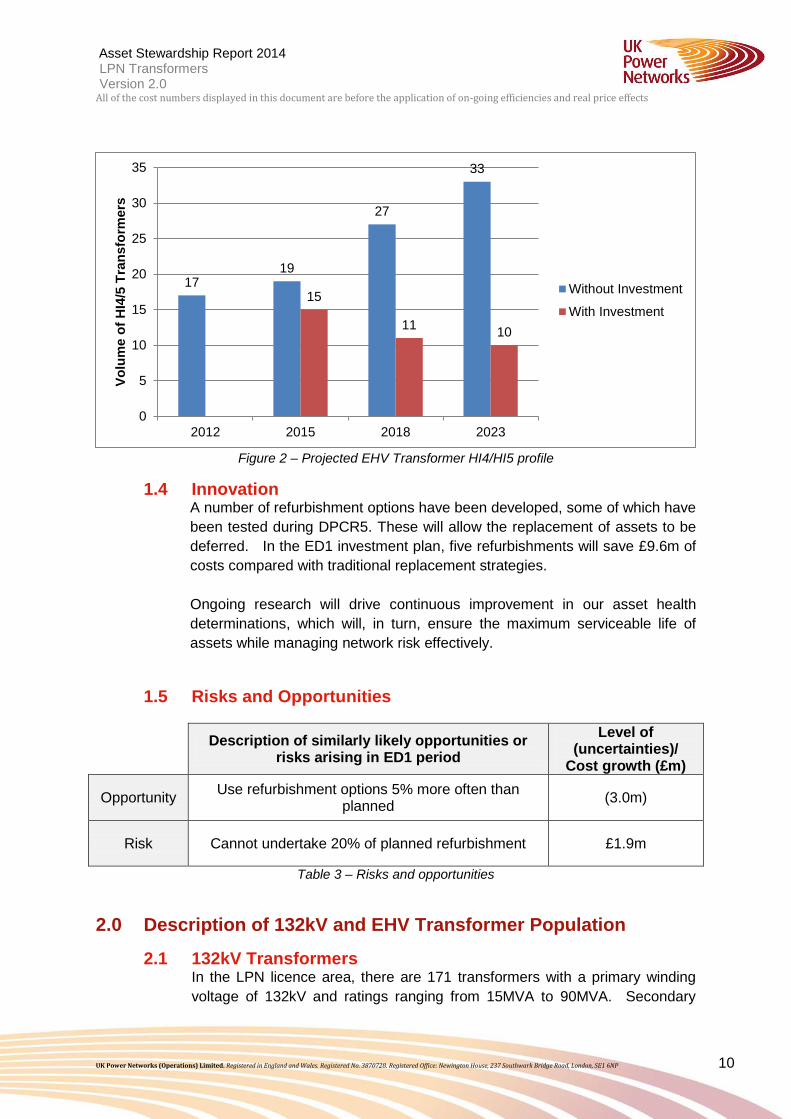
Figure 2 – Projected EHV Transformer HI4/HI5 profile
1.4 Innovation A number of refurbishment options have been developed, some of which have
been tested during DPCR5. These will allow the replacement of assets to be
deferred. In the ED1 investment plan, five refurbishments will save £9.6m of
costs compared with traditional replacement strategies.
Ongoing research will drive continuous improvement in our asset health
determinations, which will, in turn, ensure the maximum serviceable life of
assets while managing network risk effectively.
1.5 Risks and Opportunities
Description of similarly likely opportunities or
risks arising in ED1 period
Level of (uncertainties)/
Cost growth (£m)
Opportunity Use refurbishment options 5% more often than
planned (3.0m)
Risk Cannot undertake 20% of planned refurbishment £1.9m
Table 3 – Risks and opportunities
2.0 Description of 132kV and EHV Transformer Population
2.1 132kV Transformers In the LPN licence area, there are 171 transformers with a primary winding
voltage of 132kV and ratings ranging from 15MVA to 90MVA. Secondary
17 19
27
33
15
11 10
0
5
10
15
20
25
30
35
2012 2015 2018 2023
Vo
lum
e o
f H
I4/5
Tra
ns
form
ers
Without Investment
With Investment
Asset Stewardship Report 2014 LPN Transformers Version 2.0 All of the cost numbers displayed in this document are before the application of on-going efficiencies and real price effects
UK Power Networks (Operations) Limited. Registered in England and Wales. Registered No. 3870728. Registered Office: Newington House, 237 Southwark Bridge Road, London, SE1 6NP 11
windings voltages are 66kV, 33kV, 25kV, 22kV, 20kV, 11kV or 6.6kV. These
assets are located on 61 substation sites.
Figure 3 – LPN 132kV Transformer age profile
Source: 2012 RIGs V5
As can be seen from the age profile in Figure 3, significant investment was
made in the 1960s; the average age of these assets is 33.3 years. The
average age of the oldest 10% of 132kV transformers is 56 years.
NAMP line Description
1.51.01 132kV Transformer replacement
1.51.11 132kV and EHV Transformer refurbishment
Table 4 – NAMP reference
RIGs tab Line Asset Category Activity
CV3 101 132kV Transformer Additions
CV3 229 132kV Transformer Removals
CV5 52 132kV Transformer Refurbishment -
Transformer Table 5 – RIGs reference
2.2 EHV Transformers In the LPN licence area, there are 289 EHV Transformers with a primary
winding voltage of 66kV or 33kV and ratings ranging from 12MVA to 45MVA.
Secondary windings voltages are 33kV, 22kV, 11kV or 6.6kV. These assets
are located on 70 substation sites.
0
2
4
6
8
10
12
14
16
18
20
19
49
19
51
19
53
19
55
19
57
19
59
19
61
19
63
19
65
19
67
19
69
19
71
19
73
19
75
19
77
19
79
19
81
19
83
19
85
19
87
19
89
19
91
19
93
19
95
19
97
19
99
20
01
20
03
20
05
20
07
20
09
20
11
Vo
lum
e o
f T
ran
sfo
rmers
Year
Asset Stewardship Report 2014 LPN Transformers Version 2.0 All of the cost numbers displayed in this document are before the application of on-going efficiencies and real price effects
UK Power Networks (Operations) Limited. Registered in England and Wales. Registered No. 3870728. Registered Office: Newington House, 237 Southwark Bridge Road, London, SE1 6NP 12
Figure 4 – LPN EHV Transformer age profile
Source: 2012 RIGs V5
As can be seen from the age profile in Figure 4, significant investment was
made in the 1960s. Many of these older assets have yet to be retired from
service and the average age of these assets is 47 years. The average age of
the oldest 10% of EHV Transformers is 62 years, which is significantly greater
than in EPN or SPN.
NAMP line Description
1.51.03 EHV Transformer replacement
1.51.11 132kV and EHV Transformer
refurbishment Table 6 – NAMP reference
RIGs tab Line Asset Category Activity
CV3 83 33kV Transformer (GM) Additions
CV3 211 33kV Transformer (GM) Removals
CV3 84 66kV Transformer Additions
CV3 212 66kV Transformer Removals
CV5 32 33kV Transformer (GM) Refurbishment -
Transformer
CV5 42 66kV Transformer Refurbishment -
Transformer Table 7 – RIGs reference
0
5
10
15
20
25
30
35
40
45
5019
37
19
41
19
45
19
48
19
50
19
52
19
54
19
56
19
58
19
60
19
62
19
64
19
66
19
68
19
70
19
72
19
74
19
76
19
78
19
80
19
82
19
84
19
86
19
88
19
90
19
92
19
94
19
96
19
98
20
00
20
02
20
04
20
06
20
08
20
10
Vo
lum
e o
f T
ran
sfo
rmers
Year
Asset Stewardship Report 2014 LPN Transformers Version 2.0 All of the cost numbers displayed in this document are before the application of on-going efficiencies and real price effects
UK Power Networks (Operations) Limited. Registered in England and Wales. Registered No. 3870728. Registered Office: Newington House, 237 Southwark Bridge Road, London, SE1 6NP 13
3.0 Investment Drivers
3.1 Condition Measures 3.1.1 Transformers
Investment drivers from the transformer can be split into two categories:
internal condition and external condition. External condition factors include
paint condition and corrosion of any part of the transformer, cooler or
conservator and their pipe work. In addition, old gasket material can become
compressed and brittle.
Figure 5 – Severe oil leak from main cover gasket, Bengeworth Road GT2
These factors pose both an environmental risk, particularly on older
transformers without oil bunds, and a network risk, as they can lead to severe
oil leaks and unplanned outages. UK Power Networks’ Health, Safety and
Sustainability Standard HSS 01 021, Environmental Management of
Insulating Oils: Use, Handling, Storage, Recording and Disposal, requires that
transformers with persistent oil leaks are considered for repair or
replacement. Internal condition factors are the degradation of solid insulation
materials on the windings and the development of discharge and heating
faults. Both of these internal condition factors are detected by non-intrusive
oil sample testing.
3.1.2 Tap changers
Asset Stewardship Report 2014 LPN Transformers Version 2.0 All of the cost numbers displayed in this document are before the application of on-going efficiencies and real price effects
UK Power Networks (Operations) Limited. Registered in England and Wales. Registered No. 3870728. Registered Office: Newington House, 237 Southwark Bridge Road, London, SE1 6NP 14
As tap changers are the only moving part of the transformer, they are the
most maintenance-intensive part and so often the most likely to develop
defects. Although the assessment of external condition is the same as for the
transformer, regular maintenance means that the internal condition can be
assessed more easily.
Tap changers regularly have contacts changed, but older models increasingly
require additional parts, such as new springs, due to the originals becoming
weak over time. With many old tap changers, obsolescence becomes an
issue because there is no manufacturer support, which makes it difficult to
obtain the necessary parts (an example is the Allenwest LS slow-speed tap
changer manufactured from the early 1950s). This increases the operational
expenditure as parts are manufactured to order, often without the original
designs available, which builds a reliance on recovering parts from
decommissioned units. In total there are 40 different tap changer designs
commissioned in LPN.
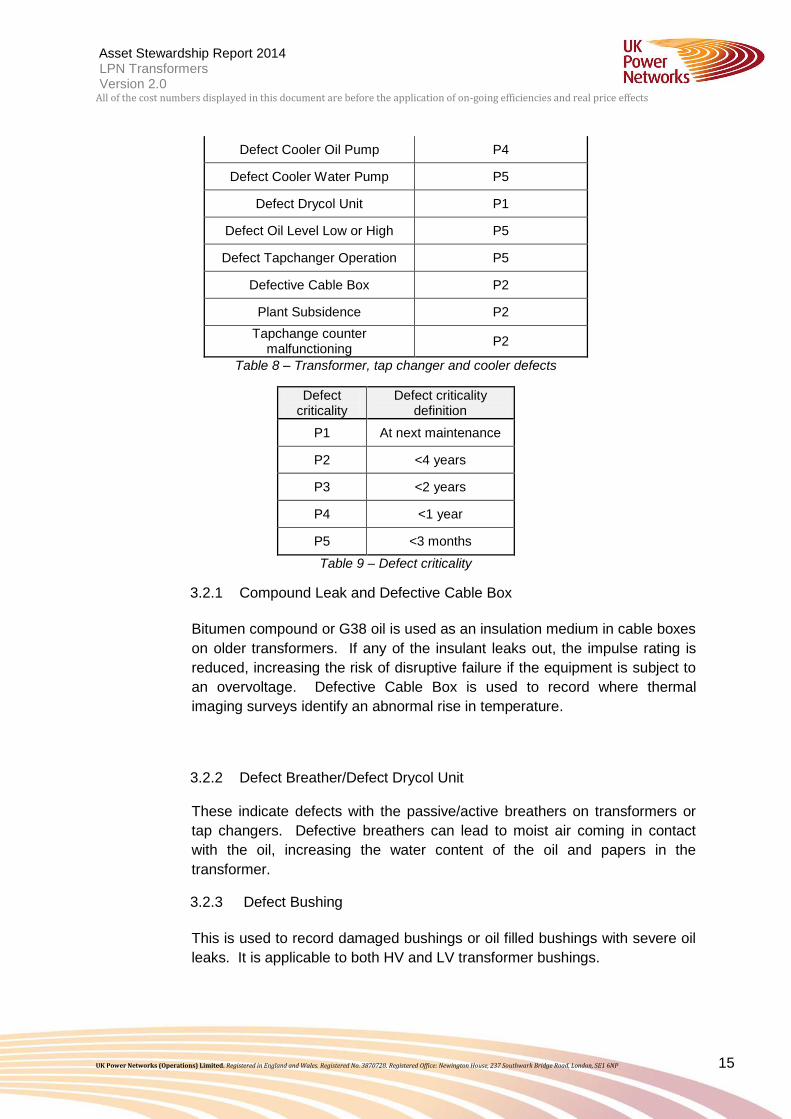
3.2 Defects Defects are an important way of recording non-conformities that could affect
the performance of assets and impact their health. Table 8 shows the defects
on transformer, tap changer and cooler assets that affect the asset’s health
and are reportable within our asset register, Ellipse,. Each defect is assigned
a priority rating, as defined in Table 9, which sets the target timescale for
repair.
Defect description Defect priority
Compound Leak P2
Defect Breather P1
Defect Bushing P4
Defect Control/Marshalling Cubicle
P3
Defect Cooler Auto Control P4
Defect Cooler Fail Alarm P4
Defect Cooler Fan P4
Asset Stewardship Report 2014 LPN Transformers Version 2.0 All of the cost numbers displayed in this document are before the application of on-going efficiencies and real price effects
UK Power Networks (Operations) Limited. Registered in England and Wales. Registered No. 3870728. Registered Office: Newington House, 237 Southwark Bridge Road, London, SE1 6NP 15
Defect Cooler Oil Pump P4
Defect Cooler Water Pump P5
Defect Drycol Unit P1
Defect Oil Level Low or High P5
Defect Tapchanger Operation P5
Defective Cable Box P2
Plant Subsidence P2
Tapchange counter malfunctioning
P2
Table 8 – Transformer, tap changer and cooler defects
Defect criticality
Defect criticality definition
P1 At next maintenance
P2 <4 years
P3 <2 years
P4 <1 year
P5 <3 months
Table 9 – Defect criticality
3.2.1 Compound Leak and Defective Cable Box
Bitumen compound or G38 oil is used as an insulation medium in cable boxes
on older transformers. If any of the insulant leaks out, the impulse rating is
reduced, increasing the risk of disruptive failure if the equipment is subject to
an overvoltage. Defective Cable Box is used to record where thermal
imaging surveys identify an abnormal rise in temperature.
3.2.2 Defect Breather/Defect Drycol Unit
These indicate defects with the passive/active breathers on transformers or
tap changers. Defective breathers can lead to moist air coming in contact
with the oil, increasing the water content of the oil and papers in the
transformer.
3.2.3 Defect Bushing
This is used to record damaged bushings or oil filled bushings with severe oil
leaks. It is applicable to both HV and LV transformer bushings.
Asset Stewardship Report 2014 LPN Transformers Version 2.0 All of the cost numbers displayed in this document are before the application of on-going efficiencies and real price effects
UK Power Networks (Operations) Limited. Registered in England and Wales. Registered No. 3870728. Registered Office: Newington House, 237 Southwark Bridge Road, London, SE1 6NP 16
3.2.4 Defect Control/Marshalling Cubicle
This is a means of recording defects in the small wiring, auxiliary fuses and
terminal blocks associated with the control of the transformer and tap
changer. These defects can prevent the correct operation of the AVC and
transformer and tap changer alarms.
3.2.5 Cooler defects
Defect Cooler Auto Control, Fail Alarm, Fan, Oil Pump and Water Pump all
refer to defects with the transformer forced cooling system. Any defects in
these systems can affect the rating of the transformer, overstressing the
asset.
3.2.6 Defect Oil Level Low or High
During inspection, the oil sight glasses are checked to ensure the oil level is
correct. Low oil level can indicate leaks and is a risk to network security,
particularly during cold weather. If the oil level drops too low, it will result in a
Buchholz alarm or trip, affecting network security and incurring extra
operational expenditure.
3.2.7 Defect Tap changer Operation/Counter Malfunctioning
This records tap changers that are not in an operational state for any number
of reasons, such as the AVC scheme malfunctioning or a broken mechanism
identified during maintenance. This is classed as a P5 defect due to the
impact a non-operational tap changer has on the voltage regulation. A
malfunctioning counter can make it harder to identify where abnormal tapping
operations are occurring, limiting the ability to identify a potential problem
early.
3.2.8 Plant Subsidence
This identifies where subsidence is or will affect the operation of an asset.
3.2.9 Asset defect analysis
Asset Stewardship Report 2014 LPN Transformers Version 2.0 All of the cost numbers displayed in this document are before the application of on-going efficiencies and real price effects
UK Power Networks (Operations) Limited. Registered in England and Wales. Registered No. 3870728. Registered Office: Newington House, 237 Southwark Bridge Road, London, SE1 6NP 17
Figure 6 – LPN 132kV and EHV Transformer Defect Rate
Source: Ellipse Extract 19/02/2013 2012 RIGs V5
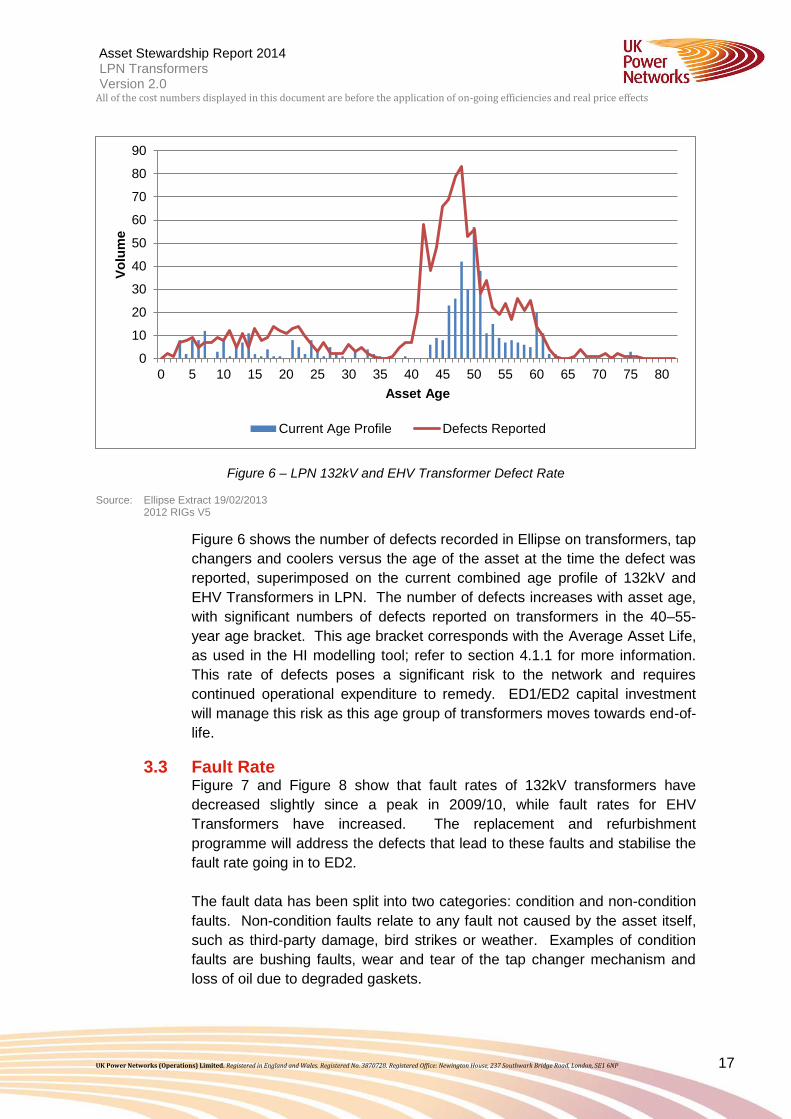
Figure 6 shows the number of defects recorded in Ellipse on transformers, tap
changers and coolers versus the age of the asset at the time the defect was
reported, superimposed on the current combined age profile of 132kV and
EHV Transformers in LPN. The number of defects increases with asset age,
with significant numbers of defects reported on transformers in the 40–55-
year age bracket. This age bracket corresponds with the Average Asset Life,
as used in the HI modelling tool; refer to section 4.1.1 for more information.
This rate of defects poses a significant risk to the network and requires
continued operational expenditure to remedy. ED1/ED2 capital investment
will manage this risk as this age group of transformers moves towards end-of-
life.
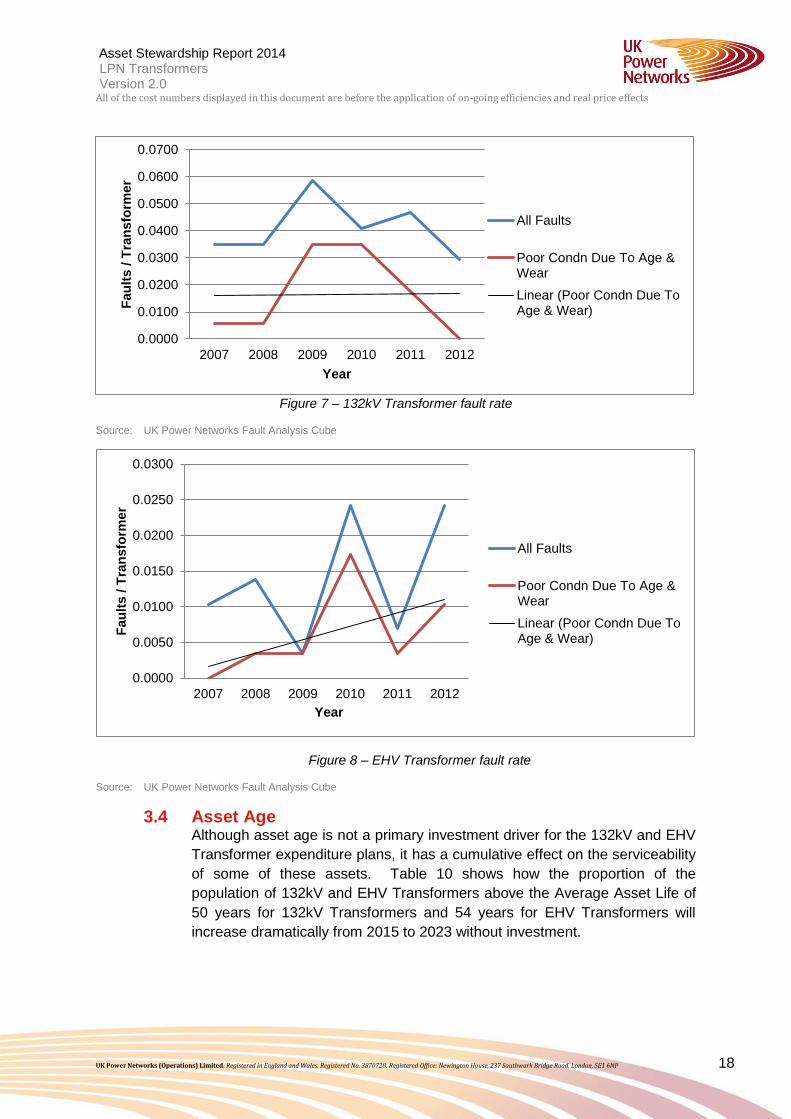
3.3 Fault Rate Figure 7 and Figure 8 show that fault rates of 132kV transformers have
decreased slightly since a peak in 2009/10, while fault rates for EHV
Transformers have increased. The replacement and refurbishment
programme will address the defects that lead to these faults and stabilise the
fault rate going in to ED2.
The fault data has been split into two categories: condition and non-condition
faults. Non-condition faults relate to any fault not caused by the asset itself,
such as third-party damage, bird strikes or weather. Examples of condition
faults are bushing faults, wear and tear of the tap changer mechanism and
loss of oil due to degraded gaskets.
0
10
20
30
40
50
60
70
80
90
0 5 10 15 20 25 30 35 40 45 50 55 60 65 70 75 80
Vo
lum
e
Asset Age
Current Age Profile Defects Reported
Asset Stewardship Report 2014 LPN Transformers Version 2.0 All of the cost numbers displayed in this document are before the application of on-going efficiencies and real price effects
UK Power Networks (Operations) Limited. Registered in England and Wales. Registered No. 3870728. Registered Office: Newington House, 237 Southwark Bridge Road, London, SE1 6NP 18
Figure 7 – 132kV Transformer fault rate
Source: UK Power Networks Fault Analysis Cube
Figure 8 – EHV Transformer fault rate
Source: UK Power Networks Fault Analysis Cube
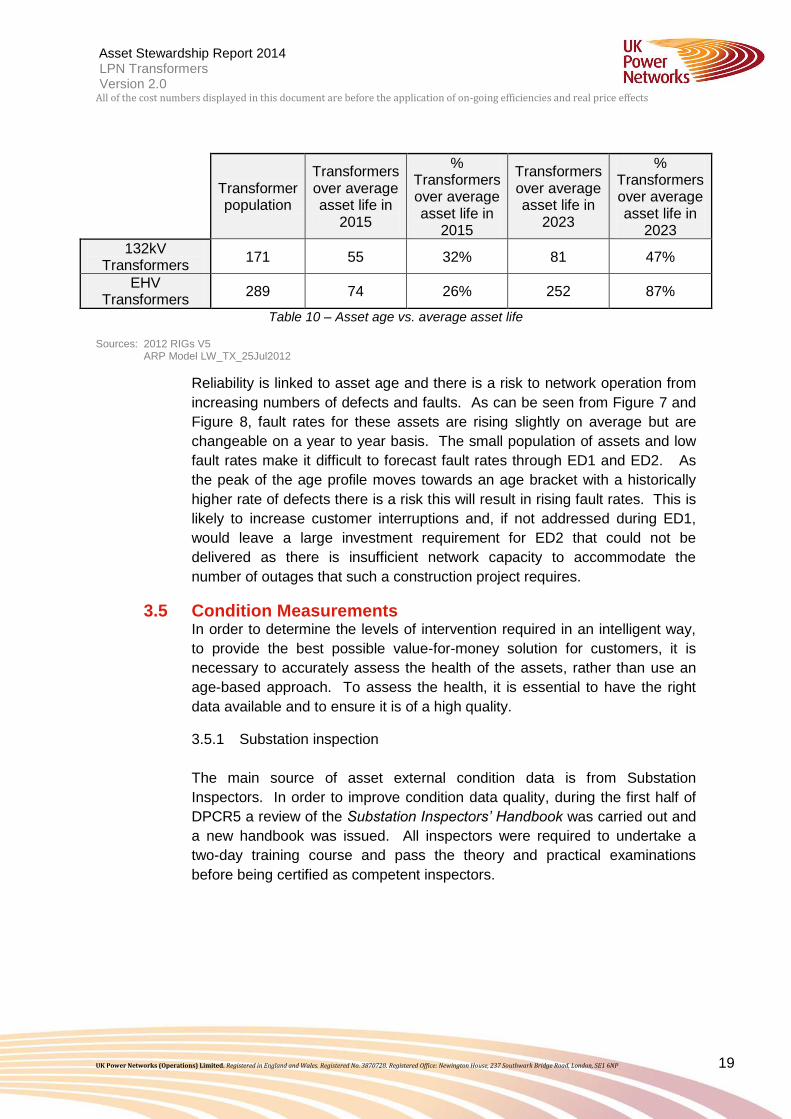
3.4 Asset Age Although asset age is not a primary investment driver for the 132kV and EHV
Transformer expenditure plans, it has a cumulative effect on the serviceability
of some of these assets. Table 10 shows how the proportion of the
population of 132kV and EHV Transformers above the Average Asset Life of
50 years for 132kV Transformers and 54 years for EHV Transformers will
increase dramatically from 2015 to 2023 without investment.
0.0000
0.0100
0.0200
0.0300
0.0400
0.0500
0.0600
0.0700
2007 2008 2009 2010 2011 2012
Fau
lts /
Tra
nsfo
rmer
Year
All Faults
Poor Condn Due To Age &Wear
Linear (Poor Condn Due ToAge & Wear)
0.0000
0.0050
0.0100
0.0150
0.0200
0.0250
0.0300
2007 2008 2009 2010 2011 2012
Fau
lts /
Tra
nsfo
rmer
Year
All Faults
Poor Condn Due To Age &Wear
Linear (Poor Condn Due ToAge & Wear)
Asset Stewardship Report 2014 LPN Transformers Version 2.0 All of the cost numbers displayed in this document are before the application of on-going efficiencies and real price effects
UK Power Networks (Operations) Limited. Registered in England and Wales. Registered No. 3870728. Registered Office: Newington House, 237 Southwark Bridge Road, London, SE1 6NP 19
Transformer population
Transformers over average asset life in
2015
% Transformers over average asset life in
2015
Transformers over average asset life in
2023
% Transformers over average asset life in
2023
132kV Transformers
171 55 32% 81 47%
EHV Transformers
289 74 26% 252 87%
Table 10 – Asset age vs. average asset life
Sources: 2012 RIGs V5 ARP Model LW_TX_25Jul2012
Reliability is linked to asset age and there is a risk to network operation from
increasing numbers of defects and faults. As can be seen from Figure 7 and
Figure 8, fault rates for these assets are rising slightly on average but are
changeable on a year to year basis. The small population of assets and low
fault rates make it difficult to forecast fault rates through ED1 and ED2. As
the peak of the age profile moves towards an age bracket with a historically
higher rate of defects there is a risk this will result in rising fault rates. This is
likely to increase customer interruptions and, if not addressed during ED1,
would leave a large investment requirement for ED2 that could not be
delivered as there is insufficient network capacity to accommodate the
number of outages that such a construction project requires.
3.5 Condition Measurements In order to determine the levels of intervention required in an intelligent way,
to provide the best possible value-for-money solution for customers, it is
necessary to accurately assess the health of the assets, rather than use an
age-based approach. To assess the health, it is essential to have the right
data available and to ensure it is of a high quality.
3.5.1 Substation inspection
The main source of asset external condition data is from Substation
Inspectors. In order to improve condition data quality, during the first half of
DPCR5 a review of the Substation Inspectors’ Handbook was carried out and
a new handbook was issued. All inspectors were required to undertake a
two-day training course and pass the theory and practical examinations
before being certified as competent inspectors.
Asset Stewardship Report 2014 LPN Transformers Version 2.0 All of the cost numbers displayed in this document are before the application of on-going efficiencies and real price effects
UK Power Networks (Operations) Limited. Registered in England and Wales. Registered No. 3870728. Registered Office: Newington House, 237 Southwark Bridge Road, London, SE1 6NP 20
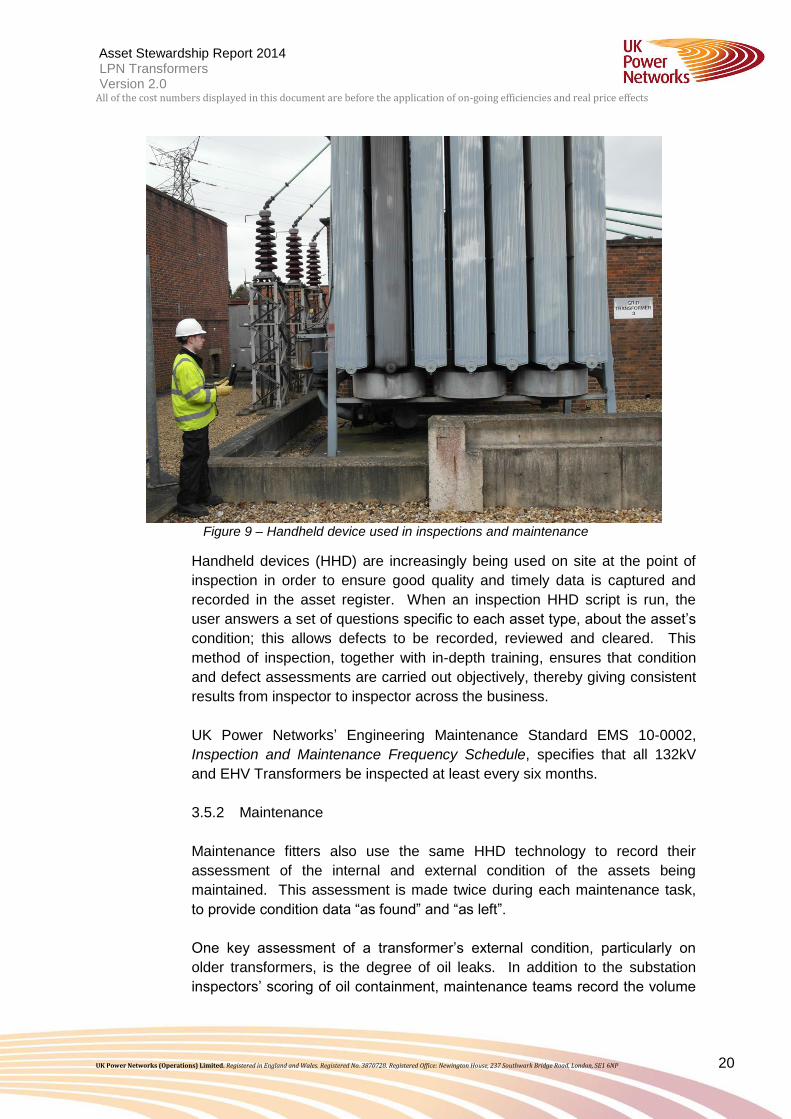
Figure 9 – Handheld device used in inspections and maintenance
Handheld devices (HHD) are increasingly being used on site at the point of
inspection in order to ensure good quality and timely data is captured and
recorded in the asset register. When an inspection HHD script is run, the
user answers a set of questions specific to each asset type, about the asset’s
condition; this allows defects to be recorded, reviewed and cleared. This
method of inspection, together with in-depth training, ensures that condition
and defect assessments are carried out objectively, thereby giving consistent
results from inspector to inspector across the business.
UK Power Networks’ Engineering Maintenance Standard EMS 10-0002,
Inspection and Maintenance Frequency Schedule, specifies that all 132kV
and EHV Transformers be inspected at least every six months.
3.5.2 Maintenance
Maintenance fitters also use the same HHD technology to record their
assessment of the internal and external condition of the assets being
maintained. This assessment is made twice during each maintenance task,
to provide condition data “as found” and “as left”.
One key assessment of a transformer’s external condition, particularly on
older transformers, is the degree of oil leaks. In addition to the substation
inspectors’ scoring of oil containment, maintenance teams record the volume
Asset Stewardship Report 2014 LPN Transformers Version 2.0 All of the cost numbers displayed in this document are before the application of on-going efficiencies and real price effects
UK Power Networks (Operations) Limited. Registered in England and Wales. Registered No. 3870728. Registered Office: Newington House, 237 Southwark Bridge Road, London, SE1 6NP 21
of oil in litres whenever they top up the oil level. This allows leakage rates to
be measured for each transformer.
UK Power Networks’ Engineering Maintenance Standard EMS 10-0002,
Inspection and Maintenance Frequency Schedule, requires that all 132kV and
EHV Transformers be maintained every eight years. Tap changers have
various maintenance cycles that are dependent upon the make and model.
High-speed tap changers are maintained less frequently than older slow-
speed tap changers, and some models have known issues or a history of
defects that require them to be maintained as often as every two years. An
example is the Ferranti Rotary tap changer manufactured in the 1950s, as
found at Bulwer Street 11kV.
3.5.3 Oil analysis
Oil samples are taken regularly from all grid and primary transformers to
assess their internal condition. By measuring the furans (FFA) in the oil, the
degree of polymerisation of the paper on the windings can be interpolated to
give an estimate of the paper’s remaining life. Dissolved Gas Analysis (DGA)
is also carried out to identify developing faults within the transformer. The
dissolved gases are produced in the oil when heating processes such as
discharge or arcing are taking place. By assessing the trend of gases, a
developing fault can be identified and addressed.
UK Power Networks’ Engineering Maintenance Standard EMS 10-0002,
Inspection and Maintenance Frequency Schedule, specifies that all 132kV
and 66kV transformers are sampled annually and all other EHV Transformers
are sampled every four years. Samples are sent to one of two external
laboratories for independent analysis.
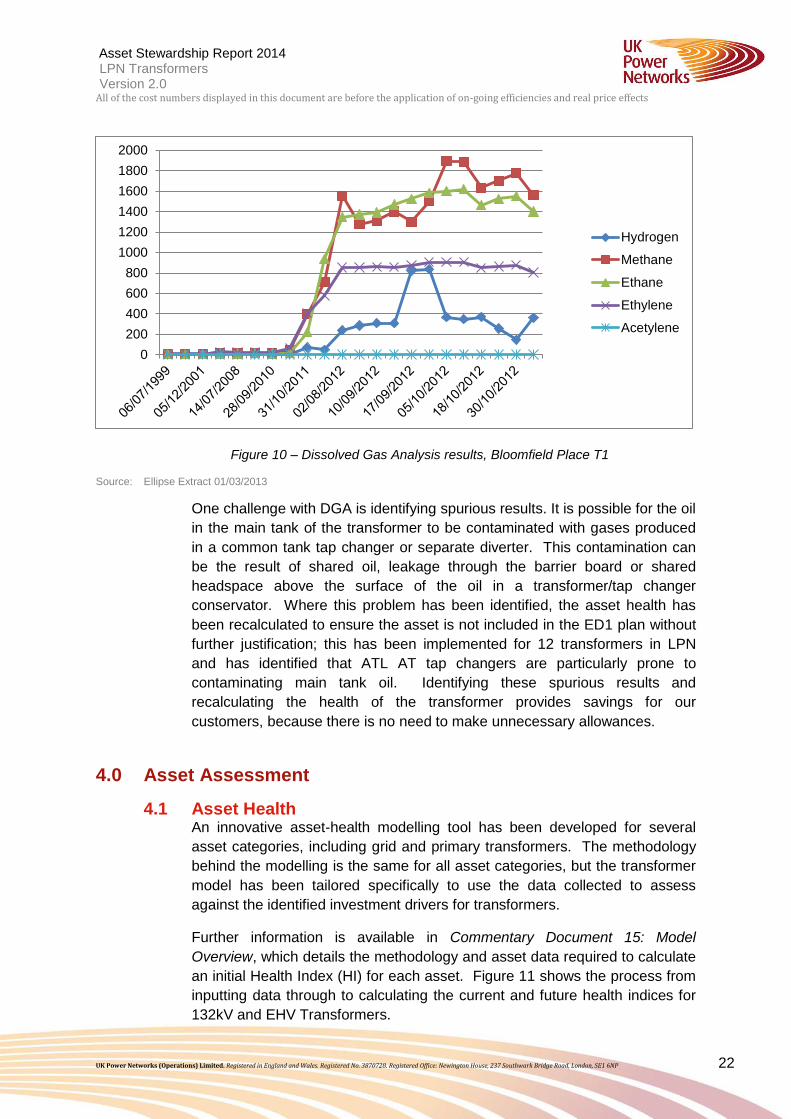
Figure 10 shows the levels of dissolved gases within one transformer, which,
until July 2011, was stable with no indications of faults. Following the first
indication of a developing problem, oil-sampling frequency was increased.
Between July 2011 and August 2012, a significant increase in fault gases was
recorded, indicating medium-temperature overheating at around 300°C.
Since August 2012, the gas levels have stabilised and increased oil sampling
will continue to monitor for further fault progression until the unit is
decommissioned.
Asset Stewardship Report 2014 LPN Transformers Version 2.0 All of the cost numbers displayed in this document are before the application of on-going efficiencies and real price effects
UK Power Networks (Operations) Limited. Registered in England and Wales. Registered No. 3870728. Registered Office: Newington House, 237 Southwark Bridge Road, London, SE1 6NP 22
Figure 10 – Dissolved Gas Analysis results, Bloomfield Place T1
Source: Ellipse Extract 01/03/2013
One challenge with DGA is identifying spurious results. It is possible for the oil
in the main tank of the transformer to be contaminated with gases produced
in a common tank tap changer or separate diverter. This contamination can
be the result of shared oil, leakage through the barrier board or shared
headspace above the surface of the oil in a transformer/tap changer
conservator. Where this problem has been identified, the asset health has
been recalculated to ensure the asset is not included in the ED1 plan without
further justification; this has been implemented for 12 transformers in LPN
and has identified that ATL AT tap changers are particularly prone to
contaminating main tank oil. Identifying these spurious results and
recalculating the health of the transformer provides savings for our
customers, because there is no need to make unnecessary allowances.
4.0 Asset Assessment
4.1 Asset Health An innovative asset-health modelling tool has been developed for several
asset categories, including grid and primary transformers. The methodology
behind the modelling is the same for all asset categories, but the transformer
model has been tailored specifically to use the data collected to assess
against the identified investment drivers for transformers.
Further information is available in Commentary Document 15: Model
Overview, which details the methodology and asset data required to calculate
an initial Health Index (HI) for each asset. Figure 11 shows the process from
inputting data through to calculating the current and future health indices for
132kV and EHV Transformers.
0
200
400
600
800
1000
1200
1400
1600
1800
2000
Hydrogen
Methane
Ethane
Ethylene
Acetylene

Asset Stewardship Report 2014 LPN Transformers Version 2.0 All of the cost numbers displayed in this document are before the application of on-going efficiencies and real price effects
UK Power Networks (Operations) Limited. Registered in England and Wales. Registered No. 3870728. Registered Office: Newington House, 237 Southwark Bridge Road, London, SE1 6NP 23
Condition scores recorded during inspection and maintenance and oil top-up
history are then used to calculate a weighting factor that is applied to the
initial HI. A similar process is also used to calculate a weighted HI for the tap
changer. Separate HI scores are calculated for DGA, FFA and oil quality
using oil sample results, excluding any data more than 10 years old. The
highest score from these contributing HIs is identified as the main HI driver
and is used as the overall HI score for each transformer.
As transformer oil leaks can have significant environmental, network and
business consequences, it is our policy, as stated in UK Power Networks’
Health, Safety and Sustainability Standard HSS 01-021, Environmental
Management of Insulating Oils: Use, Handling, Storage, Recording and
Disposal, to ensure all topping up of oil is recorded in the asset register. This
ensures that leaking transformers can be identified and the appropriate
course of action is planned in a timely manner. Where the Oil Containment
condition measure is recorded as a 4 (on a 1–4 scale), the overall HI of the
transformer cannot be less than 4.
Inspection Data
External Condition
External Defects
Maintenance Data
Internal Condition
External Condition
Internal Defects
External Defects
Oil Top-ups
Volume
Oil Sample Results
DGA
FFA
Moisture
Acidity
Breakdown Voltage
Transformer Asset
Data
Age
Make
Model
Location Data
Proximity to Coast
Indoor/Outdoor
Duty
Initial HI
Condition
Weighted HIDGA HI FFA HI Oil Quality HI Tap Changer HI
Tap Changer
Asset Data
Age
Make
Model
Final Current HI
Future HI
Figure 11 – Transformer HI modelling methodology
4.1.1 Average Asset Life
Asset Stewardship Report 2014 LPN Transformers Version 2.0 All of the cost numbers displayed in this document are before the application of on-going efficiencies and real price effects
UK Power Networks (Operations) Limited. Registered in England and Wales. Registered No. 3870728. Registered Office: Newington House, 237 Southwark Bridge Road, London, SE1 6NP 24
In order to calculate asset health degradation, each asset is assigned an
Average Asset Life in the ARP model. This is defined in the model calibration
and is specific to the manufacturer and model of the asset. This approach
takes into account the changes in transformer design and manufacturing
processes over time. In this context, within the ARP model the Average
Asset Life is considered to be the point in the life of the asset when significant
increases in defects start to appear and it is found to be in poorer condition.
Note: The majority of transformers would remain in service significantly
beyond their assigned Average Asset Life in the ARP model. For further
details and examples of Average Asset Lives for these assets, refer to
Commentary Document 15: Model Overview.
4.2 Asset Criticality Another feature of the ARP model still under development can be used to
calculate the criticality of a particular transformer asset. This is then defined in
the form of a Criticality Index with a scale of 1 to 4, with 1 being the least
critical and 4 being the most critical. A detailed methodology for calculating
the Criticality Index can be found in Commentary Document 15: Model
Overview.
Five main areas are considered when calculating the criticality of assets:
network performance, safety, operational expenditure, capital expenditure
and the environment. A number of factors generic to all ARP models are used
in these areas, in addition to some specific to transformers.
For network performance, the key factors for the transformer model are the
number of customers that the substation feeds and the maximum substation
demand.
The safety criticality is assessed based on the ESQC risk rating for the site
and the situation of the transformer (indoors, outdoors or basement).
The operational and capital expenditure criticalities consider the assets in
terms of the ease of carrying out works due to the equipment situation, site
type and transformer rating.
Finally, the environment section considers whether the site is in an
environmentally sensitive location and if the transformer is housed in a
bunded area.
4.3 Network Risk ARP provides for an innovative new approach to calculating network risk for a
given asset category. UK Power Networks believes this is one of the first
comprehensive applications of such quantified risk modelling for electricity
distribution networks worldwide. The network risk is determined by the
probability of failure, directly proportional to the HI, and the criticality of each
asset. The consequence of failure is the average cost to repair or replace a
Asset Stewardship Report 2014 LPN Transformers Version 2.0 All of the cost numbers displayed in this document are before the application of on-going efficiencies and real price effects
UK Power Networks (Operations) Limited. Registered in England and Wales. Registered No. 3870728. Registered Office: Newington House, 237 Southwark Bridge Road, London, SE1 6NP 25
transformer following one of three failure modes. This section of the ARP
model is still in the early stages of development.
Failure mode Description
Minor Can be repaired by maintenance teams
Significant Can be repaired using external resources/expertise
Major Cannot be repaired on site; offsite repair or
replacement is required
Table 11 – Failure mode definitions
Section 7.6.2 details the method of this risk analysis and the results obtained.
4.4 Data Validation All data used in the ARP model is subject to validation against a set of data
requirements. The requirements ensure data is within specified limits, up to
date and in the correct format for use in the model. On completion of the
validation process, an exception report is issued. This provides details of
every non-compliance and supports the continual improvement of data
quality.
One measure used in the ARP model, Moisture Corrected to 20°C, has a
valid range of 0 to 100ppm, with any data outside this range being excluded
from the model and leading to the creation of an exception report. In addition,
oil sample data more than 10 years old is excluded from the model.
4.5 Data Completeness
As the asset condition data, particularly oil sample results, is such a vital part
of determining the health of a transformer, the data was tested for
completeness. In order for a particular set of oil sample results to be
considered complete, certain measures had to be identified as ‘essential’:
moisture, FFA, hydrogen, methane, ethane, ethylene and acetylene. To
establish trends while ensuring data is not obsolete, oil sample results older
than 10 years old are excluded from the ARP model. Table 12 shows the
number of oil sample result sets, distinct transformers with at least one set of
oil sample results and distinct transformers with at least one set of oil sample
results with all ‘essential’ measures, also expressed as a percentage of the
asset population.
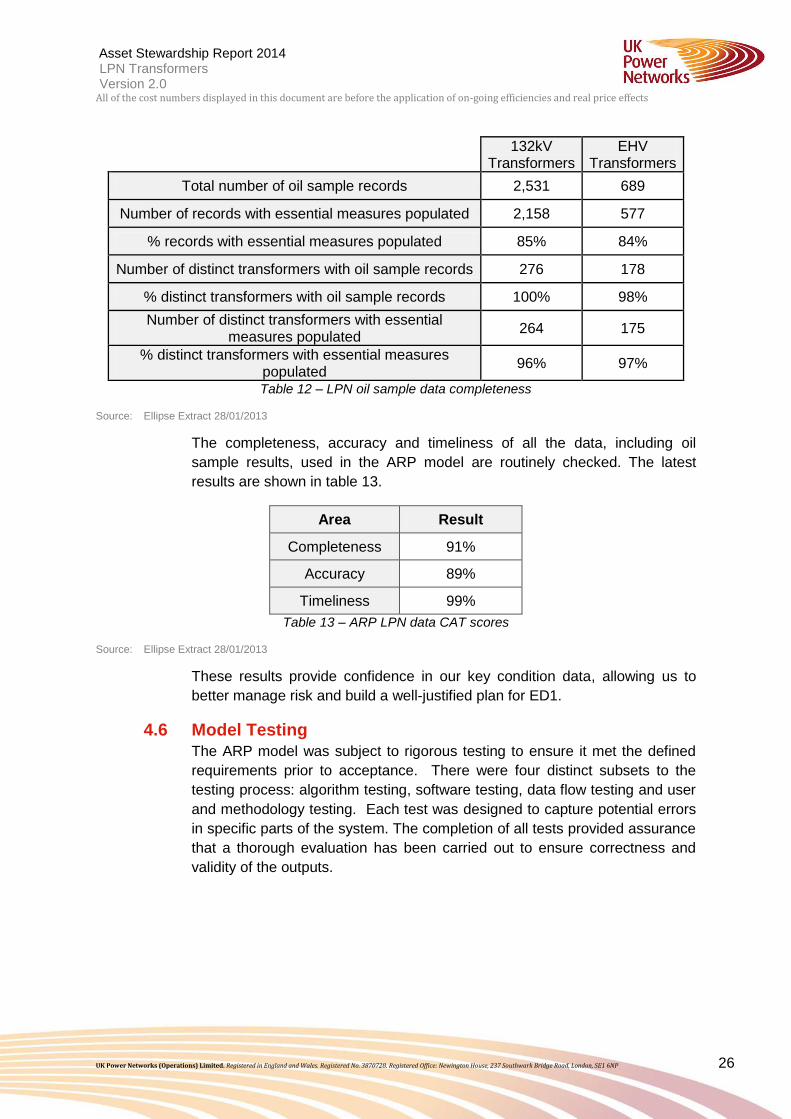
Asset Stewardship Report 2014 LPN Transformers Version 2.0 All of the cost numbers displayed in this document are before the application of on-going efficiencies and real price effects
UK Power Networks (Operations) Limited. Registered in England and Wales. Registered No. 3870728. Registered Office: Newington House, 237 Southwark Bridge Road, London, SE1 6NP 26
132kV
Transformers EHV
Transformers
Total number of oil sample records 2,531 689
Number of records with essential measures populated 2,158 577
% records with essential measures populated 85% 84%
Number of distinct transformers with oil sample records 276 178
% distinct transformers with oil sample records 100% 98%
Number of distinct transformers with essential measures populated
264 175
% distinct transformers with essential measures populated
96% 97%
Table 12 – LPN oil sample data completeness
Source: Ellipse Extract 28/01/2013
The completeness, accuracy and timeliness of all the data, including oil
sample results, used in the ARP model are routinely checked. The latest
results are shown in table 13.
Area Result
Completeness 91%
Accuracy 89%
Timeliness 99%
Table 13 – ARP LPN data CAT scores
Source: Ellipse Extract 28/01/2013
These results provide confidence in our key condition data, allowing us to
better manage risk and build a well-justified plan for ED1.
4.6 Model Testing
The ARP model was subject to rigorous testing to ensure it met the defined
requirements prior to acceptance. There were four distinct subsets to the
testing process: algorithm testing, software testing, data flow testing and user
and methodology testing. Each test was designed to capture potential errors
in specific parts of the system. The completion of all tests provided assurance
that a thorough evaluation has been carried out to ensure correctness and
validity of the outputs.
Asset Stewardship Report 2014 LPN Transformers Version 2.0 All of the cost numbers displayed in this document are before the application of on-going efficiencies and real price effects
UK Power Networks (Operations) Limited. Registered in England and Wales. Registered No. 3870728. Registered Office: Newington House, 237 Southwark Bridge Road, London, SE1 6NP 27
1.3.1 Algorithm testing
The ARP model comprises a set of algorithms implemented within the
database code. The tester, in a spreadsheet, mimicked each algorithm
comparing the results with those of the ARP algorithm for a given set of test
data inputs. The test data comprised data within normal expected ranges,
low-value numbers, high-value numbers, floating point numbers, integers,
negative numbers and unpopulated values. In order to pass the test, all
results from the ARP algorithm were required to match the spreadsheet
calculation.
1.3.2 Software testing
A number of new software functions used in the model required testing to
ensure they performed correctly. A test script was created to identify the
functional requirement, the method to carry out the function and the expected
outcome. In order to pass the test, the achieved outcome had to match the
expected outcome.
1.3.3 Data flow testing
Data flow testing was carried out to ensure that data presented in the ARP
upload files passes into the model correctly. Data counts from the ARP
model upload files were compared to data successfully uploaded to the
model. To pass the test, counts of the data had to match within specified
tolerances.
1.3.4 User and methodology testing
The aim of the user and methodology testing was to ensure that the models
are fit for purpose. A test script was created to check that displays operate
correctly and that outputs respond appropriately to changes in calibration
settings.
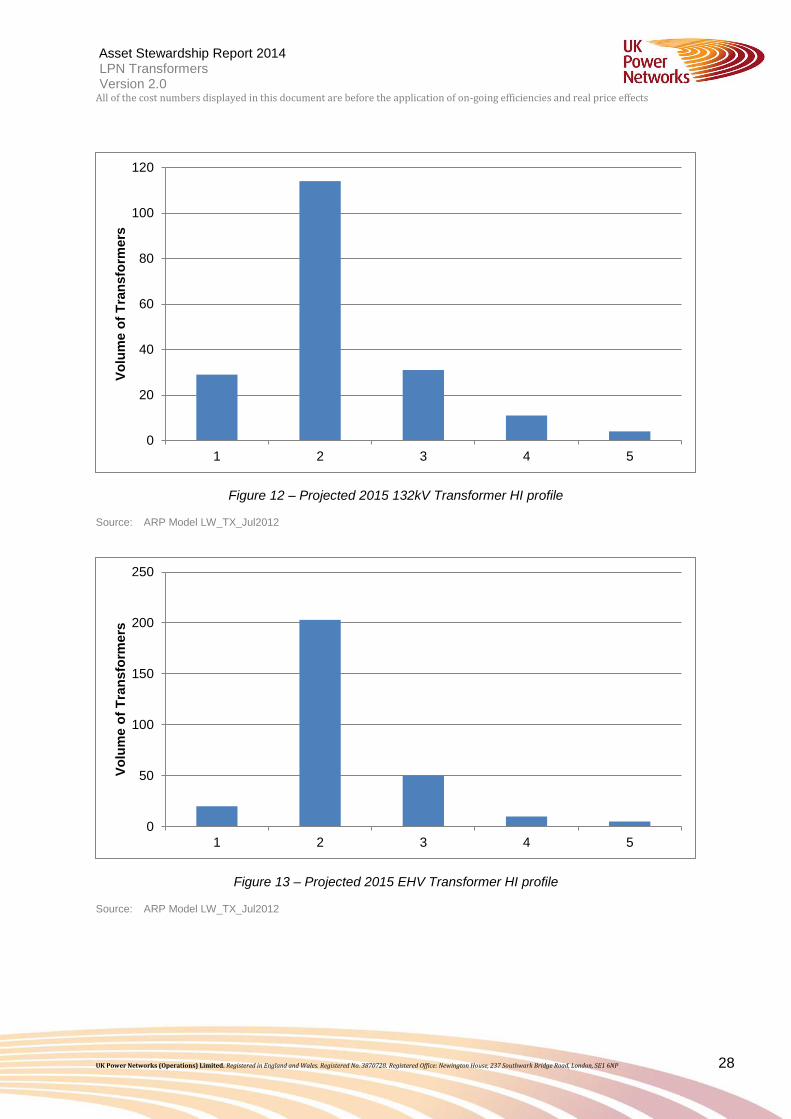
4.7 HI Profile
Figure 12 and Figure 13 show the projected HI profile at the end of DPCR5,
including the impact of planned investments in years 4 and 5 of DPCR5.
Asset Stewardship Report 2014 LPN Transformers Version 2.0 All of the cost numbers displayed in this document are before the application of on-going efficiencies and real price effects
UK Power Networks (Operations) Limited. Registered in England and Wales. Registered No. 3870728. Registered Office: Newington House, 237 Southwark Bridge Road, London, SE1 6NP 28
Figure 12 – Projected 2015 132kV Transformer HI profile
Source: ARP Model LW_TX_Jul2012
Figure 13 – Projected 2015 EHV Transformer HI profile
Source: ARP Model LW_TX_Jul2012
0
20
40
60
80
100
120
1 2 3 4 5
Vo
lum
e o
f T
ran
sfo
rme
rs
0
50
100
150
200
250
1 2 3 4 5
Vo
lum
e o
f T
ran
sfo
rme
rs
Asset Stewardship Report 2014 LPN Transformers Version 2.0 All of the cost numbers displayed in this document are before the application of on-going efficiencies and real price effects
UK Power Networks (Operations) Limited. Registered in England and Wales. Registered No. 3870728. Registered Office: Newington House, 237 Southwark Bridge Road, London, SE1 6NP 29
5.0 Intervention Policies
5.1 Interventions: Description of Intervention Options In order to maximise value in ED1 and contain network risk at the lowest cost,
a significant and innovative programme of transformer refurbishments is
proposed in ED1, in addition to the replacement programme. Refurbishment
can be broken down into a range of options, summarised in Table 14, which
will be driven specifically by the individual transformer’s requirements as
defined in UK Power Networks’ Engineering Design Standard EDS 04-0006
132kV and EHV Transformer Non-Load Related Refurbishment and
Replacement.
The chosen refurbishment options, which align to the Ofgem scope of
transformer refurbishment work, will target specific problems with each
transformer while returning the transformer to HI2 to achieve a life extension
of at least 15 years. In many cases transformers located outdoors will also be
painted as part of the refurbishment works to gain maximum life extension
benefit.
Transformer refurbishment
Intervention Description
Gasket replacement Replacement of old gasket material to cure
oil leaks
Transformer bushing replacement Replacement of damaged bushings or to
cure severe oil leaks
Tap changer refurbishment Replacement of tap changer mechanism
Oil treatment Treatment to reduce moisture and acidity to
extend the life of windings
Tap changer replacement Replacement of obsolete tap changers or where a type defect has been identified
Cooler replacement Replacement of radiator, with consideration for fans, pumps and cooler control systems
Conservator replacement Replacement due to corrosion
AVC replacement New AVC scheme
Full factory refurbishment May include replacement of core and
windings
Table 14 – Transformer refurbishment options
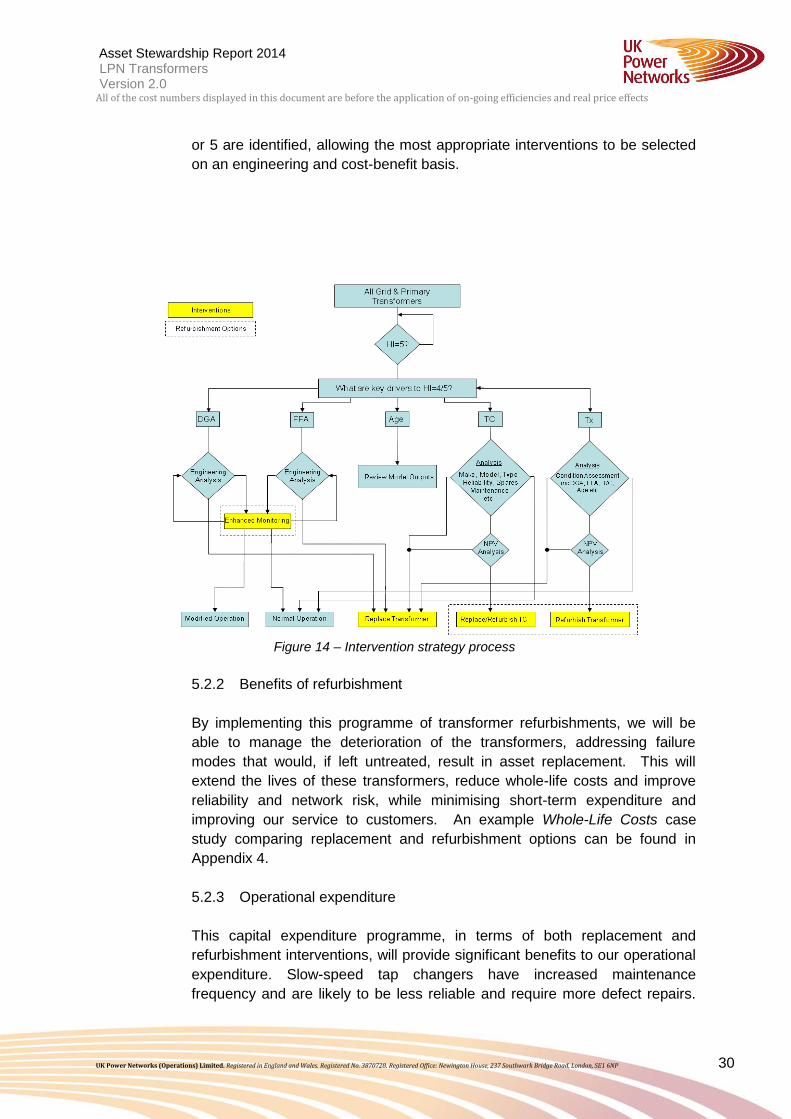
5.2 Policies: Preferred Interventions 5.2.1 Selecting interventions
The ARP model is used to identify the preferred intervention for each asset
using the method shown in Figure 14. The key drivers behind HI scores of 4
Asset Stewardship Report 2014 LPN Transformers Version 2.0 All of the cost numbers displayed in this document are before the application of on-going efficiencies and real price effects
UK Power Networks (Operations) Limited. Registered in England and Wales. Registered No. 3870728. Registered Office: Newington House, 237 Southwark Bridge Road, London, SE1 6NP 30
or 5 are identified, allowing the most appropriate interventions to be selected
on an engineering and cost-benefit basis.
5.2.2 Benefits of refurbishment
By implementing this programme of transformer refurbishments, we will be
able to manage the deterioration of the transformers, addressing failure
modes that would, if left untreated, result in asset replacement. This will
extend the lives of these transformers, reduce whole-life costs and improve
reliability and network risk, while minimising short-term expenditure and
improving our service to customers. An example Whole-Life Costs case
study comparing replacement and refurbishment options can be found in
Appendix 4.
5.2.3 Operational expenditure
This capital expenditure programme, in terms of both replacement and
refurbishment interventions, will provide significant benefits to our operational
expenditure. Slow-speed tap changers have increased maintenance
frequency and are likely to be less reliable and require more defect repairs.
Figure 14 – Intervention strategy process
Asset Stewardship Report 2014 LPN Transformers Version 2.0 All of the cost numbers displayed in this document are before the application of on-going efficiencies and real price effects
UK Power Networks (Operations) Limited. Registered in England and Wales. Registered No. 3870728. Registered Office: Newington House, 237 Southwark Bridge Road, London, SE1 6NP 31
By replacing the transformer or the tap changer, as part of a refurbishment,
the number of maintenance requirements will reduce.
Also, refurbishing a transformer with severe oil leaks will eliminate the need
for both regular oil top-ups and environmental clean-up operations as a result
of the leaks.
6.0 Innovation UK Power Networks is actively involved in a number of innovative ways to manage the
132kV and EHV Transformer fleet in addition to the industry-leading health and criticality
modelling currently in use. A trial is under way using a failed EHV transformer from Gorringe
Park Primary to assess the benefits of a ‘re-manufacture’ of transformers: the removal of the
asset back to the manufacturer for complete refurbishment, including replacement of the
core, windings and tap changer. This option can minimise project costs by limiting the
cabling and civil works associated with a full transformer replacement. This could be
beneficial, particularly where we have a high number of transformers of the same design, as
the initial design cost and time would be limited to the first order.
Another trial, to begin shortly, is on the use of advanced transformer cooler control. This
system can initiate forced cooling systems based on transformer load, anticipating and
limiting a rise in temperature that could increase the rate of ageing of the transformer. It will
also monitor the forced cooling system, sending alarms if any failure occurs, enabling
Control Engineers to take proactive action to prevent damage to the transformer caused by
overloading.
UK Power Networks is also involved in research into areas such as ageing of transformer
insulation, partial discharge diagnostic of transformer insulating fluids, DGA
measurement/data interpretation and thermal analysis of transformer insulation systems.
More information can be found in the Innovation Strategy document.
7.0 ED1 Expenditure Requirements for 132kV/EHV Transformers
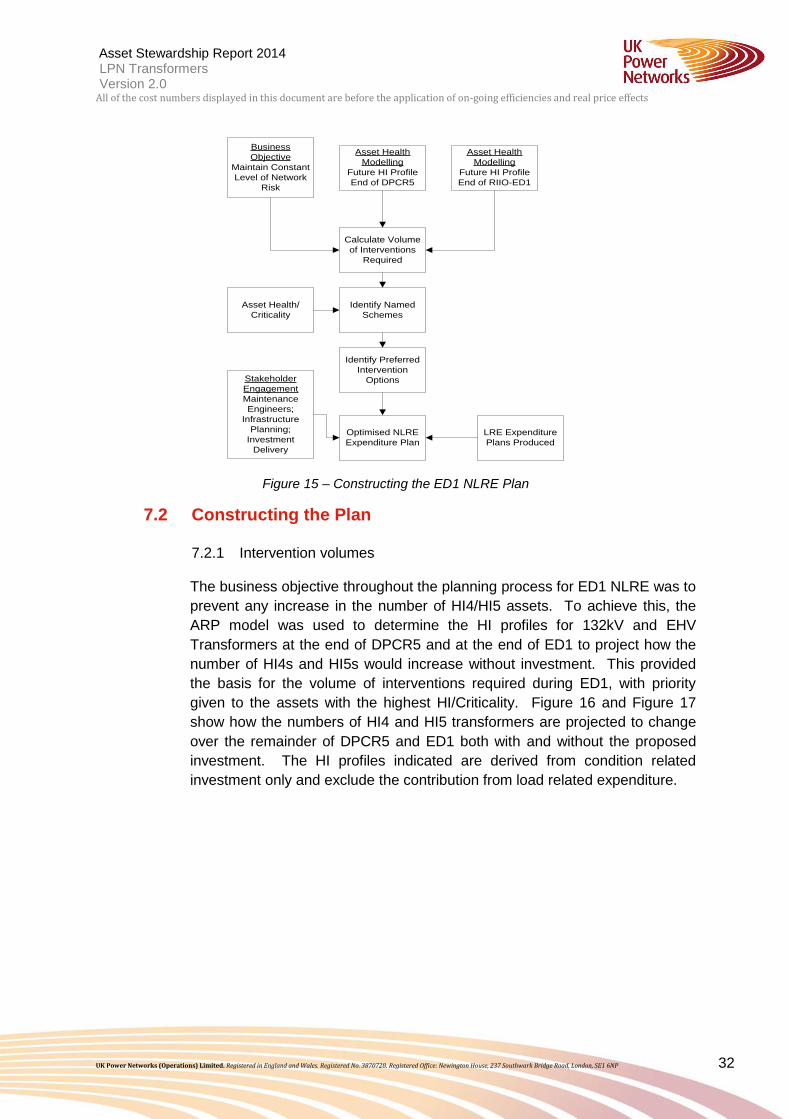
7.1 Method Figure 15 shows an overview of the method used to construct the ED1 NLRE
investment plans.
Asset Stewardship Report 2014 LPN Transformers Version 2.0 All of the cost numbers displayed in this document are before the application of on-going efficiencies and real price effects
UK Power Networks (Operations) Limited. Registered in England and Wales. Registered No. 3870728. Registered Office: Newington House, 237 Southwark Bridge Road, London, SE1 6NP 32
Asset Health
Modelling
Future HI Profile
End of DPCR5
Asset Health
Modelling
Future HI Profile
End of RIIO-ED1
Business
Objective
Maintain Constant
Level of Network
Risk
Calculate Volume
of Interventions
Required
Identify Preferred
Intervention
Options
LRE Expenditure
Plans Produced
Asset Health/
Criticality
Identify Named
Schemes
Stakeholder
Engagement
Maintenance
Engineers;
Infrastructure
Planning;
Investment
Delivery
Optimised NLRE
Expenditure Plan
Figure 15 – Constructing the ED1 NLRE Plan
7.2 Constructing the Plan 7.2.1 Intervention volumes
The business objective throughout the planning process for ED1 NLRE was to
prevent any increase in the number of HI4/HI5 assets. To achieve this, the
ARP model was used to determine the HI profiles for 132kV and EHV
Transformers at the end of DPCR5 and at the end of ED1 to project how the
number of HI4s and HI5s would increase without investment. This provided
the basis for the volume of interventions required during ED1, with priority
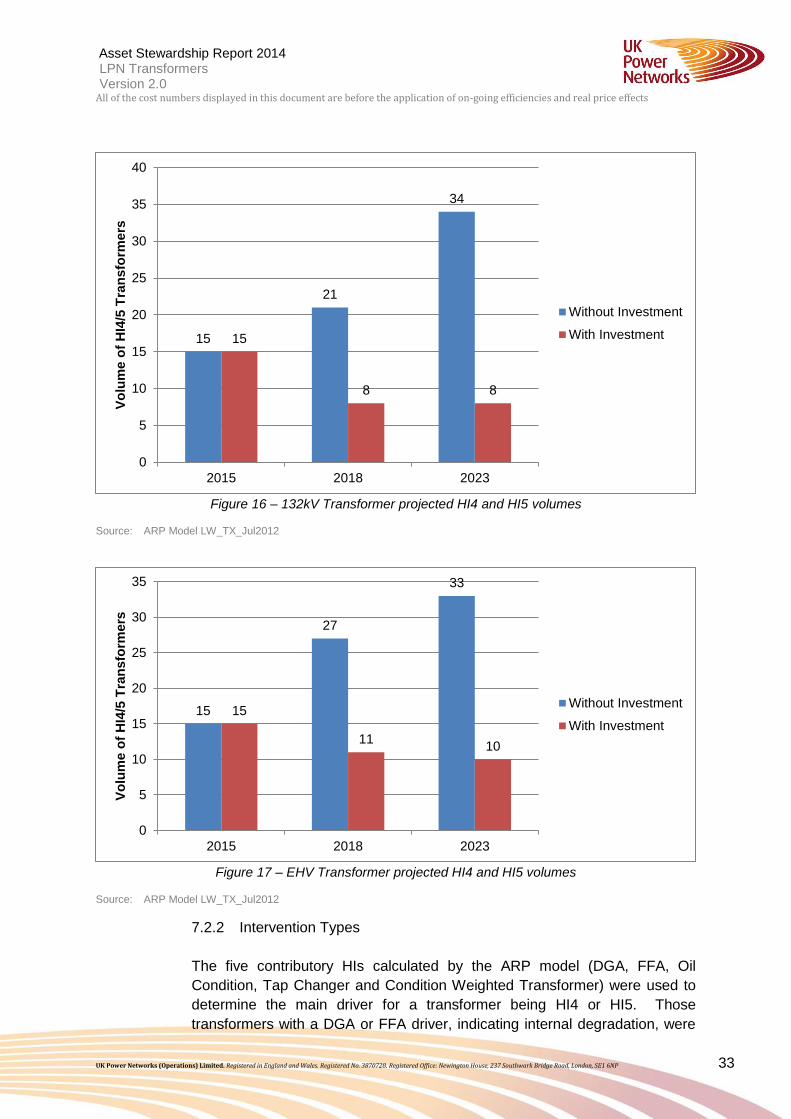
given to the assets with the highest HI/Criticality. Figure 16 and Figure 17
show how the numbers of HI4 and HI5 transformers are projected to change
over the remainder of DPCR5 and ED1 both with and without the proposed
investment. The HI profiles indicated are derived from condition related
investment only and exclude the contribution from load related expenditure.
Asset Stewardship Report 2014 LPN Transformers Version 2.0 All of the cost numbers displayed in this document are before the application of on-going efficiencies and real price effects
UK Power Networks (Operations) Limited. Registered in England and Wales. Registered No. 3870728. Registered Office: Newington House, 237 Southwark Bridge Road, London, SE1 6NP 33
Figure 16 – 132kV Transformer projected HI4 and HI5 volumes
Source: ARP Model LW_TX_Jul2012
Figure 17 – EHV Transformer projected HI4 and HI5 volumes
Source: ARP Model LW_TX_Jul2012
7.2.2 Intervention Types
The five contributory HIs calculated by the ARP model (DGA, FFA, Oil
Condition, Tap Changer and Condition Weighted Transformer) were used to
determine the main driver for a transformer being HI4 or HI5. Those
transformers with a DGA or FFA driver, indicating internal degradation, were
15
21
34
15
8 8
0
5
10
15
20
25
30
35
40
2015 2018 2023
Vo
lum
e o
f H
I4/5
Tra
ns
form
ers
Without Investment
With Investment
15
27
33
15
11 10
0
5
10
15
20
25
30
35
2015 2018 2023
Vo
lum
e o
f H
I4/5
Tra
ns
form
ers
Without Investment
With Investment
Asset Stewardship Report 2014 LPN Transformers Version 2.0 All of the cost numbers displayed in this document are before the application of on-going efficiencies and real price effects
UK Power Networks (Operations) Limited. Registered in England and Wales. Registered No. 3870728. Registered Office: Newington House, 237 Southwark Bridge Road, London, SE1 6NP 34
selected for replacement, with the remaining transformers considered for
refurbishment based on whole life cost analysis; an example is given in
Appendix 4.
7.2.3 Optimising the plan
Stakeholder engagement was an important part of the process to finalise the
ED1 plan. Maintenance engineers were consulted, because they are the
most familiar with the assets. They provided additional reassurance that the
data used in the ARP model reflected their own assessment of each asset’s
condition. There was also detailed consultation with those involved in
constructing the ED1 LRE expenditure plans to ensure the optimal investment
for maximum achievement.
Consideration was also given to NLRE plans for other equipment classes to
allow significant cost savings to be made by consolidating projects. An
example is the condition-driven work at Moscow Road 22kV. The 66/22kV
transformers will be replaced with 66/11kV transformers in conjunction with
the condition-driven replacement of the 66kV switchgear and load-driven
decommissioning of the 22kV switchgear. This is to be followed by the
condition-driven replacement of 66kV fluid-filled cables to Townmead Road
22kV.
7.3 Additional Considerations
Consideration was also given to the efficiency of the programme. In some
cases, where multiple transformer interventions were planned on one site, but
an additional identical transformer on the site was projected to be an HI4
early in ED2, it was also included in the ED1 plan. It was deemed more
efficient to adopt this approach due to the high project costs associated with a
major intervention on transformers.
7.4 Asset Volumes and Expenditure
7.4.1 Intervention volumes
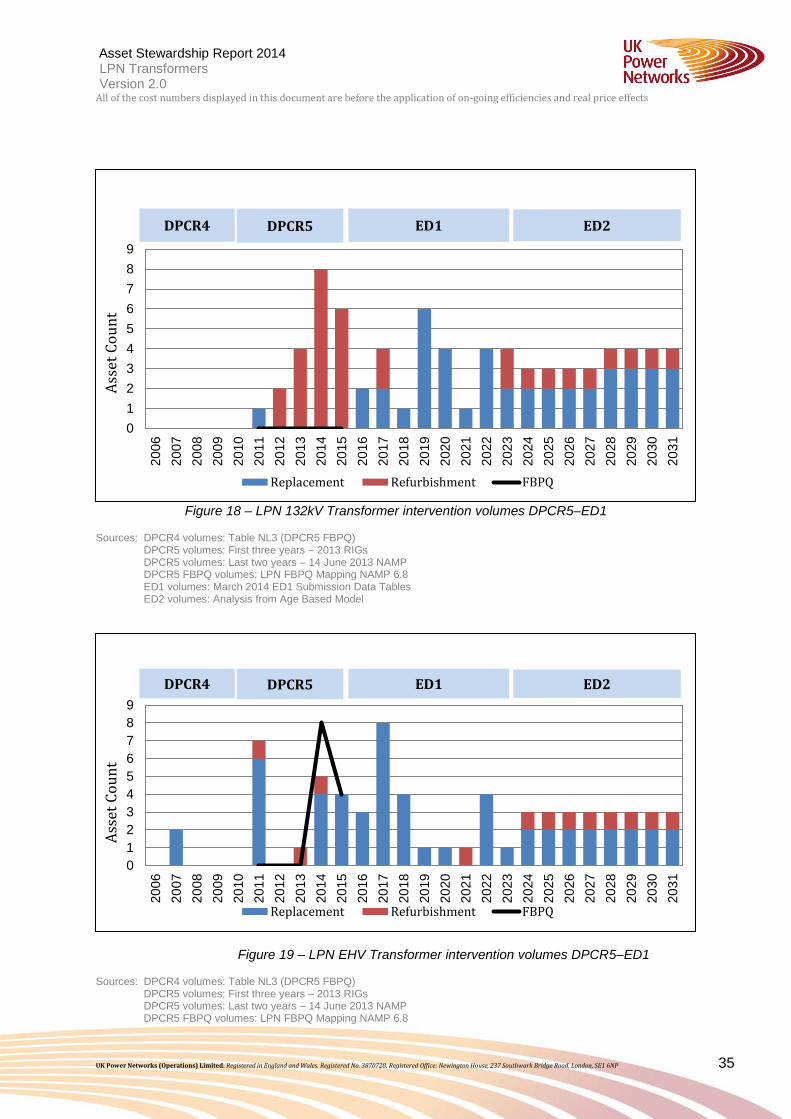
Figure 18 and Figure 19 show the DPCR4/5 investment volumes followed by
the required investment volumes for ED1 and ED2. Investment volumes can
be found in more detail in Appendix 7.
Asset Stewardship Report 2014 LPN Transformers Version 2.0 All of the cost numbers displayed in this document are before the application of on-going efficiencies and real price effects
UK Power Networks (Operations) Limited. Registered in England and Wales. Registered No. 3870728. Registered Office: Newington House, 237 Southwark Bridge Road, London, SE1 6NP 35
Figure 18 – LPN 132kV Transformer intervention volumes DPCR5–ED1
Sources: DPCR4 volumes: Table NL3 (DPCR5 FBPQ) DPCR5 volumes: First three years – 2013 RIGs DPCR5 volumes: Last two years – 14 June 2013 NAMP DPCR5 FBPQ volumes: LPN FBPQ Mapping NAMP 6.8 ED1 volumes: March 2014 ED1 Submission Data Tables ED2 volumes: Analysis from Age Based Model
Figure 19 – LPN EHV Transformer intervention volumes DPCR5–ED1
Sources: DPCR4 volumes: Table NL3 (DPCR5 FBPQ) DPCR5 volumes: First three years – 2013 RIGs DPCR5 volumes: Last two years – 14 June 2013 NAMP DPCR5 FBPQ volumes: LPN FBPQ Mapping NAMP 6.8
0
1
2
3
4
5
6
7
8
9
20
06
20
07
20
08
20
09
20
10
20
11
20
12
20
13
20
14
20
15
20
16
20
17
20
18
20
19
20
20
20
21
20
22
20
23
20
24
20
25
20
26
20
27
20
28
20
29
20
30
20
31
Ass
et C
ou
nt
Replacement Refurbishment FBPQ
DPCR4 DPCR5 ED1 ED2
0
1
2
3
4
5
6
7
8
9
20
06
20
07
20
08
20
09
20
10
20
11
20
12
20
13
20
14
20
15
20
16
20
17
20
18
20
19
20
20
20
21
20
22
20
23
20
24
20
25
20
26
20
27
20
28
20
29
20
30
20
31
Ass
et C
ou
nt
Replacement Refurbishment FBPQ
DPCR4 DPCR5 ED1 ED2

Asset Stewardship Report 2014 LPN Transformers Version 2.0 All of the cost numbers displayed in this document are before the application of on-going efficiencies and real price effects
UK Power Networks (Operations) Limited. Registered in England and Wales. Registered No. 3870728. Registered Office: Newington House, 237 Southwark Bridge Road, London, SE1 6NP 36
ED1 volumes: March 2014 ED1 Submission Data Tables ED2 volumes: Analysis from Age Based Model
7.4.2 Intervention expenditure
Figure 20 and Figure 21 show the DPCR5 investment expenditure followed
by the required investment expenditure for ED1.
Figure 20 – 132kV Transformer expenditure
Sources: DPCR4 costs: Table NL1 (DPCR5 FBPQ) DPCR5 costs: First three years – 2013 RIGs DPCR5 costs: Last two years – 14 June 2013 NAMP DPCR5 FBPQ costs: LPN FBPQ Mapping NAMP 6.8 ED1 costs: 19
th February 2014 NAMP
ED2 costs: Average from ED1 costs
Figure 21 – EHV Transformer Expenditure
Sources: DPCR4 costs: Table NL1 (DPCR5 FBPQ)
0.001.002.003.004.005.006.007.008.009.00
20
06
20
07
20
08
20
09
20
10
20
11
20
12
20
13
20
14
20
15
20
16
20
17
20
18
20
19
20
20
20
21
20
22
20
23
20
24
20
25
20
26
20
27
20
28
20
29
20
30
20
31
£m
Replacement Refurbishment FBPQ
DPCR4 DPCR5 ED1 ED2
0.00
1.00
2.00
3.00
4.00
5.00
6.00
7.00
8.00
9.00
20
06
20
07
20
08
20
09
20
10
20
11
20
12
20
13
20
14
20
15
20
16
20
17
20
18
20
19
20
20
20
21
20
22
20
23
20
24
20
25
20
26
20
27
20
28
20
29
20
30
20
31
£m
Replacement Refurbishment FBPQ
DPCR4 DPCR5 ED1 ED2
Asset Stewardship Report 2014 LPN Transformers Version 2.0 All of the cost numbers displayed in this document are before the application of on-going efficiencies and real price effects
UK Power Networks (Operations) Limited. Registered in England and Wales. Registered No. 3870728. Registered Office: Newington House, 237 Southwark Bridge Road, London, SE1 6NP 37
DPCR5 costs: First three years – 2013 RIGs DPCR5 costs: Last two years – 14 June 2013 NAMP DPCR5 FBPQ costs: LPN FBPQ Mapping NAMP 6.8 ED1 costs: 19
th February 2014 NAMP
ED2 costs: Average from ED1 costs
Note: Due to efficiency savings, careful risk management and the introduction
of the refurbishment programme in the latter part of DPCR5, the volumes of
interventions in the FBPQ were exceeded with only a small increase in costs
over the FPBQ level.
7.5 Commentary
7.5.1 132kV Transformers
The rate of 132kV Transformer NLRE replacement proposed for ED1 has
increased from 0.2 per year in the DPCR5 programme to 2.75 per year.
Despite the low NLRE investment during DPCR4 and DPCR5, there were
seven 132kV Transformers replaced under programmes other than NLRE
despite some of them also having secondary asset health drivers. It is also
clear from the age profile, Figure 3, and the history of defects, Figure 6, that
an increase in interventions will be required as the peak of investment in the
1960’s approaches end of life and more defects and faults are likely. This
increase in the rate of replacement has been limited to 2.75 per year by the
creation of the refurbishment programme. This improves asset health and
risk while minimising short-term expenditure by extending the life of assets
that would, in the past, have been considered for replacement. The improved
data and better interpretation of the data allow the risks to be managed
effectively.
As seen in section 3.4, with no interventions the average age of the 132kV
Transformer population would increase significantly during the course of ED1
but it has already increased significantly since the start of DPCR4 when the
percentage of 132kV Transformers over 50 years old was 7.4%. Extending
this analysis to include planned interventions in ED1, Table 15 shows that the
investment plan mitigates some of the increasing risk from the age profile of
the assets. Our modern approach to asset data, heath and criticality will allow
us to manage this risk effectively.
Although significant NLRE investment was not required in recent price control
review periods our analysis shows that a number of 132kV Transformers are
approaching their end of life and investment is now required.
Without investment With NLRE investment
Transformer population
Transformers over average asset life in
% Transformers over average
Transformers over average asset life in
% Transformers over average
Transformers over average asset life in
% Transformers over average
Asset Stewardship Report 2014 LPN Transformers Version 2.0 All of the cost numbers displayed in this document are before the application of on-going efficiencies and real price effects
UK Power Networks (Operations) Limited. Registered in England and Wales. Registered No. 3870728. Registered Office: Newington House, 237 Southwark Bridge Road, London, SE1 6NP 38
2015 asset life in 2015
2023 asset life in 2023
2023 asset life in 2023
132kV Transformers
171 55 32% 81 47% 67 39%
Table 15 – Asset age vs. average asset life with ED1 investment (132kV Transformers)
Sources: 2012 RIGs V5 ARP Model LW_TX_25Jul2012
The increase in the rate of replacement has been limited by the creation of
the refurbishment programme. This improves asset health and risk while
minimising short-term expenditure by extending the life of assets that would,
in the past, have been considered for replacement.
The proposed plan will ensure that maximum asset life is achieved while
optimising cost efficiency by co-ordinating projects on a given site and co-
ordinating resources shared with LRE projects, although the phasing of
planned achievement is not constant across ED1 as a result.
Further work will be required and further development of health, criticality and
risk modelling techniques to further refine the ED2 projections during ED1.
7.5.2 EHV Transformers
The rate of EHV Transformer NLRE replacement proposed for ED1 has
decreased slightly from the DPCR5 programme, from 2.8 per year to 2.75 per
year. The improved data and better interpretation of the data allow the risks
to be managed effectively despite the ageing asset population.
The proposed plan will ensure that maximum asset life is achieved while
optimising cost efficiency by co-ordinating projects on a given site and co-
ordinating resources shared with LRE projects, although the phasing of
planned achievement is not constant across ED1 as a result.
As seen in section 3.3, with no interventions the average age of the EHV
Transformer population would increase significantly during the course of ED1.
Extending this analysis to include planned interventions in ED1, Table 16
shows that the investment plan mitigates some of the increasing risk from the
age profile of the assets. Our modern approach to asset data, heath and
criticality will allow us to manage this risk effectively.
Without investment With NLRE investment
Transformer population
Transformers over average asset life in
2015
% Transformers over average asset life in
Transformers over average asset life in
2023
% Transformers over average asset life in
Transformers over average asset life in
2023
% Transformers over average asset life in
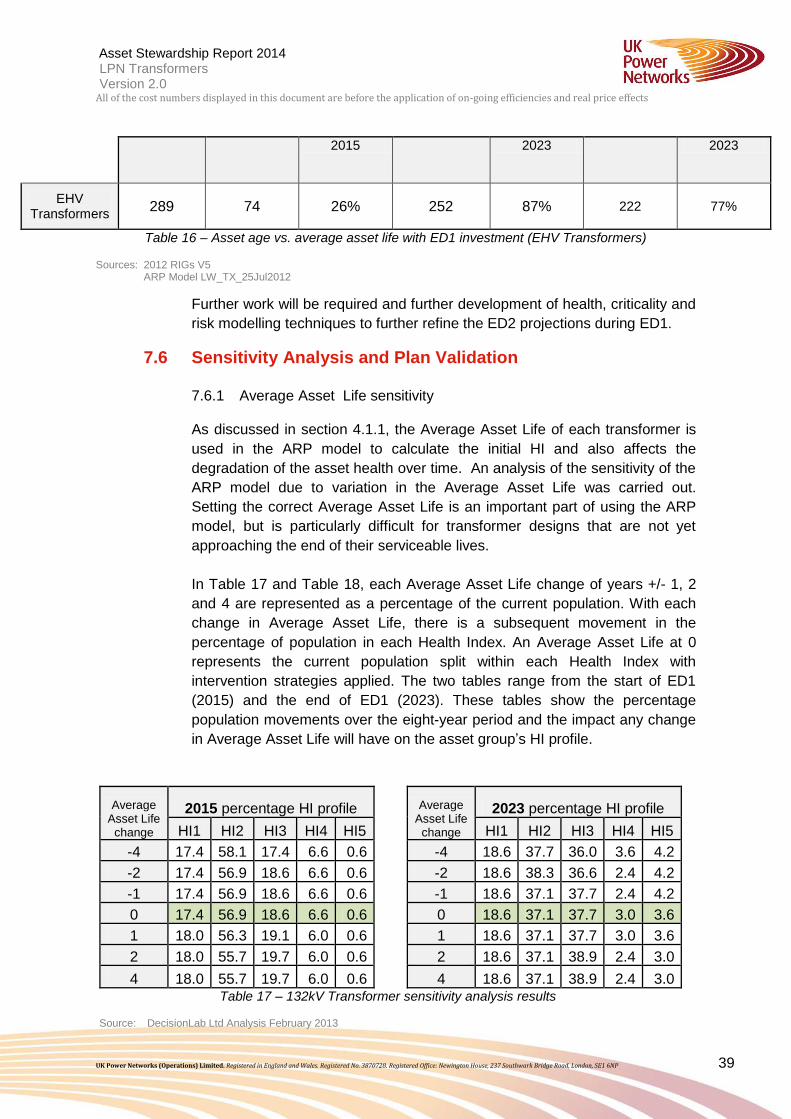
Asset Stewardship Report 2014 LPN Transformers Version 2.0 All of the cost numbers displayed in this document are before the application of on-going efficiencies and real price effects
UK Power Networks (Operations) Limited. Registered in England and Wales. Registered No. 3870728. Registered Office: Newington House, 237 Southwark Bridge Road, London, SE1 6NP 39
2015 2023 2023
EHV Transformers
289 74 26% 252 87% 222 77%
Table 16 – Asset age vs. average asset life with ED1 investment (EHV Transformers)
Sources: 2012 RIGs V5 ARP Model LW_TX_25Jul2012
Further work will be required and further development of health, criticality and
risk modelling techniques to further refine the ED2 projections during ED1.
7.6 Sensitivity Analysis and Plan Validation 7.6.1 Average Asset Life sensitivity
As discussed in section 4.1.1, the Average Asset Life of each transformer is
used in the ARP model to calculate the initial HI and also affects the
degradation of the asset health over time. An analysis of the sensitivity of the
ARP model due to variation in the Average Asset Life was carried out.
Setting the correct Average Asset Life is an important part of using the ARP
model, but is particularly difficult for transformer designs that are not yet
approaching the end of their serviceable lives.
In Table 17 and Table 18, each Average Asset Life change of years +/- 1, 2
and 4 are represented as a percentage of the current population. With each
change in Average Asset Life, there is a subsequent movement in the
percentage of population in each Health Index. An Average Asset Life at 0
represents the current population split within each Health Index with
intervention strategies applied. The two tables range from the start of ED1
(2015) and the end of ED1 (2023). These tables show the percentage
population movements over the eight-year period and the impact any change
in Average Asset Life will have on the asset group’s HI profile.
Average Asset Life
change
2015 percentage HI profile
Average Asset Life
change
2023 percentage HI profile
HI1 HI2 HI3 HI4 HI5
HI1 HI2 HI3 HI4 HI5
-4 17.4 58.1 17.4 6.6 0.6
-4 18.6 37.7 36.0 3.6 4.2
-2 17.4 56.9 18.6 6.6 0.6
-2 18.6 38.3 36.6 2.4 4.2
-1 17.4 56.9 18.6 6.6 0.6
-1 18.6 37.1 37.7 2.4 4.2
0 17.4 56.9 18.6 6.6 0.6
0 18.6 37.1 37.7 3.0 3.6
1 18.0 56.3 19.1 6.0 0.6
1 18.6 37.1 37.7 3.0 3.6
2 18.0 55.7 19.7 6.0 0.6
2 18.6 37.1 38.9 2.4 3.0
4 18.0 55.7 19.7 6.0 0.6
4 18.6 37.1 38.9 2.4 3.0 Table 17 – 132kV Transformer sensitivity analysis results
Source: DecisionLab Ltd Analysis February 2013

Asset Stewardship Report 2014 LPN Transformers Version 2.0 All of the cost numbers displayed in this document are before the application of on-going efficiencies and real price effects
UK Power Networks (Operations) Limited. Registered in England and Wales. Registered No. 3870728. Registered Office: Newington House, 237 Southwark Bridge Road, London, SE1 6NP 40
Average Asset Life
change
2015 percentage HI profile
Average Asset Life
change
2023 percentage HI profile
HI1 HI2 HI3 HI4 HI5
HI1 HI2 HI3 HI4 HI5
-4 6.2 70.7 18.6 3.5 1.0
-4 9.7 34.8 50.4 3.5 1.7
-2 6.2 71.0 18.6 3.1 1.0
-2 9.7 36.2 49.0 3.5 1.7
-1 6.2 71.7 17.9 3.1 1.0
-1 9.7 37.2 48.3 3.1 1.7
0 6.2 71.7 17.9 3.1 1.0
0 9.7 36.9 49.0 2.8 1.7
1 6.2 72.1 17.6 3.1 1.0
1 9.7 37.2 49.0 2.4 1.7
2 6.2 72.4 17.2 3.1 1.0
2 9.7 36.9 49.3 2.4 1.7
4 6.2 71.7 17.9 3.1 1.0
4 9.7 35.8 50.4 2.4 1.7 Table 18 – EHV Transformer sensitivity analysis results
Source: DecisionLab Ltd Analysis February 2013
Figure 22 – % variation in HI4 and HI5 132kV Transformers
Source: DecisionLab Ltd Analysis February 2013
Figure 23 – % variation in HI4 and HI5 EHV Transformers
Source: DecisionLab Ltd Analysis February 2013
0
1
2
3
4
5
6
7
8
-4 -2 -1 0 1 2 4
%
Variation in average life (years)
Percentage in HI4 and HI5
2015
2023
0
1
2
3
4
5
6
7
8
-4 -2 -1 0 1 2 4
%
Variation in average life (years)
Percentage in HI4 and HI5
2015
2023

Asset Stewardship Report 2014 LPN Transformers Version 2.0 All of the cost numbers displayed in this document are before the application of on-going efficiencies and real price effects
UK Power Networks (Operations) Limited. Registered in England and Wales. Registered No. 3870728. Registered Office: Newington House, 237 Southwark Bridge Road, London, SE1 6NP 41
Figure 22 and Figure 23 represent summed HI4s and HI5s as a percentage of
the population, showing the change at each Average Asset Life iteration,
comparing 2015 and 2023.
The analysis shows that changing the Average Asset Life of 132kV
Transformers by ± four years results in the proportion of HI4/HI5 assets rising
from 6.6% to 7.2% in 2015 and 5.4% to 7.0% in 2023. For EHV
Transformers, the variation is 4.1% to 4.5% in 2015 and 4.1% 5.2% in 2023.
This shows that the ED1 investment plan is robust to variations in Average
Asset Life. The consultant’s full report can be found in Appendix 6.
7.6.2 Criticality and risk
As mentioned in section 4.2 of this document, the ARP model is able to
produce a criticality index (C1 to C4) for each individual asset, although this is
a very new concept and is still being developed. The criticality index can be
used with the Health Index to indicate the level of risk on the network. Table
19 and Table 20 show the HI and criticality matrix for 2015 and 2023 with
investment during ED1.
Criticality Units
Estimated asset health and criticality profile 2015
Asset register
Asset Health Index
2015
HI1
HI2
HI3
HI4
HI5
EHV Transformer
Low No. TX 0 0 0 0 0 0
Average No. TX 9 27 7 1 0 44
High No. TX 4 144 33 7 5 193
Very high No. TX 7 32 10 2 0 51
Low No. TX 2 2 0 0 0 4
Asset Stewardship Report 2014 LPN Transformers Version 2.0 All of the cost numbers displayed in this document are before the application of on-going efficiencies and real price effects
UK Power Networks (Operations) Limited. Registered in England and Wales. Registered No. 3870728. Registered Office: Newington House, 237 Southwark Bridge Road, London, SE1 6NP 42
132kV Transformer
Average No. TX 20 82 14 8 3 127
High No. TX 7 28 15 3 1 54
Very high No. TX 0 2 2 0 0 4
Table 19 – Projected 2015 HI-CI matrix
Sources: ARP Model LW_TX_25Jul2012 ARP Model LW_TX_27Nov2012
Criticality Units
Estimated asset health and criticality Profile 2023
Asset register
Asset Health Index
2023
HI1
HI2
HI3
HI4
HI5
EHV Transformer
Low No. TX 0 0 0 0 0 0
Average No. TX 10 6 26 2 0 44
High No. TX 6 80 92 1 6 185
Very high No. TX 4 19 23 1 0 47
132kV Transformer
Low No. TX 2 0 2 0 0 4
Average No. TX 15 62 46 4 2 129
High No. TX 17 30 7 0 1 55
Very high No. TX 2 1 1 0 1 5
Table 20 – Projected 2023 HI-CI matrix with investment
Sources: ARP Model LW_TX_25Jul2012 ARP Model LW_TX_27Nov2012
8.0 Deliverability The LPN Capital Programme Investment Delivery Team, key stakeholders in the
development of the plan, will carry out all infrastructure asset intervention projects, both LRE
and NLRE. They have confirmed that the proposed transformer intervention plan is
achievable in co-ordination with other planned investments. The programme of transformer
interventions will be coordinated with that of other asset groups to ensure efficient delivery.
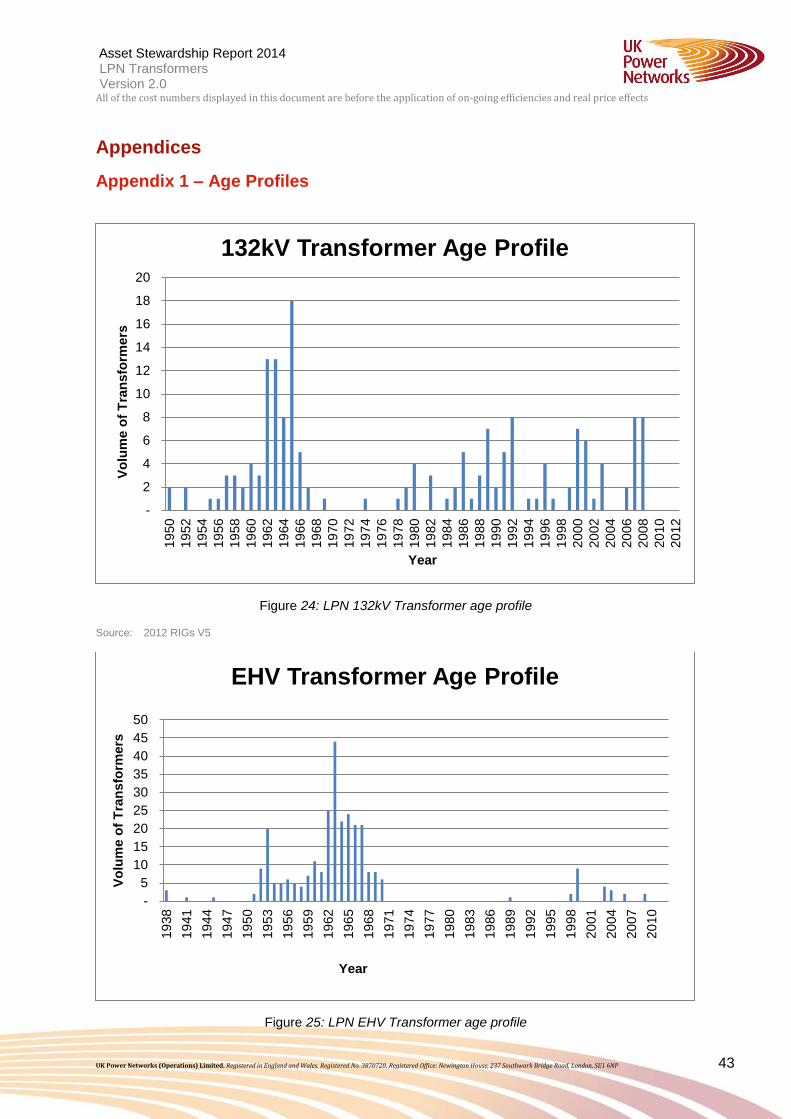
Asset Stewardship Report 2014 LPN Transformers Version 2.0 All of the cost numbers displayed in this document are before the application of on-going efficiencies and real price effects
UK Power Networks (Operations) Limited. Registered in England and Wales. Registered No. 3870728. Registered Office: Newington House, 237 Southwark Bridge Road, London, SE1 6NP 43
Appendices
Appendix 1 – Age Profiles
Figure 24: LPN 132kV Transformer age profile
Source: 2012 RIGs V5
Figure 25: LPN EHV Transformer age profile
-
2
4
6
8
10
12
14
16
18
20
19
50
19
52
19
54
19
56
19
58
19
60
19
62
19
64
19
66
19
68
19
70
19
72
19
74
19
76
19
78
19
80
19
82
19
84
19
86
19
88
19
90
19
92
19
94
19
96
19
98
20
00
20
02
20
04
20
06
20
08
20
10
20
12
Vo
lum
e o
f T
ran
sfo
rmers
Year
132kV Transformer Age Profile
-
5
10
15
20
25
30
35
40
45
50
19
38
19
41
19
44
19
47
19
50
19
53
19
56
19
59
19
62
19
65
19
68
19
71
19
74
19
77
19
80
19
83
19
86
19
89
19
92
19
95
19
98
20
01
20
04
20
07
20
10
Vo
lum
e o
f T
ran
sfo
rmers
Year
EHV Transformer Age Profile
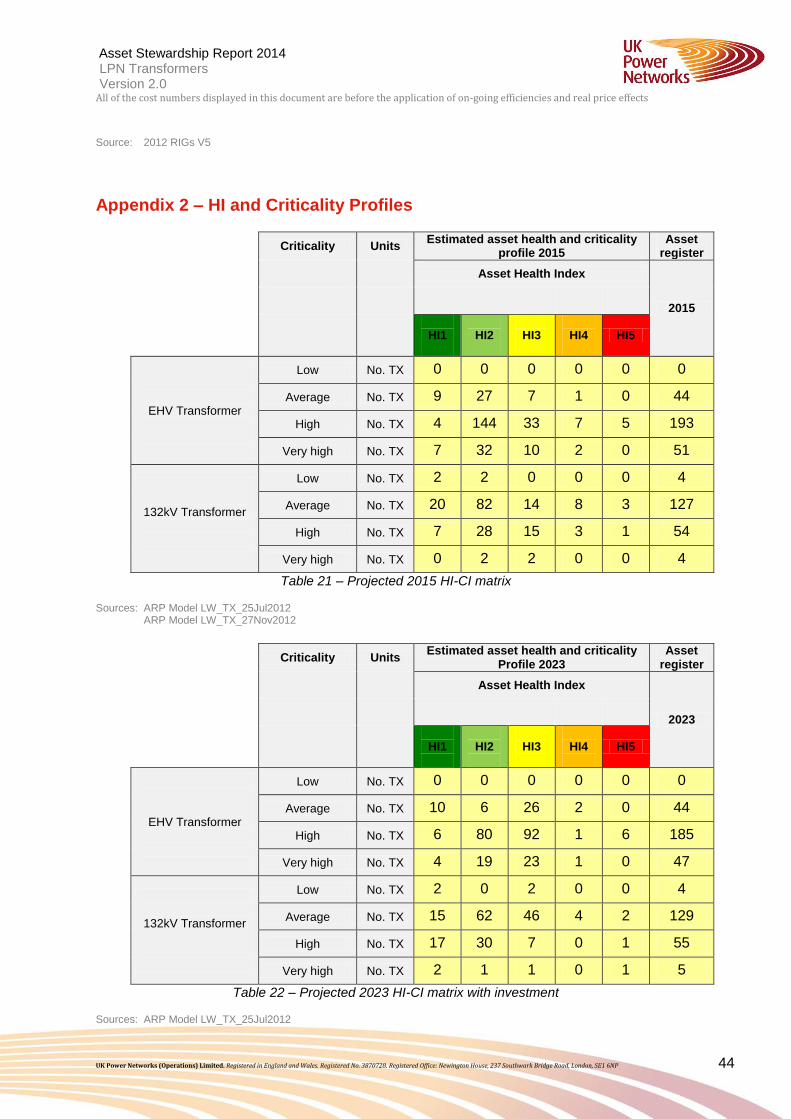
Asset Stewardship Report 2014 LPN Transformers Version 2.0 All of the cost numbers displayed in this document are before the application of on-going efficiencies and real price effects
UK Power Networks (Operations) Limited. Registered in England and Wales. Registered No. 3870728. Registered Office: Newington House, 237 Southwark Bridge Road, London, SE1 6NP 44
Source: 2012 RIGs V5
Appendix 2 – HI and Criticality Profiles
Criticality Units
Estimated asset health and criticality profile 2015
Asset register
Asset Health Index
2015
HI1
HI2
HI3
HI4
HI5
EHV Transformer
Low No. TX 0 0 0 0 0 0
Average No. TX 9 27 7 1 0 44
High No. TX 4 144 33 7 5 193
Very high No. TX 7 32 10 2 0 51
132kV Transformer
Low No. TX 2 2 0 0 0 4
Average No. TX 20 82 14 8 3 127
High No. TX 7 28 15 3 1 54
Very high No. TX 0 2 2 0 0 4
Table 21 – Projected 2015 HI-CI matrix
Sources: ARP Model LW_TX_25Jul2012 ARP Model LW_TX_27Nov2012
Criticality Units
Estimated asset health and criticality Profile 2023
Asset register
Asset Health Index
2023
HI1
HI2
HI3
HI4
HI5
EHV Transformer
Low No. TX 0 0 0 0 0 0
Average No. TX 10 6 26 2 0 44
High No. TX 6 80 92 1 6 185
Very high No. TX 4 19 23 1 0 47
132kV Transformer
Low No. TX 2 0 2 0 0 4
Average No. TX 15 62 46 4 2 129
High No. TX 17 30 7 0 1 55
Very high No. TX 2 1 1 0 1 5
Table 22 – Projected 2023 HI-CI matrix with investment
Sources: ARP Model LW_TX_25Jul2012
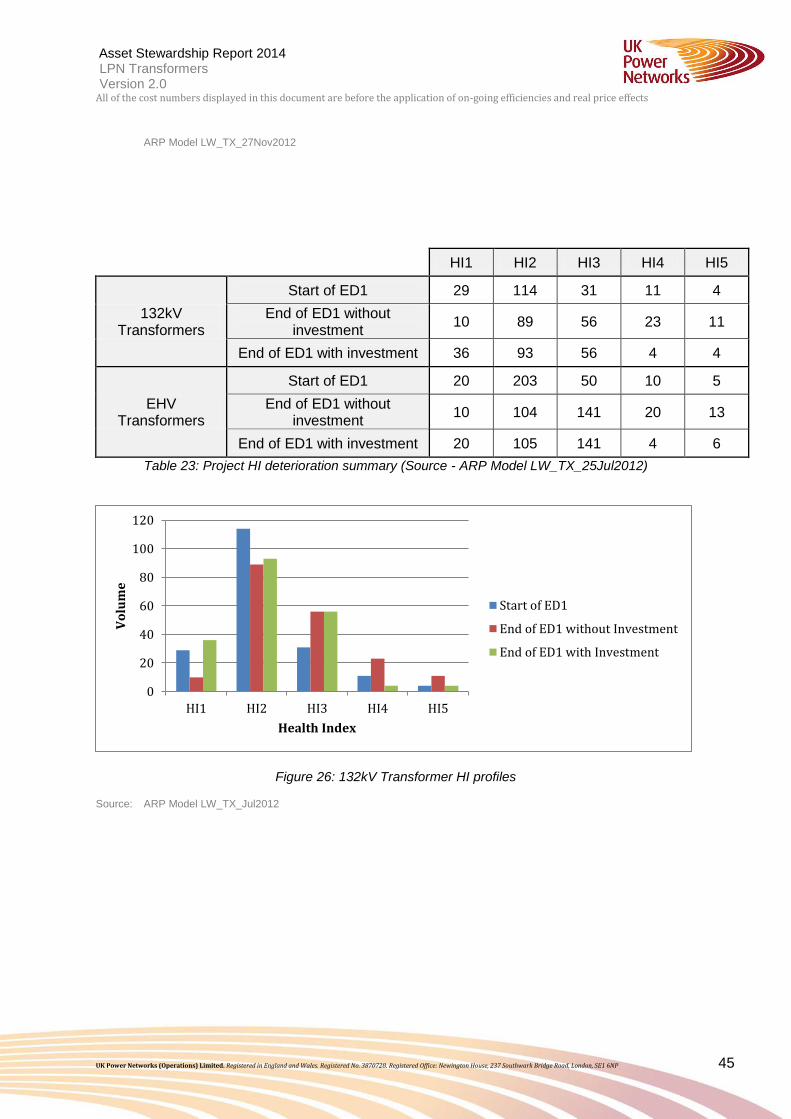
Asset Stewardship Report 2014 LPN Transformers Version 2.0 All of the cost numbers displayed in this document are before the application of on-going efficiencies and real price effects
UK Power Networks (Operations) Limited. Registered in England and Wales. Registered No. 3870728. Registered Office: Newington House, 237 Southwark Bridge Road, London, SE1 6NP 45
ARP Model LW_TX_27Nov2012
HI1 HI2 HI3 HI4 HI5
132kV Transformers
Start of ED1 29 114 31 11 4
End of ED1 without investment
10 89 56 23 11
End of ED1 with investment 36 93 56 4 4
EHV Transformers
Start of ED1 20 203 50 10 5
End of ED1 without investment
10 104 141 20 13
End of ED1 with investment 20 105 141 4 6
Table 23: Project HI deterioration summary (Source - ARP Model LW_TX_25Jul2012)
Figure 26: 132kV Transformer HI profiles
Source: ARP Model LW_TX_Jul2012
0
20
40
60
80
100
120
HI1 HI2 HI3 HI4 HI5
Vo
lum
e
Health Index
Start of ED1
End of ED1 without Investment
End of ED1 with Investment
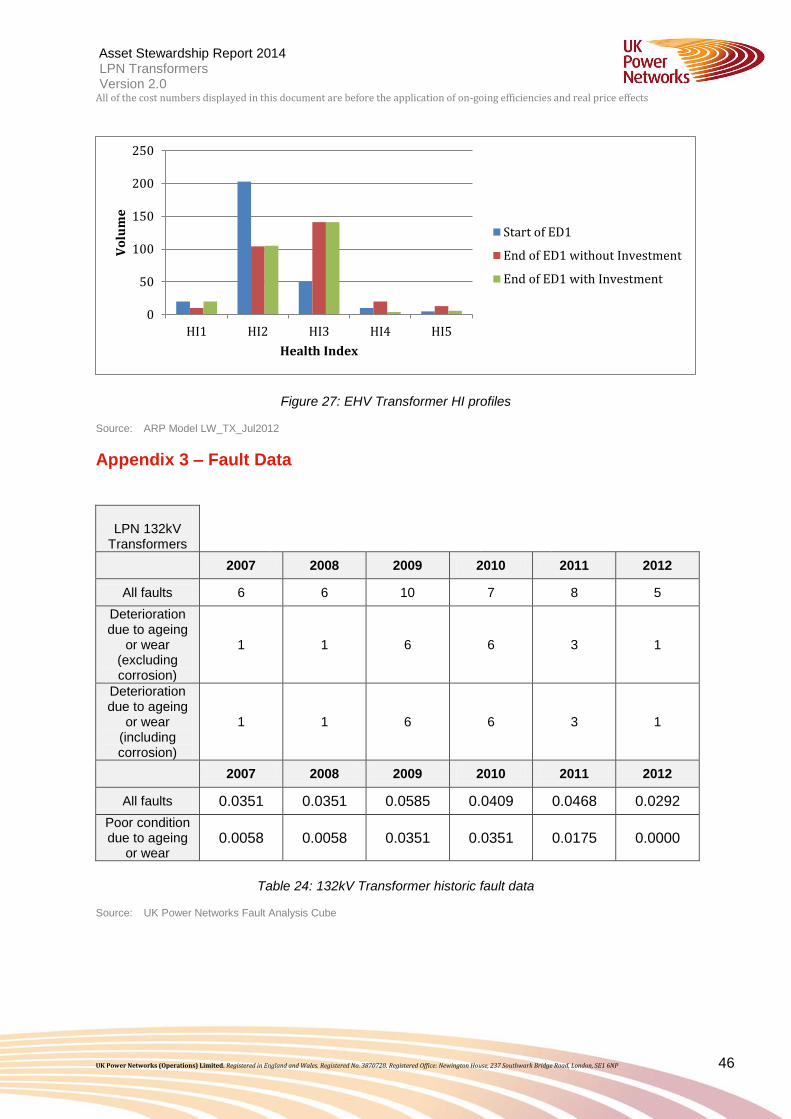
Asset Stewardship Report 2014 LPN Transformers Version 2.0 All of the cost numbers displayed in this document are before the application of on-going efficiencies and real price effects
UK Power Networks (Operations) Limited. Registered in England and Wales. Registered No. 3870728. Registered Office: Newington House, 237 Southwark Bridge Road, London, SE1 6NP 46
Figure 27: EHV Transformer HI profiles
Source: ARP Model LW_TX_Jul2012
Appendix 3 – Fault Data
LPN 132kV
Transformers
2007 2008 2009 2010 2011 2012
All faults 6 6 10 7 8 5
Deterioration due to ageing
or wear (excluding corrosion)
1 1 6 6 3 1
Deterioration due to ageing
or wear (including corrosion)
1 1 6 6 3 1
2007 2008 2009 2010 2011 2012
All faults 0.0351 0.0351 0.0585 0.0409 0.0468 0.0292
Poor condition due to ageing
or wear 0.0058 0.0058 0.0351 0.0351 0.0175 0.0000
Table 24: 132kV Transformer historic fault data
Source: UK Power Networks Fault Analysis Cube
0
50
100
150
200
250
HI1 HI2 HI3 HI4 HI5
Vo
lum
e
Health Index
Start of ED1
End of ED1 without Investment
End of ED1 with Investment
Asset Stewardship Report 2014 LPN Transformers Version 2.0 All of the cost numbers displayed in this document are before the application of on-going efficiencies and real price effects
UK Power Networks (Operations) Limited. Registered in England and Wales. Registered No. 3870728. Registered Office: Newington House, 237 Southwark Bridge Road, London, SE1 6NP 47
Figure 28: 132kV Transformer historic fault rates (Source - UK Power Networks Fault Analysis Cube)
LPN EHV
Transformers
2007 2008 2009 2010 2011 2012
All faults 3 4 1 7 2 7
Deterioration due to ageing
or wear (excluding corrosion)
1 1 5 1 3
Deterioration due to ageing
or wear (including corrosion)
1 1 5 1 3
2007 2008 2009 2010 2011 2012
All faults 0.0104 0.0138 0.0035 0.0242 0.0069 0.0242
Poor condition due to age and
wear 0.0000 0.0035 0.0035 0.0173 0.0035 0.0104
Table 25: EHV Transformer historic fault data
Source: UK Power Networks Fault Analysis Cube
0.0000
0.0100
0.0200
0.0300
0.0400
0.0500
0.0600
0.0700
2007 2008 2009 2010 2011 2012
Fau
lts /
Tra
nsfo
rmer
Year
All Faults
Poor Condn Due To Age &Wear
Asset Stewardship Report 2014 LPN Transformers Version 2.0 All of the cost numbers displayed in this document are before the application of on-going efficiencies and real price effects
UK Power Networks (Operations) Limited. Registered in England and Wales. Registered No. 3870728. Registered Office: Newington House, 237 Southwark Bridge Road, London, SE1 6NP 48
Figure 29: EHV Transformer historic fault rates (Source: UK Power Networks Fault Analysis Cube)
Appendix 4 – WLC Case Study
0.0000
0.0050
0.0100
0.0150
0.0200
0.0250
0.0300
2007 2008 2009 2010 2011 2012
Fau
lts /
Tra
nsfo
rmer
Year
All Faults
Poor Condn Due To Age &Wear
Asset Stewardship Report 2014 LPN Transformers Version 2.0 All of the cost numbers displayed in this document are before the application of on-going efficiencies and real price effects
UK Power Networks (Operations) Limited. Registered in England and Wales. Registered No. 3870728. Registered Office: Newington House, 237 Southwark Bridge Road, London, SE1 6NP 49
Wh
ole
life
co
st d
esc
rip
tio
nSt
arti
ng
assu
mp
tio
n (
sam
e f
or
all s
cen
ario
s)
Sce
nar
io 1
Ass
um
pti
on
s sp
eci
fic
to t
his
sce
nar
io
De
scri
pti
on
of
cost
s/(i
nco
me
) it
em
sY
ear
12
34
56
78
910
1112
1314
1516
1718
1920
2122
2324
2526
2728
2930
Tota
ls
No
tio
nal
pu
rch
ase
co
st o
f a
50 y
ear
old
tra
nsf
orm
er
(i.e
.:
19 y
ear
s re
mai
nin
g se
rvic
e li
fe)
330
330
An
nu
al in
spe
ctio
n &
mai
nte
nan
ce c
ost
s o
f in
itia
l
tran
sfo
rme
r
11
14
11
14
11
16
Pu
rch
ase
of
rep
lace
me
nt
tran
sfo
rme
r in
ye
ar 1
01,
200
1,20
0
An
nu
al in
spe
ctio
n &
mai
nte
nan
ce c
ost
s o
f re
pla
cem
en
t
tran
sfo
rme
r
11
11
71
11
11
11
71
11
11
11
739
Re
sid
ual
val
ue
of
rep
lace
me
nt
tran
sfo
rme
r at
en
d o
f
sce
nar
io (
i.e
.: 4
9 ye
ars
rem
ain
ing
life
)
-852
-852
Ne
t ca
sh f
low
331
11
41
11
41
1202
11
17
11
11
11
17
11
11
11
1-8
4573
3
6.85
%
83
3
Sce
nar
io 2
Ass
um
pti
on
s sp
eci
fic
to t
his
sce
nar
io
De
scri
pti
on
of
cost
s/(i
nco
me
) it
em
sY
ear
12
34
56
78
910
1112
1314
1516
1718
1920
2122
2324
2526
2728
2930
Tota
ls
No
tio
nal
pu
rch
ase
co
st o
f a
50 y
ear
old
tra
nsf
orm
er
(i.e
.:
19 y
ear
s re
mai
nin
g se
rvic
e li
fe)
330
330
An
nu
al in
spe
ctio
n c
ost
s o
f in
itia
l tra
nsf
orm
er
11
14
11
14
11
16
Tran
sfo
rme
r R
efu
rbis
hm
en
t in
Ye
ar 1
011
011
0
An
nu
al in
spe
ctio
n c
ost
s o
f re
furb
ish
ed
tra
nsf
orm
er
11
41
11
41
11
41
11
71
31
Pu
rch
ase
of
rep
lace
me
nt
tran
sfo
rme
r in
ye
ar 2
51,
200
1,20
0
An
nu
al in
spe
ctio
n c
ost
s o
f re
pla
cem
en
ttra
nsf
orm
er
11
11
71
12
Re
sid
ual
val
ue
of
rep
lace
me
nt
tran
sfo
rme
r at
en
d o
f
sce
nar
io (
i.e
.: 6
4 ye
ars
rem
ain
ing
life
)
-939
-939
Ne
t ca
sh f
low
331
11
41
11
41
112
14
11
14
11
14
11
17
1202
11
17
-938
760
6.85
%
48
9D
isco
un
ted
wh
ole
life
co
st
40 y
ear
old
Tx
wit
h s
low
sp
ee
d t
ap c
han
ger
req
uir
ing
mai
n t
ank
and
se
lect
or
DG
A a
nn
ual
ly,
div
ert
er
mai
nte
nan
ce e
very
4 y
ear
s an
d s
ele
cto
r m
ain
ten
ance
eve
ry 1
6 ye
ars.
In
spe
ctio
n c
arri
ed
ou
t e
vry
6 m
on
ths.
Re
pla
ced
aft
er
10 y
ear
s w
ith
a n
ew
tra
nsf
orm
er
wit
h m
od
ern
tap
ch
ange
r
req
uir
ing
mai
nte
ance
eve
ry 8
ye
ars.
13
2 k
V T
ran
sfo
rme
r: r
ep
lace
me
nt
v re
furb
ish
me
nt
anal
ysis
.It
is a
ssu
me
d t
he
tra
nsf
orm
er
is 4
0 ye
ars
old
at
the
be
gin
nin
g o
f th
e s
cen
ario
, th
at it
has
a c
urr
en
t n
ew
pu
rch
ase
co
st o
f
£450
k an
d h
as a
n a
vera
ge u
sefu
l op
era
tin
g li
fe o
f 60
ye
ars.
Dis
cou
nt
rate
: Se
lect
6.8
5%
Dis
cou
nte
d w
ho
le li
fe c
ost
40 y
ear
old
Tx
wit
h s
low
sp
ee
d t
ap c
han
ger
req
uir
ing
mai
n t
ank
and
se
lect
or
DG
A a
nn
ual
ly,
div
ert
er
mai
nte
nan
ce e
very
4 y
ear
s an
d s
ele
cto
r m
ain
ten
ance
eve
ry 1
6 ye
ars.
In
spe
ctio
n c
arri
ed
ou
t e
vry
6 m
on
ths.
Re
furb
ish
ed
aft
er
10 y
ear
s, p
rovi
din
g 15
ye
ars
furt
he
r se
rvic
able
life
aft
er
wh
ich
it is
re
pla
ced
wit
h a
ne
w t
ran
sfo
rme
r w
ith
mo
de
rn t
ap c
han
ger
req
uir
ing
mai
nte
ance
eve
ry
8 ye
ars.
Dis
cou
nt
rate
: Se
lect
6.8
5%

Asset Stewardship Report 2014 LPN Transformers Version 2.0 All of the cost numbers displayed in this document are before the application of on-going efficiencies and real price effects
UK Power Networks (Operations) Limited. Registered in England and Wales. Registered No. 3870728. Registered Office: Newington House, 237 Southwark Bridge Road, London, SE1 6NP 50
Appendix 5 NLRE Expenditure Plan
Figure 30: 132kV NLRE investment expenditure
Sources: DPCR4 costs: Table NL1 (DPCR5 FBPQ) DPCR5 costs: First three years – 2013 RIGs DPCR5 costs: Last two years – 14 June 2013 NAMP DPCR5 FBPQ costs: LPN FBPQ Mapping NAMP 6.8
0.00
1.00
2.00
3.00
4.00
5.00
6.00
7.00
8.00
9.00
£m
2006 2007 2008 2009 2010 2011 2012 2013 2014 2015 2016 2017 2018 2019 2020 2021 2022 2023 2024 2025 2026 2027 2028 2029 2030 2031
Refurbishment 0.00 0.00 0.00 0.00 0.00 1.36 0.74 1.09 0.85 0.70 0.16 0.13 0.00 0.00 0.00 0.00 0.16 0.21 0.17 0.17 0.17 0.17 0.17 0.17 0.17 0.17
Replacement 1.40 0.10 1.50 1.40 2.07 1.52 0.06 0.03 1.25 4.11 3.21 3.13 3.70 8.33 6.32 1.30 5.54 2.04 3.05 3.05 3.05 3.05 4.58 4.58 4.58 4.58
FBPQ 0.10 0.10 0.10 0.10 0.10
Replacement Refurbishment FBPQ
DPCR4 DPCR5 ED1 ED2
Asset Stewardship Report 2014 LPN Transformers Version 2.0 All of the cost numbers displayed in this document are before the application of on-going efficiencies and real price effects
UK Power Networks (Operations) Limited. Registered in England and Wales. Registered No. 3870728. Registered Office: Newington House, 237 Southwark Bridge Road, London, SE1 6NP 51
ED1 costs: 19th February 2014 NAMP
ED2 costs: Average from ED1 costs
Figure 31: EHV NLRE investment expenditure
Sources: DPCR4 costs: Table NL1 (DPCR5 FBPQ) DPCR5 costs: First three years – 2013 RIGs
0.00
1.00
2.00
3.00
4.00
5.00
6.00
7.00
8.00
9.00
£m
2006 2007 2008 2009 2010 2011 2012 2013 2014 2015 2016 2017 2018 2019 2020 2021 2022 2023 2024 2025 2026 2027 2028 2029 2030 2031
Refurbishment 0.00 0.00 0.00 0.00 0.00 0.34 0.00 0.24 0.33 0.00 0.00 0.00 0.00 0.00 0.12 0.07 0.00 0.00 0.19 0.19 0.19 0.19 0.19 0.19 0.19 0.19
Replacement 0.00 0.00 0.00 0.00 0.00 0.19 0.52 0.02 3.83 4.50 7.96 3.37 0.14 1.70 6.60 3.88 3.02 0.25 2.43 2.43 2.43 2.43 2.43 2.43 2.43 2.43
FBPQ 0.00 0.00 1.00 4.40 4.80
Replacement Refurbishment FBPQ
DPCR4 DPCR5 ED1 ED2

Asset Stewardship Report 2014 LPN Transformers Version 2.0 All of the cost numbers displayed in this document are before the application of on-going efficiencies and real price effects
UK Power Networks (Operations) Limited. Registered in England and Wales. Registered No. 3870728. Registered Office: Newington House, 237 Southwark Bridge Road, London, SE1 6NP 52
DPCR5 costs: Last two years – 14 June 2013 NAMP DPCR5 FBPQ costs: LPN FBPQ Mapping NAMP 6.8 ED1 costs: 19
th February 2014 NAMP
ED2 costs: Average from ED1 costs
Figure 32: 132kV NLRE investment volumes
0
1
2
3
4
5
6
7
8
9
Asset
Co
un
t
2006 2007 2008 2009 2010 2011 2012 2013 2014 2015 2016 2017 2018 2019 2020 2021 2022 2023 2024 2025 2026 2027 2028 2029 2030 2031
Refurbishment 0 0 0 0 0 0 2 4 8 6 0 2 0 0 0 0 0 2 1 1 1 1 1 1 1 1
Replacement 0 0 0 0 0 1 0 0 0 0 2.00 2.00 1.00 6.00 4.00 1.00 4.00 2.00 2 2 2 2 3 3 3 3
FBPQ 0 0 0 0 0
Replacement Refurbishment FBPQ
DPCR4 DPCR5 ED1 ED2

Asset Stewardship Report 2014 LPN Transformers Version 2.0 All of the cost numbers displayed in this document are before the application of on-going efficiencies and real price effects
UK Power Networks (Operations) Limited. Registered in England and Wales. Registered No. 3870728. Registered Office: Newington House, 237 Southwark Bridge Road, London, SE1 6NP 53
Sources: DPCR4 volumes: Table NL3 (DPCR5 FBPQ) DPCR5 volumes: First three years – 2013 RIGs DPCR5 volumes: Last two years – 14 June 2013 NAMP DPCR5 FBPQ volumes: LPN FBPQ Mapping NAMP 6.8 ED1 volumes: March 2014 ED1 Submission Data Tables ED2 volumes: Analysis from Age Based Model
Asset Stewardship Report 2014 LPN Transformers Version 2.0 All of the cost numbers displayed in this document are before the application of on-going efficiencies and real price effects
UK Power Networks (Operations) Limited. Registered in England and Wales. Registered No. 3870728. Registered Office: Newington House, 237 Southwark Bridge Road, London, SE1 6NP 54
Figure 33: EHV NLRE investment volumes
Sources: DPCR4 volumes: Table NL3 (DPCR5 FBPQ) DPCR5 volumes: First three years – 2013 RIGs DPCR5 volumes: Last two years – 14 June 2013 NAMP DPCR5 FBPQ volumes: LPN FBPQ Mapping NAMP 6.8
0
1
2
3
4
5
6
7
8
9
Asset
Co
un
t
2006 2007 2008 2009 2010 2011 2012 2013 2014 2015 2016 2017 2018 2019 2020 2021 2022 2023 2024 2025 2026 2027 2028 2029 2030 2031
Refurbishment 1 0 1 1 0 0 0 0 0 0 1 0 0 1 1 1 1 1 1 1 1
Replacement 0 2 0 0 0 6 0 0 4 4 3 8 4 1 1 0 4 1 2 2 2 2 2 2 2 2
FBPQ 0 0 0 8 4
Replacement Refurbishment FBPQ
DPCR4 DPCR5 ED1 ED2

Asset Stewardship Report 2014 LPN Transformers Version 2.0 All of the cost numbers displayed in this document are before the application of on-going efficiencies and real price effects
UK Power Networks (Operations) Limited. Registered in England and Wales. Registered No. 3870728. Registered Office: Newington House, 237 Southwark Bridge Road, London, SE1 6NP 55
ED1 volumes: March 2014 ED1 Submission Data Tables ED2 volumes: Analysis from Age Based Model
56
for evidence-based operational, tactical and strategic decisions ©DecisionLab Ltd
Appendix 6 Sensitivity Analysis
Sensitivity Analysis: Asset Risk and Prioritisation Model for LPN Transformers (written by Decision Lab)
Introduction
This is a report on the sensitivity analysis conducted on the Asset Risk and Prioritisation (ARP) Model, developed by EA Technology and used to support the asset replacement and investment strategy for LPN transformers, which is included in the ED1 plan.
The objective is to understand how the Health Index profile of assets may change if the Average Asset Life of assets does not turn out as predicted.
An input to the ARP model is the starting asset population in each Health Index, which is different in each region. Therefore, sensitivity analysis has been done on a region-by-region basis.
The Asset Risk and Prioritisation Model
The ARP model uses database information about each individual asset, and models many parameters to predict the Health Index of each asset in the future. Significant parameters are age, location, loading and current Average Asset Life.
Sensitivity Analysis
Variation in average asset life can occur, but this is significantly less than the variation in asset lives of individual transformers.
Standard Average Asset Lives are used in the ARP model. For transformers, these are specified for each manufacturer. The values are 55 and 40 years. In 2012, about 83% of the LPN transformers have a current Average Asset Life of 55 years and about 17% have an Average Asset Life of 40 years. This study covered the full population of 132kV and EHV Transformers.
Using 2012 asset data and the replacement plans up to 2023, the ARP model was used to predict the Health Index of each asset at the beginning and end of ED1. This was then repeated, varying each current Average Asset Life by +/– 1, 2 and 4 years.
All results are shown below as the percentages of either the 132kV transformer or EHV Transformer asset population.
57
for evidence-based operational, tactical and strategic decisions ©DecisionLab Ltd
132kV TX
Average Asset Life
change
2015 percentage HI profile
HI1 HI2 HI3 HI4 HI5
-4 17.4 58.1 17.4 6.6 0.6
-2 17.4 56.9 18.6 6.6 0.6
-1 17.4 56.9 18.6 6.6 0.6
0 17.4 56.9 18.6 6.6 0.6
1 18.0 56.3 19.1 6.0 0.6
2 18.0 55.7 19.7 6.0 0.6
4 18.0 55.7 19.7 6.0 0.6
EHV TX
Average Asset Life
change
2015 percentage HI profile
HI1 HI2 HI3 HI4 HI5
-4 6.2 70.7 18.6 3.5 1.0
-2 6.2 71.0 18.6 3.1 1.0
-1 6.2 71.7 17.9 3.1 1.0
0 6.2 71.7 17.9 3.1 1.0
1 6.2 72.1 17.6 3.1 1.0
2 6.2 72.4 17.2 3.1 1.0
4 6.2 71.7 17.9 3.1 1.0
Average Asset Life
change
2023 percentage HI profile
HI1 HI2 HI3 HI4 HI5
-4 18.6 37.7 36.0 3.6 4.2
-2 18.6 38.3 36.6 2.4 4.2
-1 18.6 37.1 37.7 2.4 4.2
0 18.6 37.1 37.7 3.0 3.6
1 18.6 37.1 37.7 3.0 3.6
2 18.6 37.1 38.9 2.4 3.0
4 18.6 37.1 38.9 2.4 3.0
Average Asset Life
change
2023 percentage HI profile
HI1 HI2 HI3 HI4 HI5
-4 9.7 34.8 50.4 3.5 1.7
-2 9.7 36.2 49.0 3.5 1.7
-1 9.7 37.2 48.3 3.1 1.7
0 9.7 36.9 49.0 2.8 1.7
1 9.7 37.2 49.0 2.4 1.7
2 9.7 36.9 49.3 2.4 1.7
4 9.7 35.8 50.4 2.4 1.7
As the percentages above are rounded, the sum of a row may be 0.2% above or below 100%.
The upper and lower and current Average Asset Life cases are charted below.
132kV TX
EHV TX
0
10
20
30
40
50
60
70
80
HI1 HI2 HI3 HI4 HI5
%
Health Index profile in 2015
4 years less Av. life 4 years more
0
10
20
30
40
50
60
70
80
HI1 HI2 HI3 HI4 HI5
%
Health Index profile in 2015
4 years less Av. life 4 years more
58
for evidence-based operational, tactical and strategic decisions ©DecisionLab Ltd
132kV TX
EHV TX
For all cases modelled, the sum of assets in Health Indices HI4 and HI5 is plotted below.
132kV TX
EHV TX
For 132kV transformers in LPN, the results show:
An Average Asset Life variation of four years has a small effect on the proportion of HI4 and HI5 assets in 2015. The proportion will be in the range 6.6% to 7.2%.
In 2023, the proportion of HI4 and HI5 assets is expected to 6.6%. An increase of four years in Average Asset Life would change this to 5.4%, and a decrease in Average Asset Life of four years would change it to 7.0%.
For EHV Transformers in LPN, the results show:
An Average Asset Life variation of four years has a small effect on the proportion of HI4 and HI5 assets in 2015. The proportion will be in the range 4.1% to 4.5%.
In 2023, the proportion of HI4 and HI5 assets is expected to be 4.5%. An increase of four years in Average Asset Life would change this to 4.1%, and a decrease in Average Asset Life of four years would change it to 5.2%.
Conclusion
The ED1 replacement plan for LPN transformers is robust and fairly insensitive to a variation in Average Asset Life of up to four years.
0
10
20
30
40
50
60
70
80
HI1 HI2 HI3 HI4 HI5
%
Health Index profile in 2023
4 years less Av. life 4 years more
0
10
20
30
40
50
60
70
80
HI1 HI2 HI3 HI4 HI5
%
Health Index profile in 2023
4 years less Av. life 4 years more
0
1
2
3
4
5
6
7
8
-4 -2 -1 0 1 2 4
%
Variation in average life (years)
Percentage in HI4 & HI5
2015
2023
0
1
2
3
4
5
6
7
8
-4 -2 -1 0 1 2 4
%
Variation in average life (years)
Percentage in HI4 & HI5
2015
2023
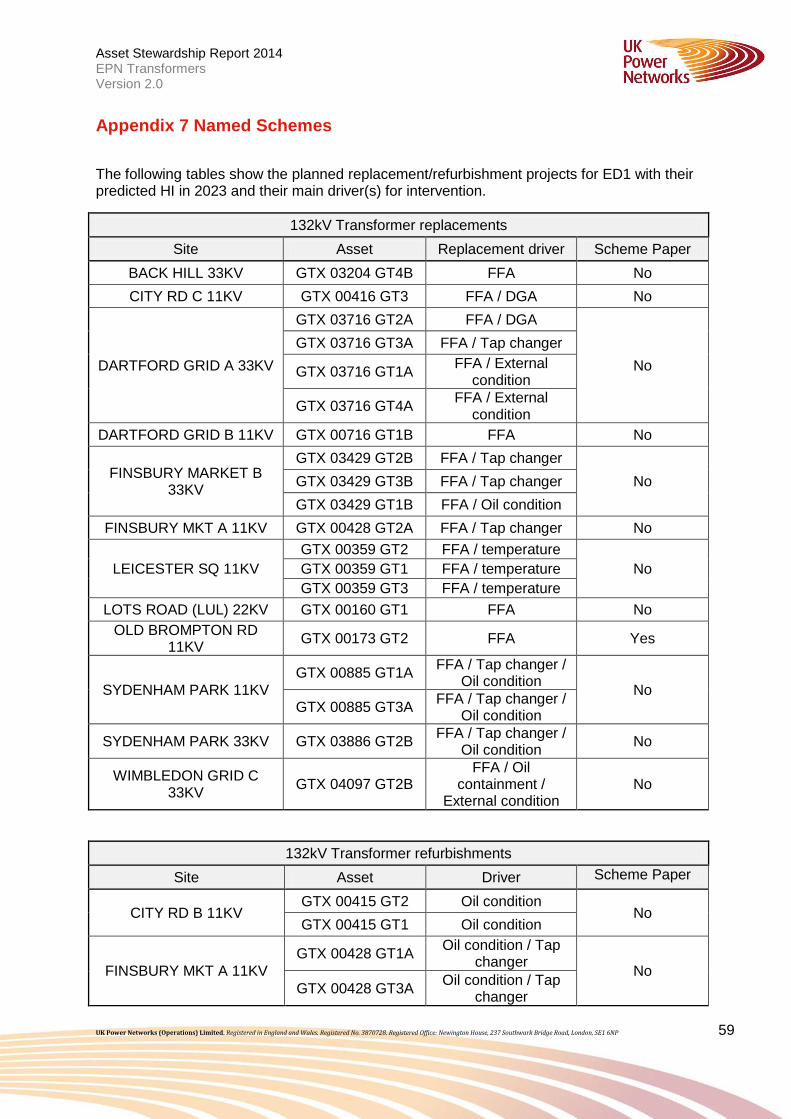
Asset Stewardship Report 2014 EPN Transformers Version 2.0
UK Power Networks (Operations) Limited. Registered in England and Wales. Registered No. 3870728. Registered Office: Newington House, 237 Southwark Bridge Road, London, SE1 6NP 59
Appendix 7 Named Schemes
The following tables show the planned replacement/refurbishment projects for ED1 with their predicted HI in 2023 and their main driver(s) for intervention.
132kV Transformer replacements
Site Asset Replacement driver Scheme Paper
BACK HILL 33KV GTX 03204 GT4B FFA No
CITY RD C 11KV GTX 00416 GT3 FFA / DGA No
DARTFORD GRID A 33KV
GTX 03716 GT2A FFA / DGA
No
GTX 03716 GT3A FFA / Tap changer
GTX 03716 GT1A FFA / External
condition
GTX 03716 GT4A FFA / External
condition
DARTFORD GRID B 11KV GTX 00716 GT1B FFA No
FINSBURY MARKET B 33KV
GTX 03429 GT2B FFA / Tap changer
No GTX 03429 GT3B FFA / Tap changer
GTX 03429 GT1B FFA / Oil condition
FINSBURY MKT A 11KV GTX 00428 GT2A FFA / Tap changer No
LEICESTER SQ 11KV
GTX 00359 GT2 FFA / temperature
No GTX 00359 GT1 FFA / temperature
GTX 00359 GT3 FFA / temperature
LOTS ROAD (LUL) 22KV GTX 00160 GT1 FFA No
OLD BROMPTON RD 11KV
GTX 00173 GT2 FFA Yes
SYDENHAM PARK 11KV
GTX 00885 GT1A FFA / Tap changer /
Oil condition No
GTX 00885 GT3A FFA / Tap changer /
Oil condition
SYDENHAM PARK 33KV GTX 03886 GT2B FFA / Tap changer /
Oil condition No
WIMBLEDON GRID C 33KV
GTX 04097 GT2B FFA / Oil
containment / External condition
No
132kV Transformer refurbishments
Site Asset Driver Scheme Paper
CITY RD B 11KV GTX 00415 GT2 Oil condition
No GTX 00415 GT1 Oil condition
FINSBURY MKT A 11KV
GTX 00428 GT1A Oil condition / Tap
changer No
GTX 00428 GT3A Oil condition / Tap
changer
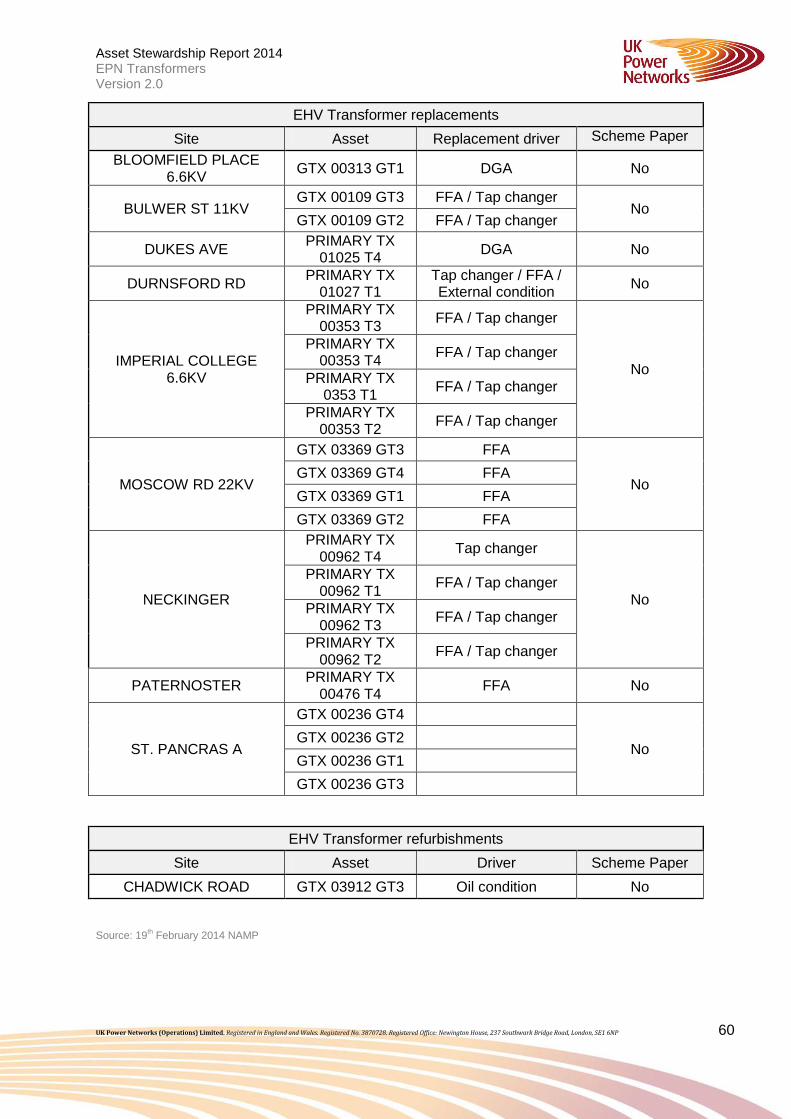
Asset Stewardship Report 2014 EPN Transformers Version 2.0
UK Power Networks (Operations) Limited. Registered in England and Wales. Registered No. 3870728. Registered Office: Newington House, 237 Southwark Bridge Road, London, SE1 6NP 60
EHV Transformer replacements
Site Asset Replacement driver Scheme Paper
BLOOMFIELD PLACE 6.6KV
GTX 00313 GT1 DGA No
BULWER ST 11KV GTX 00109 GT3 FFA / Tap changer
No GTX 00109 GT2 FFA / Tap changer
DUKES AVE PRIMARY TX
01025 T4 DGA No
DURNSFORD RD PRIMARY TX
01027 T1 Tap changer / FFA / External condition
No
IMPERIAL COLLEGE 6.6KV
PRIMARY TX 00353 T3
FFA / Tap changer
No
PRIMARY TX 00353 T4
FFA / Tap changer
PRIMARY TX 0353 T1
FFA / Tap changer
PRIMARY TX 00353 T2
FFA / Tap changer
MOSCOW RD 22KV
GTX 03369 GT3 FFA
No GTX 03369 GT4 FFA
GTX 03369 GT1 FFA
GTX 03369 GT2 FFA
NECKINGER
PRIMARY TX 00962 T4
Tap changer
No
PRIMARY TX 00962 T1
FFA / Tap changer
PRIMARY TX 00962 T3
FFA / Tap changer
PRIMARY TX 00962 T2
FFA / Tap changer
PATERNOSTER PRIMARY TX
00476 T4 FFA No
ST. PANCRAS A
GTX 00236 GT4
No GTX 00236 GT2
GTX 00236 GT1
GTX 00236 GT3
EHV Transformer refurbishments
Site Asset Driver Scheme Paper
CHADWICK ROAD GTX 03912 GT3 Oil condition No
Source: 19th February 2014 NAMP

Asset Stewardship Report 2014 EPN Transformers Version 2.0
UK Power Networks (Operations) Limited. Registered in England and Wales. Registered No. 3870728. Registered Office: Newington House, 237 Southwark Bridge Road, London, SE1 6NP 61
Appendix 8 Output NAMP/ED1 Business Plan Data Table Reconciliation
Table 26: NAMP to ED1 Business Plan Data Table Reconciliation
[Source: 19th February 2014 Namp Table O / 21st February 2014 ED1 Business Plan Data Tables]
OutputsInvestment description NAMP Line 2015/6 2016/7 2017/8 2018/9 2019/20 2020/21 2021/22 2022/23 Total RIG Table RIG Row 2015/6 2016/7 2017/8 2018/9 2019/20 2020/21 2021/22 2022/23 Total
132kV Transformer Replacement 1.51.01 2 2 1 6 4 1 4 2 22 CV3 229 2 2 1 6 4 1 4 2 22
1.51.01 1 4 4 0 0 0 0 0 CV3 211 2 4 0 0 0 0 4 1 11
1.51.03 2 4 0 1 1 0 4 1 CV3 212 1 4 4 1 1 0 0 0 11
132kV Transformer Refubishment 1.51.11 0 2 0 0 0 0 0 2 4 CV5 52 0 2 0 0 0 0 0 2 4
CV5 32 0 0 0 0 0 0 0 0 0
CV5 42 0 0 0 0 0 1 0 0 1
Total 5 12 5 7 5 2 8 5 49 5 12 5 7 5 2 8 5 49
22EHV Transformer Repalcement
RIG Table
EHV Transformer Refurbishment 1.51.11
Asset Stewardship reports
10 0 0 0 0 1 0 0
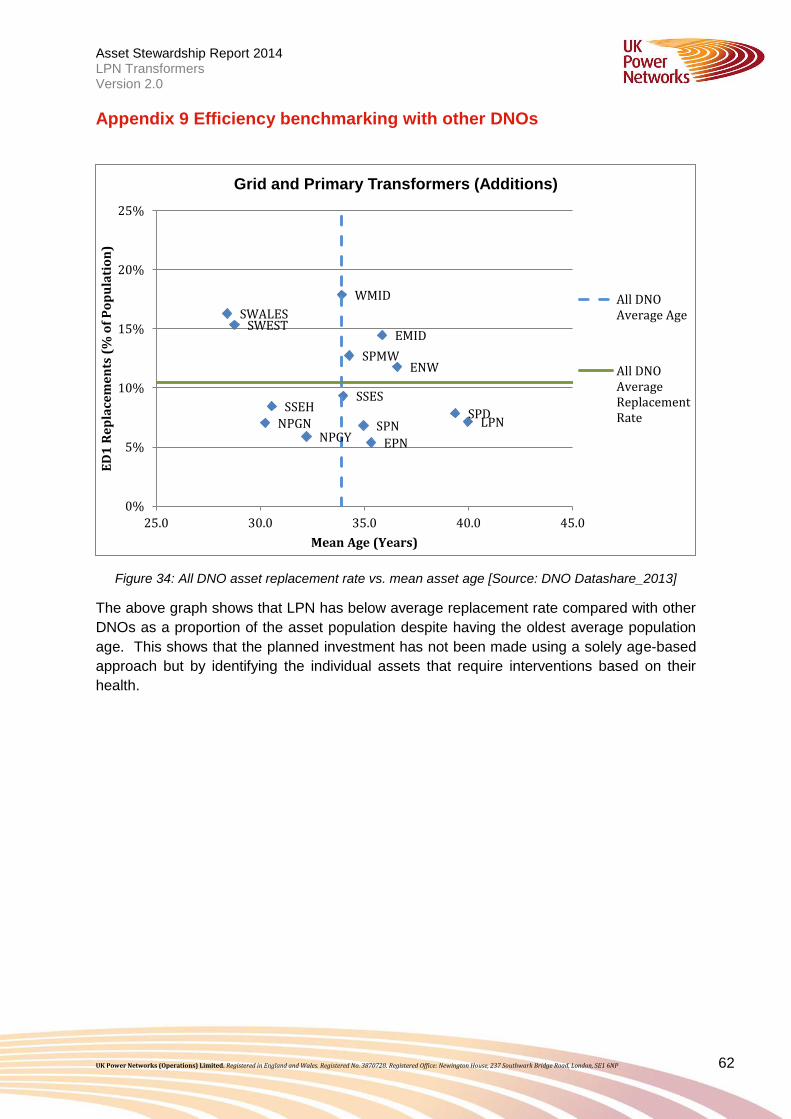
Asset Stewardship Report 2014 LPN Transformers Version 2.0
UK Power Networks (Operations) Limited. Registered in England and Wales. Registered No. 3870728. Registered Office: Newington House, 237 Southwark Bridge Road, London, SE1 6NP 62
Appendix 9 Efficiency benchmarking with other DNOs
Figure 34: All DNO asset replacement rate vs. mean asset age [Source: DNO Datashare_2013]
The above graph shows that LPN has below average replacement rate compared with other
DNOs as a proportion of the asset population despite having the oldest average population
age. This shows that the planned investment has not been made using a solely age-based
approach but by identifying the individual assets that require interventions based on their
health.
EPN
LPN SPN
EMID
WMID
SWALES SWEST
ENW
NPGN NPGY
SPD
SPMW
SSES SSEH
0%
5%
10%
15%
20%
25%
25.0 30.0 35.0 40.0 45.0
ED
1 R
ep
lace
me
nts
(%
of
Po
pu
lati
on
)
Mean Age (Years)
Grid and Primary Transformers (Additions)
All DNOAverage Age
All DNOAverageReplacementRate

Asset Stewardship Report 2014 LPN Transformers Version 2.0
UK Power Networks (Operations) Limited. Registered in England and Wales. Registered No. 3870728. Registered Office: Newington House, 237 Southwark Bridge Road, London, SE1 6NP 63
Appendix 10 Material changes since the July 2013 ED1 submission
Changes between the July 2013 submission and the March 2014 re-submission are
summarised and discussed below.
Asset type Action Change
type
2013
Submission
2014
Submission
Difference
(Reduction) Comment
132kV
Transformers Replace
Volume
(Additions) 23 26 3
Volume
(Disposals) 20 22 2
Investment
(£m) 40.85 40.96 0.11
UCI (£k) 1780.9 1571.3 (209.6)
66kV
Transformers Replace
Volume
(Additions) 7 7 -
Volume
(Disposals) 7 11 4
Investment
(£m) 6.04 6.04 -
UCI (£k) 863.2 863.2 -
Table 27: Material Changes to July 2013 ED1 Submission (CV3)
[Source: ED1 Business Plan Data Tables following the OFGEM Question and Answer Process / 21st February
2014 ED1Business Plan Data Tables]
132kV Transformers The increase in 132kV Transformer additions is due to remapping transformers that had been allocated to a High Value Project (HVP). The increase in 132kV Transformer disposals is due to the 132/22kV Deptford site becoming redundant following the NLRE project at Neckinger to replace existing 22/11kV transformers due to condition with 132/11kV transformers. Previously included in the LRE programme this decommissioning has been moved to the NLRE programme as it is driven by the Neckinger project. 66kV Transformers No change has been made to the submitted programme of works. The increase in 66kV Transformer disposals is due to remapping transformers that had been allocated to a High Value Project.