DOCUMENT 118-99
93
DOCUMENT 118-99 TELEMETRY GROUP TEST METHODS FOR TELEMETRY SYSTEMS AND SUBSYSTEMS VOLUME III TEST METHODS FOR RECORDER/REPRODUCER SYSTEMS AND MAGNETIC TAPE WHITE SANDS MISSILE RANGE KWAJALEIN MISSILE RANGE YUMA PROVING GROUND DUGWAY PROVING GROUND ABERDEEN TEST CENTER NATIONAL TRAINING CENTER ATLANTIC FLEET WEAPONS TRAINING FACILITY NAVAL AIR WARFARE CENTER WEAPONS DIVISON NAVAL AIR WARFARE CENTER AIRCRAFT DIVISION NAVAL UNDERSEA WARFARE CENTER DIVISION, NEWPORT PACIFIC MISSILE RANGE FACILITY NAVAL UNDERSEA WARFARE CENTER DIVISION, KEYPORT 30 TH SPACE WING 45 TH SPACE WING AIR FORCE FLIGHT TEST CENTER AIR FORCE DEVELOPMENT TEST CENTER AIR WARFARE CENTER AIR ARMAMENT CENTER GOLDWATER RANGE UTAH TEST AND TRAINING RANGE DISTRIBUTION A: APPROVED FOR PUBLIC RELEASE; DISTRIBUTION IS UNLIMITED
Transcript of DOCUMENT 118-99

DOCUMENT 118-99
TELEMETRY GROUP
TEST METHODS FOR TELEMETRY
SYSTEMS AND SUBSYSTEMS
VOLUME III
TEST METHODS FOR RECORDER/REPRODUCER
SYSTEMS AND MAGNETIC TAPE
WHITE SANDS MISSILE RANGE
KWAJALEIN MISSILE RANGE
YUMA PROVING GROUND
DUGWAY PROVING GROUND
ABERDEEN TEST CENTER
NATIONAL TRAINING CENTER
ATLANTIC FLEET WEAPONS TRAINING FACILITY
NAVAL AIR WARFARE CENTER WEAPONS DIVISON
NAVAL AIR WARFARE CENTER AIRCRAFT DIVISION
NAVAL UNDERSEA WARFARE CENTER DIVISION, NEWPORT
PACIFIC MISSILE RANGE FACILITY
NAVAL UNDERSEA WARFARE CENTER DIVISION, KEYPORT
30TH
SPACE WING
45TH
SPACE WING
AIR FORCE FLIGHT TEST CENTER
AIR FORCE DEVELOPMENT TEST CENTER
AIR WARFARE CENTER
AIR ARMAMENT CENTER
GOLDWATER RANGE
UTAH TEST AND TRAINING RANGE
DISTRIBUTION A: APPROVED FOR PUBLIC RELEASE;
DISTRIBUTION IS UNLIMITED

DOCUMENT 118-99
TEST METHODS FOR TELEMETRY
SYSTEMS AND SUBSYSTEMS
TEST METHOD FOR RECORDER/REPRODUCER SYSTEMS
AND MAGNETIC TAPE
VOLUME III
JANUARY 1999
Prepared by
TELEMETRY GROUP
RANGE COMMANDERS COUNCIL
Published by
Secretariat
Range Commanders Council
U.S. Army White Sands Missile Range
New Mexico 88002-5110

iii
TABLE OF CONTENTS
Page
ACRONYMS ............................................................................................................................... xiii
INTRODUCTION ....................................................................................................................... xiv
CHAPTER 1 LONGITUDINAL FIXED HEAD RECORDING TESTS ................................. 1-1
1.3.1 Purpose. ................................................................................................................ 1-1
1.3.2 Test Equipment.. .................................................................................................. 1-1
1.3.3 Test Method. ........................................................................................................ 1-1
1.3.3.1 Setup.. .................................................................................................................. 1-1
1.3.3.2 Conditions ............................................................................................................ 1-1
1.3.3.3 Procedure. ............................................................................................................ 1-1
1.3.3.4 Data Reduction..................................................................................................... 1-2
1.4 Record Head-Stack Azimuth Alignment (1)........................................................ 1-2
1.4.1 Purpose. ................................................................................................................ 1-2
1.4.2 Test Equipment.. .................................................................................................. 1-2
1.4.3 Test Method. ........................................................................................................ 1-3
1.4.3.1 Setup. ................................................................................................................... 1-3
1.4.3.2 Conditions. ........................................................................................................... 1-3
1.4.3.3 Procedure. ............................................................................................................ 1-3
1.4.3.4 Data Reduction..................................................................................................... 1-4
1.5 Reproduce Head-Stack Azimuth Alignment (1) and (2) ..................................... 1-4
1.5.1 Purpose.. ............................................................................................................... 1-4
1.5.2 Test Equipment. ................................................................................................... 1-4
1.5.3 Test Method. ........................................................................................................ 1-5
1.5.3.1 Setup.. .................................................................................................................. 1-5
1.5.3.2 Conditions.. .......................................................................................................... 1-5
1.5.3.3 Procedure. ............................................................................................................ 1-5
1.5.3.4 Data Reduction..................................................................................................... 1-5
1.6 Tape Speed Tests ................................................................................................. 1-5
1.6.1 General.. ............................................................................................................... 1-5
1.6.2 Tape Speed (1).. ................................................................................................... 1-5
1.6.3 Purpose.. ............................................................................................................... 1-5
1.6.4 Test Equipment .................................................................................................... 1-6
1.6.5 Test Method. ........................................................................................................ 1-6
1.6.5.1 Setup. ................................................................................................................... 1-6
1.6.5.2 Conditions. ........................................................................................................... 1-6
1.6.5.3 Procedure. ............................................................................................................ 1-6
1.6.5.4 Data Reduction..................................................................................................... 1-7
1.7 Speed Variation and Timing Error Tests ............................................................. 1-7

iv
Page
1.7.1 Flutter Measurement Test (1) and (2). ................................................................. 1-7
1.7.1.1 Purpose.. ............................................................................................................... 1-7
1.7.1.2 Test Equipment. ................................................................................................... 1-7
1.7.1.2.1 Oscillator.. ............................................................................................................ 1-7
1.7.1.2.2 Carrier Band-Pass Filter.. ..................................................................................... 1-7
1.7.1.2.3 Frequency Discriminator ..................................................................................... 1-7
1.7.1.2.4 Flutter Band-Pass Filter ....................................................................................... 1-8
1.7.1.2.5 Statistical Voltmeter............................................................................................. 1-8
1.7.1.3 Test Method ......................................................................................................... 1-8
1.7.1.3.1 Procedure. ............................................................................................................ 1-8
1.7.1.3.2 Data Reduction................................................................................................... 1-10
1.7.2 Time Base Error Test (1) and (2). ...................................................................... 1-11
1.7.2.1 Purpose.. ............................................................................................................. 1-11
1.7.2.2 Test Equipment.. ................................................................................................ 1-11
1.7.2.3 Test Method.. ..................................................................................................... 1-11
1.7.2.3.1 Procedure. .......................................................................................................... 1-11
1.7.2.3.2 Data Reduction................................................................................................... 1-14
1.7.3 Interchannel Time Displacement Error Test (1) and (2). ................................... 1-14
1.7.3.1 Purpose. .............................................................................................................. 1-14
1.7.3.2 Test Equipment. ................................................................................................. 1-14
1.7.3.3 Test Method.. ..................................................................................................... 1-14
1.7.3.3.1 Procedure.. ......................................................................................................... 1-14
1.7.3.3.2 Data Reduction................................................................................................... 1-16
1.8 Direct Record System Tests ............................................................................... 1-17
1.8.1 General.. ............................................................................................................. 1-17
1.8.2 Bias, Record Level and Second Harmonic Distortion Tests (1) and (2). .......... 1-17
1.8.2.1 Purpose.. ............................................................................................................. 1-17
1.8.2.2 Test Equipment. ................................................................................................. 1-17
1.8.2.2.1 Oscillator.. .......................................................................................................... 1-17
1.8.2.2.2 Voltmeter.. ......................................................................................................... 1-17
1.8.2.2.3 Wave Analyzer (Frequency Selective Voltmeter). ............................................ 1-17
1.8.2.3 Test Method. ...................................................................................................... 1-17
1.8.2.3.1 Setup. ................................................................................................................. 1-17
1.8.2.3.2 Conditions.. ........................................................................................................ 1-17
1.8.2.3.3 Procedure. .......................................................................................................... 1-17
1.8.2.3.4 Data Reduction................................................................................................... 1-18
1.8.3 Frequency Response (Direct Recording) Test (1) and (2). ................................ 1-18
1.8.3.1 Purpose.. ............................................................................................................. 1-18
1.8.3.2 Test Equipment .................................................................................................. 1-18
1.8.3.3 Test Method. ...................................................................................................... 1-18
1.8.3.3.1 Setup .................................................................................................................. 1-19
1.8.3.3.2 Conditions. ......................................................................................................... 1-19
1.8.3.3.3 Procedure. .......................................................................................................... 1-19
1.8.3.3.4 Data Reduction................................................................................................... 1-19

v
Page
1.8.4 Signal-to-Noise Ratio Tests ............................................................................... 1-19
1.8.4.1 Purpose. .............................................................................................................. 1-19
1.8.4.2 Test Equipment. ................................................................................................. 1-19
1.8.4.3 Test Method. ...................................................................................................... 1-19
1.8.4.3.1 Wide Band SNR (1) and (2)............................................................................... 1-19
1.8.4.3.1.1 Setup. ................................................................................................................. 1-19
1.8.4.3.1.2 Conditions. ......................................................................................................... 1-20
1.8.4.3.1.3 Procedure. .......................................................................................................... 1-20
1.8.4.3.1.4 Data Reduction................................................................................................... 1-20
1.8.4.4 Slot (1). .............................................................................................................. 1-20
1.8.4.5 Data Reduction................................................................................................... 1-20
1.8.5 Intermodulation Distortion Test (1) ................................................................... 1-20
1.8.5.1 Purpose.. ............................................................................................................. 1-20
1.8.5.2 Test Equipment. ................................................................................................. 1-21
1.8.5.3 Procedure. .......................................................................................................... 1-21
1.8.5.4 Data Reduction................................................................................................... 1-21
1.8.6 Crosstalk Test (1). .............................................................................................. 1-22
1.8.6.1 Purpose ............................................................................................................... 1-22
1.8.6.2 Test Equipment.. ................................................................................................ 1-22
1.8.6.3 Test Method. ...................................................................................................... 1-22
1.8.6.3.1 Setup .................................................................................................................. 1-22
1.8.6.3.2 Conditions .......................................................................................................... 1-22
1.8.6.3.3 Procedure. .......................................................................................................... 1-22
1.8.6.3.4 Data Reduction................................................................................................... 1-23
1.8.7 Bias Leakage Test (1). ....................................................................................... 1-23
1.8.7.1 Purpose.. ............................................................................................................. 1-23
1.8.7.2 Test Equipment.. ................................................................................................ 1-23
1.8.7.3 Test Method. ...................................................................................................... 1-23
1.8.7.3.1 Setup. ................................................................................................................. 1-23
1.8.7.3.2 Conditions. ......................................................................................................... 1-23
1.8.7.3.3 Procedure. .......................................................................................................... 1-23
1.8.7.3.4 Data Reduction................................................................................................... 1-24
1.8.8 Multispeed Record Level Test (1). .................................................................... 1-24
1.8.8.1 Purpose. .............................................................................................................. 1-24
1.8.8.2 Test Equipment.. ................................................................................................ 1-24
1.8.8.3 Test Method. ...................................................................................................... 1-24
1.8.8.3.1 Setup .................................................................................................................. 1-24
1.8.8.3.2 Conditions .......................................................................................................... 1-24
1.8.8.3.3 Procedure. .......................................................................................................... 1-24
1.8.8.3.4 Data Reduction................................................................................................... 1-24
1.8.9 Record Transfer Characteristic Test (1). ............................................................ 1-25
1.8.9.1 Purpose.. ............................................................................................................. 1-25
1.8.9.2 Test Equipment.. ................................................................................................ 1-25

vi
Page
1.8.9.3 Test Method. ...................................................................................................... 1-25
1.8.9.3.1 Setup.. ................................................................................................................ 1-25
1.8.9.3.2 Conditions. ......................................................................................................... 1-25
1.8.9.3.3 Procedure. .......................................................................................................... 1-25
1.8.9.3.4 Data Reduction................................................................................................... 1-25
1.8.10 Eye Pattern (1). .................................................................................................. 1-26
1.8.10.1 Purpose.. ............................................................................................................ 1-26
1.8.10.2 Test Equipment.. ................................................................................................ 1-26
1.8.10.3 Test Method. ...................................................................................................... 1-26
1.8.10.3.1 Setup. ................................................................................................................. 1-26
1.8.10.3.2 Conditions.. ........................................................................................................ 1-26
1.8.10.3.3 Procedure ........................................................................................................... 1-26
1.8.10.3.4 Data Reduction................................................................................................... 1-28
1.9 FM System Tests................................................................................................ 1-30
1.9.1 General. .............................................................................................................. 1-30
1.9.2 Deviation, Center Frequency And Polarity Tests (1) and (2). ........................... 1-30
1.9.2.1 Purpose. .............................................................................................................. 1-30
1.9.2.2 Test Equipment. ................................................................................................. 1-30
1.9.2.3 Test Method. ...................................................................................................... 1-30
1.9.2.3.1 Setup.. ................................................................................................................ 1-30
1.9.2.3.2 Conditions .......................................................................................................... 1-30
1.9.2.3.3 Procedure: .......................................................................................................... 1-30
1.9.2.3.4 Data Reduction................................................................................................... 1-31
1.9.3 Frequency Response Test (1) and (2). ............................................................... 1-31
1.9.3.1 Purpose.. ............................................................................................................. 1-31
1.9.3.2 Test Equipment .................................................................................................. 1-31
1.9.3.3 Test Method. ...................................................................................................... 1-31
1.9.3.3.1 Setup. ................................................................................................................. 1-31
1.9.3.3.2 Conditions. ......................................................................................................... 1-31
1.9.3.3.3 Procedure. .......................................................................................................... 1-31
1.9.3.3.4 Data Reduction................................................................................................... 1-32
1.9.4 Signal-To-Noise Ratio Test (1) and (2). ............................................................ 1-32
1.9.4.1 Purpose. .............................................................................................................. 1-32
1.9.4.2 Test Equipment .................................................................................................. 1-32
1.9.4.3 Test Method. ...................................................................................................... 1-32
1.9.4.3.1 Setup. ................................................................................................................. 1-32
1.9.4.3.2 Conditions .......................................................................................................... 1-32
1.9.4.3.3 Procedure ........................................................................................................... 1-32
1.9.4.3.4 Data Reduction................................................................................................... 1-32
1.9.5 Distortion Test (1) and (2). ................................................................................ 1-32
1.9.5.1 Purpose.. ............................................................................................................. 1-32
1.9.5.2 Test Equipment.. ................................................................................................ 1-32
1.9.5.3 Test Method. ...................................................................................................... 1-33
1.9.5.3.1 Setup. ................................................................................................................. 1-33

vii
Page
1.9.5.3.2 Conditions .......................................................................................................... 1-33
1.9.5.3.3 Procedure ........................................................................................................... 1-33
1.9.5.3.3.1 Single Component Distortion ............................................................................ 1-33
1.9.5.3.3.2 Intermodulation Distortion................................................................................. 1-33
1.9.5.3.4 Data Reduction................................................................................................... 1-33
1.9.6 Spurious Component Test (1) ............................................................................ 1-33
1.9.6.1 Purpose. .............................................................................................................. 1-33
1.9.6.2 Test Equipment .................................................................................................. 1-33
1.9.6.3 Test Method ....................................................................................................... 1-33
1.9.6.3.1 Setup .................................................................................................................. 1-33
1.9.6.3.2 Conditions .......................................................................................................... 1-33
1.9.6.3.3 Procedure ........................................................................................................... 1-34
1.9.6.3.4 Data Reduction................................................................................................... 1-34
1.9.7 Linearity Tests (dc) (1). ..................................................................................... 1-34
1.9.7.1 Purpose. .............................................................................................................. 1-34
1.9.7.2 Test Equipment. ................................................................................................. 1-34
1.9.7.3 Test Method ....................................................................................................... 1-34
1.9.7.3.1 Setup .................................................................................................................. 1-34
1.9.7.3.2 Conditions .......................................................................................................... 1-34
1.9.7.3.3 Procedure ........................................................................................................... 1-34
1.9.7.3.3.1 FM Record Amplifier Linearity ......................................................................... 1-35
1.9.7.3.3.2 FM Reproduce Amplifier Linearity ................................................................... 1-35
1.9.7.3.4 Data Reduction................................................................................................... 1-35
1.9.8 Drift (dc) at Center Frequency Test (1) ............................................................. 1-35
1.9.8.1 Purpose ............................................................................................................... 1-36
1.9.8.2 Test Equipment. ................................................................................................. 1-36
1.9.8.3 Test Method ....................................................................................................... 1-36
1.9.8.3.1 Setup. ................................................................................................................. 1-36
1.9.8.3.2 Conditions .......................................................................................................... 1-36
1.9.8.3.3 Procedure ........................................................................................................... 1-36
1.9.8.3.4 Data Reduction................................................................................................... 1-36
1.9.9 Multispeed Reproduce Transfer Levels Test (1) ............................................... 1-36
1.9.9.1 Purpose ............................................................................................................... 1-36
1.9.9.2 Test Equipment. ................................................................................................. 1-36
1.9.9.3 Test Method ....................................................................................................... 1-36
1.9.9.3.1 Setup .................................................................................................................. 1-37
1.9.9.3.2 Conditions .......................................................................................................... 1-37
1.9.9.3.3 Procedure ........................................................................................................... 1-37
1.9.9.3.4 Data Reduction................................................................................................... 1-37
CHAPTER 2 SERIAL HIGH DENSITY DIGITAL RECORDING TESTS ............................ 2-1
2.1 General ................................................................................................................. 2-1
2.2 Basic Serial HDDR Test (1) and (2) .................................................................... 2-1

viii
Page
2.2.1 Purpose. ................................................................................................................ 2-1
2.2.2 Test Equipment. ................................................................................................... 2-1
2.2.3 Test Method. ........................................................................................................ 2-1
2.2.3.1 Setup. ................................................................................................................... 2-1
2.2.3.2 Conditions. ........................................................................................................... 2-2
2.2.3.3 Procedure. ............................................................................................................ 2-3
2.2.3.4 Data Reduction..................................................................................................... 2-3
2.3 Speed Ratio Test (1)............................................................................................. 2-3
2.3.1 Purpose.. ............................................................................................................... 2-3
2.3.2 Test Equipment. ................................................................................................... 2-3
2.3.3 Test Method. ........................................................................................................ 2-3
2.3.3.1 Setup… ................................................................................................................ 2-3
2.3.3.2 Conditions.. .......................................................................................................... 2-3
2.3.3.3 Procedure. ............................................................................................................ 2-5
2.3.3.4 Data Reduction..................................................................................................... 2-5
2.4 Signal-to-Noise Ratio Margin Test (Using Input Attenuator) (1) ....................... 2-5
2.4.1 Purpose. ................................................................................................................ 2-5
2.4.2 Test Equipment. ................................................................................................... 2-5
2.4.3 Test Method. ........................................................................................................ 2-5
2.4.3.1 Setup. ................................................................................................................... 2-5
2.4.3.2 Conditions ............................................................................................................ 2-7
2.4.3.3 Procedure. ............................................................................................................ 2-7
2.4.3.4 Data Reduction..................................................................................................... 2-9
2.5 Signal-to-Noise Ratio Margin Test (Using Additive Noise) (1) .......................... 2-9
2.5.1 Purpose.. ............................................................................................................... 2-9
2.5.2 Test Equipment .................................................................................................... 2-9
2.5.3 Test Method. ........................................................................................................ 2-9
2.5.3.1 Setup .................................................................................................................... 2-9
2.5.3.2 Conditions. ........................................................................................................... 2-9
2.5.3.3 Procedure. ............................................................................................................ 2-9
2.5.3.4 Data Reduction................................................................................................... 2-12
2.6 Serial HDDR PCM Bit Synchronizer Test (1) ................................................... 2-13
2.6.1 Purpose. .............................................................................................................. 2-13
2.6.2 Test Equipment .................................................................................................. 2-13
2.6.3 Test Method. ...................................................................................................... 2-13
2.6.3.1 Setup. ................................................................................................................. 2-13
2.6.3.2 Conditions. ......................................................................................................... 2-14
2.6.3.3 Procedure. .......................................................................................................... 2-15
2.6.3.4 Data Reduction................................................................................................... 2-15
CHAPTER 3 DIGITAL CASSETTE HELICAL SCAN RECORDING TESTS ...................... 3-1
3.1 General ................................................................................................................. 3-1
3.2 Calibration Tape (1) ............................................................................................. 3-1

ix
Page
3.2.1 19-mm ID-1 Systems. .......................................................................................... 3-1
3.2.2 One-half inch S-VHS Systems............................................................................. 3-1
3.3 Bit Error Rate (BER) Test (1) and (2) ................................................................. 3-2
3.3.1 Test Equipment. ................................................................................................... 3-2
3.3.2 Procedure. ............................................................................................................ 3-2
3.3.3 Data Reduction..................................................................................................... 3-2
3.4 Time Scaled Playback Test (1) and (2) ................................................................ 3-3
3.4.1 Test Equipment .................................................................................................... 3-3
3.4.2 Procedure. ............................................................................................................ 3-3
3.4.3 Data Reduction..................................................................................................... 3-3
3.5 Polarity Test (1) ................................................................................................... 3-3
3.5.1 Test Equipment .................................................................................................... 3-3
3.5.2 Procedure. ............................................................................................................ 3-3
3.5.3 Data Reduction..................................................................................................... 3-3
3.6 Eye Pattern (1) ..................................................................................................... 3-3
3.6.1 Test Equipment.. .................................................................................................. 3-3
3.6.2 Procedure. ............................................................................................................ 3-4
3.6.3 Data Reduction..................................................................................................... 3-4
3.7 Longitudinal Track Tests (1) and (2) .................................................................. 3-4
3.7.1 Test Equipment.. .................................................................................................. 3-4
3.7.2 Procedure. ............................................................................................................ 3-4
3.7.3 Data Reduction..................................................................................................... 3-5
CHAPTER 4 RECORDER MULTIPLEXER/DEMULTIPLEXER SYSTEM TESTS ............ 4-1
4.1 General ................................................................................................................. 4-1
4.2 Bit Error Rate Test (1) and (2) ............................................................................. 4-1
4.2.1 General.. ............................................................................................................... 4-1
4.2.2 Test Equipment. ................................................................................................... 4-1
4.2.3 Procedure. ............................................................................................................ 4-1
4.2.4 Data Reduction..................................................................................................... 4-1
4.3 Delay Measurements (1) ...................................................................................... 4-1
4.3.1 Purpose. ................................................................................................................ 4-1
4.3.2 Test Equipment .................................................................................................... 4-2
4.3.3 Test Method. ........................................................................................................ 4-2
4.3.3.1 Setup. ................................................................................................................... 4-2
4.3.3.2 Conditions.. .......................................................................................................... 4-2
4.3.3.3 Procedure. ............................................................................................................ 4-2
4.3.3.4 Data Reduction..................................................................................................... 4-3
4.4 Format Verification Test (1) ................................................................................ 4-5
4.4.1 General.. ............................................................................................................... 4-5
4.4.2 Test Equipment .................................................................................................... 4-5
4.4.3 Procedure. ............................................................................................................ 4-5
4.4.4 Data Reduction..................................................................................................... 4-5

x
Page
CHAPTER 5 MAGNETIC TAPE TESTS ................................................................................. 5-1
5.1 General ................................................................................................................. 5-1
5.2 Manufacturer’s Centerline Tape (MCT) and Manufacturer’s
Secondary Centerline Tape (MSCT) ................................................................ 5-1
5.3 Longitudinally-Oriented Oxide Instrumentation Magnetic Tape ........................ 5-2
5.3.1 Standard Record Conditions. ............................................................................... 5-2
5.3.1.1 High Energy Tape ................................................................................................ 5-2
5.3.1.2 High Resolution Tape.. ........................................................................................ 5-2
5.3.2 Working Tape Length .......................................................................................... 5-2
5.3.3 Test Equipment-Level Detector and Recorder.. .................................................. 5-2
5.3.4 Level Detector. ..................................................................................................... 5-2
5.3.5 Direct-Write Recorder.. ....................................................................................... 5-2
5.3.6 Durability Test Analysis Consists of ................................................................... 5-3
5.3.7 Output Uniformity Test Analysis Consists of ...................................................... 5-3
5.3.8 Test Procedures, Magnetic/Electrical Characteristics. ......................................... 5-3
5.3.8.1 Bias Level. ........................................................................................................... 5-3
5.3.8.2 Record Level. ....................................................................................................... 5-4
5.3.9 Wavelength Response and Output at 0.1 Upper Band Edge Wavelengths.......... 5-4
5.3.10 Short Wavelength Output Uniformity. ................................................................ 5-5
5.3.11 Short Wavelength Instantaneous Non-Uniformity (Dropout). ............................ 5-7
5.3.12 Durability. ............................................................................................................ 5-7
5.3.13 Modulation Noise................................................................................................. 5-9
5.3.14 Layer-to-Layer Signal Transfer. .......................................................................... 5-9
5.3.15 Ease of Erasure. ................................................................................................. 5-10
5.3.16 Physical Characteristics. .................................................................................... 5-10
5.4 Digital Cassette Tape ......................................................................................... 5-10
5.4.1 Standard Record/Reproduce Conditions ............................................................ 5-11
5.4.2 Bit Error Rate Test. ............................................................................................ 5-11
5.4.2.1 General. .............................................................................................................. 5-11
5.4.2.2 Test Equipment .................................................................................................. 5-11
5.4.2.3 Procedure. .......................................................................................................... 5-11
5.4.2.4 Data Reduction................................................................................................... 5-11
5.4.3 Sensitivity. ......................................................................................................... 5-11
5.4.3.1 Purpose.. ............................................................................................................. 5-12
5.4.3.2 Procedure.. ......................................................................................................... 5-12
5.4.3.3 Data Reduction................................................................................................... 5-12
5.4.4 Signal-to-Noise Ratio (SNR). ............................................................................ 5-12
5.4.4.1 Purpose.. ............................................................................................................. 5-12
5.4.4.2 Procedure ........................................................................................................... 5-12
5.4.4.3 Data Reduction................................................................................................... 5-12

xi
LIST OF TABLES
Table Page
1-1 Flutter Band-Pass Filter Characteristics............................................................. 1-10
1-2 IMD Test Frequencies........................................................................................ 1-22
5-1 Wavelengths for Wavelength Response Tests ..................................................... 5-5
LIST OF FIGURES Figure No. Page
CHAPTER 1-LONGITUDINAL FIXED HEAD RECORDING TESTS
1-1 Typical waveform obtained from head polarity test ............................................ 1-2
1-2 Lissajous oscilloscope patterns….. ...................................................................... 1-4
1-3 Tape speed – general or field use method ............................................................ 1-6
1-4 Flutter measurement............................................................................................. 1-8
1-5 Flutter measurement using commercially available integrated test set ............... 1-9
1-6 Time base error measurement ............................................................................ 1-12
1-7 Time base error measurement using integrated commercially available
test set……………………………….............................................................. 1-13
1-8 Interchannel time displacement error measurement .......................................... 1-15
1-9 Interchannel time displacement error measurement using integrated
commercially available test set ....................................................................... 1-16
1-10 Frequency response and signal-to-noise ratio .................................................... 1-18
1-11 Intermodulation distortion test ........................................................................... 1-21
1-12 Eye pattern test setup ......................................................................................... 1-26
1-13 Good NRZ eye pattern ....................................................................................... 1-27
1-14 Good bi-phase eye pattern ................................................................................. 1-27
1-15 Poor NRZ eye pattern ........................................................................................ 1-27
1-16 Poor bi-phase eye pattern ................................................................................... 1-28
1-17 FM system test equipment setup ........................................................................ 1-31
1-18 Linearity (dc) curves .......................................................................................... 1-38
CHAPTER 2-SERIAL HIGH DENSITY RECORDING TESTS
2-1 Test setup for basic serial HDDR test .................................................................. 2-2
2-2 Test setup for SNR margin test (Attenuation Method) ........................................ 2-7
2-3 Test setup for SNR margin test (using additive noise) ...................................... 2-10
2-4 Circuit for specially conditioning white noise ................................................... 2-13
2-5 Test setup for serial HDDR PCM bit synchronizer test ..................................... 2-14

xii
Figure No. Page
CHAPTER 3-DIGITAL CASSETTE HELICAL SCAN RECORDING TESTS
3-1 Digital recorder longitudinal track test………………………………………….3-5
CHAPTER 4-RECORDER MULTIPLEXER/DEMULTIPLEXER SYSTEM TESTS
4-1 Multiplexer/demultiplexer delay measurement ................................................... 4-2
CHAPTER 5-MAGNETIC TAPE TESTS
5-1 Output uniformity test analysis ............................................................................ 5-6
5-2 Durability test analysis ......................................................................................... 5-8
LIST OF DATA SHEETS
DATA SHEET NO. Page
CHAPTER 1-LONGITUDINAL FIXED HEAD RECORDING TESTS
1-1 Eye Pattern ........................................................................................................ 1-29
CHAPTER 2-SERIAL HIGH DENSITY RECORDING TESTS
2-1 Basic Serial HDDR ............................................................................................. 2-4
2-2 Speed Ratio ......................................................................................................... 2-6
2-3 Signal-to-Noise Ratio Margin (with attenuation) ............................................... 2-8
2-4 Signal-to-Noise Ratio Margin (with additive noise) ......................................... 2-11
2-5 PCM Bit Synchronizer ...................................................................................... 2-16
CHAPTER 4 RECORDER MULTIPLEXER/DEMULTIPLEXER SYSTEM TESTS
4-1 Delay Measurements ........................................................................................... 4-4

xiii
ACRONYMS
ADARIO Analog to Digital Adaptable Recorder Input/Output ANSI American National Standards Institute BER bit-error rate CBER corrected BER CCT Crossplay Calibration Tape CRT Cathode Ray Tube CSR clock-slip rate dB decibel dBm decibels above 1 milliwatt dc direct current EDAC Error Detection and Correction FM frequency modulation GPS Global Positioning System HDD High Density Digital HDDR high density digital recording HE high energy HR high resolution Hz hertz IBM International Business Machines IMD intermodulation distortion ips inches per second IRIG Interrange Instrumentation Group ITDE interchannel time displacement error Kbps Kilobits per seconds kHz Kilohertz MCT Manufacturer's Centerline Tape MHz Megahertz MML Magnetic Media Laboratory MSCT Manufacturer's Secondary Centerline Tape Msps megabits per second NPR Noise Power Ratio NRZ non-return to zero NRZ-L non-return to zero level PBN principal block numbers PC Personal Computer PCM pulse code modulation PN Pseudo-noise RC resistor capacitor rms root mean square RMS RNRZ-L randomized non-return-to-zero-level SNR signal-to-noise ratio SR standard resolution S-VHS super VHS TBE time base error UBE upper band edge V rms volts root mean square VLDS very large data store VSG Verification Signal Generator

xiv
INTRODUCTION
This volume describes the procedures used in measuring and where applicable, adjusting
the performance parameters of recorder/reproducer systems and magnetic tapes to insure
compatibility and uniformity. Definitions of terms applicable to these procedures are found in
IRIG Standard 106-Telemetery Standards, Chapters 6 and 7.
These procedures include wideband and double density instrumentation magnetic tape
(longitudinal fixed head) recorder/reproducer systems using 1-inch (25.4-mm) wide tape and
helical scan digital recorders when tested as complete systems. It also includes
multiplexer/demultiplexer systems used as inputs/outputs of the digital recorders. Tests of
components such as heads and capstan motors are beyond the scope of these procedures. The
magnetic tape procedures include tests of electrical characteristics of longitudinally oriented
oxide magnetic tape designed for instrumentation recording, including high resolution, high
density digital, and high energy tapes. Performance tests of cassette tapes for helical scan digital
recording systems are at the systems level.
Before starting these procedures, qualitative performance tests should be conducted to
ensure that the system will transport tape and is capable of recording and reproducing the
appropriate signals, and that the system is aligned in accordance with the standards contained in
Chapter 6 of IRIG Standard 106 and the appropriate system instruction manual. When
measurement techniques are not specified, commonly accepted measurement methods for
mechanical and electrical characteristics should be employed. These tests may be conducted and
data processed either manually or via computer where available.
Procedures are included for acceptance and operational readiness tests of recorder/
reproducer systems. Not all tests are required for any one system, and tests other than those
indicated may be required for a given system, depending on system configuration and
application. After the recorder/reproducer has been aligned, the adjustments should not be
changed for the duration of the performance testing unless otherwise noted in the test procedure.
Those tests recommended during acceptance testing or after replacement of major
components are indicated by a (1) and those recommended during operational readiness tests are
indicated by a (2).
The point of contact for further documentation follows:
Range Commanders Council, Secretariat
Building 1510 Headquarters Avenue
White Sands Missile Range, NM 88002
Phone: 575.678.1107 (DSN 258)
E-mail: [email protected]

1-1
CHAPTER 1
LONGITUDINAL FIXED HEAD RECORDING TESTS
1.1 General
This chapter defines the test procedures for longitudinal fixed-head recorder/
reproducer systems. The procedures include tests of head polarity and mechanical
alignment, tape speed, speed variation and timing error, direct record systems, and FM record
systems.
1.2 Head Electrical Polarity and Mechanical Alignment Tests
This section describes tests to ensure maintenance of signal polarity from tape input to
output of a direct record/reproduce system and tests to ensure correct alignment of record head
and reproduce head azimuth.
1.3 Head Polarity Tests (1)
1.3.1 Purpose. These tests ensure that a positive-going pulse applied to the input of a direct-
record amplifier produces a magnetic flux sequence on the tape, whose polarity sequence is
south-north-north-south. The tests also ensure a magnetic flux sequence of south-north-north-
south polarity, passed across a reproduce head, produces a positive pulse at the output of a direct
reproduce amplifier.
As an alternative procedure, a tape with a known pulse polarity such
as commercially prepared speed tape, may be used.
1.3.2 Test Equipment. Small rectangular bar magnet, compass, and pulse generator.
1.3.3 Test Method.
1.3.3.1 Setup. Determine the polarity of the magnet with a compass. The north-seeking
pointer of the compass will be attracted to the south pole of the magnet. Mark the south pole of
the bar magnet.
1.3.3.2 Conditions. None.
1.3.3.3 Procedure.
1.3.3.3.1 Using a degaussed tape of the appropriate width for the machine being tested, draw
a corner of the south pole of the magnet across the width of the tape on the oxide side. Withdraw
the magnet. Since the sharpness of the recorded pulse is a function of the mechanical definition
of the corner of the magnet, difficulty may be encountered in obtaining an adequate output
NOTE

1-2
signal. In this case, a 0.15- to 0.36-mm (0.006 to 0.0014-in) transfomer lamination of soft iron
or permalloy may be extended from the south pole of the bar magnet to form a narrow south pole
and hence, a sharper pulse.
1.3.3.3.2 Reproduce the magnetized portion of the tape in the normal (forward) direction of
tape travel. All reproduce amplifiers should give a positive-going pulse at the output when the
magnetized section crosses the reproduce head (see Figure 1-1).
Figure 1-1. Typical waveform obtained from head polarity test (see test 1.3).
1.3.3.3.3 Connect the pulse generator to the record input. Record positive pulses (less than
50-percent duty cycle) on the tape through the record amplifiers. Reproduction of' these pulses
shou1d give positive pulses at the output of the playback amplifier.
1.3.3.4 Data Reduction. Not applicable.
1.4 Record Head-Stack Azimuth Alignment (1)
1.4.1 Purpose. This test ensures that the mean gap azimuth is perpendicular to the head-
mounting plate within +0.30 mrad (+1 minute of arc). See Head and Head Segment Mechanical
Parameters in Chapter 6 of IRIG Standard 106. For operational testing, the following quick
method using the Lissajous pattern technique is recommended.
1.4.2 Test Equipment. Dual trace oscilloscope, test oscilloscope, and prerecorded commercial
azimuth tape, Datatape No. 590708-1051 or Metrum No. 16815765-003 or equivalent.
Speed and Azimuth Test Tape No. 16815765, Honeywell, Denver, CO.
Azimuth Test Tape, Datatape Inc., A Kodak Company, Pasadena, CA.
1/2-inch Wideband, No. 590708-1021
1-inch Wideband, No. 590708-1051
POSITIVE POLARITY UP

1-3
1/2-inch Intermediate Band, No. 590708-1022
1-inch Intermediate Band, No. 590708-1052
1.4.3 Test Method.
1.4.3.1 Setup. Place the azimuth tape on the transport and select reproduce mode at desired
speed.
1.4.3.2 Conditions. None.
1.4.3.3 Procedure.
1.4.3.3.1 Look at the outside even tracks ( 2 and 6, 14 or 28) on a dual trace oscilloscope
adjust each pulse for equal amplitude and ensure proper polarity.1
1.4.3.3.2 Whi1e triggering with one of the signals, adjust the reproduce head azimuth for a
coincident display of the pulses on the dual trace oscilloscope.
1.4.3.3.3 Repeat subparagraphs 1.4.3.3.1 and 1.4.3.3.2 for odd head stack (1 and 5, 13 or 25).
(Delete this subparagraph for 14-track in-line heads.)
1.4.3.3.4 Remove the azimuth tape and mount a new or degaussed tape on the transport.
1.4.3.3.5 Patch a test oscillator to tracks 2, 4, and 6 on 7-track recorders; tracks 2, 12, and 14
on 14-track recorders; or tracks 2, 26, and 28 on 28-track recorders.2
1.4.3.3.6 Connect track 2 to the vertical input of the scope and track 6, 14, or 26 to the
horizontal input.
1.4.3.3.7 Record and reproduce a .008-mm (0.33-mil) wavelength sine wave (46 kHz at 381
mm/s [15 ips]) for 7-track or a 0.025-mm (1.0-mil) wavelength sine wave (15 kHz at 381 mm/s
[15 ips]) for 14- and 28-track machines at standard record level.
1.4.3.3.8 Adjust the reproduce levels of the tape recorder until the track output levels are the
same. The output levels of the tracks are balanced by removing the horizontal input and
checking the vertical signal deflection. Reconnect the horizontal input and disconnect the
vertical input. When the recorder's reproduce levels are correctly adjusted, both the horizontal
and vertical will have equal deflection.
1 IRIG Standard 106 refers to the most recent issue of IRIG 106-, Telemetry Standards.
2 For 14-track in-line heads, use outside tracks 1 and 14; and tracks 1, 12, and 14 for subparagraph 1.4.3.3.5.

1-4
1.4.3.3.9 Without adjusting the reproduce heads the resultant Lissajous pattern should be an
ellipse with the major axis in quadrants I and III as shown in Figure 1-2. If the major axis is in
quadrants II and IV, the measurement is out of tolerance.
1.4.3.3.10 While looking at the Lissajous pattern, switch from track 6, 14, or 26 to track 4, 12,
or 28. If the pattern changes quadrants, the measurement is not out of tolerance.
Figure 1-2. Lissajous oscilloscope patterns (see tests 1.4 and 1.5).
If these measurements are out of tolerance, be certain that the
transport is not causing excessive shear stress in the tape. An
unstable Lissajous pattern may be an indication of excessive
interchannel time displacement error (ITDE).
1.4.3.3.11 Repeat subparagraphs 1.4.3.3.6 through 1.4.3.3.10 using tracks 1 and 5 on 7-track
recorders, tracks 1 and 13 on 14-track recorders, or tracks 1 and 25 on 28-track recorders. Check
for a change in quadrants using tracks 7, 11, or 27. (Delete this part for 14-track in-line heads.)
1.4.3.4 Data Reduction. If the Lissajous pattern is within tolerance, no further measurement
is required. Any out-of-tolerance condition should be investigated by an optical examination to
eliminate the possibility of errors caused by gap scatter and tape tolerances.
1.5 Reproduce Head-Stack Azimuth Alignment (1) and (2)
1.5.1 Purpose. The signals recorded on a magnetic tape can be used to optimize their output on
any reproducer system. The reproducer system head azimuth is adjusted for optimum signal
alignment match between the reproducer system and the original recorder system head segments
or stacks.
1.5.2 Test Equipment. Dual trace oscilloscope and test oscillator.
IDEAL ALIGNMENT WITHIN SPECIFICATIONS
III IV
II I
III IV
II I
CAUTION

1-5
1.5.3 Test Method.
1.5.3.1 Setup. Mount a new or degaussed tape on the transport.
1.5.3.2 Conditions. The Lissajous pattern technique is used as the alignment indicator.
1.5.3.3 Procedure.
1.5.3.3.1 Perform subparagraphs 1.4.3.3.5 through 1.4.3.3.10.
1.5.3.3.2 Adjust the reproduce head azimuth until a straight line in quadrants I and III are
observed (see Figure 1-2).
1.5.3.3.3 While looking at the Lissajous pattern, switch from track 6, 14, or 26 to track 4, 12,
or 28. If the pattern changes quadrants, readjust the azimuth3.
1.5.3.3.4 Repeat subparagraphs 1.5.3.3.1 through 1.5.3.3.3 using tracks 1 and 5 on 7-track
recorders, tracks 1 and 13 on 14-track recorders, or tracks 1 and 25 on 28-track recorders. Check
for a change in quadrants using tracks 7, 11, or 27.
1.5.3.4 Data Reduction. Not applicable.
1.6 Tape Speed Tests
1.6.1 General. These tests measure effective tape speed for recording or reproducing without a
tape speed control signal (see subparagraph 6.8.4.1 of IRIG Standard 106, Telemetry Standards).
Tape speed errors are defined as departures from the nominal tape speed occurring at frequencies
below 0.5 Hz. Two test methods are specified. The first method is intended as a laboratory or
factory standard and may be used for tape speed testing or for checking working standards. The
second method describes a quicker test using a reference tape.
1.6.2 Tape Speed (1). The intent of the tape speed measurement test is the standardization of
the "effective" rather than "absolute" tape speed. Absolute tape speed is relatively meaningless
because it does not consider the operational elongation of the tape, which must be considered if a
true or effective velocity measurement is to be achieved.
1.6.3 Purpose. General or Field-Use Method is recommended for those cases where a quick
procedure for checking tape speed is required. Although the method for tape-speed measurement
specified in Laboratory Use is an accurate method of determining tape speed, it is very time
consuming for maintenance and operational testing.
3 For in-line heads, use tracks 1 and 12. Switch to tracks 1 and 14 for 1.5.3.3.4.

1-6
1.6.4 Test Equipment. For this test, commercial prerecorded tapes, Datatape No. 590706-1041
or equivalent, are used which have been recorded with saturated pulses having a pulse-to-pulse
separation distance of 38.1 mm (1.5 in) to an accuracy of + 0.01 percent under standard tension
and environmental conditions. These tapes are prepared under a tape tension of 2.78 N (10 oz) +
2 percent. Additional equipment required includes an oscilloscope, a detector, and an electronic
counter as shown in Figure 1-3.
Figure 1-3. Tape speed – general or field-use method (see tests 1.6 and appendix A).
1.6.5 Test Method.
1.6.5.1 Setup. See subparagraph 1.6.5.3.
1.6.5.2 Conditions. None.
1.6.5.3 Procedure.
1.6.5.3.1 Connect a counter to the output of the recorder, disable the bias and control track
signals, and short the input to the record amplifiers.
1.6.5.3.2 Place the test tape on the transport and select the reproduce mode at the selected
operational speed. On an oscilloscope, verify the approximate pulse period to ensure proper
operation of the counter. The spacing will be 6250 microseconds at 6096 mm/s (240 ips), 12,500
microseconds at 3048 mm/s (120 ips), 25,000 microseconds at 1524 mm/s (60 ips), 50,000
microseconds at 762 mm/s (30 ips), and 100,000 microseconds at 381 mm/s (15 ips).
Measurements are to be made near the beginning, middle and end of the reel.
The user should select a specific reel diameter for compatibility with
the data acquisition tapes. Optimum compatibility will be realized
when the test tape reel diameter is the same as the diameter of the
data acquisition reels. The prerecorded tapes should be of the same
thickness and elastoplastic characteristics as the data acquisition tapes.
OSCILLATOR
OR
D.C. SOURCE
RECORDER/
REPRODUCERDETECTOR
ELECTRONIC
COUNTER
NOTE

1-7
1.6.5.3.3 The accuracy of the tape, including questions of misuse or abuse, can be checked
visually by developing the pulses using a carbonyl iron dispersion and by measuring the
displacement between pulses under standard tension and environmental conditions.
1.6.5.4 Data Reduction. The exact speed may be calculated by the following equation:
Tape Speed = 38.1 mm or 1.5 in, (1-3)
tc tc
where
tc = Period displayed by counter (in seconds).
1.7 Speed Variation and Timing Error Tests
This section provides procedures and describes the instrumentation used for the
measurement of flutter, time base error (TBE), and interchannel time displacement error (ITDE).
1.7.1 Flutter Measurement Test (1) and (2).
1.7.1.1 Purpose. This test measures total cumulative flutter over a specified passband in
instrumentation magnetic recording equipment. A recommended test method is provided.
1.7.1.2 Test Equipment. This procedure specifies use of a commercially available
multifunction test instrument comprised of a signal oscillator, carrier band-pass filter, frequency
discriminator, output band-pass filter, and statistical voltmeter. The equipment provides direct
reading flutter measurements and is designed to read peak-to-peak amplitude and to ignore
occasional random peaks provided that the value read is exceeded less than 5 percent of the time;
that is, on a 2-sigma setting, the peak-to-peak flutter is within the value read 95 percent of the
time. The multifunctional instrument provides components which meet the following
requirements:
1.7.1.2.1 Oscillator. The oscillator must be capable of supplying a precise signal, stable in
amplitude and frequency and of the desired amplitude and frequency. A sine wave is preferred
for recording with bias. The residual frequency modulation must be negligible compared to the
flutter amplitude anticipated.
1.7.1.2.2 Carrier Band-Pass Filter. A band-pass filter may be inserted ahead of the
discriminator to limit system noise. The response of this filter must be flat within + 3.0 dB from
fc - (afc + ff) to fc + (afc + ff); where fc is the frequency of the reference carrier, ff is the highest
frequency flutter component to be measured, and a is the fractional flutter. A roll-off of 18 dB
per octave beyond band edge is suggested.
1.7.1.2.3 Frequency Discriminator. The discriminator must accept the reproduced reference
carrier which has been modulated by flutter and produce an output signal proportional to the
modulation. In general, 60-dB amplitude limiting must precede the frequency-sensitive portion
of the discriminator to meet the dynamic range requirements of the system.
The user should select a specific reel diameter for compatibility with the data acquisition tapes. Optimum compatibility will be realized when the test tape reel diameter is the same as the diameter of the data acquisition reels. The prerecorded tapes should be of the same thickness and elastoplastic characteristics as the data acquisition tapes.
NOTE

1-8
1.7.1.2.4 Flutter Band-Pass Filter. A band-pass filter follows the discriminator. Its purpose is
to limit the frequency band of the flutter signal and to reject carrier frequency components. The
filter shall be down no more than 3 dB at 0.5 Hz at the upper flutter frequency being measured,
and should fall off at a rate of 18 dB per octave above the cutoff frequency.
1.7.1.2.5 Statistical Voltmeter. The flutter signal from the band-pass filter following the
discriminator is a complex one which will, in general, be a random function, but may
additionally contain discrete components. To measure this signal adequately, statistical
techniques are used. A simplified block diagram is shown in Figure 1-4.
Figure 1-4. Flutter measurement (see test 1.7.1).
1.7.1.3 Test Method. Instantaneous differences between the record and reproduce tape
speeds result in the frequency modulation of a recorded carrier. The basic method used to
measure flutter is to determine the amount of frequency modulation (FM) caused by the
record/reproduce process. Therefore, to measure flutter, a precision reference carrier is recorded
and subsequently reproduced. The reproduced signal is applied to an FM discriminator whose
output is a continuous electrical signal proportional to the variation between the record/reproduce
speeds.
1.7.1.3.1 Procedure. This test determines the magnitude of total cumulative flutter over a
specified passband. Measurements are conducted at one or more points of tape supply reel
loading for the specified tape speed. Results are expressed as the percentage change of a
recorded frequency during the reproduce process.
1.7.1.3.1.1 Connect the equipment as shown in Figure 1-5.
OSCILLATOR
RECORDER/REPRODUCER
INPUT OUTPUT
BAND-PASS FILTER,
CARRIER
DISCRIMINATOR
BAND-PASS FILTER,
FLUTTER
STATISTICAL
VOLTMETER

1-9
Figure 1-5. Flutter measurement using commercially availabe integrated test set
(see test 1.7.1).
10
20
30
.
.
.Statistical Voltmeter
Measurement Pg
Flutter
Input
Reference
Output
Recorder/
Reproducer
under test.
Internal recorder reference
may be used for recording.
Read flutter directly from
meter on 2 sigma.
Follow manufacturer’s
recommendation for proper
use of test set.
NotesData in
Data out
Integrated Test Set
1-10
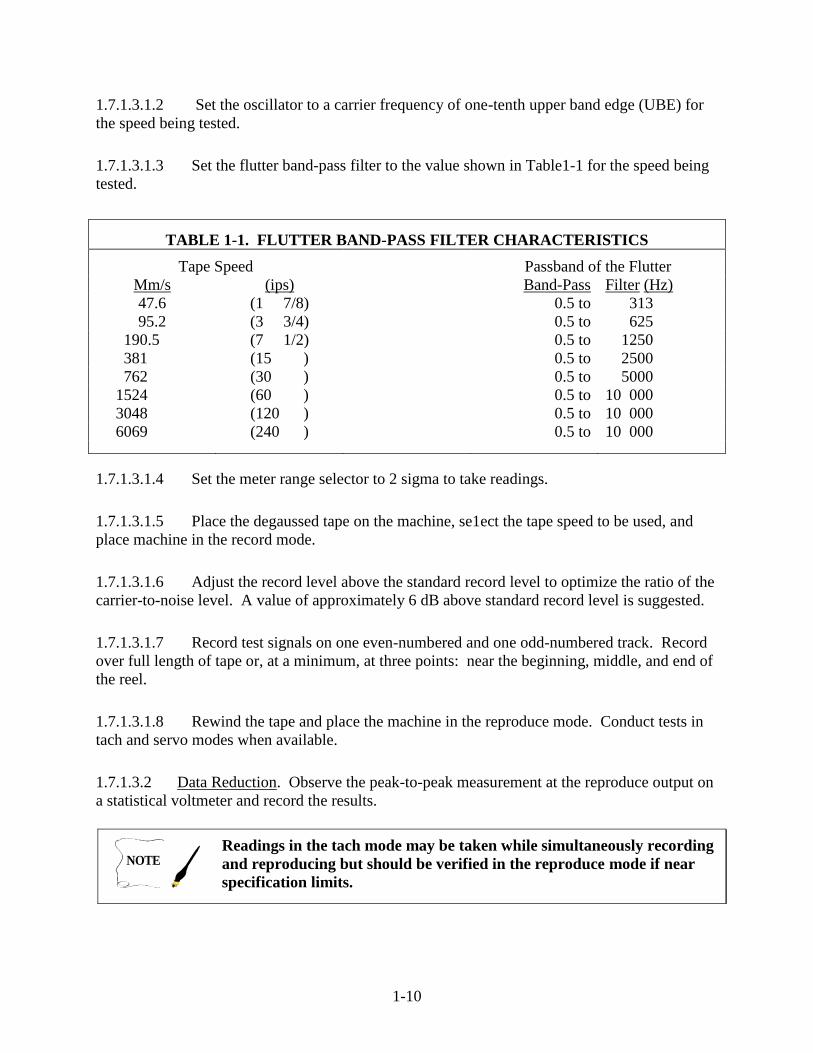
1.7.1.3.1.2 Set the oscillator to a carrier frequency of one-tenth upper band edge (UBE) for
the speed being tested.
1.7.1.3.1.3 Set the flutter band-pass filter to the value shown in Table1-1 for the speed being
tested.
TABLE 1-1. FLUTTER BAND-PASS FILTER CHARACTERISTICS
Tape Speed Passband of the Flutter
Mm/s (ips) Band-Pass Filter (Hz)
47.6 (1 7/8) 0.5 to 313
95.2 (3 3/4) 0.5 to 625
190.5 (7 1/2) 0.5 to 1250
381 (15 ) 0.5 to 2500
762 (30 ) 0.5 to 5000
1524 (60 ) 0.5 to 10 000
3048 (120 ) 0.5 to 10 000
6069 (240 ) 0.5 to 10 000
1.7.1.3.1.4 Set the meter range selector to 2 sigma to take readings.
1.7.1.3.1.5 Place the degaussed tape on the machine, se1ect the tape speed to be used, and
place machine in the record mode.
1.7.1.3.1.6 Adjust the record level above the standard record level to optimize the ratio of the
carrier-to-noise level. A value of approximately 6 dB above standard record level is suggested.
1.7.1.3.1.7 Record test signals on one even-numbered and one odd-numbered track. Record
over full length of tape or, at a minimum, at three points: near the beginning, middle, and end of
the reel.
1.7.1.3.1.8 Rewind the tape and place the machine in the reproduce mode. Conduct tests in
tach and servo modes when available.
1.7.1.3.2 Data Reduction. Observe the peak-to-peak measurement at the reproduce output on
a statistical voltmeter and record the results.
Readings in the tach mode may be taken while simultaneously recording
and reproducing but should be verified in the reproduce mode if near
specification limits.
TABLE 1-1. FLUTTER BAND-PASS FILTER CHARACTERISTICS
NOTE

1-11
1.7.2 Time Base Error Test (1) and (2).
1.7.2.1 Purpose. This test measures the time base error (TBE) of events recorded on a single
track.
1.7.2.2 Test Equipment. Two procedures are described in this section. One procedure uses a
commercially available test instrument, while the other procedure uses a signal generator and an
oscilloscope. The multifunction test instrument includes an oscillator, carrier band-pass filter,
frequency discriminator, output band-pass filter, and statistical voltmeter. The equipment
provides direct reading measurements and is designed to read peak-to-peak amplitude and to
ignore occasional random peaks provided the value read is exceeded less than 5 percent of the
time; that is, on a 2-sigma setting, the peak-to-peak measurand (TBE) is within the value read 95
percent of the time. If the oscilloscope method is used, the oscilloscope must be a dual channel
model with a bandwidth of at least 100 MHz to provide sufficient resolution.
1.7.2.3 Test Method. To measure TBE, the internal servo reference frequency is recorded
and subsequently reproduced. The time base of the reproduced signal is then compared with that
of the servo reference frequency with the recorder in the servo mode.
1.7.2.3.1 Procedure. Measurements are conducted at one or more points of the tape supply reel
loading for the specified tape speed. Results are expressed as the number of microseconds
difference in time base of the reproduced signal compared to the servo reference frequency.
1.7.2.3.1.1 Connect the equipment as shown in Figure 1-6 or 1-7.
1.7.2.3.1.2 If applicable, set the integrated test set to 2 sigma to take readings.
1.7.2.3.1.3 Place the degaussed tape on the machine and select the tape speed to be used.
1.7.2.3.1.4 Set up equipment and record test signal in accordance with manufacturer's
instruction manual.
1.7.2.3.1.5 Depending upon the operational speed selected, record a sufficient length of tape
at the beginning, middle, and end of the reel to provide adequate time for tape speed servo
acquisition and lockup before performance measurements.
1.7.2.3.1.6 Rewind the recorded tape and place the recorder/reproducer in the reproduce
mode. Select the transport tape servo system for the tape mode.

1-12
Figure 1-6. Time base error measurement (see test 1.7.2).
RECORD/
REPRODUCE
SYSTEM
UNDER
TEST
TACH
MODE
RECORD/
REPRODUCE
SYSTEM
UNDER
TEST
TACH
MODEBAND-PASS
FILTER
fc + 5%OSCILLO-SCOPE
RECORD
REFERENCE OSCILLATOR OUTPUT
CONTROL TRACK RECORD
f c
OPERATOR ESTIMATES TIME INTERVAL
CONTAINING THE REQUIRED PROPOR-
TION OF AXIS CROSSINGS.
REPRODUCE
REFERENCE OSCILLATOR OUTPUT
REPRODUCE
CONTROL TRACK
EXT TRIG IN
Y AXIX

1-13
Figure 1-7. Time base error measurement using integrated commercially available
test set (see test 1.7.2).
10
20
30
.
.
.Statistical Voltmeter
Measurement PP
TBE
Input
Reference
Output
Recorder/
Reproducer
under test.
Use prerecorded tape with
recorder in playback under
tape servo.
Read TBE directly from meter
in the 2 sigma.
Follow manufacturer's recom-
mendation for proper use of
test set.
Notes
Reference Oscil-
lator Output
Reproduce control
track output
Integrated Test Set
TBE
Input

1-14
1.7.2.3.1.7 If the integrated test set is used, follow manufacturer's instruction for determining
the TBE. If an oscilloscope is to be used, adjust the oscilloscope time base and trigger to display
a single leading edge with the TBE component occupying a minimum of 1 cm (horizontal).
1.7.2.3.1.8 When using an oscilloscope, set the vertical gain so that the upper and lower
portions of the waveform touch the outer graticule lines. Adjust the scope intensity to a level
which prevents trace blooming, but still displays individual transient excursions. Optional band-
pass filtering of the reproduced waveform serves to remove all noise components except those
existing within the narrow band.
1.7.2.3.2 Data Reduction. Observe or photograph the CRT display over 10-second sample
periods at the beginning, middle, and end of the reel. Convert the TBE displayed on the
oscilloscope to units of time based upon the horizontal width of the solid portion of the display.
Ignore crossovers occurring not more than 5 percent of the time. If integrated test set is used,
observe the peak-to-peak measurement on statistical voltmeter. Record the results.
1.7.3 Interchannel Time Displacement Error Test (1) and (2).
1.7.3.1 Purpose. This test measures the Interchannel Time Displacement Error (ITDE)
(dynamic skew) of simultaneous events recorded on separate tracks.
1.7.3.2 Test Equipment. Two procedures are described in this section. One procedure uses a
commercially available test instrument, while the other procedure uses a signal generator and an
oscilloscope. The multifunction test instrument includes an oscillator, carrier band-pass filter,
frequency discriminator, output band-pass filter, and statistical voltmeter. The equipment
provides direct reading measurements and is designed to read peak-to-peak amplitude and to
ignore occasional random peaks provided the value read is exceeded less than 5 percent of the
time; that is, on a 2-sigma setting, the peak-to-peak measurand (ITDE) is within the value read
95 percent of the time. If the oscilloscope method is used, the oscilloscope must be a dual
channel model with a bandwidth of at least 100 MHz to provide sufficient resolution.
1.7.3.3 Test Method. To measure ITDE, an oscillator frequency is recorded on two tracks
and subsequently reproduced. The time base of the reproduced signal from the two tracks is then
compared.
1.7.3.3.1 Procedure. Measurements are conducted at one or more points of tape supply reel
loading for the specifed tape speed. Results are expressed as the number of microseconds
difference between the reproduced signals.
1.7.3.3.1.1 Connect the equipment as shown in Figure 1-8 or 1-9.
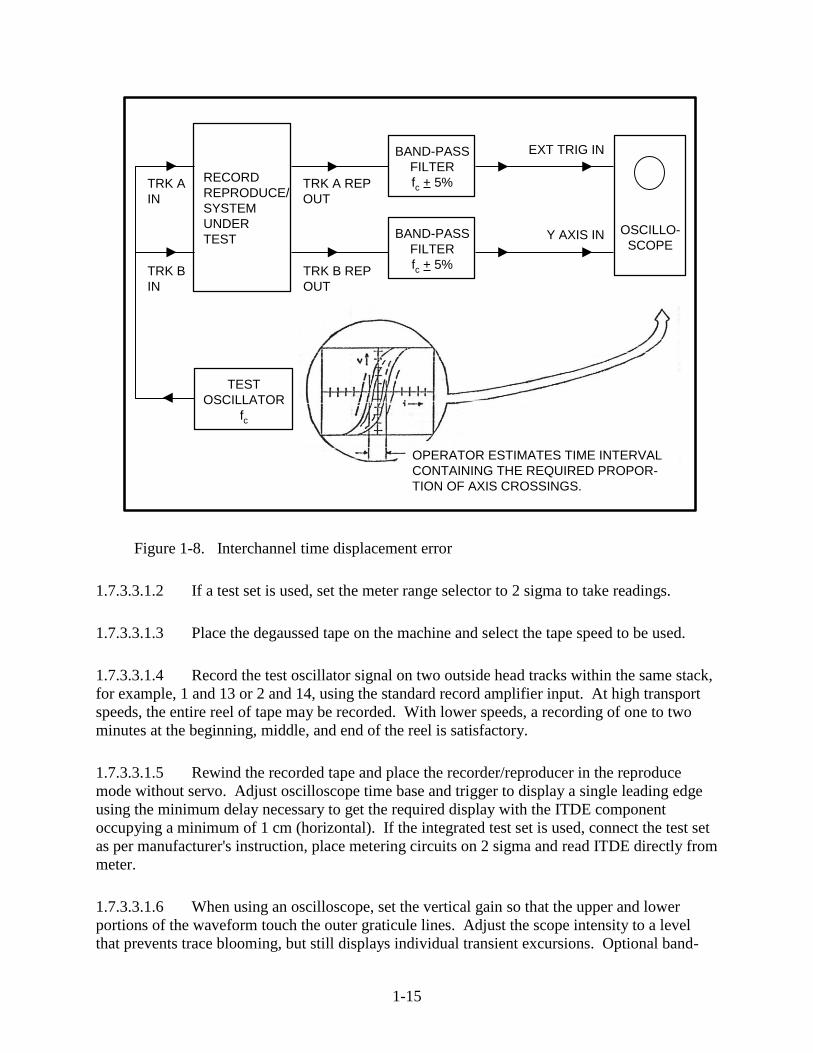
1-15
Figure 1-8. Interchannel time displacement error
1.7.3.3.1.2 If a test set is used, set the meter range selector to 2 sigma to take readings.
1.7.3.3.1.3 Place the degaussed tape on the machine and select the tape speed to be used.
1.7.3.3.1.4 Record the test oscillator signal on two outside head tracks within the same stack,
for example, 1 and 13 or 2 and 14, using the standard record amplifier input. At high transport
speeds, the entire reel of tape may be recorded. With lower speeds, a recording of one to two
minutes at the beginning, middle, and end of the reel is satisfactory.
1.7.3.3.1.5 Rewind the recorded tape and place the recorder/reproducer in the reproduce
mode without servo. Adjust oscilloscope time base and trigger to display a single leading edge
using the minimum delay necessary to get the required display with the ITDE component
occupying a minimum of 1 cm (horizontal). If the integrated test set is used, connect the test set
as per manufacturer's instruction, place metering circuits on 2 sigma and read ITDE directly from
meter.
1.7.3.3.1.6 When using an oscilloscope, set the vertical gain so that the upper and lower
portions of the waveform touch the outer graticule lines. Adjust the scope intensity to a level
that prevents trace blooming, but still displays individual transient excursions. Optional band-
BAND-PASS
FILTER
fc + 5%
OSCILLO-
SCOPEBAND-PASS
FILTER
fc + 5%
RECORD
REPRODUCE/
SYSTEM
UNDER
TEST
TRK A
IN
TRK B
IN
TRK A REP
OUT
TRK B REP
OUT
EXT TRIG IN
Y AXIS IN
TEST
OSCILLATOR
fc
OPERATOR ESTIMATES TIME INTERVAL
CONTAINING THE REQUIRED PROPOR-
TION OF AXIS CROSSINGS.

1-16
pass filtering of the reproduced waveform serves to remove all noise components except those
existing within this narrow band.
Figure 1-9. Interchannel time displacement error (skew) measurement using integrated
commercially available test set (see test 1.7.3)
1.7.3.3.2 Data Reduction. Observe or photograph the CRT display over 10-second sample
periods over the entire length of tape or, at a minimum, at the beginning, middle, and end of the
reel. Convert the ITDE displayed on the oscilloscope to units of time based upon the horizontal
width of the solid portion of the display. Ignore crossovers occurring not more than 5 percent of
the time. If integrated test set is used, observe the peak-to-peak measurement on statistical
voltmeter. Record the results.
10
20
30
.
.
.Statistical Voltmeter
Measurement PP
Skew
Input
Reference
Output
Recorder/
Reproducer
under test.
Read skew directly from meter.
Follow manufacturer’s
recommendation for proper
use of test set.
Notes
Trk. “A” out
Trk. “B” out
Integrated Test Set
Skew
Input
Trk. “A” in
Trk. “B” out
1-17
1.8 Direct Record System Tests
1.8.1 General. This section defines a series of test procedures to characterize the performance
of direct record systems. Not all of the procedures may be required for a series of tests, but for
those tests used, the bias and record level adjustments may be performed only once during a
sequence of tests. Bias and record level settings are normally established at the highest operating
tape speed (refer to manufacturer's instructions). The procedures defined include tests for bias
and record level, frequency response, signal-to-noise ratio (SNR), intermodulation distortion
(IMD), cross talk, bias leakage, second harmonic distortion, multispeed record level, record
transfer characteristics, and group delay variation and transient response measurements.
1.8.2 Bias, Record Level and Second Harmonic Distortion Tests (1) and (2).
1.8.2.1 Purpose. These tests establish bias and record level settings as specified in Record
and Reproduce Parameters, Table 6-1, Chapter 6 of IRIG Standard 106, and measure second
harmonic distortion.
1.8.2.2 Test Equipment.
1.8.2.2.1 Oscillator. Sinusoidal oscillator or signal generator must meet impedance and level
requirements of the recorder/reproducer under test. Noise, distortion, and spurious components
should be below 0.2 percent over the frequency range under test.
1.8.2.2.2 Voltmeter. True root mean square (rms) reading voltmeter calibrated to an accuracy
of +0.5 dB over frequency range under test.
1.8.2.2.3 Wave Analyzer (Frequency Selective Voltmeter). Calibrated to an accuracy of +0.5
dB with a dynamic range of at least 60 dB.
1.8.2.3 Test Method.
1.8.2.3.1 Setup. Connect the test equipment, instruments, and loads as shown in Figure 1-10.
The optional band-pass filter is not used.
1.8.2.3.2 Conditions. Refer to the manufacturer's instructions for details pertaining to
adjustments and to procedural steps.
1.8.2.3.3 Procedure.
1.8.2.3.3.1 With the signal source set to the record-bias set frequency and input level set 5 to
6 dB below standard record level, record and simultaneously reproduce a tape and adjust the bias
to the proper overbias level indicated in Table 6-1 of IRIG 106.

1-18
Figure 1-10. Frequency response and signal-to-noise ration (see tests 1.8.2,
1.8.3, and 1.8.4).
1.8.2.3.3.2 Before completing this step, be sure the selected 1evel is below possible tape
saturation at all three frequencies: fundamental frequency, second, and third harmonics. Record
and reproduce sine wave signals of frequencies equal to the record level set frequency. Then at
two and three times the record level, set frequency at the input level used to establish standard
record level. Check the three reproduced output levels and compensate for any differences by
equalizer adjustment or by mathematically adjusting subsequent computations to within +1 dB of
the record level set frequency output.
1.8.2.3.3.3 To establish the standard record level, set the signal source frequency to the
record level set frequency and adjust the record amplifier until 1 percent (-40dB) third harmonic
distortion is indicated by the wave or spectrum analyzer.
1.8.2.3.3.4 Measure and log the second harmonic distortion level indicated by the wave or
spectrum analyzer.
1.8.2.3.4 Data Reduction. Not applicable.
1.8.3 Frequency Response (Direct Recording) Test (1) and (2).
1.8.3.1 Purpose. This test measures amplitude variations within the passband of the
recorder/reproducer system.
1.8.3.2 Test Equipment. Refer to equipment listed in subparagraph 1.8.2.2 and Figure 1-10.
1.8.3.3 Test Method.
OSCILLATOR RECORDER/REPRODUCERBAND-PASS
FILTER
WAVEANALYZER
V1
V2
. .
.
LOAD LOAD

1-19
1.8.3.3.1 Setup. Connect the test equipment, instruments, and loads as indicated in
Figure 1-10.
1.8.3.3.2 Conditions. No external band-pass filter is used in this test.
1.8.3.3.3 Procedure.
1.8.3.3.3.1 Perform the initial adjustment of bias and record level as described in
subparagraph 1.8.2.4
1.8.3.3.3.2 With the signal source set to produce standard record level at the record level set
frequency, observe the actual input level (V1). This voltage shall be considered the 0-dB input
reference.
1.8.3.3.3.3 Record and reproduce a tape and observe the reproduce output level (V2).
1.8.3.3.3.4 Record and reproduce a tape, varying the input frequency over the specified
frequency band while maintaining input (V1) at the reference level. (See Record and Reproduce
Parameters, Table 6-1, Chapter 6 of IRIG Standard 106.)
1.8.3.3.4 Data Reduction. Observe and log (in dB) the maximum and minimum excursions of
the reproduce output level (V2) with respect to the reading obtained in subparagraph 1.8.3.3.3.3.
1.8.4 Signal-to-Noise Ratio Tests. Passbands obtained in test 1.8.3 and this test may not be
identical and should not be directly compared. Filter characteristics should be known or verified
before running the SNR test.
1.8.4.1 Purpose. This test determines the ratio of standard record level rms signal plus noise
output voltage to the zero modulation rms noise and spurious signal output voltage (the noise
arising when reproducing a tape recorded with no signal into the record head, but with bias
energized). Measurements shall be conducted while simultaneously recording and reproducing
with bias.
1.8.4.2 Test Equipment. Refer to Figure 1-10.
1.8.4.3 Test Method.
1.8.4.3.1 Wide Band SNR (1) and (2).
1.8.4.3.1.1 Setup. Connect the test equipment, instruments, and loads as shown in Figure 1-
10 using a band-pass filter like that listed in subparagraph 1.8.2.2.
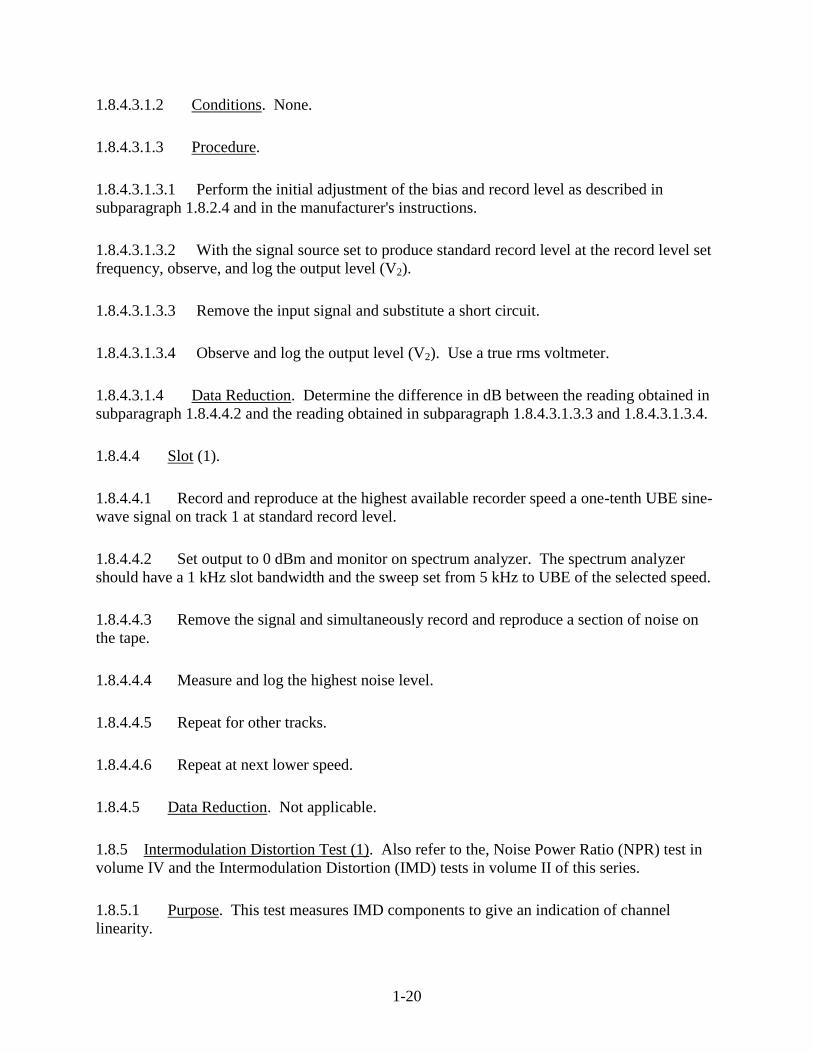
1-20
1.8.4.3.1.2 Conditions. None.
1.8.4.3.1.3 Procedure.
1.8.4.3.1.3.1 Perform the initial adjustment of the bias and record level as described in
subparagraph 1.8.2.4 and in the manufacturer's instructions.
1.8.4.3.1.3.2 With the signal source set to produce standard record level at the record level set
frequency, observe, and log the output level (V2).
1.8.4.3.1.3.3 Remove the input signal and substitute a short circuit.
1.8.4.3.1.3.4 Observe and log the output level (V2). Use a true rms voltmeter.
1.8.4.3.1.4 Data Reduction. Determine the difference in dB between the reading obtained in
subparagraph 1.8.4.4.2 and the reading obtained in subparagraph 1.8.4.3.1.3.3 and 1.8.4.3.1.3.4.
1.8.4.4 Slot (1).
1.8.4.4.1 Record and reproduce at the highest available recorder speed a one-tenth UBE sine-
wave signal on track 1 at standard record level.
1.8.4.4.2 Set output to 0 dBm and monitor on spectrum analyzer. The spectrum analyzer
should have a 1 kHz slot bandwidth and the sweep set from 5 kHz to UBE of the selected speed.
1.8.4.4.3 Remove the signal and simultaneously record and reproduce a section of noise on
the tape.
1.8.4.4.4 Measure and log the highest noise level.
1.8.4.4.5 Repeat for other tracks.
1.8.4.4.6 Repeat at next lower speed.
1.8.4.5 Data Reduction. Not applicable.
1.8.5 Intermodulation Distortion Test (1). Also refer to the, Noise Power Ratio (NPR) test in
volume IV and the Intermodulation Distortion (IMD) tests in volume II of this series.
1.8.5.1 Purpose. This test measures IMD components to give an indication of channel
linearity.
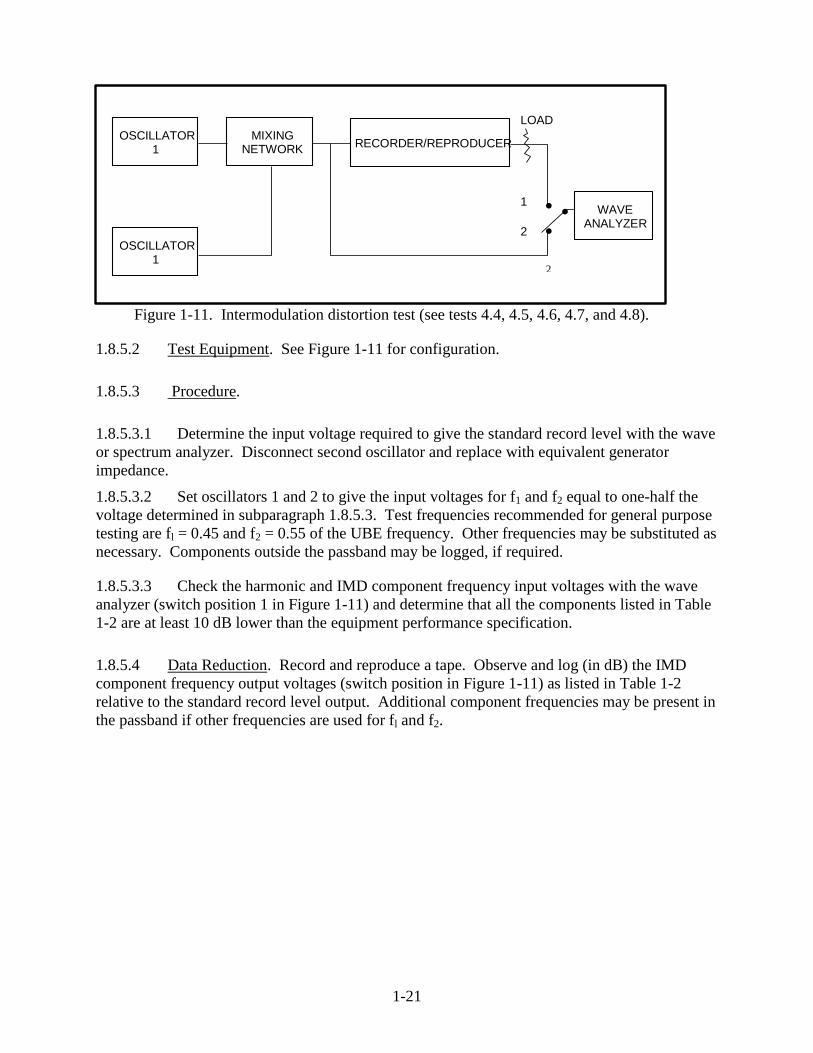
1-21
Figure 1-11. Intermodulation distortion test (see tests 4.4, 4.5, 4.6, 4.7, and 4.8).
1.8.5.2 Test Equipment. See Figure 1-11 for configuration.
1.8.5.3 Procedure.
1.8.5.3.1 Determine the input voltage required to give the standard record level with the wave
or spectrum analyzer. Disconnect second oscillator and replace with equivalent generator
impedance.
1.8.5.3.2 Set oscillators 1 and 2 to give the input voltages for f1 and f2 equal to one-half the
voltage determined in subparagraph 1.8.5.3. Test frequencies recommended for general purpose
testing are fl = 0.45 and f2 = 0.55 of the UBE frequency. Other frequencies may be substituted as
necessary. Components outside the passband may be logged, if required.
1.8.5.3.3 Check the harmonic and IMD component frequency input voltages with the wave
analyzer (switch position 1 in Figure 1-11) and determine that all the components listed in Table
1-2 are at least 10 dB lower than the equipment performance specification.
1.8.5.4 Data Reduction. Record and reproduce a tape. Observe and log (in dB) the IMD
component frequency output voltages (switch position in Figure 1-11) as listed in Table 1-2
relative to the standard record level output. Additional component frequencies may be present in
the passband if other frequencies are used for fl and f2.
2
.
.
OSCILLATOR1
RECORDER/REPRODUCER
OSCILLATOR1
MIXINGNETWORK
WAVEANALYZER
.1
2
LOAD

1-22
TABLE 1-2. IMD TEST FREQUENCIES
Component Frequency*
f1 0.45
f2 0.55
f2-f1 0.10
2f1-f2 0.35
2f2-f1 0.65
2f1 0.90
f1+f2 1.00
*The second column gives test frequencies for general use as a fraction of the UBE (f=1.0).
1.8.6 Crosstalk Test (1).
1.8.6.1 Purpose. This test measures the cross-talk signal level from one channel to all other
channels.
1.8.6.2 Test Equipment. Refer to Figure 1-11; however, delete oscillator 2, the mixing
network and the bypass signal line to the wave analyzer.
1.8.6.3 Test Method.
1.8.6.3.1 Setup. Connect the test equipment as indicated in Figure 1-11 and subparagraph
1.8.6.2.
1.8.6.3.2 Conditions. None.
1.8.6.3.3 Procedure.
1.8.6.3.3.1 Record at the standard record level and reproduce at the highest available tape
speed on a 5 kHz sine wave on each track. Set the output of each track to 0 dB.
1.8.6.3.3.2 Record a 5 kHz sine wave at standard record level on track 1 with the inputs to all
other tracks shorted.
1.8.6.3.3.3 Rewind and reproduce a signal on track 1 while logging output of other tracks as
measured on the wave or spectrum analyzer.

1-23
1.8.6.3.3.4 Repeat using other tracks as references.
1.8.6.3.3.5 Repeat using UBE record frequency at the highest available tape speed.
1.8.6.3.3.6 Change to the next lowest tape speed and sine-wave frequency to 2 kHz. Repeat
subparagraphs 1.8.6.4.1 through 1.8.6.4.5.
1.8.6.3.4 Data Reduction. Not applicable.
1.8.7 Bias Leakage Test (1).
1.8.7.1 Purpose. This test determines the level of bias leakage during the record mode.
1.8.7.2 Test Equipment. Refer to Figure 1-11; however, delete oscillator 2, the mixing
network and the bypass signal line to the wave analyzer.
1.8.7.3 Test Method.
1.8.7.3.1 Setup. Connect the test equipment as shown in Figure 1-11 with the modifications
detailed in subparagraph 1.8.7.2.
1.8.7.3.2 Conditions. None.
1.8.7.3.3 Procedure.
1.8.7.3.3.1 Load a bulk-erased tape of the appropriate type into the recorder.
1.8.7.3.3.2 At the highest available tape speed, record and reproduce the record level set
frequency on at least one odd-numbered and one even-numbered tape track. Terminate both
input and output in rated impedances and adjust input and output levels to 1 V rms.
1.8.7.3.3.3 Reduce the input level to zero while continuing to record only the bias signal.
With a wave analyzer, measure the bias leakage voltage at the following circuit points:
Odd track output signal line, high side to low side.
Even track output signal line, high side to low side.
Odd track output signal line, high side to a convenient front panel chassis ground.
Chassis ground must be properly connected to the local instrumentation
ground during the test.
NOTE

1-24
Even track output signal line, high side to a convenient front panel chassis ground.
Odd track output signal line, low side to chassis ground.
Even track output signal line, low side to chassis ground.
1.8.7.3.4 Data Reduction. Not applicable.
1.8.8 Multispeed Record Level Test (1).
1.8.8.1 Purpose. This test determines the change in the standard record level setting (third
harmonic distortion level) as a function of tape speed.
1.8.8.2 Test Equipment. Signal oscillator and wave analyzer.
1.8.8.3 Test Method.
1.8.8.3.1 Setup. Connect the test equipment as shown in Figure 1-11; however, delete
oscillator 2, the mixing network and bypass signal line. Connect the reproduced signal to the
wave analyzer as shown.
1.8.8.3.2 Conditions. None.
1.8.8.3.3 Procedure.
1.8.8.3.3.1 Load a bulk-erased tape of the type recommended onto the recorder.
1.8.8.3.3.2 At the highest recorder speed, record a one-tenth UBE 1 V rms signal at a
standard record level (1 percent third harmonic distortion). Adjust the reproduce level for 1 V
rms.
1.8.8.3.3.3 Reduce speed one setting.
1.8.8.3.3.4 Record a one-tenth UBE 1 V rms signal. Do not adjust the record level. Be sure
that the reproduced output is 1 V rms and adjust if necessary.
1.8.8.3.3.5 Measure the record level. The third harmonic distortion must be within the range
specified by the user (0.7 to 1.3 percent is suggested).
1.8.8.3.3.6 Repeat subparagraphs 1.8.8.3.3.3 through 1.8.8.3.3.5 until the lowest required
speed has been tested.
1.8.8.3.4 Data Reduction. Not applicable.

1-25
1.8.9 Record Transfer Characteristic Test (1).
1.8.9.1 Purpose. This test determines that record head losses at high frequencies are
compensated by the record amplifier. Low frequency signals are recorded and reproduced at
one-eighth the highest tape speed on the machine. High frequency signals are then recorded at
the highest tape speed on the machine and reproduced at the lower tape speed. Frequencies
recorded in the two tests are chosen to be at the same wave length on the tape. The intent of the
procedure is to eliminate the variation in response of the tape, the frequency losses in the
reproduce system, and azimuth misalignments (see Table 6-1, IRIG Standard 106).
1.8.9.2 Test Equipment. Signal oscillator and voltmeter.
1.8.9.3 Test Method.
1.8.9.3.1 Setup. Connect the test equipment as shown in Figure 1-11; however, delete band-
pass filter bypass, band-pass filter, load 2, and wave or spectrum analyzer. Connect the
reproduced output to the voltmeter.
1.8.9.3.2 Conditions. None.
1.8.9.3.3 Procedure.
1.8.9.3.3.1 Load a bulk-erased tape of the appropriate type onto the recorder.
1.8.9.3.3.2 Record and reproduce at one-eighth the highest tape speed of the machine
frequencies of 0.02, 0.1, 0.5, 0.8, and 1.0 times the maximum specified bandwidth for that speed.
The input is set to the standard record level. On recorder/reproducers with azimuth adjustable
reproduce heads, adjust the azimuth for the maximum output of the UBE frequency. Note the
absolute output level of all the frequencies.
1.8.9.3.3.3 Rewind and erase the tape. Frequencies eight times as high as those used in
subparagraph 1.8.9.3.3.2 should be recorded at the highest speed of the machine. Take
reasonable care to record the same wavelength signals at the same place and in the same
direction on the tape as in subparagraph 1.8.9.3.3.2. Each frequency should be recorded
approximately one-eighth as long as in subparagraph 1.8.9.3.3.2.
1.8.9.3.3.4 Reproduce the tape recorded in subparagraph 1.8.9.3.3.3 at one-eighth the highest
tape speed of the machine. On machines with azimuth adjustable reproduce heads, adjust
azimuth for maximum UBE. Note the absolute output level of all frequencies.
1.8.9.3.4 Data Reduction. The deviation from ideal recording is defined as the difference
between the response curves obtained in subparagraphs 1.8.9.3.3.2 and 1.8.9.3.3.4 when the
curves are mathematically adjusted to have the 0.02 frequency point in common.

1-26
1.8.10 Eye Pattern (1).
1.8.10.1 Purpose. The eye pattern test is useful for determining the distortion of a pulse code
modulation (PCM) signal. The distortion can result in jitter in the time crossings and reduction
in the signal amplitude. The distortion is typically caused by a combination of non-constant
group delay and filtering.
1.8.10.2 Test Equipment. Pseudo-noise (PN) generator, oscilloscope, bit synchronizer, plotter,
or oscilloscope camera (optional).
1.8.10.3 Test Method.
1.8.10.3.1 Setup. Connect test equipment as shown in Figure 1-12.
1.8.10.3.2 Conditions. This test may be performed during the record tape pass or during a
separate tape pass. All cables must be terminated in the proper impedance.
1.8.10.3.3 Procedure. Set the bit rate and code of the PN generator and bit synchronizer to the
desired values. With wideband recording, the maximum recommended packing densities are 25
kb/in for RNRZ-L and 15 kb/in for Bi-Phase-L. The maximum recommended packing densities
for double density recording are 50 kb/in for RNRZ-L and 30 kb/in for Bi-Phase-L. Set the
oscilloscope to trigger on the clock signal from the bit synchronizer. Start the recorder and
adjust the oscilloscope amplitude and time base controls to produce a display similar to those in
Figures 1-13, 1-14, 1-15, and 1-16. The signals shown in Figures 1-13 and 1-14 had bit error
rates of essentially zero. The signals shown in Figures 1-15 and 1-16 had approximately 1 error
per 100,000 bits.
Figure 1-12. Eye pattern test setup.
PN
GeneratorRecorder Oscilloscope
Bit Synchronizer
Clock

1-27
Figure 1-13. Good NRZ eye pattern
Figure 1-14. Good bi-phase eye pattern.
Figure 1-15. Poor NRZ eye pattern.

1-28
Figure 1-16. Poor bi-phase eye pattern.
Measure the peak-to-peak time jitter, nominal peak-to-peak amplitude, and peak-to-peak
amplitude at the center of the eye opening. Record these values on a Data Sheet 1-8. If the
appropriate equipment is available, plot or photograph the oscilloscope display and attach to the
Data Sheet.
1.8.10.3.4 Data Reduction. Multiply the time jitter by the bit rate and multiply this result by
100 to get the peak-to-peak jitter as a percentage of the bit period. Divide the minimum eye
opening by the nominal eye opening and multiply by 100 to get the percentage eye opening. For
example, in Figure 1-14 the peak-to-peak jitter is approximately 12 percent of a bit period and
the eye is approximately 80 percent open. The corresponding values for Figure 1-16 are 26
percent and 17 percent, respectively.

1-29
DATA SHEET 1-1 DIRECT RECORD SYSTEM TESTS
Test: 1.8.10 Eye Pattern
Manufacturer Model Serial No.
Test Personnel Date
Tape speed: ____________ inches per second
Recording code: ____________
Bit Rate: ____________ Megabits per second
Zero crossing time jitter: ____________ microseconds (peak-to-peak)
Time jitter x bit rate x 100: ____________ %
Nominal amplitude: ____________ volts (peak-to-peak)
Minimum eye opening: ____________ volts (peak-to-peak)
100 x minimum/nominal: ____________ %
(Attach photograph or plot if available)
1-30
1.9 FM System Tests
1.9.1 General. All FM systems tests except drift and dc linearity are run through the tape.
Allow the equipment to warm up for the specified length of time. In the absence of a warm-up
specification, the warm-up time is in accordance with the manufacturer's recommendation. All
percentages are referred to full positive to negative deviation as 100 percent. This procedure is
intended to test those systems listed in Dimensions - Recorded Tape Format, 14 Tracks In-Line
on 25.4 mm (lin.) Widetape, Table 6-4, Chapter 6 of IRIG Standard 106. The FM tests in this
chapter include deviation, center frequency, and polarity; frequency response; SNR; distortion;
spurious components; dc linearity; dc drift at center frequency; multispeed reproduce transfer
levels; and group delay variation and transient response.
1.9.2 Deviation, Center Frequency And Polarity Tests (1) and (2).
1.9.2.1 Purpose. These tests ensure that the center frequency is correctly set, that a maximum
input signal level produces full deviation in carrier frequency, and that a corresponding output
voltage (of known polarity) is present at the output of the reproduce amplifiers.
1.9.2.2 Test Equipment. Frequency counter, signal source (dc), volt-meter (dc), and
oscilloscope.
1.9.2.3 Test Method.
1.9.2.3.1 Setup. Connect the test equipment as shown in Figure 1-17.
1.9.2.3.2 Conditions. None.
1.9.2.3.3 Procedure. Check the center frequency by shorting the input of the amplifier and
monitoring the carrier frequency with an electronic counter. Adjust the center frequency to
conform within 1.0 percent of the values specified in Table 6-8, FM Record Parameters, Chapter
6, IRIG Standard 106. The deviation and polarity shall be checked as follows:
1.9.2.3.3.1 Apply the maximum positive dc input signal level and verify a full positive
deviation in carrier frequency and a corresponding positive output voltage from the reproduce
amplifiers.
1.9.2.3.3.2 Apply the negative peak dc input signal and verify a full negative deviation in
carrier frequency and a corresponding negative output voltage from the reproduce amplifier.

1-31
Figure 1-17. FM system test equipment setup (see tests 1.7.2, 1.9.3, 1.9.4, 1.9.5, 1.9.6,
1.9.7, and 1.9.8).
Diagram includes equipment required for all FM tests (except group
delay variation and transient response tests). Refer to test equipment
section of specific test for required equipment.
1.9.2.3.4 Data Reduction. Not applicable.
1.9.3 Frequency Response Test (1) and (2).
1.9.3.1 Purpose. This test ensures that the frequency response of a channel is correct.
1.9.3.2 Test Equipment. Sine-wave generator, frequency counter, true rms voltmeter, and
oscilloscope.
1.9.3.3 Test Method.
1.9.3.3.1 Setup. Connect the test equipment as shown in Figure 1-17.
1.9.3.3.2 Conditions. None.
1.9.3.3.3 Procedure.
SINE-WAVE
GENERATOR
AC/DC SIGNAL
SOURCE
LINEAR
MIXERRECORDER/
REPRODUCER
FREQUENCY
COUNTER
TRUE RMS
VOLTMETER
DC VOLTMETER
WAVE
ANALYZER
OSCILLOSCOPE
...
......
.
.
RLRIN
NOTE

1-32
1.9.3.3.3.1 Using a 0.1 sine wave reference frequency signal as specified in Table 6-8,
Chapter 6 of IRIG Standard 106, measure frequency response by maintaining the input sine-
wave signal at a constant amplitude (100 percent carrier modulation level at the reference
frequency).
1.9.3.3.3.2 Monitor the reproduce output signal amplitude at various frequencies in the
passband specified in Table 6-8 Chapter 6 of IRIG Standard 106 including the maximum
modulation frequency.
1.9.3.3.4 Data Reduction. Observe the maximum and minimum excursions of the reproduced
output level and log in dB. See appendix III-A, paragraph 1.10.
1.9.4 Signal-To-Noise Ratio Test (1) and (2).
1.9.4.1 Purpose. This test determines the SNR at the reproducer output.
1.9.4.2 Test Equipment. True rms voltmeter, sine-wave generator, frequency counter, and
oscilloscope.
1.9.4.3 Test Method.
1.9.4.3.1 Setup. Connect the test equipment as shown in Figure 5-1.
1.9.4.3.2 Conditions. No external filter will be used in the measurements. The true rms
voltmeter employed must be down no more than 3 dB at 10 Hz.
1.9.4.3.3 Procedure. Measure SNR by recording a 0.1 UBE sine-wave signal at a sufficient
level to provide full deviation. The input to the amplifier is then shorted and the carrier recorded
on the tape. The SNR measurements may be made simultaneously in the record/reproduce mode
of operation. The SNR is defined as the ratio of the reproduced output signals measured under
the above conditions with a true rms voltmeter.
1.9.4.3.4 Data Reduction. Not applicable.
1.9.5 Distortion Test (1) and (2).
1.9.5.1 Purpose. This test measures the harmonic distortion content and the intermodulation
distortion components at the reproducer output.
1.9.5.2 Test Equipment. Wave analyzer, sine-wave generator, true rms voltmeter, frequency
counter, and linear mixer.

1-33
1.9.5.3 Test Method.
1.9.5.3.1 Setup. Connect the test equipment as shown in Figure 1-17.
1.9.5.3.2 Conditions. None.
1.9.5.3.3 Procedure.
1.9.5.3.3.1 Single Component Distortion.
1.9.5.3.3.1.1 Record a 0.1 UBE sine wave signal at full deviation.
1.9.5.3.3.1.2 Measure the output of the FM reproduce amplifier with a spectrum analyzer or a
wave analyzer. Measure second, third, and root-sum-square total level of harmonic distortion
components.
1.9.5.3.3.2 Intermodulation Distortion.
1.9.5.3.3.2.1 Record two mixed signals, each at a level sufficient to provide one-half full
deviation of the carrier.
1.9.5.3.3.2.2 Monitor the reproduced output with a spectrum analyzer or a wave analyzer and
measure the IMD components of (f2 + f1), (2f1 - f2) and (2f2 - fl) as a percent of the full deviation
rms output voltage. Test frequencies are 45 and 55 percent of the maximum modulation
frequency specified in Table 6-8, Chapter 6 of IRIG Standard 106.
1.9.5.3.4 Data Reduction. Not applicable.
1.9.6 Spurious Component Test (1).
1.9.6.1 Purpose. This test measures the spurious components at the reproducer output.
1.9.6.2 Test Equipment. Wave analyzer, sine-wave generator, true rms voltmeter, and
frequency counter.
1.9.6.3 Test Method.
1.9.6.3.1 Setup. Connect the test equipment as shown in Figure 1-17.
1.9.6.3.2 Conditions. None.

1-34
1.9.6.3.3 Procedure.
1.9.6.3.3.1 Measure spurious components by recording the maximum modulation frequency
specified in Table 6-8, Chapter 6 of IRIG Standard 106, at a level that provides full deviation.
1.9.6.3.3.2 Monitor the reproduced output with a wave analyzer.
1.9.6.3.3.3 Record the value of the largest spurious component.
1.9.6.3.4 Data Reduction. Not applicable.
1.9.7 Linearity Tests (dc) (1).
1.9.7.1 Purpose. These tests measure the linearity of FM record and reproduce amplifiers.
1.9.7.2 Test Equipment. Signal source (dc), frequency counter, and voltmeter (dc).
1.9.7.3 Test Method.
1.9.7.3.1 Setup. Connect the test equipment as shown in Figure 1-17.
1.9.7.3.2 Conditions. None.
1.9.7.3.3 Procedure. In the following measurements, frequency is used as the independent
variable, while input voltage for record amplifiers and output voltage for reproduce amplifiers
are the measured dependent variables. The following terms are defined as:
fo ......... - Channel center frequency
fu ......... - Upper band edge frequency (full positive deviation)
fl .......... - Lower band edge frequency (full negative deviation)
fx ......... - Frequency at fraction X of full deviation
vo ......... - Voltage input or output at center
vu ......... - Voltage input or output at upper level
vL ........ - Voltage input or output at lower level
vx ......... - Voltage measured at fx
x - Fraction of full channel deviation
.............. (voltage or frequency) –l< x <1
e .......... - Nonlinearity (linearity error)
Y ......... - Percent nonlinearity
Voltages should be measured to an acuracy of 0.01 percent.
Frequencies should be measured to at least 0.05 percent resolution.
NOTE

1-35
1.9.7.3.3.1 FM Record Amplifier Linearity.
1.9.7.3.3.1.1 Set up the amplifier per manufacturer's instructions to give output frequency f0 at
selected input voltage v0 (usually 0 volts) and output frequency fL at the selected dc input voltage
v1.
1.9.7.3.3.1.2 At as many points throughout the range of input voltage as are required, adjust
input voltage to produce output frequency
fx = fo + x(fo – fL).
Measure and log input voltage.
1.9.7.3.3.1.3 Calculate error
ex = vin - (vo – xvL).
Record ex.
Y = (emax/(vu – vL)x 100%.
1.9.7.3.3.1.4 FM Reproduce Amplifier Linearity.
1.9.7.3.3.1.5 Set up reproduce amplifier per manufacturer's instructions to give output vo
(usually 0 volts) at input frequency fo and selected output voltage vL at input frequency fL.
1.9.7.3.3.1.6 At as many points throughout the range of frequencies from fL, to fu as are
required, input frequency
fx = fo + x (fo – fL).
Measure and log output voltages. Calculate
ex = vout - (vo – xvL).
Record ex.
Y = (emax/vu – vL) x 100%
1.9.7.3.4 Data Reduction. Plot ex versus x for record or reproduce amplifier data or both.
Points on these curves will be inside a parallelogram bounded by x = +1 and a height equal to the
peak-to-peak error. Several different types of output versus input and e versus x curves are
plotted in Figure 1-18 to illustrate how the error computations and limits are applied.
1.9.8 Drift (dc) at Center Frequency Test (1).

1-36
2
X
1.9.8.1 Purpose. This test measures center frequency drift.
1.9.8.2 Test Equipment. Frequency counter and voltmeter (dc).
1.9.8.3 Test Method.
1.9.8.3.1 Setup. Connect the test equipment as shown in Figure 1-17.
1.9.8.3.2 Conditions. None.
1.9.8.3.3 Procedure.
1.9.8.3.3.1 Record Amplifier Center Frequency Drift (for systems without reproduce
capability).
1.9.8.3.3.1.1 Short the input to the record amplifier.
1.9.8.3.3.1.2 Monitor the output frequency versus other specified parameters such as time,
temperature, and line voltage.
1.9.8.3.3.2 System Zero Drift (including procedure for measuring record amplifier zero drift).
1.9.8.3.3.2.1 Proceed as in subparagraph 1.10.3.3.1.
1.9.8.3.3.2.2 Monitor the dc output voltage change versus other parameters as specified such
as time, temperature, and line voltage. Include all changes in the frequency band dc to 0.5 Hz.
1.9.8.3.3.2.3 Interpret an x percent peak-to-peak specification as percent.
1.9.8.3.4 Data Reduction. Not applicable.
1.9.9 Multispeed Reproduce Transfer Levels Test (1).
1.9.9.1 Purpose. This test measures output amplitude variations as a function of reproducer
tape speed.
1.9.9.2 Test Equipment. Source (dc), voltmeters (dc), sine-wave oscillator, and true rms
voltmeter.
1.9.9.3 Test Method.

1-37
1.9.9.3.1 Setup. Connect the test equipment as, shown in Figure 1-18.
1.9.9.3.2 Conditions. None.
1.9.9.3.3 Procedure.
1.9.9.3.3.1 Measure multispeed reproduce transfer levels, by recording the highest carrier
frequency for which the system is equipped as specified in the Table 6-8, Chapter 6 of IRIG
Standard 106, at a level sufficient to provide full deviation of the carrier at the highest tape speed
of the system.
1.9.9.3.3.2 Rewind and reproduce the tape at each tape speed of the system specified for FM
operation and record the output voltage monitored in each case.
1.9.9.3.4 Data Reduction. Express the output amplitude variation as a percent of the full
deviation output voltage.
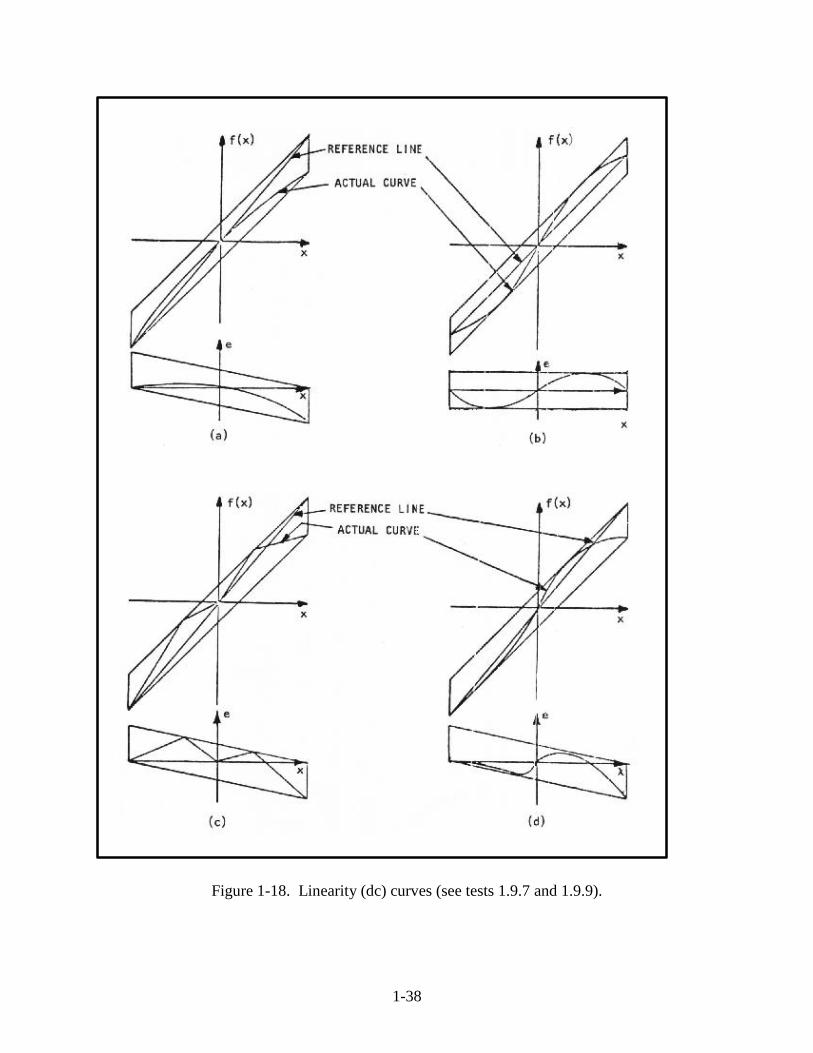
1-38
Figure 1-18. Linearity (dc) curves (see tests 1.9.7 and 1.9.9).

2-1
CHAPTER 2
SERIAL HIGH DENSITY DIGITAL RECORDING TESTS
2.1 General
This chapter defines a series of test procedures used to characterize the performance of
serial high density digital recording (HDDR) systems. The procedures include tests to determine
basic HDDR system performance, speed ratio, signal-to-noise ratio (SNR) margin, and bit
synchronizer performance. These tests are based on the serial HDDR standards contained in
Chapter 6 of IRIG 106. These standards contain the bi-phase-level (Biø-L) and randomized non-
return-to-zero-level (RNRZ-L) codes for serial HDDR. Tests in paragraphs 2.2, 2.3, 2.4, and 2.5
include an analog tape recorder/reproducer in the test setup. Before these tests are performed,
the analog tape recorder/reproducer should be checked and necessary actions taken to verify that
a. the head polarities are correct;
b. the reproduce head gaps are aligned in azimuth with the record head gaps;
c. the bias and record levels are correct and the frequency and phase equalizers are
properly adjusted;
d. the record and reproduce heads are clean and degaussed, and the tape path is clean; and
e. the magnetic tape is not excessively dirty. Shuttling a new reel of tape across the heads
two or three times will remove much of the debris from the tape and will reduce the number of
temporary dropouts. The heads and tape path should be cleaned after this procedure is
completed.
2.2 Basic Serial HDDR Test (1) and (2)
Bit synchronizer testing is described in detail in volume IV of this series. In addition, see
volume IV for a discussion on bit-error rate (BER) and clock-slip rate (CSR) also known as bit-
slip rate.
2.2.1 Purpose. This test determines the BER and CSR of an HDDR system (including
magnetic tape) at the maximum recommended IRIG bit packing density (refer to Chapter 6 of
IRIG Standard 106) using a 2047-bit pseudo-random sequence.
2.2.2 Test Equipment. PCM bit synchronizer, analog tape recorder/reproducer, and pulse code
modulation (PCM) test set with BER, CSR, and 2047-bit pseudo-random sequence capability.
2.2.3 Test Method.
2.2.3.1 Setup. Connect the test equipment as shown in figure 2-1.

2-2
Figure 2-1. Test setup for basic serial HDDR test (see tests 2.2 and 2.3).
The RNRZ-L randomizer may be part of the PCM test set,
tape recorder, or a separate device between the PCM test set
and tape recorder. The RNRZ-L derandomizer may be part of
the PCM bit synchronizer or a separate device after the PCM
bit synchronizer.
2.2.3.2 Conditions. The bit packing densities contained in this procedure are based on the
assumption that the tape recorder/reproducer being tested has a nominal bandwidth of 1.0 MHz
at a tape speed of 60 ips. If the tape recorder/reproducer bandwidth is different than this, the bit
packing densities should be adjusted accordingly. (See Chapter 6 of IRIG Standard 106.)
Test Equipment Settings
PCM Test Set
Output code: Biø-L
Output pattern: 2047-bit pseudo-random sequence
Bit rate: Set to give 15 kb/in, for example, 900 kb/s for a tape speed of 1524 mm/s
(60 ips).
PCM Bit Synchronizer
Input code: Biø-L
Bit rate: Same as PCM Test Set
Analog Tape Recorder/Reproducer
Mode: Direct recording
Tape speed: As desired
PCM TEST
SET
TAPE
RECORDER/
REPRODUCER
PCM BIT
SYNCHRONIZER
CLOCK
DATA
NOTE

2-3
Input level : Adjusted to standard record level (see Chapter 6 of IRIG Standard
106).
Tracks: As desired
2.2.3.3 Procedure.
2.2.3.3.1 Record the pseudo-random Biø-L bit stream on all tracks to be tested. Rewind the
tape and reproduce the Biø-L data at the same speed as the data were recorded. Measure the
BER and CSR in 10 separate intervals of 107
bits for each track. Record the data on Data Sheet
2-1.
2.2.3.3.2 Repeat subparagraph 2.2.3.3.1 using randomized NRZ-L (RNRZ-L) at a bit packing
density of 25 kb/in. Record the data on Data Sheet 2-1.
2.2.3.4 Data Reduction. The BER should be less than 10-6
and the CSR should be 0 in at
least 9 of the 10 intervals tested for each track. If not, the alignment of the recorder/reproducer
and the cleanliness of the tape, tape path, and heads should be checked. If any problems are
discovered, they should be corrected and the test repeated. If the results are still unsatisfactory,
the PCM bit synchronizer should be tested (see paragraph 2.6 ). If the PCM bit synchronizer
fails the test in paragraph 2.6, replace it with a PCM bit synchronizer that had passed the test in
paragraph 2.6 and repeat the test.
2.3 Speed Ratio Test (1)
2.3.1 Purpose. This test determines the effects of recording at one tape speed and reproducing
at a different tape speed.
2.3.2 Test Equipment. See subparagraph 2.2.2.
2.3.3 Test Method.
2.3.3.1 Setup. Connect the test equipment as shown in Figure 2-1
2.3.3.2 Conditions. Same as subparagraph 2.2.3.2 except record speed is 3048 mm/s (120
ips), (6096 mm/s (240 ips) optional) and reproduce speed is Biø-L 95.2 mm/s (3-3/4 ips), (47.6
mm/s (1-7/8 ips) optional) RNRZ-L 381 mm/s (15 ips). Other tape speeds may be used if they
provide a better representation of actual operational conditions.

2-4
Data Sheet_______________________________Serial High Density Digital Recording
Test 2.2:______________________________________________________________
Code_______________________________Bit Packing Density_______________kb/in
Recorder/Reproducer Manufacturer________________________ Model____________
mm/s mm/s
Serial No. ___________ Record Speed _________(ips) Reproduce Speed ______(ips)
Tape Width___________ Total No. of Tracks___________ Track Tested___________
Magnetic Tape Manufacturer__________________ Type____________ Lot_________
PCM Test Set Manufacturer _______________________________________________
Model ______________________________ Serial No. _________________________
PCM Bit Synchronizer Manufacturer_________________________________________
Model ______________________________ Serial No. _________________________
Test Personnel_________________________________ Date____________________
Test Location___________________________________________________________
Interval BER (x 10 ) CSR (x 10 )
1
2
3
4
5
6
7
8
9
10
-7 -7
2-1
Basic Serial HDDR
mm/s mm/s

2-5
2.3.3.3 Procedure.
2.3.3.3.1 Record the PCM bit stream on all tracks to be tested at a tape speed of 3048 mm/s
(120 ips), (6096 mm/s (240 ips) optional), and bit packing densities of 15 kb/in for Biø-L and
13.3 and 25 kb/in for RNRZ-L.
2.3.3.3.2 Rewind the tape and reproduce the data at a tape speed of 95.5 mm/s (3-3/4 ips)
(47.6 mm/s (1-7/8 ips) optional, .381 mm/s (15 ips) for RNRZ-L). A bit packing density of l3.3
kb/in results in a reproduce bit rate of 200 kb/s at a tape speed of 381 mm/s (15 ips).
2.3.3.3.3 Measure the BER and CSR in 10 separate intervals of 107
bits for each track and
record the data on Data Sheet 2-2.
2.3.3.4 Data Reduction. The BER should be less than 10-6
and the CSR should be 0 in at
least 9 of the 10 intervals tested for each track. If not, the alignment of the recorder/reproducer
and the cleanliness of the tape, tape path, and heads should be checked. If the PCM bit
synchronizer fails the test in paragraph 2.6, replace it with a PCM bit synchronizer that had
passed the test in paragraph 2.6 and repeat the test. If no prob1ems are discovered with the tape,
recorder/reproducer, or PCM bit synchronizer, repeat the speed ratio test with a minimum tape
speed of twice the previous minimum tape speed. Increase the minimum tape speed by
mu1tip1es of two until satisfactory results are obtained.
2.4 Signal-to-Noise Ratio Margin Test (Using Input Attenuator) (1)
2.4.1 Purpose. This test determines the SNR margin in the HDDR system. The SNR margin is
defined as the attenuation of the input signal that increases the BER to 10-5
. See paragraph 2.5
for an alternate method for measuring SNR margin.
2.4.2 Test Equipment. PCM test set, step attenuator (1-dB steps), amplifier (variable gain),
tape recorder/reproducer, and PCM bit synchronizer.
2.4.3 Test Method.
2.4.3.1 Setup. Connect the test equipment as shown in Figure 2-2.
2-1
2.2:

2-6
Data Sheet_______________________________Serial High Density Digital Recording
Test 2.3:______________________________________________________________
Code_______________________________Bit Packing Density_______________kb/in
Recorder/Reproducer Manufacturer________________________ Model____________
Serial No. ___________ Record Speed _________(ips) Reproduce Speed ______(ips)
Tape Width___________ Total No. of Tracks___________ Track Tested___________
Magnetic Tape Manufacturer__________________ Type____________ Lot_________
PCM Test Set Manufacturer _______________________________________________
Model ______________________________ Serial No. _________________________
PCM Bit Synchronizer Manufacturer_________________________________________
Model ______________________________ Serial No. _________________________
Test Personnel_________________________________ Date____________________
Test Location___________________________________________________________
Interval BER (x 10 ) CSR (x 10 )
1
2
3
4
5
6
7
8
9
10
-7 -7
2-2
Speed Ratio
mm/s mm/s

2-7
Figure 2-2. Test setup for SNR margin test (Attenuation Method) see test 2.3).
NOTE
The RNRZ-L randomizer may be part of the PCM test set, tape recorder,
or a separate device between the PCM test set and tape recorder. The RNRZ-L
derandomizer may be part of the PCM bit synchronizer or a separate device after the
PCM bit synchronizer.
2.4.3.2 Conditions. See subparagraph 2.2.3.2 for test equipment settings.
2.4.3.3 Procedure.
2.4.3.3.1 Record the pseudo random Biø-L bit stream on the track to be tested with the
attenuator set at 0 dB. The signal level should be the same as the standard record level for serial
HDDR.
2.4.3.3.2 Increase the attenuation, but keep the signal input within its operating range in the
PCM bit synchronizer.
2.4.3.3.3 Monitor the bit errors per 105 bits at each attenuator setting. When the BER is
approximately 10-5
, stop changing the attenuation.
2.4.3.3.4 Change the BER measurement interval to 106 bits. Most of the intervals should contain
between 5 to 20 bit errors. If more than 20 errors are usually observed, decrease the attenuation until the number of errors per measurement interval is between 5 and 20. If less than 5 errors are usually observed, increase the attenuation until the number of errors per measurement interval is between 5 and 20. The attenuation (in dB) which produces a BER of approximately 10
-5 is defined as the SNR
margin. A different BER can be used if desired (such as 10-6
).
2.4.3.3.5 Record the SNR margin on Data Sheet 2-3.
PCM TEST
SET
STEP
ATTENUATOR
TAPE
RECORDER/
REPRODUCER
CLOCK
DATA
AMPLIFIERPCM BIT
SYNCHRONIZER
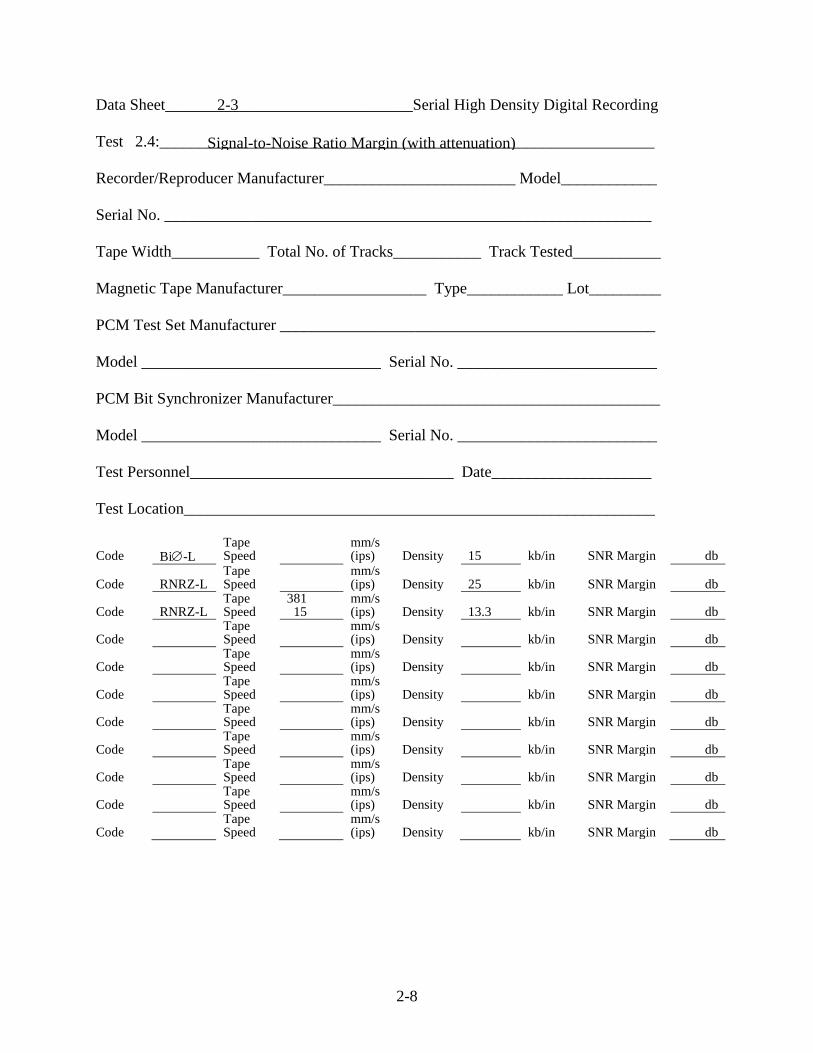
2-8
Data Sheet_______________________________Serial High Density Digital Recording
Test 2.4:______________________________________________________________
Recorder/Reproducer Manufacturer________________________ Model____________
Serial No. _____________________________________________________________
Tape Width___________ Total No. of Tracks___________ Track Tested___________
Magnetic Tape Manufacturer__________________ Type____________ Lot_________
PCM Test Set Manufacturer _______________________________________________
Model ______________________________ Serial No. _________________________
PCM Bit Synchronizer Manufacturer_________________________________________
Model ______________________________ Serial No. _________________________
Test Personnel_________________________________ Date____________________
Test Location___________________________________________________________
Code
Bi-L
Tape Speed
mm/s (ips)
Density
15
kb/in
SNR Margin
db
Code
RNRZ-L
Tape Speed
mm/s (ips)
Density
25
kb/in
SNR Margin
db
Code
RNRZ-L
Tape Speed
381 15
mm/s (ips)
Density
13.3
kb/in
SNR Margin
db
Code
Tape Speed
mm/s (ips)
Density
kb/in
SNR Margin
db
Code
Tape Speed
mm/s (ips)
Density
kb/in
SNR Margin
db
Code
Tape Speed
mm/s (ips)
Density
kb/in
SNR Margin
db
Code
Tape Speed
mm/s (ips)
Density
kb/in
SNR Margin
db
Code
Tape Speed
mm/s (ips)
Density
kb/in
SNR Margin
db
Code
Tape Speed
mm/s (ips)
Density
kb/in
SNR Margin
db
Code
Tape Speed
mm/s (ips)
Density
kb/in
SNR Margin
db
Code
Tape Speed
mm/s (ips)
Density
kb/in
SNR Margin
db
2-3
Signal-to-Noise Ratio Margin (with attenuation)

2-9
2.4.3.3.6 Repeat subparagraphs 2.4.3.3.1 through 2.4.3.3.5 using RNRZ-L at a bit packing
density of 25 kb/in. Record the SNR margin on Data Sheet 2-3.
2.4.3.3.7 Repeat subparagraphs 2.4.3.3.1 through 2.4.3.3.5 using RNRZ-L at a bit rate of 200 kb/s and a tape speed of 381 mm/s (15 ips). Record the SNR margin on Data Sheet 2-3.
2.4.3.3.8 Repeat subparagraphs 2.4.3.3.1 through 2.4.3.3.5 using Biø-L or RNRZ-L at other bit packing densities of interest (if desired). Record the SNR margin on Data Sheet 2-3.
2.4.3.4 Data Reduction. The SNR margins should be 10 dB or greater. If the margins are less than 10 dB, the HDDR system may be overly susceptible to tape dropouts and may require a reduction in the maximum bit packing density.
2.5 Signal-to-Noise Ratio Margin Test (Using Additive Noise) (1)
2.5.1 Purpose. This test determines the SNR margin in the HDDR system. The SNR margin is defined as the increase in noise at the reproduce output which increases the BER to 10
-5. See
paragraph 2.4 for an alternate method for measuring SNR margin.
2.5.2 Test Equipment. PCM test set, amplifier (variable gain), summing amplifier, tape recorder/reproducer, PCM bit synchronizer, and true rms voltmeter (100 Hz to 5 MHz minimum bandwidth).
2.5.3 Test Method.
2.5.3.1 Setup. Connect the test equipment as shown in Figure 2-3. This test may be difficult to perform if the PCM bit synchronizer is an integral part of the reproduce amplifier card.
2.5.3.2 Conditions. See subparagraph 2.2.3.2 for test equipment settings.
2.5.3.3 Procedure.
Record the pseudo L bit stream on the track to be tested.

2-10
Figure 2-3. Test setup for SNR margin test (using additive noise) (see test 2.5).
The RNRZ-L randomizer may be part of the PCM test set, tape recorder,
or a separate device between the PCM test set and tape recorder. The
RNRZ-L derandomizer may be part of the PCM bit synchronizer or a
separate device after the PCM bit synchronizer.
2.5.3.3.1 Connect the output of a second track to the amplifier. Both tracks must be properly
equalized; that is, the frequency response must conform to that stipulated in Chapter 6, IRIG
Standard 106, to provide the proper noise spectrum. The input to the second track should be
loaded with its characteristic impedance (no input signal). While recording and reproducing the
Biø-L bit stream, increase the level of the noise out of the second track until the BER is
approximately 10-5
. The output amplifier of the recorder/reproducer can be used to provide at
least part of the additional gain.
2.5.3.3.2 Measure the rms value of the output noise of the track under test (record and
reproduce with no input signal) and the rms value of the output noise of the second track. The
noise should be measured at the input to the PCM bit synchronizer. This measurement can be
done by disconnecting the track which is not being measured from the summing amplifier.
2.5.3.3.3 Record the rms values on Data Sheet 2-4. Also, measure and record the rms value
of the PCM bit stream plus noise of the output of the track being tested. In addition, this
measurement should be made at the input to the PCM bit synchronizer.
2.5.3.3.4 Repeat subparagraphs 2.5.3.3.1 through 2.5.3.3.4 using RNRZ-L at a bit packing
density of 9.84 kb/cm (25 kb/in). Record the results on Data Sheet 2-4.
2.5.3.3.5 Repeat subparagraphs 2.5.3.3.1 through 2.5.3.3.4 using RNRZ-L at a bit rate of 200
kb/s and a tape speed of 381 mm/s (15 ips). Record the results on Data Sheet 2-4.
PCM TEST
SET
TAPE
RECORDER/
REPRODUCERAMPLIFIER
CLOCK
DATA
SUMMING
AMPLIFIER
PCM BIT
SYNCHRONIZER
TRUE RMS
VOLTMETER
NOISE
ONLY
SIGNAL & NOISE
NOTE

2-11
Data Sheet_______________________________Serial High Density Digital Recording
Test 2.5:______________________________________________________________
Recorder/Reproducer Manufacturer________________________ Model____________
Serial No. _____________________________________________________________
Tape Width___________ Total No. of Tracks___________ Track Tested___________
Magnetic Tape Manufacturer__________________ Type____________ Lot_________
PCM Test Set Manufacturer _______________________________________________
Model ______________________________ Serial No. _________________________
PCM Bit Synchronizer Manufacturer_________________________________________
Model ______________________________ Serial No. _________________________
Test Personnel_________________________________ Date____________________
Test Location___________________________________________________________
Code __________ Tape Speed _________ (ips) Bit Packing Density _________ kb/in
Signal + Noise __ V rms Noise __ V rms Noise (added) __ V rms SNR Margin __ db
Code __________ Tape Speed _________ (ips) Bit Packing Density _________ kb/in
Signal + Noise __ V rms Noise __ V rms Noise (added) __ V rms SNR Margin __ db
Code __________ Tape Speed _________ (ips) Bit Packing Density _________ kb/in
Signal + Noise __ V rms Noise __ V rms Noise (added) __ V rms SNR Margin __ db
Code __________ Tape Speed _________ (ips) Bit Packing Density _________ kb/in
Signal + Noise __ V rms Noise __ V rms Noise (added) __ V rms SNR Margin __ db
Code __________ Tape Speed _________ (ips) Bit Packing Density _________ kb/in
Signal + Noise __ V rms Noise __ V rms Noise (added) __ V rms SNR Margin __ db
Code __________ Tape Speed _________ (ips) Bit Packing Density _________ kb/in Signal + Noise __ V rms Noise __ V rms Noise (added) __ V rms SNR Margin __ db
2-4
Signal-to-Noise Ratio Margin (with additive noise)
mm/s
mm/s
mm/s
mm/s
mm/s
mm/s

2-12
2.5.3.3.6 Repeat subparagraphs 2.5.3.3.1 through 2.5.3:3.4 using Biø-L at other bit packing
densities of interest (if desired). Record the results on Data Sheet 2-4.
2.5.3.4 Data Reduction. The SNR margin is calculated from
SNR Margin (dB) = 20 log10 Noise (added) V rms +1
Noise V rms
where
Noise = Noise from track being tested
Noise (added) = Noise from second track
The SNR margin should be 10 dB or greater. If the margin is less than 10 dB, the HDDR system
may be overly susceptible to tape dropouts and may require a reduction in the maximum bit
packing density.

2-13
2.6 Serial HDDR PCM Bit Synchronizer Test (1)
2.6.1 Purpose. This test measures the performance of the PCM bit synchronizer under
simulated HDDR conditions as well as the effects at low-pass and high-pass filtering and non-
white noise.
2.6.2 Test Equipment. PCM test set, linear phase bandpass filter (4-pole), summing amplifier,
low-pass filter (4-pole), PCM bit synchronizer, true rms voltmeter, noise source, and tape
recorder/reproducer output or white noise plus spectral conditioning to simulate
recorder/reproducer output (see Figure 2-4).
Figure 2-4. Circuit for specially conditioning white noise. (Component values are for
762 mm/s (30ips)). (see test 2.6).
2.6.3 Test Method.
2.6.3.1 Setup. Connect the test equipment as shown in Figure 2-5.
WHITE, GAUSSIAN
NOISE GENERATOR
STEP
ATTENUATOR
.
* Bandwidth must be at least twice bandwidth of band-pass filter in Figure 2-5.
-
+.. .
.
.4270
1780
1780
50
950
1mH 85pf
10pf
*

2-14
Figure 2-5. Test setup for serial HDDR PCM bity synchronizer test (see test 2.6).
The RNRZ-L randomizer may be part of the PCM test set, tape
recorder, or a separate device between the PCM test set and tape
recorder. The RNRZ-L derandomizer may be part of the PCM
bit synchronizer or a separate device after the PCM bit
synchronizer.
2.6.3.2 Conditions.
Test Equipment Settings
PCM Test Set
Output Code: Biø-L or RNRZ-L
Output pattern: 2047-bit pseudo-random sequence
Bit rate: 0.9 times band-pass filter high frequency for Biø-L, 1.5 times band-pass filter
high frequency for RNRZ-L.
PCM Bit Synchronizer
Input code: Biø-L or RNRZ--L
Bit rate: Same as PCM Test Set
Band-Pass Filter
Type: Bessel or RC
High-Pass: 400 or 800 Hz (6096 mm/s (240 ips))
Low-Pass: 500 kHz, 1 MHz, 2 MHz, or 4 MHz
PCM TEST
SET
LINEAR PHASE
BANDPASS FILTER
NOISE
SOURCE
CLOCK
DATA
SUMMING
AMPLIFIER
PCM BIT
SYNCHRONIZER
LOW PASS
FILTER
TRUE RMS
VOLTMETER
NOTE
2-15
Low-Pass Filter
Same cutoff frequency as low-pass section of band-pass filter.
Recorder/Reproducer (if used)
Stopped with appropriate tape speed selected
2.6.3.3 Procedure.
2.6.3.3.1 The Biø-L signal amplitude at the input to the bit synchronizer should be
approximately 1 V rms when the PCM bit rate is equal to one-fifth of the high frequency cutoff
of the band-pass filter (noise disconnected from summing amplifier).
2.6.3.3.2 Measure the rms value of the PCM signal at this bit rate and record on Data Sheet 2-
5. Increase the noise level until the BER is approximately 10-6
.
2.6.3.3.3 Measure the rms value of the noise at the input to the PCM bit synchronizer (PCM
signal disconnected from summing amplifier).
2.6.3.3.4 Record the measured values on Data Sheet 2-5.
2.6.3.3.5 Repeat subparagraphs 2.6.3.3.1 through 2.6.3.3.4 using an RNRZ-L bit stream.
Record the measured values on Data Sheet 2-5.
2.6.3.3.6 Repeat subparagraphs 2.6.3.3.1 through 2.6.3.3.4 using a 200 kb/s RNRZ-L bit
stream (400 Hz high-pass filter) only. Record the measured values on Data Sheet 2-5.
2.6.3.4 Data Reduction. Not applicable.

2-16
Data Sheet_______________________________Serial High Density Digital Recording
Test 2.6:______________________________________________________________
Bit Synchronizer Manufacturer_________________ Model_______ Serial No. _______
Band-Pass Filter Model __________________________________________________
Noise Source: Recorder/Reproducer / / Spectrally Conditioned White Noise / /
PCM Code _____ Bit Rate ______ kb/s Loop BW ____ High-Pass Frequency ____ Hz
Low-Pass Frequency ______ kHz PCM Signal ________ V rms Noise _______ V rms
SNR for 10-6
BER __________ dB
PCM Code _____ Bit Rate ______ kb/s Loop BW ____ High-Pass Frequency ____ Hz
Low-Pass Frequency ______ kHz PCM Signal ________ V rms Noise _______ V rms
SNR for 10-6
BER __________ dB
PCM Code _____ Bit Rate ______ kb/s Loop BW ____ High-Pass Frequency ____ Hz
Low-Pass Frequency ______ kHz PCM Signal ________ V rms Noise _______ V rms
SNR for 10-6
BER __________ dB
PCM Code _____ Bit Rate ______ kb/s Loop BW ____ High-Pass Frequency ____ Hz
Low-Pass Frequency ______ kHz PCM Signal ________ V rms Noise _______ V rms
SNR for 10-6
BER __________ dB
PCM Code _____ Bit Rate ______ kb/s Loop BW ____ High-Pass Frequency ____ Hz
Low-Pass Frequency ______ kHz PCM Signal ________ V rms Noise _______ V rms
SNR for 10-6
BER __________ dB
PCM Code _____ Bit Rate ______ kb/s Loop BW ____ High-Pass Frequency ____ Hz
Low-Pass Frequency ______ kHz PCM Signal ________ V rms Noise _______ V rms
SNR for 10-6
BER __________ dB
PCM Code _____ Bit Rate ______ kb/s Loop BW ____ High-Pass Frequency ____ Hz
Low-Pass Frequency ______ kHz PCM Signal ________ V rms Noise _______ V rms
SNR for 10-6
BER __________ dB
2-5
PCM Bit Synchronizer

3-1
CHAPTER 3
DIGITAL CASSETTE HELICAL SCAN RECORDING TESTS
3.1 General
This chapter defines the test procedures for 19-mm (0.75-inch) ID-1 and 12.65-mm (0.5-
inch) S-VHS digital cassette helical scan recording systems. The procedures include the use of a
calibration tape to verify the proper format and performance, bit error rate tests to verify system
operation, time scaled playback test to verify playback at lower data rates, polarity test to verify
input and output polarity, eye pattern test for determining distortion, and verification of the
longitudinal tracks.
3.2 Calibration Tape (1)
Calibration tapes are used to ensure interchange of recorded tapes among
recorders/reproducers from the same and different manufacturers.
3.2.1 19-mm ID-1 Systems. The ANSI X3.175-19904
standard defines the footprint
requirements for interchanging recorded tapes from 19-mm ID-1 systems. Interchange success
can only be assured if allowable tolerances of format parameters and recorded data
characteristics for both the recorder and the playback machines are compatible as a system. The
ANSI B5 ITG 96-345, Crossplay Calibration Recommendations for ID-1, is a recommended
practice appendix to ANSI X3.175-1990 for the purpose of establishing the use of a crossplay
calibration tape and reference tapes for record/ reproduce system adjustment to ensure high
performance fraternal and non-fraternal crossplay of ID-1 tapes.
It is recommended that a standard calibration tape representing the optimized flux pattern
on tape, conforming to the ANSI standard, be used to assure uniform condition for interchange.
The Crossplay Calibration Tape (CCT) will provide for optimizing the playback equalization
parameters of each machine for successful interchange and operational compliance to the intent
of the standard. The record characteristics shall be matched to those of the CCT; this will allow
optimal data retrieval through the previously calibrated playback channel for any record channel
which was calibrated to the CCT.
3.2.2 One-half Inch S-VHS Systems. It is recommended that calibration tapes be used for the
32 Mbps standard density6 and 64 Mbps high density
7 VLDS formats. These tapes must be
created on a specific master deck which is maintained and used only for this purpose. All
parameters of the tape transport must be measured and verified to conform to the tape format
specifications as shown in Figure 6-12 of IRIG Standard 106. Tape transport parameters are
4 Available from American National Standards Institute, 1430 Broadway, New York, NY 10018.
5 Available from American National Standards Institute; 1430 Broadway, New York, NY 10018.
6 Metrum 32 Mbps, part number 16828700-007 or equivalent. Available from Metrum, Inc., 4800 Dry Creek Road,
Littleton, CO 80122.
7 Metrum 64 Mbps, part number 16828700-008 or equivalent. Available from Metrum, Inc., 4800 Dry Creek Road,
Littleton, CO 80122.

3-2
measured by recording, then developing the tape, and optically measuring the magnetic signature
on tape using a precision optical measurement system.
Calibration tapes are created using a pseudo random data generator as the data source for
the data portion of the helical tracks of the recording. The number of principal block numbers
(PBN) or data blocks must be tightly controlled as it is used to determine the absolute X value (X
value is the distance between the beginning of the first helical swipe in a principal block and the
location of the corresponding control track pulse). In addition, a 1-KHz tone should be recorded
on the longitudinal direct channel track for use in mechanical alignment of the control track/
filemark head stack. Pulses should also be recorded on the file mark track synchronous with the
control track pulses for use in adjusting the azimuth of the control track/filemark head stack.
3.3 Bit Error Rate (BER) Test (1) and (2)
This test determines the corrected BER (CBER) of a helical scan recording system
(including magnetic tape) at the maximum recommended packing density of the system. This
test is performed with the Error Detection and Correction (EDAC) enabled.
3.3.1 Test Equipment. Bit Error Rate Test Set – a test set that generates pseudo-random bit
sequences at bit rates up to the maximum bit rate of the system under test and measures the
resulting bit error rate. The output of the test set shall be 8-bit parallel, byte serial format with a
clock signal at the required byte rate for the 19-mm systems and 8- or 16-bit parallel or bit serial
for the one-half inch systems. Bit error rates (BERs) shall be displayed as the arithmetic average
and peak values.
3.3.2 Procedure.
3.3.2.1 Connect the test set generator output to the input of the tape recorder system under
test and the tape recorder output to the test set receiver section.
3.3.2.2 Set the test set to pseudo-random bit sequence PRN-23 ( 2 23
- 1 length) at a bit rate
that results in the maximum packing density of the recorder under test and record the signal for a
minimum of 10 minutes.
3.3.2.3 Rewind the tape and measure the bit error rate as the tape is being reproduced.
3.3.3 Data Reduction. Record the highest and lowest bit error rate readings and verify that the
system meets specifications. Tape induced burst errors should be excluded. When tape induced
burst errors are suspected, the tape should be replayed to determine the location of the errors. If
the error location remains the same, the tape should be degaussed, re-recorded, and re-tested. If
the error location is retained, that error will be considered a permanent tape error for the
purposes of the BER calculation.

3-3
3.4 Time Scaled Playback Test (1) and (2)
This test verifies the capability to playback recorded data at lower rates such as one-half,
one-fourth, and one-eighth of original rate.
3.4.1 Test Equipment. Bit Error Rate Test Set.
3.4.2 Procedure.
3.4.2.1 Playback tape recorder in paragraph 3.3 at one-half rate and note bit error rate.
3.4.2.2 Repeat at playback rates of one-fourth and one-eighth rates and note the bit error rate.
3.4.3 Data Reduction. Compare bit error rates with the bit error rate achieved when played
back at the original speed.
3.5 Polarity Test (1)
This test ensures the polarity of the digital signal at the output of the reproduce electronics
is the same as the polarity of the signal at the input to the record electronics.
3.5.1 Test Equipment. Bit Error Rate Test Set, calibration tape (see paragraph 3.1).
3.5.2 Procedure.
3.5.2.1 Reproduce a PCM test signal of known polarity from the calibration tape and note the
polarity at the output of the reproduce electronics using a polarity sensitive bit error rate test set.
3.5.2.2 Set the bit error rate test set at the same bit rate and polarity as noted above. Record
the signal.
3.5.3 Data Reduction. Verify the bit error rate test set locks up. If the test set does not lock up,
invert the polarity of the test set receive section and verify lock. The test fails if the test set does
not lock up without inverting the polarity.
3.6 Eye Pattern (1)
The eye pattern test is useful for determining the distortion of a pulse code modulation
(PCM) signal. The distortion can result in jitter in the time crossings and reduction in the signal
amplitude. The distortion is typically caused by a combination of non-constant group delay and
filtering.
3.6.1 Test Equipment. Pseudo-noise (PN) generator, oscilloscope, bit synchronizer, plotter, or
oscilloscope camera (optional).

3-4
3.6.2 Procedure.
3.6.2.1 Connect test equipment as shown in Figure 1-12.
3.6.2.2 Set the bit rate and code of the PN generator and bit synchronizer to the desired
values. Set the oscilloscope to trigger on the clock signal from the bit synchronizer. Start the
recorder and adjust the oscilloscope amplitude and time base controls to produce a display
similar to those in Figures 1-13, 1-14, 1-15, and 1-16. The signals shown in Figures 1-13 and 1-
14 had bit error rates of essentially zero. The signals shown in Figures 1-15 and 1-16 had
approximately 1 error per 100,000 bits.
3.6.2.3 Measure the peak-to-peak time jitter, nominal peak-to-peak amplitude, and
peak-to-peak amplitude at the center of the eye opening. Record these values on Data Sheet 1-1.
If the appropriate equipment is available, plot or photograph the oscilloscope display and attach
to the data sheet.
3.6.3 Data Reduction. Multiply the time jitter by the bit rate and multiply this result by 100 to
get the peak-to-peak jitter as a percentage of the bit period. Divide the minimum eye opening by
the nominal eye opening and multiply by 100 to get the percentage eye opening. For example, in
Figure 1-14 the peak-to-peak jitter is approximately 12 percent of a bit period and the eye is
approximately 80 percent open. The corresponding values for Figure 1-16 are 26 percent and 17
percent, respectively.
3.7 Longitudinal Track Tests (1) and (2)
These tests determine the bias, record levels, frequency response, and wideband signal-to-
noise ratios of the longitudinal tracks of the digital cassette helical scan recorders.
3.7.1 Test Equipment. Signal generator, spectrum analyzer, and RMS voltmeter.
3.7.2 Procedure.
3.7.2.1 Connect the test equipment as shown in Figure 3-1. With the signal generator set to
the upper bandedge of the longitudinal track and input level set 5 to 6 dB below standard record
level, record and simultaneously reproduce a tape, and adjust the bias to 2 dB overbias per
manufacturer’s instructions.

3-5
Figure 3-1. Digital recorder longitudinal track tests.
3.7.2.2 With the signal generator set to 1/10 upper bandedge (reference level) and input set to
the standard record level (1 V rms), record and simultaneously reproduce a tape, and adjust the
record amplifier until 1 percent (-40 dB) third harmonic distortion level is indicated by the
spectrum analyzer. Measure and note the second harmonic distortion level as read on the
spectrum analyzer.
3.7.2.3 With the input level of the signal generator maintained at the reference level, vary the
input frequency over the frequency band of the longitudinal track and note that the maximum
and minimum readings at the output of the reproduce electronics do not exceed + 3 dB.
3.7.2.4 With the input level of the signal generator maintained at the reference level, note the
output level.
3.7.2.5 While still in the simultaneous record/reproducer mode, remove the input signal and
note the output level.
3.7.3 Data Reduction. The signal to noise ratio is the dB difference between the two readings.
SIGNAL
GENERATOR
RECORDER/
REPRODUCER
SPECTRUM
ANALYZER
VOLTMETER VOLTMETER

4-1
CHAPTER 4
RECORDER MULTIPLEXER/DEMULTIPLEXER SYSTEM TESTS
4.1 General
This chapter defines the test procedures for the multiplexer/demultiplexers used as input
and output to the helical scan recording systems. The procedures include bit error rate tests,
measurements of delays through the system, and verification of the proper format.
4.2 Bit Error Rate Test (1) and (2)
4.2.1 General. This test determines the BER of a multiplexer/demultiplexer system at selected
bit rates. This test may be run with or without the associated recorder in the loop. When the
recorder is in the loop, the error correction electronics should be activated.
4.2.2 Test Equipment. Bit Error Rate Test Set - a test set that generates pseudo-random bit
sequences at bit rates up to the maximum capability of the system under test and measures the
resulting bit error rate. The output of the test set shall be bit serial. Bit error rates shall be
displayed as the arithmetic average.
4.2.3 Procedure.
4.2.3.1 Connect the test set generator output to the input of the multiplexer system under test
and the demultiplexer output to the test set receiver section.
4.2.3.2 Set the test set to pseudo-random bit sequence PRN-23 (2 23
- 1 length) at selected bit
rates within the capability of the system. If a tape recorder is in the test loop, record the signal
for a minimum of 10 minutes.
4.2.3.3 If a tape recorder is in the test loop, rewind the tape and measure the bit error rate as
the tape is being reproduced. If only the multiplexer/demultiplexer is being tested, measure the
bit error rate at the output of the demultiplexer.
4.2.4 Data Reduction. Record the highest and lowest bit error rate readings and verify that the
system meets specifications.
4.3 Delay Measurements (1)
4.3.1 Purpose. This test determines the time delays from the input to the multiplexer to the
output of the demultiplexer. This test can be performed with the recorder bypassed (E-E mode)
or with the recorder running. The absolute values of time delay are not important for this
application but the differences in delay between different signals are important for time aligning
data from different sources.

4-2
4.3.2 Test Equipment. PCM signal sources (NRZ data and 0 degree clock), PCM signal
detectors, and counters. The PCM signal sources can be either PCM format simulators with
embedded time or pseudo-noise (PN) generators with a pulse output when a unique
synchronization pattern is detected (this pulse is used to start the time interval measurement).
The PCM signal detectors (format simulator) detect the frame synchronization pattern, latch
time, and subtract the embedded time from the current time; or (PN generator) detect a unique
synchronization pattern and output a pulse to stop the time interval measurement. The resolution
of the embedded time or the counters determines the time resolution of this technique. The
embedded time can be either absolute time (for example GPS time) or relative time. If relative
time is used the signal source and signal detector must be synchronized to each other. The
number of sets of equipment is determined by the number of channels that must be tested
simultaneously.
4.3.3 Test Method.
4.3.3.1 Setup. Connect test equipment as shown in Figure 4-1.
Figure 4-1. Multiplexer/demultiplexer delay measurement.
4.3.3.2 Conditions. This test can be performed with the recorder bypassed (E-E mode) or
with the recorder running.
4.3.3.3 Procedure.
4.3.3.3.1 Select the bit rates to be tested and record them on Data Sheet 4.1. These bit rates
should represent a cross section of the actual rates that the equipment will be used with. Bit rates
near the low and high end of the equipment specifications should be applied simultaneously. Set
the multiplexer for the bit rates to be tested. Verify that the aggregate bit rate does not exceed
the capability of the recorder or multiplexer/demultiplexer under test.
SOURCE 1
MULTIPLEXER RECORDER DEMULTIPLEXER
DETECTOR 1
SOURCE 2 DETECTOR 2
SOURCE N DETECTOR N
4-3
4.3.3.3.2 Apply data and clock signals to the multiplexer input and connect the demultiplexer
outputs (data and clock) to the appropriate detectors. A low bit rate signal can also be applied to
the analog input if an analog input is available.
4.3.3.3.3 Measure and record on Data Sheet 4-1 the time delays with the recorder bypassed.
4.3.3.3.4 (Optional) This test can only be performed if the unambiguous time measurement
interval is significantly larger than the total time required to record and reproduce the signal. For
example, a 32-bit time word with 1 microsecond resolution will repeat every 4294 seconds,
while a maximal length PN sequence with register length of 20 will repeat every 100
milliseconds at a bit rate of 10 Mbps. Start the recorder and record the signals for an appropriate
time interval. If read after write capability exists on the recorder under test, measure and record
on Data Sheet 4-1 the time delays with the recorder. For systems without read after write
capability, rewind the tape and reproduce the data. Measure and record on Data Sheet 4.1 the
time delays with the recorder and tape in the signal path. The delays will include the time spent
recording the data and rewinding the tape.
4.3.3.4 Data Reduction. Subtract the delay in the first channel from the delays in the other
channels and record as relative delay on Data Sheet 4-1.

4-4
DATA SHEET 4-1 RECORDER MULTIPLEXER/DEMULTIPLEXER SYSTEM TESTS
Test: 4.3 Delay Measurements
MUX/DEMUX Manufacturer Model Serial No. _____
Recorder Manufacturer Model Serial No. _____
Test Personnel Date ________________
MULTIPLEXER/DEMULTIPLEXER ONLY (RECORDER BYPASSED)
Ch 1 Ch 2 Ch 3 Ch 4
Bit rate (Mbps)
Delay (µs)
Relative delay (µs)
RECORDER and MULTIPLEXER/DEMULTIPLEXER
Ch 1 Ch 2 Ch 3 Ch 4
Bit rate (Mbps)
Delay (µs)
Relative delay (µs)

4-5
4.4 Format Verification Test (1)
4.4.1 General. This test verifies that the multiplexer/demultiplexer format, Analog to
DigitalAdaptable Recorder Input/Output (ADARIO), is correct as recorded on tape. This test
uses a PC based automated approach. If a tape is available that has been recorded in a known
ADARIO format, an alternate method is to use the tape to verify the demultiplexer format and
then use the demultiplexer to verify the multiplexer format. However, the following software
method has the advantage of being able to identify the degree of format compatibility and those
areas that are not compatible.
4.4.2 Test Equipment. Verification Signal Generator (VSG) - At a minimum, a fixed function,
non-programmable signal generator that provides for several discrete simultaneous analog and
digital outputs. The VSG produces an analog output (15 Hz to 1 MHz) sawtooth waveforms,
serial digital with clock (1 Mbps and 64 Kbps), parallel digital with clock (1 Msps 16 bit word
and 3.9 Ksps 8 bit word). The VSG outputs are generated from a single set of counters driven
from a common crystal oscillator. This approach allows the VSG to produce time correlated
signal outputs with recognizable data content features. The analog output is a series of sawtooth
ramps of various amplitudes and duration derived from the counter outputs and associated digital
to analog converter. Serial outputs are serialized counter outputs. Parallel outputs are derived
from the counter outputs at the several clock rates (1 MHz or 3.9 MHz).
Personal Computer (PC) - an IBM compatible 486 or higher type PC with at least 8 MB memory,
DOS 3.0 or higher, and a report printer. The processing rate of the PC is not a critical issue.
4.4.3 Procedure.
4.4.3.1 Connect the VSG to the multiplexer under test and select any combination of signals
for recording.
4.4.3.2 Record the output of the multiplexer on the associated tape recorder.
4.4.3.3 Transfer the results of this recording to a computer compatible media for analysis.
4.4.4 Data Reduction.
4.4.4.1 Commercially available verification software8 will test the storage media against all
the annotated fields within the ADARIO format. Within the ADARIO block this includes session
static and dynamic fields, channel static and dynamic fields and fill. The ADARIO block format
and its associate fields are given in IRIG Standard 106, Appendix G.
8 Alliant Techsystems ADARIO Format Verification Software or equivalent. Available from Alliant Techsystems,
401 Defense Highway, Annapolis, MD 21401.

4-6
4.4.4.2 The analysis process provided by the verification software is as follows:
Correlate the blocking structure of the data using the ADARIO Word or Fill to
determine beginning of data blocks.
Analyze the content of each data field using known VSG channel data content.
Analyze the signal data content using known VSG signal data content.
Report on compliance or lack of compliance to ADARIO format on a per field basis.
Report statistically on full data sample compliance to the ADARIO format.
4.4.4.3 The software reads a buffer of data approximately 60 K bytes (10 ADARIO formatted
blocks) from the storage media. The software then partitions the buffer into blocks of 2048*3
bytes (ADARIO block size) and then scans these blocks for equal value bytes using a variable
buffer offset from the beginning of buffer 0 to 2048*3 bytes. The software then records the
number of matches per offset. The highest number of matches is the most probable ADARIO
block boundary and will start at the end of the “FF” Hex fill bytes (if any are occurring). This
method of correlation provides a means for locating the block boundary without dependence on
data content.
4.4.4.4 The block start location will have data content that verifies the block length and
provides for the location of the highest priority channel header. Block header verification is
based on the IRIG Standard 106 ADARIO standard and the use of the VSG data content for
format and timing verification. It is recommended that all static annotation fields be tested
before conducting any dynamic testing. If any test fails, the operator will be alerted and, after
testing is complete, a comprehensive test report will be generated. The software elements are as
follows:
Storage Media Data Input Control - controls flow of data to be analyzed.
Block Correlation - locates block boundary.
Block Header Verification - verifies session static and dynamic fields, determines master
clock rate, block rate and time code, and number of active channels.
Channel Header Locator - locates channel headers based upon the number of active
channels and channel word count.
Channel Header Verification - verifies static and dynamic fields.
Channel Data Type Verification - verifies header versus data based upon recorded
parameters.
Data Feature Extractor/Correlator - verifies multi-channel data time correlation.
Report Generator - provides the size of test data, number of fields that passed and failed,
and the percentage of overall compatibility and adherence to ADARIO format.
5-1
CHAPTER 5
MAGNETIC TAPE TESTS
5.1 General
This chapter describes the detailed test procedures to be used in measuring the magnetic
tape performance requirements outlined in Magnetic Tape Standards, Chapter 7 of IRIG
Standard 106. Magnetic tape terms and definitions are also given in Chapter 7. Magnetic Media
Laboratory9 (MML) Documents 350 Oe and 750 Oe describe additional tests and test procedures
being used for qualification and acceptance tests of wideband and high energy instrumentation
magnetic tape, respectively. For physical specifications and tests of 19 mm (0.75 inch) and
12.65 mm (0.5 inch) digital cassette helical scan recording tape, refer to the manufacturer’s
specifications as they relate to the application for which the tape will be used.
When measurement techniques are not specified, it is assumed that commonly accepted
measurement methods for mechanical and electrical characteristics will be employed. Not all the
test procedures described in this chapter are required for any one evaluation and tests other than
those indicated may be required for a given evaluation. The quantity of tapes to be evaluated at
one time will depend on the final application of the tape. For new tape, it is recommended that a
statistical sampling plan be employed to specify both the quantity of tapes to be tested and the
appropriate acceptance or rejection criteria. For used tape, it is recommended that all tapes be
tested and that a tape be rejected if a single test fails.
To the greatest extent possible, the environmental conditions of the test area should
duplicate the environmental conditions normally encountered in the operational area in which the
tape is to be used. The test area should be kept as dust free as possible and the environment
should be maintained at 70 degrees F + 5 (294.3 K + 2.8) and 50 percent + 5 relative humidity.
5.2 Manufacturer’s Centerline Tape (MCT) and Manufacturer’s Secondary Centerline Tape
(MSCT)
As referred to in this document, a MCT is an unrecorded magnetic tape maintained by the
manufacturer. A MSCT is an unrecorded magnetic tape provided by the manufacturer to the
user. It shall be traceable to the appropriate MCT. Since the MSCT is used solely for the
electrical performance characteristics, it does not necessarily have to represent the
manufacturer’s centerline performance values for physical characteristics.
During the calibration of the MSCT, a calibration factor equal to the amount of
departure from the MCT is established and provided by the manufacture with the MSCT. When
using the MSCT, the calibration factor will be used to obtain the end results in comparing the
tape under test to the MCT.
9 MML Documents are available from the Naval Air Weapon Center Aircraft Division, Patuxent River, MD 20670.

5-2
Before starting the performance tests, properly align and adjust the test recorder/reproducer
in accordance with the IRIG standards and manufacturer’s instruction manual. After the
alignment is complete, a qualitative test should be conducted to ensure the system will transport
tape properly.
5.3 Longitudinally-Oriented Oxide Instrumentation Magnetic Tape
This section describes the test procedures to be used in measuring the instrumentation
magnetic tape performance requirements.
5.3.1 Standard Record Conditions.
5.3.1.1 High Energy Tape. Standard record conditions for high energy (HE) tape consist of a
2.0 MHz +2 percent sinusodial test signal recorded at 3048-mm/s (120-ips) tape speed or 1.525-
micrometer (0.06-mil) wavelength using the specified bias and record levels.
High resolution tape and the associated standard record conditions
are recommended for HDDR requirements as specified in IRIG
Standard 106. The tape and the standard record conditions for
nonstandard serial and parallel HDDR should be based on the
specific requirements.
5.3.1.2 High Resolution Tape. Standard record conditions for high resolution (HR) tape
consist of a 1.0 MHz +2 percent sinusodial test signal recorded at 3048-mm/s (120-ips) tape
speed or 3.05-micrometer (0.12-mil) wavelength using the specified bias and record levels.
5.3.2 Working Tape Length. The test procedures described here are conducted over the
working tape length, which is defined as the designated length of the tape under test excluding
the first and last 30.48 m (100 ft).
5.3.3 Test Equipment-Level Detector and Recorder. The direct-write recorder and level-
detector system described next are recommended for use in detecting and recording the
magnitude and duration of the output signal level changes required in several test procedures.
5.3.4 Level Detector. The level detector is a full-wave peak ac detector whose dc output
represents the amplitude of the ac signal envelope. The level detector has characteristics equal to
the following minimum specifications:
Bandpass of detected frequency: 400 kHz -to 1.0 Mz +1 dB or 400 kHz to 2.0 MHz +1 dB
Output ripple: less than 1 percent over rated band pass
Response of detected output: dc to 200 Hz +1 dB
Output level: Sufficient to drive direct-write recorder
5.3.5 Direct-Write Recorder. The direct-write recorder used consists of a minimum of seven
channels of recording capability with sufficient linearity, frequency response, and stability to
NOTE
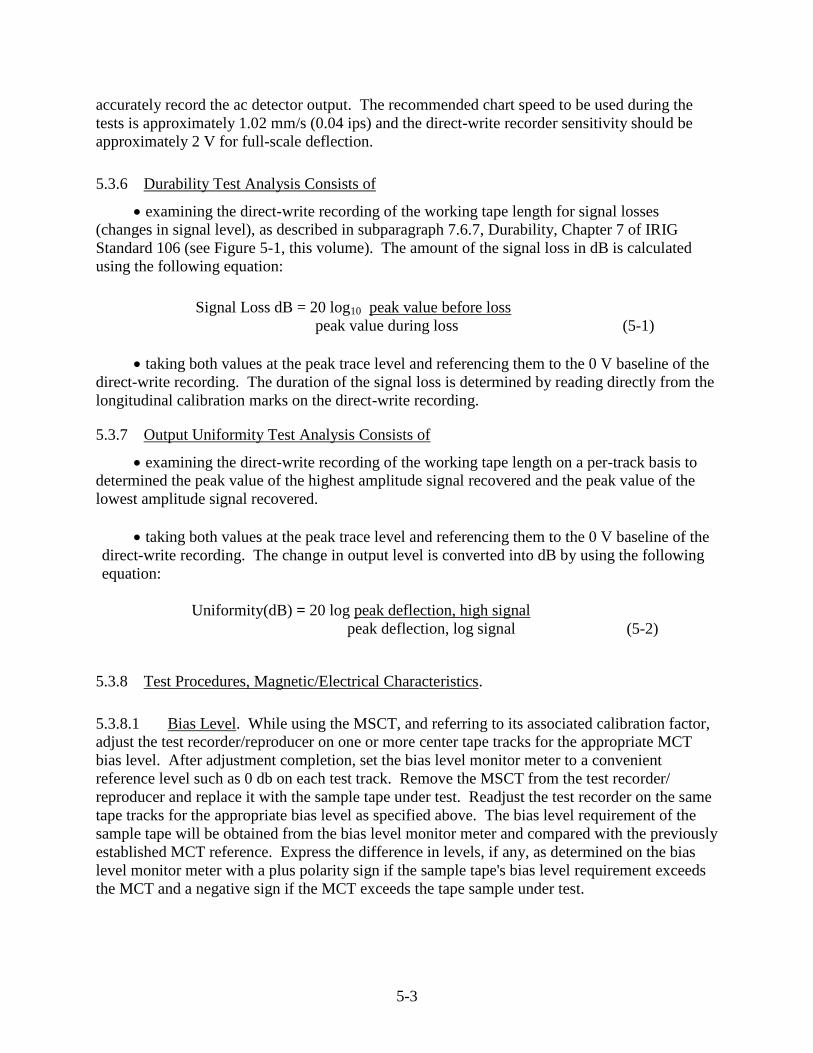
5-3
accurately record the ac detector output. The recommended chart speed to be used during the
tests is approximately 1.02 mm/s (0.04 ips) and the direct-write recorder sensitivity should be
approximately 2 V for full-scale deflection.
5.3.6 Durability Test Analysis Consists of
examining the direct-write recording of the working tape length for signal losses
(changes in signal level), as described in subparagraph 7.6.7, Durability, Chapter 7 of IRIG
Standard 106 (see Figure 5-1, this volume). The amount of the signal loss in dB is calculated
using the following equation:
Signal Loss dB = 20 log10 peak value before loss
peak value during loss (5-1)
taking both values at the peak trace level and referencing them to the 0 V baseline of the
direct-write recording. The duration of the signal loss is determined by reading directly from the
longitudinal calibration marks on the direct-write recording.
5.3.7 Output Uniformity Test Analysis Consists of
examining the direct-write recording of the working tape length on a per-track basis to
determined the peak value of the highest amplitude signal recovered and the peak value of the
lowest amplitude signal recovered.
taking both values at the peak trace level and referencing them to the 0 V baseline of the
direct-write recording. The change in output level is converted into dB by using the following
equation:
Uniformity(dB) = 20 log peak deflection, high signal
peak deflection, log signal (5-2)
5.3.8 Test Procedures, Magnetic/Electrical Characteristics.
5.3.8.1 Bias Level. While using the MSCT, and referring to its associated calibration factor,
adjust the test recorder/reproducer on one or more center tape tracks for the appropriate MCT
bias level. After adjustment completion, set the bias level monitor meter to a convenient
reference level such as 0 db on each test track. Remove the MSCT from the test recorder/
reproducer and replace it with the sample tape under test. Readjust the test recorder on the same
tape tracks for the appropriate bias level as specified above. The bias level requirement of the
sample tape will be obtained from the bias level monitor meter and compared with the previously
established MCT reference. Express the difference in levels, if any, as determined on the bias
level monitor meter with a plus polarity sign if the sample tape's bias level requirement exceeds
the MCT and a negative sign if the MCT exceeds the tape sample under test.

5-4
5.3.8.2 Record Level.
5.3.8.2.1 While using the MSCT and referring to its associated calibration factor, adjust the
test recorder/reproducer on one or more center tape tracks for the appropriate MCT bias and
record levels and optimize the reproduce equalization on all test tracks. After adjustment
completion, adjust the record level monitor meter to a convenient reference level such as 0 dB on
each test track.
5.3.8.2.2 Remove the MSCT from the test recorder/reproducer and replace it with the sample
tape under test. Repeating all procedures previously discussed, except the record level monitor
meter adjustment, determine the record level required by the manufacturer's sample tape. The
difference in levels, if any, as determined on the record level monitor meter, is expressed with a
plus polarity sign if the sample tape's record level requirement exceeds the MCT and a negative
sign if the MCT exceeds the tape sample under test.
5.3.8.2.3 The tape has failed the test if the record level required by the tape exceeds the
tolerances specified by the procuring agency.10
5.3.9 Wavelength Response and Output at 0.1 Upper Band Edge Wavelengths.
The tests in this section have been combined because the test
procedures are similar to those described in previous sections.
While using the MSCT and referring to its associated calibration factor, adjust the test
recorder on one or more center tape tracks for the appropriate MCT bias level. Adjust the record
level for 3 to 6 db below that which would be obtained at the MCT standard record level and
optimize the reproduce equalization on all test tracks. Obtain the output amplitude values at the
applicable wavelengths specified in Table 5-1 in the center one-third section of the reel using the
same measurement wavelengths as the MSCT. On completion of the test, the following four
response curves are co-plotted with the wavelength as the abscissa using the data obtained from
the previously described test:
the absolute output readings of the MSCT corrected by the appropriate calibration factor
so as to represent the MCT output in dB;
the uncorrected, absolute output reading of the manufacturer's sample tape in dB;
the output readings of the manufacturer's sample tape, after correcting the sample tape
readings by the constant dB value required to overlay curves A and B at the 0.1 UBE; and
the difference in output between curves C and A with A used as the reference.
The measured tape characteristics are then defined as:
a. The output at 0.1 UBE wavelength of the sample tape is the dB difference
between curves A and B at the 254-micrometer (10 mil) wavelength.
10
MML Documents are available from the Naval Air Weapon Center Aircraft Division, Patuxent River, MD 20670.
NOTE

5-5
b. The wavelength response of the sample tape is curve D.
c. For both definitions, a plus sign will indicate that the sample tape's output
exceeded the output of the MCT and a negative sign will indicate that the MCT output exceeded
that of the sample tape.
TABLE 5-1
WAVELENGTHS FOR WAVELENGTH RESPONSE TESTS
Standard-Resolution
Tape
High-Resolution
and HDD Tape
High-Energy Tape
um (mils) um (mils) um (mils)
7620.00
1524.00
254.00
25.40
12.70
6.35
3.18
(300.000)
( 60.000)
( 10.000)
( 1.000)
( 0.500)
( 0.250)
( 0.125)
3810.00
254.00
25.40
6.35
3.18
2.54
2.03
1.52
(150.000)
( 10.000)
( 1.000)
( 0.250)
( 0.125)
( 0.100)
( 0.080)
( 0.060)
254.00
25.40
12.70
6.35
3.18
2.54
1.52
1.02
0.76
(10.000)
( 1.000)
( 0.500)
( 0.250)
( 0.125)
( 0.100)
( 0.060)
( 0.040)
( 0.030)
5.3.10 Short Wavelength Output Uniformity.
5.3.10.1 Whi1e using the MSCT and referring to its associated calibration factor, adjust the
test recorder/reproducer on all tape tracks for the appropriate MCT bias and record, and optimize
the reproduce equalization. Remove the MSCT from the test recorder/reproducer and replace it
with the sample tape under test. Using the applicable record conditions specified in
subparagraph 5.3.1, Standard Record Conditions, simultaneously record and reproduce seven
tracks over the working length of the tape. Individually analyze the seven output signals for long
term output amplitude variations which occur along the working length of the tape, by using a
suitable means of detecting and recording the output amplitude as described in subparagraph
5.3.3, Level Detector and Recorder. When using this method, the change in output amplitude
uniformity of the tape under test is converted into units of dB as outlined in subparagraph 5.3.4,
Output Uniformity Test Analysis (see Figure 5-1).
5-6
Figure 5-1. Output uniformity test analysis (see tests 5.3.3 and 5.3.8).
5-7
5.3.10.2 The tape has failed the test, when the long term output uniformity of the peak level
of the signal trace on any track exceeds those limits specified by the procuring agency for Short
Wavelength Output Uniformity.
5.3.10.2.1 In the event that a tape fails an output uniformity test, and tension variation of the
test recorder/reproducer is suspected, retest the failed tape in the reverse direction to separate the
tape non-uniformity from the effects of tension variations.
5.3.11 Short Wavelength Instantaneous Non-Uniformity (Dropout).
5.3.11.1 While using the MSCT and referring to its associated calibration factor, adjust all tape
tracks for the appropriate MCT bias and record level as outlined and optimize the reproduce
equalization. Remove the MSCT from the test recorder/reproducer and replace it with the
sample tape under test. Using the applicable record conditions specified in subparagraph 5.3.1,
Standard Record Conditions, simultaneously record and reproduce the required tracks over the
working length of the tape.
5.3.11.2 Check the reproduce output signals for all decreases in level that equal or exceed 6
dB for a period of 5 microseconds for high energy and high resolution tape or 10 microseconds
for standard resolution tape. When the dropout time period exceeds the specified time, register a
dropout count for each sequential time period occurring in the given dropout. The dropout
detector electronics determines the 6 dB threshold by means equivalent to a full-wave peak
detector circuit.
5.3.11.3 The tape has failed the test when the number of dropout time periods per track per
30.48 m (100 ft) exceeds the limits specified by the procuring agency.
5.3.12 Durability.
5.3.12.1 While using the MSCT and referring to its associated calibration factor, adjust the test
recorder/reproducer on all tape tracks for the appropriate MCT bias and record level and
optimize the reproduce equalization. Remove the MSCT from the test recorder/reproducer and
replace it with the sample tape under test.
5.3.12.2 Using the applicable record conditions specified in subparagraph 5.3.1, Standard
Record Conditions, record and reproduce seven tracks simultaneously over the working length of
the tape under test. The first 10 test passes are simultaneous record/reproduce passes with tape
path cleaning performed at the beginning of each pass. Individually analyze the seven output
Fig ure 5- 1. Out put uni for mit y test ana lysi s (se e test s 5.3. 3 and 5.3.

5-8
Figure 5-2. Durability test analysis (see tests 5.3.1.1).

5-9
signals for signal loss as defined in subparagraph 7.6.7, Durability, Chapter 7, IRIG Standard
106, using a suitable means of detecting and recording the magnitude and length of the signal
losses as described in subparagraph 5.3.3, Level Detector and Recorder, this volume (see Figure
5-2). The tape has failed the test if signal losses in excess of those limits specified by the
procuring agency occur per tape pass.
5.3.12.3 At the successful completion of the 10th record/reproduce pass, the remainder of the
durability test is accomplished by selecting a 152.4-m (500-ft) section with no previously
recorded signal losses from the above tested tape. This tape is cycled for an additional 25
reproduce-only passes. Cleaning the tape path during this portion of the test is not allowed. The
tape has failed the accelerated portion of the durability test if 5 or more signal losses, as defined
in subparagraph 7.6.7, Durability, Chapter 7, IRIG Standard 106, occur during the 25 passes.
5.3.12.4 In the event that a tape test indicated failure of the durability requirement,
immediately stop the recorder, clean the tape path, and continue the test momentarily to
demonstrate that signal loss was not due to changes in electronics or head windings.
5.3.13 Modulation Noise. While using the MSCT and referring to its associated calibration
factor, adjust the test recorder/reproducer on one or more center tape tracks for the appropriate
MCT bias and record level and optimize the reproduce equalization on all test tracks. Remove
the MCST from the test recorder/reproducer and replace it with the sample tape under test.
Record and reproduce a 400-kHz signal at 3048-mm/s (120-ips) tape speed (7.62 m (0.3-mil)
wavelength) throughout the working tape length. Pass the output of the test track through an
electronic band-pass filter adjusted for 5 and 500 kHz limits and connect it to the vertical input
of an oscilloscope fitted with a suitable camera to record the CRT display. While using an
oscilloscope vertical gain of approximately 0.5 v/cm, adjust the reproduced output signal to a
level that provides the maximum oscilloscope display. The vertical gain of the oscilloscope is
then changed to a sensitivity of 10 times the previous setting, and the vertical center control is
adjusted to display the positive peaks of the 400-kHz signal. The sweep of the oscilloscope is
changed to "Single Sweep," and the camera lens is opened and single sweep pictures are
randomly taken throughout the working tape length. The modulation noise envelope
superimposed on the peaks of the 400-kHz signal, excluding large negative excursions caused by
dropouts, can be measured directly from the calibrated oscilloscope pictures. The tape has failed
the test if the modulation noise envelope, present at any point in the working tape length exceeds
the modulation noise limits specified by the procuring agency.
5.3.14 Layer-to-Layer Signal Transfer.
5.3.14.1 Externally erase the sample tape to be tested and place it on the test
recorder/reproducer. Using the appropriate bias level, but no input signal, record 10 layers of
tape and wind on a 114.3-mm (4-1/2-inch) diameter reel hub at 381-mm/s (15-ips) tape speed.
Increase the record level to the maximum level obtainable with the test recorder/reproducer and
record a 1.0-kHz signal on one additional layer of tape that is wound on the reel hub. Wind 10

5-10
additional layers of tape recorded with bias only over the recorded portion of the tape to maintain
intimate contact between the layers under test. Condition the reel of tape at a temperature of
324.9 K (125 F) dry heat for a period of four hours. After a stabilization period of four hours at
room temperature, play the tape back with the output of the reproduce amplifier connected to the
input of a 1 kHz filter with a maximum band pass of 50 Hz. Measure and record the level of the
recorded signal and the level of the signal resulting from layer-to-layer signal transfer using
equipment with sufficient dynamic range to measure the expected change in signal level. For
ease of measuring and analyzing results, a recording wave analyzer is suggested.
5.3.14.2 The tape has failed the test if the difference in signal levels is less than the limits
specified by the procuring agency for layer-to-layer signal transfer.11
5.3.15 Ease of Erasure.
5.3.15.1 Externally erase the sample tape to be tested and place it on the test
recorder/reproducer. Using the appropriate bias, record a 60-kHz signal at 1524-mm/s (60-ips)
tape speed using the maximum record level obtainable with the test recorder/reproducer.
Reproduce the tape at a convenient reproduce level with the output connected to a 60-kHz filter
having a maximum passband of 1 kHz. Measure the voltage across an appropriate termination at
the output of the filter. Pass the sample tape through a 60 Hz ac field of 79.58 kA/M (1000
oersteds) peak value for SR, HR, and HDD tape of 159.16 kA/m (2000 oersteds) peak value for
HE tape. Reproduce the tape using the identical test setup and the same reproduce output level
setting as described earlier. The voltage measured at the output of the filter is the residual signal.
The difference between the recorded signal level and the residual signal level, expressed in dBs,
is the effective reduction in signal or erasure.
5.3.15.2 The tape has failed the test if the difference in signal levels is less than the limits
specified by the procuring agency for ease of erasure.
5.3.16 Physical Characteristics.
5.3.16.1 Physical characteristics for a new tape should be in accordance with MML 350 Oe
and 750 Oe.
5.3.16.2 The tape shall be supplied wound on reels and hubs in accordance with Federal
Specification W-R-175, Reels and Hubs for Magnetic Tape, General Specification for and
applicable detailed specifications for the application.
5.4 Digital Cassette Tape
This section describes the test procedures to be used in measuring the digital cassette tape
performance requirements.
11
A table of suggested tape requirement limits appears in Chapter 7 of IRIG Standard 106.

5-11
5.4.1 Standard Record/Reproduce Conditions. Standard record signal is a sinusoidal signal
with an amplitude of 700 mV peak-to-peak for 19-mm systems and a sinusoidal signal with an
amplitude of 172.5 mV peak-to-peak for 12.65-mm systems.
Standard output level is the average of the peak detected reproduced signal level of a
standard record signal recorded the length of the MCT.
Average output signal level is defined as the average (over 1 second) of the peak detected
reproduced signal level of a previously recorded standard record signal. The output of the
reproduce head shall be peak detected and sampled at a rate of 1 every 200 usec for 19-mm
systems and 833 usec for 12.65-mm systems.
5.4.2 Bit Error Rate Test.
5.4.2.1 General. This test determines the BER performance of the digital cassette tape. The
test is conducted at the maximum recommended packing density of the system with the Error
Detection and Correction (EDAC) disabled.
5.4.2.2 Test Equipment. Bit Error Rate Test Set - A test set that generates pseudo-random bit
sequences at bit rates up to the maximum bit rate of the system under test and measures the
resulting bit error rate. The output of the test set shall be 8-bit parallel, byte serial format with a
clock signal at the required byte rate for the 19-mm systems and 8- or 16-bit parallel or bit serial
for the ½-inch systems. Bit errors shall be displayed as the cumulative bit total. A bit error rate
test set with the capability to identify the location of the error bursts is desirable for some
applications.
5.4.2.3 Procedure.
5.4.2.3.1 Connect the test set generator output to the input of the tape recorder system under
test and the tape recorder output to the test set receiver section.
5.4.2.3.2 Set the test set to pseudo-random bit sequence PRN-23 (223
- 1 length) at a bit rate
that results in the maximum packing density of the recorder under test. Check the recorder with
the tape out of the loop (E to E mode) to verify proper operation of the electronics. Record the
signal for the entire length of the tape.
5.4.2.3.3 Rewind the tape and measure the bit error rate as the tape is being reproduced.
5.4.2.4 Data Reduction. Record the cumulative total bit error rate readings and verify that
the tape meets specifications. Record the location of error bursts if applicable.
5.4.3 Sensitivity.

5-12
5.4.3.1 Purpose. Verify the average output level at any point along the length of the tape
does not vary from the standard output level of the MCT by more than the specified value.
5.4.3.2 Procedure. Record a 1/10 upper bandedge standard record signal for a minimum of
15 seconds sequentially on the tape under test and the MSCT.
5.4.3.3 Data Reduction. The sensitivity of the tape shall be established by comparing the
average output level of the tape under test with the standard output level of the MCT.
5.4.4 Signal-to-Noise Ratio (SNR).
5.4.4.1 Purpose. Verify that the SNR at any point along the length of the tape is not less than
the value when using the MCT. The SNR is defined as the ratio of the composite output signal
level of the standard record signal measured from all heads to the composite output level without
any signal input.
5.4.4.2 Procedure. Record a 1/10 upper bandedge standard record signal for a minimum of
30 seconds. Remove the input and substitute a short circuit. Record for 30 seconds with no
input. Reproduce the tape and note the composite output level in the recorded section of the
tape. Continue reproducing the tape and note the composite output level in the section of tape
with no input signal present. Repeat at other arbitrary locations over the entire length of the tape.
Repeat this procedure using the MCT.
5.4.4.3 Data Reduction. Calculate the SNRs of the tape under test and the MCT. The SNR
of the tape under test shall be no lower than the minimum SNR of the MCT.

INDEX OF TESTS
Test Page
Basic Serial HDDR Test (1) and (2) .......................................................................................... 2-39
Bias Leakage Test (1). ............................................................................................................... 1-23
Bias, Record Level and Second Harmonic Distortion Tests (1) and (2). .................................. 1-17
Bit Error Rate (BER) Test (1) and (2) ......................................................................................... 3-2
Bit Error Rate Test (1) and (2) ..................................................................................................... 4-1
Bit Error Rate Test. .................................................................................................................... 5-17
Calibration Tape (1) ..................................................................................................................... 3-1
Crosstalk Test (1). ...................................................................................................................... 1-22
Delay Measurements (1) .............................................................................................................. 4-1
Deviation, Center Frequency And Polarity Tests (1) and (2). ................................................... 1-30
Direct Record System Tests ....................................................................................................... 1-17
Distortion Test (1) and (2). ........................................................................................................ 1-32
Drift (dc) at Center Frequency Test (1). .................................................................................... 1-35
Eye Pattern (1) ............................................................................................................................. 3-3
Eye Pattern (1). .......................................................................................................................... 1-26
Flutter Measurement Test (1) and (2). ......................................................................................... 1-7
FM System Tests........................................................................................................................ 1-30
Format Verification Test (1) ........................................................................................................ 4-5
Frequency Response (Direct Recording) Test (1) and (2). ........................................................ 1-18
Frequency Response Test (1) and (2). ....................................................................................... 1-31
Head Electrical Polarity and Mechanical Alignment Tests ......................................................... 1-1
Head Polarity Tests (1) ................................................................................................................ 1-1
Interchannel Time Displacement Error Test (1) and (2). ........................................................... 1-14
Intermodulation Distortion Test (1) ........................................................................................... 1-20
Linearity Tests (Dc) (1). ............................................................................................................ 1-34
Longitudinal Track Tests (1) and (2) .......................................................................................... 3-4
Longitudinally-Oriented Oxide Instrumentation Magnetic Tape ................................................ 5-8
Multispeed Record Level Test (1). ............................................................................................ 1-24
Multispeed Reproduce Transfer Levels Test (1). ...................................................................... 1-36
Polarity Test (1) ........................................................................................................................... 3-3
Record Head-Stack Azimuth Alignment (1)................................................................................ 1-2
Record Transfer Characteristic Test (1). .................................................................................... 1-25
Reproduce Head-Stack Azimuth Allignment (1) and (2) ............................................................ 1-4
Sensitivity .................................................................................................................................. 5-17
Serial HDDR PCM Bit Synchronizer Test (1) ........................................................................... 2-52
Short Wavelength Instantaneous Non-Uniformity (Dropout). .................................................. 5-13
Short Wavelength Output Uniformity ....................................................................................... 5-11
Signal-to-Noise Ratio (SNR). .................................................................................................... 5-18
Signal-to-Noise Ratio Margin Test (Using Additive Noise) (1) ................................................ 2-46
Signal-to-Noise Ratio Margin Test (Using Input Attenuator) (1) ............................................. 2-43
Signal-To-Noise Ratio Test (1) and (2). .................................................................................... 1-32
Signal-to-Noise Ratio Tests ....................................................................................................... 1-19

Speed Ratio Test (1)................................................................................................................... 2-41
Speed Variation and Timing Error Tests ..................................................................................... 1-7
Spurious Component Test (1). ................................................................................................... 1-33
Tape Speed Tests ......................................................................................................................... 1-5
Time Base Error Test (1) and (2). .............................................................................................. 1-11
Time Scaled Playback Test (1) and (2) ........................................................................................ 3-3
Wavelength Response and Output at 0.1 Upper Band Edge Wavelengths................................ 5-10