
` Category 1Category 2 Category 3 Category 4Lagniappe $100 $200 $300 $400 $500.
1
Document 11 Asset Category – Services and Terminations SPN
Asset Stewardship Report 2014
Chino Atako

Asset Stewardship Report 2014 Working draft v0.1 SPN Services and Terminations Version 2.0 All of the cost numbers displayed in this document are before the application of on-going efficiencies and real price effects.
2
Approved by Richard Wakelen / Barry Hatton Approved Date 03/03/2014
Document History
Version Date Details Originator Revision Class Section Update
1.0
13.02.2014 Original Chino Atako NA NA
1.1 24.02.2014 Preface added to the document
Chino Atako Minor NA
All costs reduced updated to reflect a reduction due to the impact of impact of remapping of redundant services to C26 and unplanned replacements to CV15a/CV15b
Chino Atako Minor
1.1, 1.3, 7.1.3, 7.3, Appendix 5, Appendix 8, Appendix 10
All volume tables updated to reflect a reduction due to the impact of remapping of redundant services to C26 and unplanned replacements to CV15a/CV15b
Chino Atako Minor Table 12
Added Appendices 8, 9 and 10 to show link between UKPN NAMP and the RIGs tables
Chino Atako Minor
Removed reference to Cutout replacements due to the smart meter rollout as this is covered in a separate document Annex 10 of our RIIO-ED1 business plan.
Chino Atako Minor
1.1, 1.3, 7.1.4, 7.3
Commentary updated to reflect revised costs figures (following remapping of redundant services to C26 and Unplanned replacements to CV15a/CV15b
Chino Atako Minor 7.3
Cutout charts updated to reflect exclusion of cutout replacements due to the smart meter rollout
Chino Atako Minor Figures 20 and 21
25.02.2014
Formatting of document to align with the style guide
Chino Atako Minor Preface
1.3 26.02.2014 Updated to align with Gold checklist issued on 26.02.3014
Chino Atako Minor Reference to tables and charts, Preface
1.4 27.02.2014
Explanation for the reduction in disposal volumes between the 2013 and 2014 business plan submissions provided
Chino Atako Minor Appendix 10
2.0 06.03.2014 Final Version Chino Atako

Asset Stewardship Report 2014 Working draft v0.1 SPN Services and Terminations Version 2.0 All of the cost numbers displayed in this document are before the application of on-going efficiencies and real price effects.
3
Preface
UK Power Networks uses Asset Stewardship Reports (‘ASR’) to describe the optimum asset
management strategy and proposals for different groups of assets. This optimised asset
management strategy and plan details the levels of investment required and the targeted
interventions and outputs needed. Separate ASRs define the most efficient maintenance and
inspection regimes needed and all documents detail the new forms of innovation which are
required to maximise value, service and safety for all customers and staff throughout the
ED1 regulatory period. Outline proposals for the ED2 period are also included.
Each DNO has a suite of approximately 20 ASR’s. Although asset policy and strategy is
similar for the same assets in each DNO the detailed plans and investment proposals are
different for each DNO. There are also local issues which must be taken into account.
Accordingly each DNO has its own complete set of ASR documents.
A complete list of titles of the ASR’s, a summary of capex and opex investment is included in
‘Document 20: Asset Stewardship Report: Capex/Opex Overview’. This document also
defines how costs and outputs in the various ASR’s build up UK Power Networks ‘NAMP’
(Network Asset Management Plan) and how the NAMP aligns with Ofgem’s ED1 RIGs
tables and row numbers.
Where ‘HI’ or asset ‘Health Index’ information is included please note predicted ED1 profiles
are before any benefits from ‘Load driven investment.’
This ASR has also been updated to reflect the feedback from Ofgem on our July 2013 ED1
business plan submission. Accordingly to aid the reader three additional appendices have
been added. They are;
1. Appendix 8 - Output NAMP/ED1 RIGS reconciliation: This section explains the
‘line of sight’ between the UKPN Network Asset Management Plan (NAMP)
replacement volumes contained in the Ofgem RIGS tables. The NAMP is the UKPN
ten year rolling asset management investment plan. It is used as the overarching
plan to drive both direct and indirect Capex and Opex interventions volumes and
costs. The volume and cost data used in this ASR to explain our investment plan is
taken from the UK Power Networks NAMP. Appendix 8 explains how the NAMP
outputs are translated into the Ofgem RIGS tables. The translation of costs from the
NAMP to the ED1 RIGS tables is more complex and it is not possible to explain this
in a simple table. This is because the costs of a project in the ‘NAMP’ are allocated to
a wide variety of tables and rows in the RIGS. For example the costs of a typical
switchgear replacement project will be allocated to a range of different Ofgem ED1
RIGs tables and rows such as CV3 (Replacement), CV5 (Refurbishment) CV6 (Civil
works) and CV105 (Operational IT Technology and Telecoms). However guidance
notes of the destination RIGs tables for NAMP expenditure are included in the table
in the Section 1.1 of the Executive Summary of each ASR.

Asset Stewardship Report 2014 Working draft v0.1 SPN Services and Terminations Version 2.0 All of the cost numbers displayed in this document are before the application of on-going efficiencies and real price effects.
4
2. Appendix 10 – Material changes since the June 2013 ED1 submission: This
section shows the differences between the ASR submitted in July 2013 and the ASR
submitted for the re-submission in March 2014. It aims to inform the reader the
changes made to volumes and costs as a result of reviewing the plans submitted in
July 2013. Generally the number of changes made is very small, as we believe the
original plan submitted in July 2013 meets the requirements of a well justified plan.
However there are areas where we have identified further efficiencies and
improvements or recent events have driven us to amend our plans to protect
customer safety and service.
We have sought to avoid duplication in other ED1 documents, such as ‘Scheme Justification
Papers’, by referring the reader to key issues of asset policy and asset engineering which
are included in the appropriate ASR documents.

Asset Stewardship Report 2014 Working draft v0.1 SPN Services and Terminations Version 2.0 All of the cost numbers displayed in this document are before the application of on-going efficiencies and real price effects.
5
Contents 1.0 Executive Summary SPN Services and Terminations ................................................. 7
Scope ..................................................................................................................... 7 1.1
Investment strategy ................................................................................................. 8 1.2
ED1 Proposals ........................................................................................................ 9 1.3
Innovation ............................................................................................................. 10 1.4
Risks and Opportunities ........................................................................................ 10 1.5
2.0 Description of Services and Terminations ................................................................. 10
Risers and Laterals ............................................................................................... 10 2.1
2.1.1 Risers and Lateral Statistical Age Profile ....................................................... 12
Underground services ........................................................................................... 13 2.2
Overhead services ................................................................................................ 13 2.3
Terminations (Cutouts) ......................................................................................... 14 2.4
3.0 Investment Drivers and Condition Measurement ...................................................... 15
Investment drivers................................................................................................. 15 3.1
3.1.1 Risers and Laterals ........................................................................................ 15
3.1.2 Services and terminations .............................................................................. 15
Condition Measurements ...................................................................................... 16 3.2
3.2.1 Inspection of Risers and Laterals ................................................................... 16
3.2.2 Inspection of underground services ............................................................... 17
3.2.3 Inspection of overhead services ..................................................................... 18
3.2.4 Inspection of Cut-outs .................................................................................... 18
4.0 Asset Assessment .................................................................................................... 19
Asset Health ......................................................................................................... 19 4.1
4.2 Asset Criticality ..................................................................................................... 21
4.3 Network Risk ......................................................................................................... 22
4.4 Data Validation ..................................................................................................... 22
4.5 Data Verification ................................................................................................... 22
4.6 Data Completeness .............................................................................................. 22
5.0 Intervention policies .................................................................................................. 23
Intervention options ............................................................................................... 23 5.1
5.1.1 Risers and Laterals ........................................................................................ 23
5.1.2 Services and Terminations ............................................................................. 23
5.1.3 Cutouts .......................................................................................................... 24
Asset Stewardship Report 2014 Working draft v0.1 SPN Services and Terminations Version 2.0 All of the cost numbers displayed in this document are before the application of on-going efficiencies and real price effects.
6
Policies: selecting preferred interventions ............................................................. 25 5.2
5.2.1 Opportunities for OPEX/CAPEX trade-offs ..................................................... 25
6.0 Innovation ................................................................................................................. 26
Risers and Laterals ............................................................................................... 26 6.1
7.0 ED1 Expenditure Requirements for Services and terminations ................................. 26
Constructing the plan ............................................................................................ 26 7.1
7.1.1 Risers and laterals ......................................................................................... 26
7.1.2 Underground services .................................................................................... 27
7.1.3 Overhead services ......................................................................................... 29
7.1.4 Cutouts .......................................................................................................... 30
Asset volumes & expenditure ................................................................................ 31 7.2
7.2.1 Risers and laterals ......................................................................................... 31
7.2.2 Underground Services ................................................................................... 32
7.2.3 Overhead services ......................................................................................... 34
7.2.4 Cutouts .......................................................................................................... 36
Commentary ......................................................................................................... 37 7.3
Sensitivity Analysis ............................................................................................... 38 7.4
8.0 Deliverability ............................................................................................................. 38
Appendices ......................................................................................................................... 39
Appendix 1 - Age profiles................................................................................................. 39
Appendix 2 - HI profiles ................................................................................................... 39
Appendix 3 - Fault data ................................................................................................... 40
Appendix 4 - WLC case studies ....................................................................................... 40
Appendix 5 - NLRE Expenditure plan .............................................................................. 41
Appendix 7: Named schemes .......................................................................................... 43
Appendix 8: Output NAMP/ED1 RIGS reconciliation ........................................................ 44
Appendix 9: Material changes since the June 2013 ED1 submission .............................. 45

Asset Stewardship Report 2014 Working draft v0.1 SPN Services and Terminations Version 2.0 All of the cost numbers displayed in this document are before the application of on-going efficiencies and real price effects.
7
1.0 Executive Summary SPN Services and Terminations
Scope 1.1
This document details SPN’s non-load related expenditure (NLRE) replacement
proposals for services (including risers and lateral services) and service terminations
for the ED1 period. This covers £27.8m worth of investments in ED1.
There are 2.25 million connected customers (including 67,500 multi-occupancy
premises with risers and laterals) in the SPN Licence area fed from:
c1.7 million underground services and
c100,000 overhead services
The 1.7 million underground services have an estimated Modern Equivalent Asset
Valuation (MEAV) of £2.3bn. The proposed investment in ED1 for underground
services is 0.02% of its MEAV per annum.
The 100,000 overhead services in the SPN region have an estimated MEAV of
£58m. The proposed investment for overhead services is 0.15% of its MEAV per
annum.
There are 2.3 million cutouts in SPN with an estimated MEAV of £751m. The
proposed ED1 investment is 0.05% of its MEAV per annum.
Replacement costs for these assets are held in the Networks Asset Management
Plan (NAMP) and in sections of the RIGS tables identified in Table 1.
A full list of abbreviations is included in Section 6.0 of Document 20: CAPEX OPEX
overview.

Asset Stewardship Report 2014 Working draft v0.1 SPN Services and Terminations Version 2.0 All of the cost numbers displayed in this document are before the application of on-going efficiencies and real price effects.
8
INVESTMENT TYPE
ED1
INVESTME
NT
NAMP
LINE
RIGS REFERENCEs
Risers and Laterals
£12.3m
1.46.04.6674 Replacement of Risers (£1.6m)
Volumes & Costs - RIGS Table CV110
Row 57
1.46.04.8519 Replacement of Laterals (£10.7m)
Volumes & Costs - RIGS Table CV110
Row 58
Asset Replacement (Underground services)
£4.1m
1.46.01.6671 Replace Metered Services (£3.2m)
Volumes - RIGS Table CV3:
Additions Row 13 – LV Service (UG)
Removals Row 141– LV Service (UG)
Costs - RIGS Table CV3:
Row 13 – LV Service (UG)
1.46.06.9455 UMS Service Replacement (SWA Only) - Non Chargeable Connections Work (£0.9m)
Asset Replacement (Overhead services)
£8.6m
1.46.03.6673 Replace Overhead Services - Ad Hoc Replacements & ESQC Response (£2.5m)
Volumes - RIGS CV3 Additions
Row 7 - LV Service (OHL) Removals
Row 135 - LV Service (OHL)
Costs – RIGS Table CV3: Row 7 - Underground
1.46.05.6672 Replacement of Mural Services (£6m)
Asset replacement (Cut-outs)
£2.8m
1.17.01.6532 Cut Outs Replaced (BAU)
Volumes - RIGS Table CV3:
Additions Row 20 – LV Cutout (Metered)
Removals Row 148 – LV Cutout (Metered)
Costs - RIGS Table CV3:
Row 20 – LV Cutout (Metered)
Table 1 – Investment Summary (Source: 19th February 2014 NAMP Table J Less Indirect)
Investment strategy 1.2
The investment strategy for services and terminations in SPN is to ensure that sufficient provisions are made available to:
Comply with Electricity Supply Quality and Continuity Regulations (ESQCR) and keep public risk to a minimum
Keep Customer Interruptions (CIs) and Customer Minutes Lost (CMLs) to a minimum
This will be achieved by:
Replacing ESQCR non-compliant services and terminations
Replacing services and terminations identified to be in poor condition

Asset Stewardship Report 2014 Working draft v0.1 SPN Services and Terminations Version 2.0 All of the cost numbers displayed in this document are before the application of on-going efficiencies and real price effects.
9
ED1 Proposals 1.3
Table 2 shows the investment profile for services and service terminations in SPN throughout ED1. Inspections costs for risers and laterals are held in “Document 14 - I&M, Faults and Trees”.
Table 2 – ED1 Investment Proposals (Source: 19th February NAMP Table J Less Indirect)
NAMP
Line(s) Asset Category 15/16 16/17 17/18 18/19 19/20 20/21 21/22 22/23
ED1
Total
Risers and laterals
1.46.04
Replacement of Risers 202 202 202 202 202 202 202 202 1,613
1.46.04
Replacement of Laterals 1,337 1,337 1,337 1,337 1,337 1,337 1,337 1,337 10,694
Underground Services
1.46.01 Replace Metered Services 448 448 448 422 374 374 374 374 3,260
1.46.06
UMS Service Replacement
(SWA Only) - Non Chargeable
Connections Work
107 107 107 107 107 107 107 107 854
Overhead services
1.46.03
Replace Overhead Services -
Ad Hoc Replacements & ESQC
Response
316 316 316 316 316 316 316 316 2,531
1.46.05
Replacement of Mural Services 753.1 753.1 753.1 753.1 753.1 753.1 753.1 753.1 6,024.4
Cutouts
1.17.01 Cut Outs Replaced (BAU) 668 446 223 223 223 460 273 273 2,788
Total (£k) 3,831 3,609 3,386 3,360 3,312 3,549 3,362 3,362 27,764

Asset Stewardship Report 2014 Working draft v0.1 SPN Services and Terminations Version 2.0 All of the cost numbers displayed in this document are before the application of on-going efficiencies and real price effects.
10
Innovation 1.4 UK Power Networks has adopted a new approach to inspect, maintain and replace risers and laterals located within multi-occupancy premises. A ten-year cycle of inspections is underway to confirm ownership and the condition of these risers and laterals. Based on sample inspections and testing of R&Ls carried out between 2011 and 2012 it was established that there are issues with the breakdown of insulation in VIR cables and rods. For this reason a proactive program of replacements will be carried out for risers and laterals with VIR to reduce the risk to third-parties and UK Power network staff working on R&Ls.
Risks and Opportunities 1.5
Description of similarly likely opportunities or risks arising in ED1 period
Uncertainties
Risk/Opportunity
UKPN to confirm ownership of R&Ls through a program of inspections because there is still uncertainty about the number of properties we are responsible for. The program of inspections may result in an increase or decrease in required expenditure to ED1
Probable outcome is
+/- 5% of the
investment in ED1
Risk/Opportunity
The smart metering program may result in a much higher or lower number of cutouts and service replacements allowed for in ED1
Probable outcome is
+/-5% of the
investment in ED1
Table 3 – Risks and Opportunities
2.0 Description of Services and Terminations
Risers and Laterals 2.1
Risers and laterals (R&Ls) are cables or busbars that form part of the equipment installed within multi-occupancy premises to distribute electricity to more than one dwelling or unit. In SPN riser and lateral systems that are of an adoptable standard, or would have been at the time of construction, are owned by UK Power Networks.
Analysis of the Postcode Address File (PAF) and the Meter Point Registration System (MPRS) data identified 157,000 premises in SPN containing a riser and lateral system that could be owned by UK Power Networks.
A program of inspections has commenced to confirm ownership and the condition of R&Ls in SPN. Initially a random sample from the identified list of 157,000 was inspected to verify the procedure. One of the learning points from this trial was that the productivity of the inspectors was severely reduced due to the geographical separation of the locations for inspection.

Asset Stewardship Report 2014 Working draft v0.1 SPN Services and Terminations Version 2.0 All of the cost numbers displayed in this document are before the application of on-going efficiencies and real price effects.
11
Hence, post code areas were selected for inspection to include urban and non-urban locations from across the entire licence area. This ensured that the sample was still representative whilst also using the resources in a productive and efficient manner.
The inspection of a 5% sample of SPN R&L assets was completed in 2012 and the results concerning ownership are shown in the following pie chart. 31% of properties were positively identified as containing a riser and lateral system owned by UKPN with 40% of properties identified as not containing UKPN owned R&Ls. 2% of properties containing R&L’s were unable to be located. UKPN believe they no longer exist.
Distributing the 26% for which there was no access to the property proportionally between properties with and without UKPN owned R&Ls indicates that UKPN will be responsible for 43% of the 157,000 properties identified in the initial analysis. This equates to some 67,500 properties.
Figure 1 – Ownership of Riser and Laterals – (Source: 5% representative sample
UKPN inspection data 2012)
The latest available inspection results show that the majority of cables inspected (77%) are PVC insulated, with the next most common cable type being Mineral Insulated (MICC). 3% of premises inspected contained Vulcanised India Rubber (VIR) cables. These VIR cables will all be targeted for replacement in ED1 because of the ESQC risks and deliverability constraints mean it is not practicable to remove them all any sooner

Asset Stewardship Report 2014 Working draft v0.1 SPN Services and Terminations Version 2.0 All of the cost numbers displayed in this document are before the application of on-going efficiencies and real price effects.
12
Figure 2 – Types of Cable Installations – (Source: Ellipse data extract 27 Feb 2013)
2.1.1 Risers and Lateral Statistical Age Profile
The age of R&L assets is difficult to determine even from an on-site inspection by an experienced inspector. In order to produce an age profile for risers and laterals, the type of cables installed has been used to determine an age profile for the known population using the following rules:
1: Expected installation dates for different cable types have been determined. The riser and lateral population has been smoothed evenly over the entire date range for that type.
Cable asset types and date ranges used:
Lead covered 1920 – 1945 VIR 1935 – 1955 VIR covered rods 1935 – 1955 MICC concentric 1945 – 1978 Mineral Insulated 1945 – 1978 Busbar System 1950 - 1978 PVC concentric 1970 – 2000 PVC covered rods 1955 – 1980 PVC 1955 – 2000 Steel wire armoured 1955 – 2000 XLPE 1990 – Present LSF (Low smoke) 1990 - Present Other Smooth across date range
2: The oldest quartile of the cable type recorded in a particular riser and lateral installation will be used to determine in which date range the asset is replaced.

Asset Stewardship Report 2014 Working draft v0.1 SPN Services and Terminations Version 2.0 All of the cost numbers displayed in this document are before the application of on-going efficiencies and real price effects.
13
Underground services 2.2A service is an electrical line which connects either street furniture requiring supply, or no more than four consumer installations in adjacent buildings, to a distribution main. There are 1.7 million underground services in the SPN licence area. Figure 3 shows the age profiles for these services. The majority of the overhead line services in SPN were installed in the 1970s and 1980s. The average age of the oldest 10% of Underground Services is 91 years.
Figure 3 shows that there was a peak of installation of underground services in the 1960s. It is important to note that there is a sizeable population of underground service cables installed pre-1920, the 1930s and 1940s. 31% of the underground service cables in SPN will be 70 years or older at the start of RIIO-ED1 rising to 42% at the end of ED1 (without investment).
Figure 3 – LV Service (UG) Age Profile (Source – RIGS 2012 CV3 Table V5)
Overhead services 2.3
There are 100,000 overhead services in the SPN licence area. Figure 4 shows the age profiles for these services. The majority of the overhead line services in SPN were installed in the 1970s and 1980s. 2% of the LV overhead line services will be 70 years or older at the start of ED1 and will rise to 6% at the end of ED1 without investment.

Asset Stewardship Report 2014 Working draft v0.1 SPN Services and Terminations Version 2.0 All of the cost numbers displayed in this document are before the application of on-going efficiencies and real price effects.
14
Figure 4 – LV Service OHL Age Profile (Source – RIGS 2012 CV3 Table V5)
Terminations (Cutouts) 2.4
UK Power Network does not record information on the age profile of cutouts. We do not have a routine inspection regime for cutouts hence do not have age profile information for them. Cutouts are inspected by meter operators as part of their routine meter inspections. They report the condition of cutouts by exception (i.e. only those in poor condition).
Figure 5 – Photos of Cut Outs
Typically, less than 0.2% of cutouts are replaced each year. Figure 6 shows the
replacement rate per year for cutouts in SPN.

Asset Stewardship Report 2014 Working draft v0.1 SPN Services and Terminations Version 2.0 All of the cost numbers displayed in this document are before the application of on-going efficiencies and real price effects.
15
0.00%
0.05%
0.10%
0.15%
0.20%
0.25%
20
05
/06
20
06
/07
20
07
/08
20
08
/09
20
09
/10
20
10
/11
20
11
/12
Re
pla
cem
en
t ra
te
Regulatory year
Cutout replacement rate
Cutout replacement rate per year
Average cutout replacement rate per year
Figure 6 – Cutout replacement rate (Source – DPCR5 FBPQ and CV3 RIGS table 19th February 2014)
3.0 Investment Drivers and Condition Measurement
Investment drivers 3.1
3.1.1 Risers and Laterals
The main drivers for the replacement of R&Ls are the following:
Electricity Supply Quality and Continuity Regulations (ESQCR)
Condition of assets with known failure modes (e.g. VIR Cables)
Security and quality of supply to customers
Reduction in Customer Interruptions (CIs) and Customer Minutes Lost (CMLs)
3.1.2 Services and terminations The Investment drivers for the replacement of services (underground and overhead) and service terminations (cutouts) include:
Electricity Supply Quality and Continuity Regulations
Security and quality of supply to customers
Condition (including defects) of services and terminations
Reduction in Customer Interruptions (CIs) and Customer Minutes Lost (CMLs)
Asset Stewardship Report 2014 Working draft v0.1 SPN Services and Terminations Version 2.0 All of the cost numbers displayed in this document are before the application of on-going efficiencies and real price effects.
16
These drivers will be supported by:
ESQCR risk assessments
Asset condition*
Asset and network performance.
Analysis of current and future work costs.
Historic, current and emerging equipment and diagnostic technologies.
Stakeholder options**
* Specific information is obtained from UKPN staff carrying out work at premises or third parties (i.e. meter operators and household occupants).
** In setting investment levels for ED1, consideration has been given to the impact of the smart meter roll out programme between 2014 and 2019
Condition Measurements 3.2
3.2.1 Inspection of Risers and Laterals
A methodology has been developed using UKPN’s Meter Point Registration System
(MPRS) to identify addresses where multiple occupancy or multiple supply points are
located. The methodology involved searching for postal addresses where more than
one electricity supply point was located. Key words were used such as Flat, House,
Mansion, Court etc.
This analysis was supplemented by the analysis of the Postcode Access Files (PAF)
and identified 157,000 potential multi occupancy premises in SPN.
A 10 year program of inspections has been commenced to verify ownership and
condition of R&Ls identified from the MPRS/PAF analysis.
As part of the inspection process condition points and defects are recorded using a
hand held devices (HHD). This ensures that good quality data is captured and
recorded in the asset register in a timely manner hand at the point of inspection.
When an inspection HHD script is run the user answers set questions, specific to
each asset type, about the condition and allows defects to be recorded, reviewed and
cleared.
Key condition points collected during the inspection process include:
Overall condition of the riser(s).
Overall condition of the lateral(s).
Overall condition of the distribution board(s)/cut-out(s)
These are assessed on a condition rating (CR) scale from 1 to 4 where a CR1
indicates an asset is new and CR4 indicates it is in poor condition. Table 4 shows all
the condition rating descriptions.
Asset Stewardship Report 2014 Working draft v0.1 SPN Services and Terminations Version 2.0 All of the cost numbers displayed in this document are before the application of on-going efficiencies and real price effects.
17
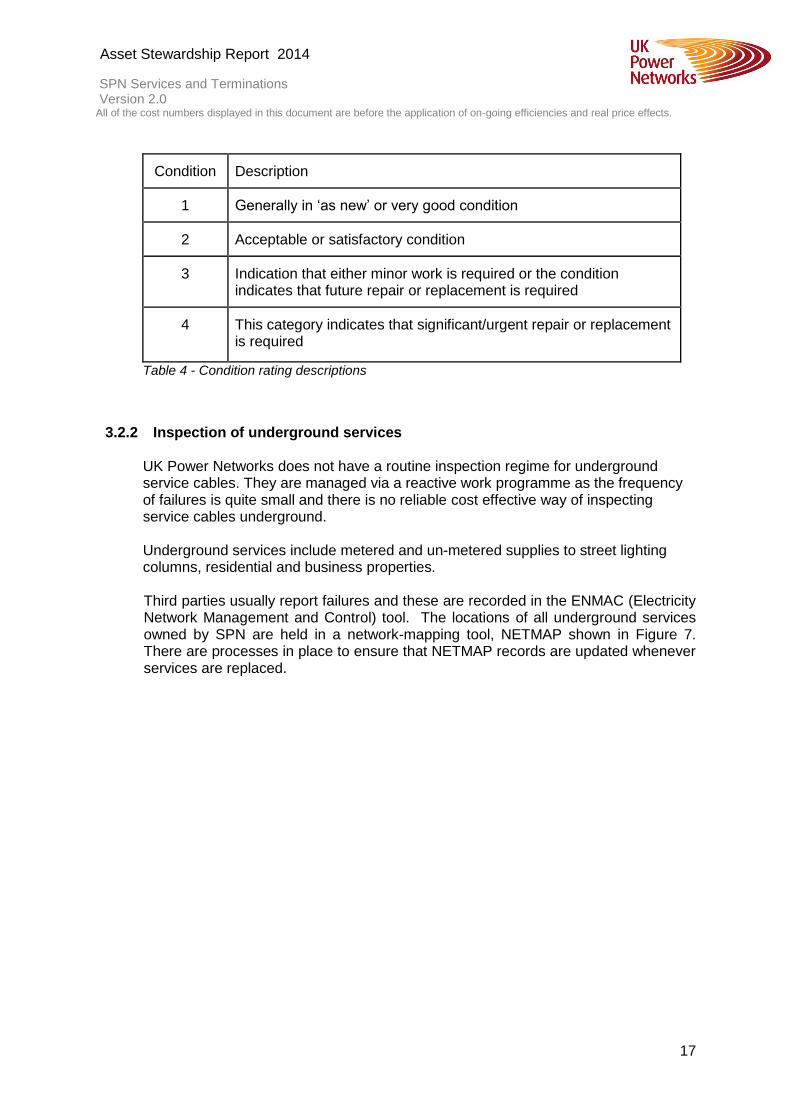
Condition Description
1 Generally in ‘as new’ or very good condition
2 Acceptable or satisfactory condition
3 Indication that either minor work is required or the condition indicates that future repair or replacement is required
4 This category indicates that significant/urgent repair or replacement is required
Table 4 - Condition rating descriptions
3.2.2 Inspection of underground services UK Power Networks does not have a routine inspection regime for underground service cables. They are managed via a reactive work programme as the frequency of failures is quite small and there is no reliable cost effective way of inspecting service cables underground.
Underground services include metered and un-metered supplies to street lighting columns, residential and business properties.
Third parties usually report failures and these are recorded in the ENMAC (Electricity Network Management and Control) tool. The locations of all underground services owned by SPN are held in a network-mapping tool, NETMAP shown in Figure 7. There are processes in place to ensure that NETMAP records are updated whenever services are replaced.

Asset Stewardship Report 2014 Working draft v0.1 SPN Services and Terminations Version 2.0 All of the cost numbers displayed in this document are before the application of on-going efficiencies and real price effects.
18
Figure 7 - NETMAP view of services and mains
3.2.3 Inspection of overhead services
Individual overhead line services are inspected on a four year cycle as part of routine
full patrols and safety patrols for low voltage mains overhead lines. Hands held
devices (HHDs) are used on site at the point of inspection to record condition,
defects, ESQC ratings and ESQC compliance. The information collected is used to
create and prioritise replacement or other remedial work programmes. In addition
historical fault rates are examined to set budgets.
3.2.4 Inspection of Cut-outs
Condition assessment of these assets is mainly through exception reporting by
metering service companies as required by the Meter Operation Code of Practice
Agreement (MOCOPA) agreement.
The Meter Operation Code of Practice Agreement (MOCOPA) is an Agreement
between electricity distribution businesses and electricity meter operators in Great
Britain.
Following the completion of the smart meter rollout there will be fewer visits to meters
by the meter operators. Issues identified at the cutout are fed back to UK Power
Networks by meter inspectors or household occupants. The frequency of meter
readings varies by region but is typically at least once a year.

Asset Stewardship Report 2014 Working draft v0.1 SPN Services and Terminations Version 2.0 All of the cost numbers displayed in this document are before the application of on-going efficiencies and real price effects.
19
4.0 Asset Assessment
Asset Health 4.1
4.1.1 Risers and Laterals There is currently no Health Index Framework for risers and laterals however an inspection programme which commenced in 2011 is capturing condition points associated with the lateral, the riser and the associated distribution boards. Condition Point 1 is ‘As New’ with Condition Point 4 being ‘Poor Condition’.
Figure 8 - Condition Rating of Risers and Laterals (Source: Ellipse data extract 27 Feb 2013)
4.1.2 Services and Terminations (including cutouts) There is no Health Index Framework for services and cutouts. However trends can be observed from fault rates and historical rates of replacement. All faults are recorded on the ENMAC (Electricity Network Management and Control) system. UK power Networks has developed a tool (fault cube) to extract and analyse fault data from ENMAC. Details of fault causes and trends can be extrapolated from the fault cube.
Asset Stewardship Report 2014 Working draft v0.1 SPN Services and Terminations Version 2.0 All of the cost numbers displayed in this document are before the application of on-going efficiencies and real price effects.
20
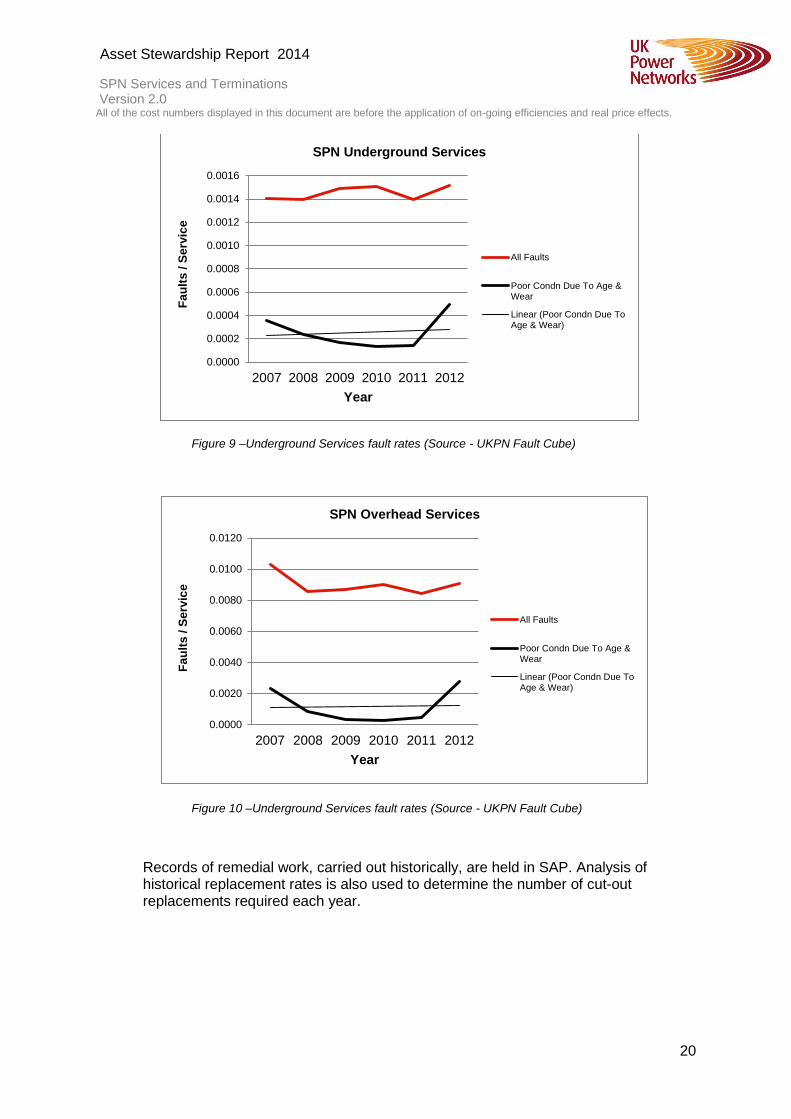
Figure 9 –Underground Services fault rates (Source - UKPN Fault Cube)
Figure 10 –Underground Services fault rates (Source - UKPN Fault Cube)
Records of remedial work, carried out historically, are held in SAP. Analysis of historical replacement rates is also used to determine the number of cut-out replacements required each year.
0.0000
0.0002
0.0004
0.0006
0.0008
0.0010
0.0012
0.0014
0.0016
2007 2008 2009 2010 2011 2012
Fa
ult
s / S
erv
ice
Year
SPN Underground Services
All Faults
Poor Condn Due To Age &Wear
Linear (Poor Condn Due ToAge & Wear)
0.0000
0.0020
0.0040
0.0060
0.0080
0.0100
0.0120
2007 2008 2009 2010 2011 2012
Fa
ult
s / S
erv
ice
Year
SPN Overhead Services
All Faults
Poor Condn Due To Age &Wear
Linear (Poor Condn Due ToAge & Wear)

Asset Stewardship Report 2014 Working draft v0.1 SPN Services and Terminations Version 2.0 All of the cost numbers displayed in this document are before the application of on-going efficiencies and real price effects.
21
4.2 Asset Criticality
4.2.1 Risers and laterals Replacement of risers and laterals that have reached the end of life are prioritised for replacement on the numbers of occupants within the premises and number of floors.
A criticality rating table (see table 5) has been developed to assist in the prioritisation of work and the ability of the Fire and Rescue service to evacuate residents in the event of fire using external ladders should the internal staircase be inaccessible.
Table 5 – Criticality table
4.2.2 Underground services and cut-outs
There is no criticality framework for underground services & cut-outs. However future
consideration may be given to the size of the services, and whether they are single or
three-phase supplies to determine a criticality framework.
4.2.3 Overhead services There is no criticality framework for overhead services. However overhead services are assessed and prioritised for replacement or other remedial work based on the ESQC risk rating. The ESQC risk rating is dependent on the equipment risk rating and location risk. The ESQC equipment is assessed as High, Medium or Low based on the following
rules:
High risk - Service - Not up to UK Power Network’s Specification (Reference Overhead line Inspectors handbook)
Medium risk – Service is insulated
Low risk – Concentric, Duplex/Triplex, Service – ABC The ESQC location risk is assessed based on the location of the service.
Criticality Category Description
1 Up to 2 floors and 4 premises
2 Up to 2 floors and more than 4 premises
3 3-4 floors and up to 8 premises
4 3-4 floors and more than 8 premises
5 More than 4 floors

Asset Stewardship Report 2014 Working draft v0.1 SPN Services and Terminations Version 2.0 All of the cost numbers displayed in this document are before the application of on-going efficiencies and real price effects.
22
4.3 Network Risk
There is no separate network risk framework for cutouts. However the number of non-compliant cutouts reported on the network will provide a measure of assessing network risk.
4.4 Data Validation
R&L inspection data entered using handheld devices uses table validation when the data is input on site. This ensures only data within the specified range can be input.
All reports received from third parties or UK Power Networks staff will be assessed
against the intervention policies (outlined in section 5.1) to determine the need to
replace a service or cutout.
4.5 Data Verification
There is a well-documented process to ensure that NETMAP is updated when services are replaced. A key part of the process requires field staff to complete System Alternation Notices (S.A.N) whenever services are replaced. These S.A.Ns are sent to the Network records team and the Network Control teams.
Cutouts are not recorded on any SPN systems.
4.6 Data Completeness
We are carrying out surveys of risers and laterals in SPN, as part of a ten-year programme, to verify ownership. All of our overhead services and underground services are recorded on our network mapping tool, NETMAP.
Asset Stewardship Report 2014 Working draft v0.1 SPN Services and Terminations Version 2.0 All of the cost numbers displayed in this document are before the application of on-going efficiencies and real price effects.
23
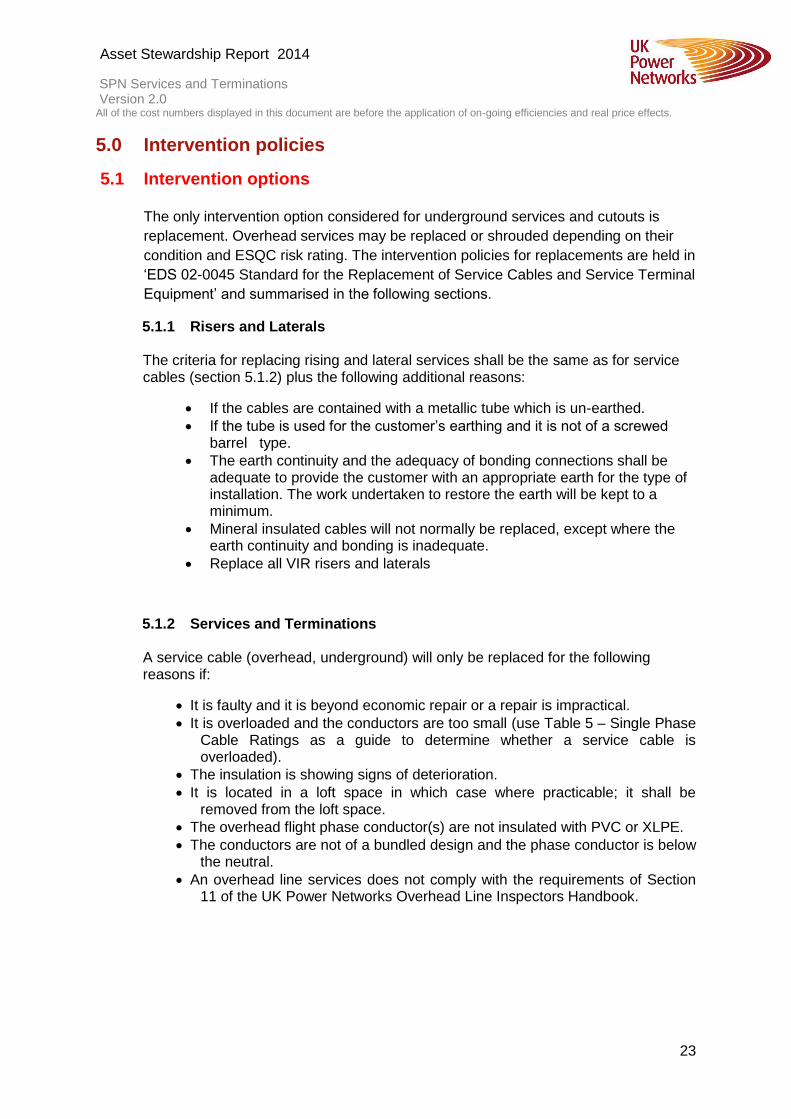
5.0 Intervention policies
Intervention options 5.1
The only intervention option considered for underground services and cutouts is
replacement. Overhead services may be replaced or shrouded depending on their
condition and ESQC risk rating. The intervention policies for replacements are held in
‘EDS 02-0045 Standard for the Replacement of Service Cables and Service Terminal
Equipment’ and summarised in the following sections.
5.1.1 Risers and Laterals The criteria for replacing rising and lateral services shall be the same as for service cables (section 5.1.2) plus the following additional reasons:
If the cables are contained with a metallic tube which is un-earthed.
If the tube is used for the customer’s earthing and it is not of a screwed barrel type.
The earth continuity and the adequacy of bonding connections shall be adequate to provide the customer with an appropriate earth for the type of installation. The work undertaken to restore the earth will be kept to a minimum.
Mineral insulated cables will not normally be replaced, except where the earth continuity and bonding is inadequate.
Replace all VIR risers and laterals
5.1.2 Services and Terminations
A service cable (overhead, underground) will only be replaced for the following reasons if:
It is faulty and it is beyond economic repair or a repair is impractical.
It is overloaded and the conductors are too small (use Table 5 – Single Phase Cable Ratings as a guide to determine whether a service cable is overloaded).
The insulation is showing signs of deterioration.
It is located in a loft space in which case where practicable; it shall be removed from the loft space.
The overhead flight phase conductor(s) are not insulated with PVC or XLPE.
The conductors are not of a bundled design and the phase conductor is below the neutral.
An overhead line services does not comply with the requirements of Section 11 of the UK Power Networks Overhead Line Inspectors Handbook.

Asset Stewardship Report 2014 Working draft v0.1 SPN Services and Terminations Version 2.0 All of the cost numbers displayed in this document are before the application of on-going efficiencies and real price effects.
24
Cable Type Size (in2) Maximum Rating (A)
Paper Insulated, lead sheathed
0.007(7/0.036) 50
Paper Insulated, lead sheathed
0.01 (7/0.044) 60
Paper Insulated, lead sheathed
0.0145 (7/0. 052) 75
Mineral insulated 0.007 50
Mineral insulated 0.01 60
Mineral insulated 0.0145 75
Table 6 – Single Phase Cable Ratings
*Overhead services may be shrouded with Insuline LV Conductor shrouding if they are in good
condition, but there are clearance issues that cannot easily be resolved.
Figure 11 shows a section of cable being covered with Insuline conductor. Insuline
insulation is considered an effective insulation when used on bare wire overhead
lines. It can be used to mitigate the risk of horizontal clearances, e.g. buildings, street
lights and climbable trees.
Figure 11: Insuline conductor
5.1.3 Cutouts
A cut-out shall only be changed under the following circumstances, if:
It is damaged or faulty
It is of a type with fuse in the neutral
It is of a type with re-wireable fuses
The metal clad casing is unearthed
The cut-out is deemed to be overloaded.
If a PME connection is required and the cut-out is not suitable for this purpose
Asset Stewardship Report 2014 Working draft v0.1 SPN Services and Terminations Version 2.0 All of the cost numbers displayed in this document are before the application of on-going efficiencies and real price effects.
25
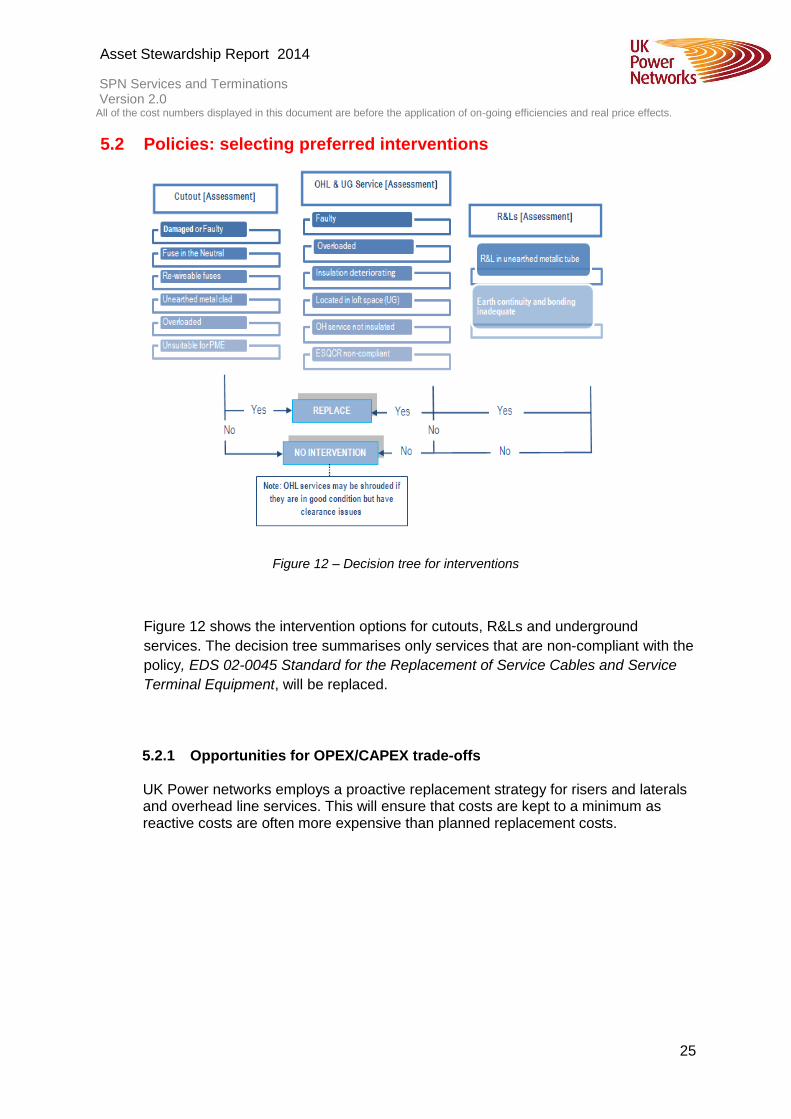
Policies: selecting preferred interventions 5.2
Figure 12 – Decision tree for interventions
Figure 12 shows the intervention options for cutouts, R&Ls and underground
services. The decision tree summarises only services that are non-compliant with the
policy, EDS 02-0045 Standard for the Replacement of Service Cables and Service
Terminal Equipment, will be replaced.
5.2.1 Opportunities for OPEX/CAPEX trade-offs
UK Power networks employs a proactive replacement strategy for risers and laterals and overhead line services. This will ensure that costs are kept to a minimum as reactive costs are often more expensive than planned replacement costs.

Asset Stewardship Report 2014 Working draft v0.1 SPN Services and Terminations Version 2.0 All of the cost numbers displayed in this document are before the application of on-going efficiencies and real price effects.
26
6.0 Innovation
Risers and Laterals 6.1
UK Power networks have adopted a new approach to inspect, maintain and replace risers and laterals located within multi-occupancy premises. A ten-year cycle of inspections will be carried out to confirm ownership and the condition of these risers and laterals. In SPN the policy is that riser and lateral systems that are of an adoptable standard, or would have been at the time of construction, are owned by the Company.
Based on sample inspections and testing, of R&Ls, completed in 2012 it was established that there are issues with the breakdown of insulation in Vulcanised India Rubber cables and rods. The insulation of VIR type cable is known to degrade over time in a manner which can lead to sections of insulation breaking away under mechanical manipulation. All VIR type cable operated by UKPN would be expected to be at least 50 years old and installed in areas open to public access e.g. basements, broom cupboards, walls of flats adjacent to the metering. There is a therefore a high likelihood of inadvertent damage to these installations by third parties which could potentially lead to fire or exposed conductors coming into contact with persons. For these reasons a proactive program of replacements will be carried out for risers and laterals with VIR.
7.0 ED1 Expenditure Requirements for Services and terminations
Constructing the plan 7.1
7.1.1 Risers and laterals
Of the 157,000 properties initially identified, the inspection results obtained in Section 2 indicate that UKPN can expect to confirm ownership of 43% of these properties upon completion of the inspection programme. This equates to 67,500 properties. See Section 2 for further information. The inspection results in Section 2 also show that 3.5% of the riser and lateral installations inspected were in poor condition including those insulated with Vulcanised India Rubber (3%). This means that asset replacement is required in 3.5% of the 67,500 properties which is some 2360 properties.

Asset Stewardship Report 2014 Working draft v0.1 SPN Services and Terminations Version 2.0 All of the cost numbers displayed in this document are before the application of on-going efficiencies and real price effects.
27
Each property contains on average 4 laterals and 0.4 risers. i.e. not all properties contain a riser but just laterals installed from a ground floor intake position. Therefore 8,896 laterals and 896 risers require replacements which have been phased over ED1.
15/16 16/17 17/18 18/19 19/20 20/21 21/22 22/23
ED1 Total
Planned Replacement of Laterals
1,112 1,112 1,112 1,112 1,112 1,112 1,112 1,112 8,912
Planned Replacement of Risers
112 112 112 112 112 112 112 112 896
Table 7 - Risers and laterals planned replacement volumes in ED1 (Source: 19th February 2014 NAMP Table O)
7.1.2 Underground services
The investment levels for underground services have been set based on historical achievements. Figure 13 shows the historical replacement volumes and the corresponding fault rates for underground services.
Historical and forecast replacement volumes

Asset Stewardship Report 2014 Working draft v0.1 SPN Services and Terminations Version 2.0 All of the cost numbers displayed in this document are before the application of on-going efficiencies and real price effects.
28
Historical fault rate
Figure 13: Underground services justification
The level of investment set in ED1 is similar to the average achievement over the 7-year period 2005 to 2012, excluding the two years of unusually high replacement activity 2007/2008 and 2009/2010. Table 7 shows the historical achievement volumes compared to the average annual volume proposed in ED1.
2005/06 2006/07 2007/08 2008/09 2009/10 2010/11 2011/12 *Average - Last 7 years
Average ED1
UG Service Replacement (Count)
419 860 1,174 501 1,229 385 89 451 482
Table 8. Underground service removals placement volumes 2005 – 2012 (*Excludes the two years of unusually high replacement activity 2007/2008 and 2009/2010)
The ED1 proposals are higher than the achievements in the first few years of
DPCR5. This is necessary to curtail the increasing condition-related fault rates
evident in figure 13.

Asset Stewardship Report 2014 Working draft v0.1 SPN Services and Terminations Version 2.0 All of the cost numbers displayed in this document are before the application of on-going efficiencies and real price effects.
29
7.1.3 Overhead services
The investment levels for overhead services have been set based on historical achievement and a review of condition-related fault rates. There has been a decreasing trend in overall fault rates, for overhead services in the last five years. However there has also been an increasing trend in condition-related failures of overhead services in the last few years.
Fault rates (overhead services)
Historical and forecast replacements (overhead services)
Figure 14 Overhead services justification

Asset Stewardship Report 2014 Working draft v0.1 SPN Services and Terminations Version 2.0 All of the cost numbers displayed in this document are before the application of on-going efficiencies and real price effects.
30
The increasing condition-related failures could be attributed to the ageing services population and the small number of replacements at the start of ED1. For this reason the replacement rates for the remainder of DPCR5 and ED1 has been increased. The ED1 proposals are similar to the volumes of achievement at the start and end of DPCR4.
7.1.4 Cutouts The investment proposal for planned cutout replacements in ED1 is based on historical achievements and the anticipated impact of the smart meter rollout programme which will be carried out between 2014 and 2019. During the smart meter roll out, meter operators will inspect all cutouts and service terminations associated with meters. It is assumed that approximately 2% of all cutouts will be replaced between 2013 and 2020, due to the impact of the smart meter roll out programme. As a result the number of planned replacements is expected to decrease in that period. A review of historical replacements show that typically 0.16% of the cutout population is replaced each year. Following the smart meter rollout the replacement rate is expected to reduce to 0.05% of the population. Table 9 shows the comparative figures.
Licence
area
Cutout volumes
excluding half-hourly
customers
Steady state replacement
rate
Cut out replacements post-
smart meter rollout
(2021/2022 – 2022/2023)
SPN
2,114,809
0.16% of the population;
3,454
0.05% of the population;
1,057
Table 9: Forecast rates of cutout replacements before and after the smart meter rollout
Table 10 shows the annual replacement volumes between 2013 and 2023. The reduced cutout replacements between 2015/2016 and 2020/2021 is due to the large numbers of other cutouts that will be replaced during the smart meter rollout
NAMP
Ref
Description 2013/2
014
2014/2
015
2015/2
016
2016/2
017
2017/2
018
2018/2
019
2019/2
020
2020/2
021
2021/2
022
2022/2
023
1.17.01.
6532
Cut Outs
Replaced 3,454 3,454 2,591 1,727 864 864 864 1,782 1,057 1,057
Table 10: Forecast cutout replacement volumes (Source: 19th February 2014 NAMP Table O)

Asset Stewardship Report 2014 Working draft v0.1 SPN Services and Terminations Version 2.0 All of the cost numbers displayed in this document are before the application of on-going efficiencies and real price effects.
31
Asset volumes & expenditure 7.2
7.2.1 Risers and laterals
Figures 12 and 13 show the historical and forecast work for the replacement of risers and laterals in SPN. The ramp up in the first few years will allow us to secure resources to achieve the steady state forecasts in ED1.
Figure 15 - R&L volumes DPCR5-ED2 (Source – 19th February 2014 NAMP Table O)
Figure 16 - R&L costs DPCR5 - ED2 (Source – 19th February 2014 NAMP Table J LESS INDIRECT)
0
200
400
600
800
1,000
1,200
2010
/201
1
2011
/201
2
2012
/201
3
2013
/201
4
2014
/201
5
2015
/201
6
2016
/201
7
2017
/201
8
2018
/201
9
2019
/202
0
2020
/202
1
2021
/202
2
2022
/202
3
2023
/202
4
2024
/202
5
2025
/202
6
2026
/202
7
2027
/202
8
2028
/202
9
2029
/203
0
2030
/203
1
Co
un
t
Year
R&L volumes DPCR5 - ED2
Planned Replacement of Laterals Planned Replacement of Risers
DPCR5 ED1 ED2
0
200
400
600
800
1,000
1,200
1,400
1,600
2010
/20
11
2011
/20
12
2012
/20
13
2013
/20
14
2014
/20
15
2015
/20
16
2016
/20
17
2017
/20
18
2018
/20
19
2019
/20
20
2020
/20
21
2021
/20
22
2022
/20
23
2023
/202
4
2024
/20
25
2025
/20
26
2026
/20
27
2027
/20
28
2028
/20
29
2029
/20
30
2030
/20
31
£k
Year
R&L Expenditure DPCR5 - ED2
Planned Replacement of Laterals Planned Replacement of Risers
DPCR5 ED1 ED2

Asset Stewardship Report 2014 Working draft v0.1 SPN Services and Terminations Version 2.0 All of the cost numbers displayed in this document are before the application of on-going efficiencies and real price effects.
32
7.2.2 Underground Services
Figures 17 and 18 show the forecast volumes and costs for the replacement of
underground services.
Figure 17 – Underground Services Volumes DPCR4 – ED2
Sources: DPCR4 & DPCR5 FBPQ - Table NL3 (DPCR5 FBPQ)
DPCR5 (First three years) - 2013/2014 RIGS CV3 table DPCR5 (Last Two years) - 2013/2014 RIGS CV3 table ED1 - 2013/2014 RIGS CV3 table ED2 - From Age-Based Analysis

Asset Stewardship Report 2014 Working draft v0.1 SPN Services and Terminations Version 2.0 All of the cost numbers displayed in this document are before the application of on-going efficiencies and real price effects.
33
Figure 18 – Underground Services Costs DPCR4 – ED2
Sources: DPCR4 & DPCR5 FBPQ - Table NL1 (DPCR5 FBPQ)
DPCR5 (First three years) - 2013/2014 RIGS CV3 table DPCR5 (Last Two years) – 14th June NAMP (Table J LESS INDIRECT) ED1 – 14th June NAMP (Table J LESS INDIRECT) ED2 - From Age-Based Analysis * UCI

Asset Stewardship Report 2014 Working draft v0.1 SPN Services and Terminations Version 2.0 All of the cost numbers displayed in this document are before the application of on-going efficiencies and real price effects.
34
7.2.3 Overhead services
Figures 19 and 20 show the forecast volumes and costs for the replacement of
underground services.
Figure 19 – Overhead Line Services Volumes DPCR4 – ED2
Sources : DPCR4 & DPCR5 FBPQ - Table NL3 (DPCR5 FBPQ) DPCR5 (First three years) - 2013/2014 RIGS CV3 table DPCR5 (Last Two years) - 2013/2014 RIGS CV3 table ED1 - 2013/2014 RIGS CV3 table ED2 - From Age-Based Analysis Note - 2010/11, 2011/12 and 2012/13 volumes are ‘equivalent’ volumes from expenditure observed in the three years; NB – A change request needs to be submitted to smooth the ED1 costs as well as reduce 2013/14 and 2014/15 costs to match ED1.
Asset Stewardship Report 2014 Working draft v0.1 SPN Services and Terminations Version 2.0 All of the cost numbers displayed in this document are before the application of on-going efficiencies and real price effects.
35
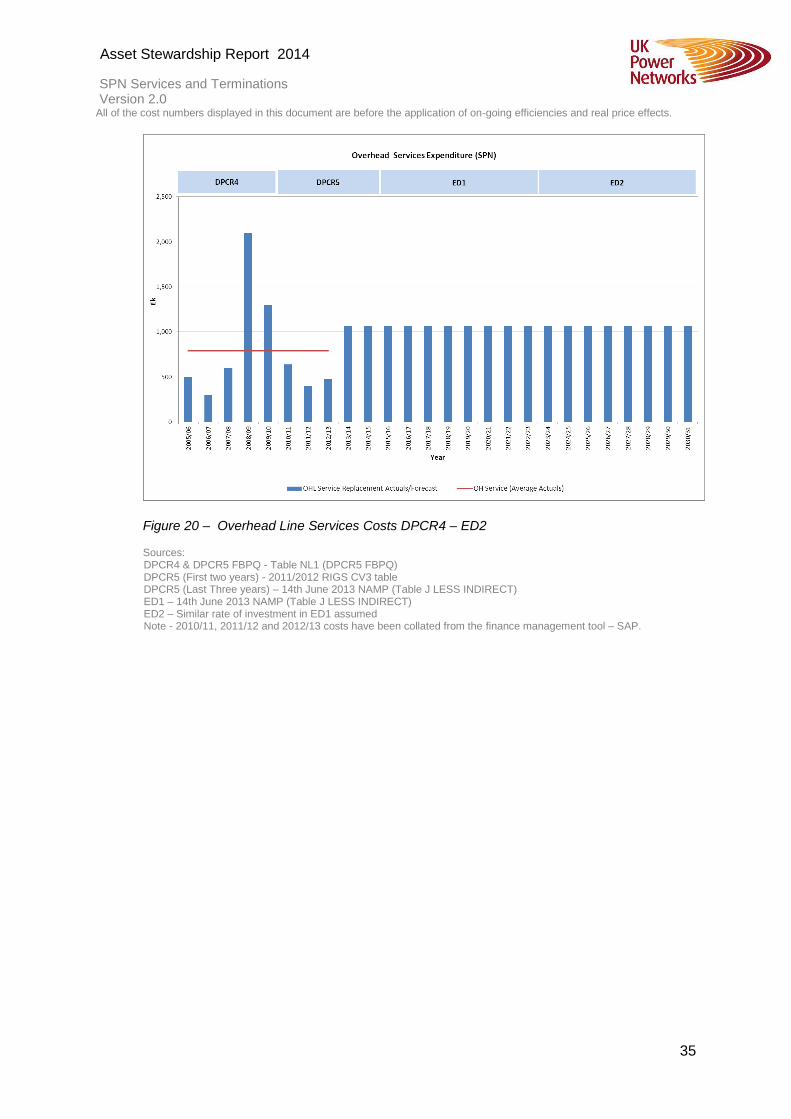
Figure 20 – Overhead Line Services Costs DPCR4 – ED2
Sources: DPCR4 & DPCR5 FBPQ - Table NL1 (DPCR5 FBPQ)
DPCR5 (First two years) - 2011/2012 RIGS CV3 table DPCR5 (Last Three years) – 14th June 2013 NAMP (Table J LESS INDIRECT) ED1 – 14th June 2013 NAMP (Table J LESS INDIRECT) ED2 – Similar rate of investment in ED1 assumed Note - 2010/11, 2011/12 and 2012/13 costs have been collated from the finance management tool – SAP.

Asset Stewardship Report 2014 Working draft v0.1 SPN Services and Terminations Version 2.0 All of the cost numbers displayed in this document are before the application of on-going efficiencies and real price effects.
36
7.2.4 Cutouts
Figure 21 – Cutout Volumes DPCR4-ED2
Sources: DPCR4 & DPCR5 FBPQ - Table NL3 (DPCR5 FBPQ) DPCR5 (First three years) - 2013/2014 RIGS CV3 table DPCR5 (Last Two years) - 2013/2014 RIGS CV3 table ED1 - 2013/2014 RIGS CV3 table ED2 - From Age-Based Analysis

Asset Stewardship Report 2014 Working draft v0.1 SPN Services and Terminations Version 2.0 All of the cost numbers displayed in this document are before the application of on-going efficiencies and real price effects.
37
Figure 22 – Cutout costs DPCR4 – ED2
Sources: DPCR4 & DPCR5 FBPQ - Table NL1 (DPCR5 FBPQ)
DPCR5 (First three years) - 2013/2014 RIGS CV3 table DPCR5 (Last Two years) – 14th June NAMP (Table J LESS INDIRECT) ED1 – 14th June NAMP (Table J LESS INDIRECT) ED2 - From Age-Based Analysis
Commentary 7.3
The proposed investment programme for the replacement of R&Ls in ED1 in SPN is £12.3m and a ramp up to this level is already underway in DPCR5. No allowance was agreed for proactive inspections and replacement of R&Ls in DPCR5 because there was no proactive replacement policy. In 2011 a review of the policy on R&Ls was carried out which resulted in the inspection of a sample of R&Ls in SPN. The results of the inspections were extrapolated to determine investment requirements in ED1. The proposed level of investment in ED1 will ensure that sufficient provisions are available to replace R&Ls in poor condition and those with VIR, identified from routine inspections.
The proposed investment programme for the replacement of overhead and underground services in SPN is £12.6m (Underground services - £4.1m; overhead services - £8.5m). The proposals are based on historical achievements and observed fault rates. A key feature of the plan is that the investment levels have been set to manage the level of condition-related faults associated with services. Achievements for underground services in the first two years of DPCR5 have been lower than planned . This has led to an increase in condition-related faults from 2011 to 2012

Asset Stewardship Report 2014 Working draft v0.1 SPN Services and Terminations Version 2.0 All of the cost numbers displayed in this document are before the application of on-going efficiencies and real price effects.
38
(see Figure 9). The investment proposals for services have been increased from 2013 onwards to ensure that the condition-related fault trends are reduced. The proposed investment programme for the replacement of cutouts is £2.8m. This excludes cutout replacements due to the smart meter rollout programme. The investment profile shown takes in to account the large scale replacements due to the smart meter rollout. It is estimated that the installation of smart meters by meter operators will result in a 2% replacement rate of all cutouts inspected. Details of replacements due to the smart metering rollout can be found in Annex 10 of our RIIO-ED1 business plan. Following the completion of the smart meter roll-out programme, the replacement rate of cutouts is expected to reduce to 0.05% of the population.
Sensitivity Analysis 7.4No sensitivity analyses have been carried out on the services and terminations ED1 proposals.
8.0 Deliverability
The replacement of R&Ls will be carried out primarily by directly employed staff with the use of some contractors. We have set the R&L replacement plan such that there is a ramp up in DPCR5 to the desired investment level in ED1. The replacements of overhead and underground services are similar to historical levels of achievements. Most of the work will be carried out by existing resources in our Networks operations teams. Replacement of cutouts are done live and will not require loss of supplies to other customers. A review of the historical cutouts replacements though DPCR4 and DPCR5 show that there is a steady increase in the number of replacements each year. The increase in overall cutout replacements is expected throughout the smart meter rollout period. However there will be a corresponding decrease in other planned cutout replacements (if we exclude the replacements due to the smart meter rollout). Additional resources will be sought where necessary to manage the increased replacements due to the smart meter rollout activities as well as other planned cutout replacement activities.

Asset Stewardship Report 2014 Working draft v0.1 SPN Services and Terminations Version 2.0 All of the cost numbers displayed in this document are before the application of on-going efficiencies and real price effects.
39
Appendices
Appendix 1 - Age profiles
Figure 23 - Underground Service Age Profile (Source – RIGS 2012 CV3 Table V5)
Figure 24 - Overhead LV Services (Source – RIGS 2012 CV3 Table V5)
Appendix 2 - HI profiles N/A

Asset Stewardship Report 2014 Working draft v0.1 SPN Services and Terminations Version 2.0 All of the cost numbers displayed in this document are before the application of on-going efficiencies and real price effects.
40
Appendix 3 - Fault data
Figure 25 – Underground Services Fault rates (Source - UKPN Fault Cube)
Figure 26 – OHL Services Fault Graphs (Source - UKPN Fault Cube)
Appendix 4 - WLC case studies Not applicable.
0.0000
0.0002
0.0004
0.0006
0.0008
0.0010
0.0012
0.0014
0.0016
2007 2008 2009 2010 2011 2012
Fa
ult
s / S
wit
ch
ge
ar
Year
SPN Underground Services
All Faults
Poor Condn Due To Age & Wear
Linear (Poor Condn Due To Age & Wear)
0.0000
0.0020
0.0040
0.0060
0.0080
0.0100
0.0120
2007 2008 2009 2010 2011 2012
Fa
ult
s / S
wit
ch
ge
ar
Year
SPN OHL Services
All Faults
Poor Condn Due To Age & Wear

Asset Stewardship Report 2014 Working draft v0.1 SPN Services and Terminations Version 2.0 All of the cost numbers displayed in this document are before the application of on-going efficiencies and real price effects.
41
Appendix 5 - NLRE Expenditure plan
Table 11– ED1 Expenditure Plan (Source 19th February 2014 NAMP Table J Less Indirect)
NAMP
Line(s) Asset Category 15/16 16/17 17/18 18/19 19/20 20/21 21/22 22/23
ED1
Total
Risers and laterals
1.46.04
Replacement of Risers 202 202 202 202 202 202 202 202 1,613
1.46.04
Replacement of Laterals 1,337 1,337 1,337 1,337 1,337 1,337 1,337 1,337 10,694
Underground Services
1.46.01 Replace Metered Services 448 448 448 422 374 374 374 374 3,260
1.46.06
UMS Service Replacement
(SWA Only) - Non Chargeable
Connections Work
107 107 107 107 107 107 107 107 854
Overhead services
1.46.03
Replace Overhead Services -
Ad Hoc Replacements & ESQC
Response
316 316 316 316 316 316 316 316 2,531
1.46.05
Replacement of Mural Services 753.1 753.1 753.1 753.1 753.1 753.1 753.1 753.1 6,024.4
Cutouts
1.17.01 Cut Outs Replaced (BAU) 668 446 223 223 223 460 273 273 2,788
Total (£k) 3,831 3,609 3,386 3,360 3,312 3,549 3,362 3,362 27,764

Asset Stewardship Report 2014 Working draft v0.1 SPN Services and Terminations Version 2.0 All of the cost numbers displayed in this document are before the application of on-going efficiencies and real price effects.
42
NAMP Line(s)
Asset Category 15/16 16/17 17/18 18/19 19/20 20/21 21/22 22/23 ED1 Total
Risers and laterals
1.46.04 Replacement of
Risers 112 112 112 112 112 112 112 112 8896
Replacement of
Laterals 1,112 1,112 1,112 1,112 1,112 1,112 1,112 1,112 8,896
1.46.04
Underground Services
1.46.01 Replace Metered
Services 420 420 420 395 350 350 350 350 3,055
1.46.06
UMS Service
Replacement (SWA
Only) - Non
Chargeable
Connections Work
100 100 100 100 100 100 100 100 800
Overhead services
1.46.03
Replace Overhead
Services - Ad Hoc
Replacements &
ESQC Response
1050 1050 1050 1050 1050 1050 1050 1050 8,400
1.46.05 Replacement of
Mural Services 250 250 250 250 250 250 250 250 2,000
Cutouts
1.17.01 Cut Outs Replaced
(BAU) 2591 1727 864 864 864 1782 1057 1057 10,806
Table 12 - ED1 Forecast Volumes (Source 19th February 2014 NAMP Table O)

Asset Stewardship Report 2014 Working draft v0.1 SPN Services and Terminations Version 2.0 All of the cost numbers displayed in this document are before the application of on-going efficiencies and real price effects.
43
Appendix 6: Sensitivity Analysis
Not Applicable
Appendix 7: Named schemes Not Applicable

44
Appendix 8: Output NAMP/ED1 RIGS reconciliation Outputs Asset Stewardship reports RIGs Table
Investment description
NAMP line description NAMP
Line 2015/6 2016/7 2017/8 2018/9 2019/20 2020/21 2021/22 2022/23 Total
RIG Table
RIG Row
2015/6 2016/7 2017/8 2018/9 2019/20 2020/21 2021/22 2022/23 Total
Risers & Laterals
Replacement of Risers 1.46.04.6
674 112 112 112 112 112 112 112 112 896 CV110 57 112 112 112 112 112 112 112 112 896
Replacement of Laterals 1.46.04.8
519 1,112 1,112 1,112 1,112 1,112 1,112 1,112 1,112 8,896 CV110 58 1,112 1,112 1,112 1,112 1,112 1,112 1,112 1,112 8,896
Underground services
Replace Metered Services
1.46.01.6671
420 420 420 395 350 350 350 350 3,055
CV3 141 520 520 520 495 450 450 450 450 3,855
UMS Service Replacement (SWA Only) - Non Chargeable Connections Work
1.46.06.9455
100 100 100 100 100 100 100 100 800
Overhead services
Replace Overhead Services - Ad Hoc Replacements & ESQC Response
1.46.03.6673
1,050 1,050 1,050 1,050 1,050 1,050 1,050 1,050 8,400
CV3 135 1,300 1,300 1,300 1,300 1,300 1,300 1,300 1,300 10,400
Replacement of Mural Services
1.46.05.6672
250 250 250 250 250 250 250 250 2,000
Cut Out (Metered)
Cut Outs Replaced (BAU)
1.17.01.6532
2,591 1,727 864 864 864 1,782 1,057 1,057 10,806 CV3 148 2,591 1,727 864 864 864 1,782 1,057 1,057 10,806
Total 5,635 4,771 3,908 3,883 3,838 4,756 4,031 4,031 34,853 5,635 4,771 3,908 3,883 3,838 4,756 4,031 4,031 34,853
Table 13 NAMP to RIGS mapping [Source: 19th February 2014 Namp Table O / 21st February 2014 ED1 Business Plan Data Tables]

45
Appendix 9: Material changes since the June 2013 ED1 submission
Asset type Action Change type 2013 2014 Difference
(Reduction)
Risers and Laterals CV110
Replace
9,792 9,792 0 Volume
Additions/Disposals
Investment (£m) 12.31 12.31 0
UCI (£k) 1.26 1.26 0
LV Service (UG) CV3
Replace
3,855 / 11,471*
3,855 / 3,855
0 / (7,616)
Volume
Additions/Disposals
Investment (£m) 12.20 4.10 8.1
UCI (£k) 3.16 1.06 2.1
LV Service (OHL) CV3
Replace
10,400 /10,400 10,400 /10,400 0 Volume
Additions/Disposals
Investment (£m) 8.5 8.5 0
UCI (£k) 0.83 0.83 0
Cutouts CV3
Replace
10,806 / 10,806 10,806 / 10,806 0 Volume
Additions/Disposals
Investment (£m) 2.8 2.8 0
UCI (£k) 0.26 0.26 0
Table 14 - Material changes to the July 2013 ED1 submission [Source: October 2013 ED1 Submission / 21st February 2014 ED1 Submission]
*The volume of disposals of underground services in the 2013 business plan submission
was more than the volume of additions because it included the removal of 7,616 redundant
services in ED1. Following a review of the mappings to the reporting tables, all of the
redundant services costs have been remapped to ”C26: Network Operating Costs – Other”
and the volumes removed from CV3.
This document now only includes costs relevant to asset replacement (CV3) and
replacement of rising and lateral mains (CV110). Unplanned replacements of services are
included in the Inspection and Maintenance Asset Stewardship reports.


![Build in Canada Programme d’innovation Innovation Program ...€¦ · 13 TestDepartmentsbyParcipaonLevel & [CATEGORY NAME] [CATEGORY NAME] [CATEGORY NAME] [CATEGORY NAME] NaonalResearchCouncil](https://static.fdocuments.net/doc/165x107/5f224b4457407520eb2cd843/build-in-canada-programme-dainnovation-innovation-program-13-testdepartmentsbyparcipaonlevel.jpg)