DOCUEENT RESUME ED 121 508 RC 009 105 · high schools located in Dimmit, Zapata, and Starr...
48
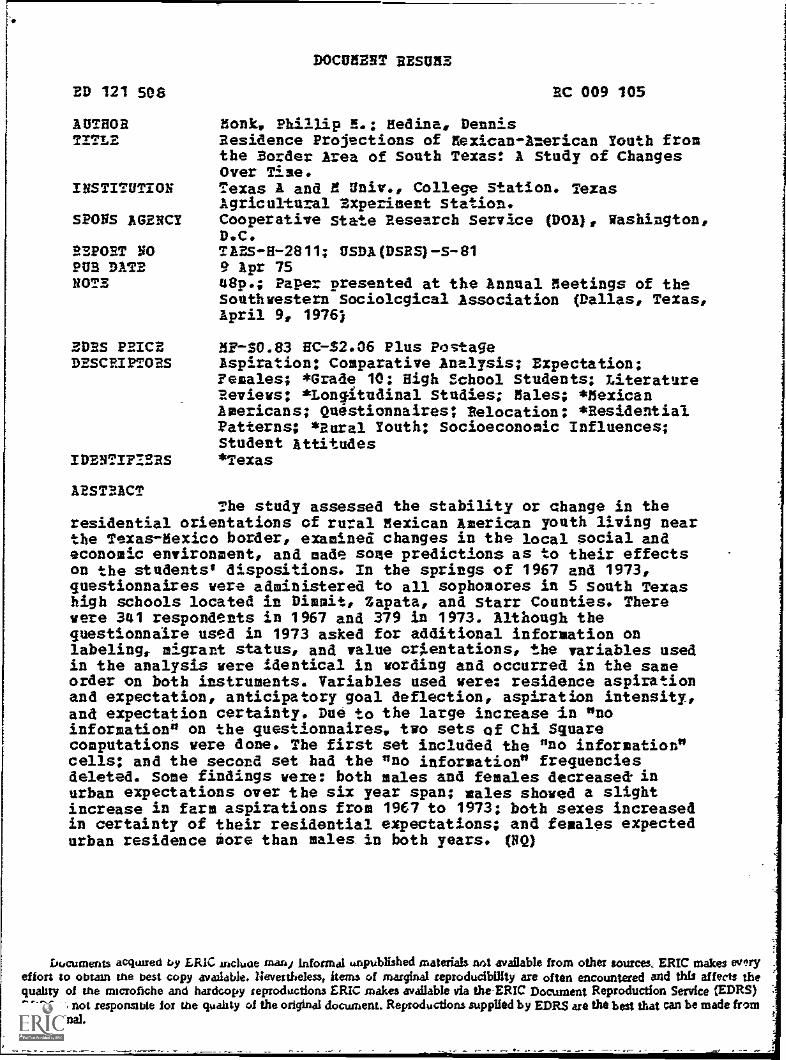
DOCUEENT RESUME ED 121 508 RC 009 105 AUTHOR Monk, Phillip E.; Eedina, Dennis TITLE Residence Projections of Eexican-American Youth from the Border Area of south Texas: A Study of Changes Over Time. INSTITUTION Texas A and B Univ., College Station. Texas Agricultural Bxperiment Station. SPONS AGENCY Cooperative State Research Service (D01), Washington, D.C. REPORT NO TABS-H-2811; USDA(DSRS)-S-81 PUB DATE 9 Apr 75 NOTE 48p.; Paper presented at the Annual Meetings of the Southwestern Sociolcgical Association (Dallas, Texas, April 9, 1976) EDRS PRICE EF-$0.83 EC-52.06 Plus Postage DESCRIPTORS Aspiration: Comparative Analysis; Expectation; Females; *Grade 10; High School Students; Literature Reviews: *Longitudinal Studies; Males; *Mexican Americans; Questionnaires; Relocation; *Residential Patterns; *Rural Youth: Socioeconomic Influences; student Attitudes IDENTIFIERS *Texas ARSTRICT The study assessed the stability or change in the residential orientations of rural Mexican American youth living near the Texas-Mexico border, examined changes in the local social and economic environment, and made some predictions as to their effects on the students' dispositions. In the springs of 1967 and 1973, questionnaires were administered to all sophomores in 5 South Texas high schools located in Dimmit, Zapata, and Starr Counties. There were 341 respondents in 1967 and 379 in 1973. Although the questionnaire used in 1973 asked for additional information on labeling, migrant status, and value orientations, the variables used in the analysis were identical in wording and occurred in the same order on both instruments. Variables used were: residence aspiration and expectation, anticipatory goal deflection, aspiration intensity, and expectation certainty. Due to the large increase in "no information" on the questionnaires, two sets of Chi Square computations were done. The first set included the "no information" cells: and the second set had the "no information" frequencies deleted. Some findings were: both males and females decreased: in urban expectations over the six year span; males showed a slight increase in farm aspirations from 1967 to 1973; both sexes increased in certainty of their residential expectations; and females expected urban residence more than males in both years. (NQ) Ducuments acquired by ERIC include man' informal unpublished materials AM available from other sources. ERIC makes every effort to obtain the best copy available. Nevertheless, items of marginal reproducibility are often encountered and this affects the quality of erne microfiche and hardcopy reproductions ERIC snakes available via the-ERIC Document Reproduction Service (EDRS) £DRS is not responsible lot the quality of the original document. Reproductions supplied by EDRS are the best that can be made from the original.
Transcript of DOCUEENT RESUME ED 121 508 RC 009 105 · high schools located in Dimmit, Zapata, and Starr...
DOCUEENT RESUME
ED 121 508 RC 009 105
AUTHOR Monk, Phillip E.; Eedina, DennisTITLE Residence Projections of Eexican-American Youth from
the Border Area of south Texas: A Study of ChangesOver Time.
INSTITUTION Texas A and B Univ., College Station. TexasAgricultural Bxperiment Station.
SPONS AGENCY Cooperative State Research Service (D01), Washington,D.C.
REPORT NO TABS-H-2811; USDA(DSRS)-S-81PUB DATE 9 Apr 75NOTE 48p.; Paper presented at the Annual Meetings of the
Southwestern Sociolcgical Association (Dallas, Texas,April 9, 1976)
EDRS PRICE EF-$0.83 EC-52.06 Plus PostageDESCRIPTORS Aspiration: Comparative Analysis; Expectation;
Females; *Grade 10; High School Students; LiteratureReviews: *Longitudinal Studies; Males; *MexicanAmericans; Questionnaires; Relocation; *ResidentialPatterns; *Rural Youth: Socioeconomic Influences;student Attitudes
IDENTIFIERS *Texas
ARSTRICTThe study assessed the stability or change in the
residential orientations of rural Mexican American youth living nearthe Texas-Mexico border, examined changes in the local social andeconomic environment, and made some predictions as to their effectson the students' dispositions. In the springs of 1967 and 1973,questionnaires were administered to all sophomores in 5 South Texashigh schools located in Dimmit, Zapata, and Starr Counties. Therewere 341 respondents in 1967 and 379 in 1973. Although thequestionnaire used in 1973 asked for additional information onlabeling, migrant status, and value orientations, the variables usedin the analysis were identical in wording and occurred in the sameorder on both instruments. Variables used were: residence aspirationand expectation, anticipatory goal deflection, aspiration intensity,and expectation certainty. Due to the large increase in "noinformation" on the questionnaires, two sets of Chi Squarecomputations were done. The first set included the "no information"cells: and the second set had the "no information" frequenciesdeleted. Some findings were: both males and females decreased: inurban expectations over the six year span; males showed a slightincrease in farm aspirations from 1967 to 1973; both sexes increasedin certainty of their residential expectations; and females expectedurban residence more than males in both years. (NQ)
Ducuments acquired by ERIC include man' informal unpublished materials AM available from other sources. ERIC makes everyeffort to obtain the best copy available. Nevertheless, items of marginal reproducibility are often encountered and this affects thequality of erne microfiche and hardcopy reproductions ERIC snakes available via the-ERIC Document Reproduction Service (EDRS)£DRS is not responsible lot the quality of the original document. Reproductions supplied by EDRS are the best that can be made fromthe original.

Residence Projections of Mexican-American Youth from the Border Areaof South Texas: A Study of Changes over Time
Phillip M. Monk and Dennis Medina
Department of Rural Sociology .
Texas A&M University to.oltrwantToirmitm.Trt.tromATIonsitiLiMIE
RATIORAioNSTITUTEOPEDUCATION
TNIS DOCUMENT iMS SEEN REPRO-DUCED EXACTLY AS RECEIVED PROMTHE PERSON Olt ORGAttiTaTIONORIGITAyi.40 IT postaSOC VIEW 01 °potionsSTATED CO NOT NECESSARILY REPRESENTOPPKIAL NATIONAL INSTITUTE OPEDUCATION POSITION OR POLICY
ii)
e4ss *Paper presented at the annual meetings of the Southwestern Sociological
Association, Dallas, April 9, 1976. This report contributes to USDA-CSRS
Regional Project S-8I, "Development of Human Resource Potentials of Rural
4Z10Youth in the South and Their Patterns of Mobility," and Texas Agriculture
c:S4ExperimentStation project H2811, "Development of Human Resource Potentials
144 of Rural Youth in the South and Their Patterns of Mobility."
2

INTRODUCTION
There has been a long and clearly established trend in this country of
rural people migrating to the urban centers to seek employment, new acquain-
tances, or excitement. Perhaps more often than not, the underlying reasons
for this migration were tied to the withering of opportunities for a satis-
factory life in the rural areas.
The problems brought about by this residential migration are familiar
and well documented. The cities, the individuals and the rural communities
all have lengthy lists of woes resulting from this phenomenon (Hauser, 1968;
National Research Goals Staff, 1970; Sundquist, 1970).
As for the Mexican American people, perhaps two of the problems have
utmost significance: (1) The concentration of large numbers of ethnic and
social minorities into the dehumanizing and seemingly inescapable existence
of the inner-city barrios and (2) the bleeding off of the promising, young,
and ambitious minds that are of potential aid to those resigned to the intolerable..
colonies.
For the Individual, in terms of his own life satisfaction, there is a
high risk of frustration and depression at either location. Historically,
it appears that the minority group member has opted to take his chances for
personal advancement in the urban setting.
Nevertheless, recently there have been some broad demographic trends
which point toward the possibility of a slackening or reversal of the rural
outmigration phenomenon.1
Calvin Beale (1974:26) lists four broad changes
1Chapman (1974:11) notes that from 1970 to 1973 the metropolitan counties
grew in population by 2.2 percent. Nonmetropolitan counties adjacent to
metropolitan areas grew by 4.1 percent and nonmetropolitan counties not ad-
jacent to metropolitan areas grew by 3.7 percent.
3

-2-
that appear to be major factors in this demographic pattern: (i) The extrac-
tive industries have decreased in their employment opportunities to what may
be an acceptable and stable level, (2) Rural areas have had increasing success
in luring manufacturers to their areas. This has reached a point at which the
growth rate of manufacturing activity for nonmetropolitan counties has exceeded
that of metropolitan counties. (3) Recreational travel and second homes in-
creased dramatically over the decade of the 1960's. (4) Tice improved access
to rural areas resulting fry interstate highway construction has made many rural
areas more attractive as residential and commercial areas.
Accompanying this utilitarian or economically determined model for the mi-
gration shift is a more philosophically oriented model. In recent years, there
has been a.renewal of interest in rural residence that stems from the disen-
chantment with urban life. Pollution, crime and crowding have led many urban
dwellers to seek cleaner surroundings, security and peace of mind in the less
populated regions farther removed from the cities. Surely this negative evalua-
tion of urban life has reached consciousness of rural dwellers and perhaps has
influenced their preferences for residence.
Complementing this disenchantment is the "back-to-the-land" philosophy which
has reportedly gained strength. This more positive orientation toward rural
life holds that as one gets closer to nature and simplifies one's existence he/
she will attain a richer life experience and a harmony with survival. Charles
Reich discusses the applicability of this philosophy to the middle class youth
of the late 1960's and early 1970's:
They do not go to nature as a holiday from what Is real. They
go to nature as a source. The salt water of the sea is their
freedom. The forest Is where they come from, It Is the place where
they feel closest to themselves, it is a renewal (Reich, 1970:284).
4
-3-
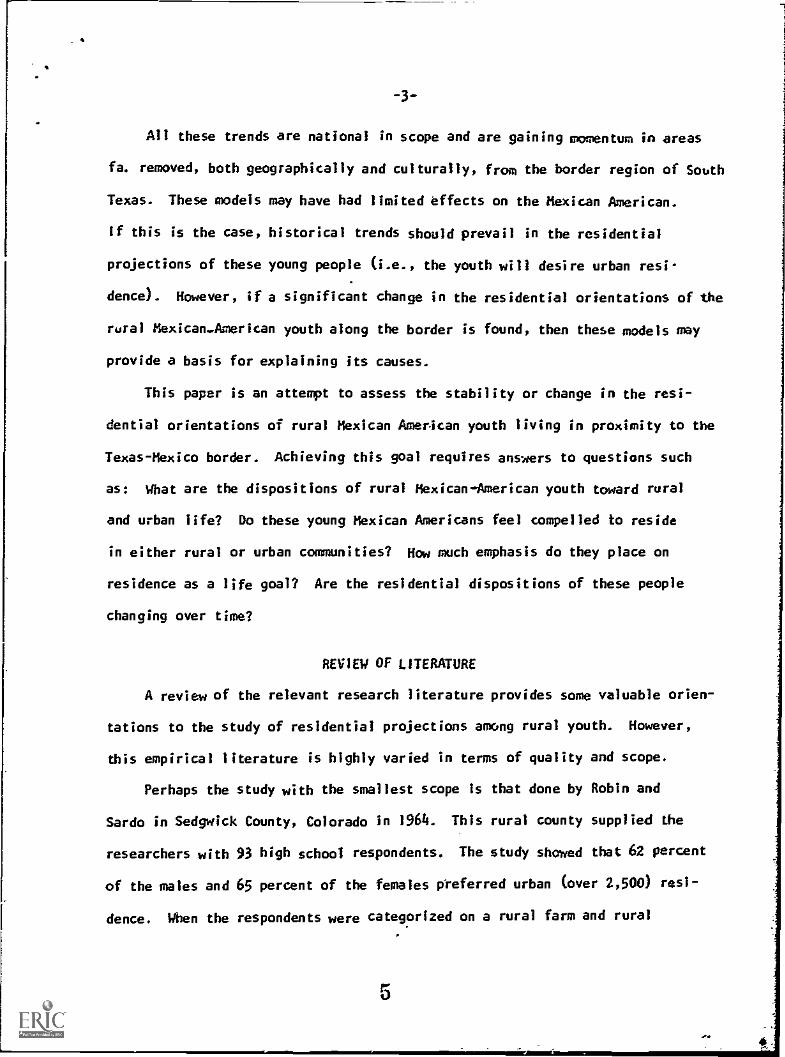
All these trends are national in scope and are gaining momentum in areas
fa. removed, both geographically and culturally, from the border region of South
Texas. These models may have had limited effects on the Mexican American.
If this is the case, historical trends should prevail in the residential
projections of these young people (i.e., the youth will desire urban resi-
dence). However, if a significant change in the residential orientations of the
rural Mexican-American youth along the border is found, then these models may
provide a basis for explaining its causes.
This paper is an attempt to assess the stability or change in the resi-
dential orientations of rural Mexican American youth living in proximity to the
Texas-Mexico border. Achieving this goal requires answers to questions such
as: What are the dispositions of rural Mexican-American youth toward rural
and urban life? Do these young Mexican Americans feel compelled to reside
in either rural or urban communities? How much emphasis do they place on
residence as a life goal? Are the residential dispositions of these people
changing over time?
REVIEW OF LITERATURE
A review of the relevant research literature provides some valuable orien-
tations to the study of residential projections among rural youth. However,
this empirical literature is highly varied in terms of quality and scope.
Perhaps the study with the smallest scope is that done by Robin and
Sardo in Sedgwick County, Colorado in 1964. This rural county supplied the
researchers with 93 high school respondents. The study showed that 62 percent
of the males and 65 percent of the females preferred urban (over 2,500) resi-
dence. When the respondents were categorized on a rural farm and rural
5

nonfarm basis, the data showed that 50 percent of the former group desired urban
residence while 69 percent of the latter group had such desires (Robin and
Sardo, 1964:12).2
Cowhig and his associates conducted a study in 1958 with a somewhat
larger scope in that it involved four contiguous rural counties in Michi-
gan with a total of 545 high school seniors as respondents. These re-
searchers found that 24 percent of the males and 38 percent of the females
prefered urban (over 2,500) residence. When the respondents were divided
by current place of residence it was found that 21 percent of the farm
respondents, 20 percent of the open country respondents and 55 percent of
the village respondents aspired toward urban residence (Cowhig, Artis,
Beegle and Goldsmith; 1960: 19).
Schwarzweller adds another dimension and increases the scope of
study in his 1960 effort. Schwarzweller sampled 451 high school seniors
in eight rural counties of Kentucky. These counties were equally divided
between the Bluegrass and Mountain regions of the state. In this study
49 percent of the males and 68 percent of the females desired urban (not
defined) residence. While aspirations for urban residence are not treated
in the remainder of the report, Schwarzweller does give figures for those
aspiring to migrate. In this respect is was found that 29 percent of
the Bluegrass males and 50 percent of the Mountain males wanted to live
elsewhere.3 Similarly 40 percent of the bluegrass females and 70 percent
of the Mountain females wanted to locate elsewhere. On the basis of a
=0. .2Robin and Sardo presented their data in raw number form (Table 6).
Computation of percentages and other data Manipulations are the responsi-bility of the authors of this paper,
Sit must be noted that the economic condLtiops of .the mountainsare much worse than those of the Bluegrass area (Schwarzweller, 1960:8. 14).

-5-
farm- nonfarm dichotomy, the data shows that 40 percent nonfarm males and
35 percent of the farm males prefer migration. Also, 59 percent of the
nonfarm females and 46 percent of the farm females wish to live elsewhere.
Schwarzweller adds the notion of plans for migration in addition to
aspirations for migration. Presumably, since Schwarzweller does not
clearly state this, when asked about what he/she plans to do the respon-
dent is subjected to his/her on rational evaluation of what is feasible
as well as what he/she desires or aspires to. The figures reported under
plans formigration varied somewhat from the figures on Aspirations but
the patterns across sex, region and farm-nonfarm residence did not vary
(Schwarzweller, 1960: 5-23).
Youmans and his colleagues conducted a survey in 1962 which was of
a more limited scope but added the important factor of racial variations.
Their data set was comprised of 171 Black and 240 White high school seniors
Lig three contiguous rural counties in northern Florida. Their data shows
that 69 percent of the Black males and 73 percent of the Black females
desired urban (not defined) residence. Comparably, only 35 percent of the
White males and 68 percent of the White females wanted to live in the city
(Youmans, Grigsby and King; 1965:4, 16).4
Kuvlesky and Pelham added a much needed thoroughness and clarity
to the development of residence projection studies. Their 1966 bi-racial
study of three East Texas rural counties involved 197 Bizck and 287 White
high school sophomores. This data revealed 33 percent of the White males
4Youmans et. al. presented their data in four categories of residen-
tial aspirations: (1) large city (2) small city (3) small town and (4)country (Table 6). For this paper we collapsed the first two categoriesinto the urban classification.
7
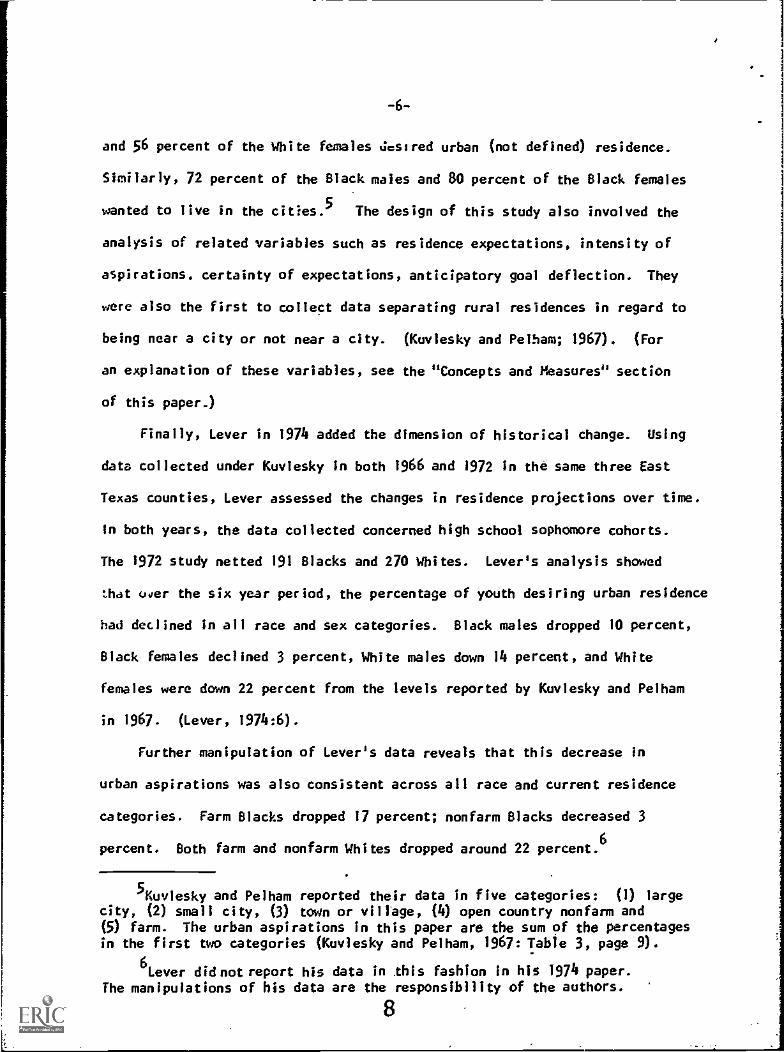
-6-
and 56 percent of the White females Jcsored urban (not defined) residence.
Similarly, 72 percent of the Black males and 80 percent of the Black females
.wanted to live in the clues. 5 The design of this study also involved the
analysis of related variables such as residence expectations, intensity of
aspirations. certainty of expectations, anticipatory goal deflection. They
were also the first to collect data separating rural residences in regard to
being near a city or not near a city. (Kuviesky and Pelham; 1967). (For
an explanation of these variables, see the "Concepts and Measures" section
of this paper.)
Finally, Lever in 1974 added the dimension of historical change. Using
data collected under Kuvlesky in both 1966 and 1972 in the same three East
Texas counties, Lever assessed the changes in residence projections over time.
In both years, the data collected concerned high school sophomore cohorts.
The 1972 study netted 191 Blacks and 270 Whites. Lever's analysis showed
that over the six year period, the percentage of youth desiring urban residence
had declined in all race and sex categories. Black males dropped 10 percent,
Black females declined 3 percent, White males down 14 percent, and White
females were down 22 percent from the levels reported by Kuviesky and Pelham
in 1967. (Lever, 1974:6).
Further manipulation of Lever's data reveals that this decrease in
urban aspirations was also consistent across all race and current residence
categories. Farm Blacks dropped 17 percent; nonfarm Blacks decreased 3
percent. Both farm and nonfarm Whites dropped around 22 percent.6
5Kuvlesky and Pelham reported their data in five categories: (1) largecity, (2) small city, (3) town or village, (4) open country nonfarm and
(5) farm. The urban aspirations In this paper are the sum of the percentagesin the first two categories (Kuviesky and Pelham, 1967: Table 3, page 9).
6Lever did not report his data in this fashion in his 1974 paper.
The manipulations of his data are the responsibility of the authors.
8

-7-
in summary, the review of literature shows that the study of rural
youths' residence projections has evolved toward greater complexity and
accuracy over the years. Also some striking patterns have appeared across
virtually all of these studies. (1) Females are more likely to deiire
urban residence than males regardless of differences in race, region and
current residence. (2) Blacks are more likely to desire urban residence
than Whites regardless of differences In sex. region and current residence.
(3) Nonfarm dwellers are more likely to desire urban residence than farm
dwellers regardlessof differences in sex, race and region.7
This study represents an effort to extend the analysis of youth resi-
dence projections to the Mexican American population of South Texas.
DATA COLLECTION AND SPECIFICATION OF OBJECTIVES
In the springs of 1967 and 1973, interviewers trained and supervised
by Dr. William Kuvlesky distributed questionnaires to all the sophomore
students present in five South Texas high schools.8
These schools are located
in Dimmit, Zapata and Starr Counties.
Although the interview teams in the two years were composed of different
individuals, extensive efforts were made to make their procedures as similar
as possible. After distributing the questionnaire, one of the team members
read through the entire interview schedule allowing time for the students to
respond after each question. The majority of the interview schedules was
7The Kuvlesky-Pelham study presents an exception to this statement in
that Black farm youth desired urban residence at a slightly higher rate thandid Black nonfarm youth.
8Two clarifications must be made here:. (1) The 1967 effort included
seven schools, two of which did not wish to cooperate in 1973 -because ofproblems with other research efforts in the Interim period. These weredeleted from the 1967 data set in this analysis for purposes of comparability.(2) The Anglo students and other ethnic. minorities present on the days ofthe data collection completed interview schedules but were deleted from tillsstudy leaving only Mexican Americans.
9
1

-8-
identical for the two data collection efforts. However, the 1973 instrument
asked for additional information on labeling, migrant status, value orienta-
tions, etc. at the end. Nevertheless, all variables used in this analysis
were identical in wording and occurred in the same order on both instruments.
These procedures succeeded in obtaining 341 completed schedules from
Mexican American students in 1967. In the 1973 effort, 379 Mexican American
respondents completed interviews.
From this data we will strive to describe the changes and trends concern-
ing various aspects of these students' residential hopes and expectations. This
will be done in a manner that will facilitate comparison with the findings
presented in the review of literature section. Additionally, we will attempt
to go beyond previous work by examining some relevant variables that may give
a basis for hypothetical explanations as to why the changes occurred. Finally,
we will endeavor a risky evaluation of the impact of these changes on the Mexi-
can American population of these three South Texas counties.
However, prior to analyzing the residential projections of these respon-
dents, it is essential to examine the changes in the local social and economic
environment and make some prediction as to their effects on the dispositions
of these students.
DUCR1PTION OF THE STUDY AREA AND SOCIAL. ENVIRONMENT
The 1970 census provides a good statistical description of the study area
(see Table 1). The census data was collected near the midpoint of the time
lapse between our data collections. A cursory analysis of the census data re-
veals that our, study area has a high concentration of Mexican Americans most-
ly residing in rural areas. Education and income are low in comparison with
the state wide figures for the Spanish-surname population. Employment is
10

-9-
largely in Agriculture and retail trade. Unemployment rates are higher than
those of the Spanish-surname population as a whole. These figures indicate
that the educational and economic environment of the study population is
one of limited opportunity. if the respondents are aware of this relative
lack of opportunity, then it is likely that they will be somewhat disen-
chanted with rural life.
The five high schools that were visited ranged in size from a sophomore
class of 30 to a sophomore class of 248. Their physical facilities
and educational equipment varied from moderate to poor in terms of both
quantity and quality. Over the six year period, there was little change
noted by the field interviewers. However, it is assumed that the schools
became a bit more crowded. This is indicated by the increases in their
sophomore class enrollment.
The data collected on family background during both studies reveals
several moderate changes. Slight increases were registered in parental
educational attainment. Mean level of education was up slightly for both
parents as was percent graduated from high school. Employment changed in
the opposite direction. The percentage of fathers in the labor market de-
creased along with the percentage of fathers actively employed. There was
an accompanying increase in the percentage of fathers holding low status
Jobs and an increase in the percentage of mothers seeking employment.9
Overall, the changes in the environmental influences appear to be slight.
To the extent that changes did occur they have generally been for the worse.
The slight magnitude of change makes any prediction of changing values
9For a more detailed analysis of changes in the families, schools and
counties see: Kuvlesky, William P. and Phillip M, Monk, "Historical Changein Status Aspirations and Expectations of Mexican-American Youth from theBorder Area of Texas: 1967-1973." Paper presented at the annual meetings of
the Southwestern Sociological Association (March 27, 1975).
11

0
Table 1 : Census Description of the Spanish Surname Population in the Stud Area.
Population Characteristics Education Characteristics
Total Spanish Percent PercentSurname Spanish Rural
Population Population Surname (Total Population)
Median Numberof School Years
Completed
Percent High
School Graduates
Dimmit 9,039 7,381
Starr 17,707 17,330
Zapata 4,352 3,584
Texas 11,196,730 1,649,677
8i.6 4o
97.9 68
91.5 100
14.7 20
Male Female Male Female
3.2 4.0 9.4 10.8
5.7 6.0 18.8 22.3
5.3 5.0 25.4 12.3
6.7(total) 20.0(total)

I
Table 1 (Cont.) Economic Characteristics
i
Percent of SpanishSurname Over 16in Labor Force
Hale Female
Percent of SpanishSurname Labor ForceUnemployed
Hale Female
Three Largest industriesfor Spanish Surname -Number of Employees
Family IncomeofSpanish Surname
Median Mean
Percent ofSpanish Sumac'sFamilies BelowPoverty Level
Dimmit 65.8 23.0 8,3 14.0 (1) Agriculture 542 3,527 4,173 62,2(2) Retail Trade 354(3) Construction 133
Starr 56.6 27.4 9,1 4.1 (1) Agriculture 901 3,593 5,060 Sad(2) Education 845
(3) Retail Trade 644
Zapata 56,3 20.6 7.7 0 (1) Construction(2) Agriculture
184
1653,313 4.413 57.8 CO
va..4(3) Education 132
Texas 76.2 34.2 4.9 7.1 Cl) Retail Trade . . . 111,360 5,603 6,449 34.0
(2) Manufacturing . . . 104,369(3) Professional Services 79,607
..11=,

-12-
perilous. However, to the extent that these students can generalize and
project their hardships to the rural lifestyle, it can be assumed that they
will have less positive perceptions of rural residence.
CONCEPTS AHD MEASURES (See APPENDIX A)
Residence aspiration refers to the place the respondent would most
like to live if he/she were completely free to choose. Residence ex-
pectation is the place the respondent feels he/she will most likely live after
taking into account the realities of his/her situation. To the extent that
these aspirations and expectations differ anticipatory goal deflection
is said to exist. If the respondent's aspiration is rural and his/her
expectation is urban then anticipatory goal deflection is rural to urban.
If the respondent's aspiration is urban and his/her expectation is rural
then anticipatory goal deflection is classified as urban to rural. if
there is no difference between aspiration and expectation there there is
no anticipatory goal deflection. Intensity of aspiration is the degree
of importance that the respondent attaches to his desired residence in
relation to six other life goals Certainty of expectations measures
how sure the respondent Is that he/she will realize their expectations.
ANALYSIS OF FINDINGS
The numbers presented in the tables are percentage distributions rounded
to the whole digit.
The computations of Chi Square were done twice because of the confounding
effects of the large increases in "no information." The first set of computa-
tions includes the "no information" cells. The second set of Chi Square
values has the "no information" frequencies deleted.
14

-13-
Residence Aspirations (Table 2)
The most notable change from 1967 to 1973 is a decrease in the
percentage of youth aspiring to live in a city. This trend is more
pronounced for males than for the females in the sample. Over half of
the females held urban residential aspirations compared to slightly
over a third of the male sample in 1973. This is a significant drop
from 1967 when over two-thirds of the youth in both sex-categories
desired to live in a cit/.
There is an almost equal decline in urban aspirations, regardless of
the size of the city (i.e. large or small city) for the male population,
but for the females in the sample the decrease is almost exclusively con-
tained within the large city, with a decrease of only one percent of those
desiring to live in a small city from 1967 to 1973.
The greatest increase over both sex categories occurred in theono
responsecategory. More than a quarter of the male population in 1973
gave no information for residential aspirations, compared to In of the
females, a 24% and 9% increase from 1967, respectively.
A slightly increasing percentage of males in 1973 desired residence
in a town or village, or on a farm. The number of males wishing to live
in the country, but specifically not on a farm decreased slightly. The
male sample did not discriminate between their rural residence aspirations
existing near or not near a city since both categories increased at
approximately equal percentages.
The females in 1973 exhibited slight increases in desiring to live in
a town or village, and in the country, but not a farm. A slightly smaller
number of females desired to live on a farm in 1973 than in 1967. These
females indicated a preference that their residence aspirations not be
near a city in 1973.
15

Table2. Residential Aspirations by Sex. South Texas. 1967-73
Residence Aspiration (22) Hale Female
1967 1973 Change 1967 1973
(in a City) (67) (36) (-31) (68) (56)
1 = Very Large.25 9 -16 22 11
2 = Small 42 27 -15 46 45
(Hear a City) (20 (28) (1i) (24) (23)
3 = in a Town/Village 6 9 3 9 11
4 = Country/Hot Farm 12 9 -3 -9- -11
5 = On a Farm 6 10 4 6 1
(Not Hear a City) (5) (8) (3) (2) (6)
6= In Town/Village 1 3 2 0 1
7= Country/Hot Farm 2 2 0 2 4
8 = On a Farm 2 3 1 0 1
0 = No Information (4) (28) WO (6) (15)
TOTAL 99.98% 100.01% 0 100.00% 100.02%.
X2: 58.29 X2
: 27.37dif: 8 dif: 8
p: .001 p: <.001
2X2 2.2., 3
d,f, 7P ; z,01 >,401
16
x.A :20,isd.P.

-15-
Residence Expectations (Table 3)
In 1973, the expectations of rural Mexican-American youth to live
in urban areas dropped, but not as sharply as aspirations did in Table
2. As in aspirations, the trend in 1973 is more pronounced for the
males than for the females in the sample, decreasing 14 percent and 6
percent, respectively, from 1967, when approximately two-thirds of the
youth in both sex categories expected to live in the cities.
Breaking down the urban expectations into smaller categories, it
is seen that the percentage of males expecting to live in a large city
decreased more than the percentage expecting to live in a smaller urban
area. Even though in 1967 almost twice as many males expected to live
in a small city as in a large city, the percentage of those expecting
to live in a large city in 1973 decreased ten percent compared to a four
percent decrease in those expecting to live in a small
the percentage of females expecting to live in a large
stant from1973 to 1967. The total decrease in female
reflects a decrease in the number of females expecting
cities.
There was not as great an increase inuno information for expectations,
Table 3, as there was in Table 2. Only eight percent of the males and
two percent of the females in the population gave no information in 1973
for expectations, an increase of five percent and one percent from 1967,
respectively.
Total rural expectations increased 9 percent for males, and 5
percent for females in 1973. The rural area that increased the most
consistently across both sex categories for residence expectations was
the town or village.
city. Conversely,
city remained Corr-
urban expectations
to live in small
17
-16-
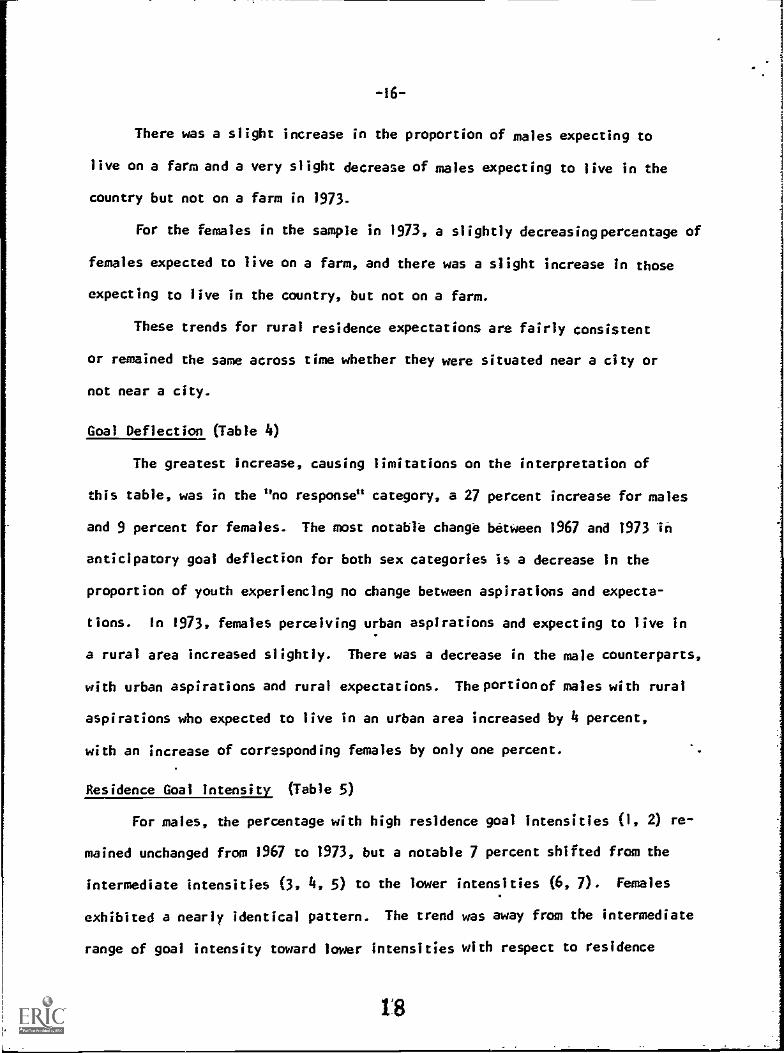
There was a slight increase in the proportion of males expecting to
live on a farm and a very slight decrease of males expecting to live in the
country but not on a farm in 1973.
For the females in the sample in 1973, a slightly decreasing percentage of
females expected to live on a farm, and there was a slight increase In those
expecting to live in the country, but not on a farm.
These trends for rural residence expectations are fairly consistent
or remained the same across time whether they were situated near a city or
not near a city.
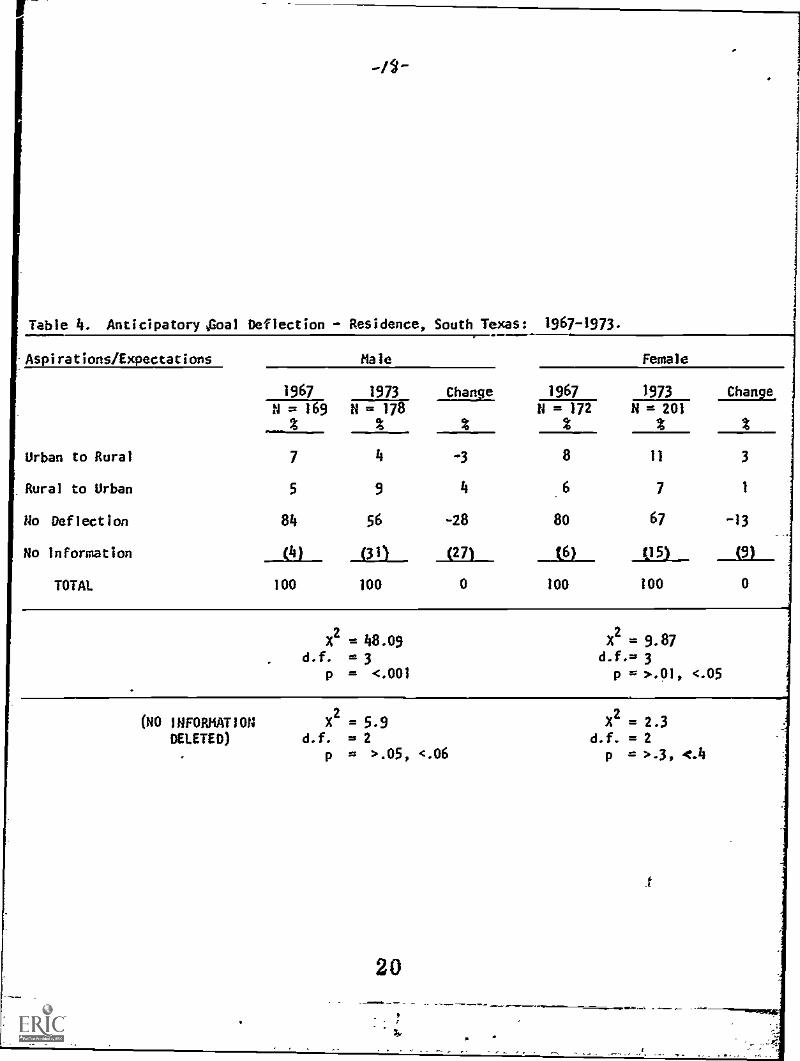
Goal Deflection (Table 4)
The greatest increase, causing limitations on the interpretation of
this table, was in the "no response" category, a 27 percent increase for males
and 9 percent for females. The most notable change between 1967 and 1973 in
anticipatory goal deflection for both sex categories is a decrease In the
proportion of youth experiencing no change between aspirations and expecta-
tions. In 1973, females perceiving urban aspirations and expecting to live In
a rural area increased slightly. There was a decrease in the male counterparts,
with urban aspirations and rural expectations. The portion of males with rural
aspirations who expected to live in an urban area increased by 4 percent,
with an increase of corresponding females by only one percent.
Residence Goal Intensity (Table 5)
For males, the percentage with high residence goal intensities (1, 2) re-
mained unchanged from 1967 to 1973, but a notable 7 percent shifted from the
intermediate intensities (3, 4, 5) to the lower intensities (6, 7). Females
exhibited a nearly identical pattern. The trend was away from the intermediate
range of goal intensity toward lower intensities with respect to residence
IS

Table 3 Residential Expectations by Sex. South Texas. 1967-1973.
Residence Expectations (23) Hale Female
1967_ 1973 1967 1973 Change
N = 169 N = 178
_Change
N * 172 N = 201
On a City) (66) (52) (-14) (68) (62) (-6)
= Very Large 24 14 -10 15 15 0
= Small 42 38 -4 53 47 -6
(Near a City) (24) (29) (5) (28) (29) (1)
3 = In a Town/Village 9.5 12 2.5 14 18 4
4 = In Country/Not Farm 9.5 9 -.5 9 10 1
5= On a Farm 5 8 3 5 1 -4
Wet Near a City) (7) (11) (4) (3) (7) (4)
6= In Town/Village 2 6 4 1 3 2
7= in Country/Not Farm 2 2 0 2 3 1
8 = On a Farm 3 3 0 0 1 1
0 = No Information (31 (8) (5) (1) (2) (1)
TOTAL 100.02% 100.00% 0 100.00% 100.00% 0
X2= 14.73 X2 a 12.93
d.f. . 8 d.f. = 8p= > .05, 4.06 p= 'Olt <.12
(NO INFORMATION X2 = 10.69 X2= 12.52
DELETED) d.f. = 7 d.f.= 7
P p = POSI 4.09
42-
Table 4. Anticipatory,Ooal Deflection - Residence, South Texas: 1967-1973.
TOTAL 100 100 0 100 100 0
X2= 48.09 X
2= 9.87
d.f. = 3 d.f.= 3p = <.001 p >.01, <.05
(NO INFORMATION X2= 5.9 X
2= 2.3
DELETED) d.f. = 2 d.f. = 2p = .09, <.06 p = >.3, 4.4
X2= 48.09 X
2= 9.87
d.f. = 3 d.f.= 3p = <.001 p >.01, <.05
20
(NO INFORMATION X2= 5.9 X
2= 2.3
DELETED) d.f. = 2 d.f. = 2p = .09, <.06 p = >.3, 4.4
(NO INFORMATION X2= 5.9 X
2= 2.3
DELETED) d.f. = 2 d.f. = 2p = .09, <.06 p = >.3, 4.4
2020

U.
-19-
aspiration. Although the pattern is not a strong one, there is a clear ten-
dency to consider residence as less important among life goals.
Certainty of Residence Expectation (Table 6)
The females in 1973 exhibited a shift from the middle ground, or the
"not very sure;' upward to theasureanOvery surecategories, indicating a
slight increase in confidence with respect to residence expectation. The
percentage of females in the certain categories remained the same in 1973
as in 1967.
The males exhibited a similar pattern involving a larger proportion.
Although the percentage of males responding every sureudid not change in 1973,
an increase of 20 percent of the males responding in the "sure"
corresponds with a decrease in the not very sure(211percent) and "uncertain"
(2 percent) responses. There was a 1 percent increase in mates Indicating
they were very uncertain about their residence expectations in 1973.
There were only slight increases in the proportion of respondents giving no
information; five percent and three percent for males and females, respec-
tively.
Residential Aspirations by Modal Residence° (Table 7)
. The first glaring trend is the decrease in urban aspirations over all the
modal residence categories. These decreases are consistently large but the
decreases among city dwellers is the largest. Similarly, it should be noted
that each modal residence category, except the city dwellers, showed an in-
crease in the percentage of aspirants wishing to remain in the same setting
10Modal residence is a term used to refer to the residential setting in
which the respondent has lived most of his/her life (see Appendix A).

4
Table 5. Residence Goal Intensity. South Texas. 1967-1973
Goal Intensky (33) Mdle Female
1967 1173 Change,4
1967 1973 Change.
N = 169 N =%178 N ar,
%172 N =
%201
High(p)
c,8)(f) (35) (5) .sp)
2 7 3Intermediate (71) (64) (-7) (80) (71) (9)
Low
04,4
4
5
7C..
11
31
29(20)
16
4
1.5 4 a 16 8
3o -1 39 30 -9
19 -10 25 .8
(27) ( 7) Mi) (20) ( 6)
.4zo 4 12 17 5.
7 ..; 3 2 3 1
0 = No Information ,-1/.-- (1)*-// _iii_ _Val_ al__
TOTAL 100.00% 100.00% 0 100.00% 100.00% o
X2
= 10.99 X2
= 15.06d.f. = 7 d.f. = 7
p = > .13, <.14 p r-- > .03, <.011
(NO INFORMATIONDELETED)
2X = 10.99 X
2= 15.06
d.f. = 6 d.f. = 6p = > .08, <.09 p = > .1, <.2

Table 6. eortbinty of Residence Expectations. South Texas 1967-1973.
Certainty (24) Hale Female
1= Very Sure
2 = Sure
3 = Not Very Sure
1967 1973 Change 1967 1973 Change
N = 169%
N = 178% %
N = 172%
N = 201%
15
28
49.
15
48
25
0
20
-24
5
27
58
7
30
50
2
3
-8
4= Uncertain 6 4 -2 7 7 0
5.= Very Uncertain 1 2 1 1 1 0
0 = No Information (1) (6) (5) (2) (5) (3)
TOTAL 100.00% 100.00% 0 100.00% 100.00% 0
X2
=30.93 X2= 5.31
d.f. *5 d.f. = 5p =<.001 p. > .3, <.4
(HO INFORMATIONDELETED)
X2=
d.f. =p =
22.84
4.001
X2
= 2.43d.f. = 4
p = '.6, <47
23

-22-
(e.g. town or village by town or village dwellers increased 5.3 percent).
Note also that the percentage of farm dwellers desiring farm residence in
the future increased more than any other single cell in the table (except "no
information").
Mother clear trend is the across-theboard increase in the percentage
of Mexican American youth who are aspiring to town or village residence.
Although the increases are small, they are consistent.
One last interesting note is that the decrease in urban aspirations among
city dwellers was spread through all of the other three aspiration categories.
However, the farm setting attracted the largest percentage of disenchanted
urbanites.
Residential Aspirations by Farm-Nonfarm Modal Residence (Table 8)
In the interest of continuity with past research, a collapsed version
of the previous table is presented here. Although modal residence is not
synonymous with current residence, the comparison seems appropriate (see
Table 8).
The Mexican-American farm youth are less attracted to urban aspirations
than are the nonfarm youth in both 1967 and 1573. This finding is consistent
with the findings reported in other studies (see review of literature sec-
tion).
Another Important finding revealed by this table is that a majority of the
farm dwellers in 1967 desired urban residence. However, by 1573 this was no
longer the case. A clear majority of the 1573 farm dwellers preferred rural
residence.
24

Table 7: Residential Aspirations by Modal Residence
ResidentialAspirations
City Town or Village Open Country Farm1967 1 1973 1 Change 1967 1 1973 1 Change 1967 ! 1973 : Change 1967 1973 Change
Urban
I 1
i
1 1
177.4 47.1 -30.3.
. 41
71.3 53.6 -11
1
:
1
7.7I I
1 1
I
:
4
60.9 35.6 -25.3:
I .
50.0 35.5 -14.5..,....,,r.,
Town orVillage 5.7
1
8.° 14. 2.3 9.6 14.9 + 5.3
1
1
5.8 : 8.2L
+ 2.4 10.4 12.9 + 2.5......
Open CountryI 1
6.6 : 9.2 I+ 2.64 4
7.8 1 10.5 : + 2.7I I
23.2 : 28.8 : + 5.6,
16.7 6.5 -10.2
Farm. 1
2.8 : 8.0 : + 5.21
: ;
7.8 : 3.9 1 - 3.9t :
5.8 : 4.1 : - 1.7I 0
16.7A
25.8 + 9.1
No Information 1
I 1
1
7.5 i 27.6 1+20.1
1
I
4
3.5 1 17.1
I
I
I
1 +13.6 4.3 23.3 +19.0 6.2 19.4 +13.2
TOTAL
-
100.0%
N=I06
99.9%
N=87
L
1
- 0.1 100.0%
N=115
,
1
100.0%
N=181
100.0%
N=69
1
100.0%1
1
N=73 :
!
100.0%
N=48
100.1%
N=31
+ 0.1
.
("NO INFORMATION" INCLUDED) d.f. = 28 X2
= 127.25 p < .001
("NO INFORMATION" DELETED) d.f. = 21 X2= 85.26 p < .001

Table 8. Residential Aspirations by Farm-Nonfarm ModalResidence.
Residence Farm NonfarmAspirations 1967 t 1973 Change 1967 1973 Change
Urban 53.3 44.0 - 9.3. 74.9 61.0 -13.9
Rural 46.7 56.0 + 9.3 25.1 j 39.0 +13.9
TOTAL 100.0% 100.0% 100.0% 100.0%
N=45 N=25 N=275 N=269
NO Informa-tion 3 6 15
i.
72
("NO INFORMATION"INCLUDED)
d.f. = 6 X2= 59.13
p < .001
'( "NO INFORMATION"
DELETED)d.f. = 3 X2 = 21 . 36
p < .001

-25-
Residential Expectations by Modal Residence (Table 9)
All modal residence categories decreased in urban residential expectations
except the farm category. The increase in farm expectations is an intri-
guing finding in view of the decrease in the percentage of farm dwellers
aspiring to urban residence. It appears that farm dwellers are more pessimis-
tic about the feasibility of life in rural areas than are the residents of
other settings. It is important to observe that all modal categories except
open country still have a majority of their aspirants expecting to live in
the cities. The largest portion of the urban expectation decrease among
city and town or village dwellers went toward an increase in town or village
expectations (4- 11.1 and 4.9 percent, respectively). The open country
dwellers showed their largest increase in open country expectations. For
farm dwellers, the largest increase was a scant 1.5 percent rise in farm
expectations. The large 13.5 percent decrease among farm dwellers expecting
open country residence is consistent with their decrease in open country
aspirations.
As with aspirations, each modal category except city experienced increases
in its corresponding expectation category (e.g. the percentage of farm
dwellers expecting farm residence increased 1.5 percent).
Rurality Score by Modal Residence (Table 10)
The 1973 interview schedule contained a set of six value statements
concerning rural people and rural lifestyles (see Appendix A). These state-
ments were scored one for the least rural response, three for an intermediate
response, and five for the most rural response. The range of total scores
(i.e., 6 to 30) was divided at the mid-point to arrive at the low - high
dichotomy presented here (see Table 10).
27

Table 9. Residential Expectations by Modal Residence
Residentialgxpectations
City Town or Village Open Country
.
FarmI967 ! 1973 !Change
1 1
1 63.2 1-19.8s
!
1967 1 1973 !Change,
1
68.7 1 58.6 1-10.11
!
.1967 1 1973 :Change,1 1
52.2 : 49.3 1 2.91
I
1967 1973 ISIELTL#
54.2 61.3 : + 7.1t._
Urban 83.0
Town orVillage 3.8
i
I
14.9 1+11.1 20.0
4 0
24.9 + 4.9
0
15.9 11.0 - 4.9 12.5 12.9 + 0.4
Open Country 4.7 8.0 1+ 3.3!
5.2 8.3 + 3.1 26.1 32.5 4 6.8 16.7 3.2 -13.5
Farm1
!
t
4.7 1 6.9 1+ 2.21
6.1 5.0 1- 1.11
1
2.9 4.1 g + 1.2!
14.6 16.1 + 1.5.
No informa-tiontion
1 1
g g1 1
3.8 6.9 1+ 3.1I .
1 s
g
g10 3.3 + 3.3! 1
1 I
gi
2.9 2.7 gi - 0.2I
2.1 6.5 +4.4
TOTAL 100.0%
N0106
99.9%
NN87
0.1 100.0% 100.1%
NN115 NNI61
+ 0.1 100.0%
N*69
100.0%
N "73
100.1%
N=48
100.0%
N=31
- 0.J.,
("NO INFORMATION" INCLUDED) d.f. N 28 X2
= 109.15 p < .001
("NO INFORMATION" DELETED) d.f. m 21 X2= 100.11 p < .001

-27-
This table indicates that as the modal residences increase in rurality
so do the values. Considering the farm dwellers' increase in urban expecta-
tions to a level of 61 percent, and that 63 percent of the farm dwellers
scored high on the index of rural values, one must conclude that a sizable
percentage of the farm youth consider urban life an unpleasant economic
necessity_
Residential Aspirations by SocioEconomic Status (Tables 11 and 12)
In this study, socio-economic status (SES) is based upon the occupation
of the main bread winner in the respondents' households. Those main bread
winners who held unskilled jobs were classified as low SES while skilled
workers, managers, proprietors and professionals were classified as high
SES. (see Table In.
Despite a sizable decrease in urban aspirations among the low SES re-
spondents, a majority still preferred urban residence in 1973. Changes in
the other residential settings were only slight for the low SES respondents.
The 3.9 percent increase in town or village aspirations represents the largest
increase in any of the residential settings. it is clear that the low SES
respondents are not very favorably oriented toward farm residence. In both
1967 and 1973, the farm setting ranked last in attracting low SES youth.
Concurrently, the decrease in farm aspirations of 2.6 percent over the six
year period further emphasizes this finding.
An analysis of the high SES respondents reveals a somewhat different
picture. Although the percentage of high SES respondents desiring urban
residence decreased as did the percentage of low SES respondents, the high
SES category decreased at a much higher rate: By 1973, less than one-half
of the high SES respondents aspired to urban residence. The magnitude of the
29

-28-
Table 10. Rurality Score by Modal Residence
Rurality Score
High (19-30)
1
Urban o
1
Town or Village :Open Country
41 51 55
Low (6-18) 59 49 45
TOTAL 100%
N=83
100 %
ii=169
100
11=67
1
("NO INFORMATION" INCLUDED) d.f. = 4 X2 = 11.72
p > .01 <.05
Farm
63
37
100 %
U=30
("NO INFORMATION" DELETED) d.f. = 3 X2 = 5.65
p >0.1, < 0.2
Table 11. Residential Aspirations by Socio-Economic Status.
ResidentialAs ;rations Lop w 1967 , Low 1973 Change High 1967, High 1973 Change
Urban 68.1 52.7 -15.4 70.3 44.8 -25.5
Town orVillage 9-7 13.6 + 3.9 5.2
s11.2 + 6.0
Open Country 9.0 10.9 + 1.9 13.5 16.4 + 2.9
Farm 6.9 4.3 - 2.6 6.5 11.2 + 4.7
No Information 6.2 18.5 +12.3 4.5 16.4 +11.9
TOTAL 99-9%
N=144
100.0%
N=184
+ 0.1 100.0% 100.0%
N=155 N=116
("NO INFORMATION"INCLUDED)
d.f. = 12 X2
= 45.65
p < .001
("NO INFORMATION"DELETED)
d.f. = 9 X2
= 23.08
p >.00I, < .01
30

-29-
increase in town or village residence was the highest of the aspiration categories.
This pattern is also similar to the one exhibited by the low SES category.
However, the farm aspirations for the high SES respondents exhibited a moderate
increase. This is opposed to the trend among low SES respondents.
A collapsed and rearranged version of this table reveals some additional
findings (see Table 12).
In 1967, there was virtually no difference between the two SES groups in
terms of residential aspirations. However, by 1973 the low SES group showed
a much higher preference for urban residence than did the high SES group.
This analysis suggests that the swing from urban to rural aspirations
is stronger among the high SES Mexican Americans.11
Rurality Score by Socio-Economic Status (Table 13)
The majority of high SES Mexican American youth demonstrate a high
score in positive attitudes concerning rural life and people. The rate of
high scores on the rurality index was 14.2 percent higher for high status
MexicanAmerican youth than for their low status counterparts.
A slight majority of the low SES students scored low in the rurality
index, indicating a more negative view of the rural environment and lifestyle.
The findings here coupled with the findings on residential aspirations
by SES indicate that the trend toward rural residence orientations is primari-
ly a middle class phenomena.
11In the 1967 sample, 48.2 percent of the main breadwinners held low
status jobs. in the 1973 sample, 61.3 percent of the breadwinners heldlow status jobs. This is not likely to be an artifact of sampling, since
the entire sophomore classes were sampled. More likely, this is a reflec-
tion of the continued economic decline of these rural South Texas counties.
31

-30-
Table 12. Residential Aspirations by Socio-EconomicStatus.
ResidentialAspirations Low 1967 High 1967 Low 1973 High 1973
Urban 68.1 70.3 52.7 44.8
Rural 25.7 25.2 28.8 38.8
No Response 6.2 4.5 18.5 16.4
Total 100.0%
11=144
100.0%
N=I55
100.0%
ti=184
100.0%
11=116
("n0 INFORMATION"INCLUDED)
("NO INFORMATION"DELETED)
d.f. = 6 X2 = 35.8
p < .001
d.f. = 3 X2=13.13
p >.001, < .01
Table 13. Rurality Score by Socio-EconomicStatus (1973)
Rurality Score Low High
High (19 -30) 41.8 56.0
Low (6-18) 51.6 41.4
No Response 6.5 2.6
Total 99.9%
11=184
100.0%
101-16
("NO INFORMATION"INCLUDED)
("NO INFORMATION"DELETED
d.f. = 2; X2= 6.8
0 > <.05
d.f. = 1 X2= 4.44
P .01, <.05
32

-31-
Residential Aspirations by Migrant Status (1973) (Table 14)
it seems likely that those students that have traveled in the migrant
stream would have a different perspective concerning residential aspirations
than the students who have not had migrant experience. The nature (positive
or negative) of the migrants' attitudes toward rural lifestyles would be
difficult to predict. However, considering the reported miseries of migrant
living quarters and their harsh working conditions, one would expect them to
be negatively oriented toward rural residence. (see Table 14).
As expected, the migrants show a definite preference for urban resi-
dence; however, they do not differ markedly from the nonmigrants. Thus,
we must conclude that migrant status is not a highly significant factor in the
determination of residential goals.
Residential Aspirations by Metropolitan Experience (Table 15)
As with migrant status, one would expect those students having resided
in metropolitan areas to differ from those who have not had such an experience
in their residential preferences. Given the urban disenchantment hypothesis
put forth in the introduction, the expected result would be that those with
metropolitan experience would prefer rural residence more frequently than
would their inexperienced counterparts. (see Table 15).
A significant majority (2 out of 3) of the Mexican-American youth having
lived in metropolitan areas held urban aspirations. This is opposed to the
hypothesis presented above. There are several possible explanations for this
finding but they are all purely conjecture: (1) Perhaps the students who
have lived in metropolitan settings do not identify with the negative aspects
of urban life. (2) Perhaps they feel the excitement and employsient oppor-
tunities of the urban areas are worth the costs of crime, pollution and
33

-32-
Table 14. Residential Aspirations by Migrant
Status (1973)
Residential Aspirations Yes No
Urban 62.6 58.3
Rural 37.4 41.7
Total 100.0% 100.0%
N=91 N=192
("NO INFORMATION" d.f. = 1; X2 = 0.48DELETED) p > .05, < .06
Table 15. Residential Aspirations by Metropolitan"Experience (1973)
Residential Aspirations Yes No
Urban 66.7 57.3
Rural 33.3 42.7
Total 100.0% 100.0%
N=72 N-213
("NO INFORMATION" d.f. = 1; X2 = 1.97DELETED)
p < 0.1, > 0.2
84

-33-
crowding. (3) Perhaps their urban experiences were pleasant and they have
not adjusted to their present rural environment. (4) Perhaps they regret
having left friends or relatives in metropolitan areas.
Detailing the possible causes of this finding is not a practical task
at this point, but when one recalls the large decrease in urban aspirations
among those students citing the city as their modal residence (Table 7) this
finding becomes all the more surprising.
SUMMARY OF FINDINGS
The most dramatic and confounding historical change was the increase in
"no information." There are several possible reasons for this trend: in-
creasing aversion to questionnaires, differing atmospheres or moods set by
the interviewers or differing situational variables in the schools or com-
munities. However, none of these hypotheses are empirically verifiable with
the data available.
This increase in "no information" has some serious implications for the
analysis of the data. There is a remote possibility that those variables
showing declines over the study period may be in reality increasing if the
respondents not giving information were homogeneous with respect to the vari-
able. However, in instances where the decline is greater than the increase
in "no information" the variable must have actually declined (e.g., Residential
Aspirations - In a City Both Sexes - Table 2). Similarly, those variables
showing increases despite the rise in "no information" must have actually in-
creased. However, the degree of increase for the variable is probably not
adequately reflected.
Table 2:
1. Both sexes declined in the percentages of their members aspiring to

-34-
urban residence over the six year period.
2. A majority of the females preferred urban residence in both years.
While a majority of the males in 1967 desired urban residence, by 1973
slightly over one-third held urban aspirations.
3. Both sexes in both years clearly preferred residence near a city
to residence not near a city.
4. Males showed a slight increase in farm aspirations from 1967 to 1973
while females registered a slight decrease in this category.
Table 3:
1. Both sexes decreased in urban expectations over the six year span.
2. A majority of both sexes for both years expected urban residence.
Females expected urban residence more than males in both years.
3. Both sexes for both years showed much higher percentages expecting
to live near a city than expecting not to live near a city.
4. Of the rural residence settings, town or village near a city
registered the highest rate of expectations for both sexes in both years.
5. Males expecting farm residence increased slightly while females expect-
ing farm residence decreased slightly.
Table 4:
1. Anticipatory goal deflection showed little change except that
which was caused by increases in no information. Males increased slightly
in rural to urban deflection, while females increased slightly in urban to
rural deflection.
Table 5:
1. The importance of residence in relation to six other life goals de-
creased slightly over the six year period for both sexes.

-35-
Table 6:
1. Both sexes increased in certainty of their residential expectations.
2. Males were more certain than females for both years.
Table 7:
1. The percentage of Mexican Americans desiring urban residence de-
creased in all modal residence categories. City dwellers decreased the most
in urban aspirations.
2. There was an increase in students aspiring to town or village resi-
dence in all modal residence categories.
3. Each modal residence category, except the city dwellers, showed
an increase in the percentage of aspirants wishing to remain in the same
setting.
4. The 9.5 percent increase in farm dwellers aspiring to farm residence
was the largest increase over the six year period (except "no information").
5. The largest percentage of disenchanted city dwellers desired farm
residence.
Table 8:
1. Nonfarm dwellers preferred urban residence at a higher rate than
farm dwellers for both years.
2. A clear majority of the 1973 farm dwellers preferred rural residence.
Table 9:
1. All modal residence categories, except farm dwellers, decreased In
percentages expecting urban residence during the six year span.
2. The majority of each modal category, except open country dwellers
in 1973, expected urban residence.
3. Each modal category, except city dwellers, registered an increase
37

in the percentage of students expecting to live in the same residential
setting.
4. Farm dwellers showed a large decrease in expectations of living in
the open country setting.
Table 10:
1. As modal residence increases in rurality, so does the percentage of
respondents scoring high on the rurality index (1973 only).
Table 11:
1. Both socio-economic categories decreased, over the six year period,
in the percentages of their constituents aspiring to urban residence. High
SES respondents demonstrated a larger decrease in urban aspirations than the
low SES respondents.
2. Low SES respondents are not favorably oriented toward farm residence.
3. By 1973, less than one-haleof the high SES respondents held urban
aspirations.
Table 12:
1. In 1967, variations in socio-economic status had little bearing on
residential aspirations, but by 1973 there was a considerable change. High
SES respondents were more likely to desire rural residence than were low
SES respondents in 1973.
Table 13:
1. A much higher percentage of high SES respondents scored high on the
rurality index than did low SES respondents. A majority of the high SES re-
spondents held high rural value scores (1973 only).
Table 14:
1. Migrant youth show a clear preference for urban residence, but they
33

-37-
do not differ significantly from nonmigrants in their residential aspirations.
Table 15:
1. Two-thirds of the Mexican-American students who had lived in metropoli-
tan areas held urban aspirations. This was moderately higher than the percen-
tage of students with no metropolitan experience.
DISCUSSION AND CONCLUSIONS
The data clearly indicates the rural Mexican-American youth of the Texas
border region have become less enchanted by life in the cities. This change
was strong enough to cut across differences in sex, modal residence and socio-
economic status. These urban decreases were not only complete throughout all
categories in terms of aspirations but they were also complete throughout all
categories of expectations. The one exception to this statement is the increase
in urban expectations among farm dwellers. However, when one examines the de-
crease in urban aspirations and the high percentage of high scores on the
rurality index, one must view the farm dwellers' increase in urban expectations
as being economically motivated.
It is also essential to remember that the urban setting still attracts the
majority of aspirants among females, town or village dwellers, and low SES
students. Similarly, larger percentages of migrants and students with metro-
politan residential experience prefer urban residence more frequently than non-
migrant nonmetropolitan counterparts.
When one reviews our findings and compares them to prevlous research, the
results are highly impressive: (1) Consistent with the previoUs research ,
females desire urban residence more frequently than males. (2) Contistent
with the previous research - nonfarm dwellers prefer urbanresidence at a
higher rate than do farm dwellers.
39

-38-
While socio-economic status was not used as an independent variable in any
of the previous research reports, Schwarzweller approached it indirectly. He
found that the Mountain youth (generally of lower SES) had a greater propen-
sity for migration than did the Bluegrass youth (generally of higher SES).
Additionally, if one assumes that the Blacks in the Youmans, Kuvlesky-Pelham
and Lever studies were of lower SES than their White counterparts, then the
findings that Blacks held higher rates of urban aspirations than did the Whites,
also supports a hypothesis that low SES students more frequently desire urban
residence than high SES students. The data on Mexican-American youth is sup-
portive of such an hypothesis. Although the strength of the effects of SES
on urban aspirations is not overbearing, it would seem only prudent for future
residence projections researchers to carefully scrutinize its effects.
Turning our attention to the more theoretical aspects of this study, we
can make several assertions. First, the economically determined model for
explaining increases in rural aspirations does not hold up as well as might
have been expected.
A review of the volumes of Texas Industrial Expansion, a publication
listing new and expanded industrial activities by Standard Metropolitan Sta-
tistical Areas (SMSA) and by counties, revealed that there was virtually no
industrial growth in the three counties over the six year period.12
However,
the neighboring counties of Maverick and Hidalgo exhibited relatively sub-
stantial industrial expansion in and near their areas of high population concen-
tration (Eagle Pass and the McAllen - Pharr - Edinburg SMSA). This industrial
expansion mostly involved increases in low skilled employment opportunities
for food processing, textile manufacturing and tourism.
To the extent that the economically determined model does apply, it Is more
12Dimmit County showed an Increase of about 100 jobs over this period.
The other counties showed considerablyAess activity.
40

-39-
prevalent among the low SES Mexican-American students. if it can be con-
sidered that the low SES group is responsive to economic opportunity and are
willing to commt.Le to the increasing occupational opportunities in neighboring
counties, then the economic model can explain their slight 3.1 percent increase
in rural aspirations. Also the economic model is given more credence in ex-
plaining low SES changes because of the relatively small percentage (0e1.8) of
low SES respondents exhibiting high scores on the rurality index. This indi-
cates that the majority consider urban residence lifestyles as good as rural
ones. Thus their desires fos rural residence are not based on philosophical
grounds of rural romanticism.
The philosophical model appears to carry more weight with the higher SES
group. They showed a much larger decrease (25.5 percent) in urban aspirations,
and a much greater (13.6 percent) increase in rural aspirations than their low
SES counterparts. Similarly, a significantly larger percentage of high SES
respondents scored high on the rurality index.
However, it must be recalled that those students with metropolitan experience
showed a high (66.7 percent) preference for urban residence, thus denying
the metropolitan disenchantment thesis. This is highly confusing in light of
the finding that the respondents whose modal residence was the city,
showed a minority (47.1 percent) aspiring to urban residence.
The data seems to point to the conclusion that it is the positive philo-
sophical model (i.e., the back-to-the-land philosophy) that is leading the
way for change in residential projections among Mexican-American youth. Perhaps
this philosophy Is not prevalent in the same romanticiled version expounded by
Reich, but exists primarily in a modified form. Perhaps the philosophy is one
of sacrificing some of the economic benefits of Urban residence for the environ-
mental benefits (physical and social) of rural life. Perhaps .the higher SES
41

. I
-40-
Mexican Americans desire this "golden-mean" in which they can enjoy the best1
.
of both worlds
A recent article by Lance Morrow (1976) attributes this "best of both
worlds" model to the disenchanted urban middle class who have been abandoning
the urban environment in increasing numbers from 1970 to 1974. It appears as
if these values are cutting across ethnic, regional and residential lines. In
other words, it appears that the middle class Mexican Americans in rural South
Texas hold the same values attributed to the urban middle class in the large
northern cities.
IMPLICATIONS OF THE FINDINGS
In all probability, this change in values will not work to the advantage
of the counties involved nor the Mexican-American populations in them. Most
likely the middle class Mexican-American youth and the most promising lower
class youth will continue to leave the area for more attractive residences in
areas that offer good schools, good jobs, good services, adequate recreational
facilities and proximity to an urban setting.
The only chance available to the counties for retaining their more promis-
ing youth is in the development of better schools, employment opportunities,
services and recreational facilities. This is a big order for places with a
limited tax base, such as these three border counties.
Perhaps the best hope for Zapata and Starr Counties is to try to attract
some of the growing winter tourist trade that annually deluges the Low Rio
Grande Valley. The Falcon Dam in Zapata County provides a potential recrea-
tional facility.
Dimmit County's best hope would probably be continued attempts to attract
industry.
Perhaps there will be a slight increase in retention of youth for these
counties in the near future, but the odds, for substantial change in this respect
are not favorable. 42

-41-
BIBLIOGRAPHY
Arbingast, Stanley A. (ed.)1967-73 Texas Industrial Expansion. (Vols. 17-23) Austin: Bureau of
Business Research, The University of Texas at Austin.
Beale, Calvin L.
1974 "Rural Development: Population and Settlement Prospects."Journal of Soil and Water Conservation, Vol. 29, January/February, pp. 23-27.
Chapman, William.
1974 "Migration Back to Small Towns Accelerated in the 70's."Houston Chronicle, Section E, p. 11, Tuesday, October 29.
Cowhig, James, Jay Ards, J. Allen Beegle, and Harold Goldsmith.1960 "Orientations toward Occuaption and Residence: A Study
of High School Seniors in Four Rural Counties in Michigan."Michigan State University, Agricultural Experiment Station,Department of Sociology and Anthropology, East Lansing,Michigan. Special Bulletin 1 428.
Hauser, Phillip M.1968 "The Chaotic Society: The Social Morphological Revolution."
Vital Speeches of the Day, Vol. 35, October 15, pp. 25-26.
Kuvlesky, William P. and John Peliham."Place of Residence Projections of Rural Youth: A Racial
Comparison." Social Science Quarterly, 50 (June), pp. 166-76.
Lever, Michael F.
1974 "Place of Residence Projections of East Texas Rural Youth:Changes between 1966 and 1972." Texas Agricultural Experi-ment Station, Texas ABM University, College Station, Texas.Departmental Information Report Ho. 74-1.
Morrow, Lance1976 "Americans on the Move." Time, Vol. 107, March 15, pp. 54-64.
Rational Goals Research Staff1970 Toward Balanced Growth: Quantity with Quality. U. S. Govern-
ment Printing Office, Washington, D. C. (July).
Reich, Charles A.
1971 The Greening of America. New York: Bantam Books.
Robin, Ellen P. and Joseph Sardo1964 "Attitudes and Plans of High School Students in Sedgwick County,
Colorado." Fort Collins: Colorado Agricultural ExperimentStation, Technical Bulletin i 85, (September).
1
1
1
1
1

-42-
Schwarzweller, Harry.1960 "Sociocultural Factors and the Career Aspirations and Plans of
Rural Kentucky High School Seniors." Lexington, University of
Kentucky; Kentucky Agricultural Experiment Station, ProgressReport No. 94.
Sandquist, James L.1970 "Where Shall They Live?" The Public Interest 18: 88-100.
U. S. Bureau of Census.1973 Census of the Population: 1970. Vol. 1, Characteristics of the
Population, Part 45, Section 1, Texas, Tables 19, 35, 129, 130,
131, 133, 182.
U. S. Bureau of Census.1973 Census of the Population: 1970, Subject Reports
PC(2)-ID: Persons of Spanish Surname. (June) Tables: 6, 7,9, 12.
Youmans, E. G., S. E. Grigsby, and H. C. King1965 "After High School What: Highlights of a Study of Career Plans
of Negro and White Rural Youth in Three Florida Counties."Gainesville, University of Florida, Cooperative ExtensionService, Departmental Technical Report No. 67-2.

APPENDIX A: RELEVANT QUESTIONNAIRE ITEMS IN 1967-1973 INSTRUMENTS
A comparison of questions used for each status projection element in both
status areas in 1967 and 1973 indicate they were identical in every case. The
stimulus questions used are reproduced below.
RESIDENTIAL PROJECTIONS
Residence Aspiration
Of the kind of place listed below, in which one would you most desire to
live for the rest of your life? (Circle only
In a city
I Very large
2 Small
Near a city
3 In a town or village
4 In the country but not on a farm
5 On a farm
Not near a city
6 In a town or village
7 In the country but not on a farm
8 On a farm
one number):
Residence Expectation
From the kind of places listed above, what type of place do you really
expect to live most of your life? Place the number of this type of place in
the following box:
Intensity of Aspiration
Listed below are a number of things that most young people look forward bp.
45
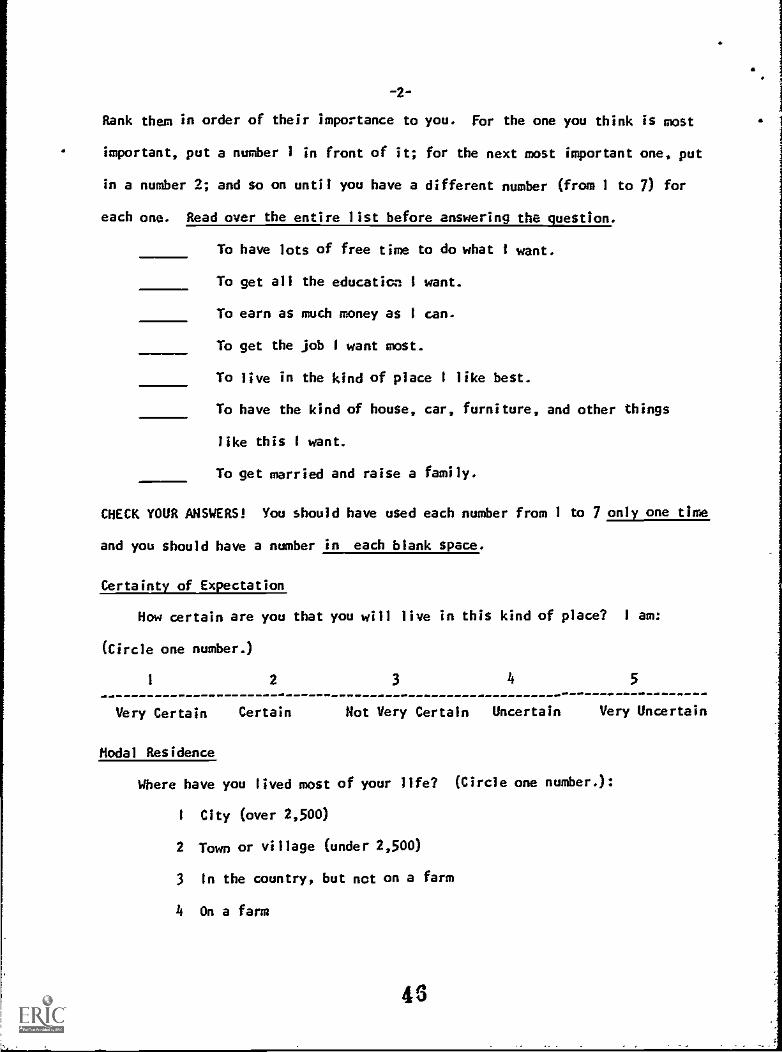
-2-
Rank them in order of their importance to you. For the one you think is most
important, put a number 1 in front of it; for the next most important one, put
in a number 2; and so on until you have a different number (from 1 to 7) for
each one. Read over the entire list before answering the question.
To have lots of free time to do what 1 want.
To get all the educaticn 1 want.
To earn as much money as I can.
To get the job I want most.
To live in the kind of place I like best.
To have the kind of house, car, furniture, and other things
like this I want.
To get married and raise a family.
CHECK YOUR ANSWERS! You should have used each number from 1 to 7 only one time
and you should have a number in each blank space.
Certainty of Expectation
How certain are you that you will live in this kind of place? 1 am:
(Circle one number.)
1 2 3 ii 5
Very Certain Certain Not Very Certain Uncertain Very Uncertain
Modal Residence
Where have you lived most of your life? (Circle one number.):
1 City (over 2,500)
2 Town or village (under 2,500)
3 In the country, but net on a farm
4 On a farm
46

-3-
SES INDICATOR
Main Breadwinner's Job
What is the main job held by the major money earner of your home? (Write
your answer in the following box. Give a specific job, not the company or
place worked for.)
The following stimulus items were included in the 1973 interview schedule
Rurality Index
DIRECTIONS: Answer the following questions by checking the answer that bestindicates your opinions toward rural living.
1. Rural folks are (a. more; b.__as; c. less) broadminded than other groupswith which you are familiar.
2. Regal living provides (a. many; b. some; c.__few) chances for newexperiences or opportunities.
3. Rural folks have a (a. greater; b. about the same; c._ less) feelingof neighborliness than people living in other areas.
4. A person reared in the country has a. (a......good; b.____fair; c. _poor)
chance of attaining recognition in later life.
5. A person from a small town or village has (a. more; b. about the
same; c. less) opportunity to develop his abilities than a person from
the farm.
6. Making a high income is (a. the best; b. a fair; c. a poor) measureof success in life.
7. As far as I am concerned, living in a city is (a. better than; b.__about the same as; c. worse than) living in a small town or rural area
Migrant Status
Have you ever traveled away from home to do farm (ranch) work in anotherarea or state?
1. No 2. Yes If yes, where? Town:
47
State:

-Ia-
Metropolitan Experience
Have you and your family ever lived in a large city, for example onethe size of San Antonio, Laredo, or Austin?
1. No 2. Yes What City?
i