DOCTORAL (Ph.D.) DISSERTATION Optimization of...
91
DOCTORAL (Ph.D.) DISSERTATION Optimization of manufacture and examination of micropellets based on pharmaceutical technological and biopharmaceutical parameters Dr. Szilárd Pál University of Pécs, Faculty of Medicine Institute of Pharmaceutical Technology and Biopharmacy Pécs 2013
-
Upload
truongdiep -
Category
Documents
-
view
218 -
download
0
Transcript of DOCTORAL (Ph.D.) DISSERTATION Optimization of...

DOCTORAL (Ph.D.) DISSERTATION
Optimization of manufacture and examination of micropellets
based on pharmaceutical technological and biopharmaceutical
parameters
Dr. Szilárd Pál
University of Pécs, Faculty of Medicine
Institute of Pharmaceutical Technology and Biopharmacy
Pécs
2013

Optimization of manufacture and examination of
micropellets based on pharmaceutical technological and
biopharmaceutical parameters
Dr. Szilárd Pál
Head of the Doctoral School:
Dr. Erika Pintér
Head of Program:
Dr. Loránd Barthó
Supervisor:
Dr. Attila Dévay
Founder and first director of
the Institute of Pharmaceutical Technology and Biopharmacy
University of Pécs, Faculty of Medicine
Pécs
2013

1
Publications and presentations related to the thesis
1. Sz. Pál, S. Nagy, T. Bozó, B. Kocsis, A. Dévay:
Technological and biopharmaceutical optimization of nystatin release from a
multiparticulate based bioadhesive drug delivery system
European Journal of Pharmaceutical Sciences 49.2: 258-264.2013.
IF: 3.212
2. S. Nagy, B. Kocsis, Sz. Pál, T. Bozó, K. Mayer, A. Dévay:
Antifungális hatóanyagtartalmú bioadhezív mikropelletek vizsgálati tapasztalatai
XVI. Gyógyszertechnológiai Konferencia és VIII. Gyógyszer az ezredfordulón
Konferencia, Siófok, 2010.
3. A. Dévay, B. Kocsis, Sz. Pál, K. Mayer, S. Nagy:
Quick detection of Nystatin from sustained release dosage forms using Microbiologically
Detected Dissolution (MDD)
The 2nd BBBB Conference on Pharmaceutical Sciences, Tartu, 2007.
4. Sz. Pál, K. Mayer, I. Antal, A. Dévay:
Comparison of evaluation on pharmaceutical and biopharmaceutical properties of
multiparticular dosage forms using factorial design and artificial neural network
The 2nd BBBB Conference on Pharmaceutical Sciences, Tartu, 2007.
5. A. Dévay, K. Mayer, Sz. Pál, I. Antal:
Investigation on drug dissolution and particle characteristics of pellets related to
manufacturing process variables of high-shear granulation
Journal of Biochemical and Biophysical Methods 69: 197-205.2006.
IF: 1.302
6. A. Dévay, S. Nagy, Sz. Pál:
MDD, új eljárás antibiotikumok kioldódásának vizsgálatára
Congressus Pharmaceuticus Hungaricus XIII., Budapest, 2006.
7. A. Dévay, S. Nagy, Sz. Pál:
Comparison of dissolution and microbiological thin layer chromatography detection of
drugs containing antimicrobial drugs
5th World Meeting on Pharmaceutics, Biopharmaceutics and Pharmaceutical
Technology, Geneva, 2006.
8. A. Dévay, Sz. Pál, S. Nagy:
A mikrobiológiailag detektált kioldódási (MDD) módszer alkalmazása antifungális
hatóanyagtartalom érzékeny és gyors vizsgálatára
Gyógyszerkutatási Szimpózium, Debrecen, 2006.

2
9. A. Dévay, I. Antal, Sz. Pál:
Gyógyszeres mikropelletek formulálásásának szempontjai
Gyógyszerkutatási Szimpózium, Debrecen, 2006.
10. A. Dévay, K. Mayer, Sz. Pál:
Investigation of dissolution of active ingredient from micropellets
8th Symposium on Instrumental Analysis, Graz, 2005.
11. A. Dévay, B. Kocsis, Sz. Pál, A. Bodor, K. Mayer, S. Nagy:
Application of a microbiological detection for investigation of dissolution of antibiotic
delivery systems
8th Symposium on Instrumental Analysis, Graz, 2005.
12. A. Dévay, Sz. Pál, I. Antal:
Effect of process parameters on characteristics of theophylline containing pellets prepared
in high shear granulator
6th Central European Symposium on pharmaceutical technology and biotechnology,
Siófok, 2005.

3
Other publications
1. Gy. Horváth, É. Szőke, Á. Kemény, T. Bagoly, J. Deli, L. Szente, Sz. Pál, K. Sándor, J.
Szolcsányi, Zs. Helyes:
Lutein inhibits the function of the transient receptor potential A1 ion channel in different
in vitro and in vivo models.
Journal of Molecular Neuroscience 1: 1-9.2012.
IF: 2.922
2. Sz. Pál, A. Dévay:
A kronoterápia gyógyszerészeti vonatkozásai
Gyógyszerészet 55:131-137.2011.
3. A. Dévay, Sz. Pál:
Kronoterápiás hatóanyagleadó rendszerek tervezése
Gyógyszerészet 55:323-328.2011.
4. S. Merczel, Sz. Pál, B. Kocsis, A. Dévay:
PVP-J tartalmú biokompatibilis műkönnyek gyógyszertechnológiai és mikrobiológiai
optimalizálása
Acta Pharmaceutica Hungarica 80:59-66.2010.
5. T. Bozó, K. Mayer, Sz. Pál, A. Dévay:
A szem korszerű gyógyszeres terápiájának lehetőségei
Gyógyszerészet 53:5-12.2009.
6. T. Bozó, Sz. Pál, A. Dévay:
Liposzómák fejlesztésének és gyógyszerterápiás alkalmazásának újabb lehetőségei
Acta Pharmaceutica Hungarica 78:103-109. 2008.
7. Sz. Pál, K. Mayer, A. Dévay:
Részecskeméret-meghatározás a dinamikus fényszóródás módszerével
Acta Pharmaceutica Hungarica 75:23-31.2005.
8. Sz. Pál:
A patikus dilemmái: a FoNo VII. a gyakorlatban
Acta Pharmaceutica Hungarica 75:199-203.2005.

4
Other presentations
1. A. Dévay, Sz. Pál:
Preparation and examination of cochleates using central composite design
6th Central European Symposyum on pharmaceutical technology and biotechnology,
Siófok, 2005.
2. A. Dévay, Sz. Pál, I. Antal:
Design of oral sustained release delivery system by a melt dispersion method
6th Central European Symposyum on pharmaceutical technology and biotechnology,
Siófok, 2005.
3. A. Dévay, Sz. Pál, I. Antal:
Formulation of sustained release diclophenac microcapsules
6th Central European Symposyum on pharmaceutical technology and biotechnology,
Siófok, 2005.
4. Sz. Pál, K. Mayer, A. Bodor, S. Nagy, A. Dévay:
Evaluation of dissolution profiles of polyethyleneglycol and hydroxy propyl methyl
cellulose based matrix tablets
6th Central European Symposyum on pharmaceutical technology and biotechnology,
Siófok, 2005.
5. A. Dévay, B. Kocsis, Sz. Pál, A. Bodor, K. Mayer, S. Nagy:
New method for microbiological detection of delivery process from dosage forms
containing antibiotics
6th Central European Symposium on pharmaceutical technology and biotechnology,
Siófok, 2005.
6. A. Dévay, Sz. Pál, K. Mayer, I. Klebovich, I. Antal:
Study on pellet characteristics related to process parameters during high shear granulation
Proceedings of the 1st BBBB Conference on Pharmaceutical Sciences, Siófok, 2005.
7. A. Dévay, K. Mayer, S. Nagy, Sz. Pál:
Determination of particle size distribution of lipoid based pharmaceutical
microstructures using dynamic light scattering
8th Symposium on Instrumental Analysis, Graz, 2005.
8. A. Dévay, Sz. Pál, S. Nagy, K. Mayer, A. Bodor:
Effects of pharmaceutical excipients in dosage forms containing N-acetycysteine (NAC)
Pharmacy: Smart Molecules for Therapy,
Magyar Tudományos Akadémia, Budapest, 2005.

5
9. A. Dévay, Sz. Pál, K. Mayer:
Comparison of central composite factorial design and artificial neural networks on the
evaluation of cochleate’s size
Pharmacy: Smart Molecules for Therapy,
Magyar Tudományos Akadémia, Budapest, 2005.
10. A. Dévay, I. Antal, K. Mayer, Sz. Pál:
Investigation of physical parameters of cochleates
Gyógyszerkutatási Szimpózium, Pécs, 2005.
11. A. Dévay, S. Nagy, A. Bodor, K. Mayer, Sz. Pál:
Application of Weibull distribution for investigation of controlled release matrix tablets
Gyógyszerkutatási Szimpózium, Pécs, 2005.
12. I. Antal, J. Dredán, M. Lengyel, Á.Z. Dávid, Sz. Pál, I. Klebovich, A. Dévay:
Prediction of dissolution profile stability based on diffuse reflectance spectra and solvent
adsorption kinetics of coated pellets
5th World Meeting on Pharmaceutics, Biopharmaceutics and Pharmaceutical
Technology, Geneva, 2006.
13. A. Dévay, I. Antal, Sz. Pál:
Investigation of process parameters on the size of lipid based nanostructures
5th World Meeting on Pharmaceutics, Biopharmaceutics and Pharmaceutical
Technology, Geneva, 2006.
14. Sz. Pál, A. Dévay:
Ibuprofen tartalmú készítmények előállítása és vizsgálata
Gyógyszerkutatási Szimpózium, Debrecen, 2006.
15. A. Dévay, Sz. Pál:
Kohleátok előállítása és vizsgálata
Gyógyszerkutatási Szimpózium, Debrecen, 2006.
16. A. Dévay, B. Kocsis, Sz. Pál, K. Mayer, S. Nagy:
Experiments to decrease effect of incompatibility between povidone and ibuprofen in
pharmaceutical dosage forms
The 2nd BBBB Conference on Pharmaceutical Sciences,Tartu, 2007.
17. A. Dévay, S. Nagy, K. Mayer, Sz. Pál:
Investigation of drug dissolution from cochleates applying transdermal diffusion cell
The 2nd BBBB Conference on Pharmaceutical Sciences, Tartu, 2007.

6
18. A. Dévay, S. Nagy, K. Mayer, Sz. Pál:
Investigation of phosphatidylserine based nanostructures improving their stability in
pharmaceutical dosage forms
The 2nd BBBB Conference on Pharmaceutical Sciences, Tartu, 2007.
19. A. Dévay, B. Kocsis, Sz. Pál, K. Mayer, S. Nagy:
Examination of dosage forms containing cephalexin by Microbiologically detected
Dissolution
The 2nd
BBBB Conference on Pharmaceutical Sciences, Tartu, 2007.
20. A. Dévay, B. Kocsis, Sz. Pál, K. Mayer, S. Nagy:
Az ibuprofen és a PVP inkompatibilitásának csökkentése co-freeze drying módszerrel
Gyógyszerkutatási Szipózium, Szeged, 2007.
21. A. Dévay, B. Kocsis, Sz. Pál, K. Mayer, S. Nagy:
Direkt tablettázással készült cefalexin tabletták hatóanyag-leadásának tanulmányozása
különböző pH-n, mikrobiológiailag detektált kioldódás (MDD) vizsgálattal
Gyógyszerkutatási Szipózium, Szeged, 2007.
22. Sz. Pál, T. Bozó, A. Dévay:
Mesterséges neurális hálózat alkalmazása multipartikuláris rendszerek optimalizálása
céljából
Gyógyszerkutatási Szipózium, Szeged, 2007.
23. T. Bozó, Sz. Pál, K. Mayer, S. Merczel, A. Dévay:
Liposzómák hatóanyag-leadásának vizsgálata változó fiziológiás feltételek mellett
Gyógyszerkutatási Szipózium, Szeged, 2007.
24. A. Dévay, K. Mayer, T. Bozó, Sz. Pál:
Félszilárd gyógyszerkészítmények hatóanyag-leadása membrándiffúziós cella
alkalmazásával
Gyógyszerkutatási Szipózium, Szeged, 2007.
25. A. Dévay, I. Antal, Sz. Pál:
Analysis of pelletizing in high-shear granulator applying digital acoustic signal detection
Biopharmaceutics and Pharmaceutical Technology, Barcelona, 2008.
26. T. Bozó, Sz. Pál, K. Mayer, S. Merczel, S. Nagy, A. Dévay:
Investigation of encapsulation efficacy of liposomes applying conductivity measurement,
6th World Meeting on Pharmaceutics
Biopharmaceutics and Pharmaceutical Technology, Barcelona, 2008.

7
27. I. Antal, N. Kállai, J. Dredán, E. Balogh, Sz. Pál, A. Dévay, I. Klebovich:
Understanding and controlling drug layering and coating process using neutral pellets
6th World Meeting on Pharmaceutics, Biopharmaceutics and Pharmaceutical
Technology, Barcelona, 2008.
28. A. Dévay, Sz. Pál:
A hatóanyagleadás folyamatának új elméleti és gyakorlati megközelítése
Congressus Pharmaceuticus Hungaricus, Budapest, 2009.
29. Gy. Horváth, P. Molnár, J. Deli, L. Szente, T. Bozó, Sz. Pál, A. Dévay, M. Simonyi, Á.
Kemény, K. Sándor, J. Szolcsányi, Zs. Helyes:
Karotinoidok hatásának vizsgálata neurogén gyulladásos folyamatokra in vivo
egérmodellekben
Congressus Pharmaceuticus Hungaricus, Budapest, 2009.
30. S. Merczel, Sz. Pál, B. Kocsis, A. Dévay:
Műkönnyek gyógyszertechnológiai optimalizálása és mikrobiológiai stabilizálása
biokompatibilis gyógyszerkészítmény tervezése céljából
Congressus Pharmaceuticus Hungaricus, Budapest, 2009.
31. Sz. Pál, K. Mayer, S. Nagy, A. Dévay:
Granulátumok és pelletek folyási tulajdonságainak jellemzése képanalizáló módszer
alkamazásával
Congressus Pharmaceuticus Hungaricus, Budapest, 2009.
32. K. Mayer, O. Pelczéder, Sz. Pál, A. Dévay:
Polivinil-alkohol tartalmú, biokompatibilis szemcsepp formulálása
Congressus Pharmaceuticus Hungaricus, Budapest, 2009.
33. A. Dévay, T. Pernecker, Sz. Pál:
Hipertenzív krízis kezelésére alkalmas multipartikuláris hatóanyag-leadó rendszer
előállítása és vizsgálata,
Congressus Pharmaceuticus Hungaricus, Budapest, 2009.
34. A. Dévay, Sz. Pál, S. Nagy, K. Mayer:
Kisgép a receptúrában: félszilárd gyógyszerkészítmények receptúrai elkészítésének
optimalizálása
Congressus Pharmaceuticus Hungaricus, Budapest, 2009.
35. A. Dévay, Sz. Pál:
Kronoterápiás gyógyszerhordozó rendszerek alkalmazhatóságának biofarmáciai és
gyógyszertechnológiai szempontjai
XVI. Gyógyszertechnológiai Konferencia és VIII. Gyógyszer az ezredfordulón
Konferencia, Siófok, 2010.

8
36. Sz. Pál, A. Dévay:
Dinamikus képanalizáló módszer gyógyszeres szemcsék folyási tulajdonságainak
meghatározására
XVI. Gyógyszertechnológiai Konferencia és VIII. Gyógyszer az Ezredfordulón
Konferencia, Siófok, 2010.
37. S. Merczel, K. Mayer, T. Bozó, Sz. Pál, A. Dévay:
Műkönnyek gyógyszertechnológiai optimalizálása es mikrobiológiai stabilizálása
biokompatibilis gyógyszerkészítmény tervezése céljából
XVI. Gyógyszertechnológiai Konferencia és VIII. Gyógyszer az ezredfordulón
Konferencia, Siófok, 2010.
38. A. Dévay, Sz. Pál:
Nanoméretű gyógyszerhordozó rendszerek fejlesztésének szempontjai
XVI. Gyógyszertechnológiai Konferencia és VIII. Gyógyszer az ezredfordulón
Konferencia, Siófok, 2010.
39. Sz. Pál, A. Dévay:
Mikropelletek fizikai tulajdonságai és a szemcsék folyási sajátságai közti összefüggések
feltárása dinamikus képanalizáló módszer alkalmazásával
XVI. Gyógyszertechnológiai Konferencia és VIII. Gyógyszer az ezredfordulón
Konferencia, Siófok, 2010.
40. T. Pernecker, Sz. Pál, A. Dévay:
Bioadhezív segédanyagot tartalmazó szublingvális minitabletták előállításának
optimalizálása hipertenzív krízis kezelése céljából
XVI. Gyógyszertechnológiai Konferencia és VIII. Gyógyszer az ezredfordulón
Konferencia, Siófok, 2010.
41. S. Merczel, K. Mayer, Sz. Pál, A. Dévay:
Antimikrobás hatású szemészeti in situ hatóanyag-leadó rendszer kvantitatív vizsgálata
XVI. Gyógyszertechnológiai Konferencia és VIII. Gyógyszer az ezredfordulón
Konferencia, Siófok, 2010.
42. K. Mayer, Sz. Pál, A. Dévay:
A gyógyszertári gyógyszerkészítés lehetőségei a korszerű terápiában
XVI. Gyógyszertechnológiai Konferencia és VIII. Gyógyszer az ezredfordulón
Konferencia, Siófok, 2010.
43. A. Fittler, B. Brachmann, Sz. Pál, A. Dévay, B. Kocsis, Z. Matus, L. Botz:
Új utakon a gyógyszerforgalmazás? Az interneten rendelt gyógyszerek átfogó
gyógyszerészeti vizsgálatai.
XVI. Gyógyszertechnológiai Konferencia és VIII. Gyógyszer az ezredfordulón
Konferencia, Siófok, 2010.

9
44. Gy. Horváth, É. Szőke, P. Molnár, L. Szente, Á. Kemény, J. Deli., T. Bozó, Sz. Pál, A.
Dévay, M. Simonyi, J. Szolcsányi, Zs. Helyes:
Inhibition of Mustard Oil-Induced Neural Responses by RAMEB-Lutein in Different In
Vitro and In Vivo Systems
15th International Cyclodextrin Symposium, Vienna, 2010.

10
Table of Contents
Publications and presentations related to the thesis ................................................................... 1
Other publications ...................................................................................................................... 3
Other presentations ..................................................................................................................... 4
List of Abbreviations ................................................................................................................ 12
1. Introduction .......................................................................................................................... 14
2. Aims ..................................................................................................................................... 16
3. Literature survey .................................................................................................................. 16
3.1. Interaction between particles, distribution of binder liquid ........................................... 17
3.2. Particle growth and attrition mechanism during pelletization ....................................... 20
3.3. Operation of pelletization .............................................................................................. 24
3.3.1. Mixing method ........................................................................................................ 25
3.3.2. Rotary disk method ................................................................................................. 26
3.3.3. Extrusion-spheronization method ........................................................................... 26
3.3.4. Roto-fluid method ................................................................................................... 27
3.3.5. Spray drying and freeze drying ............................................................................... 27
3.3.6. High-shear pelletization .......................................................................................... 28
3.3.6.1. Forces during high-shear pelletization ............................................................. 30
3.3.6.2. Determination of end-point of high-shear pelletization ................................... 32
3.3.6.2.1. Measurement of power consumption ........................................................ 32
3.3.6.2.2. Measurement of the impeller torque .......................................................... 32
3.3.6.2.3. Other methods based on the measurement of impeller torque .................. 33
3.3.6.2.4. Alternative measurement methods ............................................................ 33
3.4. Biopharmaceutical background ..................................................................................... 34
4. Materials and Methods ......................................................................................................... 39
4.1. Materials ........................................................................................................................ 39
4.1.1. Nystatin ................................................................................................................... 39
4.1.2. Pharmaceutical excipients ....................................................................................... 39
4.1.2.1. Microcrystalline cellulose ................................................................................ 39
4.1.2.2. α-lactose-monohydrate ..................................................................................... 40
4.1.2.3. Ethylcellulose ................................................................................................... 40
4.1.2.4. Hydroxyethylcellulose ..................................................................................... 40
11
4.1.2.5. Carbomer .......................................................................................................... 40
4.2. Methods ......................................................................................................................... 41
4.2.1. Design of experiments ............................................................................................ 41
4.2.2. Preliminary studies for high-shear pelletization ..................................................... 43
4.2.2.1. Determination of end-point of pelletization ..................................................... 44
4.2.3. Manufacture of micropellets containing nystatin for application GIC therapy ...... 45
4.2.4. Examinations of pellets ........................................................................................... 47
4.2.4.1. Particle size analysis ......................................................................................... 47
4.2.4.2. Drug release ...................................................................................................... 47
4.2.4.3. Determination of biological activity by direct bioautography ......................... 48
4.2.4.4. Bioadhesivity test ............................................................................................. 49
4.2.4.5. Scanning electron microscopy examinations ................................................... 50
4.2.4.6. Diffuse reflectance examinations ..................................................................... 50
4.2.4.7. Swelling examinations ..................................................................................... 51
4.2.4.8. Further dosage form examinations (bulk and tapped density, flowability,
friability) ........................................................................................................................ 51
4.2.4.9. Stability test ...................................................................................................... 51
5. Results .................................................................................................................................. 54
5.1. Optimization results for high-shear pelletization .......................................................... 54
5.2. Results of examinations of nystatin micropellets .......................................................... 57
6. Discussion ............................................................................................................................ 69
6.1. Optimization of GIC therapy ......................................................................................... 71
6.2. Summary of the new results .......................................................................................... 75
7. Conclusion ............................................................................................................................ 78
List of Figures .......................................................................................................................... 79
List of Tables ............................................................................................................................ 81
References ................................................................................................................................ 82

12
List of Abbreviations
ATCC American Type Culture Collection
API Active Pharmaceutical Ingredient
BCS Biopharmaceutical Classification System
CPL CarboPoL®/carbomer
DOE Design Of Experiment
EC EthylCellulose
ED Experimental Design
EDTA EthyleneDiamineTetraacetic Acid
FBMR Focused Beam Reflectance Measurement
GI GastroIntestinal
GIC GastroIntestinal Candidiasis
HEC HydroxyEthylCellulose
HIV Human Immundeficiency Virus
MDD Microbiologically Detected Dissolution
MDT Mean Dissolution Time
MTT 3-(4,5-diMethylThiazol-2-yl)-2,5-diphenylTetrazolium bromide
NIR Near Infrared
NIRS Near Infrared Spectroscopy
NS Not Significant

13
RH Relative Humidity
RPM Rotation Per Minute
RRSB Rosin-Rammler-Bennett-Sperling
RSV Relative Swept Volume
SEM Scanning Electron Microscope
S.D. Standard Deviation
τ, τD Mean Dissolution Time (MDT)
τM MDT based on microbiological examinations
τS MDT based on spectrophotometric examinations
TLC Thin Layer Chtomatography
UV Ultra Violet
VIS VISible

14
1. Introduction
Optimization of the drug release of peroral dosage forms and adjusting it to the absorption
window of the active ingredient is the fundamental point in the development of a new
pharmaceutical product [1,2]. However, there may be different aspects in cases when local
effect is required. In this type of therapy the concept of the dissolution of active ingredients
should be revaluated [3]. The enhancement of the bioavailability according to the
Biopharmaceutical Classification System (BCS) [4] cannot be applied invariably [6], since
importance of the absorption and the permeability is minor. Conversely, there are other
essential parameters which should be taken into account during the development of these
preparations, including the adhesivity to the mucous membrane, large contact surface of the
drug particles, the profile and the time of drug release [7]. Among several diseases,
gastrointestinal candidiasis (GIC) [8] was chosen to formulate and optimize a medicinal
product taking into consideration the enhancement of the bioavailability of local effect.
Application of pellets in this therapy offers even more advantages. They are suitable to
optimize drug release by their particle size, coating thickness or material.
Pellets among multiparticulate dosage forms offer several advantages generally in the therapy
related to safety and effectiveness of the medicinal product such as individual reproducibility
of gastric emptying, more regular absorption, increasingly stable, predictable plasma levels
and a reduced risk of high concentrations [9,10]. This basic concept of multiple-unit systems
is the fact that the dose of the active ingredient is released by the individual subunits, and the
functionality of the entire dose depends on the quality of the subunits [11]. Pellets are suitable
for further processing in order to optimize drug release by combining different particle size
fractions and coating thickness [12] in capsules or compressing them into tablet.
Manufacturing of pellets requires specialized equipments, technologies and excipients. Pellets
are usually prepared by wet agglomeration of fine powders of active ingredient and excipients
into spherical units in closed granulating systems, i.e. in rotor-fluid granulators or high-shear
mixers [13]. To produce pellets in a high shear mixer, the process involves distinct phases:
homogenization of powders, granulation, spheronization and drying. The primer nucleus of
future pellets is formed by binder spraying and dispersing during the agitation. Being a
multivariate process, it is important to identify and control the process variables, i.e. the
appropriate agitation prevents the development of too large particles [14,15,76]. Since
15
agglomerates undergo densification as mixing and spraying, the process time is expected as a
critical parameter influencing quality of pellets.
Although various experiments were drawn up to investigate the effect of the formulation
variables on the physical characteristics of pellets, only a few reports can be found in the
pharmaceutical literature investigating the large number of process variables together during
the pelletization concerning both the physical properties of granules and the drug release
profile of the dosage form [16].
Modelling the effect of process variables with factorial designs and analysis of the response
surfaces is a powerful, efficient and systematic tool that shortens the time required for the
development of pharmaceutical dosage forms and improves research and development work
[20].
The objective of the dissertation is to offer an optimized pharmaceutical preparation for the
therapy of GIC containing nystatin to achieve a prolonged site-specific antifungal treatment
using multiparticulate dosage form and special bioadhesive excipients based on preliminary
examinations carried out on micropellets with model drug incorporated.

16
2. Aims
Aims of this research work are:
determination of significant process variables and their effect of high-shear
pelletization,
application of the measurement of diffuse reflectance spectra as a possibility for fast
in-process control during the pelletization process,
application of optimized process variables in order to produce micropellets with
specific physical characters for an optimized GIC therapy,
application of Microbiologically Detected Dissolution (MDD) technique based on
direct bioautography in order to determine the dissolution kinetics of antifungal
substances,
comparison of the MDD with other analytical method,
optimizing the biopharmaceutical characters of micropellets for the antifungal action,
recommendation of the manufacturing method and ingredients for a successful GIC
therapy.
3. Literature survey
The literature survey of the thesis contains two parts. The first is concerned with the
technological manufacture and optimization, the second part handles the therapeutic
importance of locally acting micropellets.
Definition of pellets is not uniform, sometimes they are discussed together with granules and
often the terms pellet-micropellet are not distinguished. Their preparation can be carried out
in many ways with similarities to the preparation of granules [21]. According to the literature
there are a few fix points which can characterize the pellet dosage form as spherical particles
with almost smooth surface and compact texture independently to the method of preparation.
If their size is below 1 mm, the term “micropellet”, between 1 and 2 mm, the term
”minipellet” can be used.

17
According to the structure, as seen on Fig. 1 we can distinguish pellets containing the API in
the
1. matrix and in the
2. coating.
Figure 1. Basic types of pellets
(matrix pellet containing API on the left; inert pellet core with layer containing the API on the
right)
Pellets have several pharmaceutical technological advantages, such as excellent flowability,
easily optimizable particle size distribution, good mechanical stability, abrasion-resistant
structure and optimizable coating due to the regular, uniform, smooth surface [13].
3.1. Interaction between particles, distribution of binder liquid
Interaction between solid particles during granulation was first scientifically investigated by
Rumpf in the 50s [23]. In his work the following forces were listed:
1. attrition forces – gravitational force, magnetic force, electrostatic force or the van der
Waal force play less role in the interactions between particles, than capillary forces,
2. solid bridges – they are developing during the formation of inorganic bonds, chemical
reactions, crystallisation and melting phenomena,
3. shape closing bridges – they are developing due to the different shape and size of
particles during pelletization getting into physical contact to each other,
4. liquid bridges – they are forming due to capillary forces which ensures the cohesion of
particles and decrease the attrition forces.
inert
core

18
Newitt and Conway-Jones distinguished four phases during the development of spherical
particles according to the distribution of the binder liquid: the pendular state with liquid
bridges, the funicular state in which the amount of liquid bridges increases capillary state and
the droplet state [24].
Figure 2. Stages of wetting (S means the liquid saturation level) and tensile strength (σ)
during granulation
During pelletization right before the addition of any liquid small size particle-aggregates can
be observed due to the secondary attrition forces. After the beginning of addition of liquid
first drops start to connect the primary particles at the contact points. At the next, funicular
stage, the liquid bridges may reach each other and more than two primary particles can be
connected via this liquid bridge. Gaps are also started to be filled with liquid at this stage. At
the next stage the structure of the pellet is formed and due to the capillary state the liquid
added to the system is absorbed by the aggregated structure. The mechanical stability of the
pellet is the highest at this point. Increasing the amount of the added liquid the droplet state
can be reached, when the structure weakens and the system turns into paste or suspension.

19
Basically we can distinguish two types of binder liquid additions:
1. the size of the liquid drop is bigger than the size of the primary particle (drop
addition),
2. the size of the liquid drop is smaller than the size of the primary particle (spray
addition).
During the wetting of the powder mixture the contact angle (Θ) is the most important physical
property which describes the wetting mechanism on the solid/liquid/gas boundary surface,
which is the angle of solid/liquid and liquid/gas boundary surface.
We can distinguish:
1. contact wetting (Θ>0°),
2. film wetting (Θ=0°).
In case of Θ<90° we can state, that the substance is lyophilic, in case of Θ>90° it is lyophobic.
After the equilibrium of solid/liquid/gas phases the relationship between the surface tension
and the contact angle can be expressed by the Young-Dupré equation:
0cos lvslsv (1)
γsv
solid/gas surface tension
γsl solid/liquid surface tension
γlv liquid/gas surface tension
Θ contact angle

20
Another way of characterisation of the wetting is the Washburn-test, which is based on the
penetration of a liquid into a column filled with particles due to capillary forces. This
phenomenon can be described by the following equation:
γ
(2)
he height of the liquid after the equilibrium
R average radius of capillaries in the particle agglomerate
density of the liquid
g gravitational force
γlv Θ adhesion tension
3.2. Particle growth and attrition mechanism during pelletization
During pelletization the balance of particle growth and attrition mechanisms is very
fundamental. We can distinguish four types of these mechanisms:
1. Nucleation – is the first step during particle growth, when primary particles are getting
into contact to each other and stick together in the presence of the binder liquid
forming a nucleus.
2. Coalescence – due to the collision of particles bigger aggregates are formed.
3. Layering – also called as „balling”, when a larger amount of primary particles stick on
the surface of a bigger aggregate due to liquid addition.
4. Breakage – there are more mechanisms for the breakage of granules/pellets:
a. crushing – during which smaller granules or pellets crush and get onto the
surface of bigger particles. There are several mechanisms of crushing:
i. shattering,
ii. fragmentation,

21
iii. abrasion,
b. abrasion transfer – during which the material transfer occurs between two
colliding particles, while both particles stay intact.
These mechanisms are often described mathematically by different models according to
different steps of pellet formation. Strength of liquid bridge between two colliding particles
determines whether they stay intact or attach together. The greatest force which depends on
the relative amount between two particles comparing to their volume was first described by
Rumpf [23]:
plcap dF (3)
1.9< α<π coefficient depending on the amount of moisture
γl surface tension of the liquid
dp diameter of the particle
Rumpf described another relationship for the breakage of granules, which includes the
particles tensile strength (σt) in funicular or capillar state:
cos1
pp
lt
dSC
(4)
C coordination number dependent from the shape of the particle
S liquid saturation of the granule
ε intragranular porosity
dpp diameter of the primary particle
Θ contact angle

22
Ouchiyama and Tanaka determined a model which can be used to calculate the critical
diameter (dc) above which there is no coalescence [25]:
a
tKcdc
2
3
(5)
a and c constants
K deformation constant
σt tensile strength of the granule
The ’K’ deformation constant can be described as the ratio of the contact surface (A) and the
compaction force (F):
F
AK (6)
Kristensen et al completed Ouchiyama and Tanaka’ model to calculate the tensile strength of
the granule particles and stated that granule particles must reach a minimal mechanical
stability for the coalescence [26].
Ennis et al recognized, that the viscosity of the liquid significantly influences the cohesion
force of the liquid bridge, thus an agglomeration model was developed for the dynamic liquid
bridge [28]. Depending on the kinetic energy during the collision of particles the energy
spread across the system is used at coalescence or the reflexion of particles. To describe this
system Ennis et al introduced the dimensionless viscous Stokes number:
9
8 0rvSt
p
v (7)

23
p density of the pellet/granule
v0 relative velocity between two particles
r radius of the pellet/granule
η viscosity of the binder liquid
The viscous Stokes number is the ratio of two colliding particle’s energy and the spreading of
energy in a viscous binding liquid [29]. In case of a high-shear granulator the velocity of the
collision is in direct proportion to the impeller rotation speed (vimo):
vimo πND (8)
N rotating speed of the impeller
D diameter of the granulation bowl
Since in case of collision of two particles they lose kinetic energy, the velocity before the
collision (v0) is higher than the velocity after the collision (v).
Coalescence occurs when the viscous Stokes number (Stv) is smaller than its critical value
(Stv*):
a
vh
h
eSt ln
11
* (9)
e rearrangement coefficient, which can be calculated from the difference of
velocity before and after the collision
h thickness of the liquid layer on the surface of the pellet
ha surface roughness (diameter of the primary particles is also ’ha’)
According to the theory above there are three cases regarding the values Stv and Stv*:
1. Stv « Stv* - in this case all collisions are successful
2. Stv = Stv* - some collisions are successful
3. Stv » Stv* - none of the collisions are successful

24
From the expressions above we can state, that the collision of the particles and growth by
coalescence has higher probability at low particle density, low impeller speed, small particle
size, high viscosity liquid binder, small rearrangement coefficient, thick surface liquid layer
and smooth particle surface. Since these variables usually change in function of time, above
calculations can only be used for retrospective studies.
3.3. Operation of pelletization
Similarly to the granules there are three main types of operations of pelletization:
1. Solvent pelletization – the applied liquid dissolves totally or partially one or more
components of the powder mixture. During the addition of the liquid a saturated
solution develops on the surface of the particles which binds them together. After the
evaporation of the solvent the dissolved component gathers on the surface of the pellet
and crystallizes, forming a thick coating (Fig.3.) [21].
Figure 3. Mechanism of pelletizing with solvent
2. Binder pelletization – usually high molecular weight polymers are used. The powder
mixture is usually wetted by the proper amount of binder liquid and then it is kneaded.
The binder material also can be added in its powder form, but these pellets’
mechanical properties are usually poor (Fig.4.) [21].

25
Figure 4. Mechanism of pelletizing with binding agent
3. Sinter pelletization – in this case one or more components of the powder mixture has
a lower melting point (usually high molecular weight macrogol). Heating the mixture
partial melting occurs. Spray drying or freeze drying this mixture result almost
perfectly spherical pellets (Fig.5.) [21].
Figure 5. Mechanism of pelletizing with sintering
In order to carry out pelletizing, several procedures are available, which will be discussed in
the following chapters.
3.3.1. Mixing method
This is the simplest way of pelletisation. This method usually results heterogeneous particle
size distribution. During this method the powder mixture and the liquid binder both are placed
into a rotating caldron, where the pellets are formed [13].

26
3.3.2. Rotary disk method
The powder mixture is placed on the surface of a rotating flat disk or a conical body, while the
binder liquid is added from the centre of the rotating axis. Developing particles roll to the
edge of the rotating disk due to the centrifugal force, during which they gain their spherical
shape. Using this method spheronization of preliminary prepared granules can also be carried
out (Fig.6.).
Figure 6. Rotary disk pelletizing equipment [77]
3.3.3. Extrusion-spheronization method
This is one of the most commonly used pellet preparation method [27]. Powder components
are kneaded with the liquid, then the wet mass is extruded through a 0.5-2.0 mm diameter
hole size disk. After this step the plastic and wet extrudate is spheronized (Fig.7.) [30].
Figure 7. Extruder during operation [77]

27
3.3.4. Roto-fluid method
Applying fluid-bed granulation, spheronization and drying is carried out in one complex step.
There is a rotating disk at the bottom of the machine with a conical body in the centre (Fig.
8.). Due to the fluid air, the rotating disk and the conical body particles circulate around the
wall of the working area and roll on the surface of the disk. The liquid is added towards the
centre of the working space spraying the liquid to the rotational direction. Reaching the proper
particle size the liquid addition is stopped and from this point only spheronization and drying
is carried out. Roto-fluid pelletization is one of the most power consuming and expensive
methods, its advantage is the high productivity and the one-step production [21].
Figure 8. Operation of roto-fluid machine [77]
3.3.5. Spray drying and freeze drying
API is dispersed in the vehicle’s solution, and then it is sprayed. Perfectly spherical droplets
formed during this preparation are then dried by hot or cold air [21].
28
3.3.6. High-shear pelletization
This method unifies the main steps of the classic wet granulation (homogenization, wetting,
kneading and particle forming) and the spheronization. The production is carried out in one
working space similarly to the fluidisation in one complex step (Fig. 9.). During high-shear
granulation intense mixing of the components and the presence of the shearing forces results
the smooth and compact spherical particles. The mechanical parameters of the end-product
depend on the operation variables. Spray or drop form of liquid is immediately dispersed due
to the high rotation speed of mixer elements, thus reaching a quick and perfect wetting. Main
mixer elements consists the impeller and the chopper. The impeller is at the bottom of the
working space reaching rotation speed of 500-2000 rpm. The impeller moves the mass around
the working space and in radial direction outwards from the centre to the wall. The mass
produces a whirling movement and continuously falls back towards the centre. Chopper
blades can be placed at the bottom, top or tangentially to the rotation axis of the impeller. This
mixer element is composed of more smaller, thinner blades (3-6), which enhance the shearing
forces during the production. Their speed also varies between 500-2000 rpm. Pellets produced
in the high-shear machine can be dried by microwave or heating double-jacket as well. The
production method is extremely quick, there is low risk of contamination due to the closed
working area. Choosing the proper operation variables and applying the proper excipients
almost all pharmaceutical technological and biopharmaceutical parameters can be optimized
and controlled [13].

29
Most important variables during high-shear production related to the equipment:
1. mixing bowl
a. shape
b. size
c. material
2. impeller
a. shape
b. size
c. speed
3. chopper
a. shape
b. size
c. speed
4. temperature of the working space
5. operation time
Most important variables during high-shear production related to the material are:
1. powder composition (particle size distribution, physical properties)
2. weight
3. liquid binder
a. viscosity
b. density
c. amount
d. dosing speed
e. dosing method

30
Figure 9. Lab-scale high share granulator (Pro-C-epT 4M8, Belgium, Zelzate)
3.3.6.1. Forces during high-shear pelletization
During pelletization presence and equilibrium of integration and reduction effects leads to the
formation of pellets, which are based on the following forces:
gravitational force
acceleration force
centrifugal force
resistance of the pelletizing bowl
fluid effects developed by the impeller
For the characterisation of the forces effecting the preparation, the tip speed of the impeller is
commonly used, which is directly proportional to its shearing force. The perimetric speed is
responsible for the movement of the wet mass. This value can be calculated by the following
expression:
π r (10)

31
vt velocity of the tip of the impeller
vf speed of the rotor of the impeller (rpm)
r radius of the circle done by the tip of the impeller
The Froude number describes the forces affecting to the wet mass resulting its compaction,
which is carried out by the impeller. The Froude number is a dimensionless value.
r r
(11)
Fr Froude number
v speed of the impeller
r radius of the circle done by the tip of the impeller
G acceleration of gravity
At smaller, laboratory production scale the Froude number is usually higher, than in industrial
scale. The higher number means bigger pellet size, more compact structure, which can result
the cohesion of the particles to the pelletizing bowl [33].

32
3.3.6.2. Determination of end-point of high-shear pelletization
Critical point of the high-shear pelletization is the determination of the end-point of the
production. The end-point is usually determined by the technologist according to the particle
size, the particle size distribution, density, and the powder rheology. Instrumented high-shear
machines have several parameters which are observed in order to forecast and determine the
optimal end-point [34].
Most important methods include:
measurement of power consumption,
measurement of the impeller torque,
other methods based on the measurement of the impeller torque,
alternative measurement methods.
3.3.6.2.1. Measurement of power consumption
One of the most commonly used methods is the measurement of the power consumption of
the impeller. Scientific literature several times reported that the increase of the pellet size has
close correlation to the increasing power consumption. This correlation is not linear, but it is
characteristic and reproducible to the definite powder composition [35].
3.3.6.2.2. Measurement of the impeller torque
The second most commonly used method is the measurement of the impeller torque, which
has good correlation to the previously mentioned method, since sometimes it is recommended
to use the more complex measurement of the impeller torque due to insensitivities in the
power consumption profile in case of definite weight of mass or other specific parameters.
The profile of the impeller torque divides the pellet formation process into five phases. In the
first phase the powder is moistened without forming liquid bridges. In the second phase liquid
bridges are formed between the particles and first granules are formed. Formation of coarse

33
agglomerates could be observed in the third phase and in the fourth phase large areas are
filled with liquid. In the fifth phase when the liquid saturation equals 100%, the system
becomes a suspension [35]. The end-point of the pelletization is usually during the fourth
phase.
3.3.6.2.3. Other methods based on the measurement of impeller torque
Torque rheometer method – the third most commonly used method, which also
provides information on rheological properties [38].
Torque reaction force method – applies Newton’s third law of action-reaction.
During the measurement the rotor tries to move against the rotational direction which
develops forces inside the engine, which can be detected and used for the end-point
determination [35].
3.3.6.2.4. Alternative measurement methods
There are several other measurement methods supplementing the lacks of the methods
mentioned above:
Application of NIR sensor – this method is based on the moisture changes of the
particles. Its disadvantage is that the sensor can only detect the moisture on the surface
of the wet mass [39]].
Focused Beam Reflectance Measurement (FBMR) – the method is based on the
particle size determination. This method cannot be used for end-point determination
alone, but it can be a perfect supplement of other methods [40].
Acoustic sensor measurement – one of the oldest methods of the end-point
determination which can be used alone and as a supplementing tool as well.
Development of the technology in recent years and modern analysis softwares provide
more potential to this method [31].

34
3.4. Biopharmaceutical background
Gastrointestinal candidiasis (GIC) often occurs in patients suffering from immunosuppression
(e.g. related to HIV infection), but many researchers found GIC also in non-immuno
suppressed humans. GIC belongs to one of the most discussed diseases, since it is still
undecided whether it can cause systemic symptoms or not. Researches, however, indicate GIC
diseases may be more prevalent than it is supposed. Several antifungal pharmaceutical
ingredients are considered to be effective in the therapy of GIC as listed in Table I [43].
Table I. BCS classification of antifungal agents used in candidiasis
BCS
Class Antifungal agent Biopharmaceutical properties
1 - high solubility, high permeability
2 clotrimazole, itraconazole low solubility, high permeability
3 fluconazole, capsofungin high solubility, low permeability
4 amphotericin B, nystatin low solubility, low permeability
Clotrimazole (Fig. 10.) belongs to the group of imidazoles, it is applied in 10 mg troches 5
times a day in mucosal candidiasis. According to the Ph. Eur. 8. it is white or pale yellow
crystalline powder. It is practically insoluble in water; soluble in alcohol, in acetone, in
chloroform, and in methyl alcohol [44].
C22H17ClN2 = 344.8
Figure 10. Structural formula of clotrimazole, 1-(α -2-Chlorotrityl)imidazole

35
Itraconazole (Fig. 11.) is a triazole antifungal ingredient applied in oral solution 200 mg/day.
This substance is a white powder, insoluble in water; very slightly soluble in alcohol; freely
soluble in dichloromethane; sparingly soluble in tetrahydrofuran [44].
C35H38Cl2N8O4 = 705.6
Figure 11. Structural formula of itraconazole, (±)-2-sec-Butyl-4-[4-(4-{4-[(2R*,4S*)-2-(2,4-
dichlorophenyl)-2-(1H-1,2,4-triazol-1-ylmethyl)-1,3-dioxolan-4-ylmethoxy]phenyl}-
piperazin-1-yl)phenyl]-2,4-dihydro-1,2,4-triazol-3-one
Fluconazole (Fig. 12.) is also a triazole antifungal ingredient applied in 100-200 mg. It is a
white or almost white, hygroscopic, crystalline powder, slightly soluble in water; freely
soluble in methyl alcohol; soluble in acetone [44].
C13H12F2N6O = 306.3
Figure 12. Structural formula of fluconazole, 2-(2,4-Difluorophenyl)-1,3-bis(1H-1,2,4-
triazol-1-l)propan-2-ol
36
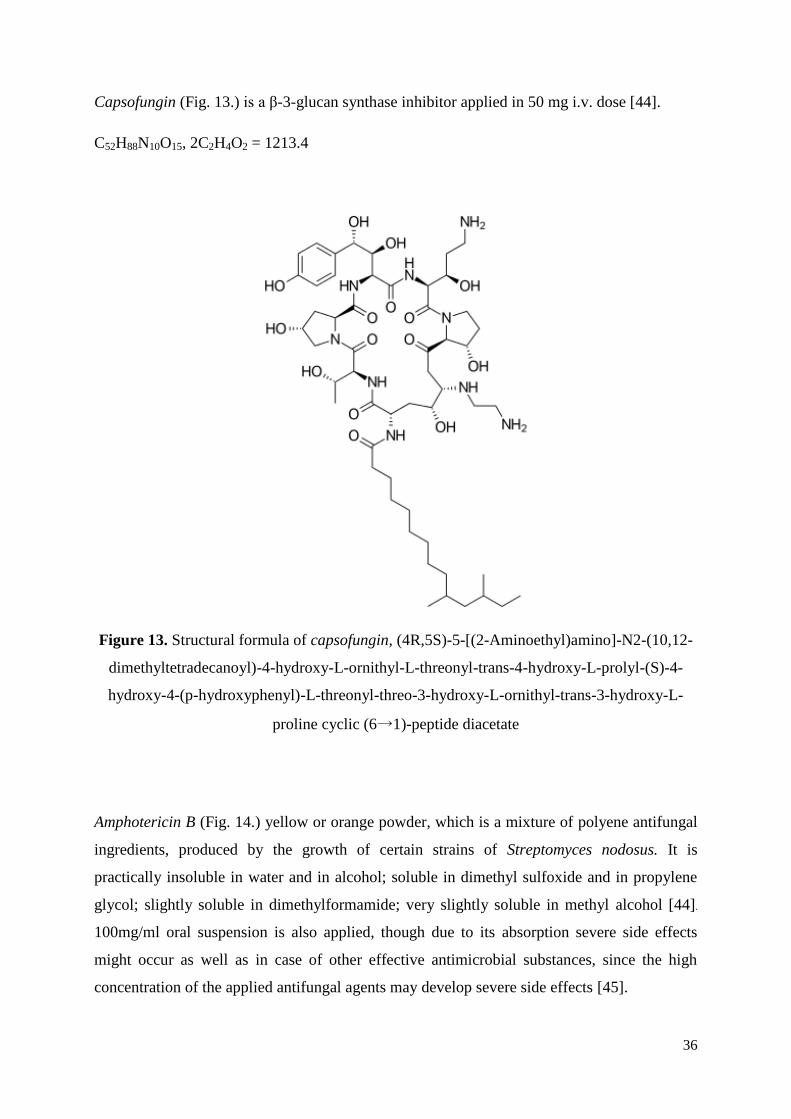
Capsofungin (Fig. 13.) is a β-3-glucan synthase inhibitor applied in 50 mg i.v. dose [44].
C52H88N10O15, 2C2H4O2 = 1213.4
Figure 13. Structural formula of capsofungin, (4R,5S)-5-[(2-Aminoethyl)amino]-N2-(10,12-
dimethyltetradecanoyl)-4-hydroxy-L-ornithyl-L-threonyl-trans-4-hydroxy-L-prolyl-(S)-4-
hydroxy-4-(p-hydroxyphenyl)-L-threonyl-threo-3-hydroxy-L-ornithyl-trans-3-hydroxy-L-
proline cyclic (6→1)-peptide diacetate
Amphotericin B (Fig. 14.) yellow or orange powder, which is a mixture of polyene antifungal
ingredients, produced by the growth of certain strains of Streptomyces nodosus. It is
practically insoluble in water and in alcohol; soluble in dimethyl sulfoxide and in propylene
glycol; slightly soluble in dimethylformamide; very slightly soluble in methyl alcohol [44].
100mg/ml oral suspension is also applied, though due to its absorption severe side effects
might occur as well as in case of other effective antimicrobial substances, since the high
concentration of the applied antifungal agents may develop severe side effects [45].

37
C47H73NO17 = 924.1
Figure 14. Structural formula of amphotericin B, (1R,3S,5R,6R,9R,
11R,15S,16R,17R,18S,19E,21E, 23E,25E,27E,29E,31E,33R,35S,36R,37S)- 33-[(3-amino- 3,6-
dideoxy- β-D-mannopyranosyl)oxy]-1,3,5,6,9,11,17,37-octahydroxy- 15,16,18-trimethyl- 13-
oxo- 14,39-dioxabicyclo [33.3.1] nonatriaconta-19,21,23,25,27,29,31-heptaene- 36-carboxylic
acid
Pharmaceutical character of nystatin will be summarized later in chapter 4.1.1. Its effect is
based on the topical action and the contact time with the mucous membrane, thus the
formulation should adhere to the affected area as long as possible, however available dosage
forms are unable to achieve an optimized effect, lacking the specialities of the adequate
topical treatment. To reach this aim, mucoadhesive materials are needed to be added.
Application of mucoadhesive polymers in the formulation, such as the anionic carbomer
(CPL) and the non-ionic hydroxyethylcellulose (HEC) is a possible method for the targeted
mucosal drug delivery which has been introduced to the pharmaceutics in the late 1960s [48].
In our study after preliminary examinations of high-shear granulation, nystatin was chosen as
one of the most adequate API for the treatment of GIC due to its preferential properties [43].
Micropellets containing nystatin with increased specific surface were produced according to
an experimental design containing bioadhesive excipients, which can prolong the contact time
with the mucous membranes. The pellet size and the proportion of bioadhesive substances
(carbopol®/hydroxyethylcellulose) were taken into consideration as variables affecting the
therapy [51].
During the evaluation, in vitro spectrophotometrical, microbiological dissolution, ex vivo
bioadhesion and swelling tests were carried out.

38
Effectiveness of the produced medicament samples was evaluated by the determination of the
drug release [52]. Developing possibilities of nystatin determination methods are continuing
intensively, since classic UV analytical methods in the pharmaceutical practice are not
suitable to follow exact changes of antifungal activity of nystatin [53]. UV spectrum of
nystatin demonstrates three main local maxima at 290, 306 and 318 nm which are only
reliable at the same molecular state. Micellar structure of the polyene nystatin can lead to
differences in the UV spectrum [54]. Numerous colour reactions were also tested, but there
was no confirmed correlation with the biological activity [55]. A generalized assumption was
later published regarding the lack of relationship for all polyene antibiotics between the UV
spectrophotometric assay and the biological activity, which eventuated to include an agar
diffusion method for the quantitative assay of nystatin in the Ph. Eur. 5. However, the agar
diffusion method is sometimes time, cost and power consuming especially in case of large
quantity of samples. Application of thin layer chromatography (TLC) based direct
bioautography during the drug dissolution tests, microbiologically detected dissolution
(MDD) can be carried out [56]. The MDD does not need strict sterile conditions and it is
almost 100 times more sensitive than the agar diffusion method. Novel approach to enhance
the UV spectrophotometric determination and to achieve better correlation is the application
of the third-derivative spectrophotometric evaluation, which was applied in our experiments.
The objective of the present study is to offer an optimized drug formulation by revealing the
relationship between average pellet size, CPL and HEC content and optimized drug release to
achieve a site-specific antifungal therapy.

39
4. Materials and Methods
4.1. Materials
4.1.1. Nystatin
The polyene antifungal antibiotic nystatin (Fig. 15.) (BCS class IV.) is one of the most
important active agents in the site-specific treatment of the candidiasis [46], as it was reported
by several clinical researches. Nystatin is a yellow or slightly brownish hygroscopic substance
obtained by fermentation using the ATCC 11455 strain of Streptomyces noursei [44]. Nystatin
is very poorly absorbed from the gastrointestinal tract, therefore the development of side
effects is suppressed. It is excreted almost entirely in the faeces.
Figure 15. Structure of nystatin, (1S,3R,4R,7R,9R,11R,15S,16R,17R,18S,19E,21E,
25E,27E,29E,31E,33R,35S,36R,37S)-33-[(3-amino-3,6-dideoxy-β-L-mannopyranosyl)oxy]-1,
3,4,7,9,11,17,37-octahydroxy-15, 16,18-trimethyl-13-oxo-14, 39-
dioxabicyclo[33.3.1]nonatriaconta-19, 21,25,27,29,31-hexaene-36-carboxylic acid
4.1.2. Pharmaceutical excipients
4.1.2.1. Microcrystalline cellulose
Microcrystalline cellulose is purified, partially depolymerized cellulose that occurs as a white,
odourless, tasteless, crystalline powder composed of porous particles. Microcrystalline
cellulose is widely used in pharmaceuticals, primarily as a binder/diluent in oral tablet and

40
capsule formulations where it is used in both wet-granulation and direct-compression
processes [36]. In our experiments Avicel PH 101 and Avicel PH 105 were used.
4.1.2.2. α-lactose-monohydrate
Lactose occurs as white to off-white crystalline particles or powder. It is odourless and
slightly sweet-tasting; the lactose is approximately 20% as sweet as sucrose. This excipient is
widely used as a filler or diluent in tablets and capsules [36].
4.1.2.3. Ethylcellulose
Ethylcellulose (EC) is a tasteless, free-flowing, white powder. Ethylcellulose is widely used in
oral and topical pharmaceutical formulations. The main use of ethylcellulose in oral
formulations is as a hydrophobic coating agent for tablets and granules. Ethylcellulose
coatings are used to modify the release of a drug) to mask an unpleasant taste, or to improve
the stability of a formulation; for example, where granules are coated with ethylcellulose to
inhibit oxidation. Modified release tablet formulations may also be produced using
ethylcellulose as a matrix former [36].
4.1.2.4. Hydroxyethylcellulose
Hydroxyethylcellulose (HEC) occurs as a light tan or cream to white colored, odorless and
tasteless, hygroscopic powder. Hydroxyethylcellulose is a non-ionic, water-soluble polymer
widely used in pharmaceutical formulations, primarily used as a thickening agent in
ophthalmic and topical formulations. It is also used as a binder and film-coating agent for
tablets as well as an excipient for its bioadhesive properties [36].
4.1.2.5. Carbomer
Carbomers (CPL) are white-colored, acidic, hygroscopic powders with a slight characteristic
odour. Carbomers are synthetic high-molecular-weight polymers of acrylic acid that are cross-
linked with either allyl sucrose or allyl ethers of pentaerythritol. They are mainly used in
liquid or semisolid pharmaceutical formulations as suspending or viscosity-increasing agents.

41
Formulations include creams, gels, and ointments for use in ophthalmic, rectal and topical
preparations. It is also used as a bioadhesive material in oral preparations [36].
4.2. Methods
4.2.1. Design of experiments
Design, operation and control of pharmaceutical technological systems are based on
information and their processing. Understanding of procedures is carried out by data mining,
which means knowledge discovery from a database. Data mining is a scientific action, which
aims at discovery of particular phenomena and procedures by data management and search
and analysis of their correlations.
Afterwards discovery of procedures (process analysis) will take place the control of
procedure, which can only be efficient, if factors can be determined, which are influencing
quality parameters. The factors can be grouped accordingly how extent and in which way are
able to effect on particular parameters.
One of the most important tasks of experimental design is the optimization of a preparation,
which can be defined as search of the best and most favourable values of a phenomenon in
order to create the necessary technological conditions. Size of manufacture batch,
manufacturing time and particular operation parameters can also be obtained by optimization
of parameters [58].
With the usage of factorial experimental design, few numbers of experiments are enough to
explore the correlation between independent and dependent variables. Requirements of
chosen parameters and factors are:
- controllability,
- accuracy,
- factor has to be unambiguous and directed to the particular object,
- independence between factors.
The experimental design (ED, or Design of Experiment, DOE) means plan or design
containing settings and sequence, which has to be compiled even before beginning of
experiment. This is an effective method, which allows planning and analysis of experiments,

42
objective evaluation of obtained result, conclusion, after which follow the steps for
optimization of particular process.
Full factorial experimental design is regarded if all possible factor level combination and
fractional factorial experiments are performed. If just a part of the full, partial factor design is
carried out. Latter one can significantly reduce the necessary number of experiments, which
should be performed.
The linear model
for two factors (x1 and x2):
21122211o xxbxbxbbY (12)
b coefficient
x1x2 interactions
for three factors (x1 , x2 and x3):
321123322331132112332211o xxxbxxbxxbxxbxbxbxbbY (13)
b coefficient
x1x2 , x1x3 , x2x3 , x1x2x3 interactions
Mathematic model determined experimentally is appropriate to describe or characterize an
examined system, if it meets with the criteria of adequacy. Namely there is no significant
difference between output of system calculated according to computer and output of actual
system.
Optimization can be performed by applying the gradient descent method developed by Box
and Wilson. The principal of this method is that in order to determine the optimum,
simultaneous change of significant factors is required [59].
43
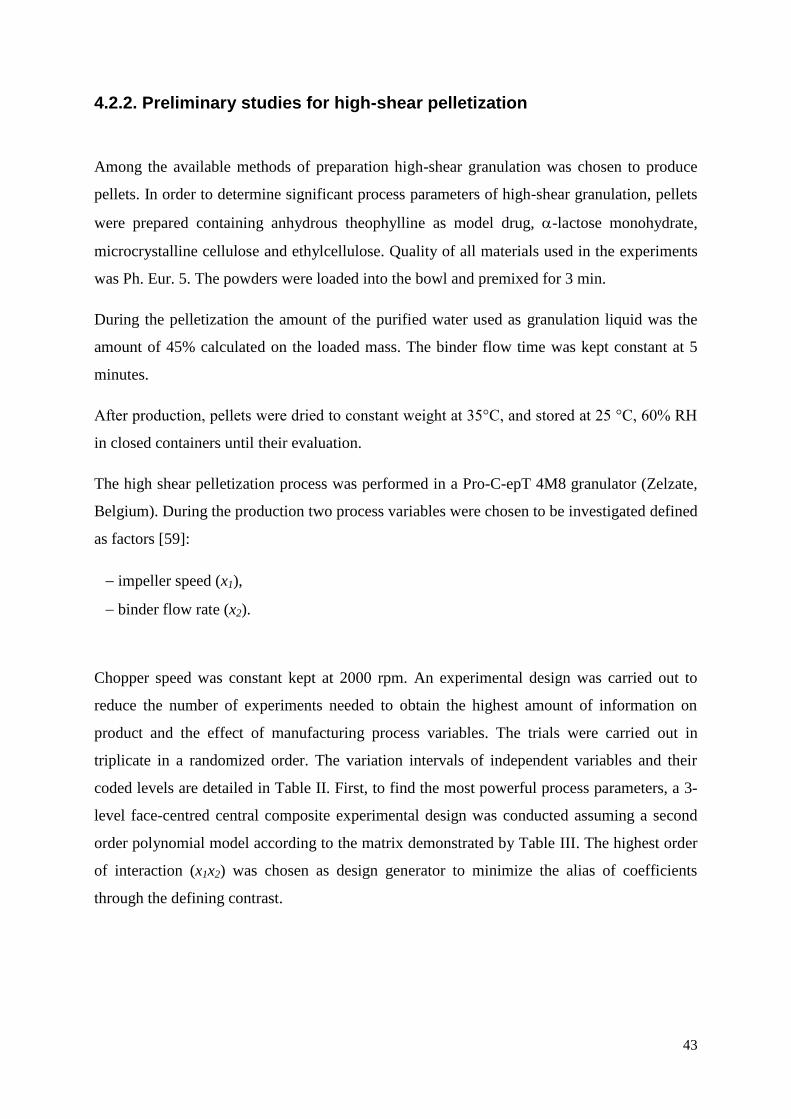
4.2.2. Preliminary studies for high-shear pelletization
Among the available methods of preparation high-shear granulation was chosen to produce
pellets. In order to determine significant process parameters of high-shear granulation, pellets
were prepared containing anhydrous theophylline as model drug, -lactose monohydrate,
microcrystalline cellulose and ethylcellulose. Quality of all materials used in the experiments
was Ph. Eur. 5. The powders were loaded into the bowl and premixed for 3 min.
During the pelletization the amount of the purified water used as granulation liquid was the
amount of 45% calculated on the loaded mass. The binder flow time was kept constant at 5
minutes.
After production, pellets were dried to constant weight at 35°C, and stored at 25 °C, 60% RH
in closed containers until their evaluation.
The high shear pelletization process was performed in a Pro-C-epT 4M8 granulator (Zelzate,
Belgium). During the production two process variables were chosen to be investigated defined
as factors [59]:
impeller speed (x1),
binder flow rate (x2).
Chopper speed was constant kept at 2000 rpm. An experimental design was carried out to
reduce the number of experiments needed to obtain the highest amount of information on
product and the effect of manufacturing process variables. The trials were carried out in
triplicate in a randomized order. The variation intervals of independent variables and their
coded levels are detailed in Table II. First, to find the most powerful process parameters, a 3-
level face-centred central composite experimental design was conducted assuming a second
order polynomial model according to the matrix demonstrated by Table III. The highest order
of interaction (x1x2) was chosen as design generator to minimize the alias of coefficients
through the defining contrast.

44
Table II. Independent process variables: factors and their coded levels
Factors Variation
intervals
Low
(− 1)
Base
(0)
High
(+ 1)
x1 impeller speed (rpm) 500 750 1000
x2 binder flow (ml/min) 8 10 12
Table III. 2-factor, 3-level face centred central composite experimental design matrix for the
pelletization
Trial Controlled factor
x1 x2
Impeller
speed
(rpm)
Binder
flow
(ml/min)
1 1000 12
2 500 12
3 1000 8
4 500 8
5 1000 10
6 500 10
7 750 12
8 750 8
9 750 10
4.2.2.1. Determination of end-point of pelletization
Measurement of the impeller torque was used for the determination of pelletization end-point.
It is a prevalent technique due to its reliability and in-process possibilities. The principle of
this method is the detection of the resistance caused by the wet mass obstructing the
impeller’s movement. End-point was determined according to the profile of the impeller
torque during production in the IV. phase of high-shear granulation (see Chapter 3.3.6.2.2.).

45
4.2.3. Manufacture of micropellets containing nystatin for application GIC therapy
Nystatin (Merck, Darmstadt, Germany), α-lactose-monohydrate (DC, BDI, Zwolle,
Netherlands), microcrystalline cellulose (Avicel PH 105, FMC, Philadelphia, USA),
hydroxyethylcellulose (HEC) (Hercules, Wilmington, USA) and carbomer (CPL) (Carbopol
934P, Hercules, Wilmington, USA) were used to prepare pellets. Purified water was used as
granulation liquid. Quality of all materials used in the experiments was Ph. Eur. 7.
Pellets were produced in a high-shear mixer (Pro-C-epT 4M8 Granulator, Belgium, Zelzate)
with a three-blade impeller and a chopper. Each batch contained 5% nystatin, 45%
microcrystalline cellulose, hydroxyethylcellulose and carbomer in different amounts (0-5%)
according to an experimental design, α-lactose-monohydrate added as diluent so that the total
dry mass was 100.0 g. Powders were loaded into a 1000 ml bowl and premixed for 3 minutes.
Purified water was used as binder liquid.
Pellets of 15 samples were prepared according to a central composite factorial design (Table
IV. and V.) in triplicate. Experimental design of full type with five centre points had three
numeric factors including average pellet size (x1), CPL ( x2) and HEC (x3) content and five
coded levels (-1.414, -1, 0, +1, +1.414). Different average pellet sizes with various CPL and
HEC contents were produced in the trials in order to examine different preparations. During
statistical evaluations Design Expert v.7.0 (Stat-Ease Inc., Minneapolis, USA) was used to
calculate the relative effect of factors (b), the confidence interval was 95%, significance was
determined if p<0.05. TableCurve® 3D v. 4.0 (Systat Software Inc., London, UK) was used
to reveal the response surface from the polynomial equation calculated using the experimental
design.
An Erweka vibrating sieve (Erweka GmbH, Heusenstamm, Germany) had been used for
determining pellet size and separation of pellets by average size, according to the
experimental design.

46
Table IV. Central composite factorial design with two level factorial design points (-1,1),
axial points (-1.414, 1.414) and a centre point (0)
Trial x1 x2 x3
1 1 1 -1
2 1 -1 1
3 -1 1 1
4 -1 -1 -1
5 -1.414 0 0
6 1.414 0 0
7 0 -1.414 0
8 0 1.414 0
9 0 0 -1.414
10 0 0 1.414
11 0 0 0
12 0 0 0
13 0 0 0
14 0 0 0
15 0 0 0
Table V. Process parameters of trials
Factors with coded levels -1.414 -1 0 1 1.414
x1, average pellet size (μm) 217.2 300.00 500.00 700.00 782.8
x2, CPL content (g) 0.00 0.73 2.50 4.27 5.00
x3, HEC content (g) 0.00 0.73 2.50 4.27 5.00

47
4.2.4. Examinations of pellets
4.2.4.1. Particle size analysis
The size analysis of the pellets was carried out by sieves using an Erweka vibrating apparatus,
with a set of eight standard sieves (100, 160, 250, 400, 630, 1000, 1600 μm). The sample size
was 100.0 g and the shaking time was 5 minutes. The pellet size (geometric-weight mean
diameter) and size distribution (geometric standard deviation) were estimated.
In case of optimized production Rosin-Rammler-Sperling-Bennett (RRSB) distribution
function of particle size was also presented, based on the mass retained on the sieves, which is
described by the following formula [21,73]:
= 100 -(
)
(14)
where
R% residual mass on the sieve
x particle size
a size at 36,8% of particles retained
n uniformity factor
Software for RRSB distribution was developed by our institute.
4.2.4.2. Drug release
Drug release from pellets containing nystatin was studied in 900 ml of pH 1.2 hydrochloric
acid at 37±0.5°C, applying a paddle apparatus of Ph. Eur. 5. at 75 rpm (Erweka DT 700,
Heusenstamm, Germany) examining 500 mg samples. Spectrophotometric determination was
carried out according to previous examinations (λ = 306 nm, Jasco V-550 UV/VIS
spectrophotometer, Japan). Mean and standard deviation (S.D.) was determined from three
samples.

48
The dissolution kinetics of the preparation detected by both spectrophotometer and
microbiological method, was determined by the Weibull distribution function, applied in the
following form [1]:
( [
]
) (15)
where
m dissolution (%) at time t
m∞ dissolution (%) at infinite time
t0 lag-time of dissolution
τ mean dissolution time (theoretical time when 63.2% of the active agent is
dissolved)
β shape parameter of the dissolution profile
Our evaluation focused mainly on the effect of matrix forming agents on drug release kinetics.
Shape parameter β and mean dissolution time τ were selected to characterize drug release and
the correlation was determined between the values of the microbiological assay and the
spectrophotometric measurement. Regarding these parameters, βS and τS were determined
from spectrophotometric data, βM and τM were determined from microbiological assay.
4.2.4.3. Determination of biological activity by direct bioautography
One of the most widely applied methods among biological activity measurements is the direct
bioautography. In this method microorganisms grown in a proper broth are spread on the
surface of a TLC plate and then incubated. The surface of the TLC plate is covered with the
broth to ensure the growth of microorganisms. Antimicrobial agents dripped on the plate
develop inhibition zones which can be easily visualised by application of dehydrogenase
activity detecting substances [56].

49
Biological activity of the samples was determined on silica gel plates applying 3-(4, 5-
dimethyl-2-thiazolyl) -2, 5-diphenyl -2H- tetrazolium bromide – MTT (Sigma Aldrich, USA)
to visualise antimicrobial activity. The applied test strain was Candida albicans, ATCC
90028. The TLC plates were: TLC DC - Alufolien Silica gel 60 F254 (Art. 1.05554, Merck,
Darmstadt, Germany). Sample application on TLC plates was a series of 2-7 ng nystatin (Fig.
16.). Samples of microbiological detection and UV spectrophotometric determination were
from the dissolution experiment. The diameter of inhibition spots was determined by the
analysis of brightness distribution on TLC plate using 300 dpi scanned images and ImageJ
1.45f software (Wayne Rasband, National Institutes of Health, USA) for evaluation.
Figure 16. Inhibition spots on a sample TLC plate
4.2.4.4. Bioadhesivity test
The bioadhesivity of the prepared micropellets was investigated ex vivo by a wash-off test. A
1.5x1.5 cm piece of guinea pig ileum mucosa was fixed onto a plate at an angle of 45°. The
examined section of ileum was previously rinsed in a Krebs buffer solution of the following
composition:
NaCl (119 mmol/L)
KCl (4.7 mmol/L)
CaCl2·2H2O (2.5 mmol/L)
NaHCO3 (20 mml/L)
MgCl2·7H2O (1.17 mmol/L)
KH2PO4 (1.18 mmol/L)
EDTA (0.027 mmol/L)
glucose (11 mmol/L)

50
Pellets (n = ~50) were gently spread onto the mucosa, then 50 ml of Krebs solution was
applied to rinse at flow rate of 20ml/min. The number of pellets adhering to the tissue after
rinsing were counted and compared to the total amount of the initial value in bioadhesion
retention % [61].
4.2.4.5. Scanning electron microscopy examinations
Scanning electron microscope (JEOL, JSM 6300 Scanning Microscope, Japan) was used to
study the surface and the shape of samples. For SEM evaluation the pellets were mounted on
a worksheet and coated with fine gold. Acceleration voltage of 20.0 kV was used with 100x
magnification.
4.2.4.6. Diffuse reflectance examinations
Diffuse reflectance measurement (R%) was carried out on solid samples applying an
UV/VIS/NIR spectrophotometer (Jasco V-670, Japan) equipped with integrating sphere
(diameter=60mm) and PbS detector between 1000-2000 nm in a 5 mm layered cell.
Reflectance was evaluated according to the Kubelka-Munk formula [62]:
)
-
(16)
where
R% intensity of diffusely reflected light
K absorption coefficient
S scattering coefficient

51
4.2.4.7. Swelling examinations
Swelling of pellets was determined using a calibrated stereomicroscope (Nikon SMZ 800 C-
PS, Japan). During the examination n = ~ 50 pellets were suspended in 5 ml of distilled and
degassed water. The increase in size of the pellets was monitored for 15 minutes and
evaluated compared to the initial size [65].
4.2.4.8. Further dosage form examinations (bulk and tapped density,
flowability, friability)
The bulk and tapped densities of the pellets were determined by standard methods. The tapped
density was performed applying 1250 taps using a tapped density tester (J. Engelsmann,
Ludwigshafen, Germany). The bulk and tapped density data were used to calculate the
H u r’ [66] and C rr’ [67] indices.
Flowability was examined using the apparatus described in the Ph. Eur. 7., 2.9.16. test, by
application of a dry funnel calculating the angle of repose of 100.0 g sample preparation.
Friability examinations were carried out according to the Ph. Eur. 7. as well, using the
apparatus in 2.9.7. test measuring 10.0 g of the sample. 100 rotations were made after the
pellet’s dust-control and then measured the loss of weight in % [68].
4.2.4.9. Stability test
Accelerated stability test of optimized product was carried out aiming the determination of the
following parameters:
k, degradation constant,
t½ half-life of the degradation and
tx expiration date.

52
Stability tests are based on the Arrhenius law:
-
, (17)
At first order decomposition in case of nystatin, degradation half-life (t1/2) can be calculated
by the following way [74]:
⁄
(18)
The Ea activation energy can be determined by taking into account degradation constants at
different test temperatures:
( -
) (19)
According to the Arrhenius equation results of long term stability tests can be predicted by
calculating the degradation constants at different temperatures (in my experiment it was 40,
50 and 60°C), then representing the log k-1/T function, by extrapolation the decay at 25°C can
be calculated [35,75].
In case of expiration date 5% decay of the API was allowed, applying the formula:
- (20)
Legends of the equations above:
k, k1, k2 degradation constants
A pre-exponential factor (frequency factor)
Ea activation energy

53
R universal gas constant
T, T1, T2 absolute temperature
t½ degradation half life
tx expiration date
m0 initial API content
x decayed API amount during tx time
Simex Binder BF 115 thermostate was used to keep the samples on three different
temperatures mentioned before at 75% relative humidity. Samples were taken monthly for 6
months. Total API content was determined by pulverizing the pellets and dissolving the API
in 50 ml of methanol containing 5% acetic acid accelerating the dissolution by KL-2 Bühler
shaking machine for 6 hours. After filtration nystatin content was determined (λ = 306 nm,
Jasco V-550 UV/VIS spectrophotometer, Japan).

54
5. Results
5.1. Optimization results for high-shear pelletization
Considering the average particle size (y1, R = 0.981), both process variables significantly
influenced the particle agglomeration process through the model of the next formula:
- -
(21)
The positive sign of the coefficients refers to an increasing effect while the negative sign
indicates a decreasing effect on the corresponding response.
Increasing the binder flow rate the reduction of the average particle size was observed, which
is probably due to the faster agglomeration, where more pellets were formed with smaller size
within a shorter period. The impeller speed had opposite effect on particle size depending on
its value. In the first stage (up to 750 rpm), the impeller helped the formation of larger
particles, above 750 rpm, smaller particles were built due to intensive agitation which may
hinder the further agglomeration of pellets (Fig. 17.).
Figure 17. Effect of impeller speed and binder flow on the average particle size
50055
060065
070075
080085
090095
0
Impeller speed (rpm)
1211.5
1110.5
109.5
98.5
Binde
r flo
w (ml/m
in)
500
500550
550600
600650
650700
700750
750
Part
icle
siz
e (
m
)
Part
icle
siz
e (
m)

55
Table VI. Measurements according to the experimental design
Trial Controlled factor
x1 x2 y1
Impeller
speed
(rpm)
Binder
flow
(ml/min)
Particle
diameter
(μm)
1 1000 12 583.8 ± 22.33
2 500 12 513.7 ± 26.67
3 1000 8 628.4 ± 33.42
4 500 8 669.8 ± 29.56
5 1000 10 596.4 ± 22.41
6 500 10 550.0 ± 15.67
7 750 12 628.4 ± 21.34
8 750 8 770.0 ± 39.12
9 750 10 632.7 ± 32.17
Table VII. Statistical evaluation of measurements
Response Model F-
value
Parameter Coefficients
b0 b1 b2 b11 b22 b12
Particle
diameter
15.20 Value 1519.846 1.572 − 266.979 − 0.0014 9.831 0.056
Std error 464.235 0.463 84.792 2.65E− 04 4.141 0.023
p > |t| 0.05 0.04 0.05 0.01 0.10
(NS)
0.10
(NS)

56
Diffuse reflectance spectra of pellet samples manufactured in the 9 experimental trials
demonstrated significant differences depending on the impeller speed and binder flow rate
(Fig. 18.). Pellet samples with large average particle diameter demonstrated an elevated
spectral shift through F(R) values, offering benefits for the in-process control, such as end-
point determination of the pelletization process by NIRS. A linear regression was established
between the particle size and transformed reflectance values according to the Kubelka–Munk
formula (R=0.9842) (Fig. 19.).
Figure 18. Diffuse reflectance spectra of samples according to Kubelka-Munk formula (see
Chapter 4.2.4.6.)

57
Figure 19. Correlation between the particle size of micropellets and diffuse reflectance
spectra after Kubelka-Munk transformation at 1528 nm representing 95 % confidence interval
5.2. Results of examinations of nystatin micropellets
Results of our second manufacture based on preliminary examinations according the central
composite experimental design (Table IV.) are described in Table VIII.
500 550 600 650 700 750 800
0.40
0.45
0.50
0.55
0.60
0.65
0.70
0.75F
(R%
)
Particle size (m)

Table VIII. Matrix of the central composite experimental design (τS – mean dissolution time based on spectrophotometric data, τM – mean
dissolution time based on microbiological assay, βS – W ibu ’ shape parameter based on spectrophotometric data, βM – W ibu ’ shape
parameter based on microbiological assay)
Examined factors Response parameters (Mean±S.D., n=3)
Tr. x1 x2 x3 Spectrophotometric data Microbiological assay
Average
particle
size (μm)
CPL
(%)
HEC
(%)
τS
(min) βS
τM
(min) βM
Swelling
(μm)
Bioadhesion
retention
(%)
1 700.0 4.27 0.73 119.5±10.8 0.3519±0.011 103.2±5.2 0.3462±0.0432 58.2±0.80 57.44±1.02
2 700.0 0.73 4.27 56.9±7.3 0.5362±0.012 49.0±2.1 0.5103±0.014 10.4±1.12 43.63±2.04
3 300.0 4.27 4.27 283.2±21.4 0.4023±0.042 278.0±13.6 0.3789±0.023 18.0±1.76 42.24±1.67
4 300.0 0.73 0.73 16.7±0.7 0.3134±0.010 11.3±1.1 0.2970±0.064 6.8±0.82 12.65±2.32
5 217.2 2.50 2.50 4.1±0.9 0.3898±0.047 3.6±0.4 0.3567±0.010 1.3±1.20 36.31±0.78
6 782.8 2.50 2.50 287.3±40.1 0.5131±0.028 227.3±2.4 0.5108±0.022 41.4±0.33 68.52±2.21
7 500.0 0.00 2.50 16.3±6.5 0.5044±0.035 11.9±1.2 0.4890±0.035 4.6±1.43 33.21±2.42
8 500.0 5.00 2.50 87.3±15.6 0.3918±0.057 71.8±8.6 0.3675±0.014 43.4±0.65 47.78±2.10
9 500.0 2.50 0.00 43.4±13.2 0.4251±0.030 42.4±10.9 0.4172±0.023 13.7±1.66 49.50±1.10
10 500.0 2.50 5.00 82.1±17.8 0.4978±0.038 51.8±7.4 0.4356±0.014 16.9±0.37 31.85±0.43
11 500.0 2.50 2.50 404.3±58.4 0.4112±0.013 316.8±21.4 0.3983±0.030 32.1±0.45 38.42±0.80
12 500.0 2.50 2.50 329.4±11.1 0.4212±0.027 320.7±24.2 0.4171±0.022 36.0±0.98 37.43±1.64
13 500.0 2.50 2.50 332.3±6.7 0.4154±0.057 249.1±31.1 0.4056±0.020 38.3±0.41 32.64±1.30
14 500.0 2.50 2.50 333.1±15.7 0.4190±0.021 313.4±18.6 0.3989±0.013 40.4±0.65 35.81±0.93
15 500.0 2.50 2.50 274.2±54.2 0.4287±0.049 269.5±13.3 0.3752±0.025 40.6±0.48 31.93±0.64
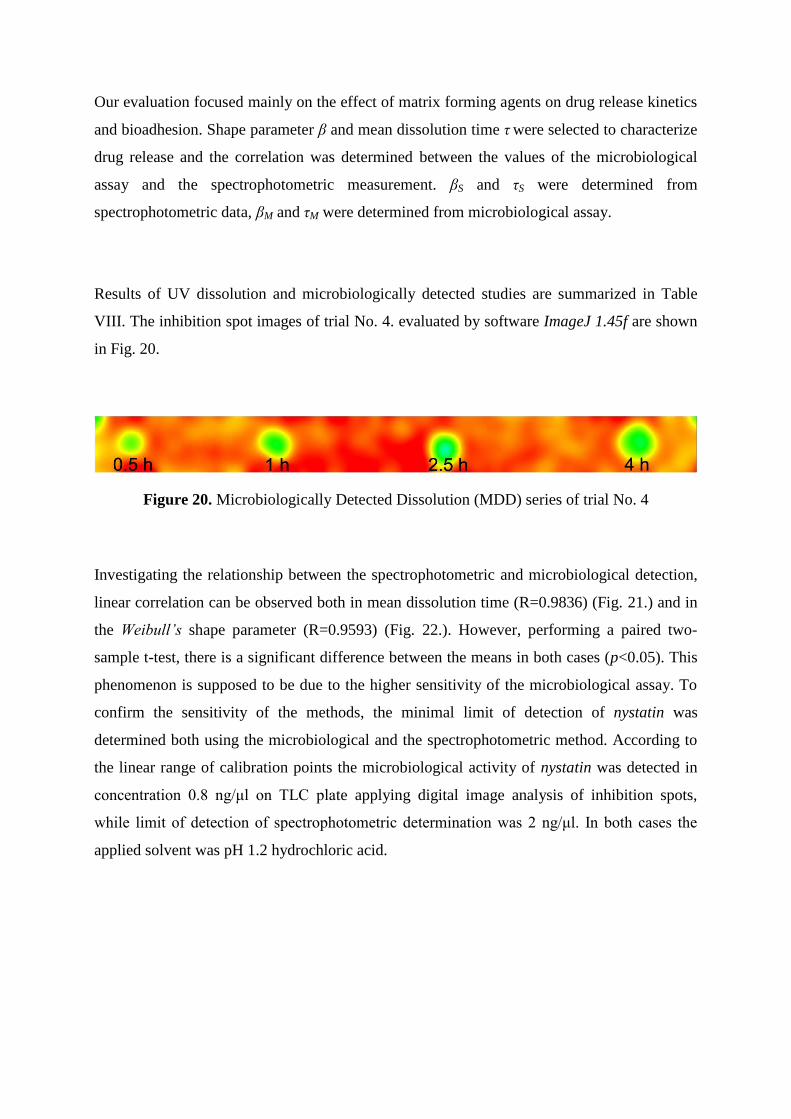
Our evaluation focused mainly on the effect of matrix forming agents on drug release kinetics
and bioadhesion. Shape parameter β and mean dissolution time τ were selected to characterize
drug release and the correlation was determined between the values of the microbiological
assay and the spectrophotometric measurement. βS and τS were determined from
spectrophotometric data, βM and τM were determined from microbiological assay.
Results of UV dissolution and microbiologically detected studies are summarized in Table
VIII. The inhibition spot images of trial No. 4. evaluated by software ImageJ 1.45f are shown
in Fig. 20.
Figure 20. Microbiologically Detected Dissolution (MDD) series of trial No. 4
Investigating the relationship between the spectrophotometric and microbiological detection,
linear correlation can be observed both in mean dissolution time (R=0.9836) (Fig. 21.) and in
the W ibu ’ shape parameter (R=0.9593) (Fig. 22.). However, performing a paired two-
sample t-test, there is a significant difference between the means in both cases (p<0.05). This
phenomenon is supposed to be due to the higher sensitivity of the microbiological assay. To
confirm the sensitivity of the methods, the minimal limit of detection of nystatin was
determined both using the microbiological and the spectrophotometric method. According to
the linear range of calibration points the microbiological activity of nystatin was detected in
concentration 0.8 ng/μl on TLC plate applying digital image analysis of inhibition spots,
while limit of detection of spectrophotometric determination was 2 ng/μl. In both cases the
applied solvent was pH 1.2 hydrochloric acid.

61
Figure 21. Correlation between the mean dissolution times calculated from the
spectrophotometric and microbiological data (representing 95% upper and lower confidence
intervals)
Figure 22. Correlation between the shape factors of the Weibull function calculated from
spectrophotometric and microbiological data (representing 95% upper and lower confidence
intervals)
0 100 200 300 400
0
50
100
150
200
250
300
350
400
M (
min
)
S (min)
0.30 0.35 0.40 0.45 0.50 0.55
0.30
0.35
0.40
0.45
0.50
0.55
M
S

62
Evaluating the dissolution curves, significant difference can be observed, since the presence
of CPL and HEC slowed drug release remarkably, which is undesirable in this preparation.
Fig. 23. presents the dissolution curves of trials 7, 9 and 12 as detected by both
microbiological and spectrophotometrical method. The complete absence of CPL or HEC
resulted in enhanced dissolution in trials no. 7 and 9.
Figure 23. Dissolution of trials 7, 9. and 12 detected by both by spectrophotometric and
microbiological method (S – spectrophotometric assay, M – microbiological assay)
Comparing and considering the measurements of the microbiological and spectrophotometric
detection, the more sensitive microbiological tests were evaluated in further investigations.
The equations of response surfaces represent the significant effects of factors x1 and x2 on the
τM time parameter (R=0.9908), the βM shape factor (R=0.8535), the bioadhesion retention time
(R=0.8262) and the swelling (R=0.8415).
Table IX. represents the multiple regression statistical evaluation for significance and
probabilities at 95% confidence interval of responses (NS = not significant).

63
Table IX. Statistical evaluation of the central composite factorial design
Response Model F-
value Parameter
Coefficients
b0 b1 b2 b3 b12 b13 b23 b12 b2
2 b32 b123
τM 21.32 Value 293.91 79.10 21.20 3.32 -49.79 -59.03 113.36 -89.24 -126.02 -123.41 -155.16
(p=0.0048) Std error 19.08 21.34 21.34 21.34 30.17 30.17 30.17 17.85 17.85 17.85 35.06
p>|t| - 0.0082 0.2619
(NS)
0.8480
(NS)
0.0961
(NS)
0.0620
(NS)
0.0078 0.0028 0.0008 0.0008 0.0044
β 9.84 Value 0.410 0.050 -0.032 0.034 - - - - - - -
(p=0.0019) Std error 9.16E-003 0.013 0.013 0.013 - - - - - - -
p>|t| - 0.0022 0.0279 0.0203 - - - - - - -
Swelling 8.89
(p=0.0028) Value 26.81 12.56 14.23 -4.01 - - - - - - -
Std error 2.74 3.76 3.76 3.76 - - - - - - -
p>|t| - 0.0065 0.0030 0.3087
(NS) - - - - - - -
Bioadhesion 7.89
(p=0.0044) Value 11.15 0.038 4.526 -0.649 - - - - - - -
Std error 2.11 2.88 2.88 2.88 - - - - - - -
p>|t| - 0.0022 0.0181 0.6983
(NS)
- - - - - - -

64
According to the modified cubic response surface the average size of the pellets, its quadratic
form, the quadratic form of CPL and HEC and the interaction between the CPL and the HEC
influence the effect of nystatin significantly. Smaller size of the pellets results better
dissolution due to the large specific surface. Pellets with average size from 500 to 1000 μm
containing CPL and HEC in app, in ratio 1:1, have the slowest drug release profile (Fig. 24.
and Fig. 25.). In this case the area of the maximum point is not recommended as aim during
production.
Figure 24. Effect of pellet size and CPL content on Mean Dissolution Time (2.5% HEC
content)
Figure 25. Effect of CPL and HEC content on Mean Dissolution Time (500 μm pellet size)

65
The Weibull function’s shape parameter β is influenced significantly by pellet size, CPL and
HEC content. The relationship is described with a linear model. The shape parameter
increases with the increase of pellet size. Simultaneous increase of HEC and decrease of CPL
results in a higher β value (Fig. 26. and Fig. 27.).
Figure 26. Effect of pellet size and CPL content on the W ibu ’ βM shape parameter (2.5%
HEC content)
Figure 27. Effect of pellet size and HEC content on the W ibu ’ βM shape parameter (2.5%
CPL content)
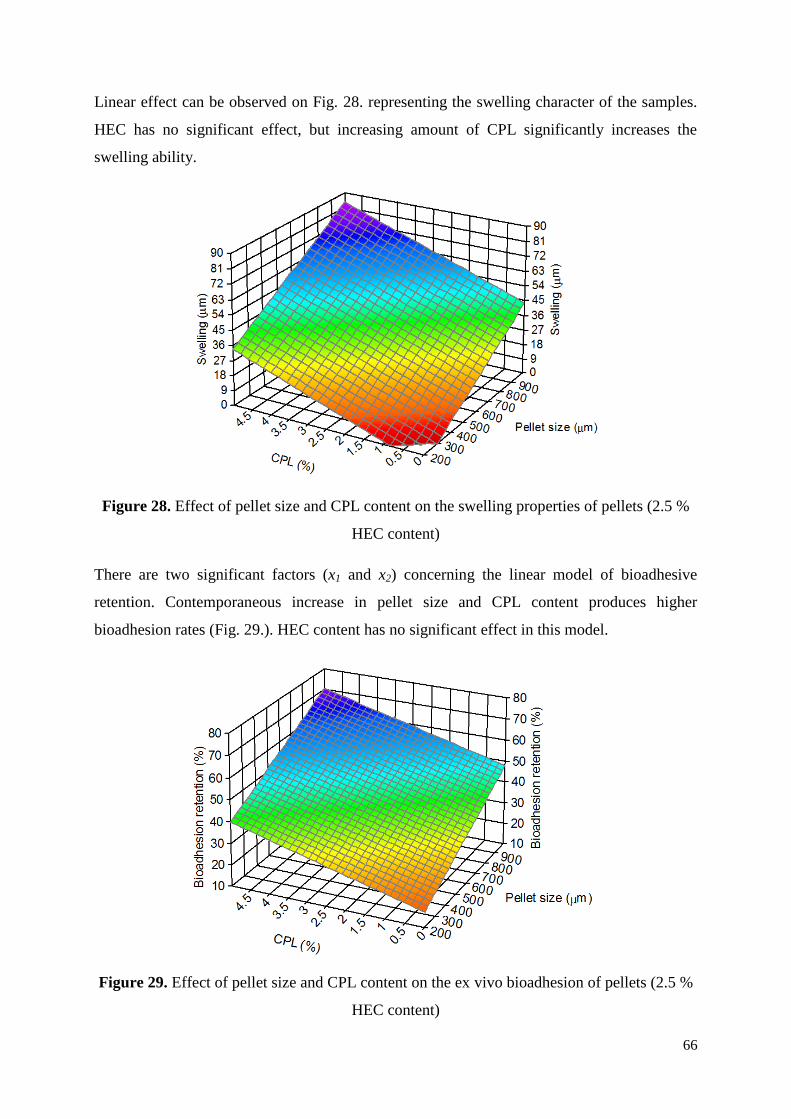
66
Linear effect can be observed on Fig. 28. representing the swelling character of the samples.
HEC has no significant effect, but increasing amount of CPL significantly increases the
swelling ability.
Figure 28. Effect of pellet size and CPL content on the swelling properties of pellets (2.5 %
HEC content)
There are two significant factors (x1 and x2) concerning the linear model of bioadhesive
retention. Contemporaneous increase in pellet size and CPL content produces higher
bioadhesion rates (Fig. 29.). HEC content has no significant effect in this model.
Figure 29. Effect of pellet size and CPL content on the ex vivo bioadhesion of pellets (2.5 %
HEC content)

67
Trials 7, 9 and 12 were selected from the samples to be investigated by scanning electron
microscopy with the same pellet size (500μm), but different ratios of CPL/HEC:
Trial No. 7, CPL 0%, 5% HEC
Trial No. 9, 5% CPL, 0% HEC
Trial No. 12, 2.5% CPL, 2.5% HEC
The manufacturing process parameters were the same in all trials, thus the character of the
surface of the pellets depends only on the CPL/HEC ratio. In trials No. 7, and 9 where either
carbomer or hydroxyethylcellulose was used as bioadhesive agent, the surfaces of pellets were
almost similarly porous. Samples from trial No. 12 containing CPL/HEC in ratio 1:1 were
fine and glossy. This smooth surface is due to the congealment of the applied bioadhesive
polymers which results slow release of the API (Fig. 30.).
Figure 30. SEM image of micropellets from trials No. 7., 9., 12.
The diffuse reflectance spectra of pellet samples from trials No. 7, 9 and 12 with the same
particle size of 500 μm were also analysed as a function of CPL and HEC content, which may
refer to the surface characteristics of the samples [70]. Significant difference can be observed
in trial No. 12, with elevated spectral shift caused by the glossy surface characteristics (Fig.
31.).

68
Figure 31. Diffuse reflectance spectra of pellet samples (Trials No. 7, 9 and 12) after
Kubelka-Munk transformation (see Chapter 4.2.4.6.)

69
6. Discussion
The aim of the dissertation was to develop an optimized drug delivery system in order to treat
gastrointestinal candidiasis. The fundamental point of an effective therapy may be a locally
acting antifungal agent incorporated in a multiparticulate dosage form. As the active
pharmaceutical ingredient, nystatin was chosen due to its advantageous properties of having
contact antimicrobial effect with negligible absorption. As the dosage form micropellets were
produced due to their good physical properties and large contact surface uniformly spreading
through the GI tract. For production method among several possibilities high-shear
pelletization was chosen, which is a reliable and quick method offering numerous facilities
via adjustment of process parameters affecting the properties of the end-product. Optimized
GIC therapy also requires long retention time on the surface of action which can be ensured
by application of bioadhesive excipients, such as CPL and HEC. Summarizing the facts and
observations, by production of nystatin based micropellets containing bioadhesive materials
optimized GIC therapy can be reached.
In order to achieve the aims, preliminary examinations were carried out on a high-shear
granulator to determine significant process parameters affecting the physical properties of
micropellets focusing on the particle size distribution. These examinations were made
according to a 3-level face-centred central composite experimental design examining the
effect of impeller speed and binder flow rate on micropellet parameters.
After evaluation of the experiments a second order polynomial model was set up, which
pointed to both factors as significant process parameters representing their effect as a saddle
shape function. This experiment represented, that by applying extremities of the impeller
speed (500 rpm and 1000 rpm) and liquid addition at speed of 10-12 ml/min together resulted
relatively small particle size (500-550 μm). End-point of pelletization was determined by the
measurement of the impeller torque. According to the experiments detection of NIR spectra
after appropriate transformation could also serve important information of the process, since
close (R=0.9842) correlation was observed between the particle size and the diffuse
reflectance of the samples.
Results of these preliminary examinations were applied in the preparation of nystatin
containing micropellets, adjusting process variables according to the previous experiences.

70
In the second production experimental design of full type with five centre points was set up.
Examined factors were the following:
average pellet size,
CPL content and
HEC content.
Investigated quality parameters of micropellets were:
particle size distribution,
flowability,
hardness,
surface characteristics,
swelling,
bioadhesion property and
dissolution of nystatin determined by spectrophotometer and microbiological assay.
Evaluating the results important observation was the applicability of microbiologically
detected dissolution based on direct bioautography, which had close correlation with the drug
release determined by sphetrophotometric method regarding both the mean dissolution time
(MDT) and the shape factor (β) of the Weibull distribution applied as a model for the
dissolution studies. Extremities of the micropellet size (~200 μm and ~800 μm), CPL and
HEC content (at both excipients 0 and 5%) short dissolution time could be achieved.
According to the model established low value of shape factor, which was also the aim of the
optimization, could be reached by reducing the pellet size and HEC content, but increasing
CPL content. In case of swelling, particle size and CPL content was significant. Increasing
CPL content and particle size swelling ratio also increased. Surface characteristics by SEM
clearly represented the matrix formation of CPL and HEC when applied in the same amount,
which was also confirmed by the diffuse reflectance spectra, since in this experiment it was
not the indicator of the particle size, but the surface roughness of micropellets.

71
6.1. Optimization of GIC therapy
Gathering all experimental data and determining the optimization aims (short dissolution time
and low β values with long retention time with appropriate swelling) software Design Expert
v.7.0 (Stat-Ease Inc., Minneapolis, USA) was used to calculate the recommended parameters
for the optimized GIC therapy by micropellet based drug delivery system.
Result of the optimization is production of nystatin containing micropellets with average size
of 550μm, containing about 4.25% CPL and 0.75% HEC. To confirm the optimization result,
a test sample was produced in triplicate.
Pellets production was carried out according to the previous experiences in a high-shear mixer
(Pro-C-epT 4M8 Granulator, Belgium, Zelzate) with a three-blade impeller and a chopper.
Powders were loaded into a 1000 ml bowl and premixed for 3 minutes. Ingredients and
excipients were 5% nystatin (Merck, Darmstadt, Germany), 45% α-lactose-monohydrate (DC,
BDI, Zwolle, Netherlands), 45% microcrystalline cellulose (Avicel PH 105, FMC,
Philadelphia, USA), 0.75% hydroxyethylcellulose (Hercules, Wilmington, USA) and 4.25%
carbomer (Carbopol 934P, Hercules, Wilmington, USA). Quality of all materials used in the
experiments was Ph. Eur. 7. The total dry mass was 100.0 g. 50 ml of purified water was used
as granulation liquid at speed of 10 ml/min. Production was carried out at 25°C with 5 min net
pelletization time applying 500 rpm impeller and 2000 rpm chopper speed.
Pelletization end-point (Fig. 32.) was determined according to the impeller torque in
pelletization phase IV (see Chapter 3.3.6.2.2).

72
Figure 32. Pelletization end-point in case of optimized production (end-point marked with red
arrow)
Examinations carried out were the following: average particle size, mean dissolution time,
Weibull shape factor, flowability, Carr index, Hausner factor and friability.
Before examinations pellets were kept in a closed container for 24 h. Examination of these
pellets were carried out in triplicate to test the optimization results (Table X.).
0 100 200 300 400
0
2
4
6
8
10
12
V
IV
III
II
Imp
elle
r to
rqu
e (
%)
Time (s)
I
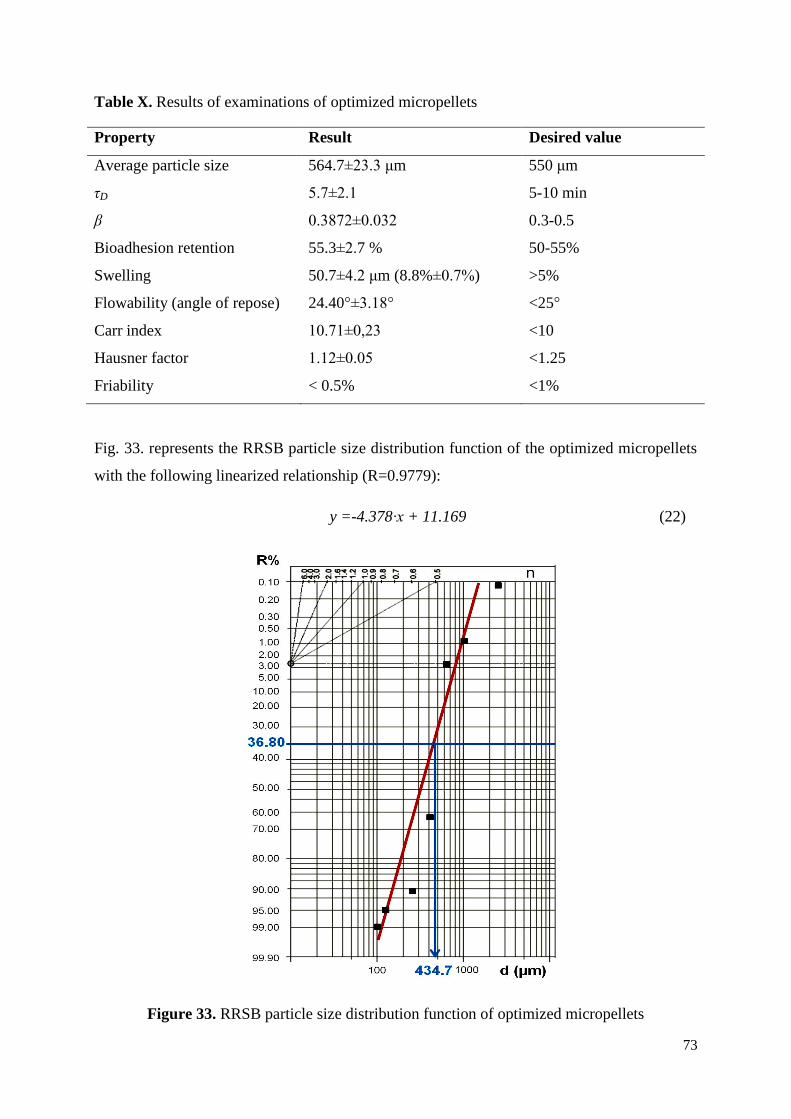
73
Table X. Results of examinations of optimized micropellets
Property Result Desired value
Average particle size 564.7±23.3 μm 550 μm
τD 5.7±2.1 5-10 min
β 0.3872±0.032 0.3-0.5
Bioadhesion retention 55.3±2.7 % 50-55%
Swelling 50.7±4.2 μm (8.8%±0.7%) >5%
Flowability (angle of repose) 24.40°±3.18° <25°
Carr index 10.71±0,23 <10
Hausner factor 1.12±0.05 <1.25
Friability < 0.5% <1%
Fig. 33. represents the RRSB particle size distribution function of the optimized micropellets
with the following linearized relationship (R=0.9779):
y =-4.378 + 11.169 (22)
Figure 33. RRSB particle size distribution function of optimized micropellets

74
The particle size distribution of the optimized micropellets is monodiperse. According to the
RRSB diagram the characteristic particle size parameter (d) at 36.8% is 434.7±15.3 μm and
the uniformity factor: n = 4.378.
The dissolution curve of these samples is in Fig. 34. Results from stability tests are presented
in Table XI. and Fig. 35.
Figure 34. Dissolution curve of the optimized micropellets
Table XI. Results of stability tests
Temperature (°C) Nystatin degradation
t½ (months) k (month-1
)
25 320.2 0.0022
40 76.4 0.0091
50 34.1 0.0203
60 2.3 0.3013
0 1 2 3 4 5 6 7
0
10
20
30
40
50
60
70
Dru
g d
isso
lve
d (
%)
Time (h)
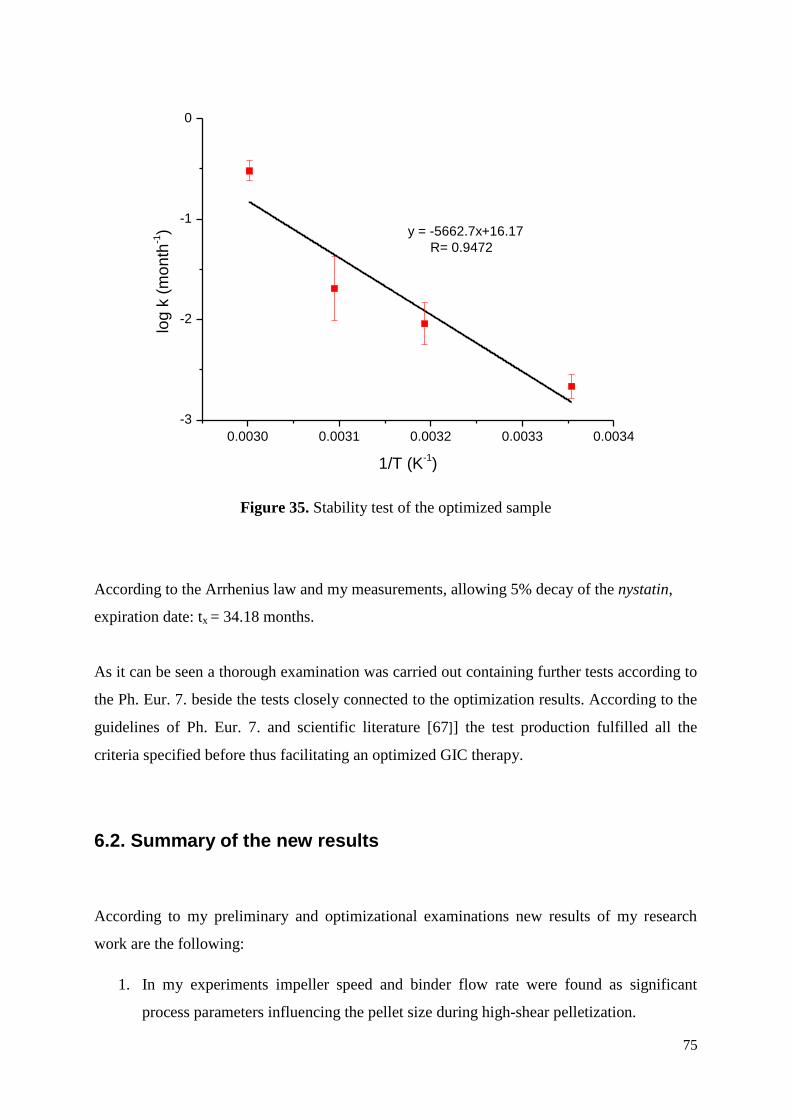
75
Figure 35. Stability test of the optimized sample
According to the Arrhenius law and my measurements, allowing 5% decay of the nystatin,
expiration date: tx = 34.18 months.
As it can be seen a thorough examination was carried out containing further tests according to
the Ph. Eur. 7. beside the tests closely connected to the optimization results. According to the
guidelines of Ph. Eur. 7. and scientific literature [67]] the test production fulfilled all the
criteria specified before thus facilitating an optimized GIC therapy.
6.2. Summary of the new results
According to my preliminary and optimizational examinations new results of my research
work are the following:
1. In my experiments impeller speed and binder flow rate were found as significant
process parameters influencing the pellet size during high-shear pelletization.
0.0030 0.0031 0.0032 0.0033 0.0034
-3
-2
-1
0
log
k (
mo
nth
-1)
1/T (K-1)
y = -5662.7x+16.17
R= 0.9472

76
2. It can be declared, that impeller torque and diffuse reflectance measurement can both
be used in in-process control of high-shear pelletization including the determination of
the end-point of the manufacturing process.
3. Measurement of diffuse reflectance was found to be an indicator of the surface
characteristics of micropellets which was confirmed by SEM examinations.
4. According to the results application of Microbiologicaly Detected Dissolution (MDD)
studies based on direct bioautography were able to modelize the antifungal effect of
the nystatin.
5. Close correlation was found between spectrophotometric investigations and MDD
studies.
6. Experiments verified that by incorporating bioadhesive materials, such as CPL and
HEC in the pellet matrix, the residence time significantly increases on the surface of
the mucous membranes.
7. According to the optimizational results of my research work optimal ratio of
CPL:HEC was determined to be 17:3 to reach 50-55% bioadhesion retention and
relatively quick dissolution (MDT=5-10min).
8. Optimal size of pellets in my experiments aiming GIC therapy is found to be 550μm.
9. Summarizing my results recommendation for the ingredients and their proportions in
an optimized GIC therapy by production of micropellets with 550μm average particle
size may be:
nystatin (5%)
microcrystalline cellulose (45%)
α-lactose-monohydrate (45%)
carbomer (4.25%)
hydroxyethylcellulose (0.75%)
10. Optimal process parameter recommendations in laboratory scale are:
1000 ml glass pelletizing bowl
Initial temperature: 25°C
100.0 g net weight of powders before liquid addition
3 min premixing time
5 min net pelletizing time
1 min mixing after binder addition
24 h drying of samples before examinations

77
500 rpm impeller speed
2000 rpm chopper speed
10ml/min binder flow rate (purified water)
50 ml total amount of binder liquid
78
7. Conclusion
During first experimental part the high-shear pelletization, the impeller speed and binder flow
rate were observed as critical manufacturing parameters influencing the average particle size.
Considering the formation of agglomerates, while the binder flow rate had a positive
quadratic effect on the average particle size, the action of impeller was more complex
depending on its rotation speed. The examined NIR diffuse reflectance spectra of pellet
samples offer a fast instrumental method for in-process control and they can be due to the
changed scattering which depended on the particle size of pellets. This experiment served as a
base to adjust high-shear process variables according to therapeutical aims of my second
experiment, focused on the gastrointestinal candidiasis therapy which is in accordance with
the scientific literature.
The second part of my experimental work focused on the optimization of the nystatin based
pharmaceutical therapy in GIC. Considering the parameters to be optimized, enhanced drug
release and long contact time are the most important in terms of successful medication. The
application of carbomer, a commonly used mucoadhesive excipient and
hydroxyethylcellulose, a high stability and compatibility mucoadhesive agent in the optimized
proportion in combination with optimized pellet size may be the key to a successful GIC
therapy. According to the response surfaces obtained from the experimental design, the
average pellet size of 550 μm, 85% carbopol: 15% hydroxyethylcellulose ratio (4.25% CPL
and 0.75% HEC content) are approaching the optimal therapeutic effect, which result in
approximately 50–55% bioadhesion retention, τ = 5–10 min drug release, β value of 0.32–
0.37 and swelling index above 5%.
These estimations were confirmed in our test production where further investigations of the
dosage form were carried out in order to prepare the applicant sample as a possibility for a
more successful therapy in GIC.

79
List of Figures
Figure 1. Basic types of pellets ............................................................................................... 17
Figure 2. Stages of wetting and tensile strength during granulation ....................................... 18
Figure 3. Mechanism of pelletizing with solvent .................................................................... 24
Figure 4. Mechanism of pelletizing with binding agent .......................................................... 25
Figure 5. Mechanism of pelletizing with sintering .................................................................. 25
Figure 6. Rotary disk pelletizing equipment ........................................................................... 26
Figure 7. Extruder during operation ........................................................................................ 26
Figure 8. Operation of roto-fluid machine .............................................................................. 27
Figure 9. Lab-scale high share granulator ............................................................................... 30
Figure 10. Structural formula of clotrimazole ......................................................................... 34
Figure 11. Structural formula of itraconazole ......................................................................... 35
Figure 12. Structural formula of fluconazole .......................................................................... 35
Figure 13. Structural formula of capsofungin ......................................................................... 36
Figure 14. Structural formula of amphotericin B .................................................................... 37
Figure 15. Structure of nystatin ............................................................................................... 39
Figure 16. Inhibition spots on a sample TLC plate ................................................................. 49
Figure 17. Effect of impeller speed and binder flow on the average particle size .................. 54
Figure 18. Diffuse reflectance spectra of samples according to Kubelka-Munk formula ....... 56
Figure 19. Correlation between the particle size of micropellets and diffuse reflectance
spectra after Kubelka-Munk transformation at 1528 nm .......................................................... 57
Figure 20. Microbiologically Detected Dissolution (MDD) series of trial No. 4 ................... 60
Figure 21. Correlation between the mean dissolution times calculated from the
spectrophotometric and microbiological data .......................................................................... 61
Figure 22. Correlation between the shape factors of the Weibull function calculated from
spectrophotometric and microbiological data .......................................................................... 61
Figure 23. Dissolution of trials 7, 9. and 12 detected by both by spectrophotometric and
microbiological method ............................................................................................................ 62
Figure 24. Effect of pellet size and CPL content on Mean Dissolution Time (2.5% HEC
content) ..................................................................................................................................... 64
Figure 25. Effect of CPL and HEC content on Mean Dissolution Time (500 μm pellet size) 64

80
Figure 26. Effect of pellet size and CPL content on the W ibu ’ βM shape parameter (2.5%
HEC content) ............................................................................................................................ 65
Figure 27. Effect of pellet size and HEC content on the W ibu ’ βM shape parameter (2.5%
CPL content) ............................................................................................................................ 65
Figure 28. Effect of pellet size and CPL content on the swelling properties of pellets (2.5 %
HEC content) ............................................................................................................................ 66
Figure 29. Effect of pellet size and CPL content on the ex vivo bioadhesion of pellets (2.5 %
HEC content) ............................................................................................................................ 66
Figure 30. SEM image of micropellets from trials No. 7., 9., 12. ........................................... 67
Figure 31. Diffuse reflectance spectra of pellet samples (Trials No. 7, 9 and 12) after
Kubelka-Munk transformation .................................................................................................. 68
Figure 32. Pelletization end-point in case of optimized production ........................................ 72
Figure 33. RRSB particle size distribution function of optimized micropellets ..................... 73
Figure 34. Dissolution curve of the optimized micropellets ................................................... 74
Figure 35. Stability test of the optimized sample .................................................................... 75

81
List of Tables
Table I. BCS classification of antifungal agents used in candidiasis ...................................... 34
Table II. Independent process variables: factors and their coded levels ................................. 44
Table III. 2-factor, 3-level face centred central composite experimental design matrix for the
pelletization .............................................................................................................................. 44
Table IV. Central composite factorial design with two level factorial design points (-1,1),
axial points (-1.414, 1.414) and a centre point (0) ................................................................... 46
Table V. Process parameters of trials ...................................................................................... 46
Table VI. Measurements according to the experimental design ............................................. 55
Table VII. Statistical evaluation of measurements ................................................................. 55
Table VIII. Matrix of the central composite experimental design .......................................... 59
Table IX. Statistical evaluation of the central composite factorial design .............................. 63
Table X. Results of examinations of optimized micropellets .................................................. 73
Table XI. Results of stability tests ........................................................................................... 74

82
References
[1] P. Costa, J. Manuel, S. Lobo: Modelling and comparison of dissolution profiles.
Eur. J. Pharm. Sci. 13: 123–133.2001.
[2] F.O. Costa, J.J.S. Sousa, A.A.C.C. Pais, S.J. Formosinho: Comparison of
dissolution profiles of Ibuprofen pellets. J. Control. Release 89: 199–212.2003.
[3] M. Siewert J. Dressman, C. Brown, V. Shah: FIP/AAPS guidelines for
dissolution/in vitro release testing of novel/special dosage forms. Dissolution
Technologies 6–15.2003.
[4] G. L. Amidon, H. Lennernas, V. P. Shah, J. R. Crison: A theoretical basis for a
biopharmaceutic drug classification: the correlation of in vitro drug product
dissolution and in vivo bioavailability. Pharmaceut. Res. 12: 413–420.1995.
[5] A. Dévay, I. Antal: A gyógyszeres terápia biofarmáciai alapjai. Medicina
Könyvkiadó, Budapest, 2009.
[6] R. C. Schellekens, F. E. Stuurman, F. H. van der Weert, J. G. Kosterink, H. W.
Frijlink: A novel dissolution method relevant to intestinal release behaviour and
its application in the evaluation of modified release mesalazine products. Eur.
J.Pharm. Sci. 30: 15–20.2007.
[7] J. J. Sousa, A. Sousa, F. Podczeck, J. M. Newton: Influence of process conditions
on drug release from pellets. Int. J. Pharm. 144: 159–169.1996.
[8] R. E 2nd
Cater: Chronic intestinal candidiasis as a possible etiological factor in the
chronic fatigue syndrome. Med. Hypotheses 44:507–515.1995.
[9] A. Järvinen, S. Nykänen, L. Paasiniemi, T. Hirjärvi-Lahti, J. Mattila: Enteric
coating reduces upper gastrointestinal adverse reactions to doxycycline. Clin.
Drug Investig. 10: 323–7.1995.

83
[10] P. Macheras, A. Dokoumetzidis: On the heterogeneity of drug dissolution and
release. Pharm. Res. 17: 108–12.2000.
[11] R. Chopra, G. Alderborn, F. Podczeck, J. M. Newton: The influence of pellet
shape and surface properties on the drug release from uncoated and coated pellets. Int.
J. Pharm. 239: 171–8.2002.
[12] R. Chatlapalli, B. D. Rohera: Physical characterization of HPMC and HEC and
investigation of their use as pelletization aids. Int. J. Pharm. 161: 179–93.1998.
[13] I. Ghebre-Sellassie: Pharmaceutical Pelletization Technology: Drugs and
pharmaceutical sciences. Marcel Dekker, New York, 1–13.1989.
[14] A. Faure, P. York, R. C. Rowe: Process control and scale-up of pharmaceutical
wet granulation processes: a review. Eur. J. Pharm. Biopharm. 52: 269–77.2001.
[15] A. C. Jorgensen, P. Luukkonen, J. Rantanen, R. Schaefer, A. M. Juppo, J.
Vliruusi: Comparison of torque measurements and near-infrared spectroscopy in
characterization of a wet granulation process. J. Pharm. Sci. 93: 2232–43.2004.
[16] H. A. Rashid, J. Heinamaki, O. Antikainen, J. Yliruusi: Influence of the
centrifugal granulating process on the properties of layered pellets, Eur. J. Pharm.
Biopharm. 51: 227–234.2001.
[17] P. G. Paterakis, E. S. Korakianiti, P. P. Dallas, D. M. Rekkas: Evaluation and
simultaneous optimization of some pellets characteristics using a 33 factorial design
and the desirability function, Int. J. Pharm. 248: 51–60.2002.
[18] J.B. Schwartz, R. E. O'Connor: Optimization techniques in pharmaceutical
formulation and processing. Editors: Banker GS, Rhodes CT. Modern Pharmaceutics.
3rd ed. Marcel Dekker, New York, 727–52.1997.
[19] D. Voinovich, M. Moneghini, B. Perissutti, E. Franceschinis: Melt pelletization
in high shear mixer using a hydrophobic melt binder: influence of some apparatus and
process variables. Eur. J. Pharm. Biopharm. 52: 305–13.2001.

84
[20] F. Zhou, C. Vervaet, J. P. Remon: Influence of processing ont he
characteristics of matrix pellets based on microcrystalline waxes and starch
derivatives, Int. J. Pharm. 147: 23–30.1997.
[21] A. Dévay: The Theory and Practice of Pharmaceutical Technology. University
of Pécs, Pécs, 2013.
[22] P. Holm: Theory of granulation. Editor: Parikh D.M., Handbook of
Pharmaceutical Granulation Technology, Marcel Dekker, New York, 7–23.1997.
[23] H. Rumpf: The strength of granules and agglomerates, In: Agglomeration, ed.
K. W.A., Interscience, New York, 379–418.1962.
[24] D. M. Newitt, J.M. Conway-Jones: A contribution to the theory and practice of
granulation, Trans. Instn. Chem. Engrs. 36: 422–442.1958.
[25] N. Ouchiyama, T. Tanaka: The propability of coalescence in granulation
kinetics, Ind. Eng. Chem. Process Des. Dev. 14.3: 286–289.1975.
[26] H. G. Kristensen, P. Holm, T. Schæfer: Mechanical properties of moist
agglomerates in relation to granulation mechanisms. Part I: Deformability of moist,
densified agglomerates, Powder. Technol. 44: 227–237.1985.
[27] H. G. Kristensen, P. Holm, T. Schæfer: Mechanical properties of moist
agglomerates in relation to granulation mechanisms. Part II: Effects of particle size
distribution, Powder. Technol. 44: 239–247.1985.
[28] B. J. Ennis, J. Li, G. Tardos, R. Pfeffer: The influence of viscosity on the
strength of an axially strained pendular liquid bridge, Chem. Eng. Sci. 45.10: 3071–
3088.1990.
[29] B. J. Ennis, G. Tardos, R. Pfeffer: A microlevel-based characterization of
granulation phenomena, Powder. Technol. 65: 257–272.1991.
[30] C. Vervaet, L. Baert, J. P. Remon: Extrusion-spheronisation. A literature
review, Int. J. Pharm. 116: 131–146.1995.

85
[31] L. Briens, D. Daniher, A. Tallevi: Monitoring high-shear granulation using
sound and vibration measurements, Int. J. Pharm. 331: 54–60.2006.
[32] D. Vojnovic, M. Moneghini, F. Rubessa: Optimalization of granulates in a high
shear mixer by mixture design, Drug Dev. Ind. Pharm. 20.6: 1035–1047.1994.
[33] P. Holm: Effect of impeller and chopper design on granulating in a high speed
mixer, Drug Dev. Ind. Pharm. 13.9-11: 1675–1701.1987.
[34] J. Kristensen, T. Schaefer, P. Kleinebudde: Direct pelletization in a rotary
processor controlled by torque measurements. II: effects of changes in the content of
microcrystalline cellulose. AAPS Pharmsci 2 .3: 24.2000.
[35] Encyclopedia of Pharmaceutical Technology, 3rd Edition, Editor: J. Swarbrick:
Informa Healthcare USA Inc., New York, 2007.
[36] Handbook of Pharmaceutical Excipients, 5th Edition, Editor: R. C. Rowe, P. J.
Sheskey, S. C. Owen: Pharmaceutical Press, London, 2006.
[37] S. R. Ghanta, R. Srinivas, C. T. Rhodes: Use of mixer torque measurements as
an aid to optimizing wet granulation process. Drug Dev. Ind. Pharm. 10: 305–
311.1984.
[38] R. C. Rowe: Mixer torque rheometry - further advances, Pharm. Tech. Eur. 8.8:
38–48.1996.
[39] S. Watano: Direct control of wet granulation processes by image processing
system, Powder Technol. 117: 163–172.2001.
[40] J. Rantanen, S. Lehtola, P. Rämet, J. P. Mannermaa, J. Yliruusi: On-line
monitoring of moisture content in an instrumented fluidized bed granulator with a
multi-channel NIR moisture sensor, Powder Technol. 99: 163–170.2000.

86
[41] S. Ganguly, J. Z. Gao: Application of on-line Focused Beam Reflectance
Measurement Technology in high shear wet granulation, The AAPS Journal 7(S2):
Abstract No. T3216.2005.
[42] M. Whitaker, G. R. Baker, J. Westrup, P. A. Goulding, D. R. Rudd, R. M.
Belchamber, M. P. Collins: Application of acoustic emission to the monitoring and
end point determination of a high shear granulation process, Int. J. Pharm. 204: 79–
91.2000.
[43] M. Knoke: Clinical pictures of orointestinal candidiasis. Fiction or reality?
Mycoses 39 Suppl. 1: 40–43.1996.
[44] Martindale – The Complete Drug Reference, Editor: S. C. Sweetman:
Pharmaceutical Press 36th Edition, London, 2009.
[45] J. D. Cleary, P. D. Rogers, S. W. Chapman: Variability in polyene content and
cellular toxicity among deoxycholate amphotericin B formulations. Pharmacotherapy
23:572–578.2003.
[46] M. K. Kathiravan, A. B. Salake, A. S. Chothe, P. B. Dudhe, R. P. Watode, M.
S. Mukta, S. Gadhwe: The biology and chemistry of antifungal agents: a review.
Bioorgan. Med. Chem. 20: 5678–5698.2012.
[47] L. L. Patton, A. J. Bonito, D. A. Shugars: A systematic review of the
effectiveness of antifungal drugs for the prevention and treatment of oropharyngeal
candidiasis in HIV-positive patients. Oral Surg. Oral Med. Oral Pathol. Oral Radio.
Endodont. 92: 170–179.2001.
[48] V. Grabovac, D. Guggi, A. Bernkop-Schnurch: Comparison of the
mucoadhesive properties of various polymers. Adv. Drug Deliv. Rev. 57: 1713–
1723.2005.
[49] J. M. Llabot, R. H. Manzo, D. A. Allemandi: Drug release from
carbomer:carbomer sodium salt matrices with potential use as mucoadhesive drug
delivery system. Int. J. Pharm. 276: 59–66.2004.

87
[50] J. S. Trier, D. J. Bjorkman: Esophageal, gastric, and intestinal candidiasis. Am.
J. Med. 77: 39–43.1984.
[51] C. Maderuelo, A. Zarzuelo, J. M. Lanao: Critical factors in the release of drugs
from sustained release hydrophilic matrices. J. Control. Release: Off. J. Control.
Release Soc. 154: 2–19.2011.
[52] V. Ramana, S. Uppoor: Regulatory perspectives on in vitro (dissolution)/in
vivo (bioavailability) correlations. J. Control. Release 72: 127–32.2001.
[53] R. F. Cosgrove, A. E. Beezer, R. J. Miles: A comparative study of the
microbiological assays currently available for nystatin raw material. J. Pharm.
Pharmacol. 31: 171–173.1979.
[54] O. V. Travkin, G. I. Lashkov, E. V. Komarov: Physiochemical characteristics
of 3 states of the nystatin molecule. Antibiotiki 26: 519–522.1981.
[55] T. Higuchi, E. Brochmann-Hanssen, J. I. Bodin: Pharmaceutical Analysis.
Interscience Publishers, New York, 1961.
[56] L. Botz, B. Kocsis, S. Nagy: Bioautography; in “Encyclopedia of Analytical
Science, Ten-Volume Set”; Editor: P. Worsfold, A. Townshend, C. Poole. Elsevier
Academic Press. 1: 271-277.2005.
[57] A. Dévay, B. Kocsis, Sz. Pál, A. Bodor, K. Mayer, S. Nagy: New method for
microbiological detection of delivery process from dosage forms containing
antibiotics. Eur. J. Pharm. Sci. 25: S81–S83.2005.
[58] R. Thies, P. Kleinebudde: Melt pelletization of a hygroscopic drug in a high
shear mixer, Part I. Influence of process variables. Int. J. Pharm. 188: 131–43.1994.
[59] A. Dévay, K. Mayer, Sz. Pál, I. Antal: Investigation on drug dissolution and
particle characteristics of pellets related to manufacturing process variables of high-
shear granulation. J. Biochem. Biophys. Meth. 69: 197–205.2006.
88
[60] F. Langenbucher: Parametric representation of dissolution–rate curves by the
RRSBW distribution. Pharm. Ind. 38: 472–7.1976.
[61] Z. Liu, W. Lu, L. Qian, X. Zhang, P. Zeng, J. Pan: In vitro and in vivo studies
on mucoadhesive microspheres of amoxicillin. J. Control. Release: Off. J. Control.
Release Soc. 102: 135–144.2005.
[62] I. Antal, R. Zelkó, N. Rőczey, J. Plachy, I. Rácz: Dissolution and diffuse
reflectance characteristics of coated theophylline particles. Int. J. Pharm. 155: 83–
9.1997.
[63] G. Reich: Near-infrared spectroscopy and imaging: basic principles and
pharmaceutical applications. Adv. Drug Deliv. Rev. 57: 1109–43.2005.
[64] K. M. Morisseau, C. T. Rhodes: Pharmaceutical uses of near-infrared
spectroscopy. Drug Dev. Ind. Pharm. 21: 1071–90.1995.
[65] P. Kleinebudde: Shrinking and swelling properties of pellets containing
microcrystalline cellulose and low substituted hydroxpropylcellulose: I. Shrinking
properties. Int. J. Pharm. 109: 209–219.1994.
[66] H. H. Hausner: Friction conditions in a mass of metal powder. Int. J. Powder.
Metall. 3: 7–13.1967.
[67] R. L. Carr: Particle behaviour storage and flow. Br. Chem. Eng. 15: 1541–
1549.1970.
[68] European Pharmacopoeia 7th Ed., Council of Europe, Strasbourg, 2013.
[69] Z. Muskó, J. Bajdik, K. Pintye-Hódi, P. Szabó-Révész, A. Kelemen, I. Erős:
Preparation of pellets containing theophylline. Pharm. Ind. 64: 1194–8.2002.

89
[70] D. Murias, C. Reyes-Betanzo, M. Moreno, A. Torres, A. Itzmoyotl, R.
Ambrosio, M. Soriano, J. Lucas, P.R.I. Cabarrocas: Black silicon formation using dry
etching for solar cells applications. Mater. Sci. Eng. B – Adv. 177: 1509–1513.2012.
[71] P. Kleinebudde: The crystallite-gel-model for microcrystalline cellulose in wet-
granulation, extrusion, and spheronization. Pharm. Res. 14.6: 804-809.1997.
[72] P. Holm, T. Schaefer, H. G. Kristensen: Granulation in high-speed mixers. Part
VI. Effects of process conditions on power consumption and granule growth. Powder
Technol. 43: 225–233.1985.
[73] T. Allen: Powder Sampling and Particle Size Determination. Elsevier,
Amsterdam, 2003.
[74] J. M. T. Hamilton: The effect of pH and of temperature ont he stability and
bioactivity of nystatin and amphotericin B. J. Pharm. Pharmac. 25: 401-407.1973
[75] A. Dévay, P. Kovács, I. Rácz: Optimization of chemical stability of diazepam
in the liquid phase by means of factorial design. Int. J. Pharm., 6.3:5–9.1985.
[76] A. Dévay: Olvadék-diszeperziósls koacervációs eljárás gyógyszerek
formulálása során. Doctoral candidate dissertation, Budapest, 1987.
[77] www.gea.com

Acknowledgements
I would like to thank to my PhD advisor
Dr. Attila Dévay
for his support and continuous help encouraging me during hard times of my research work,
introducing me to the wonderful world of pharmaceutical technology and biopharmacy.
I would like to thank to my family and all my co-authors for their support in my work.
I thank all members of Institute of Pharmaceutical Technology and Biopharmacy for their
help.