DOCKETED - Californiadocketpublic.energy.ca.gov/PublicDocuments/17-BSTD-01/TN220876... ·...
54
DOCKETED Docket Number: 17 - BSTD - 01 Project Title: 2019 Building Energy Efficiency Standards PreRulemaking TN #: 220876 Document Title: Presentation - Proposed 2019 Building Energy Efficiency Standards ZNE Strategy Description: August 22, 2017 presentation of the Proposed 2019 Building Energy Efficiency Standards ZNE Strategy by Energy Commission staff. Filer: Adrian Ownby Organization: California Energy Commission Submitter Role: Commission Staff Submission Date: 8/24/2017 10:54:44 AM Docketed Date: 8/24/2017
Transcript of DOCKETED - Californiadocketpublic.energy.ca.gov/PublicDocuments/17-BSTD-01/TN220876... ·...

DOCKETED
Docket Number:
17-BSTD-01
Project Title: 2019 Building Energy Efficiency Standards PreRulemaking
TN #: 220876
Document Title:
Presentation - Proposed 2019 Building Energy Efficiency Standards ZNE Strategy
Description: August 22, 2017 presentation of the Proposed 2019 Building Energy Efficiency Standards ZNE Strategy by Energy Commission staff.
Filer: Adrian Ownby
Organization: California Energy Commission
Submitter Role:
Commission Staff
Submission Date:
8/24/2017 10:54:44 AM
Docketed Date:
8/24/2017
Building Energy Efficiency Standards
Proposed 2019 Building Energy Efficiency Standards ZNE Strategy Building Standards Office: Mazi Shirakh, PE ZNE Lead and Advisor for Building Energy Efficiency Standards (BEES) Christopher Meyer Manager, Building Standards Office Bill Pennington Senior Technical and Program Advisor to the Energy Efficiency Division Payam Bozogchami, PE Project Manager, BEES Danny Tam Mechanical Engineer
Countdown to 2020
August 22, 2017
August 2017 Total Eclipse

August 2017 Total Eclipse

2019 ZNE Strategy
Content 1. Proposed ZNE Strategy – What is it and how we arrived there; explaining EDR
2. Cost Effectiveness for Prescriptive PV Requirements and NEM rules
3. Strategies for Reach Codes
4. CBECC-Res Software Tools for ZNE
4
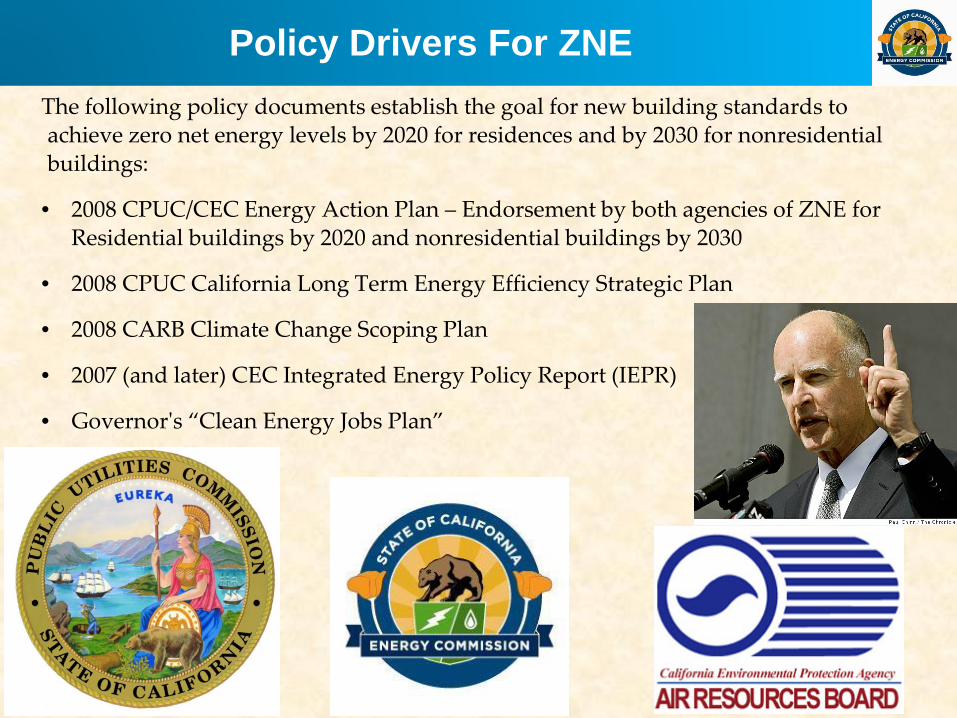
Policy Drivers For ZNE The following policy documents establish the goal for new building standards to achieve zero net energy levels by 2020 for residences and by 2030 for nonresidential buildings:
• 2008 CPUC/CEC Energy Action Plan – Endorsement by both agencies of ZNE for Residential buildings by 2020 and nonresidential buildings by 2030
• 2008 CPUC California Long Term Energy Efficiency Strategic Plan
• 2008 CARB Climate Change Scoping Plan
• 2007 (and later) CEC Integrated Energy Policy Report (IEPR)
• Governor's “Clean Energy Jobs Plan”
5

ZNE Strategy: the 2015 IPER Vision A decade ago when the ZNE goal was first set it was a simple idea: All newly constructed residential buildings by the year 2020 must be ZNE as defined by the IEPR:
“…the value of the net amount of energy produced by on-site renewable energy resources is equal to the value of the energy consumed annually by the building, at the level of a single “project” …. using the California Energy Commission’s Time Dependent Valuation metric.”
Improving building energy efficiency and deploying PVs were identified as the primary tools to achieve the ZNE goals
6
7
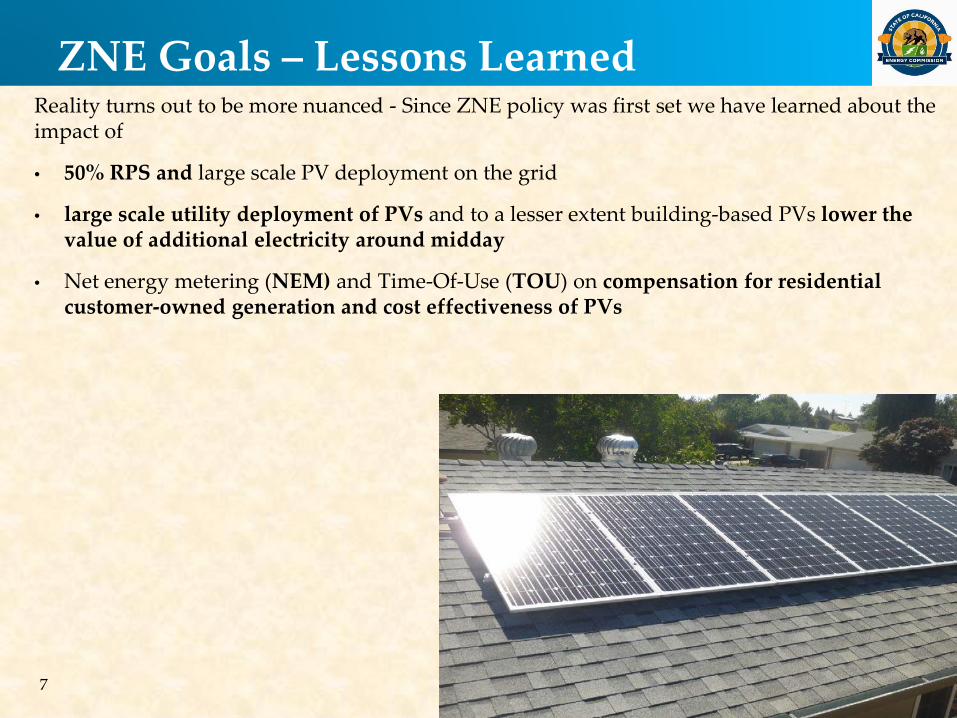
ZNE Goals – Lessons Learned Reality turns out to be more nuanced - Since ZNE policy was first set we have learned about the impact of
• 50% RPS and large scale PV deployment on the grid
• large scale utility deployment of PVs and to a lesser extent building-based PVs lower the value of additional electricity around midday
• Net energy metering (NEM) and Time-Of-Use (TOU) on compensation for residential customer-owned generation and cost effectiveness of PVs

8
ZNE Goals – Lessons Learned - Continued • The current NEM rules treat the grid as “virtual storage” (or a bank), where the overgenerated
kWhs can be “stored” and used later in the day, or another season
• In reality, the grid as it is now has very little capability to store and effectively use overgenerated kWhs from PVs
• Electrification of homes, which results in a larger PV array, must be coupled with grid harmonization strategies to realize the expected environmental and home owner benefits
• Currently, customer-owned storage at about $500/kWh is still too expensive to be cost for the 2019 Standards, but this rapidly changing and can cost effective in a future cycle of Standards
Although ZNE is the goal for 2020, the 2019 Standards must operate within the confines of NEM and life cycle costing, which are the overriding factors for PV requirements
9
ZNE Goals – Lessons Learned - Continued Grid harmonization strategies (GHS) must be coupled with customer owned PV systems to bring maximum benefits to the grid, environment, and the home owner
GHSs are strategies that maximize self-utilization of the PV array output and minimize exports back to the grid; examples of GHS include but are not limited to battery storage, demand response, thermal storage, and for some homeowners, EV grid integration.
10
2019 Standards Goals – Path to the Future 1. Increase building energy efficiency cost effectively
2. For Part 6, make progress toward the ZNE goal as possible within the confines of NEM and life cycle costing rules, while recognizing that Part 6 is an important but not the only tool for achieving ZNE
3. Contribute to the State’s GHG reduction goals
4. Promote self-utilization of the PV generation by encouraging or requiring demand flexibility and grid harmonization strategies
5. Provide independent compliance path for both mixed-fuel and all electric homes
6. Achieve the above goals while ensuring real benefits for the building occupants with positive benefit to cost ratios for all efficiency and generation measures
7. Provide the tools for local governments to adopt ordinances to achieve ZNE through Part 11 Reach Codes, and other beyond code practices
The proposed 2019 Standards strategy will accomplish all seven goals listed above
11
Standards Goals – Beyond the 2019 Cycle 1. Extend the same seven goals from the previous slide to high-rise multifamily and
nonresidential buildings
2. Improve integration of demand flexibility and grid harmonization strategies – consider making some measures prescriptive as technologies improve and cost effectiveness allows
3. Consider EV grid integration into the Standards - EV grid integration in nonresidential buildings offers huge potential for GHG reduction and self-utilization of PV generation

12
ZNE Goals – 2019 Standards Approach The 2019 Standards will recognize the following priority for efficiency and generation resources:
1. Envelope efficiency, 2. Appropriately sized PVs, and 3. Grid harmonization strategies that maximize self-utilization of the PV output and limit exports to the grid
Further, the standards must be framed in a way to encourage competition, innovation, and flexibility to foster new solutions as the grid and technologies evolve.

Oversupply and ramping: A new challenge as more renewables are integrated into the grid
Typical Spring Day
Net Load 11,663 MW on May 15, 2016
Actual 3-hour ramp 10,892 MW on
February 1, 2016
Page 13
CAISO Public
Solutions
Target energy efficiency
Increase storage and demand response
Enable economic dispatch of renewables
Decarbonize transportation fuels
Retrofit existing power plants
Align time-of-use rates with system conditions
Diversify resource portfolio
Deepen regional coordination

14
PV Cost Effectiveness - Findings
All Standards measures , whether efficiency or renewables, must be cost effective in each CZ, using life cycle costing
Using the 2019 TDVs which captures the impact of NEM rules, the LCC finds:
Complying with NEM rules, appropriately sized PVs that displace annual kWhs are found to be cost effective in all climate zones, even if the NEM2 rules are changed in the future to compensate hourly exported kWhs at avoided cost

15
Here Comes the Sun…
For the first time, 2019 Standards are proposed to have prescriptive PV requirements
Prescriptively, the PV system will be sized to displace the annual kWhs of the home
The prescriptive PV size will be calculated as follows:
Equation 150.1(c)14.1: kWPV = (CFA x A) + B
Where:
kWPV is the kW DC size of the PV system CFA is the conditioned floor area A is the floor area adjustment factor from Table 150.1-2 B Is the dwelling type adjustment factor from 150.1-2
There will be look up tables for the Adjusters For performance compliance, we’ll use the Energy Design Rating (EDR) Tool

Proposed Exceptions to On-Site PV
Draft exceptions to part or all of the proposed residential PV requirement for consideration and refinement during the rulemaking process:
EXCEPTION 1 : Address where existing barriers external to the dwelling exist, including but not limited to trees, hills, and adjacent structures.
EXCEPTION 2 : Allow for a reduced PV size in climate zone 15 that can be accommodated by the solar access requirements of the solar ready zone.
EXCEPTION 3 : Allow for a reduced PV size for single family homes with three stories.
EXCEPTION 4 : Address dwelling unit plans that were approved by planning departments prior to January 1, 2020.
EXCEPTION 5 : Allow for a reduced PV size if installed in conjunction with a battery storage system.
16

17
Builds on Commission’s Energy Design Rating Tool
• Energy Design Rating (EDR) score show how close a home is to the ZNE target
Aligned with RESNET
Reference home is a 2006 IECC compliant home, EDR=100
A score of zero means the house is a ZNE building
• CEC’s CBECC-Res software has the capability to calculate EDR scores for EE and PV
• Builders can use a combination of envelope energy efficiency features, better appliances, PVs, and other strategies to get to the target EDR
Download CBECC-Res here for free: http://www.bwilcox.com/BEES/BEES.html
18
Proposed 2019 Standards Approach
Energy Design Rating (EDR) targets for each climate zone: 1. An EDR level for energy efficiency features based on 2019 prescriptive
measures – This EDR target can only be met using energy efficiency measures, i.e., no PV tradeoff
2. An EDR Contribution for the PV system that is sized to displace the home’s annual kWhs
3. Subtract the PV EDR Contribution from the energy efficiency EDR to determine the final target EDR

19
Proposed 2019 Standards Approach 1. Maximize envelope efficiency as allowed by LCC and calculate EE EDR
i. HPA to R19 in severe CZs – Currently R13
ii. HPW to 0.043 ~ 0.046 U-factor in severe CZs – Currently 0.051
iii. Windows U-factor of 0.30 and SHGC of 0.23 – Currently 0.32 and 0.25
iv. QII as a prescriptive requirement
Establish an Energy Design Rating (EDR) for energy efficiency in each CZ that can only be met with efficiency measures (no PV tradeoff against EE)
2. Calculate EDR of PV system as follows:
i. Calculate the PV size required to displace the kWh in each CZ
ii. Calculate the EDR contribution of the PV array
3. Subtract the PV EDR contribution from the EE EDR contribution to establish the final EDR that the building must meet to comply in each CZ
Note: Examples are presented in later slides

20
Target EDR’s Many Advantages 1. A target EDR establishes a performance benchmark that the building must
meet to comply; consistent with the Warren-Alquist Act performance standards expectation to provide builders with compliance flexibility
2. Target EDR allows the builder to use more efficiency and less PV to get to the target; such as high performance glazing, Energy Star appliances, and higher than minimum HVAC systems that we are prevented from requiring because of preemption issues
3. The EDR concept can be used to right size the PV system for low EDR and ZNE goals by taking advantage of grid harmonization strategies including battery storage, thermal storage, and demand response and flexibility strategies
4. Target EDR is fully compatible with setting reach codes, local jurisdiction simply identifies a lower target EDR (or zero) that can be met with a combination of additional EE, PV, demand response/flexibility, EV integration, or storage
5. Target EDR works well with varying building sizes – static PV size does not

21
Target EDR Advantages - Example Here is an example of how CBECC-Res calculates the Target EDR for both EE and PV in CZ12 for the 2,700 sf house:

22
Parallel Prescriptive Paths
There will be two parallel prescriptive paths for compliance, one for each of:
1. Mixed Fuel Homes
2. All-Electric Homes
This allows the all-electric and mixed fuel homes to have their own prescriptive paths,
NEEA Tier 3 HPWH models can easily be used to meet or exceed standard design using the performance path
23
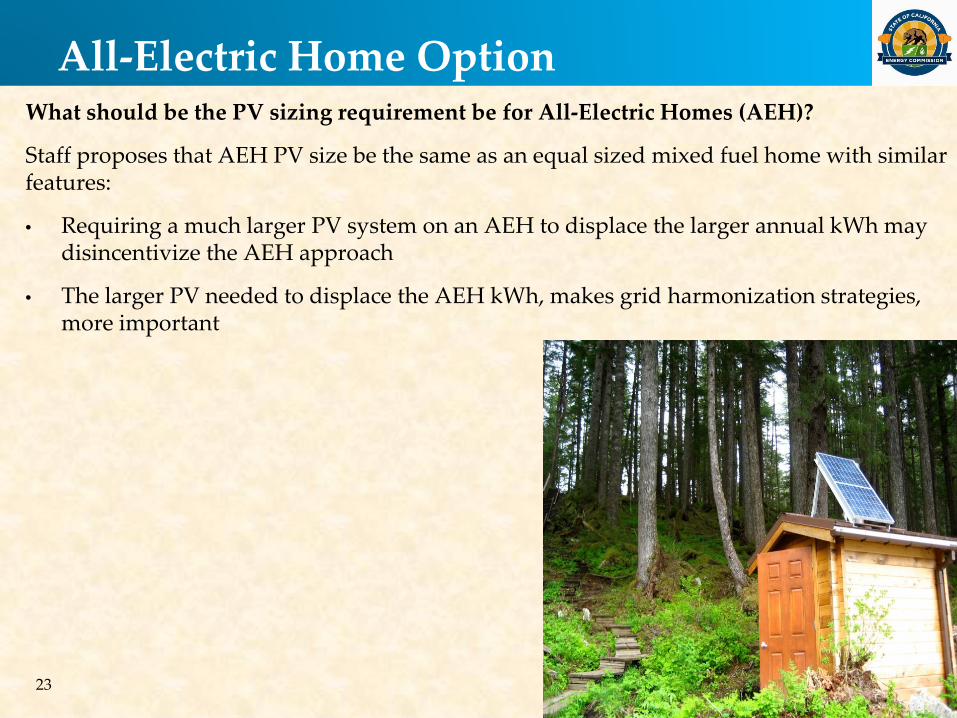
All-Electric Home Option What should be the PV sizing requirement be for All-Electric Homes (AEH)?
Staff proposes that AEH PV size be the same as an equal sized mixed fuel home with similar features:
• Requiring a much larger PV system on an AEH to displace the larger annual kWh may disincentivize the AEH approach
• The larger PV needed to displace the AEH kWh, makes grid harmonization strategies, more important
24
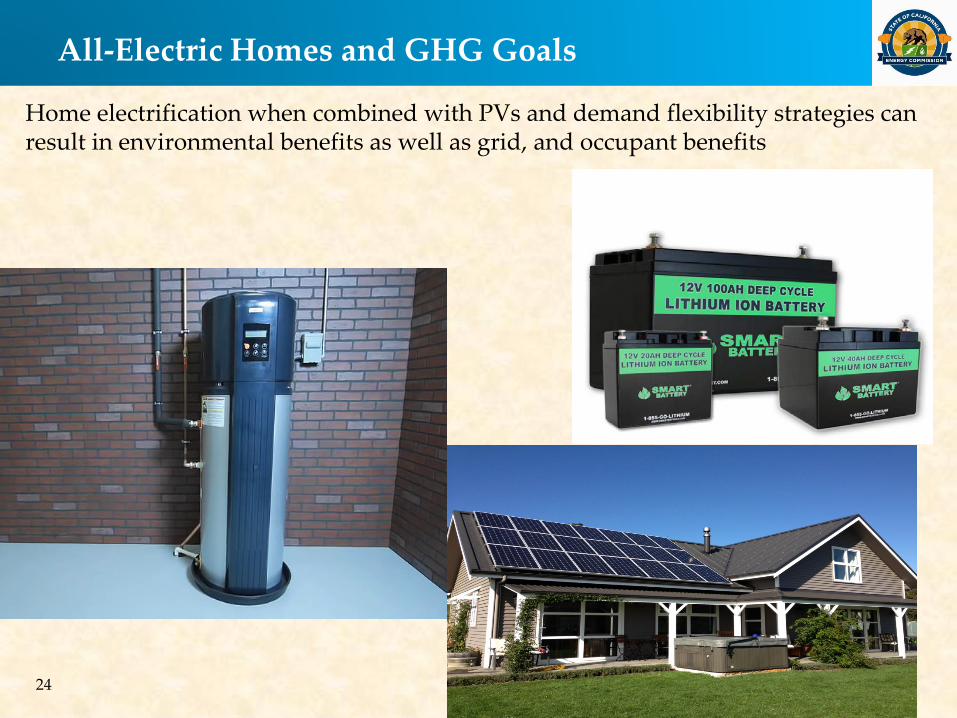
All-Electric Homes and GHG Goals Home electrification when combined with PVs and demand flexibility strategies can
result in environmental benefits as well as grid, and occupant benefits
25
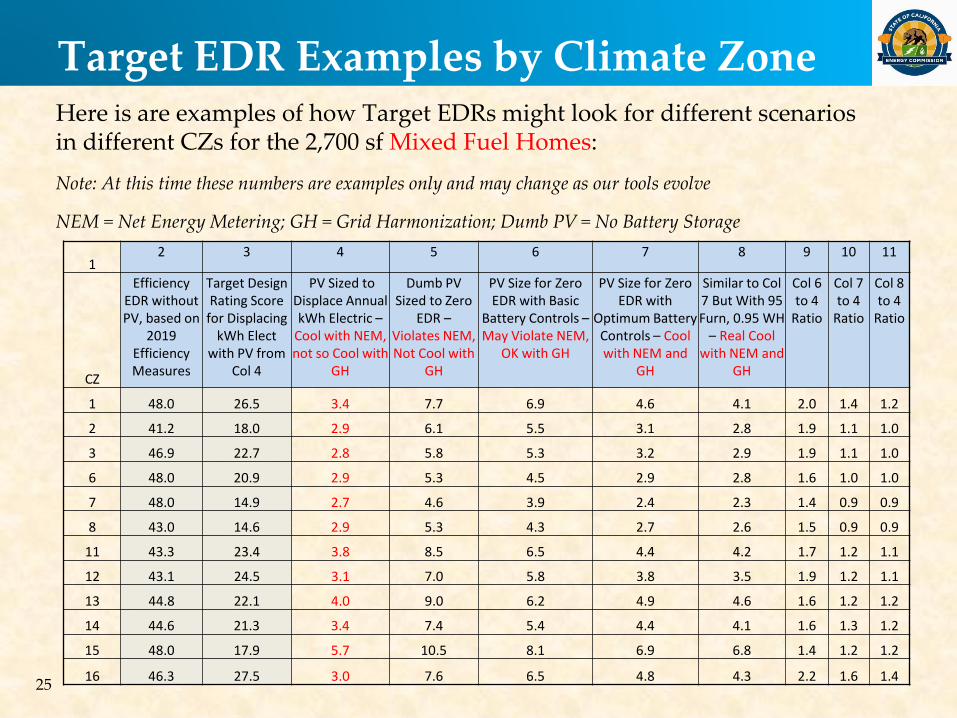
Target EDR Examples by Climate Zone Here is are examples of how Target EDRs might look for different scenarios in different CZs for the 2,700 sf Mixed Fuel Homes: Note: At this time these numbers are examples only and may change as our tools evolve
NEM = Net Energy Metering; GH = Grid Harmonization; Dumb PV = No Battery Storage
1 2 3 4 5 6 7 8 9 10 11
CZ
Efficiency EDR without PV, based on
2019 Efficiency Measures
Target Design Rating Score
for Displacing kWh Elect
with PV from Col 4
PV Sized to Displace Annual kWh Electric –
Cool with NEM, not so Cool with
GH
Dumb PV Sized to Zero
EDR – Violates NEM, Not Cool with
GH
PV Size for Zero EDR with Basic
Battery Controls – May Violate NEM,
OK with GH
PV Size for Zero EDR with
Optimum Battery Controls – Cool with NEM and
GH
Similar to Col 7 But With 95 Furn, 0.95 WH
– Real Cool with NEM and
GH
Col 6 to 4
Ratio
Col 7 to 4
Ratio
Col 8 to 4
Ratio
1 48.0 26.5 3.4 7.7 6.9 4.6 4.1 2.0 1.4 1.2
2 41.2 18.0 2.9 6.1 5.5 3.1 2.8 1.9 1.1 1.0
3 46.9 22.7 2.8 5.8 5.3 3.2 2.9 1.9 1.1 1.0
6 48.0 20.9 2.9 5.3 4.5 2.9 2.8 1.6 1.0 1.0
7 48.0 14.9 2.7 4.6 3.9 2.4 2.3 1.4 0.9 0.9
8 43.0 14.6 2.9 5.3 4.3 2.7 2.6 1.5 0.9 0.9
11 43.3 23.4 3.8 8.5 6.5 4.4 4.2 1.7 1.2 1.1
12 43.1 24.5 3.1 7.0 5.8 3.8 3.5 1.9 1.2 1.1
13 44.8 22.1 4.0 9.0 6.2 4.9 4.6 1.6 1.2 1.2
14 44.6 21.3 3.4 7.4 5.4 4.4 4.1 1.6 1.3 1.2
15 48.0 17.9 5.7 10.5 8.1 6.9 6.8 1.4 1.2 1.2
16 46.3 27.5 3.0 7.6 6.5 4.8 4.3 2.2 1.6 1.4

26
Target EDR Examples by Climate Zone Here is are examples of how Target EDRs might look for different scenarios in different CZs for the 2,700 sf All-Electric Homes: Note: At this time these numbers are examples only and may change as our tools evolve
NEM = Net Energy Metering; GH = Grid Harmonization; Dumb PV = No Battery Storage
1 2 3 4 5 6 7 8 9 10 11
CZ
Target Design Rating Score
for Displacing kWh Elect
with PV Size from Col 3
PV Sized to Displace
Annual kWh Electric in
Mixed Fuel Homes–Cool
with NEM not so Cool with
GH
Dumb PV Sized to Displace
Annual kWh in AEH – Cool with NEM, not Cool
with GH
Dumb PV Sized for Zero EDR – Violates NEM, Not Cool with
GH
PV Sized for Zero EDR with Basic Battery
Controls – May Violate NEM,
OK for GH
PV Sized for Zero EDR with
Optimum Battery Controls
– Cool with NEM and GH
Similar to Col 7 But With 14 EER HP, 3.5
COP HPWH – Real Cool with NEM and GH
Col 6 to 4
Ratio
Col 7 to 4 Ratio
Col 8 to 4 Ratio
1 33.9 3.4 7.7 9.4 8.4 5.6 5.3 1.1 0.8 0.7
2 29.6 2.9 5.9 7.2 6.5 3.9 3.7 1.1 0.7 0.6
3 32.1 2.8 5.4 7.0 6.0 3.8 3.6 1.1 0.7 0.7
6 26.6 2.9 4.6 5.9 4.9 3.2 3.0 1.1 0.7 0.7
7 26.0 2.7 4.1 5.3 4.4 2.7 2.6 1.1 0.7 0.6
8 26.0 2.9 4.6 6.1 4.8 3.1 2.9 1.0 0.7 0.6
11 31.4 3.8 6.6 9.9 7.6 5.9 5.3 1.2 0.9 0.8
12 30.0 3.1 5.9 8.4 6.7 4.8 4.4 1.1 0.8 0.7
13 30.8 4.0 6.7 10.3 8.0 6.5 5.8 1.2 1.0 0.9
14 33.3 3.4 5.9 8.6 6.7 5.8 5.3 1.1 1.0 0.9
15 26.2 5.7 7.0 11.5 9.2 8.0 7.0 1.3 1.1 1.0
16 48.3 3.0 7.7 10.2 8.9 7.0 6.9 1.2 0.9 0.9

27
Extreme Efficiency and ZNE
Conclusions:
1. Limited opportunity for regulated loads to lower EDR in the future
2. Need PV + demand flexibility to achieve low EDR scores or ZNE
Can extreme energy efficiency regardless of cost achieve full ZNE (EDR of 0)?
• Even if we eliminate all heating, cooling, hot water, and IAQ loads, we’ll still end up with an EDR score of 25-30, the theoretical limit for efficiency EDR!
• That is because in most climate zones plug loads are now the dominant loads and they are unaffected by efficiency measures, extreme or not
• 2019 Standards efficiency EDRs are in the 43-48 range depending on the CZ
• “Practical” efficiency measures – without renewables and demand flexibility - can move the EDR score by no more than 7-9 points in severe CZs, less in milder CZs to ~34-41 range!
28
Standards and PV Sizing
• For Part 6, PV is sized to net out the buildings annual kWh; larger PV array may be installed but will not receive additional compliance credit
• For Part 11 compliance, CBECC allows PV array coupled with a 6 kWh battery storage system to be oversized by a factor of 1.6; this PV size:
Provides additional flexibility for the grid; the battery enables the increased PV capacity to be used by the utility to meet high demand during critical peak periods
Promotes self-utilization on peak since PV is coupled with battery storage
The 1.6 cap ensures a greater than 1.0 benefit to cost ratio for the building owner even if hourly exports are compensated only at avoided cost
• CBECC provides a size limit bypass checkbox that once checked allows exceeding the 1.6 times size limit, with a warning that this option may violate NEM sizing rules

29
Estimated Costs by Climate Zones
Average of Two Prototypes
Climate Zone High
Performance Walls
High Performance Attics QII PV Size, kW DC
PV (Average of two prototypes- mixed
fuel home) Total
1 $ 887.90 $ - $ 396.00 3.2 $ 9,858.00 $ 11,145.08 2 $ 887.90 $ - $ 396.00 2.7 $ 8,308.00 $ 9,594.58 3 $ 887.90 $ - $ 396.00 2.6 $ 7,998.00 $ 9,284.48 4 $ 887.90 $ 288.20 $ 396.00 2.6 $ 7,998.00 $ 9,572.68 5 $ 887.90 $ - $ 396.00 2.4 $ 7,548.50 $ 8,834.84 6 $ - $ - $ 396.00 2.6 $ 8,137.50 $ 8,536.13 7 $ - $ - $ 396.00 2.5 $ 7,688.00 $ 8,086.48 8 $ 887.90 $ 288.20 $ 396.00 2.7 $ 8,308.00 $ 9,882.78 9 $ 887.90 $ 288.20 $ 396.00 2.8 $ 8,757.50 $ 10,332.43
10 $ 887.90 $ 288.20 $ 396.00 2.9 $ 8,897.00 $ 10,471.97 11 $ 887.90 $ 288.20 $ 396.00 3.4 $ 10,586.50 $ 12,162.02 12 $ 887.90 $ 288.20 $ 396.00 2.8 $ 8,757.50 $ 10,332.43 13 $ 887.90 $ 288.20 $ 396.00 3.6 $ 11,206.50 $ 12,782.22 14 $ 887.90 $ 288.20 $ 396.00 3.1 $ 9,517.00 $ 11,092.17 15 $ 887.90 $ 288.20 $ 396.00 5.3 $ 16,306.00 $ 17,883.36 16 $ 887.90 $ 288.20 $ 396.00 2.7 $ 8,447.50 $ 10,022.33

30
2 – Life Cycle Costing
Life Cycle Costing for Prescriptive PV Requirement
E3 Life Cycle Costing Analysis Finds:
1. PV systems sized to displace annual kWhs are cost effective in all climate zones
2. Even if NEM2 rules are changed to compensate exported kWhs at avoided cost
3. With no federal ITC
The following are a partial representation of E3 analysis and findings (E3’s greatest hits) – The full report will be available online

Solar production occurs during low TDV hours, and households demand energy during high TDV hours
• PV must be sized larger to reach TDV ZNE vs. Site ZNE (which doesn’t account for the changing value of kWh)
For a 2,100 ft2 home with 180° PV orientation, TDV ZNE requires 7% - 44% larger PV capacity than Site ZNE (average: 21%)
Because PV interconnection rules limit sizing to electric kWh, this presentation focuses on that size
TDV ZNE requires a larger PV system than Site ZNE
31
-
2
4
6
8
10
CZ1
CZ2
CZ3
CZ4
CZ5
CZ6
CZ7
CZ8
CZ9
CZ10
CZ11
CZ12
CZ13
CZ14
CZ15
CZ16
PV S
yste
m C
apac
ity (k
W)
Mixed Fuel Home PV System Capacity (kW)2100 sf mixed fuel home, 180° orientation
Sizing PV to Offset Electric kWhSizing PV to Offset Electric TDVSizing PV to Offset Electric + Gas TDV (Current Definition of ZNE)
-
2
4
6
8
10
CZ1
CZ2
CZ3
CZ4
CZ5
CZ6
CZ7
CZ8
CZ9
CZ10
CZ11
CZ12
CZ13
CZ14
CZ15
CZ16
PV s
yste
m c
apac
ity
(kW
)
All-Electric Home PV system capacity (kW)(2,100 sq ft all-electric home, 180°PV orientation)
Sizing PV to Offset Electric kWh Sizing PV to Offset Electric TDV

PV Costs
No ITC Assumed - The ITC is scheduled to step down throughout the 2020-2022 building standard cycle (26%, 22%, 20%) and then to 0% for residential systems beginning in 2023
All costs assume a 30-yr panel life and inverter replacements after 10 and 20 years (comprises ~$0.40/W in the costs)
$2.61 $2.99
$3.55
$0.00$0.50$1.00$1.50$2.00$2.50$3.00$3.50$4.00
Low Cost Med Cost High Cost
$/W
($2
019)
PV Costs
Price based on NREL 2016 Installer Price
• Low cost case: • 30% cost reduction 2016 – 2020 (GreenTech Media)
• Medium cost case: • 18% cost reduction 2016 – 2020 (Bloomberg)
• High cost case: • No cost reduction 2016 - 2020

Three solar compensation policies
33
0
1
2
3
4
5
6
NEM 2.0 AC for Exports AC for All
30-y
r NPV
PV
Prod
uctio
n Va
lue
($20
19)
Average per-kWh compensated value (TDV) of rooftop PV(Mixed fuel home, solar PV sized to electric kWh, 2,100 sq ft home, 180°PV orientation)
Behind-the-meter Generation Non-Surplus Export Generation
AC = Avoided Costs
Non-surplus Export Generation are the hourly exports

Offsetting electric kWh with solar PV is cost-effective except under the most aggressive NEM reform scenarios
Cost-Effectiveness of Offsetting Elec kWh in a Mixed Fuel Home
34
CZ PV kW1 2.89 2 2.46 3 2.38 4 2.36 5 2.22 6 2.38 7 2.26 8 2.46 9 2.51
10 2.58 11 3.10 12 2.58 13 3.28 14 2.73 15 4.83 16 2.37
$(10,000)
$(5,000)
$-
$5,000
$10,000
$15,000
$20,000
$25,000
1 2 3 4 5 6 7 8 9 10 11 12 13 14 15 16
Net
Ben
efit
($20
19 N
PV)
Climate Zone
Net Benefit of Offsetting Electric kWh in a Mixed Fuel Home2700 sf - PV 180°
Low Cost PV NEM 2.0
Med Cost PV NEM 2.0
High Cost PV NEM 2.0
Low Cost PV Avoided Cost forExportsMed Cost PV Avoided Cost forExportsHigh Cost PV Avoided Cost forExportsLow Cost PV Avoided Cost for All

3 - Strategies for Reach Codes
NEM Rules and Oversizing PV –
DRAFT
March 2, 2017
Snuller Price, Zachary Ming, Brian Conlon

PV Sizing Methods
Electric kWh
• PV scaled such that annual generation = annual electric load
Maximize Net Benefits
• PV scaled to maximize net TDV benefit to customer • Practically, this is the same capacity as sizing to kWh, i.e., further generation will only
receive Net Surplus Compensation (NSC)
Electric TDV
• PV scaled such that annual TDVs generated = annual TDV of electric load
Zero Net Benefits (Breakeven Point)
• PV scaled to point at which a larger system will not be cost-effective
• Cost of PV system = Revenue from PV generation 36
Sizes no longer follow predictable order

02468
101214161820
CZ01 CZ02 CZ03 CZ04 CZ05 CZ06 CZ07 CZ08 CZ09 CZ10 CZ11 CZ12 CZ13 CZ14 CZ15 CZ16
Syst
em Si
ze (k
W)
2700 sqft, PV180, NEM 2.0, Mid Cost PV
PV Sized to Electric kWh PV Sized to Maximize Net Benefits
PV Sized to Electric TDV PV Sized to Zero Net Benefits
CZ1 1.98 CZ2 2.51 CZ3 2.49 CZ4 2.62 CZ5 2.76 CZ6 2.42 CZ7 2.61 CZ8 2.49 CZ9 2.55
CZ10 2.43 CZ11 2.65 CZ12 2.59 CZ13 2.43 CZ14 2.96 CZ15 2.55 CZ16 2.61
PV sized to max net benefits is smaller than sized to electric TDV
• Sizing to TDV does not reflect lower compensation for exports from NEM 2.0
At sizes beyond max net benefits, incremental kW only receive NSC
• Large net benefit and small marginal net cost (PV cost – NSC) at the point of maximum net benefits require much larger systems to zero out net benefits
• Retail for self-use and exports, NSC for net surplus – NEM2
Sizing Comparison NEM 2.0, Mid Cost PV
37
Ratio of PV Sized to Zero Net Benefits PV Sized to Electric kWh

02468
101214161820
CZ01 CZ02 CZ03 CZ04 CZ05 CZ06 CZ07 CZ08 CZ09 CZ10 CZ11 CZ12 CZ13 CZ14 CZ15 CZ16
Syst
em Si
ze (k
W)
2700 sqft, PV180, Avoided Cost for Exported Energy, Mid Cost PV
PV Sized to Electric kWh PV Sized to Maximize Net Benefits
PV Sized to Electric TDV PV Sized to Zero Net Benefits
CZ01 1.21 CZ02 1.57 CZ03 1.52 CZ04 1.64 CZ05 1.71 CZ06 1.58 CZ07 1.67 CZ08 1.67 CZ09 1.69 CZ10 1.57 CZ11 1.65 CZ12 1.64 CZ13 1.45 CZ14 1.91 CZ15 1.55 CZ16 1.60
Valuing export PV generation at avoided cost reduces cost-effectiveness of PV sized to offset kWh
• Smaller net benefits for systems sized to offset kWh means less kW at marginal net cost are needed to zero out net benefits
• Retail for self-use, AC for exports, NSC for net surplus, NEM”3”
Sizing Comparison AC for Exports, Mid Cost PV
38
Ratio of PV Sized to Zero Net Benefits PV Sized to Electric kWh

- 2 4 6 8
10 12 14 16 18 20
CZ01 CZ02 CZ03 CZ04 CZ05 CZ06 CZ07 CZ08 CZ09 CZ10 CZ11 CZ12 CZ13 CZ14 CZ15 CZ16
Syst
em Si
ze (k
W)
2700 sqft, PV180, BTM TDV, Mid Cost PV
PV Sized to Electric kWh PV Sized to Maximize Net Benefits
PV Sized to Electric TDV PV Sized to Zero Net Benefits
Sizing Comparison BTM TDV, Mid Cost PV
39
Ratio of PV Sized to Zero Net Benefits
PV Sized to Electric kWh
BTM TDV means
• All PV production consumed behind-the-meter (BTM) receives full TDV value
• All PV production exported to the grid as well as all net surplus above a system sized to annual kWh receives net surplus compensation (NSC)
PV sized to electric kWh and electric TDV are unchanged from previous rate structures
PV sized to maximize net benefits and PV sized to zero net benefits are substantially reduced
Retail for self-use, NSC for exports and annual surplus
CZ1 0.74 CZ2 1.05 CZ3 1.01 CZ4 1.11 CZ5 1.14 CZ6 1.04 CZ7 1.12 CZ8 1.11 CZ9 1.18
CZ10 1.05 CZ11 1.11 CZ12 1.14 CZ13 0.89 CZ14 1.30 CZ15 0.98 CZ16 1.07

Storage Overview
E3 analyzed the additional value of a battery storage system to an existing PV system of a 2700 sf, mixed fuel home
BTM TDV rate scenario
• BTM generation receives full TDV value (~$0.20/kWh); exported generation receives net surplus compensation value (~$0.03/kWh)
Battery assumptions
• 14 kWh
• 5 kW
• 90% round trip efficiency
• $500/kWh fully installed
40

02468
101214161820
CZ01 CZ02 CZ03 CZ04 CZ05 CZ06 CZ07 CZ08 CZ09 CZ10 CZ11 CZ12 CZ13 CZ14 CZ15 CZ16
Syst
em Si
ze (k
W)
2700 sqft, PV180, BTM TDV, Mid Cost PV
PV Sized to Electric kWh PV Sized to Maximize Net Benefits
PV Sized to Electric TDV PV Sized to Zero Net Benefits
Sizing Comparison BTM TDV With Storage, Mid Cost PV
Ratio of PV Sized to Zero Net Benefits
PV Sized to Electric kWh
41
Installing storage (without accounting for the storage costs) increases the benefits to the homeowner, allowing them to install more solar
The Generous Santa option: Demonstrates how PV value increases if coupled with storage at no cost
Retail for self-use, and NSC for exports and annual surplus
CZ1 2.05 CZ2 2.78 CZ3 2.70 CZ4 3.09 CZ5 3.09 CZ6 2.89 CZ7 2.97 CZ8 3.17 CZ9 3.77
CZ10 3.75 CZ11 3.76 CZ12 3.71 CZ13 3.66 CZ14 4.26 CZ15 3.47 CZ16 3.02
storage costs not included

Sizing Comparison Avoided Cost for Exported Energy With Storage, Mid Cost PV
CZ1 1.48 CZ2 2.21 CZ3 1.96 CZ4 2.71 CZ5 2.23 CZ6 1.73 CZ7 1.87 CZ8 2.29 CZ9 2.39 CZ10 2.47 CZ11 2.82 CZ12 2.63 CZ13 2.49 CZ14 2.73 CZ15 2.33 CZ16 1.90 42
Changing the rate structure to avoided cost for exported energy increases the net benefits of solar + storage and therefore increases the amount of solar that can be installed before net benefits are reduced to zero; annual surplus at NSC
The Stingy Santa option – Demonstrates the impact on the PV if Santa charges you for the storage
Retail for self-use, AC for exports, and NSC for annual surplus – NEM”3”
NEW
Ratio of PV Sized to Zero Net Benefits
(with Storage Costs) PV Sized to Electric kWh
02468
101214161820
CZ01 CZ02 CZ03 CZ04 CZ05 CZ06 CZ07 CZ08 CZ09 CZ10 CZ11 CZ12 CZ13 CZ14 CZ15 CZ16
Syst
em Si
ze (k
W)
2700 sqft, PV180, Avoided Cost for Exported Energy, Mid Cost PV
PV Sized to Electric kWh PV Sized to Maximize Net Benefits
PV Sized to Electric TDV PV Sized to Zero Net Benefits
PV Sized to Zero Net Benefits (with Storage Cost) PV Sized to Electric + Gas TDV

$0.00
$0.05
$0.10
$0.15
$0.20
$0.25
$0.30
1 2 3 4 5 6 7 8 9 10 11 12 13 14 15 16
Brea
keve
n Re
tail
Rate
($20
20 re
al le
veliz
ed)
Climate Zone
43
POU PV Cost/Benefit Breakeven Analysis
TDV Retail Rate
Not cost-effective at any retail rate
Cost-effective at any retail rate
For avoided cost only rate structures, increasing the retail rate does not increase cost-effectiveness
When solar is cost-effective while only being compensated at avoided cost, it is cost-effective regardless of the retail rate level
High Cost PV Avoided Cost for All
Mid Cost PV Avoided Cost for All
Low Cost PV Avoided Cost for All
High Cost PV Avoided Cost for Exports
Mid Cost PV Avoided Cost for Exports
Low Cost PV Avoided Cost for Exports
High Cost PV NEM 2.0
Mid Cost PV NEM 2.0
Low Cost PV NEM 2.0
SDG&E PG&E SCE LADWP
IID SMUD
IEPR Rate Forecast

California Energy Commission
Limited Impact of Standards PV Requirements Compared to Other Forecasted PV Development
45
4. Software Tools The CBECC-Res Compliance Software May Be Used For:
• Part 6 Compliance, and
• Part 11 (CALGreen, Reach Codes, etc)
The Software can be used to:
• Size PV for Part 6 compliance or lower target EDRs for Reach Codes
• Assess the impact of battery storage on lowering EDR
• Assess the impact of precooling and other DR strategies on lowering EDR
• Assess the impact of HPWH DR on lowering EDR
• And other options

46
Software Tools – Input Screens
This screen can be used to specify an EDR target that may be required by reach codes to size the PV system

47
Software Tools – Input Screens

48
Software Tools – Input Screens
49
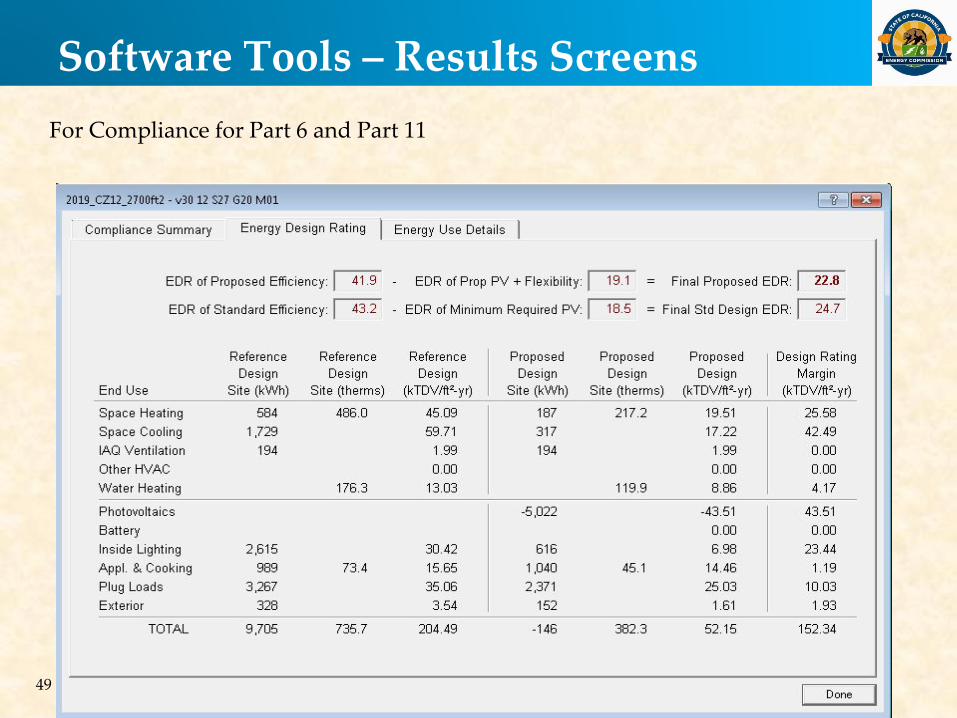
Software Tools – Results Screens
For Compliance for Part 6 and Part 11

50
Software Tools – Results Screens
Compliance Pass/Fail

51
Questions?
52
Mitigating Distribution System Impact The 2019 BEES will require or encourage the smart, grid harmonized PV systems that will greatly reduce or eliminate the distribution system impacts of the proposed PV systems for new buildings; and may also serve as a model for PV systems installed on existing buildings:
1. Limiting of requirements and compliance credits to right-sized PV systems that on average (considering Standards exceptions) will be substantially smaller than allowed by current interconnection rules,
2. Specification of the smartest inverters (phase III) that the CPUC has approved for use in IOU territories, capable of providing transmission and distribution ancillary services
3. Strong compliance credits for battery storage to encourage self-utilization onpeak and avoidance of offpeak, hourly exports
California Energy Commission
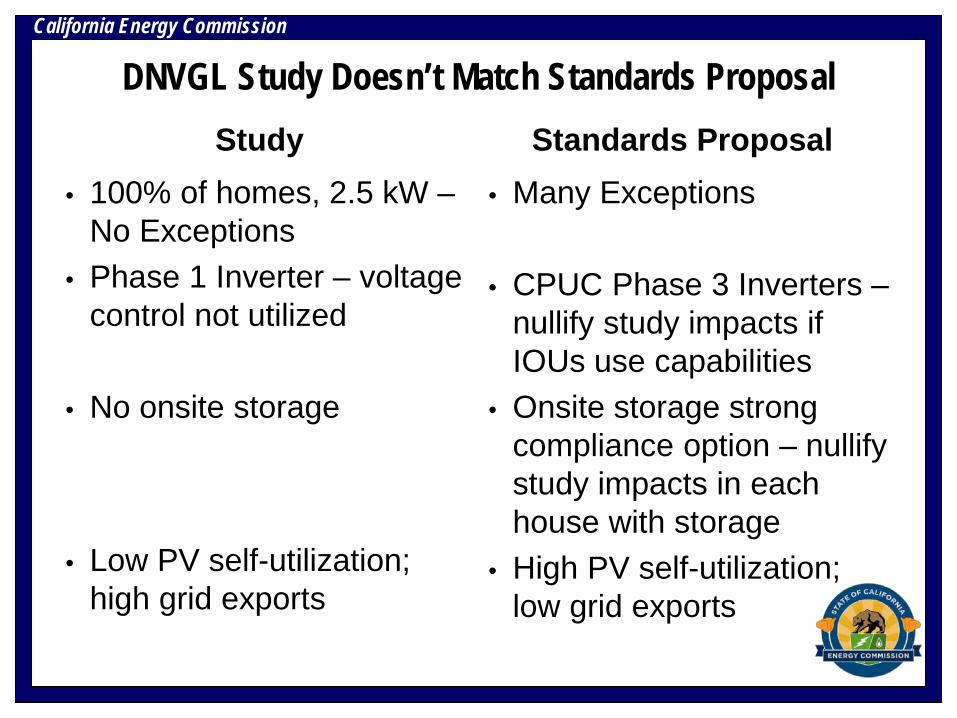
DNVGL Study Doesn’t Match Standards Proposal Study
• 100% of homes, 2.5 kW – No Exceptions
• Phase 1 Inverter – voltage control not utilized
• No onsite storage • Low PV self-utilization;
high grid exports
Standards Proposal • Many Exceptions
• CPUC Phase 3 Inverters – nullify study impacts if IOUs use capabilities
• Onsite storage strong compliance option – nullify study impacts in each house with storage
• High PV self-utilization; low grid exports


![½ |» ʸ¸¼·Y ¾Ì] c Zne ÉZÅ ÄË ¿ejip.ir/article-1-825-fa.pdf½ |» ʸ¸¼·Y ¾Ì] c Zne ÉZÅ ÄË ¿ ...  ʻ](https://static.fdocuments.net/doc/165x107/5e3965850d53a02160125f6d/-y-oe-c-zne-z-ejipirarticle-1-825-fapdf-y.jpg)