
DO YOU KNOW WHAT YOU’RE EATING? - Consumer Reports
78
DO YOU KNOW WHAT YOU’RE EATING? AN ANALYSIS OF U.S. GOVERNMENT DATA ON PESTICIDE RESIDUES IN FOODS February, 1999 Consumers Union of United States, Inc. Public Service Projects Department Technical Division Edward Groth III, PhD, Project Director Charles M. Benbrook, PhD, Consultant Karen Lutz, MS, Consultant This analysis was supported in part by the Pew Charitable Trusts, the Joyce Foundation and the W. Alton Jones Foundation.
Transcript of DO YOU KNOW WHAT YOU’RE EATING? - Consumer Reports

DO YOU KNOW WHAT YOU’REEATING?
AN ANALYSIS OF U.S. GOVERNMENT DATAON PESTICIDE RESIDUES IN FOODS
February, 1999
Consumers Union of United States, Inc.Public Service Projects Department
Technical Division
Edward Groth III, PhD, Project DirectorCharles M. Benbrook, PhD, Consultant
Karen Lutz, MS, Consultant
This analysis was supported in part by the Pew Charitable Trusts, the Joyce Foundation and the W. AltonJones Foundation.

i
TABLE OF CONTENTS
TABLE OF CONTENTS i
LIST OF TABLES ii
SUMMARY 1
INTRODUCTION: The USDA Pesticide Data Program 5
METHODOLOGY 6A. CU’s Analysis of the PDP Data 6B. CU’S Toxicity Index 7 (1) Toxicity of Different Pesticides 8 (2) Calculating Toxicity Indices for Specific Foods 9 (3) Examining “Risk Drivers” for Specific Foods 11C. Some Data-Analysis Issues 11
RESULTS AND DISCUSSION 13A. Comparative Toxicity Loading of Different Foods 13B. Illegal Residues 15C. Health Implications of Differences in Toxicity Loading 16D. Multiple Residues 19E. Differences Between Imported and Domestic Foods 20F. Differences Between Fresh and Processed Foods 23G. Trends 26H. Risk Drivers 30I. Pesticide Use Data 36
RECOMMENDATIONS 38A. Advice to Consumers 38B. Policy Recommendations 39
REFERENCES 42
FOR MORE INFORMATION 42

ii
LIST OF TABLES
TABLE 1. Foods Tested by the USDA Pesticide Data Program,1994-1997
TABLE 2. Acute Toxicity of Pesticides Detected by the USDAPesticide Data Program, 1994-1997
TABLE 3. Chronic Toxicity of Pesticides Detected by the USDAPesticide Data Program, 1994-1997
TABLE 4. Toxicity Indices for Foods Tested in the USDA PesticideData Program, 1994-1997
TABLE 5. Shares of Total Toxicity Index Values Contributed by IndividualPesticides Detected on Each Food by Origin and Year, Pesticide DataProgram, 1994-1997
TABLE 6. Odds of Exceeding “Safe” Daily Doses for Selected Pesticidesin Selected Foods Tested by the USDA Pesticide Data Program, 1996and 1997
TABLE 7. Multiple Pesticide Residues: Frequency Distribution ofSamples With Different Numbers of Residues Detected by theUSDA Pesticide Data Program, 1996
TABLE 8. Applications of Selected High-Risk Pesticides to SelectedCrops, 1993-1997

1
SUMMARY
We analyzed data collected by the U.S. Department of Agriculture’sPesticide Data Program (PDP) to compare the relative amounts and toxicityof pesticide residues in different foods. We obtained pesticide residue dataon over 27,000 food samples tested by the PDP in 1994-97. We weighted theamounts of residues present to account for differences in the toxicity ofindividual pesticide chemicals, and computed a Toxicity Index (TI) for eachfood. Our TI integrates measures of the frequency of pesticide detection, thelevels of residues present and the relative toxicity of the detected residues,yielding an index of the relative toxicity loading of each food.
Larger TI values represent greater toxicity loading—that is, foods withhigh TI scores have greater amounts of pesticide residues, residues that aremore toxic, or both, compared to foods with low TI scores. TI values for thefoods tested by the PDP in 1994-97 range from 0.01 to 5,376.
But the majority of foods have TI values between 10 and 300, and afew more have values between 300 and 600. That is, the relative toxicityloading of the widely consumed foods tested by the PDP spans a range of atleast 60-fold. In our judgment, values greater than 100 on the TI scale showcomparatively high pesticide contamination, and values less than 10 indicatethat those foods are comparatively quite “clean.” (Values in the range from10 to 100 represent increasing degrees from “low” to “moderate” levels ofpesticide contamination.)
Our Toxicity Index does not measure risk, per se; the degree of riskassociated with pesticide residues in foods also depends on food intake andon personal factors like age, illness, exposure to other sources of pesticides,and so forth. There is no sharp line between “safe” and “unsafe” scores onour Toxicity Index. With some exceptions noted later, the residues detectedby the PDP are within the established U.S. legal limits for those pesticides onthose foods. However, legal limits do not define safety, and residues of somechemicals on some foods would frequently expose a young child to a dosegreater than the U.S. government’s official estimate of the “safe” daily intakeof those pesticides.
Our TI values permit a variety comparisons among foods:

2
Which Foods Have the Lowest TI Values? Six foods had very low TI’s (10or less) each time they were tested: Frozen/canned corn, milk, U.S. orangejuice, U.S. broccoli, bananas, and canned peaches. Not quite as low, but stillrelatively “clean,” were frozen/canned sweet peas, U.S. and imported applejuice, frozen winter squash from Mexico, tomatoes from Canada, Brazilianorange juice, and U.S. wheat. See page 13 and Table 4 for details.
Which Foods Have the Highest TI Values? Seven foods consistently hadhigh or very high TI’s each time tested: Fresh peaches (both domestic andimported); frozen and fresh winter squash grown in the U.S.; domestic andimported apples, grapes, spinach and pears; and U.S.-grown green beans.Among these, U.S. peaches and frozen winter squash had TI Values about10-fold higher than even the other “high” scores. See page 14 and Table 4for details.
How Many Residues? Some foods have residues of many more pesticidesthan others. Up to 37 different pesticide chemicals were detected in applesby the PDP, for example, and more than 20 are found in peaches, pears andspinach, while only 10 were found in broccoli, and fewer than that in applejuice, orange juice, bananas and corn. Individual food samples often havemultiple residues on them. An apple grown in the U.S. typically contains fourpesticides, and some have as many as 10 different residues. Peaches, wintersquash, spinach, carrots and grapes are more likely than not to have two ormore residues in a sample. One sample of spinach had residues of 14different pesticides on it.
Are Imported Foods More Contaminated Than U.S. Crops? No. Eleven ofthe 12 highest TI scores are for U.S.-grown foods. There are 39 cases with10 or more samples of a food from a specific other country to compare withU.S. samples; in 26 cases (67 percent), U.S. samples had higher TI’s. Somedifferences exist between importing countries, as well as between the U.S.and other countries. Cases where imports are worse include Chilean grapes,Canadian and Mexican carrots, Mexican broccoli and tomatoes, Argentineand Hungarian apple juice, and Brazilian orange juice. U.S. samples areworse than imports for fresh peaches, fresh and frozen winter squash, freshgreen beans, apples, and pears. U.S. apple juice has a higher TI than applejuice from Germany or Mexico, and U.S. grapes have higher TI’s than thosefrom South Africa and Mexico. The size of the differences varies from foodto food. In two cases with the highest TI’s of any foods, U.S. peaches have10 times the TI of Chilean imports, and U.S. frozen winter squash has a TI

3
143 times as high as Mexican winter squash has. Only two imported foods,Mexican broccoli and Brazilian orange juice, have TI’s more than 10-foldlarger than those of U.S. samples, but in each case the higher score is stillcomparatively low.
Do Processed Foods Have Less Pesticides Than Fresh Foods? Generally,yes. But there are exceptions. TI values for apple juice and orange juice arefar lower than for the fresh fruits, and the TI for canned peaches is 1/1,000that of fresh peaches. Canned spinach has a TI about half as high as that forfresh spinach. Canned/frozen corn and canned/frozen peas also have amongthe lowest TI values, but no data on the fresh crops are available. But frozenand canned green beans and frozen winter squash each had TI scores higherthan those for the corresponding fresh crops.
Were Any of the Residues Illegal? Yes. About 1 percent of the residuesdetected by the PDP in 1994, 4 percent in 1995 and 1996, and 5 percent in1997 violated U.S. tolerances. Most violations are not excessive residues oflegally registered pesticides, but rather, low levels of chemicals that are notregistered for use on that food. Some violations are attributed to persistentresidues in soils or to wind dispersal of pesticides applied legally to nearbyfields, but we believe the PDP data show widespread illegal use of severalinsecticides on both U.S. and Mexican spinach.
Our analysis of the data also enables us to explain why different foodshave the Toxicity Indices they do. We can break the TI for a food down intothe components contributed by each pesticide chemical detected in that food.Doing that shows that a comparatively small number of uses of a few highlytoxic insecticides accounts for most of the toxicity loading in the crops withhigh TI values.
For example, 22 different pesticides were detected in U.S. peaches in1996, but one chemical—methyl parathion—accounts for more than 90percent of the total toxicity load. Methyl parathion accounts for a large partof the TI values for apples, pears, green beans and peas, as well as peaches.The high TI’s for winter squash (fresh and frozen) from the U.S. are almostentirely due to residues of dieldrin, a very toxic, carcinogenic insecticide thatwas banned 25 years ago, but persists in some agricultural soils. A handful ofother widely used insecticides and a few fungicides consistently accounts forthe greatest fraction of toxicity loading in most crops. We call pesticide usesthat dominate the TI’s for specific crops “risk drivers.”

4
The fact that a few very toxic pesticides account for most of thetoxicity loading in PDP-tested crops has important policy implications. Therisks associated with pesticides in foods can be sharply reduced by focusingrisk-management efforts on a few high-risk pesticide uses. Safer alternativesexist to manage most pests against which these high-risk chemicals are used(see Worst First, Consumers Union, 1998).
In 1996 Congress passed a law, the Food Quality Protection Act, thatrequires pesticide tolerances to protect children. This law could require theU.S. EPA to ban or severely restrict many of the high-risk insecticide usesresponsible for the greatest part of the toxicity loading revealed by the PDPdata. Unfortunately, the EPA is making only slow progress in implementingthe new law, and is faced with fierce resistance from agricultural interests andpesticide manufacturers.
While consumers await stricter government limits, there are steps theycan take to minimize pesticide risks in foods they eat or feed their children.We do not recommend eating less fruits and vegetables; the health benefits ofthese foods outweigh risks from the pesticides they contain. However,consumers can:
• Wash or peel fresh fruits and vegetables. Peeling apples, peaches andpears, in particular, can drastically reduce pesticide exposure from thesefoods, which have some of the highest Toxicity Indices.
• Try to buy organically grown peaches, apples, grapes, pears, green beans,winter squash and spinach, if they are available where you live.
• Choose a variety of foods; don’t overdo it with any one fresh fruit orvegetable.
• Choose foods that have relatively low scores on CU’s Toxicity Index.This includes considering the country of origin for foods where domesticand imported samples have very different scores (peaches, apples, grapes,tomatoes, winter squash), and choosing processed fruits and vegetablesthat have TI scores substantially lower than fresh equivalents, such ascanned peaches.

5
INTRODUCTION
The USDA Pesticide Data Program
Since 1991, the United States Department of Agriculture (USDA) hascarried out an extensive program testing foods sold in the U.S. for pesticideresidues. This Pesticide Data Program (PDP) is designed to provide data onactual pesticide residues in widely-consumed foods, including foods known tobe eaten often by children, to support more accurate risk assessments bygovernment agencies that regulate pesticide use.
The PDP uses standard, multi-residue analytical methods (MRM’s)that screen foods for a wide range of pesticides, and carries out additional,specific tests for some widely used pesticides not picked up by the MRMs.The analyses can detect more than 200 different pesticides and breakdownproducts.
The USDA’s test protocols require testing foods “as eaten.” Thus, if aconsumer would ordinarily wash, peel or cook a food before consuming it,the PDP does that before analyzing the food. The results therefore provide areasonably accurate picture of residues that consumers are likely to eat.
Each PDP sample is a composite of about five pounds of produce; asample of might consist of 10 to 20 apples or oranges, or several hundredgrapes. Composite samples provide reasonable estimates of the averageresidues consumers are exposed to over time, but tend to average out thevariation in residue levels that occurs from one piece of fruit to the next. ThePDP data therefore are likely to understate the maximum residue levels thatmay be present, for instance, on an individual apple, peach or carrot. Thislimitation is more significant for assessing acute exposure than for assessingchronic exposure, since long-term averages matter most in the latter case,while occasional “peak” exposures can be crucial in the former.
The PDP tests about 10 or 12 different foods a year, typically testingabout 500 to 700 samples of each food. The foods selected rotate from oneyear to the next. The PDP has tried to test many different foods, which hastended to limit the program’s ability to track changes over time in pesticideresidue patterns in the same foods. Only a few foods have been tested for asmany as three consecutive years.

6
In gathering the foods tested each year, USDA tries to sample bothfrom major production regions within the U.S. and imports from countriesthat are significant suppliers to the U.S. market.
For many of the tested U.S. crops and some foods produced in othercountries, the PDP data effectively document the pesticide content of foodsthat are traded internationally. Our analysis is therefore probably of interestto consumers and consumer organizations outside the U.S.A.
METHODOLOGY
A. Consumers Union’s Analysis of the PDP Data
We obtained the results of the PDP pesticide residue analyses for theyears 1994 through 1997. (The 1997 data are the most recent available, justreleased in January 1999.) The data are available to the public, and reportsare published on the USDA web site, but most citizens are not familiar withthe program or the data it has produced.
In the four years we examined, the PDP tested over 27,000 samples in27 different food categories. Table 1 lists the foods and numbers of samplesof each food tested each year. Sixteen of the tested foods were fresh fruitsand vegetables; 8 were processed fruits and vegetables; milk, soybeans andwheat were also included.
For 15 foods, at least 10 imported samples came from at least oneforeign country, which was our “threshold” for examining imported samplesas a separate category. For the other foods, all or nearly all of the samplescame from the U.S. Table 1 shows foods and countries they came from,where there were adequate samples. In nine cases (apple juice/Argentina,bananas/Central America, orange juice/Brazil, grapes, peaches and pearsfrom Chile, green beans, tomatoes and winter squash from Mexico), the PDPtested at least 60 imported samples in one or more years. This large samplesize provides an accurate picture of that food from that origin. For some ofthe other imported foods, though, sample numbers are probably too small tosupport precise estimates of their relative pesticide toxicity loading.

7
Our consultants, Karen Lutz and Chuck Benbrook, designed and built alarge database program that we then used to analyze the USDA data. Thisdatabase enabled us to examine the residue results in many ways—by year,food item, pesticide chemical, residue level, frequency of detection, countryof origin, and by any combination of those parameters.
To the same database, we added information on the toxicity of everypesticide chemical detected in the PDP in the years we examined. The U.S.Environmental Protection Agency (EPA) has compiled toxicity data on allregistered pesticides; we used EPA’s most recent data.
The combination of USDA PDP residue data and EPA toxicity dataenabled us to estimate the relative toxicity loading of pesticide residues indifferent foods. This integration of residue and toxicity data is an innovationby Consumers Union; we first applied this method last year in our report onOrganically Grown Foods. We believe this method offers the scientific andregulatory communities, as well as consumers, a sound and useful way tocompare the relative size of pesticide risks posed by different chemicals andcombinations of chemicals in different foods.
B. CU’s Toxicity Index
To compare the amounts of pesticide residues in different foods in ameaningful way, CU has developed a “Toxicity Index,” or TI for short. TheTI provides an integrated measure of the frequency of detection of residues ina food, the average levels of residues present, and the relative toxicity of thespecific pesticides present.
This index is not a true measure of risk. Risk depends on how much aperson eats of different foods and on characteristics of individual consumerslike age, health status and other (non-food) exposures to pesticides. But theTI depicts the relative amount of pesticide toxicity in different foods, and assuch it provides a more robust index of relative risk than simple measures ofresidue frequencies or levels, unweighted for toxicity, can do.
To create our TI’s, we first needed to calculate a TI for each pesticidechemical found in the foods the PDP tested. Then, using the chemicals’ TI’sand the PDP data, we computed TI’s for the pesticide residues in each food.

8
(1) Toxicity of Different Pesticides
Pesticide toxicity has two components: Acute Toxicity, the propensityto cause immediately observable adverse effects at relatively high levels ofexposure; and Chronic Toxicity, the propensity to cause long-term, delayedeffects, following repeated lower-level exposure. Different pesticide activeingredients differ widely in both acute and chronic toxicity.
The standard toxicological measure of Acute Toxicity is the LD50,which is defined as the dose of a chemical that kills half of the exposed groupof test animals. The smaller the LD50, the more toxic the chemical. Table 2shows the LD50’s of pesticide chemicals detected in foods in the PDP. Therange from least toxic to most toxic of the listed pesticides by this measure ofacute toxicity is over 5,000-fold.
To translate LD50’s into an Acute Toxicity Index, (ATI), we took theinverse of the LD50 for each chemical (i.e., 1/LD50); this gives us an index inwhich larger numbers indicate greater toxicity. We multiplied the results by100, to make the results whole numbers, instead of decimal fractions, whileleaving the relative magnitude of the ATI’s unchanged. Table 2 also showsthe ATI for each pesticide chemical.
In summary: ATI = (1/LD50) x 100
The most widely used toxicological measure of Chronic Toxicity is theReference Dose, or RfD. The RfD is derived by taking the highest dose levelthat had no observed adverse effect in test animals and dividing it by a “safetyfactor,” typically 100. The result in theory represents a dose thought to bewithout appreciable risk to humans, although the uncertainties inherent inextrapolating from animals to humans and from high doses to lower dosesmust be acknowledged. As with the LD50, the more toxic a chemical is, thesmaller its RfD. The EPA has published chronic RFD’s for most registeredpesticides. Table 3 displays the RFD’s of pesticides detected in the PDP.Here too, there is a wide range (8,000-fold) from most to least toxic.
CU has developed a Chronic Toxicity Index (CTI), which is based onthe RfD, and also takes into account certain additional data on a chemical’stoxicity. As with the Acute Toxicity Index, we used the inverse of the RfD,so that more toxic pesticides would have larger CTIs. RfD’s typically arevery small numbers, and the expression (1/RfD) yields results that range from

9
about 6 to over 50,000. To express the results on a more manageable scale,we multiplied them by 0.1. We then added factors, where applicable, forendocrine disruption and carcinogenicity:
Endocrine disrupters: For pesticides listed as suspected endocrine disruptersby Colborn et al. (1996), the CTI was multiplied by a factor of 3. (I.e., CTI =(1/RfD) x 0.1 x 3.) Endocrine disruption is responsible for some of the mostdevastating documented effects of pesticides on wildlife, and as moreresearch emerges, may well prove to be a very critical aspect of pesticides’impacts on human health. In our judgment, potential endocrine disruption is amore important aspect of a chemical’s toxicity than even potential carcino-genicity, and our scoring scheme therefore gives it great weight.
Carcinogens: We incorporated a factor based on the U.S. EPA’s classifica-tion of carcinogens and estimate of carcinogenic potency, or Q*. For thosepesticides that have a Q* in EPA's database, we multiplied the Q* by 10 forpesticides classified by EPA as “known” or “probable” human carcinogens,and by 5 for those classified as “possible” human carcinogens. To put theresults on a scale where they would comprise about one-third of the totalwhen combined with the RfD-based index, we multiplied them by 50. Thisproduct was then added to the CTI. The effect of this additional factor isminor for pesticides that are very toxic in other ways (in which case, the RfDcomponent of the CTI is dominant). For pesticides that have relatively lowgeneral toxicity but are carcinogenic, the carcinogen component of the CTItends to dominate.
Table 3 also displays CU’s Chronic Toxicity Index for pesticidesdetected in the PDP, and the factors used to calculate the CTIs.
(2) Calculating Toxicity Indices for Specific Foods
Using our ATI and CTI for each chemical, and the PDP data, we cancompute a Toxicity Index (TI) for each category of food tested, based on theamounts of residues of different pesticides found in that food.
For example: The PDP tested 502 samples of U.S.-grown apples in1996. The analysis detected residues of 37 different pesticide chemicals inthose apple samples. The PDP data show us which chemicals were detected,how often (i.e., in how many of the 502 samples) each was detected, and at

10
what levels they were detected in each sample. The PDP data provide thisinformation on all the pesticide residues found in all 27 of the foods and insamples from each country of origin, in each year we examined. Overall,there are about 1,300 unique combinations of specific pesticides in specificfoods from specific countries in specific years.
For each of those 1,300 combinations, we calculated frequency ofdetection (percent positive for the specific chemical) and the mean residue(the average residue level in the positive samples.) We then used thosevalues, and the ATI and CTI for each individual pesticide, to compute an ATIand a CTI for each of the 1,300 combinations.
For example, for each of the 37 pesticides found in U.S. apples in1996, we calculated an Acute Toxicity Index by multiplying the percentpositive for a particular chemical in those apple samples, times the meanresidue, times the chemical’s ATI. We repeated the same process, usingeach chemical’s CTI, to get the Chronic Toxicity Index for each pesticidefound on the apples.
We repeated these steps for all 1,300 combinations of chemicals onfoods from a given country in a given year. When this step was completed,we had 1,300 ATI scores and 1,300 CTI scores.
Before we could combine the ATI and CTI scores into a single TI foreach individual chemical/food/country of origin/year combination, we had toconvert them to the same scale. We standardized the two sets of numbers byconverting them to a percent scale. Through this step, all but a few “outlier”values in the ATI and CTI data sets were expressed as numbers between 0and 100.1
After standardizing the ATI and CTI indices to the 100-point scale, wecombined the indices for each individual food/country-of-origin/chemical/year combination into a single Toxicity Index using the formula TI = ATI +2CTI. That is, we gave chronic toxicity twice as much weight as the acute
1 The initial strategy in our standardization step was to make 100 the highest score on both the ATI andCTI scales, expressing all other values as a percent of the maximum. However, there are a few extremevalues in each set. If we had simply used the highest score in each set as our divisor (i.e., fixed the top ofthe scale at 100), the rest of the values would have been compressed into a narrow range, e.g., about 0-6on the 100-point scale for the CTI values. We addressed this problem by choosing a representative veryhigh score as the divisor, and allowing a few outliers to have scores greater than 100. Less than 1 percentof the raw ATI and CTI scores exceeded 100.

11
toxicity component. We believe this weighting is appropriate for assessingdietary exposure to pesticides.
To get a TI value for a given food/country-of-origin/year, we thenadded the TI values for all the pesticides detected in that specific category.For example, the TI for U.S. apples tested in 1996 is the sum of the TI’s forthe 37 individual pesticide chemicals found on those apples that year.
TI scores for all the food/country-of-origin/year combinations coveredin our analysis are summarized in Table 4.
(3) Examining “Risk Drivers” For Specific Foods
The overall TI for a particular food from a particular country in aparticular year indicates the aggregate amount of pesticide toxicity that thefood carries. The component TI’s for the individual chemicals detected inthat food indicate how much each pesticide contributes to the food’s overalltoxicity loading.
In most cases, a small number of pesticide chemicals accounts for mostof the toxicity loading. For example, U.S. apples tested in 1996 had a TI of550, and 37 different pesticides contributed to that overall score. But justthree—the insecticides methyl parathion and azinphos-methyl, and thefungicide diphenylamine—have a combined TI of 407, or 74 percent of thetotal TI. For U.S. fresh peaches, methyl parathion alone accounts for over90 percent of the total TI in each of the three years tested.
We call pesticide residues that account individually for large fractionsof a food’s total toxicity loading risk drivers. Table 5 shows the componentTI’s of all the individual chemicals detected in each of the tested foods. Thistable shows which chemicals are risk drivers and which are minor factors inthe overall TI’s of different foods from different countries.
C. Some Data-Analysis Issues
The overall TI for any particular food category is the sum of a group ofTI’s for individual chemicals found in that food, and each chemical’s TI, inturn, depends in part on the mean residue level of the chemical in samples of

12
the food. Residue levels for individual chemicals can vary widely fromsample to sample of a food, and an average residue may result from a widerange of different values. If the number of samples is small (as it is for someof the imported PDP food categories), one or two samples with an extremelyhigh residue level or with a very toxic pesticide could skew the resulting TIscore. When TI scores are determined by rare or somewhat random events,apparent differences might be due to chance, and not likely to represent whatwould be seen if one looked repeatedly at the same comparisons.
For example, U.S.-grown potatoes were analyzed in two years of thePDP. The TI in 1994 was 191; in 1995 it was 59. Did pest management onpotato farms improve markedly? Probably not. Table 5 shows 688 samplesof potatoes were tested in 1994, but only 36 of those samples were tested fordieldrin. Four of the 36 were positive for this very toxic insecticide, whichwas banned in the 1970s, but persists in some soils. The TI value for dieldrinalone accounts for 73 percent of the total TI for potatoes in 1994. Dieldrinwas not detected in any of 702 1995 samples. Two possibilities exist: The1994 sampling may have overstated the presence of dieldrin in potatoes, orthe 1995 sampling may have understated it. But it seems quite likely that,despite the large number of samples, the two years’ data do not comparablyrepresent the occurrence of dieldrin in potatoes, and that the large decline inTI’s from one year to the next is a spurious difference, not a real change.
In conducting our analysis, we sought to determine whether anydifferences and trends in TI’s shown in Table 4 might be due to chance, or tothe random occurrence of certain rare, highly toxic residues. To reduce thelikelihood of such skewing effects, we applied a “rule of 10” to the data. Weexcluded data for a food from a specific country in a given year if the PDPtested fewer than 10 samples of that food/country/year combination. And,within larger data sets, we excluded from our TI calculations residue data forwhich less than 10 samples of a food/country/year were tested.
We also used a variety of other information at hand, such as USDApesticide use data, to assess whether the patterns we saw in the residue datamade sense. Our bottom line: We believe the differences shown in Table 4are real. However, where sample size (see Table 1) is small, comparativelysmall differences (of 10-20 points or less on the TI scale) between scores fordifferent foods are not very meaningful, statistically. Large differences, andscores based on large sample sizes, are not subject to this caveat.

13
RESULTS AND DISCUSSION
A. Comparative Toxicity Loading of Different Foods
The TI values for different foods shown in Table 4 range from 0.01 to5,376—a range of more than 500,000-fold. However, the majority of valuesfall between 10 and 300 on the TI scale. The scale is relative, and there is nofirm dividing line between “acceptable” and “excessive” degrees of pesticidetoxicity loading. Nevertheless, in our judgment, values of less than 10 can beconsidered very low toxicity loading, i.e., the food is very “clean.” Valuesabove 100 indicate “high” toxicity loading, increasingly serious as scores getlarger. TI values between 10 and 100 fall on a continuum rising from “low”through “moderate” toxicity loading.
Foods with the lowest TI scores include:
Canned/Frozen Sweet Corn (U.S., 1995) 0.01Canned/Frozen Sweet Corn, (U.S., 1994) 0.02Milk (U.S., 1996) 1Milk (U.S., 1997) 1Broccoli (U.S., 1994) 2Orange Juice (U.S., 1997) 2Bananas (Imports, 9 countries, 1994) 3Bananas (Imports, 7 countries, 1995) 4Canned Peaches (U.S., 1997) 5Canned/Frozen Peas (U.S., 1994) 6Grapes (Mexico, 1994) 10Apple Juice (U.S., 1996) 11Apple Juice (Mexico, 1997) 12Apple Juice (Germany, 1997) 13Apple Juice (Argentina, 1996) 18Apple Juice (U.S., 1997) 20
Corn, bananas and peas all have an inedible exterior husk, which tendsto keep pesticide residues away from the edible portions of the foods.Processing typically further reduces residues. Only three of 1,015 samples ofcorn tested in two years had any detectable residues. The very low score forU.S. broccoli reflects the rarity of residues in that food; the two mostfrequently detected insecticides were each found on less than 2 percent of

14
659 samples. Apple juice (imported and domestic) typically has only lowresidues of a few pesticides. The score for canned peaches, which is 1/1,000that for fresh peaches, reflects effects of processing, a longer time betweenharvest and consumption, and differences in pest management on peachesgrown for processing as opposed to those grown for the fresh market (seeSection F, below).
A few other foods had scores nearly as low as those listed above:Frozen/canned peas tested in 1995-96 (TI’s of 22 and 21); frozen wintersquash from Mexico (1997, 21); orange juice from Brazil (1997, 23); freshwinter squash from Honduras (1997, 23); U.S. sweet potatoes (1997, 25);Canadian tomatoes (1997, 26); and wheat (1995-97, 18, 29 and 32).
The highest Toxicity Indices (those over 100 on our TI scale), listed indescending order, were for the following foods/origins/years:
Fresh Peaches (U.S., 1995) 5,376Fresh Peaches (U.S., 1996) 4,848Fresh Peaches (U.S., 1994) 4,390Frozen Winter Squash (U.S., 1997) 3,012Fresh Winter Squash (U.S., 1997) 1,706Grapes (U.S., 1994) 1,552Fresh Spinach (Mexico, 1996) 623Apples (U.S., 1994) 567Fresh Spinach (U.S., 1995) 554Apples (U.S., 1996) 550Frozen/Canned Green Beans (U.S., 1997) 529Apples (U.S., 1995) 521Fresh Spinach (U.S., 1996) 495Fresh Peaches (Chile, 1996) 471Pears (U.S., 1997) 435Pears (Chile, 1997) 415Fresh Peaches (Chile, 1994) 381Fresh Peaches (Chile, 1995) 366Fresh Spinach (U.S., 1997) 349Grapes (Chile, 1996) 339
Grapes (U.S., 1995) 329Apples (New Zealand, 1994) 298
Fresh Green Beans (U.S., 1994) 294Apples (New Zealand, 1996) 284

15
Apples (New Zealand, 1995) 260Fresh Spinach (Mexico, 1997) 256Celery (U.S., 1994) 255Grapes (Chile, 1995) 241Grapes (U.S., 1996) 228Fresh Green Beans (U.S., 1995) 222Frozen/Canned Green Beans (U.S., 1996) 222Canned Spinach (U.S., 1997) 204Pears (South Africa, 1997) 201Potatoes (U.S., 1994) 191Grapes (Chile, 1994) 181Grapes (South Africa, 1996) 169Tomatoes (Mexico, 1997) 159Pears (Argentina, 1997) 157Oranges (U.S., 1994) 138Carrots (Mexico, 1995) 136Tomatoes (Mexico, 1996) 123Lettuce (U.S., 1994) 122Fresh Spinach (Mexico, 1995) 103
Seven crops (peaches, apples, pears, grapes, winter squash, spinachand green beans) appear among the highest TI scores repeatedly, with scoresabove 200 essentially every time they were tested. For all but green beansand winter squash, imports and U.S. samples both have high (though oftennot equally high) TI scores. In most cases, the consistently high scores areattributable to the insect problems typically associated with growing thesecrops, and to the insecticides (mostly organophosphates) used on them. (SeeSection H, below, for further details.)
B. Illegal Residues
Only 1 percent of the residues detected by the PDP in 1994 violatedthe legal limits, or tolerances, established by the U.S. EPA for the specificpesticides on the specific foods in which they were detected. In 1995 and1996, the violation rate was about 4 percent, and in 1997 it was 5 percent.Spinach was tested in the latter three years, and in 1995 and 1996, more thanhalf of the violative residues were on spinach (a situation that improved in1997). There were no noteworthy differences in violation rates between U.S.and imported samples.

16
Most violations (95 percent or so of the illegal residues each year) donot involve residue levels that exceed a legally permitted maximum level.Instead, most illegal residues are pesticides detected on foods on which theyare not registered for use with the EPA. Such violations can occur because ofresidues left in soils from past uses on other crops, and from “drift,” wind-blown contamination of a field by pesticides applied legally to a different cropon adjacent fields.
However, some residues show up consistently in a significant fractionof samples of a crop on which they are not registered for use, at levels quitesimilar to those found in crops on which the chemical is legally registered foruse. This strongly suggests that some growers used the pesticide, eventhough it is not legally registered for use on that crop. We found this kind ofpattern of significant illegal use of several insecticides on spinach. At leastone illegal residue was present in about 25 percent of spinach samples in1995 and 1996, and many samples had residues of more than one illegally-used pesticide. In 1997, the violation rate was about half as high as in thetwo previous years, but still far greater than for other foods.
Some residues of pesticides banned years ago still show up in foods.Chlorinated hydrocarbon insecticides, such as DDT, dieldrin and chlordane,all banned from food uses in the 1970s, are very persistent in soil, and someagricultural land is still contaminated with them. For example, DDT and itsbreakdown product DDE are found in carrots, sweet potatoes and potatoes,and dieldrin was detected in 74 percent of tested samples of frozen, and 37percent of fresh, winter squash. Such persistent banned pesticides have notolerances, but the Food and Drug Administration has set “action levels,” orlimits above which the FDA considers these residues too high to allow thefoods on the market. None of the dieldrin, DDT or other residues of bannedorganochlorine insecticides violated action levels. But these “legal” residuescan contribute substantially to the toxicity loading of the foods in which theyoccur.
C. Health Implications of Differences in Pesticide Toxicity Loading
What is the health significance of a high TI score? The only solidscientific answer to that question is, we are not sure. Pesticides, of course,are poisons; they are designed to kill living organisms. It is certain that all

17
pesticides can have adverse health effects on people at a high enough level ofexposure. The critical question is whether exposure associated with theresidues found in foods is low enough to ensure an adequate safety marginbetween actual exposures and levels that can cause health damage.
Exposures Above Official “Safe” Levels. The Reference Dose (orRfD, defined on page 8), is generally regarded as a science-based estimate ofa presumably “safe” daily intake for an individual pesticide. While there isroom to debate that view—not all RfD’s may adequately account for thehigher vulnerability of children, for instance—let’s stipulate for now that anRfD is a definition of “safe” pesticide exposure. In that case, the PDP dataprovide some striking evidence that safety margins are not adequate.
For example, the average methyl parathion residue on U.S. peachestested in 1994-96 was 0.055 parts per million. At that concentration, a 100-gram peach would contain 5.5 micrograms of methyl parathion. The currentEPA RfD for methyl parathion is 0.00002 mg/kg/day (or 0.02 ug/kg/day,since 1 mg = 1,000 ug). That means a 20-kg (44-pound) child should notconsume more than 0.4 micrograms per day of this insecticide. Eating justone medium-sized peach with an average methyl parathion residue, though,would give that 20-kg child a dose of this intensely neurotoxic insecticidealmost 14 times higher than the RfD.
In fact, even the lowest methyl-parathion residue found on peaches in1996, the most recent year tested, 0.004 ppm, would still deliver a ReferenceDose of the insecticide to a 20-kilogram child who ate a 100-gram peach.Methyl parathion was found on 41 percent of U.S. peaches in 1996. Thismeans roughly two of every five children who eat a U.S. peach will exceedthe RfD for methyl parathion by eating that single food item. The maximummethyl parathion level the PDP found on peaches in 1996, 0.5 ppm, woulddeliver 125 times the RfD, and the highest 10 percent of residues all exceed35 times the RfD.2
2 The PDP did not test fresh peaches in 1997, so 1996 data are the most recent available. However, dataon pesticide applications (from another branch of USDA) suggest that total pounds of methyl parathionused on peaches declined 44 percent from 1995 to 1997. The Food and Drug Administration’s pesticideresidue testing program tested fresh peaches in 1996 and 1997. FDA data show a 34 percent decrease infrequency of detection of methyl parathion in peaches (from 28 percent in 1996 to 18 percent in 1997.)However, the same data show that the mean residue of methyl parathion on peaches increased five-fold,from 0.04 ppm in 1996 to 0.21 ppm in 1997. This suggests that methyl parathion use patterns on peachesmay have shifted to fewer applications, but closer to harvest time. The FDA’s sample size is smaller (only35 samples positive for methyl parathion), and we consider the 1996 PDP data the best indicator of thecurrent status of methyl parathion residues in peaches. A new PDP look at peaches would be valuable.

18
Methyl parathion on peaches is perhaps an extreme example, but is farfrom the only case in which a young child can ingest more than a safe dose(i.e., more than the RfD) of a specific pesticide by eating a single serving of aspecific food. Table 6 highlights some pesticide/crop combinations andshows how often they can deliver an unsafe dose. For instance, dieldrin wasfound in 37 percent of fresh winter squash and 74 percent of frozen wintersquash samples tested for it in 1997. The majority of positive samples hadresidues high enough to give a 20-kg child more than the RfD of dieldrin in a100-gram serving of squash. The odds of this occurring are 28 percent forfresh squash, and 48 percent for frozen squash. Grapes from Chile tested in1996 contained residues of the organophosphate insecticides chlorpyrifos,dimethoate and omethoate, each at levels sometimes high enough to exceedthe respective RfD's. The combined odds (i.e., the chance that a 20-kg childeating 100 grams of Chilean grapes would exceed the RfD for at least one ofthe three) are about 10 percent. Similarly, if that child were to eat 100 gramsof fresh spinach, the odds are about 1 in 12 that he or she would exceed theRfD for dimethoate, omethoate or methomyl.
While odds like 1 in 12 or 10 percent may not seem very large, thereare 20 million children under the age of six years in the United States. Thelikelihood that one of every 10 children who eats Chilean grapes, four of tenwho eat U.S. peaches or half of those who eat frozen U.S. winter squash willget more than the theoretically “safe” dose of a very toxic insecticide, is not atrivial concern. And these simple calculations ignore the fact that children(and most everyone else) eat many different foods in a day, several of whichmay expose them to residues that could have additive effects.
In theory, RfD’s have safety factors built into them, and eating a foodthat exceeds the RfD for a pesticide does not automatically mean a child willsuffer adverse effects. But the public needs to be confident that the levels ofpesticides in foods are “safe enough,” i.e., that there is in fact a wide marginof safety between actual exposure and harmful levels, even for children andother vulnerable sub-populations. Clearly, such confidence in the “safetymargin” of current residue levels is not warranted. In fact, if “safe use” isdefined as practices that seldom leave residues that can exceed the RfD, itappears that methyl parathion cannot be used safely on foods that childreneat, and that winter squash can’t be grown safely on dieldrin-contaminatedcroplands.

19
What about exposures that don’t exceed the RfD? While manypeople assert that the levels of pesticides in foods are generally too small tohave any adverse effects, there is no scientifically credible way to rule out therisk of subtle harmful effects in at least some fraction of the exposedpopulation. Not all forms of health damage are readily measurable. It is alsovery difficult to assess possible interactive effects of multiple residues foundin the variety of foods consumed in a typical day.
Young children, and fetuses, are more sensitive to toxic effects ofchemicals than adults are, because the young are growing and developingrapidly, processes that are vulnerable to disruption by toxic agents. Sinceyoung people’s bodies are smaller than adults’ bodies, children get greaterdoses of residues by consuming a given food than an adult would. Childrenalso eat fewer foods, and eat more of certain foods that tend to be relativelyheavily contaminated with pesticides, than adults do. Most insecticides arenerve poisons, and a central concern is potential damage to the developingnervous system. Current scientific knowledge is generally inadequate todefine exposure levels that are free of risk of adverse developmental effectson the nervous system. RfD’s are typically based on tests on adult animals;most pesticides have not been fully tested for effects on immature animals.These gaps in scientific knowledge suggest that a cautious attitude towarddietary pesticide exposure, even at relatively “low” levels, is quite sensible.
While we cannot draw a clear line between “safe” and “unsafe” on ourToxicity Index, risk associated with dietary exposure to pesticide residues isrelative. Higher toxicity loading scores clearly represent greater risks thanlower scores, and in our judgment, differences of the magnitude shown hereare meaningful. Excluding the extremely low scores for canned corn, therange of TI values for foods tested by the PDP over this four-year span ismore than 5,000-fold. Consumers are justified in wanting to minimize theirexposure to pesticides through food choices. Our TI values can help guidethem to sound choices that can measurably reduce the risk of harm.
D. Multiple Residues
One of the reasons pesticide risk assessment is so difficult is that theaverage person’s daily diet consists of many different foods, and many ofthose foods contain pesticide residues. People are not exposed to a singlepesticide chemical at a constant dose level, the way laboratory animals are in

20
toxicity tests; instead, they consume a constantly changing mixture of manydifferent pesticides at variable levels.
The PDP data make this multi-chemical exposure picture very clear.PDP analyses show that as many as five or six different pesticides typicallyare detected in 10 percent or more of most crops, and for many foods, it is“normal” for individual samples to have multiple residues. Table 7 showsthe frequency of detection of multiple residues in the individual samples ofdifferent foods tested by the PDP in 1996. The median number of residues(that is, the number for which half the samples had fewer and half had moreresidues) on tomatoes and oranges was one, while the median apple samplehad four residues, and the median peach sample had three residues. Threepercent of apples had eight or more different residues. And one sample ofspinach had a whopping 14 different pesticides on it.
The data in Table 7 suggest that a person whose meals in a given dayincluded apple juice, a salad with carrots, spinach and tomato, some greenbeans and a peach, would be exposed to 10 different pesticide residues, ifthose foods had typical (median) contamination patterns.
E. Differences Between Imported and Domestic Foods
One interesting question is whether imported foods have higher TIscores, indicating greater loading of pesticide toxicity, than domesticallygrown samples of the same crops. U.S. agricultural interests have argued thatstricter U.S. regulations on pesticides in foods (which may be required as theU.S. EPA implements the Food Quality Protection Act of 1996) will hurt U.S.growers in the world market. Growers in other countries, facing fewerrestrictions on pesticide use, the argument goes, can produce foods morecheaply. An implication of this argument is that imported foods may be moreheavily contaminated with pesticide residues.
While U.S. government and agribusiness spokespeople are fond ofboasting that “The U.S. has the safest food supply in the world,” the USDAhas also stated that there are no meaningful differences in pesticide residueproblems between domestically-grown and imported foods. Our analysis ofthe PDP data tells a different story.

21
One way to compare U.S. and imported foods is to see which grouphas consistently higher Toxicity Indices. The list of foods with highest TIscores, on page 14 above, shows 12 food/country/year cases that have TI’sgreater than 500. Eleven of those 12 cases are U.S.-grown foods. The oneimported food among the top dozen (Mexican spinach in 1996) had muchlower scores the other two years it was tested. Foods that might fairly becharacterized as “loaded” with pesticide residues, based on our ToxicityIndex, are almost all “Made in the USA.”
Table 1 shows 39 cases in which more than 10 samples of a specificfood imported from a specific country were tested; we used a sample size of10 as our cut-off for comparing imports and larger numbers of U.S. samples.Of those 39 U.S./import comparisons, Table 4 shows that U.S. samples hadhigher Toxicity Indices in 26 cases (67 percent). Again, the available datafail to support the hypothesis that imported foods in general are more likely tobe contaminated with pesticides.
However, as Table 4 also shows, there are notable differences fromcrop to crop. In a few cases, imports have consistently higher TI values; inmore cases, U.S. samples have consistently higher values; and occasionally,there is no consistent pattern (U.S. TI’s are higher one year, and importedTI’s higher the next). The size of the difference between U.S. samples andimports also varies from food to food. Let’s look at some specific cases:
Cases in which U.S. samples have higher TI scores:
Peaches. The U.S. TI values over three years of testing exceed the TIvalues for imports from Chile by more than 10-fold.
Winter Squash. For fresh samples of this vegetable, U.S. samples hada TI 42 times as high as that of Mexican samples. For frozen products, theU.S. score was 143-fold higher than that of Mexican samples.
Apples. The TI values for U.S. apples over a three-year testing spanare consistently about twice as high as those for apples from New Zealand,the leading source of imports. The number of imported samples is small, butthe consistency of the scores from year to year and the consistent pattern ofresidues (i.e., the same three insecticides account for most of the score in allthree years for both sets) suggest that this is a real difference.

22
Pears from four countries were tested in 1997. The U.S. had thehighest TI. Pears from Chile had a marginally lower TI, and those from SouthAfrica and Argentina had TI’s less than half that of U.S. samples.
Fresh Green Beans. In both years sampled, TI’s for U.S. sampleswere substantially higher than those for Mexican samples, by ratios of about3-fold and 6-fold in 1994 and 1995, respectively.
Oranges. Imports from Australia in 1995 had a TI 3/4 as large as thatof U.S. oranges tested that year.
Apple Juice. Scores for apple juice from all countries are quite low.In 1997, imports from Germany and Mexico had TI’s lower than that of U.S.apple juice. (Imports from two other countries had TI’s higher than that ofU.S. juice, though; see below.)
Grapes. Imports from Mexico had consistently much lower TI’s thanU.S. grapes had, in three years of tests. South African grapes, tested in 1996only, also had a modestly lower TI than U.S. grapes did that year. (TI’s forgrapes from Chile, the leading source of imports, present a more complexpicture; see discussion below.)
Tomatoes. Canadian tomatoes tested in 1997 had a TI half as large asthat for U.S. tomatoes that year. (However, Mexican tomatoes had a muchhigher TI than either U.S. or Canadian samples did; see below.)
Cases in which imported samples had higher TI values:
Carrots. Canadian imports had consistently higher TI scores over thethree years tested. In two of those years, the Canadian TI’s were about twiceas high as the US TI’s. In 1994, the difference was very small. Carrots fromMexico, tested in 1995 only, had a TI substantially higher than Canadian andU.S. samples.
Tomatoes. Mexican tomatoes tested in 1996 had about twice the TIof U.S. tomatoes. In 1997, the gap widened to about three-fold.

23
Broccoli. Mexican samples, tested only in 1994, had a TI more than20 times higher than U.S. samples (but the U.S. score was a very low 2).
Apple Juice: Imports from Hungary and Argentina in 1997 had TI’shigher than the U.S. TI that year. Juice from Argentina also had a higher TIin 1996. Since all of these TI values are relatively low, the differences arenot very meaningful.
Orange Juice. U.S. samples tested in 1997 had a very low TI of 2,while Brazilian samples had a 23; but, again, 23 is still a comparatively lowscore.
Cases where the U.S. samples had higher scores in some years andimported samples had higher scores in other years:
Fresh Spinach. U.S. samples had high scores of 554 in 1995, 495 in1996 and 349 in 1997. Mexican samples had a moderately high TI of 103 in1995, a very high 623 in 1996, and a 256 in 1997. Small sample size for theimports limits the precision of the Mexican TI’s. If all three years’ data arecombined, the average U.S. TI is 460, and the Mexican average is 327.
Grapes. The comparison of U.S. grapes with imports from Chile isvery interesting. In 1994, the TI for U.S. samples was almost 9 times that ofChilean grapes’ TI, but by 1996 Chilean grapes had a significantly higher TIthan domestic grapes. (This is most likely a valid long-term trend reflectingreduced pesticide use in U.S. grape production; see Section G, below.)
F. Differences Between Fresh and Processed Foods
The PDP data we examined include 16 fresh fruits and vegetables, and8 processed fruits and vegetables (plus milk, wheat and soybeans).
The processed foods include apple juice, orange juice, and frozen orcanned varieties of corn, sweet peas, green beans, winter squash, spinach,and peaches. Fresh samples of six of these foods were also tested, makingcomparisons between fresh and processed versions possible.

24
In general, processed foods have lower levels of pesticide residues thancomparable fresh foods. Growers who have contracts with processors oftendon’t need to ensure that their foods are cosmetically perfect, and this allowsthem to omit some pesticide treatments, including some late-seasoninsecticide applications. Many processors, responding to consumer demandfor foods with minimal pesticide residues, have contracts with growers thatspecifically limit pesticide applications. Processing itself also often involveswashing, peeling and cooking the food, steps that all tend to reduce pesticideresidues.
Two of the processed foods tested in the PDP years we examined donot have unprocessed varieties for comparison, but both (corn, and sweetpeas) have quite low TI scores. (However, the score for peas increased by250 percent from 1994 to 1995-96; see “Trends,” below.) The other casesshow some very interesting differences among the specific foods.
Peaches. The TI for canned peaches in 1997, was 5, an astonishing1,000-fold lower than scores for fresh peaches grown in the U.S., and 100-fold lower than the TI’s for imported peaches from Chile. This differencereflects different pest management needs and practices between peachesgrown for canning and those grown for the fresh market. Orchardists whoproduce cling peaches for canning grow a different variety than those grownfor the fresh market, one that has somewhat less severe pest problems. Thefruit doesn’t need to be cosmetically perfect, and many canners forbid the useof certain pesticides, including methyl parathion (which was not found in anyof the 745 samples of canned peaches the PDP tested in 1997). Theprocessing itself involves a vigorous wash that scours off the peaches’ skinand removes most residues, and the long span of time between harvest andconsumption allows further breakdown of any residues that remain.
Differences for other processed foods were less dramatic than that forpeaches, but still noteworthy:
Apple Juice. TI scores for 1997 U.S. samples are more than 25-foldlower than those for U.S. fresh apples (in 1996, 50-fold lower). Importedapple juice from Argentina, Hungary, Germany and Mexico had TI scoresranging from about one-twentieth to about one-eighth that of fresh applesfrom New Zealand.

25
Orange Juice. The TI for U.S. orange juice, first tested in 1997, is anextremely low 2, roughly 25-fold lower than the TI for U.S. fresh orangestested in 1996 and 70-fold lower than that of 1994 oranges. Orange juicefrom Brazil had a score half as high as that of U.S. fresh oranges (Brazilianfresh oranges were not tested).
Canned Spinach from the U.S., first tested in 1997, had a high TI of204, but that is less than half of the average TI for fresh U.S. spinach tested in1995 through 1997.
The remaining two cases are exceptions to the general rule thatprocessed foods tend to have lower pesticide residues:
Frozen/Canned Green Beans grown in the U.S., tested in 1996 and1997, had TI’s of 222 and 529. Fresh U.S.-grown green beans scored 294 in1994, and 222 in 1995. (Unfortunately, no fresh green beans were tested in1996 or 1997.)
The scores for the processed beans are much higher than expected for aprocessed food, given the scores for the fresh commodity. Table 5 showsthat the high scores are explained primarily by residues of methyl parathion inthe frozen/canned green beans. No methyl parathion was detected in anyfresh green beans in 1994 or 1995. In 1996, this insecticide was found in 3.4percent of the frozen/canned samples, and accounted for 49 percent of the TIscore. In 1997, it was found in 4.6 percent of samples, the average residuelevel three was times as high as in 1996, and it contributed 82 percent of thescore. These increases in residues are consistent with USDA’s pesticide usedata, which show increasing applications of methyl parathion on U.S. greenbean acreage (See Section I, below, and Table 8.)
The increased score for methyl parathion accounts for all of the jump inscores between 1996 and 1997. Without methyl parathion, the TI’s forfrozen/canned green beans in 1996 and 1997 would have been 113 and 96,respectively. It appears, therefore, that expected lower scores for processedgreen beans were “cancelled out” by increasing use of a very toxic pesticideon this crop.
Winter Squash was tested in 1997 for the first time, and both frozenand fresh varieties were sampled. Both types had extremely high scores, and

26
the score for frozen product was much higher—3,012, versus 1,706 for freshwinter squash. The insecticide dieldrin accounts for 86 to 90 percent of thetotal score in each case. Dieldrin, a chlorinated organic pesticide banned inthe U.S. in the 1970s, is very persistent in soil, and is taken up through theroots by some crops—including winter squash varieties. Producers of somepart of the U.S. winter squash crop seem to be farming lands with a history ofdieldrin (or aldrin, which breaks down to dieldrin) applications. Frozensquash has a higher score because dieldrin was detected in 74 percent of thesamples, versus in 37 percent of the fresh samples (mean residue levels wereroughly comparable).
G. Trends
One very interesting question that the public might look to the PDPdata to answer is whether the overall problem of pesticide residues in foods isgetting better, or getting worse. Unfortunately, the PDP was not designed toanswer that question. The foods tested change from year to year, and thatmakes it difficult to track trends, even for individual crops. If one adds up theTI values for all crops tested year to year, the total has declined slightly overthe four years we examined. But the total is the sum of the TI’s for differentcrops in different years, and TI values among crops vary widely. Any “trend”may therefore result more from the crops chosen for testing than fromimprovements in the overall pesticide residue picture.
No foods were tested in all four years that we examined. Seven foodswere tested in three consecutive years (apples, carrots, grapes, oranges, peasand peaches, all tested 1994-96, and fresh spinach, tested 1995-97). If onecompares the total TI for the six U.S.-grown crops tested from 1994 through1996, there is an apparent downward trend, from 6,717 in 1994 to 6,326 in1995 and 5,749 in 1996, a decrease of 14 percent over the three years. Butthat “trend” is almost entirely attributable to the change in TI scores for U.S.grapes, which dropped from 1,552 in 1994 to 329 in 1995 and 228 in 1996.If grapes are excluded, the total score for the other five U.S. crops increasedby 7 percent over this three-year period.
It is more instructive to examine the specific crops on which there arethree years of data:

27
Apples. There is no notable overall trend. Total TI values heldrelatively steady over the three-year test period, for both U.S. samples andimports. In both cases, a small cluster of individual pesticides is responsiblefor the bulk of the total TI in all three years (see Table 5).
Carrots. There was a slight downward trend (-17 percent) for U.S.samples, and a slight increase (15 percent) for Canadian samples, althoughthe number of imported samples is too small to be sure that this apparenttrend is real.
Grapes. There is a steep decline in the TI’s for U.S.-grown grapes,from 1,552 in 1994 to 228 in 1996. We believe this reflects actual changes inpest-management practices among U.S. grape producers. In recent yearsgrape growers have made great strides in adopting less chemical-intensiveintegrated pest management strategies. Comparing the TI factors for theindividual pesticides found on grapes (Table 5), the percent positive andmean residue levels for the insecticides methyl parathion, azinphos-methyland dimethoate all declined substantially in U.S. grapes from 1994 to 1996.These trends account for most of the decline in the TI scores, and they areconsistent with trends in pesticide use data on the crop. We believe the PDPdata do show a major reduction in the toxicity loading of U.S. grapes overrecent years.
Individual components of the overall TI (Table 5) also explain theupward trend in TI values for Chilean grapes (from 181 in 1994 to 339 in1996). Three insecticides (dimethoate, omethoate and chlorpyrifos) and thefungicide iprodione all increased substantially in frequency of detection inChilean grapes over the three-year span. Overall, the pattern is consistentand suggests that the trend is real, at least for these three years.
Oranges. The TI’s for U.S. samples declined from 138 in 1994 to 38in 1995, then rose to 49 in 1996. The insecticide formetanate hydrochloridewas detected in 10.6 percent of 663 samples tested for it in 1994, and its TIvalue was 107, or 77 percent of the total for the food. In 1995, the samechemical was found in only 3.5 percent of samples and the average residuewas only one-fifth as high as the year before, and in 1996 no formetanatehydrochloride was detected in any of the 511 samples tested. This change inthe residue pattern for one pesticide accounts for most of the decline in TIvalues for oranges. (A higher mean residue level for the fungicide imazalilaccounts for the rise from 1995 to 1996.) While short-term trends in pest

28
problems may account for the decline in use of formetanate hydrochloride,this pesticide is very toxic and ecologically disruptive, and orange growershave been working hard at finding safer alternatives to its use. The trend inresidue data shown here is a hopeful sign that their efforts are succeeding.
Peaches. No real trend is apparent in the very high TI values for theU.S. peaches tested from 1994 through 1996. The scores rose from 4,390 in1994 to 5,376 in 1995 and dropped back to 4,848 in 1996. One pesticide, theinsecticide methyl parathion, accounts for more than 90 percent of the total TIfor this food in all three years. While the frequency of detection wasconsistent from year to year, the average residue level rose in 1995 and thendropped somewhat in 1996, driving the changes in the overall TI score.
On the basis of USDA pesticide use data, it appears that applicationsof methyl parathion on U.S. peaches declined sharply between 1995 and1997. But residue data from the Food and Drug Administration’s (FDA)testing program show a five-fold rise in the mean methyl parathion residue onpeaches from 1996 to 1997. This suggests, perhaps, that while fewer poundswere applied, applications were made closer to harvest, resulting in higherresides. The FDA tests far fewer samples than the PDP does. Given thesecomplex and limited data, it is not possible to project a trend in methylparathion residues in U.S. peaches beyond 1996. It would be valuable for thePDP to sample this crop again in the near future.
The TI values for imported peaches from Chile tested from 1994 to1996 show a slight drop in 1995, then a big increase in 1996. TI values forthe individual pesticides found on Chilean peaches show that the same twochemicals, iprodione and azinphos-methyl, account for over 70 percent of thetotal TI each year. The decline from 1994 to 1995 is attributable mainly to adrop in the average residue level for azinphos-methyl (which remained lowerin 1996, although the percent of samples positive for this insecticide rose 50percent over the three years.) The increase in 1996 is attributable primarily toa 34 percent increase in the average residue level for iprodione. Ourconclusion: These year-to-year changes probably represent responses todiffering pest problems in the three years, rather than an underlying trend.
Green Beans. Fresh green beans grown in the U.S. were tested in twoyears, 1994-95; frozen/canned green beans from the U.S. were tested in thenext two years. While these two foods differ and their TI values are notstrictly comparable, they are the same crop, and one very interesting trend in

29
residue patterns emerges. No methyl parathion was detected in any samplesof fresh green beans in 1994 or 1995. But this very toxic insecticide showedup in frozen/canned green beans in 1996, and both its frequency of detectionand mean residues increased from 1996 to 1997. Methyl parathion residuesalone account for the rise in the TI from 222 in 1996 to 529 in 1997. Sincethese changes correlate strongly with USDA pesticide applications data formethyl parathion on green beans, we believe this trend is real.
Peas. The TI value for frozen/canned peas was a very low 6 in 1994,but increased to 22 and 21 in the next two years. As in the case of greenbeans, the explanation is use of methyl parathion on this crop. No sampleshad methyl parathion residues in 1994, and it was detected in only 1 percentof the samples in 1995 and 1996. But this insecticide still accounts for halfthe total TI for peas in both of the latter years, small as those totals are. Heretoo, residue patterns match use data trends for methyl parathion on peas.
Spinach. U.S. fresh spinach tested in 1995 through 1997 had high butdecreasing TI values, 554, 495 and 349. Imported samples from Mexico hada moderately high 103 in 1995, a very high 623 in 1996, and a 256 in 1997.Since sample size is very small for the Mexican imports (14, 21 and 12), wecan’t make anything of the year-to-year fluctuations there. But the trend inU.S. values is driven by declining scores for permethrin and dimethoate, twoof the top four TI components in each of the three years. The frequency ofdetection for each has held fairly steady, but mean residue levels declined 39percent for permethrin and 71 percent for dimethoate. U.S. spinach growersappear to be making progress toward reducing applications of at least somerisk-driving insecticides on their crop.
Overall, then, we have a mixed bag: There are three cases where TIvalues are declining, most likely due to increased reliance on Integrated PestManagement by growers of the crops (grapes, oranges and spinach). Thereare three cases where residue patterns changed little over three years (apples,peaches and carrots). And there are two cases where Toxicity Indices haverisen sharply because of increasing use of methyl parathion on the crop (peasand green beans). These few data points are interesting, but not sufficient todiscern any overall trends in pesticide residues in the U.S. diet over the four-year period we examined.

30
H. Risk Drivers
Individual crops tested by the PDP contained as many as 37 differentpesticide residues, and several crops consistently had more than 20 differentpesticides detected on them. But in essentially every case, a small number ofspecific chemicals—from one to three or four—accounts for most of the TIscore. We have coined the term “risk drivers” to describe any pesticidechemical that accounts for 10 percent or more of a food’s overall TI in anyyear. The higher the TI value for a food, the more important the role of itsrisk drivers in overall dietary exposure to pesticide residues.
As Table 5 makes clear, the same pesticides tend to be risk drivers inmore than one food, and year after year. For the 27 foods tested by the PDPin the four years we examined, roughly fifteen different pesticides show uprepeatedly as major TI components of multiple foods. From the standpoint ofpolicy, the fact that a few chemicals account for the most toxicity loading inmany foods is important for setting priorities. Exposure and risk can bereduced substantially by focusing on comparatively few pesticide uses on alimited number of high-consumption foods.
In this section, we profile the risk-driving pesticides found in foodstested by the PDP in 1994 through 1997. They are discussed roughly in orderof their overall contributions to toxicity loading on the tested foods.
Parathion-methyl. Also called methyl parathion, this highly toxicorganophosphate insecticide is the leading factor in the TI’s for U.S. grownpeaches (1994-96), U.S. apples (94-96), U.S. pears (97), U.S. grapes (94;second-ranked in 95), frozen/canned green beans (96-97) and frozen/cannedsweet peas (95-96). It is also a notable factor in the TI for U.S. carrots (94)and U.S. wheat (96-97), and a minor factor in imported and U.S. tomatoes(96-97) and U.S. apple juice (97). Often, it accounts for more than half of thefood’s TI, by itself; in peaches, methyl parathion alone contributes over 90percent of the TI’s each year. Methyl parathion was rarely detected onimported produce sampled by the PDP.
In our scoring system, methyl parathion has the highest ChronicToxicity Index of any pesticide detected by the PDP (see Table 3). It has thelowest EPA RfD (0.00002 mg/kg/day) among the organophosphateinsecticides, and the second lowest RfD overall (only heptachlor epoxide’sRfD of 0.00001 is smaller). The very low RfD for methyl parathion is based

31
on animal studies showing adverse effects on the developing nervous systemat very low doses. Methyl parathion is also among the most potent organo-phosphates in terms of its acute toxicity.
In 1998, the EPA reviewed the RfD’s for all members of the organo-phosphate and carbamate families of insecticides, as required by the FoodQuality Protection Act (FQPA). The FQPA says that EPA must make surethat pesticide limits protect children’s health, and requires that the agency addan extra 10-fold safety factor to limits for all pesticides, unless there is asound scientific basis for using a different safety factor. Last August, theEPA issued a preliminary decision in which it applied an additional 10-foldsafety factor to the RfD’s for 11 insecticides. Methyl parathion is among the11; so is chlorpyrifos, another of the top risk-drivers in the foods tested by thePDP. For another 10 insecticides, EPA applied an additional 3-fold safetyfactor. That group includes methamidophos, another risk-driver that weprofile below. For another 27 insecticides, EPA has not decided to apply anyadditional safety factor yet, though that decision may not be final.
Methyl parathion is not a suspected carcinogen, but it is listed as anendocrine disrupter by Colborn et al. (1996). In our scoring scheme, that factincreases its Chronic Toxicity Index threefold. Five of the top 12 risk-driversin our analysis are suspected endocrine disrupters.
Dieldrin. All food uses of this chlorinated organic insecticide werebanned by the EPA in the 1970s, but it persists in soils in some locations.Some crops, notably winter squash, absorb dieldrin into the edible parts of theplant via the roots. Dieldrin accounts for 86 percent of the very high TI forfresh winter squash grown in the U.S., and 90 percent of the even higher TIfor U.S. frozen winter squash, both tested only in 1997. (Winter squash fromMexico tested the same year had minimal dieldrin residues.) Dieldrin was thelargest TI component for U.S. potatoes in 1994, and made smallercontributions to TI scores for U.S. carrots (94), U.S. spinach (95-97), sweetpotatoes (96), tomatoes (97) and soybeans (97).
Dieldrin has a very high CTI in our scoring system (it ranks third,behind methyl parathion and heptachlor epoxide), because it has a very lowchronic RfD (0.00005 mg/kg/day), and it is a potent carcinogen. In fact, thecarcinogenicity component accounts for 80 percent of its Chronic ToxicityIndex. It has not been listed as a suspected endocrine disrupter.

32
Iprodione, the only fungicide among the top risk-drivers, is a leadingcontributor to the TI’s for Chilean grapes (94-96), a major factor in TI’s forChilean and U.S. peaches (94-96), and a somewhat lesser factor in the scoresfor U.S. grapes (95-96) and South African pears (97). It is also detected, atfar lower levels, on green beans (U.S. and Mexican, 94-95) and U.S. carrots(95-96). Iprodione consistently ranks second to parathion-methyl in the TIfor U.S. peaches. The TI contributions for iprodione on peaches range from150 to 229—larger than the TI’s for all residues in many foods.
Iprodione is quite low in acute and chronic toxicity, but it is classed byEPA as a “probable human carcinogen,” which accounts for most of itsChronic Toxicity Index in our scoring system. In 1996, iprodione residueswere found on two-thirds of Chilean grapes, 20 percent of U.S. grapes, andabout 80 percent of peaches from both countries. Widespread use on thesecrops and fairly high average residues (0.8-0.9 ppm, on peaches) explain thischemical’s large contribution to toxicity loading.
Azinphos-methyl. This organophosphate insecticide is the top riskdriver on pears from the U.S., South Africa, Chile and Argentina (1997) andis among the top risk drivers for U.S.-grown and New Zealand apples (1994-96) and for apple juice (domestic and imported, 96). It is one of the biggestfactors in the TI’s for Chilean peaches in all three years, and a much smallerfactor in the TI’s for U.S. peaches. It was a risk-driver for U.S. grapes in 94,but not in later years. It is also used on green beans, spinach and tomatoes,but accounts for a much smaller part of the overall TI in those cases.
Azinphos-methyl, also called Guthion, is almost as acutely toxic asmethyl parathion, but is only 1/75 as toxic on a chronic basis, comparing thecurrent EPA RFD’s for the two insecticides. It is neither a carcinogen nor anendocrine disrupter, based on current knowledge.
Heptachlor Epoxide is a breakdown product of a chlorinated hydro-carbon insecticide, heptachlor. As with dieldrin, DDT and other members ofthis chemical family, heptachlor use on food crops was banned in the U.S.during the 1970s. But residues of these very long-lived pesticides remain insoils, and some crops absorb them through their roots. Among the foods thePDP tested, only winter squash (fresh and frozen), tested in 1997, containedheptachlor epoxide residues, but the TI values (362 for the frozen, 142 for thefresh squash) are as high as or higher than TI’s for all residues combined inmany other foods.

33
Heptachlor expoxide has the lowest chronic RfD of any pesticidedetected by the PDP in these four years, 0.00001 mg/kg/day. It is also apotent carcinogen, but not known to be an endocrine disrupter. These toxicattributes combine to give it the second highest CTI in our system, closebehind methyl parathion (see Table 3).
Methomyl, a carbamate insecticide, is one of the top three TI factorsfor U.S. grapes (94-96), and the top TI factor for Mexican grapes in 1996. Itis an important factor in the TI’s for U.S. lettuce (1994), Mexican spinach(95-97), and U.S. spinach (95-97), and a less important factor in the scoresfor U.S. and Mexican green beans (94). It is also detected on peaches fromChile and the U.S. and on U.S. apples, but contributes only in a very minorway to the TI’s for those foods.
Methomyl’s RfD is 400 times larger than that for methyl parathion(i.e., it is 1/400 as toxic), but it is listed as an endocrine disrupter by Colbornet al., which boosts its Chronic Toxicity Index in our scoring scheme. Inacute toxicity, it is on a par with methyl parathion and azinphos-methyl.
Permethrin. This synthetic pyrethroid insecticide is the predominantfactor in the TI’s for both Mexican and U.S. spinach in 95-97. It is a smallerfactor in scores for celery and lettuce, tested only in 94.
Permethrin is quite low in acute toxicity and is only 1/2,500 as toxic asmethyl parathion, in terms of chronic RfD; it’s the least-toxic pesticide amongthe prominent risk drivers. But EPA classes permethrin as a possible humancarcinogen, which accounts for most of its Chronic Toxicity Index in ourscoring scheme. It dominates the TI for spinach because it was detected on40 to 60 percent of the Mexican and U.S. samples, respectively, and wasfound at relatively high concentrations (averages of from 1.5 to 2.4 ppm inthree years of U.S. samples).
Dimethoate, another organophosphate insecticide, is a top TI factorfor Chilean grapes (94-96), Mexican and U.S. green beans (94), U.S. spinach(96-97), Mexican spinach (96), U.S. lettuce (94), U.S. sweet peas (94-96),U.S. and Argentine apple juice (96-97), and German and Hungarian applejuice (97).

34
Dimethoate, and its breakdown product omethoate (see next profile),are among the more toxic organophosphates, with RfD’s only 25 and 15times greater, respectively, than that for methyl parathion. Neither one isclassed as a carcinogen or an endocrine disrupter, based on current data.
Omethoate. This organophosphate is sometimes used on its own as aninsecticide, but is also a breakdown product of dimethoate, and use of thelatter often explains its presence. It tends to be found on the same foods asdimethoate. It is the leading TI factor for both Chilean (94-96) and Mexicangrapes (94-95), and is one of the top three TI factors for U.S. spinach (95-97)and U.S. processed peas (94-96). It is a major factor in the TI for apple juicefrom Argentina (97) and is also detected on apples, tomatoes, green beansand lettuce, but is a smaller factor in the total TI’s for those foods. Itstoxicity profile was discussed above.
Chlorpyrifos, another organophosphate insecticide, is a risk driver forimported (New Zealand) apples (94-96), and a smaller component of the TIfor U.S. apples in those years. It is also detected in apple juice, and is a topfactor in the score for imported (Argentine) juice in 1996. It is the top factorin the TI’s for Mexican tomatoes (96-97) and U.S. soybeans (97). It is alsoan important component of scores for Chilean grapes (94-96) and U.S. wheat(95-96), and a minor factor in the scores for Chilean and U.S. peaches (94-96), Chilean pears (97) and U.S. sweet potatoes (97). It was found on from 2to 8 percent of fresh spinach samples in 1995-97 (with the lowest rate in 97).It makes only a small contribution to the TI’s for spinach, but its use onspinach is not legally permitted.
Chlorpyrifos is one of the more toxic organophosphates, with an RfD(including the FQPA-mandated extra 10-fold safety factor) only 15 times aslarge as that for methyl parathion. It is neither a carcinogen nor currentlylisted as an endocrine disrupter. Its high Chronic Toxicity Index reflects itspotent neurotoxicity.
Dicofol, a chlorinated organic insecticide, is the leading risk driver onpears from Chile (97) and a major contributor to the TI’s of U.S. grapes (94-96), U.S. apples (94, 96), Chilean peaches (95-96), and U.S. tomatoes (96).
On a chronic basis dicofol is moderately toxic, 1/60 as toxic as methylparathion. It is also a suspected endocrine disrupter, which boosts its CTI.On crops where the PDP detected it, dicofol was present fairly infrequently (3

35
to 11 percent of samples), but at relatively high residue levels (0.3 to 0.5ppm) on samples where it is present.
Carbaryl, a carbamate insecticide, is a leading factor in the TI forapples from New Zealand (94-96) and for both U.S. and imported apple juice(96-97). Carbaryl also contributes TI components of 29-41 points to the totalfor U.S. peaches in 1994-96; this factor is overwhelmed by methyl parathionon peaches, but it is larger than the total TI for several other entire foods.Carbaryl also accounts for about 85 percent of the very low TI for cannedpeaches. It is used on many other crops as well, and makes a smallercontribution to the TI’s for grapes (U.S. and Chile), green beans (U.S. andMexico), pears from Argentina, oranges, sweet peas and sweet potatoes (allfrom the U.S.).
Carbaryl is comparatively low in chronic toxicity (1/700 as toxic asmethyl parathion), but it is listed as a suspected endocrine disrupter.
Endosulfan is a chlorinated hydrocarbon insecticide. It is a top riskdriver for U.S. and Mexican green beans in 94-95, and Mexican spinach (95-97), and a lesser factor in TI’s for U.S. spinach in (95-97), and Mexican andU.S. tomatoes (96-97). It is the largest factor in small scores for importedwinter squash from Mexico and Honduras in 1997.
Endosulfan is comparatively low in chronic toxicity, with an RfD 300times greater than methyl parathion’s. It is listed as an endocrine disrupter.
Acephate, another organophosphate insecticide, is a risk driver forU.S. celery (94), U.S. fresh green beans (94-95), and U.S. processed greenbeans (96-97). On green beans, it is the largest single component of the TI in94 and 95. It is used on many other crops but typically contributes onlyminimally to overall TI’s.
Acephate is relatively toxic among the organophosphates, about 1/60as toxic as methyl parathion. It is neither a carcinogen nor an endocrinedisrupter.
Methamidophos, another organophosphate, is used on its own as aninsecticide; it is also a breakdown product of acephate, and residues of thetwo pesticides tend to occur on the same crops. It is the leading TI factor forU.S. tomatoes (96-97) and the second-ranked factor for Mexican tomatoes

36
(96-97). Methamidophos is one of the top TI factors for U.S. fresh greenbeans (94-95), Mexican fresh green beans in 1995, and U.S. processed greenbeans (96-97). Its toxicity profile is very similar to acephate’s.
I. Pesticide Use Data
The National Agricultural Statistical Service (NASS), part of the U.S.Department of Agriculture, publishes surveys of pesticide applications onmajor U.S. crops. Data for fruits and vegetables are compiled in alternatingyears. We obtained NASS pesticide use data for fruits for 1993, 1995 and1997, and for vegetables for 1994 and 1996, and added them to our database.
Crop-to-crop differences and trends in pesticide applications can helpconfirm inferences drawn from the PDP residue data. Use data for some risk-driving insecticides on key crops are shown in Table 8. While residue dataare a better index of the potential for dietary exposure, and therefore ofrelative risk to consumers, the use data show some interesting patterns.
For example, azinphos-methyl, carbaryl and chlorpyrifos applicationson apples held fairly steady from 1993 through 1997, but dimethoate use onapples decreased by 75 percent and methyl parathion applications more thandoubled in the same period. This suggests that methyl parathion is replacingsome uses of dimethoate on apples, and is consistent with the dominant rolemethyl parathion plays in the TI’s for apples from 1994 through 1996. Overthe same three years, the TI’s for dimethoate on apples declined from 15 to2.5, and the percent of samples with residues of this insecticide shrank from12 percent to 3 percent—almost perfectly in synch with use data.
Methyl parathion use has also increased steeply on pears and greenbeans, and decreased on peaches. The effects of this use trend showed up inthe TI’s for processed green beans, and methyl parathion is the top-rankedfactor in the TI for U.S. pears in the one year they were tested. Insufficientrecent data are available to assess whether the contribution of this chemical tothe extremely high TI’s for U.S. peaches may be shrinking.
The use on potatoes of two very toxic insecticides, methamidophos andaldicarb, increased dramatically from 1995 to 1997. The PDP carried out aspecial test of potatoes in 1997, testing only for aldicarb. They tested 342

37
samples, and found one or more aldicarb breakdown products in 20 samples,a detection frequency of 6 percent. (No aldicarb was detected in U.S.potatoes tested in 1994 and 1995.) They also tested individual servings (i.e.,single potatoes) and found that residues in individual samples varied from 0.1to 7 times the mean level for composite samples. This variability means somechildren eating a potato have a risk of getting a very high dose of aldicarb,which has implications in terms of potential acute toxicity. This situationclearly requires ongoing surveillance.
Progress toward less reliance on high-risk insecticides is evident in thedecreasing use of azinphos-methyl on grapes, peaches and pears; thedeclining use of dimethoate on apples, grapes, green beans and peas; anddecreases in methamidophos and chlorpyrifos use on tomatoes.
Comparable data are not available for pesticide applications in othercountries, but the NASS data provide some additional insights into changingpest-management practices in the U.S., and can help explain some of theresidue patterns that show up in the PDP data.

38
RECOMMENDATIONS
A. Advice to Consumers
It is sensible for consumers to try to minimize their own and theirchildren’s exposure to pesticide residues in foods. One way to do that is tochoose foods that have relatively low toxicity loading on our Toxicity Index.In particular, consumers can:
• Choose foods frequently that have low TI values, such as milk, bananas,broccoli, orange juice, apple juice, and frozen or canned peas and corn;
• Choose foods with the highest TI values, such as peaches, winter squash,apples, pears, grapes, frozen/canned green beans, and fresh spinach, lessoften. Eating these foods occasionally is unlikely to do much harm, buteating multiple servings in a short time probably should be avoided.
• Look for organically grown apples, peaches, pears, grapes, winter squash,spinach and green beans. In tests published in January 1998, ConsumersUnion confirmed that organically grown foods have substantially lowerpesticide toxicity loading than their conventionally grown counterparts.
• Ask your grocer or supermarket produce buyer to seek out suppliers offruits and vegetables produced without using high-risk pesticides. Manygrower organizations have pledged to reduce their use of chemicals likemethyl parathion, and some have set up certification programs to “green-label” their produce. Clearly expressed consumer demand can help theseforward-looking producers gain a foothold in the market.
• Before feeding peaches, pears and apples to children, remove the peel.Many pesticide residues are on the outside of a fruit. Removing the peelcan dramatically lower pesticide exposure associated with these foods.
• For foods where PDP data show significant differences between U.S.-grown samples and imports, choose from a source with a lower ToxicityIndex. For example, Chilean peaches over U.S. peaches, Mexican wintersquash (fresh or frozen) and green beans over U.S.- grown varieties, NewZealand apples over U.S. apples, U.S. tomatoes over Mexican tomatoes,
39
U.S. grapes over Chilean grapes, and U.S. orange juice over Brazilianorange juice.
• Choose processed foods more often, especially those for which ToxicityIndices are substantially lower than for fresh varieties of the same foods,such as canned peaches.
Consumers can also reduce pesticide contamination on any fruits andvegetables they buy by washing the foods. A gentle washing with detergent(such as any dishwashing liquid) will remove a sizeable fraction of surfaceresidues.
It’s important that parents not reduce their children’s consumption offruits and vegetables, out of fear of pesticide risks. The benefits of eatingthese healthful foods outweigh the risks. However, parents armed with factsabout documented differences in pesticide contamination of different foodscan provide those health benefits and minimize pesticide exposure throughsensible food choices.
B. Policy Recommendations
In its efforts to implement the Food Quality Protection Act (FQPA), theEPA needs to set priorities, and address the pesticide uses that pose thelargest risks first.
The information we have assembled here can help set priorities. Wesuggest beginning with foods that have Toxicity Indices greater than 100, andfocusing on individual pesticides found on those foods whose residuesaccount for 10 percent or more of the overall TI’s. Table 5 shows about adozen crops, and about 20 pesticides used one or more of those crops, thatmeet these criteria.
We believe the EPA should, with very little further ado, determine thatuse of methyl parathion on foods like apples, grapes, peaches, pears andgreen beans cannot survive the children’s health protection requirements ofthe FQPA. EPA must promptly address the dominant role this insecticideplays in the toxicity loading of several foods consumed in large quantities bychildren. Taking action on methyl parathion alone can dramatically reduce

40
the TI’s for several of the foods with the highest toxicity loadings in thisanalysis.
But EPA should not stop with methyl parathion. The most prominentrisk drivers in Table 5 involve only about 20 chemicals in all, and for manyof the chemicals, only selected uses are risk drivers. Many essential uses ofeven some very toxic pesticides probably can be preserved; selective bans ofhigh-risk uses, not outright bans of chemicals, can very likely reduce overalltoxicity loading to acceptably safe levels. In some cases, tighter regulation ofhow a pesticide is used—reducing the permissible application rates, orrequiring longer intervals between application and harvest, to give residuesmore time to break down—can undoubtedly bring risks within acceptablelimits, without requiring growers to do completely without certain valuablepest-control chemicals.
The Food and Drug Administration, EPA and USDA need to addressthe problems that can result from dieldrin residues in soils. Residues of thispesticide—banned a quarter-century ago—gave U.S. winter squash ToxicityIndices far greater than those of many other foods with residues of currentlylegal, high-risk organophosphates. It seems clear that the “action levels” ineffect for such persistent environmental contaminants need re-examination;many would not pass the child-health protection test of the FQPA.
Producers of crops which, like winter squash, have a propensity fortaking up residues like dieldrin and heptachlor epoxide from the soil, shouldplant only on lands that are known to be free of these pollutants.
As far as the PDP is concerned, we believe USDA should expand itssurveillance of foods children eat a lot of, to provide data that can measureprogress as the FQPA is implemented. As it is now structured, the PDProtates among different foods. While breadth of coverage is valuable, it isalso essential to revisit certain foods that play a large role in overall dietarypesticide exposure often, to track trends in residue patterns. We think apples,peaches, pears, grapes, potatoes, spinach, green beans and winter squash allshould probably be tested at least every other year.
Whenever pesticide-use data indicate a steep increase in applicationsof a risk-driving pesticide (as, for example, recent increases in aldicarb use onWestern potatoes, or methyl parathion use on green beans), such trends in usedata should trigger expanded testing of that crop by the PDP.

41
In tests Consumers Union did in 1997 for a report published in January1998, we found that green peppers had frequent, high residues of acephateand methamidophos. We think green peppers should be tested by the PDP,too. Perhaps another six to 10 crops that each are significant in (i.e., make upmore than 1 percent of) the diets of young children, have not yet been testedby the PDP, and should be among those tested soon.
We would like to see the PDP include more samples of organically-grown and “green labeled” foods in its annual test surveys. These foodcategories are becoming increasingly important in the U.S. marketplace,driven in part by consumer demand for foods produced with less pesticideuse. In 1997, the PDP made an initial effort to include identified samples ofsuch categories for several tested foods. We hope the program can expand itstesting of these market sectors, to provide objective data on whether and howthese alternatives can help reduce dietary pesticide exposure.
Our comparisons between U.S. and imported samples of various foodswere sometimes stymied by the PDP’s inclusion of too few samples of foodsfrom certain importing countries. USDA should carry out an analysis of thenumber of samples needed to provide statistically meaningful residue data,and should ensure that the PDP tests sufficient numbers of samples from keyimporting countries for foods it examines each year.

42
REFERENCES
Benbrook, Charles M., et al. (1996) Pest Management at the Crossroads.Yonkers, NY: Consumers Union of U.S., Inc,
Colborn, Theo, Diane Dumanoski and John Peterson Myers (1996) OurStolen Future. New York: Dutton.
Colborn, Theo, Frederick S. vom Saal and Ana M. Soto (1993)Developmental Effects of Endocrine-Disrupting Chemicals in Wildlife andHumans, Environmental Health Perspectives, Vol. 101:5, pp.378-384.
Consumers Union (1998) Greener Greens? The Truth About Organic Food.Consumer Reports, January 1998, pp. 12-18.
Environmental Working Group (1998) Overexposed: OrganophosphateInsecticides in Children’s Foods. Washington, DC: EWG.
Kenney, Jeannine M., Charles M. Benbrook, and Edward Groth III (1998)Worst First: High Risk Insecticide Uses, Children’s Foods, and SaferAlternatives. Washington, D.C.: Consumers Union of U.S., Inc.
National Research Council (1993) Pesticides in the Diets of Infants andChildren. Washington, DC: National Academy Press.
FOR MORE INFORMATION
USDA PDP reports and databases: http://www.ams.usda.gov/science/pdp/
For the EPA’s toxicity data on pesticides, contact The Office of PesticidePrograms, OPPTS/OPP/HED, U.S. Environmental Protection Agency, 401 MStreet, SW, Washington, D.C. 20460 (Attn: Mr. Rick Whiting):
For Consumers Union’s papers and analyses related to pesticide policy andthe Food Quality Protection Act: http://www.ecologic-ipm.com.
For an interactive database on pesticides encountered in foods you eat or feedto your children: http://www.foodnews.org.

1994 1995 1996 1997
Apple Juice Argentina 11 59Germany 18Hungary 25Mexico 12U.S. 162 515
Apples New Zealand 13 13 15U.S. 656 659 502
Bananas All Imports 636 486
Broccoli Mexico 14U.S. 659
Carrots Canada 23 35 10Mexico 19U.S. 655 646 481
Celery U.S. 172
Grapes Chile 255 256 279Mexico 32 46 24South Africa 10U.S. 377 379 211
Green Beans, Fresh Mexico 83 80U.S. 484 483
Green Beans, Frozen/ Canned U.S. 525 691
Lettuce U.S. 688
Milk U.S. 570 727
Orange Juice Brazil 66U.S. 487
Oranges Australia 14U.S. 676 680 511
Peaches, Fresh Chile 123 115 126U.S. 271 249 198
Peaches, Canned U.S. 745
Food*Country of
OriginNumber of Samples
Table 1. Foods Tested by the USDA Pesticide Data Program, 1994-1997

1994 1995 1996 1997Food*
Country of Origin
Number of Samples
Pears Argentina 34Chile 66South Africa 13U.S. 588
Potatoes U.S. 688 702
Soybeans U.S. 159
Spinach, Fresh Mexico 14 21 12U.S. 593 491 497
Spinach, Canned U.S. 168
Sweet Corn, Canned/Frozen U.S. 364 651
Sweet Peas, Canned/Frozen U.S. 346 660 346
Sweet Potatoes U.S. 507 691
Tomatoes Canada 21Mexico 31 192U.S. 134 497
Wheat U.S. 600 340 623
Winter Squash, Fresh Honduras 10Mexico 161U.S. 258
Winter Squash, Frozen Mexico 20U.S. 199
* Food-country combinations with 9 or fewer samples are not included in this table.

PesticideLD50
(mg/kg)1/LD50
Acute Toxicity Index
(100 x 1/LD50)
2,4-D 375.00 0.0027 0.27 4-hydroxydiphenylamine (DPA) 300.00 0.0033 0.33 acephate 945.00 0.0011 0.11aldicarb 0.93 1.0753 107.5 aldicarb sulfoxide 0.93 1.0753 107.5 aldoxycarb 27.00 0.0370 3.70 atrazine 2,000.00 0.0005 0.05azinphos-methyl 16.00 0.0625 6.25benomyl 5,000.00 0.0002 0.02bifenthrin 55.00 0.0182 1.82 captan 5,000.00 0.0002 0.02carbaryl 300.00 0.0033 0.33carbofuran 8.00 0.1250 12.50 carbofuran-3 OH 8.00 0.1250 12.50chlordane 460.00 0.0022 0.22 chlorothalonil 5,000.00 0.0002 0.02chlorpropham 3,800.00 0.0003 0.026 chlorpyrifos 135.00 0.0074 0.74chlorpyrifos-methyl 3,000.00 0.0003 0.03cypermethrin 86.00 0.0116 1.16DCPA 5,000.00 0.0002 0.02DDD (TDE) 113.00 0.0088 0.88DDE 113.00 0.0088 0.88DDT 113.00 0.0088 0.88demeton-S-sulfone 30.00 0.0333 3.33diazinon 300.00 0.0033 0.33dichlorvos (DDVP) 56.00 0.0179 1.79diclofop methyl 565.00 0.0018 0.18dicloran 4,000.00 0.0003 0.03dicofol PP 690.00 0.0014 0.14dieldrin 37.00 0.0270 2.70dimethoate 150.00 0.0067 0.67diphenylamine (DPA) 300.00 0.0033 0.33 disulfoton sulfone 2.60 0.3846 38.46endosulfan I 80.00 0.0125 1.25endosulfan II 80.00 0.0125 1.25endosulfan sulfate 80.00 0.0125 1.25esfenvalerate 67.00 0.0149 1.49ethion 208.00 0.0048 0.48fenamiphos 15.00 0.0667 6.67 fenamiphos sulfoxide 15.00 0.0667 6.67fenbutatin oxide 2,630.00 0.0004 0.04fenpropathrin 66.00 0.0152 1.52 fenvalerate 450.00 0.0022 0.22
Table 2. Acute Toxicity of Pesticides Detected by the USDA Pesticide Data Program, 1994-1997

PesticideLD50
(mg/kg)1/LD50
Acute Toxicity Index
(100 x 1/LD50)
formetanate HCL 21.00 0.0476 4.76 heptachlor epoxide NA* NA* NA*hexachlorobenzene 5,000.00 0.0002 0.02imazalil 320.00 0.0031 0.31iprodione 3,500.00 0.0003 0.03lamba-cyhalothrin 56.00 0.0179 1.79 lindane 88.00 0.0114 1.14linuron 4,000.00 0.0003 0.03malathion 2,100.00 0.0005 0.05metalaxyl 670.00 0.0015 0.15methamidophos 30.00 0.0333 3.33methidathion 25.00 0.0400 4.00methomyl 17.00 0.0588 5.88methoxychlor 5,000.00 0.0002 0.02methoxychlor PP 5,000.00 0.0002 0.02mevinphos 4.00 0.2500 25.00myclobutanil 1,600.00 0.0006 0.06o-phenylphenol 2,700.00 0.0004 .04omethoate 50.00 0.0200 2.00oxamyl 6.00 0.1667 16.67parathion-ethyl 14.00 0.0714 7.14parathion-methyl 14.00 0.0714 7.14pentachloroaniline (PCA) 2,420.00 0.0004 0.04 permethrin 500.00 0.0020 0.20phorate sulfone 2.00 0.5000 50.00phosalone 120.00 0.0083 0.83phosmet 230.00 0.0043 0.43phosphamidon 7.00 0.1429 14.29piperonyl butoxide 5,000.00 0.0002 0.02propargite 2,200.00 0.0005 0.05quintozene (PCNB) 1,700.00 0.0006 0.06simazine 5,000.00 0.0002 0.02tecnazine 5,000.00 0.0002 0.02 thiabendazole 3,330.00 0.0003 0.03triadimefon 602.00 0.0017 0.17trifluralin 5,000.00 0.0002 0.02vinclozolin 5,000.00 0.0002 0.02

(A) (B) (C) (D) (E) (F) (G) (H) (I) (J) (K)
PesticideEPA Reference
Dose (RfD) (mg/kg/day)
1/RfD Scaled Inverse
RfD (0.1 x Col. B)
Endocrine Disruptor
Component (C) x (D)
EPA Class- ification
EPA Class Value
EPA Cancer Potency Factor
(Q*)
Carcino- genicity
Component (G x H)
Scaled Carcino- genicity
Component (50 x I)
Chronic Toxicity
Index (E + J)
2,4-D 0.01 100 10 3 30 30 4-hydroxydiphenylamine (DPA) 0.025 40 4 1 4 4 acephate 0.0012 833 83 1 83 83 aldicarb 0.001 1,000 100 3 300 300 aldicarb sulfoxide 0.001 1,000 100 3 300 300 aldoxycarb 0.001 1,000 100 1 100 100 atrazine 0.035 29 2.9 3 9 C 5 0.222 1.11 55.5 64 azinphos-methyl 0.0015 667 67 1 67 67 benomyl 0.05 20 2 3 6 C 5 0.0042 0.021 1.1 7 bifenthrin 0.015 67 7 1 7 7 captan 0.13 8 0.8 1 1 B2 10 0.00121 0.0121 0.6 1 carbaryl 0.014 71 7 3 21 C 5 0.0227 0.1135 6 27 carbofuran 0.005 200 20 1 20 20 carbofuran-3 OH 0.005 200 20 1 20 20 chlordane 0.00006 16,667 1,667 1 1,667 B2 10 1.3 13 650 2,317 chlorothalonil 0.02 50 5 1 5 B2 10 0.0077 0.077 3.9 9 chlorpropham 0.05 20 2 1 2 2 chlorpyrifos 0.0003 3,333 333 1 333 333 chlorpyrifos-methyl 0.01 100 10 1 10 10 cypermethrin 0.01 100 10 3 30 30 DCPA 0.01 100 10 1 10 C 5 0.00149 0.00745 0.4 10 DDD (TDE) 0.0005 2,000 200 1 200 B2 10 0.34 3.4 170 370 DDE 0.0005 2,000 200 1 200 B2 10 0.34 3.4 170 370 DDT 0.0005 2,000 200 1 200 B2 10 0.34 3.4 170 370 demeton-S-sulfone 0.00004 25,000 2,500 1 2,500 2,500 diazinon 0.0007 1,429 143 1 143 143 dichlorvos (DDVP) 0.00017 5,882 588 1 588 C 5 0.122 0.61 30.5 619 diclofop methyl 0.002 500 50 1 50 108 dicloran 0.025 40 4 1 4 4 dicofol PP 0.0012 833 83 3 250 250 dieldrin 0.00005 20,000 2,000 1 2,000 B2 10 16 160 8,000 10,000 dimethoate 0.0005 2,000 200 1 200 200 diphenylamine (DPA) 0.025 40 4 1 4 4 disulfoton sulfone 0.0003 3,333 333 1 333 333 endosulfan I 0.006 167 17 3 50 50 endosulfan II 0.006 167 17 3 50 50
Table 3. Chronic Toxicity of Pesticides Detected by the USDA Pesticide Data Program, 1994-1997
Reference Dose Component Carcinogenicity Component

(A) (B) (C) (D) (E) (F) (G) (H) (I) (J) (K)
PesticideEPA Reference
Dose (RfD) (mg/kg/day)
1/RfD Scaled Inverse
RfD (0.1 x Col. B)
Endocrine Disruptor
Component (C) x (D)
EPA Class- ification
EPA Class Value
EPA Cancer Potency Factor
(Q*)
Carcino- genicity
Component (G x H)
Scaled Carcino- genicity
Component (50 x I)
Chronic Toxicity
Index (E + J)
Reference Dose Component Carcinogenicity Component
endosulfan sulfate 0.006 167 17 3 50 50 esfenvalerate 0.02 50 5 1 5 5 ethion 0.0005 2,000 200 1 200 200 fenamiphos 0.0001 10,000 1,000 1 1,000 1,000 fenamiphos sulfoxide 0.0001 10,000 1,000 1 1,000 1,000 fenbutatin oxide 0.05 20 2 1 2 2 fenpropathrin 0.025 40 4 1 4 4 fenvalerate 0.025 40 4 1 4 4 formetanate HCL 0.002 500 50 1 50 50 heptachlor epoxide 0.00001 100,000 10,000 1 10,000 B2 10 9.1 91 4,550 14,550 hexachlorobenzene 0.0008 1,250 125 1 125 B2 10 1.6 16 800 925 imazalil 0.025 40 4 1 4 C 5 0.062 0.31 15.5 20 iprodione 0.06 17 1.7 1 2 B2 10 0.0439 0.439 21.95 24 lamba-cyhalothrin 0.001 1,000 100 1 100 100 lindane 0.0047 213 21 3 64 64 linuron 0.008 125 13 1 13 13 malathion 0.04 25 3 1 3 3 metalaxyl 0.074 14 1.4 1 1 1 methamidophos 0.001 1,000 100 1 100 100 methidathion 0.0015 667 67 1 67 67 methomyl 0.008 125 13 3 38 38 methoxychlor 0.005 200 20 3 60 60 methoxychlor PP 0.005 200 20 3 60 60 mevinphos 0.00025 4,000 400 1 400 400 myclobutanil 0.025 40 4 1 4 4 o-phenylphenol 0.02 50 5 1 5 5 omethoate 0.0003 3,333 333 1 333 333 oxamyl 0.0002 5,000 500 1 500 500 parathion-ethyl 0.00033 3,030 303 3 909 909 parathion-methyl 0.00002 50,000 5,000 3 15,000 15,000 pentachloroaniline 0.16 6 0.6 1 1 1 permethrin 0.05 20 2 3 6 C 5 0.0184 0.092 4.6 11 phorate sulfone 0.0005 2,000 200 1 200 200 phosalone 0.0025 400 40 1 40 40 phosmet 0.003 333 33 1 33 33 phosphamidon 0.0002 5,000 500 1 500 500 piperonyl butoxide 0.0175 57 6 1 6 6

(A) (B) (C) (D) (E) (F) (G) (H) (I) (J) (K)
PesticideEPA Reference
Dose (RfD) (mg/kg/day)
1/RfD Scaled Inverse
RfD (0.1 x Col. B)
Endocrine Disruptor
Component (C) x (D)
EPA Class- ification
EPA Class Value
EPA Cancer Potency Factor
(Q*)
Carcino- genicity
Component (G x H)
Scaled Carcino- genicity
Component (50 x I)
Chronic Toxicity
Index (E + J)
Reference Dose Component Carcinogenicity Component
propargite 0.04 25 3 1 3 B2 10 0.0171 0.171 8.6 11 quintozene (PCNB) 0.003 333 33 1 33 33 simazine 0.005 200 20 1 20 C 5 0.12 0.6 30 50 tecnazine 0.01 100 10 1 10 10 thiabendazole 0.1 10 1 1 1 1 THPI (tetrahydro- phthalimide) N.A.* N.A.* N.A.* N.A.* N.A.* N.A.* N.A.* N.A.* N.A.* N.A.* N.A.*triadimefon 0.04 25 3 1 3 3 trifluralin 0.024 42 4 3 13 C 5 0.0077 0.0385 1.9 14 vinclozolin 0.012 83 8 3 25 25 N.A. = Toxicity data not available on this post-harvest fungicide.

Food*Country of
Origin1994 1995 1996 1997
Apple Juice Argentina 18 32Germany 13Hungary 30Mexico 12U.S. 11 20
Apples New Zealand 298 260 284U.S. 567 521 550
Bananas All Imports 3 4
Broccoli Mexico 45U.S. 2
Carrots Canada 73 80 84Mexico 136U.S. 64 40 53
Celery U.S. 255
Grapes Chile 181 241 339Mexico 10 79 71South Africa 169U.S. 1,552 329 228
Green Beans, Fresh Mexico 97 39U.S. 294 222
Green Beans, Frozen/Canned U.S. 222 529
Lettuce U.S. 122
Milk U.S. 1 1
Orange Juice Brazil 23U.S. 2
Oranges Australia 30U.S. 138 38 49
Peaches, Fresh Chile 381 366 471U.S. 4,390 5,376 4,848
Peaches, Canned U.S. 5
Toxicity Index Value
Table 4. Toxicity Indices for Foods Tested in the USDA Pesticide Data Program, 1994-1997

Food*Country of
Origin1994 1995 1996 1997
Toxicity Index Value
Pears Argentina 157Chile 415South Africa 201U.S. 435
Potatoes U.S. 191 59
Soybeans U.S. 66
Spinach, Fresh Mexico 103 623 256U.S. 554 495 349
Spinach, Canned U.S. 204
Sweet Corn, Canned/Frozen U.S. 0.02 0.01
Sweet Peas, Canned/Frozen U.S. 6 22 21
Sweet Potatoes U.S. 56 25
Tomatoes Canada 26Mexico 123 159U.S. 63 55
Wheat U.S. 18 29 32
Winter Squash, Fresh Honduras 23Mexico 41U.S. 1,706
Winter Squash, Frozen Mexico 21U.S. 3,012
* Food-country combinations with 9 or fewer samples are not inlcuded in this table.

Food Origin Year Pesticide TypeNumber of Samples
Percent Positive
Mean Residue
Toxicity Index
Share of Toxicity by Pesticide
apple juice Argentina 1997 dimethoate I 59 50.8% 0.011 15.10 47.8%apple juice Argentina 1997 omethoate I 59 18.6% 0.012 10.58 33.5%apple juice Argentina 1997 carbaryl I 59 44.1% 0.015 2.95 9.3%apple juice Argentina 1997 azinphos-methyl I 59 5.1% 0.011 1.50 4.7%apple juice Argentina 1997 methamidophos I 59 6.8% 0.005 0.76 2.4%apple juice Argentina 1997 thiabendazole F 58 8.6% 0.143 0.27 0.8%apple juice Argentina 1997 acephate I 59 3.4% 0.007 0.26 0.8%apple juice Argentina 1997 diphenylamine (DPA) F 59 1.7% 0.048 0.12 0.4%apple juice Argentina 1997 captan F 58 1.7% 0.046 0.02 0.1%
Totals 31.56 100.0%
apple juice Argentina 1996 dimethoate I 11 27.3% 0.011 8.50 48.1%apple juice Argentina 1996 carbaryl I 11 45.5% 0.020 4.10 23.2%apple juice Argentina 1996 azinphos-methyl I 11 9.1% 0.010 2.44 13.8%apple juice Argentina 1996 methamidophos I 11 9.1% 0.006 1.23 7.0%apple juice Argentina 1996 benomyl F 11 9.1% 0.083 0.72 4.1%apple juice Argentina 1996 thiabendazole F 11 18.2% 0.151 0.59 3.4%apple juice Argentina 1996 malathion I 11 9.1% 0.017 0.07 0.4%
Totals 17.65 100.0%
apple juice Germany 1997 omethoate I 18 16.7% 0.008 6.45 51.2%apple juice Germany 1997 dimethoate I 18 22.2% 0.005 3.06 24.3%apple juice Germany 1997 carbaryl I 18 16.7% 0.024 1.77 14.1%apple juice Germany 1997 methamidophos I 18 5.6% 0.005 0.63 5.0%apple juice Germany 1997 thiabendazole F 18 16.7% 0.077 0.28 2.2%apple juice Germany 1997 diphenylamine (DPA) F 16 6.3% 0.025 0.23 1.8%apple juice Germany 1997 acephate I 18 5.6% 0.003 0.18 1.5%
Totals 12.60 100.0%
apple juice Hungary 1997 dimethoate I 25 72.0% 0.009 18.15 60.4%apple juice Hungary 1997 omethoate I 25 12.0% 0.010 6.00 20.0%apple juice Hungary 1997 carbaryl I 25 12.0% 0.043 2.30 7.7%apple juice Hungary 1997 benomyl F 24 4.2% 0.270 1.08 3.6%apple juice Hungary 1997 azinphos-methyl I 25 4.0% 0.010 1.07 3.6%apple juice Hungary 1997 thiabendazole F 25 16.0% 0.151 0.52 1.7%apple juice Hungary 1997 methamidophos I 25 4.0% 0.005 0.45 1.5%apple juice Hungary 1997 permethrin I 25 4.0% 0.048 0.37 1.2%apple juice Hungary 1997 diphenylamine (DPA) F 25 4.0% 0.013 0.08 0.3%
Totals 30.02 100.0%
apple juice Mexico 1997 dimethoate I 12 33.3% 0.012 11.00 88.3%apple juice Mexico 1997 thiabendazole F 12 8.3% 0.440 0.79 6.3%apple juice Mexico 1997 carbaryl I 12 8.3% 0.013 0.48 3.8%apple juice Mexico 1997 diphenylamine (DPA) F 12 8.3% 0.013 0.16 1.3%apple juice Mexico 1997 o-phenylphenol F 12 8.3% 0.005 0.03 0.3%
Totals 12.46 100.0%
apple juice US 1997 dimethoate I 515 21.4% 0.008 4.97 24.7%apple juice US 1997 azinphos-methyl I 515 7.4% 0.023 4.59 22.8%apple juice US 1997 omethoate I 515 5.8% 0.011 3.11 15.5%apple juice US 1997 parathion-methyl I 515 0.4% 0.003 2.26 11.2%apple juice US 1997 carbaryl I 515 23.5% 0.020 2.11 10.5%apple juice US 1997 thiabendazole F 513 38.4% 0.209 1.73 8.6%apple juice US 1997 diphenylamine (DPA) F 502 10.4% 0.035 0.53 2.6%apple juice US 1997 oxamyl I 515 0.2% 0.017 0.37 1.8%apple juice US 1997 benomyl F 513 1.2% 0.109 0.12 0.6%apple juice US 1997 methamidophos I 515 1.6% 0.003 0.10 0.5%apple juice US 1997 esfenvalerate I 413 0.5% 0.038 0.09 0.5%apple juice US 1997 acephate I 515 1.2% 0.006 0.07 0.4%apple juice US 1997 o-phenylphenol F 435 6.2% 0.010 0.05 0.2%apple juice US 1997 fenvalerate I 515 0.4% 0.050 0.02 0.1%
Totals 20.12 100.0%
apple juice US 1996 carbaryl I 162 32.1% 0.027 3.88 34.5%apple juice US 1996 thiabendazole F 162 39.5% 0.205 1.74 15.5%apple juice US 1996 azinphos-methyl I 162 4.9% 0.011 1.47 13.1%apple juice US 1996 dimethoate I 162 7.4% 0.007 1.43 12.7%apple juice US 1996 omethoate I 143 2.1% 0.014 1.42 12.6%apple juice US 1996 diphenylamine F 156 10.9% 0.042 0.68 6.1%apple juice US 1996 benomyl F 162 3.1% 0.102 0.30 2.7%apple juice US 1996 phosmet I 137 2.9% 0.010 0.16 1.4%apple juice US 1996 methamidophos I 162 0.6% 0.006 0.08 0.7%
Table 5. Shares of Total Toxicity Index Values Contributed by Individual Pesticides Detected on Each Food by Origin and Year, Pesticide Data Program 1994-1997
Table 5.

Food Origin Year Pesticide TypeNumber of Samples
Percent Positive
Mean Residue
Toxicity Index
Share of Toxicity by Pesticide
apple juice US 1996 captan F 133 4.5% 0.027 0.03 0.3%apple juice US 1996 acephate I 162 0.6% 0.004 0.03 0.2%apple juice US 1996 o-phenylphenol F 156 5.1% 0.007 0.03 0.2%
Totals 11.26 100.0%
apples New Zealand 1996 chlorpyrifos I 15 80.0% 0.031 110.92 39.1%apples New Zealand 1996 azinphos-methyl I 15 93.3% 0.044 108.93 38.4%apples New Zealand 1996 carbaryl I 15 33.3% 0.328 48.44 17.1%apples New Zealand 1996 propargite I 15 26.7% 0.218 9.05 3.2%apples New Zealand 1996 diphenylamine F 15 20.0% 0.208 6.15 2.2%apples New Zealand 1996 captan F 15 33.3% 0.019 0.15 0.1%
Totals 283.65 100.0%
apples New Zealand 1995 azinphos-methyl I 13 84.6% 0.054 123.43 47.4%apples New Zealand 1995 chlorpyrifos I 13 69.2% 0.028 85.67 32.9%apples New Zealand 1995 carbaryl I 13 38.5% 0.266 45.37 17.4%apples New Zealand 1995 diazinon I 13 15.4% 0.013 3.70 1.4%apples New Zealand 1995 propargite I 13 7.7% 0.150 1.78 0.7%apples New Zealand 1995 diphenylamine F 13 15.4% 0.014 0.32 0.1%apples New Zealand 1995 captan F 13 23.1% 0.022 0.12 0.04%
Totals 260.38 100.0%
apples New Zealand 1994 carbaryl I 13 53.8% 0.651 155.22 52.1%apples New Zealand 1994 azinphos-methyl I 13 61.5% 0.037 60.79 20.4%apples New Zealand 1994 chlorpyrifos I 13 76.9% 0.017 59.52 20.0%apples New Zealand 1994 propargite I 13 30.8% 0.270 12.94 4.3%apples New Zealand 1994 dicofol I 13 7.7% 0.029 7.21 2.4%apples New Zealand 1994 diphenylamine (DPA) F 12 33.3% 0.032 1.56 0.5%apples New Zealand 1994 captan F 13 46.2% 0.034 0.36 0.1%apples New Zealand 1994 thiabendazole F 13 7.7% 0.013 0.02 0.01%
Totals 297.62 100.0%
apples US 1996 parathion-methyl I 502 6.0% 0.019 217.15 39.5%apples US 1996 diphenylamine F 496 88.3% 0.841 109.55 19.9%apples US 1996 azinphos-methyl I 502 53.2% 0.057 80.75 14.7%apples US 1996 chlorpyrifos I 502 24.5% 0.027 29.99 5.4%apples US 1996 methoxychlor I 502 18.7% 0.180 25.96 4.7%apples US 1996 dicofol I 502 2.8% 0.221 19.91 3.6%apples US 1996 propargite I 502 24.7% 0.402 15.45 2.8%apples US 1996 thiabendazole F 502 74.1% 0.835 13.32 2.4%apples US 1996 oxamyl I 502 3.6% 0.026 10.45 1.9%apples US 1996 carbaryl I 502 12.0% 0.129 6.84 1.2%apples US 1996 parathion-ethyl I 421 0.7% 0.058 5.66 1.0%apples US 1996 dimethoate I 502 3.0% 0.031 2.51 0.5%apples US 1996 ethion I 502 0.6% 0.136 2.18 0.4%apples US 1996 omethoate I 427 2.3% 0.019 2.10 0.4%apples US 1996 mevinphos I 502 1.0% 0.013 1.61 0.3%apples US 1996 methomyl I 502 2.2% 0.030 1.44 0.3%apples US 1996 phosphamidon I 502 1.0% 0.012 1.30 0.2%apples US 1996 phosmet I 422 3.6% 0.047 0.92 0.2%apples US 1996 captan F 502 14.9% 0.155 0.54 0.1%apples US 1996 o-phenylphenol F 461 10.0% 0.071 0.53 0.1%apples US 1996 endosulfan sulfate I 502 4.2% 0.012 0.51 0.1%apples US 1996 esfenvalerate I 403 2.2% 0.036 0.40 0.1%apples US 1996 DDT I 303 0.7% 0.010 0.33 0.1%apples US 1996 endosulfan II I 502 2.8% 0.011 0.31 0.1%apples US 1996 endosulfan I I 502 2.8% 0.008 0.22 0.04%apples US 1996 lindane I 502 0.8% 0.013 0.12 0.02%apples US 1996 diazinon I 502 0.2% 0.022 0.08 0.02%apples US 1996 imazalil F 502 0.2% 0.092 0.06 0.01%apples US 1996 fenbutatin oxide I 322 1.2% 0.109 0.05 0.01%apples US 1996 iprodione F 502 0.4% 0.025 0.03 0.01%apples US 1996 chlorothalonil F 502 0.8% 0.030 0.03 0.01%apples US 1996 DDE I 502 0.2% 0.005 0.02 0.004%apples US 1996 myclobutanil F 502 2.0% 0.016 0.02 0.004%apples US 1996 fenvalerate I 502 0.6% 0.031 0.02 0.004%apples US 1996 dicloran F 502 0.2% 0.019 0.00 0.0004%apples US 1996 metalaxyl F 162 0.6% 0.005 0.00 0.0003%
Totals 550.38 100.0%
apples US 1995 parathion-methyl I 659 5.0% 0.023 220.06 42.2%apples US 1995 diphenylamine F 657 72.1% 0.806 86.39 16.6%apples US 1995 azinphos-methyl I 657 45.8% 0.069 84.94 16.3%apples US 1995 chlorpyrifos I 658 21.4% 0.026 24.78 4.8%
Table 5.
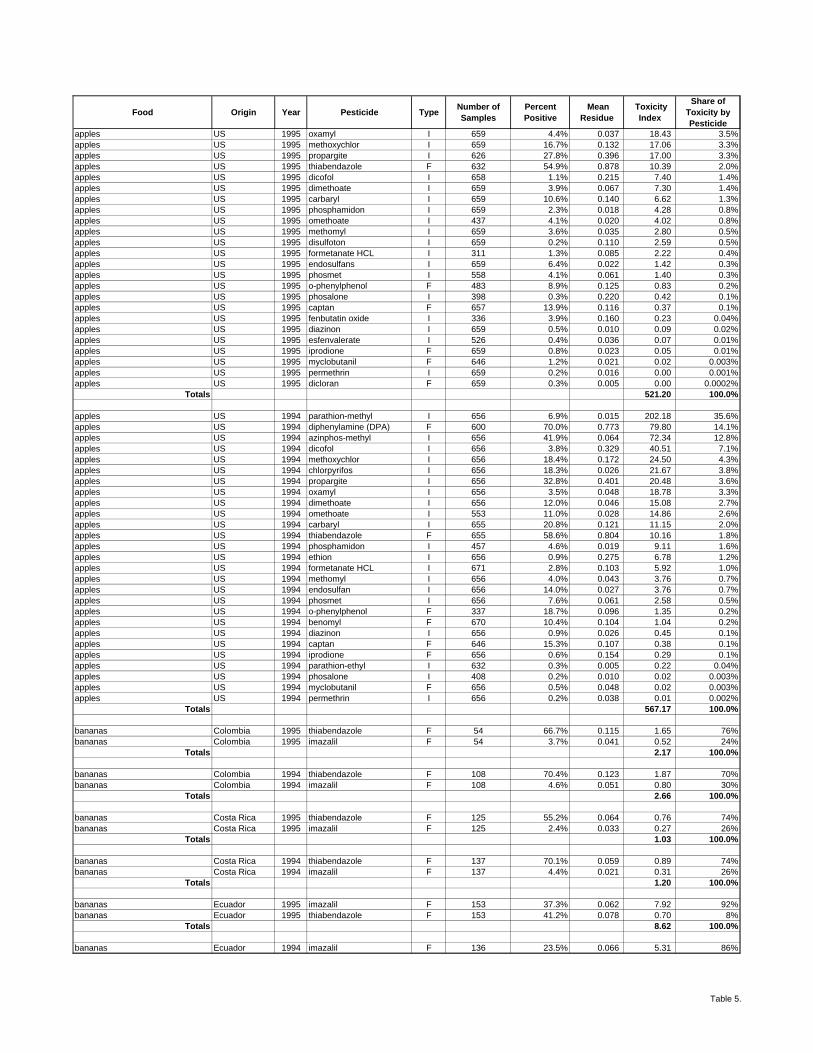
Food Origin Year Pesticide TypeNumber of Samples
Percent Positive
Mean Residue
Toxicity Index
Share of Toxicity by Pesticide
apples US 1995 oxamyl I 659 4.4% 0.037 18.43 3.5%apples US 1995 methoxychlor I 659 16.7% 0.132 17.06 3.3%apples US 1995 propargite I 626 27.8% 0.396 17.00 3.3%apples US 1995 thiabendazole F 632 54.9% 0.878 10.39 2.0%apples US 1995 dicofol I 658 1.1% 0.215 7.40 1.4%apples US 1995 dimethoate I 659 3.9% 0.067 7.30 1.4%apples US 1995 carbaryl I 659 10.6% 0.140 6.62 1.3%apples US 1995 phosphamidon I 659 2.3% 0.018 4.28 0.8%apples US 1995 omethoate I 437 4.1% 0.020 4.02 0.8%apples US 1995 methomyl I 659 3.6% 0.035 2.80 0.5%apples US 1995 disulfoton I 659 0.2% 0.110 2.59 0.5%apples US 1995 formetanate HCL I 311 1.3% 0.085 2.22 0.4%apples US 1995 endosulfans I 659 6.4% 0.022 1.42 0.3%apples US 1995 phosmet I 558 4.1% 0.061 1.40 0.3%apples US 1995 o-phenylphenol F 483 8.9% 0.125 0.83 0.2%apples US 1995 phosalone I 398 0.3% 0.220 0.42 0.1%apples US 1995 captan F 657 13.9% 0.116 0.37 0.1%apples US 1995 fenbutatin oxide I 336 3.9% 0.160 0.23 0.04%apples US 1995 diazinon I 659 0.5% 0.010 0.09 0.02%apples US 1995 esfenvalerate I 526 0.4% 0.036 0.07 0.01%apples US 1995 iprodione F 659 0.8% 0.023 0.05 0.01%apples US 1995 myclobutanil F 646 1.2% 0.021 0.02 0.003%apples US 1995 permethrin I 659 0.2% 0.016 0.00 0.001%apples US 1995 dicloran F 659 0.3% 0.005 0.00 0.0002%
Totals 521.20 100.0%
apples US 1994 parathion-methyl I 656 6.9% 0.015 202.18 35.6%apples US 1994 diphenylamine (DPA) F 600 70.0% 0.773 79.80 14.1%apples US 1994 azinphos-methyl I 656 41.9% 0.064 72.34 12.8%apples US 1994 dicofol I 656 3.8% 0.329 40.51 7.1%apples US 1994 methoxychlor I 656 18.4% 0.172 24.50 4.3%apples US 1994 chlorpyrifos I 656 18.3% 0.026 21.67 3.8%apples US 1994 propargite I 656 32.8% 0.401 20.48 3.6%apples US 1994 oxamyl I 656 3.5% 0.048 18.78 3.3%apples US 1994 dimethoate I 656 12.0% 0.046 15.08 2.7%apples US 1994 omethoate I 553 11.0% 0.028 14.86 2.6%apples US 1994 carbaryl I 655 20.8% 0.121 11.15 2.0%apples US 1994 thiabendazole F 655 58.6% 0.804 10.16 1.8%apples US 1994 phosphamidon I 457 4.6% 0.019 9.11 1.6%apples US 1994 ethion I 656 0.9% 0.275 6.78 1.2%apples US 1994 formetanate HCL I 671 2.8% 0.103 5.92 1.0%apples US 1994 methomyl I 656 4.0% 0.043 3.76 0.7%apples US 1994 endosulfan I 656 14.0% 0.027 3.76 0.7%apples US 1994 phosmet I 656 7.6% 0.061 2.58 0.5%apples US 1994 o-phenylphenol F 337 18.7% 0.096 1.35 0.2%apples US 1994 benomyl F 670 10.4% 0.104 1.04 0.2%apples US 1994 diazinon I 656 0.9% 0.026 0.45 0.1%apples US 1994 captan F 646 15.3% 0.107 0.38 0.1%apples US 1994 iprodione F 656 0.6% 0.154 0.29 0.1%apples US 1994 parathion-ethyl I 632 0.3% 0.005 0.22 0.04%apples US 1994 phosalone I 408 0.2% 0.010 0.02 0.003%apples US 1994 myclobutanil F 656 0.5% 0.048 0.02 0.003%apples US 1994 permethrin I 656 0.2% 0.038 0.01 0.002%
Totals 567.17 100.0%
bananas Colombia 1995 thiabendazole F 54 66.7% 0.115 1.65 76%bananas Colombia 1995 imazalil F 54 3.7% 0.041 0.52 24%
Totals 2.17 100.0%
bananas Colombia 1994 thiabendazole F 108 70.4% 0.123 1.87 70%bananas Colombia 1994 imazalil F 108 4.6% 0.051 0.80 30%
Totals 2.66 100.0%
bananas Costa Rica 1995 thiabendazole F 125 55.2% 0.064 0.76 74%bananas Costa Rica 1995 imazalil F 125 2.4% 0.033 0.27 26%
Totals 1.03 100.0%
bananas Costa Rica 1994 thiabendazole F 137 70.1% 0.059 0.89 74%bananas Costa Rica 1994 imazalil F 137 4.4% 0.021 0.31 26%
Totals 1.20 100.0%
bananas Ecuador 1995 imazalil F 153 37.3% 0.062 7.92 92%bananas Ecuador 1995 thiabendazole F 153 41.2% 0.078 0.70 8%
Totals 8.62 100.0%
bananas Ecuador 1994 imazalil F 136 23.5% 0.066 5.31 86%
Table 5.

Food Origin Year Pesticide TypeNumber of Samples
Percent Positive
Mean Residue
Toxicity Index
Share of Toxicity by Pesticide
bananas Ecuador 1994 thiabendazole F 136 47.8% 0.082 0.84 14%Totals 6.15 100.0%
bananas Guatamala 1995 thiabendazole F 46 67.4% 0.098 1.42 49%bananas Guatamala 1995 imazalil F 46 4.3% 0.065 0.96 34%bananas Guatamala 1995 diphenylamine F 46 2.2% 0.150 0.48 17%
Totals 2.86 100.0%
bananas Guatemala 1994 thiabendazole F 89 30.3% 0.068 0.45 100%Totals 0.45 100.0%
bananas Honduras 1995 thiabendazole F 47 42.6% 0.085 0.78 63%bananas Honduras 1995 imazalil F 47 4.3% 0.032 0.46 37%
Totals 1.24 100.0%
bananas Honduras 1994 imazalil F 67 11.9% 0.060 2.44 86.3%bananas Honduras 1994 thiabendazole F 67 11.9% 0.151 0.39 13.7%
Totals 2.83 100.0%
bananas Mexico 1995 thiabendazole F 16 12.5% 0.093 0.25 100.0%Totals 0.25 100.0%
bananas Mexico 1994 imazalil F 38 10.5% 0.048 1.70 81.8%bananas Mexico 1994 thiabendazole F 38 23.7% 0.074 0.38 18.2%
Totals 2.08 100.0%
bananas Panama 1995 imazalil F 21 19.0% 0.050 3.24 56.0%bananas Panama 1995 thiabendazole F 21 90.5% 0.131 2.54 44.0%
Totals 5.79 100.0%
bananas Panama 1994 imazalil F 46 39.1% 0.053 7.01 66.5%bananas Panama 1994 thiabendazole F 46 95.7% 0.172 3.54 33.5%
Totals 10.55 100.0%
broccoli Mexico 1994 mevinphos I 14 7.1% 0.033 29.27 64.6%broccoli Mexico 1994 methomyl I 14 7.1% 0.070 10.99 24.2%broccoli Mexico 1994 permethrin I 14 14.3% 0.183 5.07 11.2%
Totals 45.33 100.0%
broccoli US 1994 chlorpyrifos I 659 1.7% 0.010 0.73 30.6%broccoli US 1994 methamidophos I 611 0.5% 0.032 0.35 14.8%broccoli US 1994 dimethoate I 653 1.7% 0.007 0.32 13.6%broccoli US 1994 methomyl I 659 0.6% 0.023 0.30 12.5%broccoli US 1994 omethoate I 542 0.6% 0.010 0.27 11.2%broccoli US 1994 DDE I 659 0.5% 0.021 0.23 9.7%broccoli US 1994 endosulfan I 659 0.8% 0.016 0.12 5.1%broccoli US 1994 permethrin I 659 0.2% 0.115 0.03 1.4%broccoli US 1994 chlorothalonil F 612 0.3% 0.054 0.02 0.9%broccoli US 1994 carbaryl I 659 0.2% 0.007 0.00 0.2%
Totals 2.39 100.0%
carrots Canada 1996 DDT I 8 75.0% 0.012 44.84 53.3%carrots Canada 1996 parathion-ethyl I 9 33.3% 0.004 19.78 23.5%carrots Canada 1996 chlorpyrifos I 10 40.0% 0.005 8.95 10.6%carrots Canada 1996 DDE I 10 50.0% 0.005 6.31 7.5%carrots Canada 1996 diazinon I 10 30.0% 0.007 4.23 5.0%
Totals 84.10 100.0%
carrots Canada 1995 parathion-ethyl I 31 35.5% 0.008 41.09 51.5%carrots Canada 1995 DDT I 26 34.6% 0.012 20.32 25.5%carrots Canada 1995 chlorpyrifos I 35 14.3% 0.009 6.01 7.5%carrots Canada 1995 DDE I 35 37.1% 0.007 5.97 7.5%carrots Canada 1995 diazinon I 35 14.3% 0.012 3.29 4.1%carrots Canada 1995 phosmet I 31 9.7% 0.016 0.87 1.1%carrots Canada 1995 benomyl F 35 8.6% 0.084 0.69 0.9%carrots Canada 1995 esfenvalerate I 31 6.5% 0.020 0.65 0.8%carrots Canada 1995 iprodione F 35 5.7% 0.025 0.44 0.6%carrots Canada 1995 endosulfans I 35 2.9% 0.011 0.32 0.4%carrots Canada 1995 fenvalerate I 35 2.9% 0.020 0.07 0.1%carrots Canada 1995 dicloran F 35 2.9% 0.010 0.02 0.02%
Totals 79.73 100.0%
carrots Canada 1994 parathion-ethyl I 22 31.8% 0.011 47.31 64.8%carrots Canada 1994 DDT I 21 33.3% 0.010 16.61 22.8%carrots Canada 1994 DDE I 23 47.8% 0.005 5.81 8.0%carrots Canada 1994 DDD (TDE) I 20 20.0% 0.004 1.43 2.0%
Table 5.

Food Origin Year Pesticide TypeNumber of Samples
Percent Positive
Mean Residue
Toxicity Index
Share of Toxicity by Pesticide
carrots Canada 1994 chlorpyrifos I 23 4.3% 0.005 0.97 1.3%carrots Canada 1994 diazinon I 23 4.3% 0.010 0.84 1.1%
Totals 72.96 100.0%
carrots Mexico 1995 parathion-methyl I 19 5.3% 0.010 101.91 74.8%carrots Mexico 1995 DDE I 19 15.8% 0.043 16.62 12.2%carrots Mexico 1995 hexachlorobenzene F 19 10.5% 0.013 16.17 11.9%carrots Mexico 1995 endosulfans I 19 5.3% 0.024 1.27 0.9%carrots Mexico 1995 quintozene F 19 5.3% 0.007 0.16 0.1%carrots Mexico 1995 pentachlorobenzene F 19 10.5% 0.003 0.14 0.1%carrots Mexico 1995 captan F 19 10.5% 0.020 0.05 0.04%
Totals 136.32 100.0%
carrots US 1996 DDE I 481 43.5% 0.038 39.90 75.7%carrots US 1996 iprodione F 481 38.5% 0.043 5.15 9.8%carrots US 1996 phosphamidon I 481 0.2% 0.160 3.51 6.7%carrots US 1996 DDT I 187 6.4% 0.010 3.20 6.1%carrots US 1996 chlorpyrifos I 481 0.4% 0.015 0.28 0.5%carrots US 1996 endosulfan sulfate I 481 2.1% 0.008 0.18 0.3%carrots US 1996 ethion I 481 0.8% 0.007 0.16 0.3%carrots US 1996 diazinon I 481 1.0% 0.007 0.13 0.3%carrots US 1996 metalaxyl F 63 23.8% 0.008 0.12 0.2%carrots US 1996 acephate I 481 0.4% 0.007 0.03 0.1%carrots US 1996 endosulfan I I 481 0.2% 0.010 0.02 0.04%carrots US 1996 dicloran F 481 0.2% 0.040 0.00 0.01%
Totals 52.68 100.0%
carrots US 1995 DDE I 644 38.2% 0.031 29.09 73.1%carrots US 1995 iprodione F 646 26.5% 0.041 3.35 8.4%carrots US 1995 DDT I 238 5.0% 0.011 2.70 6.8%carrots US 1995 diazinon I 645 3.3% 0.025 1.56 3.9%carrots US 1995 parathion-methyl I 646 0.2% 0.005 1.50 3.8%carrots US 1995 terbufos sulfone I 292 0.3% 0.004 0.55 1.4%carrots US 1995 metalaxyl F 11 63.6% 0.010 0.40 1.0%carrots US 1995 endosulfans I 646 3.6% 0.010 0.35 0.9%carrots US 1995 DDD I 239 1.3% 0.004 0.10 0.2%carrots US 1995 acephate I 646 0.5% 0.012 0.06 0.2%carrots US 1995 dicloran F 646 0.3% 0.230 0.04 0.1%carrots US 1995 chlorpyrifos I 646 0.2% 0.005 0.03 0.1%carrots US 1995 quintozene F 646 0.6% 0.007 0.02 0.05%carrots US 1995 methamidophos I 646 0.2% 0.004 0.01 0.04%carrots US 1995 o-phenylphenol F 513 0.8% 0.017 0.01 0.02%carrots US 1995 lindane I 646 0.2% 0.005 0.01 0.02%carrots US 1995 pentachlorobenzene F 646 0.3% 0.005 0.01 0.02%carrots US 1995 myclobutanil F 646 0.2% 0.014 0.00 0.004%carrots US 1995 malathion I 623 0.2% 0.017 0.00 0.003%carrots US 1995 thiabendazole F 1283 0.1% 0.050 0.00 0.002%carrots US 1995 captan F 504 0.2% 0.010 0.00 0.001%
Totals 39.80 100.0%
carrots US 1994 DDE I 640 37.3% 0.023 21.01 33.0%carrots US 1994 parathion-methyl I 655 0.9% 0.008 14.78 23.2%carrots US 1994 dieldrin I 63 1.6% 0.005 10.20 16.0%carrots US 1994 disulfoton sulfone I 85 1.2% 0.037 6.75 10.6%carrots US 1994 iprodione F 641 25.9% 0.054 4.32 6.8%carrots US 1994 DDT I 393 3.3% 0.018 3.00 4.7%carrots US 1994 diazinon I 655 4.7% 0.018 1.66 2.6%carrots US 1994 disulfoton I 655 0.2% 0.035 0.83 1.3%carrots US 1994 parathion-ethyl I 617 0.3% 0.007 0.29 0.5%carrots US 1994 endosulfan I 641 2.5% 0.011 0.29 0.5%carrots US 1994 DDD (TDE) I 380 1.3% 0.011 0.25 0.4%carrots US 1994 dicloran F 655 1.1% 0.203 0.13 0.2%carrots US 1994 hexachlorobenzene F 655 0.2% 0.005 0.09 0.1%carrots US 1994 chlorpyrifos I 655 0.2% 0.005 0.03 0.1%carrots US 1994 pentachloroaniline (PCA) F 50 6.0% 0.008 0.01 0.02%carrots US 1994 quintozene (PCNB) F 655 0.3% 0.007 0.01 0.01%carrots US 1994 captan F 521 1.3% 0.020 0.01 0.01%carrots US 1994 o-phenylphenol F 286 0.3% 0.014 0.00 0.01%carrots US 1994 thiabendazole F 646 0.3% 0.025 0.00 0.003%
Totals 63.65 100.0%
celery US 1994 oxamyl I 172 16.9% 0.088 166.13 65.1%celery US 1994 acephate I 172 41.3% 0.106 47.91 18.8%celery US 1994 dicloran F 172 52.9% 0.242 7.66 3.0%celery US 1994 chlorothalonil F 172 67.4% 0.091 7.26 2.8%celery US 1994 methamidophos I 172 25.6% 0.011 6.58 2.6%
Table 5.

Food Origin Year Pesticide TypeNumber of Samples
Percent Positive
Mean Residue
Toxicity Index
Share of Toxicity by Pesticide
celery US 1994 parathion-methyl I 172 0.6% 0.005 5.63 2.2%celery US 1994 permethrin I 172 29.7% 0.079 4.54 1.8%celery US 1994 methomyl I 172 3.5% 0.037 2.82 1.1%celery US 1994 mevinphos I 172 2.3% 0.009 2.60 1.0%celery US 1994 chlorpyrifos I 172 2.3% 0.015 1.56 0.6%celery US 1994 DDE I 172 8.1% 0.007 1.43 0.6%celery US 1994 diazinon I 172 4.7% 0.010 0.85 0.3%celery US 1994 iprodione F 172 0.6% 0.030 0.05 0.02%celery US 1994 endosulfan I 172 0.6% 0.005 0.03 0.01%
Totals 255.05 100.0%
grapes Chile 1996 omethoate I 234 33.8% 0.047 76.07 22.4%grapes Chile 1996 iprodione F 279 66.7% 0.295 60.98 18.0%grapes Chile 1996 dimethoate I 279 28.3% 0.075 58.23 17.2%grapes Chile 1996 hexachlorobenzene F 279 0.4% 1.300 55.06 16.2%grapes Chile 1996 chlorpyrifos I 279 20.1% 0.049 43.83 12.9%grapes Chile 1996 methomyl I 279 3.9% 0.165 14.34 4.2%grapes Chile 1996 carbaryl I 279 7.9% 0.201 7.00 2.1%grapes Chile 1996 parathion-ethyl I 234 3.0% 0.016 6.56 1.9%grapes Chile 1996 vinclozolin F 278 6.8% 0.206 4.58 1.4%grapes Chile 1996 carbofuran-3 OH I 279 0.4% 0.300 4.20 1.2%grapes Chile 1996 azinphos-methyl I 279 5.0% 0.028 3.70 1.1%grapes Chile 1996 captan F 279 73.1% 0.155 2.64 0.8%grapes Chile 1996 diazinon I 279 2.9% 0.022 1.20 0.4%grapes Chile 1996 fenbutatin oxide I 239 7.1% 0.109 0.29 0.1%grapes Chile 1996 myclobutanil F 279 7.5% 0.040 0.20 0.1%grapes Chile 1996 phosmet I 234 1.3% 0.015 0.10 0.03%grapes Chile 1996 DDE I 279 0.4% 0.004 0.03 0.01%grapes Chile 1996 endosulfan I I 279 0.4% 0.003 0.01 0.003%grapes Chile 1996 chlorothalonil F 227 0.4% 0.012 0.01 0.002%
Totals 339.03 100.0%
grapes Chile 1995 omethoate I 184 28.3% 0.053 72.75 30.1%grapes Chile 1995 iprodione F 255 57.6% 0.279 49.80 20.6%grapes Chile 1995 dimethoate I 255 23.5% 0.068 44.15 18.3%grapes Chile 1995 chlorpyrifos I 256 14.1% 0.033 21.05 8.7%grapes Chile 1995 vinclozolin F 256 39.1% 0.162 20.62 8.5%grapes Chile 1995 carbofuran-3 OH I 256 1.2% 0.254 11.62 4.8%grapes Chile 1995 methomyl I 256 0.8% 0.385 6.61 2.7%grapes Chile 1995 carbaryl I 256 5.1% 0.141 3.18 1.3%grapes Chile 1995 captan F 255 85.1% 0.160 3.18 1.3%grapes Chile 1995 mevinphos I 256 1.6% 0.016 3.06 1.3%grapes Chile 1995 azinphos-methyl I 256 1.2% 0.067 2.09 0.9%grapes Chile 1995 parathion-ethyl I 256 2.0% 0.006 1.71 0.7%grapes Chile 1995 carbofuran I 256 0.8% 0.023 0.69 0.3%grapes Chile 1995 diazinon I 256 2.0% 0.013 0.49 0.2%grapes Chile 1995 dicofol I 256 0.4% 0.008 0.10 0.0%grapes Chile 1995 myclobutanil F 256 5.5% 0.027 0.10 0.0%grapes Chile 1995 phosmet I 256 1.2% 0.010 0.06 0.0%grapes Chile 1995 fenvalerate I 256 0.4% 0.070 0.03 0.0%
Totals 241.30 100.0%
grapes Chile 1994 omethoate I 226 19.0% 0.049 45.03 24.9%grapes Chile 1994 dimethoate I 255 21.2% 0.063 36.40 20.1%grapes Chile 1994 iprodione F 255 51.8% 0.215 34.58 19.1%grapes Chile 1994 mevinphos I 255 1.2% 0.091 13.24 7.3%grapes Chile 1994 chlorpyrifos I 255 11.8% 0.023 12.14 6.7%grapes Chile 1994 vinclozolin F 255 29.0% 0.116 10.91 6.0%grapes Chile 1994 carbofuran-3 OH I 168 0.6% 0.340 7.91 4.4%grapes Chile 1994 azinphos-methyl I 255 3.9% 0.060 6.33 3.5%grapes Chile 1994 captan F 255 76.1% 0.217 3.85 2.1%grapes Chile 1994 parathion-methyl I 255 0.4% 0.005 3.80 2.1%grapes Chile 1994 parathion-ethyl I 235 1.7% 0.010 2.33 1.3%grapes Chile 1994 diazinon I 255 3.5% 0.027 1.85 1.0%grapes Chile 1994 methomyl I 255 0.8% 0.047 0.80 0.4%grapes Chile 1994 carbaryl I 255 2.0% 0.074 0.64 0.4%grapes Chile 1994 benomyl F 251 5.2% 0.123 0.61 0.3%grapes Chile 1994 phosmet I 255 1.2% 0.070 0.45 0.2%grapes Chile 1994 thiabendazole F 255 0.8% 0.300 0.05 0.03%grapes Chile 1994 myclobutanil F 255 2.0% 0.033 0.04 0.02%grapes Chile 1994 diphenylamine (DPA) F 230 0.4% 0.017 0.01 0.01%grapes Chile 1994 dicloran F 255 0.8% 0.010 0.00 0.003%
Totals 180.99 100.0%
grapes Mexico 1996 methomyl I 24 20.8% 0.073 33.61 47.1%grapes Mexico 1996 carbofuran-3 OH I 24 12.5% 0.063 30.63 42.9%
Table 5.

Food Origin Year Pesticide TypeNumber of Samples
Percent Positive
Mean Residue
Toxicity Index
Share of Toxicity by Pesticide
grapes Mexico 1996 myclobutanil F 24 50.0% 0.122 4.19 5.9%grapes Mexico 1996 dimethoate I 24 4.2% 0.015 1.72 2.4%grapes Mexico 1996 omethoate I 20 5.0% 0.005 1.21 1.7%grapes Mexico 1996 fenbutatin oxide I 22 4.5% 0.011 0.02 0.03%
Totals 71.38 100.0%
grapes Mexico 1995 omethoate I 38 23.7% 0.027 30.57 38.7%grapes Mexico 1995 carbofuran-3 OH I 46 4.3% 0.141 23.89 30.2%grapes Mexico 1995 methomyl I 46 15.2% 0.020 6.79 8.6%grapes Mexico 1995 iprodione F 46 6.5% 0.248 5.01 6.3%grapes Mexico 1995 carbofuran I 46 2.2% 0.052 4.42 5.6%grapes Mexico 1995 dimethoate I 46 13.0% 0.010 3.59 4.5%grapes Mexico 1995 diazinon I 46 2.2% 0.037 1.55 2.0%grapes Mexico 1995 myclobutanil F 46 45.7% 0.040 1.27 1.6%grapes Mexico 1995 mevinphos I 46 2.2% 0.004 1.08 1.4%grapes Mexico 1995 endosulfans I 46 6.5% 0.009 0.57 0.7%grapes Mexico 1995 fenbutatin oxide I 11 9.1% 0.038 0.13 0.2%grapes Mexico 1995 carbaryl I 46 2.2% 0.011 0.11 0.1%grapes Mexico 1995 captan F 46 19.6% 0.020 0.09 0.1%
Totals 79.04 100.0%
grapes Mexico 1994 omethoate I 21 9.5% 0.012 5.30 51.4%grapes Mexico 1994 benomyl F 32 6.3% 0.380 2.28 22.1%grapes Mexico 1994 myclobutanil F 32 28.1% 0.101 1.95 18.9%grapes Mexico 1994 dimethoate I 32 6.3% 0.005 0.77 7.5%grapes Mexico 1994 captan F 32 3.1% 0.020 0.01 0.1%grapes Mexico 1994 dicloran F 32 3.1% 0.005 0.01 0.1%
Totals 10.32 100.0%
grapes South Africa 1996 iprodione F 10 100.0% 0.371 115.21 68.4%grapes South Africa 1996 omethoate I 7 28.6% 0.026 35.27 20.9%grapes South Africa 1996 dimethoate I 10 40.0% 0.014 14.85 8.8%grapes South Africa 1996 dichlorvos I 10 10.0% 0.003 2.53 1.5%grapes South Africa 1996 captan F 10 10.0% 0.280 0.65 0.4%
Totals 168.51 100.0%
grapes US 1996 dicofol I 211 8.1% 0.447 116.42 51.1%grapes US 1996 methomyl I 211 10.9% 0.299 71.59 31.4%grapes US 1996 iprodione F 211 19.9% 0.139 8.57 3.8%grapes US 1996 phosmet I 177 5.1% 0.274 7.67 3.4%grapes US 1996 endosulfan II I 211 4.3% 0.087 3.71 1.6%grapes US 1996 chlorpyrifos I 211 7.6% 0.011 3.67 1.6%grapes US 1996 myclobutanil F 211 46.4% 0.104 3.32 1.5%grapes US 1996 carbaryl I 211 5.7% 0.129 3.25 1.4%grapes US 1996 fenamiphos sulfoxide I 115 1.7% 0.008 2.05 0.9%grapes US 1996 omethoate I 183 2.2% 0.017 1.80 0.8%grapes US 1996 propargite I 211 4.3% 0.211 1.40 0.6%grapes US 1996 endosulfan I I 211 2.8% 0.039 1.11 0.5%grapes US 1996 endosulfan sulfate I 211 3.8% 0.020 0.76 0.3%grapes US 1996 fenbutatin oxide I 51 2.0% 0.820 0.60 0.3%grapes US 1996 dicloran F 211 5.7% 0.148 0.50 0.2%grapes US 1996 diazinon I 211 0.9% 0.023 0.41 0.2%grapes US 1996 DDE I 211 2.8% 0.006 0.38 0.2%grapes US 1996 azinphos-methyl I 211 0.9% 0.013 0.33 0.1%grapes US 1996 dimethoate I 211 1.4% 0.005 0.18 0.1%grapes US 1996 captan F 210 6.2% 0.033 0.05 0.02%
Totals 227.78 100.0%
grapes US 1995 dicofol I 377 11.1% 0.464 167.21 50.9%grapes US 1995 parathion-methyl I 379 0.5% 0.072 73.05 22.2%grapes US 1995 methomyl I 378 10.3% 0.130 29.54 9.0%grapes US 1995 omethoate I 301 10.3% 0.035 17.68 5.4%grapes US 1995 dimethoate I 379 6.9% 0.079 14.82 4.5%grapes US 1995 iprodione F 379 30.1% 0.157 14.64 4.5%grapes US 1995 propargite I 378 8.7% 0.222 2.99 0.9%grapes US 1995 endosulfans I 379 6.6% 0.029 1.94 0.6%grapes US 1995 myclobutanil F 378 35.2% 0.075 1.83 0.6%grapes US 1995 chlorpyrifos I 379 5.3% 0.007 1.76 0.5%grapes US 1995 fenbutatin oxide I 300 13.7% 0.163 0.82 0.2%grapes US 1995 dicloran F 379 4.7% 0.187 0.52 0.2%grapes US 1995 carbaryl I 379 1.3% 0.086 0.50 0.2%grapes US 1995 benomyl F 379 2.4% 0.174 0.40 0.1%grapes US 1995 DDE I 379 2.9% 0.005 0.38 0.1%grapes US 1995 DDT I 183 0.5% 0.010 0.27 0.1%grapes US 1995 vinclozolin F 379 0.5% 0.105 0.18 0.1%grapes US 1995 captan F 379 7.4% 0.042 0.07 0.02%
Table 5.

Food Origin Year Pesticide TypeNumber of Samples
Percent Positive
Mean Residue
Toxicity Index
Share of Toxicity by Pesticide
grapes US 1995 phosmet I 351 0.6% 0.018 0.06 0.02%grapes US 1995 diazinon I 379 0.3% 0.006 0.03 0.01%grapes US 1995 methamidophos I 379 0.3% 0.004 0.02 0.01%grapes US 1995 acephate I 379 0.3% 0.006 0.02 0.01%grapes US 1995 diphenylamine F 375 0.3% 0.014 0.01 0.002%grapes US 1995 thiabendazole F 758 0.1% 0.050 0.00 0.0004%
Totals 328.73 100.0%
grapes US 1994 parathion-methyl I 377 3.4% 0.208 1,387.19 89.4%grapes US 1994 dicofol I 377 5.8% 0.317 59.86 3.9%grapes US 1994 methomyl I 377 14.9% 0.168 55.00 3.5%grapes US 1994 iprodione F 377 29.7% 0.191 17.57 1.1%grapes US 1994 azinphos-methyl I 377 1.9% 0.203 10.08 0.6%grapes US 1994 omethoate I 324 5.6% 0.021 5.53 0.4%grapes US 1994 endosulfan I 377 14.6% 0.027 3.94 0.3%grapes US 1994 propargite I 377 9.3% 0.199 2.88 0.2%grapes US 1994 dimethoate I 377 5.3% 0.017 2.50 0.2%grapes US 1994 chlorpyrifos I 377 0.8% 0.054 1.93 0.1%grapes US 1994 carbaryl I 377 1.9% 0.199 1.64 0.1%grapes US 1994 myclobutanil F 377 31.8% 0.069 1.51 0.1%grapes US 1994 benomyl F 388 4.6% 0.261 1.16 0.1%grapes US 1994 dicloran F 377 6.4% 0.132 0.50 0.03%grapes US 1994 diazinon I 377 0.8% 0.012 0.18 0.01%grapes US 1994 DDE I 377 0.3% 0.004 0.03 0.002%grapes US 1994 methamidophos I 377 0.3% 0.004 0.02 0.002%grapes US 1994 vinclozolin F 376 0.3% 0.024 0.02 0.001%grapes US 1994 acephate I 377 0.3% 0.006 0.02 0.001%grapes US 1994 captan F 370 3.2% 0.021 0.02 0.001%grapes US 1994 lindane I 377 0.3% 0.005 0.02 0.001%grapes US 1994 thiabendazole F 377 0.3% 0.013 0.00 0.00005%
Totals 1,551.58 100.0%
green beans Mexico 1995 endosulfans I 80 41.3% 0.060 25.02 64.5%green beans Mexico 1995 carbaryl I 80 5.0% 0.382 8.47 21.8%green beans Mexico 1995 acephate I 80 3.8% 0.066 2.71 7.0%green beans Mexico 1995 methamidophos I 80 6.3% 0.013 1.77 4.6%green beans Mexico 1995 iprodione F 80 1.3% 0.140 0.54 1.4%green beans Mexico 1995 captan F 69 15.9% 0.075 0.28 0.7%
Totals 38.79 100.0%
green beans Mexico 1994 endosulfan I 83 57.8% 0.085 49.29 50.8%green beans Mexico 1994 methomyl I 83 1.2% 0.440 11.65 12.0%green beans Mexico 1994 dimethoate I 83 8.4% 0.049 11.26 11.6%green beans Mexico 1994 benomyl F 80 28.8% 0.391 10.78 11.1%green beans Mexico 1994 iprodione F 83 6.0% 0.355 6.64 6.8%green beans Mexico 1994 carbaryl I 83 1.2% 0.570 3.04 3.1%green beans Mexico 1994 methamidophos I 83 6.0% 0.014 1.87 1.9%green beans Mexico 1994 chlorothalonil F 83 1.2% 0.570 0.82 0.8%green beans Mexico 1994 azinphos-methyl I 83 1.2% 0.020 0.65 0.7%green beans Mexico 1994 omethoate I 61 1.6% 0.005 0.40 0.4%green beans Mexico 1994 acephate I 83 1.2% 0.026 0.34 0.4%green beans Mexico 1994 permethrin I 83 1.2% 0.103 0.24 0.2%green beans Mexico 1994 captan F 78 2.6% 0.070 0.04 0.04%
Totals 97.02 100.0%
green beans US 1995 acephate I 483 23.2% 0.236 59.98 27.0%green beans US 1995 demeton-S-sulfone I 72 5.6% 0.026 47.52 21.4%green beans US 1995 methamidophos I 483 20.9% 0.099 46.68 21.0%green beans US 1995 endosulfans I 483 21.1% 0.133 28.23 12.7%green beans US 1995 dimethoate I 483 5.0% 0.088 12.02 5.4%green beans US 1995 methomyl I 483 4.6% 0.072 7.26 3.3%green beans US 1995 omethoate I 302 4.3% 0.025 5.19 2.3%green beans US 1995 diazinon I 483 0.6% 0.385 4.60 2.1%green beans US 1995 carbaryl I 482 2.7% 0.230 2.75 1.2%green beans US 1995 iprodione F 483 1.7% 0.324 1.67 0.7%green beans US 1995 chlorothalonil F 483 16.4% 0.074 1.44 0.6%green beans US 1995 esfenvalerate I 389 5.9% 0.044 1.29 0.6%green beans US 1995 vinclozolin F 387 3.6% 0.106 1.25 0.6%green beans US 1995 azinphos-methyl I 483 0.8% 0.027 0.60 0.3%green beans US 1995 oxamyl I 483 0.2% 0.025 0.58 0.3%green beans US 1995 DDE I 483 1.7% 0.008 0.30 0.1%green beans US 1995 DDT I 178 0.6% 0.010 0.28 0.1%green beans US 1995 permethrin I 483 1.0% 0.113 0.23 0.1%green beans US 1995 dicloran F 483 0.6% 0.467 0.17 0.1%
Table 5.

Food Origin Year Pesticide TypeNumber of Samples
Percent Positive
Mean Residue
Toxicity Index
Share of Toxicity by Pesticide
green beans US 1995 methidathion I 483 0.2% 0.040 0.17 0.1%green beans US 1995 metalaxyl F 18 33.3% 0.005 0.10 0.05%green beans US 1995 quintozene F 483 3.1% 0.006 0.09 0.04%green beans US 1995 dicofol I 483 0.2% 0.008 0.05 0.02%green beans US 1995 lindane I 483 0.2% 0.005 0.01 0.01%green beans US 1995 captan F 349 0.3% 0.140 0.01 0.004%green beans US 1995 fenvalerate I 483 0.2% 0.020 0.00 0.002%
Totals 222.47 100.0%
green beans US 1994 acephate I 484 25.6% 0.298 83.66 28.5%green beans US 1994 methamidophos I 484 24.2% 0.114 62.27 21.2%green beans US 1994 dimethoate I 484 7.9% 0.238 51.45 17.5%green beans US 1994 endosulfan I 484 23.8% 0.188 44.84 15.3%green beans US 1994 omethoate I 379 7.7% 0.052 19.22 6.5%green beans US 1994 methomyl I 484 4.1% 0.132 11.98 4.1%green beans US 1994 carbaryl I 484 5.2% 0.253 5.78 2.0%green beans US 1994 aldicarb sulfoxide I 483 0.2% 0.076 5.55 1.9%green beans US 1994 benomyl F 479 10.9% 0.265 2.76 0.9%green beans US 1994 chlorothalonil F 482 19.3% 0.090 2.05 0.7%green beans US 1994 iprodione F 484 1.4% 0.329 1.48 0.5%green beans US 1994 vinclozolin F 385 3.6% 0.056 0.67 0.2%green beans US 1994 azinphos-methyl I 483 0.6% 0.031 0.52 0.2%green beans US 1994 carbofuran I 450 0.7% 0.017 0.43 0.1%green beans US 1994 esfenvalerate I 243 1.6% 0.051 0.42 0.1%green beans US 1994 DDE I 484 0.8% 0.012 0.24 0.1%green beans US 1994 dichlorvos (DDVP) I 484 0.2% 0.012 0.21 0.1%green beans US 1994 quintozene (PCNB) F 484 4.1% 0.008 0.14 0.05%green beans US 1994 dicloran F 484 1.7% 0.103 0.10 0.03%green beans US 1994 permethrin I 484 0.4% 0.124 0.10 0.03%green beans US 1994 aldoxycarb I 395 0.3% 0.013 0.08 0.03%green beans US 1994 diazinon I 484 0.4% 0.009 0.07 0.02%green beans US 1994 fenvalerate I 372 0.5% 0.038 0.02 0.01%
Totals 294.02 100.0%
green beans, canned/frozen US 1997 parathion-methyl I 691 4.6% 0.048 432.63 81.8%green beans, canned/frozen US 1997 acephate I 654 46.3% 0.074 37.72 7.1%green beans, canned/frozen US 1997 methamidophos I 664 45.3% 0.027 27.68 5.2%green beans, canned/frozen US 1997 demeton-S-sulfone I 107 9.3% 0.007 20.29 3.8%green beans, canned/frozen US 1997 carbaryl I 683 10.7% 0.070 3.33 0.6%green beans, canned/frozen US 1997 dimethoate I 690 1.9% 0.038 1.98 0.4%green beans, canned/frozen US 1997 vinclozolin F 669 18.2% 0.030 1.78 0.3%green beans, canned/frozen US 1997 dicofol I 691 0.6% 0.049 0.92 0.2%green beans, canned/frozen US 1997 methomyl I 691 1.0% 0.033 0.74 0.1%green beans, canned/frozen US 1997 carbofuran I 687 0.3% 0.043 0.48 0.1%green beans, canned/frozen US 1997 omethoate I 691 0.7% 0.013 0.47 0.1%green beans, canned/frozen US 1997 esfenvalerate I 557 1.4% 0.040 0.29 0.1%green beans, canned/frozen US 1997 diazinon I 691 1.0% 0.008 0.15 0.03%green beans, canned/frozen US 1997 diphenylamine (DPA) F 678 0.9% 0.071 0.09 0.02%green beans, canned/frozen US 1997 fenvalerate I 691 1.2% 0.058 0.08 0.01%green beans, canned/frozen US 1997 DDE I 691 0.3% 0.008 0.05 0.01%green beans, canned/frozen US 1997 endosulfan sulfate I 691 0.6% 0.008 0.05 0.01%green beans, canned/frozen US 1997 iprodione F 691 0.4% 0.030 0.04 0.01%green beans, canned/frozen US 1997 endosulfan II I 691 0.4% 0.005 0.02 0.004%green beans, canned/frozen US 1997 endosulfan I I 691 0.4% 0.003 0.01 0.002%green beans, canned/frozen US 1997 propargite I 691 0.1% 0.037 0.01 0.002%green beans, canned/frozen US 1997 o-phenylphenol F 599 0.8% 0.013 0.01 0.002%green beans, canned/frozen US 1997 quintozene F 691 0.1% 0.005 0.00 0.001%green beans, canned/frozen US 1997 dicloran F 691 0.3% 0.013 0.00 0.0004%green beans, canned/frozen US 1997 metalaxyl F 194 0.5% 0.005 0.00 0.0003%green beans, canned/frozen US 1997 thiabendazole F 691 0.1% 0.015 0.00 0.0001%
Totals 528.84 100.0%
green beans, canned/frozen US 1996 parathion-methyl I 525 3.4% 0.016 109.17 49.3%green beans, canned/frozen US 1996 demeton-S-sulfone I 80 13.8% 0.009 39.06 17.6%green beans, canned/frozen US 1996 acephate I 525 33.9% 0.099 36.97 16.7%green beans, canned/frozen US 1996 methamidophos I 525 32.6% 0.034 24.99 11.3%green beans, canned/frozen US 1996 carbaryl I 525 12.0% 0.059 3.12 1.4%green beans, canned/frozen US 1996 dimethoate I 525 2.9% 0.030 2.34 1.1%green beans, canned/frozen US 1996 vinclozolin F 410 20.2% 0.029 1.91 0.9%green beans, canned/frozen US 1996 omethoate I 446 2.9% 0.013 1.87 0.8%green beans, canned/frozen US 1996 esfenvalerate I 410 3.4% 0.033 0.56 0.3%green beans, canned/frozen US 1996 methomyl I 525 1.0% 0.027 0.56 0.3%green beans, canned/frozen US 1996 DDT I 197 0.5% 0.010 0.25 0.1%green beans, canned/frozen US 1996 dicofol I 525 0.2% 0.030 0.18 0.1%green beans, canned/frozen US 1996 diazinon I 525 0.8% 0.009 0.14 0.1%green beans, canned/frozen US 1996 DDE I 525 0.8% 0.007 0.13 0.1%
Table 5.

Food Origin Year Pesticide TypeNumber of Samples
Percent Positive
Mean Residue
Toxicity Index
Share of Toxicity by Pesticide
green beans, canned/frozen US 1996 fenvalerate I 525 1.7% 0.056 0.11 0.05%green beans, canned/frozen US 1996 endosulfan sulfate I 525 0.8% 0.008 0.06 0.03%green beans, canned/frozen US 1996 iprodione F 525 0.8% 0.022 0.05 0.02%green beans, canned/frozen US 1996 permethrin I 525 0.4% 0.058 0.04 0.02%green beans, canned/frozen US 1996 o-phenylphenol F 440 2.0% 0.025 0.04 0.02%green beans, canned/frozen US 1996 endosulfan I I 525 0.6% 0.004 0.02 0.01%green beans, canned/frozen US 1996 metalaxyl F 80 6.3% 0.005 0.02 0.01%green beans, canned/frozen US 1996 endosulfan II I 525 0.2% 0.005 0.01 0.004%green beans, canned/frozen US 1996 quintozene F 525 0.2% 0.005 0.00 0.002%
Totals 221.62 100.0%
lettuce US 1994 mevinphos I 688 11.0% 0.044 60.93 50.1%lettuce US 1994 methomyl I 688 4.9% 0.164 17.86 14.7%lettuce US 1994 dimethoate I 688 11.9% 0.040 13.04 10.7%lettuce US 1994 permethrin I 690 14.1% 0.374 10.19 8.4%lettuce US 1994 endosulfan I 688 21.1% 0.042 8.86 7.3%lettuce US 1994 acephate I 688 12.8% 0.026 3.62 3.0%lettuce US 1994 omethoate I 488 5.1% 0.012 2.89 2.4%lettuce US 1994 diazinon I 688 3.9% 0.017 1.28 1.1%lettuce US 1994 methamidophos I 688 5.8% 0.010 1.25 1.0%lettuce US 1994 cypermethrin I 98 1.0% 0.100 0.74 0.6%lettuce US 1994 DDE I 688 2.9% 0.010 0.71 0.6%lettuce US 1994 DDT I 421 0.2% 0.013 0.15 0.1%lettuce US 1994 chlorpyrifos I 688 0.1% 0.010 0.07 0.1%lettuce US 1994 dicloran F 688 0.9% 0.042 0.02 0.02%lettuce US 1994 malathion I 688 0.3% 0.033 0.00 0.004%lettuce US 1994 chlorothalonil F 634 0.2% 0.005 0.00 0.001%
Totals 121.60 100.0%
milk US 1997 DDE I 727 14.2% 0.003 1.01 96.4%milk US 1997 o-phenylphenol F 273 1.8% 0.011 0.02 1.5%milk US 1997 ivermectin I 424 0.2% 0.002 0.02 1.5%milk US 1997 thiabendazole F 543 0.4% 0.050 0.00 0.4%milk US 1997 diphenylamine (DPA) F 665 0.2% 0.010 0.00 0.2%
Totals 1.05 100.0%
milk US 1996 DDE I 570 17.4% 0.002 1.05 94.9%milk US 1996 dichlorvos I 570 0.2% 0.003 0.04 4.0%milk US 1996 o-phenylphenol F 202 0.5% 0.010 0.00 0.3%
milk US 1996 thiabendazole F 536 0.7% 0.050 0.01 0.7%Totals 1.10 100.0%
orange juice Brazil 1997 aldicarb I 66 1.5% 0.035 18.70 82.4%orange juice Brazil 1997 ethion I 66 34.8% 0.002 1.92 8.5%orange juice Brazil 1997 methidathion I 66 6.1% 0.005 0.61 2.7%orange juice Brazil 1997 dicofol I 66 1.5% 0.010 0.49 2.2%orange juice Brazil 1997 imazalil F 66 3.0% 0.046 0.47 2.1%orange juice Brazil 1997 carbaryl I 66 9.1% 0.011 0.42 1.9%orange juice Brazil 1997 thiabendazole F 66 6.1% 0.048 0.06 0.3%orange juice Brazil 1997 o-phenylphenol F 65 1.5% 0.017 0.02 0.1%
Totals 22.70 100.0%
orange juice US 1997 imazalil F 480 4.0% 0.043 0.58 32.1%orange juice US 1997 ethion I 487 9.2% 0.002 0.58 31.7%orange juice US 1997 carbaryl I 487 3.7% 0.012 0.19 10.5%orange juice US 1997 thiabendazole F 480 8.3% 0.079 0.14 7.8%orange juice US 1997 methidathion I 487 1.2% 0.005 0.12 6.9%orange juice US 1997 dicofol I 487 0.2% 0.010 0.07 3.7%orange juice US 1997 o-phenylphenol F 398 3.8% 0.020 0.06 3.2%orange juice US 1997 chlorpyrifos I 487 0.2% 0.005 0.05 2.5%orange juice US 1997 diphenylamine (DPA) F 474 0.4% 0.050 0.03 1.7%
Totals 1.82 100.0%
oranges Australia 1995 imazalil F 7 71.4% 0.121 29.31 98.9%oranges Australia 1995 thiabendazole F 14 7.1% 0.210 0.32 1.1%
Totals 29.63 100.0%
oranges US 1996 imazalil F 511 58.1% 0.174 34.42 69.6%oranges US 1996 chlorpyrifos I 511 12.1% 0.007 3.62 7.3%oranges US 1996 o-phenylphenol F 447 14.8% 0.227 2.53 5.1%oranges US 1996 aldicarb sulfoxide I 511 0.4% 0.017 2.35 4.7%oranges US 1996 carbaryl I 511 11.9% 0.042 2.20 4.5%oranges US 1996 thiabendazole F 511 44.4% 0.199 1.90 3.8%oranges US 1996 methidathion I 511 6.5% 0.009 1.13 2.3%oranges US 1996 dicofol I 511 0.6% 0.023 0.44 0.9%
Table 5.

Food Origin Year Pesticide TypeNumber of Samples
Percent Positive
Mean Residue
Toxicity Index
Share of Toxicity by Pesticide
oranges US 1996 ethion I 511 0.8% 0.018 0.37 0.7%oranges US 1996 omethoate I 432 0.5% 0.008 0.17 0.3%oranges US 1996 azinphos-methyl I 511 0.2% 0.020 0.10 0.2%oranges US 1996 propargite I 511 2.2% 0.025 0.08 0.2%oranges US 1996 dimethoate I 511 0.4% 0.007 0.07 0.1%oranges US 1996 endosulfan sulfate I 511 1.0% 0.005 0.05 0.1%oranges US 1996 diphenylamine F 447 0.2% 0.086 0.03 0.1%oranges US 1996 malathion I 511 0.8% 0.011 0.00 0.01%oranges US 1996 fenbutatin oxide I 340 0.9% 0.005 0.00 0.003%
Totals 49.48 100.0%
oranges US 1995 imazalil F 680 57.1% 0.115 22.32 59.2%oranges US 1995 formetanate HCL I 512 3.5% 0.096 6.84 18.1%oranges US 1995 carbaryl I 680 10.4% 0.047 2.19 5.8%oranges US 1995 chlorpyrifos I 680 7.4% 0.005 1.79 4.7%oranges US 1995 thiabendazole F 1186 34.7% 0.210 1.57 4.2%oranges US 1995 aldicarb sulfoxide I 680 0.1% 0.015 0.78 2.1%oranges US 1995 methidathion I 680 3.1% 0.008 0.53 1.4%oranges US 1995 o-phenylphenol F 513 15.6% 0.042 0.49 1.3%oranges US 1995 omethoate I 614 0.8% 0.010 0.40 1.1%oranges US 1995 azinphos-methyl I 680 0.1% 0.073 0.29 0.8%oranges US 1995 propargite I 655 0.3% 0.580 0.27 0.7%oranges US 1995 endosulfans I 680 2.1% 0.005 0.10 0.3%oranges US 1995 dimethoate I 680 0.4% 0.004 0.05 0.1%oranges US 1995 ethion I 680 0.7% 0.002 0.04 0.1%oranges US 1995 dicofol I 680 0.1% 0.008 0.04 0.1%oranges US 1995 fenbutatin oxide I 338 0.9% 0.005 0.00 0.004%oranges US 1995 malathion I 680 0.3% 0.009 0.00 0.003%
Totals 37.70 100.0%
oranges US 1994 formetanate HCL I 663 10.6% 0.499 106.91 77.4%oranges US 1994 imazalil F 676 52.4% 0.110 19.62 14.2%oranges US 1994 thiabendazole F 676 62.3% 0.198 2.65 1.9%oranges US 1994 chlorpyrifos I 676 4.7% 0.009 1.82 1.3%oranges US 1994 carbaryl I 676 7.7% 0.044 1.50 1.1%oranges US 1994 aldicarb sulfoxide I 676 0.1% 0.025 1.30 0.9%oranges US 1994 ethion I 676 3.6% 0.012 1.11 0.8%oranges US 1994 dicofol I 676 1.5% 0.023 1.10 0.8%oranges US 1994 methidathion I 676 4.7% 0.009 0.83 0.6%oranges US 1994 omethoate I 583 0.9% 0.010 0.40 0.3%oranges US 1994 o-phenylphenol F 346 18.5% 0.026 0.36 0.3%oranges US 1994 dimethoate I 676 1.8% 0.005 0.26 0.2%oranges US 1994 carbofuran I 551 0.2% 0.030 0.21 0.2%oranges US 1994 endosulfan I 676 1.5% 0.005 0.07 0.1%oranges US 1994 benomyl F 679 0.4% 0.073 0.03 0.02%
Totals 138.18 100.0%
peaches Chile 1996 iprodione F 126 80.2% 0.857 213.27 45.3%peaches Chile 1996 azinphos-methyl I 126 72.2% 0.072 138.89 29.5%peaches Chile 1996 dicofol I 126 4.0% 0.278 35.62 7.6%peaches Chile 1996 benomyl F 130 56.9% 0.511 27.88 5.9%peaches Chile 1996 chlorpyrifos I 126 34.9% 0.010 16.36 3.5%peaches Chile 1996 phosmet I 105 21.0% 0.114 13.18 2.8%peaches Chile 1996 propargite I 126 12.7% 0.422 8.35 1.8%peaches Chile 1996 carbaryl I 127 15.7% 0.052 3.60 0.8%peaches Chile 1996 endosulfan II I 126 9.5% 0.036 3.42 0.7%peaches Chile 1996 dicloran F 126 4.8% 0.860 2.45 0.5%peaches Chile 1996 diazinon I 126 7.9% 0.016 2.41 0.5%peaches Chile 1996 endosulfan sulfate I 126 9.5% 0.019 1.81 0.4%peaches Chile 1996 methomyl I 127 0.8% 0.093 1.61 0.3%peaches Chile 1996 endosulfan I I 126 6.3% 0.017 1.05 0.2%peaches Chile 1996 captan F 126 9.5% 0.269 0.60 0.1%peaches Chile 1996 diphenylamine F 104 4.8% 0.081 0.57 0.1%peaches Chile 1996 methamidophos I 126 0.8% 0.005 0.09 0.0%peaches Chile 1996 imazalil F 126 0.8% 0.017 0.05 0.0%peaches Chile 1996 fenvalerate I 126 1.6% 0.025 0.05 0.0%peaches Chile 1996 fenbutatin oxide I 118 1.7% 0.040 0.02 0.0%
Totals 471.27 100.0%
peaches Chile 1995 iprodione F 115 75.7% 0.638 149.62 40.9%peaches Chile 1995 azinphos-methyl I 115 59.1% 0.070 111.53 30.5%peaches Chile 1995 dicofol I 115 3.5% 0.320 36.00 9.8%peaches Chile 1995 phosmet I 103 27.2% 0.095 14.24 3.9%peaches Chile 1995 chlorpyrifos I 115 30.4% 0.009 12.41 3.4%peaches Chile 1995 formetanate HCL I 86 7.0% 0.085 12.04 3.3%peaches Chile 1995 dimethoate I 115 1.7% 0.184 8.80 2.4%
Table 5.

Food Origin Year Pesticide TypeNumber of Samples
Percent Positive
Mean Residue
Toxicity Index
Share of Toxicity by Pesticide
peaches Chile 1995 propargite I 115 8.7% 0.474 6.36 1.7%peaches Chile 1995 diazinon I 115 17.4% 0.017 5.68 1.6%peaches Chile 1995 carbaryl I 115 6.1% 0.187 5.04 1.4%peaches Chile 1995 omethoate I 103 1.9% 0.029 2.68 0.7%peaches Chile 1995 benomyl F 114 3.5% 0.234 0.79 0.2%peaches Chile 1995 endosulfans I 115 4.3% 0.008 0.37 0.1%peaches Chile 1995 dicloran F 115 1.7% 0.223 0.23 0.1%peaches Chile 1995 vinclozolin F 115 2.6% 0.014 0.12 0.03%peaches Chile 1995 captan F 115 10.4% 0.023 0.06 0.02%peaches Chile 1995 fenvalerate I 115 0.9% 0.038 0.04 0.01%peaches Chile 1995 permethrin I 115 0.9% 0.020 0.03 0.01%peaches Chile 1995 diphenylamine F 90 1.1% 0.017 0.03 0.01%
Totals 366.06 100.0%
peaches Chile 1994 iprodione F 123 71.5% 0.682 151.43 39.7%peaches Chile 1994 azinphos-methyl I 123 48.0% 0.114 146.59 38.5%peaches Chile 1994 benomyl F 125 61.6% 0.428 25.25 6.6%peaches Chile 1994 phosmet I 123 19.5% 0.135 14.54 3.8%peaches Chile 1994 dicofol I 123 0.8% 0.380 9.99 2.6%peaches Chile 1994 vinclozolin F 118 4.2% 0.721 9.93 2.6%peaches Chile 1994 carbaryl I 123 13.8% 0.102 6.22 1.6%peaches Chile 1994 propargite I 123 5.7% 0.518 4.59 1.2%peaches Chile 1994 diazinon I 123 21.1% 0.010 3.87 1.0%peaches Chile 1994 endosulfan I 123 5.7% 0.053 3.03 0.8%peaches Chile 1994 chlorpyrifos I 123 5.7% 0.008 1.96 0.5%peaches Chile 1994 mevinphos I 123 0.8% 0.010 1.01 0.3%peaches Chile 1994 dicloran F 123 2.4% 0.540 0.79 0.2%peaches Chile 1994 fenvalerate I 31 6.5% 0.080 0.60 0.2%peaches Chile 1994 parathion-ethyl I 109 0.9% 0.003 0.38 0.1%peaches Chile 1994 captan F 119 15.1% 0.086 0.30 0.1%peaches Chile 1994 o-phenylphenol F 43 14.0% 0.017 0.18 0.05%peaches Chile 1994 dimethoate I 123 0.8% 0.006 0.13 0.04%peaches Chile 1994 thiabendazole F 123 4.9% 0.093 0.10 0.03%peaches Chile 1994 lindane I 123 0.8% 0.010 0.09 0.02%
Totals 380.97 100.0%
peaches US 1996 parathion-methyl I 198 41.4% 0.056 4,507.05 93.0%peaches US 1996 iprodione F 198 78.3% 0.923 224.16 4.6%peaches US 1996 phosmet I 168 31.5% 0.217 37.76 0.8%peaches US 1996 carbaryl I 198 16.2% 0.412 29.45 0.6%peaches US 1996 azinphos-methyl I 198 8.6% 0.054 12.39 0.3%peaches US 1996 dicloran F 198 51.5% 0.394 12.16 0.3%peaches US 1996 propargite I 198 21.7% 0.324 10.97 0.2%peaches US 1996 methomyl I 198 1.5% 0.183 6.11 0.1%peaches US 1996 chlorpyrifos I 198 5.6% 0.008 2.01 0.04%peaches US 1996 dicofol I 198 1.0% 0.047 1.53 0.03%peaches US 1996 fenbutatin oxide I 155 22.6% 0.137 1.15 0.02%peaches US 1996 endosulfan sulfate I 198 2.0% 0.045 0.90 0.02%peaches US 1996 endosulfan II I 198 2.5% 0.020 0.50 0.01%peaches US 1996 permethrin I 198 0.5% 0.480 0.47 0.01%peaches US 1996 myclobutanil F 198 10.1% 0.055 0.38 0.01%peaches US 1996 endosulfan I I 198 2.0% 0.011 0.21 0.004%peaches US 1996 imazalil F 198 1.5% 0.017 0.09 0.002%peaches US 1996 captan F 198 5.6% 0.064 0.08 0.002%peaches US 1996 benomyl F 199 1.0% 0.083 0.08 0.002%peaches US 1996 diazinon I 198 1.0% 0.004 0.08 0.002%peaches US 1996 thiabendazole F 198 1.0% 0.042 0.01 0.0002%peaches US 1996 chlorothalonil F 198 0.5% 0.012 0.01 0.0001%
Totals 4,847.55 100.0%
peaches US 1995 parathion-methyl I 249 41.8% 0.061 4,893.41 91.0%peaches US 1995 iprodione F 249 66.7% 1.109 229.17 4.3%peaches US 1995 formetanate HCL I 80 25.0% 0.214 108.77 2.0%peaches US 1995 carbaryl I 249 18.5% 0.500 40.94 0.8%peaches US 1995 dicloran F 249 61.8% 0.866 31.29 0.6%peaches US 1995 phosmet I 215 14.4% 0.261 20.78 0.4%peaches US 1995 azinphos-methyl I 249 13.3% 0.057 20.19 0.4%peaches US 1995 propargite I 249 24.9% 0.423 16.25 0.3%peaches US 1995 chlorpyrifos I 249 10.0% 0.007 3.05 0.1%peaches US 1995 endosulfans I 249 9.6% 0.028 2.71 0.1%peaches US 1995 methoxychlor I 249 0.8% 0.420 2.60 0.05%peaches US 1995 methomyl I 249 1.2% 0.060 1.60 0.03%peaches US 1995 diazinon I 249 1.2% 0.064 1.49 0.03%peaches US 1995 captan F 249 19.3% 0.203 0.91 0.02%peaches US 1995 benomyl F 255 0.8% 0.895 0.67 0.01%peaches US 1995 permethrin I 249 3.2% 0.102 0.64 0.01%
Table 5.

Food Origin Year Pesticide TypeNumber of Samples
Percent Positive
Mean Residue
Toxicity Index
Share of Toxicity by Pesticide
peaches US 1995 esfenvalerate I 136 2.9% 0.043 0.63 0.01%peaches US 1995 fenbutatin oxide I 155 12.9% 0.050 0.24 0.004%peaches US 1995 vinclozolin F 249 0.8% 0.051 0.13 0.002%peaches US 1995 dimethoate I 249 0.8% 0.005 0.10 0.002%peaches US 1995 DDE I 249 0.4% 0.005 0.05 0.001%peaches US 1995 o-phenylphenol F 158 1.9% 0.031 0.04 0.001%peaches US 1995 myclobutanil F 249 1.2% 0.053 0.04 0.001%peaches US 1995 chlorothalonil F 235 0.4% 0.065 0.03 0.001%peaches US 1995 fenvalerate I 244 0.4% 0.020 0.01 0.0002%peaches US 1995 thiabendazole F 504 0.2% 0.050 0.00 0.00004%peaches US 1995 malathion I 249 0.8% 0.005 0.00 0.00003%
Totals 5,375.76 100.0%
peaches US 1994 parathion-methyl I 271 42.8% 0.049 4,041.74 92.1%peaches US 1994 iprodione F 271 66.4% 0.896 184.70 4.2%peaches US 1994 carbaryl I 271 16.6% 0.509 37.44 0.9%peaches US 1994 formetanate HCL I 273 6.2% 0.237 30.01 0.7%peaches US 1994 dicloran F 271 53.5% 0.898 28.75 0.7%peaches US 1994 propargite I 271 29.2% 0.473 21.46 0.5%peaches US 1994 azinphos-methyl I 271 7.4% 0.095 18.83 0.4%peaches US 1994 phosmet I 271 13.3% 0.148 10.84 0.2%peaches US 1994 methoxychlor I 271 0.7% 0.815 4.64 0.1%peaches US 1994 lindane I 271 0.4% 0.710 3.01 0.1%peaches US 1994 benomyl F 272 11.0% 0.155 1.64 0.04%peaches US 1994 chlorpyrifos I 271 3.0% 0.012 1.63 0.04%peaches US 1994 permethrin I 271 5.2% 0.146 1.46 0.03%peaches US 1994 endosulfan I 271 5.2% 0.026 1.37 0.03%peaches US 1994 vinclozolin F 271 0.7% 0.352 0.84 0.02%peaches US 1994 captan F 271 12.5% 0.129 0.38 0.01%peaches US 1994 methomyl I 270 0.4% 0.033 0.27 0.01%peaches US 1994 diazinon I 271 1.5% 0.009 0.26 0.01%peaches US 1994 o-phenylphenol F 133 10.5% 0.018 0.15 0.003%peaches US 1994 DDE I 271 0.4% 0.011 0.10 0.002%peaches US 1994 thiabendazole F 271 0.7% 0.243 0.04 0.001%peaches US 1994 myclobutanil F 271 0.4% 0.033 0.01 0.0002%peaches US 1994 chlorothalonil F 244 0.4% 0.010 0.00 0.0001%
Totals 4,389.57 100.0%
peaches, canned US 1997 carbaryl I 728 11.0% 0.079 3.86 83.3%peaches, canned US 1997 iprodione F 745 2.7% 0.030 0.25 5.3%peaches, canned US 1997 azinphos-methyl I 743 0.1% 0.053 0.19 4.1%peaches, canned US 1997 piperonyl butoxide I 112 0.9% 0.120 0.08 1.8%peaches, canned US 1997 methamidophos I 745 0.3% 0.012 0.07 1.5%peaches, canned US 1997 o-phenylphenol F 648 3.2% 0.024 0.06 1.3%peaches, canned US 1997 esfenvalerate I 402 0.2% 0.042 0.05 1.1%peaches, canned US 1997 diphenylamine (DPA) F 725 0.1% 0.140 0.03 0.6%peaches, canned US 1997 fenvalerate I 745 0.3% 0.050 0.02 0.3%peaches, canned US 1997 benomyl F 741 0.1% 0.083 0.01 0.2%peaches, canned US 1997 acephate I 743 0.1% 0.007 0.01 0.2%peaches, canned US 1997 myclobutanil F 745 0.3% 0.025 0.00 0.1%peaches, canned US 1997 thiabendazole F 743 0.3% 0.042 0.00 0.1%
Totals 4.64 100.0%
pears Argentina 1997 azinphos-methyl I 34 73.5% 0.039 76.66 48.8%pears Argentina 1997 diphenylamine (DPA) F 33 33.3% 0.634 31.20 19.9%pears Argentina 1997 phosmet I 28 53.6% 0.074 21.74 13.8%pears Argentina 1997 dicofol I 34 5.9% 0.051 9.70 6.2%pears Argentina 1997 carbaryl I 34 38.2% 0.051 8.64 5.5%pears Argentina 1997 thiabendazole F 32 50.0% 0.675 7.27 4.6%pears Argentina 1997 captan F 32 50.0% 0.120 1.40 0.9%pears Argentina 1997 propargite I 34 5.9% 0.033 0.30 0.2%pears Argentina 1997 iprodione F 34 2.9% 0.025 0.23 0.1%
Totals 157.14 100.0%
pears Chile 1997 dicofol I 66 13.6% 0.410 180.66 43.5%pears Chile 1997 azinphos-methyl I 66 63.6% 0.072 123.18 29.7%pears Chile 1997 phosmet I 58 56.9% 0.160 50.20 12.1%pears Chile 1997 chlorpyrifos I 66 15.2% 0.019 12.67 3.1%pears Chile 1997 thiabendazole F 62 53.2% 0.976 11.19 2.7%pears Chile 1997 parathion-ethyl I 58 1.7% 0.046 10.86 2.6%pears Chile 1997 diphenylamine (DPA) F 64 45.3% 0.084 5.63 1.4%pears Chile 1997 diazinon I 66 28.8% 0.008 4.34 1.0%pears Chile 1997 captan F 65 50.8% 0.354 4.19 1.0%pears Chile 1997 omethoate I 66 4.5% 0.014 3.08 0.7%pears Chile 1997 dimethoate I 66 6.1% 0.018 2.92 0.7%pears Chile 1997 propargite I 66 4.5% 0.234 1.66 0.4%
Table 5.

Food Origin Year Pesticide TypeNumber of Samples
Percent Positive
Mean Residue
Toxicity Index
Share of Toxicity by Pesticide
pears Chile 1997 iprodione F 66 16.7% 0.024 1.25 0.3%pears Chile 1997 carbaryl I 66 7.6% 0.029 0.98 0.2%pears Chile 1997 dichlorvos I 66 1.5% 0.005 0.64 0.2%pears Chile 1997 endosulfan II I 66 3.0% 0.018 0.55 0.1%pears Chile 1997 endosulfan I I 66 3.0% 0.012 0.37 0.1%pears Chile 1997 endosulfan sulfate I 66 3.0% 0.012 0.37 0.1%pears Chile 1997 methidathion I 66 1.5% 0.005 0.15 0.04%pears Chile 1997 fenvalerate I 66 1.5% 0.050 0.09 0.02%pears Chile 1997 o-phenylphenol F 58 5.2% 0.013 0.05 0.01%
Totals 415.02 100.0%
pears South Africa 1997 azinphos-methyl I 13 92.3% 0.068 168.34 83.6%pears South Africa 1997 iprodione F 13 61.5% 0.157 29.99 14.9%pears South Africa 1997 diphenylamine (DPA) F 13 61.5% 0.033 2.99 1.5%
Totals 201.32 100.0%
pears US 1997 parathion-methyl I 588 6.0% 0.018 208.11 47.8%pears US 1997 azinphos-methyl I 582 67.9% 0.089 161.15 37.0%pears US 1997 o-phenylphenol F 510 29.6% 0.820 18.34 4.2%pears US 1997 dicofol I 588 1.5% 0.328 16.23 3.7%pears US 1997 thiabendazole F 581 71.8% 0.522 8.07 1.9%pears US 1997 oxamyl I 588 1.0% 0.060 6.89 1.6%pears US 1997 phosmet I 509 13.0% 0.074 5.32 1.2%pears US 1997 formetanate HCL I 171 2.3% 0.105 4.97 1.1%pears US 1997 diphenylamine (DPA) F 576 18.8% 0.068 1.87 0.4%pears US 1997 carbaryl I 588 4.1% 0.073 1.32 0.3%pears US 1997 diazinon I 588 0.9% 0.038 0.62 0.1%pears US 1997 parathion-ethyl I 510 0.4% 0.008 0.43 0.1%pears US 1997 endosulfan II I 588 2.6% 0.015 0.40 0.1%pears US 1997 dimethoate I 588 0.2% 0.060 0.28 0.1%pears US 1997 omethoate I 588 0.2% 0.026 0.21 0.0%pears US 1997 chlorpyrifos I 588 0.3% 0.014 0.21 0.05%pears US 1997 endosulfan sulfate I 573 2.3% 0.008 0.19 0.04%pears US 1997 methoxychlor I 588 0.5% 0.044 0.17 0.04%pears US 1997 endosulfan I I 588 1.0% 0.009 0.09 0.02%pears US 1997 captan F 567 2.5% 0.092 0.05 0.01%pears US 1997 propargite I 588 0.2% 0.160 0.04 0.01%pears US 1997 esfenvalerate I 467 0.2% 0.033 0.04 0.01%pears US 1997 iprodione F 573 0.2% 0.025 0.01 0.003%pears US 1997 fenvalerate I 588 0.2% 0.050 0.01 0.002%
Totals 435.05 100.0%
potatoes US 1995 phorate sulfoxide I 310 1.6% 0.058 15.95 27.1%potatoes US 1995 demeton-S-sulfone I 144 2.1% 0.022 15.08 25.6%potatoes US 1995 phorate sulfone I 310 4.5% 0.011 8.36 14.2%potatoes US 1995 phorate oxygen analog I 59 6.8% 0.005 5.82 9.9%potatoes US 1995 DDT I 388 10.6% 0.010 5.34 9.1%potatoes US 1995 DDE I 702 15.1% 0.008 2.83 4.8%potatoes US 1995 endosulfans I 702 18.9% 0.013 2.49 4.2%potatoes US 1995 thiabendazole F 702 18.2% 0.387 1.52 2.6%potatoes US 1995 o-phenylphenol F 656 4.7% 0.168 0.59 1.0%potatoes US 1995 methamidophos I 702 2.0% 0.010 0.44 0.7%potatoes US 1995 disulfoton I 702 0.1% 0.005 0.11 0.2%potatoes US 1995 metalaxyl F 40 15.0% 0.011 0.10 0.2%potatoes US 1995 tecnazene F 101 2.0% 0.030 0.08 0.1%potatoes US 1995 quintozene F 702 0.6% 0.019 0.05 0.1%potatoes US 1995 phosphamidon I 702 0.1% 0.003 0.05 0.1%potatoes US 1995 pentachlorobenzene F 702 0.7% 0.006 0.02 0.03%potatoes US 1995 diphenylamine F 687 0.1% 0.057 0.01 0.02%
Totals 58.84 100.0%
potatoes US 1994 dieldrin I 36 11.1% 0.010 139.18 73.1%potatoes US 1994 phorate sulfoxide I 197 2.0% 0.064 22.32 11.7%potatoes US 1994 phorate sulfone I 260 2.3% 0.047 18.63 9.8%potatoes US 1994 thiabendazole F 688 23.4% 0.455 2.29 1.2%potatoes US 1994 DDE I 688 9.6% 0.010 2.27 1.2%potatoes US 1994 DDT I 491 3.9% 0.010 2.01 1.1%potatoes US 1994 endosulfan I 688 12.1% 0.016 1.97 1.0%potatoes US 1994 carbofuran I 597 0.3% 0.049 0.64 0.3%potatoes US 1994 o-phenylphenol F 357 3.9% 0.172 0.51 0.3%potatoes US 1994 carbofuran-3 OH I 579 0.2% 0.035 0.24 0.1%potatoes US 1994 methamidophos I 688 0.7% 0.010 0.16 0.1%potatoes US 1994 chlorpyrifos I 688 0.1% 0.024 0.16 0.1%potatoes US 1994 quintozene (PCNB) F 688 0.6% 0.021 0.05 0.03%potatoes US 1994 iprodione F 688 0.1% 0.088 0.04 0.02%potatoes US 1994 dimethoate I 688 0.1% 0.005 0.02 0.01%
Table 5.

Food Origin Year Pesticide TypeNumber of Samples
Percent Positive
Mean Residue
Toxicity Index
Share of Toxicity by Pesticide
potatoes US 1994 dicloran F 688 0.6% 0.046 0.02 0.01%potatoes US 1994 acephate I 688 0.1% 0.005 0.01 0.004%potatoes US 1994 captan F 603 0.2% 0.020 0.00 0.0004%
Totals 190.52 100.0%
soybean, grain US 1997 chlorpyrifos I 157 80.3% 0.014 51.56 77.6%soybean, grain US 1997 dieldrin I 159 3.8% 0.003 14.54 21.9%soybean, grain US 1997 malathion I 159 33.3% 0.014 0.21 0.3%soybean, grain US 1997 DDD I 159 0.6% 0.008 0.09 0.1%soybean, grain US 1997 thiabendazole F 136 1.5% 0.012 0.00 0.0%soybean, grain US 1997 metolachlor H 159 3.1% 0.003 0.00 0.0%
Totals 66.41 100.0%
spinach, fresh Mexico 1997 methomyl I 12 25.0% 0.347 190.50 74.4%spinach, fresh Mexico 1997 endosulfan sulfate I 12 16.7% 0.176 29.36 11.5%spinach, fresh Mexico 1997 permethrin I 12 16.7% 0.717 23.16 9.1%spinach, fresh Mexico 1997 DDE I 12 41.7% 0.011 11.53 4.5%spinach, fresh Mexico 1997 endosulfan II I 12 8.3% 0.010 0.84 0.3%spinach, fresh Mexico 1997 diazinon I 12 8.3% 0.003 0.48 0.2%
Totals 255.87 100.0%
spinach, fresh Mexico 1996 methomyl I 21 42.9% 0.228 214.46 34.4%spinach, fresh Mexico 1996 omethoate I 17 35.3% 0.082 139.25 22.3%spinach, fresh Mexico 1996 dimethoate I 21 9.5% 0.530 138.79 22.3%spinach, fresh Mexico 1996 endosulfan sulfate I 21 38.1% 0.136 52.06 8.4%spinach, fresh Mexico 1996 permethrin I 21 38.1% 0.584 43.09 6.9%spinach, fresh Mexico 1996 DDE I 21 47.6% 0.005 5.90 0.9%spinach, fresh Mexico 1996 diazinon I 21 14.3% 0.019 5.12 0.8%spinach, fresh Mexico 1996 chlorothalonil F 21 4.8% 0.880 4.98 0.8%spinach, fresh Mexico 1996 mevinphos I 21 4.8% 0.007 4.14 0.7%spinach, fresh Mexico 1996 chlorpyrifos I 21 9.5% 0.009 3.83 0.6%spinach, fresh Mexico 1996 methamidophos I 21 19.0% 0.007 2.89 0.5%spinach, fresh Mexico 1996 endosulfan II I 21 19.0% 0.015 2.77 0.4%spinach, fresh Mexico 1996 esfenvalerate I 12 8.3% 0.042 1.75 0.3%spinach, fresh Mexico 1996 carbaryl I 21 4.8% 0.077 1.62 0.3%spinach, fresh Mexico 1996 endosulfan I I 21 19.0% 0.005 0.96 0.2%spinach, fresh Mexico 1996 acephate I 21 4.8% 0.018 0.94 0.2%spinach, fresh Mexico 1996 benomyl F 22 4.5% 0.120 0.52 0.1%spinach, fresh Mexico 1996 fenvalerate I 21 4.8% 0.050 0.27 0.04%spinach, fresh Mexico 1996 dicloran F 21 4.8% 0.010 0.03 0.005%
Totals 623.39 100.0%
spinach, fresh Mexico 1995 permethrin I 14 42.9% 0.366 30.38 29.5%spinach, fresh Mexico 1995 mevinphos I 14 7.1% 0.025 22.17 21.6%spinach, fresh Mexico 1995 methomyl I 14 7.1% 0.120 18.85 18.3%spinach, fresh Mexico 1995 endosulfans I 14 35.7% 0.052 18.64 18.1%spinach, fresh Mexico 1995 DDE I 14 42.9% 0.009 9.54 9.3%spinach, fresh Mexico 1995 methamidophos I 14 7.1% 0.020 3.22 3.1%
Totals 102.80 100.0%
spinach, fresh US 1997 permethrin I 497 54.1% 1.580 165.77 47.5%spinach, fresh US 1997 omethoate I 497 13.1% 0.099 62.45 17.9%spinach, fresh US 1997 methomyl I 497 9.7% 0.168 35.60 10.2%spinach, fresh US 1997 dimethoate I 486 6.6% 0.141 25.58 7.3%spinach, fresh US 1997 dieldrin I 193 1.6% 0.011 21.97 6.3%spinach, fresh US 1997 DDE I 497 41.4% 0.017 16.66 4.8%spinach, fresh US 1997 DDT I 375 9.9% 0.013 6.35 1.8%spinach, fresh US 1997 endosulfan sulfate I 497 8.7% 0.065 5.65 1.6%spinach, fresh US 1997 diazinon I 497 1.4% 0.089 2.40 0.7%spinach, fresh US 1997 parathion-methyl I 497 0.2% 0.003 1.17 0.3%spinach, fresh US 1997 chlorpyrifos I 497 2.2% 0.011 1.12 0.3%spinach, fresh US 1997 methamidophos I 497 2.2% 0.019 0.95 0.3%spinach, fresh US 1997 chlordane cis I 79 1.3% 0.002 0.75 0.2%spinach, fresh US 1997 chlordane trans I 79 1.3% 0.002 0.75 0.2%spinach, fresh US 1997 acephate I 497 2.6% 0.024 0.70 0.2%spinach, fresh US 1997 endosulfan II I 497 2.2% 0.024 0.53 0.2%spinach, fresh US 1997 endosulfan I I 497 1.4% 0.020 0.28 0.1%spinach, fresh US 1997 metalaxyl F 79 10.1% 0.013 0.08 0.02%spinach, fresh US 1997 lindane I 497 0.4% 0.008 0.04 0.01%spinach, fresh US 1997 o-phenylphenol F 431 2.3% 0.017 0.03 0.01%spinach, fresh US 1997 DDD I 431 0.2% 0.005 0.02 0.01%spinach, fresh US 1997 iprodione F 497 0.2% 0.030 0.02 0.01%spinach, fresh US 1997 diphenylamine (DPA) F 485 0.2% 0.050 0.02 0.004%
Table 5.

Food Origin Year Pesticide TypeNumber of Samples
Percent Positive
Mean Residue
Toxicity Index
Share of Toxicity by Pesticide
spinach, fresh US 1997 vinclozolin F 497 0.2% 0.014 0.01 0.003%spinach, fresh US 1997 dicloran F 497 1.6% 0.007 0.01 0.002%spinach, fresh US 1997 quintozene F 497 0.6% 0.002 0.01 0.002%spinach, fresh US 1997 chlorothalonil F 440 0.2% 0.007 0.00 0.001%
Totals 348.91 100.0%
spinach, fresh US 1996 permethrin I 491 61.5% 1.641 195.69 39.5%spinach, fresh US 1996 methomyl I 491 10.8% 0.531 125.99 25.4%spinach, fresh US 1996 omethoate I 409 16.6% 0.056 45.04 9.1%spinach, fresh US 1996 dimethoate I 491 7.3% 0.200 40.40 8.2%spinach, fresh US 1996 DDE I 491 58.9% 0.017 23.59 4.8%spinach, fresh US 1996 endosulfan sulfate I 491 12.8% 0.142 18.25 3.7%spinach, fresh US 1996 dieldrin I 169 3.0% 0.004 14.44 2.9%spinach, fresh US 1996 DDT I 403 13.2% 0.018 11.81 2.4%spinach, fresh US 1996 demeton-S-sulfone I 74 1.4% 0.013 5.78 1.2%spinach, fresh US 1996 azinphos-methyl I 491 0.8% 0.183 3.99 0.8%spinach, fresh US 1996 oxamyl I 491 0.4% 0.049 2.22 0.4%spinach, fresh US 1996 chlorpyrifos I 491 4.9% 0.008 1.84 0.4%spinach, fresh US 1996 cypermethrin I 283 1.1% 0.194 1.49 0.3%spinach, fresh US 1996 endosulfan II I 491 5.1% 0.020 1.00 0.2%spinach, fresh US 1996 diazinon I 491 2.2% 0.023 1.00 0.2%spinach, fresh US 1996 endosulfan I I 491 4.3% 0.021 0.90 0.2%spinach, fresh US 1996 acephate I 491 3.1% 0.018 0.61 0.1%spinach, fresh US 1996 methamidophos I 491 3.1% 0.006 0.41 0.1%spinach, fresh US 1996 metalaxyl F 156 5.8% 0.094 0.33 0.1%spinach, fresh US 1996 carbofuran-3 OH I 491 0.2% 0.033 0.26 0.1%spinach, fresh US 1996 chlorothalonil F 491 0.6% 0.111 0.08 0.02%spinach, fresh US 1996 piperonyl butoxide I 74 1.4% 0.060 0.06 0.01%spinach, fresh US 1996 DDD I 403 0.2% 0.014 0.06 0.01%spinach, fresh US 1996 iprodione F 491 0.4% 0.038 0.05 0.01%spinach, fresh US 1996 carbaryl I 491 0.2% 0.039 0.04 0.01%spinach, fresh US 1996 dicloran F 489 3.3% 0.014 0.03 0.01%spinach, fresh US 1996 quintozene F 491 0.8% 0.006 0.02 0.004%spinach, fresh US 1996 captan F 485 1.4% 0.051 0.02 0.003%spinach, fresh US 1996 o-phenylphenol F 425 0.7% 0.016 0.01 0.002%spinach, fresh US 1996 malathion I 491 0.2% 0.003 0.00 0.0001%
Totals 495.42 100.0%
spinach, fresh US 1995 permethrin I 593 61.6% 2.446 291.77 52.7%spinach, fresh US 1995 dimethoate I 592 5.1% 0.482 67.10 12.1%spinach, fresh US 1995 omethoate I 501 17.6% 0.055 46.42 8.4%spinach, fresh US 1995 methomyl I 593 10.8% 0.183 43.31 7.8%spinach, fresh US 1995 DDE I 593 49.4% 0.022 26.10 4.7%spinach, fresh US 1995 dieldrin I 128 1.6% 0.013 25.09 4.5%spinach, fresh US 1995 endosulfans I 593 13.7% 0.120 16.47 3.0%spinach, fresh US 1995 DDT I 503 17.1% 0.015 13.14 2.4%spinach, fresh US 1995 mevinphos I 592 2.5% 0.027 8.62 1.6%spinach, fresh US 1995 demeton-S-sulfone I 70 1.4% 0.010 4.70 0.8%spinach, fresh US 1995 chlorpyrifos I 593 7.8% 0.011 3.75 0.7%spinach, fresh US 1995 diazinon I 592 3.0% 0.038 2.22 0.4%spinach, fresh US 1995 cypermethrin I 281 0.7% 0.300 1.54 0.3%spinach, fresh US 1995 acephate I 592 4.9% 0.025 1.33 0.2%spinach, fresh US 1995 carbofuran-3 OH I 593 0.2% 0.140 0.92 0.2%spinach, fresh US 1995 methamidophos I 592 2.2% 0.009 0.43 0.1%spinach, fresh US 1995 DDD I 502 1.6% 0.008 0.24 0.04%spinach, fresh US 1995 carbaryl I 593 1.3% 0.032 0.19 0.03%spinach, fresh US 1995 carbofuran I 593 0.2% 0.025 0.16 0.03%spinach, fresh US 1995 metalaxyl F 22 18.2% 0.008 0.09 0.02%spinach, fresh US 1995 lindane I 593 0.3% 0.015 0.06 0.01%spinach, fresh US 1995 vinclozolin F 593 0.3% 0.042 0.05 0.01%spinach, fresh US 1995 chlorothalonil F 580 1.0% 0.021 0.03 0.005%spinach, fresh US 1995 dicloran F 593 2.2% 0.010 0.01 0.002%spinach, fresh US 1995 o-phenylphenol F 379 0.3% 0.052 0.01 0.002%spinach, fresh US 1995 fenvalerate I 553 0.2% 0.038 0.01 0.001%spinach, fresh US 1995 malathion I 593 0.7% 0.011 0.00 0.001%
Totals 553.77 100.0%
spinach, canned US 1997 permethrin I 168 83.9% 1.187 193.17 94.5%spinach, canned US 1997 DDE I 168 25.0% 0.011 6.50 3.2%spinach, canned US 1997 parathion-ethyl I 146 2.7% 0.012 4.60 2.2%spinach, canned US 1997 diphenylamine (DPA) F 168 1.2% 0.109 0.19 0.1%spinach, canned US 1997 trifluralin H 168 0.6% 0.025 0.03 0.01%
Totals 204.49 100.0%
Table 5.

Food Origin Year Pesticide TypeNumber of Samples
Percent Positive
Mean Residue
Toxicity Index
Share of Toxicity by Pesticide
sweet corn US 1995 o-phenylphenol F 593 0.3% 0.020 0.01 52.1%sweet corn US 1995 endosulfans I 651 0.2% 0.003 0.00 47.9%
Totals 0.01 100.0%
sweet corn US 1994 benomyl F 364 0.3% 0.084 0.02 100.0%Totals 0.02 100.0%
sweet peas, canned/frozen US 1996 parathion-methyl I 346 0.9% 0.006 10.07 47.1%sweet peas, canned/frozen US 1996 dimethoate I 346 14.2% 0.018 7.07 33.0%sweet peas, canned/frozen US 1996 omethoate I 346 6.9% 0.009 2.94 13.7%sweet peas, canned/frozen US 1996 carbaryl I 346 2.0% 0.093 0.84 3.9%sweet peas, canned/frozen US 1996 endosulfan sulfate I 346 1.2% 0.013 0.15 0.7%sweet peas, canned/frozen US 1996 methoxychlor I 346 0.6% 0.028 0.12 0.6%sweet peas, canned/frozen US 1996 endosulfan II I 346 0.6% 0.011 0.06 0.3%sweet peas, canned/frozen US 1996 diazinon I 346 0.6% 0.005 0.06 0.3%sweet peas, canned/frozen US 1996 o-phenylphenol F 346 2.3% 0.024 0.04 0.2%sweet peas, canned/frozen US 1996 methamidophos I 346 0.3% 0.005 0.03 0.2%sweet peas, canned/frozen US 1996 endosulfan I I 346 0.3% 0.006 0.02 0.1%
Totals 21.40 100.0%
sweet peas US 1995 parathion-methyl I 660 1.4% 0.004 11.73 53.9%sweet peas US 1995 dimethoate I 660 11.7% 0.019 6.19 28.5%sweet peas US 1995 omethoate I 574 7.1% 0.008 2.64 12.1%sweet peas US 1995 carbaryl I 660 1.2% 0.105 0.56 2.6%sweet peas US 1995 diazinon I 660 1.1% 0.016 0.33 1.5%sweet peas US 1995 methoxychlor I 660 0.3% 0.081 0.19 0.9%sweet peas US 1995 parathion-ethyl I 660 0.2% 0.003 0.06 0.3%sweet peas US 1995 endosulfans I 660 0.3% 0.009 0.03 0.1%sweet peas US 1995 o-phenylphenol F 592 1.4% 0.024 0.02 0.1%
Totals 21.76 100.0%
sweet peas US 1994 dimethoate I 346 6.9% 0.019 3.69 62.0%sweet peas US 1994 omethoate I 288 2.1% 0.010 1.01 17.0%sweet peas US 1994 carbaryl I 346 1.2% 0.177 0.90 15.2%sweet peas US 1994 methomyl I 346 0.6% 0.025 0.32 5.3%sweet peas US 1994 diazinon I 346 0.3% 0.005 0.03 0.5%
Totals 5.94 100.0%
sweet potatoes US 1997 dicloran F 675 57.2% 0.290 9.92 40.4%sweet potatoes US 1997 parathion-methyl I 691 0.3% 0.009 4.76 19.4%sweet potatoes US 1997 chlorpyrifos I 691 11.0% 0.009 4.36 17.7%sweet potatoes US 1997 phosmet I 667 5.7% 0.101 3.16 12.9%sweet potatoes US 1997 aldicarb sulfoxide I 679 0.1% 0.017 0.88 3.6%sweet potatoes US 1997 DDE I 677 1.5% 0.015 0.55 2.2%sweet potatoes US 1997 piperonyl butoxide I 179 4.5% 0.081 0.29 1.2%sweet potatoes US 1997 carbaryl I 691 0.3% 0.150 0.19 0.8%sweet potatoes US 1997 endosulfan sulfate I 691 1.4% 0.009 0.13 0.5%sweet potatoes US 1997 aldoxycarb I 563 0.2% 0.017 0.07 0.3%sweet potatoes US 1997 endosulfan I I 691 0.7% 0.006 0.05 0.2%sweet potatoes US 1997 o-phenylphenol F 667 1.5% 0.033 0.04 0.2%sweet potatoes US 1997 endosulfan II I 691 0.6% 0.006 0.04 0.1%sweet potatoes US 1997 diazinon I 691 0.4% 0.004 0.04 0.1%sweet potatoes US 1997 benomyl F 689 0.1% 0.180 0.03 0.1%sweet potatoes US 1997 permethrin I 691 0.4% 0.021 0.02 0.1%sweet potatoes US 1997 methamidophos I 691 0.1% 0.005 0.02 0.1%sweet potatoes US 1997 acephate I 676 0.1% 0.007 0.01 0.05%sweet potatoes US 1997 fenvalerate I 676 0.1% 0.050 0.01 0.03%sweet potatoes US 1997 diphenylamine (DPA) F 691 0.1% 0.017 0.00 0.01%sweet potatoes US 1997 thiabendazole F 691 0.3% 0.029 0.00 0.01%sweet potatoes US 1997 malathion I 691 0.1% 0.023 0.00 0.01%
Totals 24.55 100.0%
sweet potatoes US 1996 aldicarb sulfoxide I 507 1.0% 0.071 24.70 44.0%sweet potatoes US 1996 dicloran F 497 63.6% 0.375 14.28 25.4%sweet potatoes US 1996 phosmet I 507 5.9% 0.145 4.72 8.4%sweet potatoes US 1996 chlorpyrifos I 507 10.5% 0.010 4.70 8.4%sweet potatoes US 1996 dieldrin I 129 0.8% 0.003 2.99 5.3%sweet potatoes US 1996 DDT I 272 5.1% 0.008 2.11 3.7%sweet potatoes US 1996 DDE I 507 4.7% 0.008 0.88 1.6%sweet potatoes US 1996 carbaryl I 507 0.2% 0.670 0.58 1.0%sweet potatoes US 1996 piperonyl butoxide I 129 10.9% 0.066 0.56 1.0%sweet potatoes US 1996 aldoxycarb I 372 0.5% 0.033 0.41 0.7%sweet potatoes US 1996 endosulfan sulfate I 507 1.6% 0.005 0.08 0.1%sweet potatoes US 1996 endosulfan II I 507 1.0% 0.005 0.05 0.1%
Table 5.

Food Origin Year Pesticide TypeNumber of Samples
Percent Positive
Mean Residue
Toxicity Index
Share of Toxicity by Pesticide
sweet potatoes US 1996 methamidophos I 507 0.4% 0.006 0.05 0.1%sweet potatoes US 1996 acephate I 507 0.4% 0.008 0.03 0.1%sweet potatoes US 1996 endosulfan I I 507 0.4% 0.005 0.02 0.03%sweet potatoes US 1996 o-phenylphenol F 507 0.8% 0.025 0.01 0.03%sweet potatoes US 1996 thiabendazole F 507 0.4% 0.100 0.01 0.02%sweet potatoes US 1996 diphenylamine F 507 0.2% 0.015 0.00 0.01%sweet potatoes US 1996 malathion I 507 1.6% 0.005 0.00 0.01%
Totals 56.18 100.0%
tomatoes Canada 1997 oxamyl I 21 4.8% 0.043 23.05 87.4%tomatoes Canada 1997 iprodione F 21 9.5% 0.068 2.00 7.6%tomatoes Canada 1997 dicloran F 21 9.5% 0.212 1.21 4.6%tomatoes Canada 1997 myclobutanil F 21 4.8% 0.040 0.13 0.5%
Totals 26.38 100.0%
tomatoes Mexico 1997 chlorpyrifos I 191 37.2% 0.036 60.04 37.8%tomatoes Mexico 1997 methamidophos I 191 38.2% 0.034 29.17 18.4%tomatoes Mexico 1997 azinphos-methyl I 190 4.7% 0.104 13.15 8.3%tomatoes Mexico 1997 parathion-methyl I 191 0.5% 0.012 12.16 7.7%tomatoes Mexico 1997 fenamiphos sulfoxide I 61 3.3% 0.021 9.89 6.2%tomatoes Mexico 1997 oxamyl I 192 2.6% 0.028 8.27 5.2%tomatoes Mexico 1997 endosulfan II I 192 43.2% 0.013 5.85 3.7%tomatoes Mexico 1997 endosulfan sulfate I 192 35.9% 0.012 4.45 2.8%tomatoes Mexico 1997 fenamiphos sulfone I 148 2.0% 0.013 3.88 2.4%tomatoes Mexico 1997 endosulfan I I 192 32.8% 0.011 3.51 2.2%tomatoes Mexico 1997 omethoate I 191 4.2% 0.017 3.45 2.2%tomatoes Mexico 1997 permethrin I 191 16.2% 0.072 2.26 1.4%tomatoes Mexico 1997 cypermethrin I 63 3.2% 0.050 1.15 0.7%tomatoes Mexico 1997 vinclozolin F 191 2.1% 0.086 0.58 0.4%tomatoes Mexico 1997 fenamiphos I 192 0.5% 0.007 0.54 0.3%tomatoes Mexico 1997 benomyl F 193 1.6% 0.122 0.18 0.1%tomatoes Mexico 1997 metalaxyl F 11 9.1% 0.026 0.14 0.1%tomatoes Mexico 1997 iprodione F 191 1.0% 0.044 0.14 0.1%tomatoes Mexico 1997 chlorothalonil F 191 1.6% 0.025 0.05 0.03%tomatoes Mexico 1997 fenvalerate I 191 1.0% 0.027 0.03 0.02%tomatoes Mexico 1997 diazinon I 191 0.5% 0.003 0.03 0.02%tomatoes Mexico 1997 dicloran F 191 1.0% 0.029 0.02 0.01%tomatoes Mexico 1997 o-phenylphenol F 176 1.1% 0.016 0.01 0.01%tomatoes Mexico 1997 diphenylamine (DPA) F 186 0.5% 0.013 0.01 0.01%tomatoes Mexico 1997 captan F 192 1.0% 0.023 0.01 0.004%
Totals 158.98 100.0%
tomatoes Mexico 1996 chlorpyrifos I 31 38.7% 0.036 62.91 51.2%tomatoes Mexico 1996 methamidophos I 31 41.9% 0.013 11.98 9.7%tomatoes Mexico 1996 azinphos-methyl I 31 19.4% 0.022 11.15 9.1%tomatoes Mexico 1996 endosulfan II I 31 45.2% 0.023 10.49 8.5%tomatoes Mexico 1996 endosulfan I I 31 38.7% 0.019 7.32 6.0%tomatoes Mexico 1996 endosulfan sulfate I 31 38.7% 0.014 5.44 4.4%tomatoes Mexico 1996 permethrin I 31 22.6% 0.110 4.80 3.9%tomatoes Mexico 1996 omethoate I 30 10.0% 0.007 3.55 2.9%tomatoes Mexico 1996 benomyl F 33 18.2% 0.098 1.70 1.4%tomatoes Mexico 1996 vinclozolin F 27 11.1% 0.036 1.30 1.1%tomatoes Mexico 1996 esfenvalerate I 20 10.0% 0.025 1.25 1.0%tomatoes Mexico 1996 iprodione F 31 3.2% 0.100 1.00 0.8%tomatoes Mexico 1996 myclobutanil F 31 3.2% 0.025 0.06 0.05%
Totals 122.93 100.0%
tomatoes US 1997 methamidophos I 486 29.4% 0.043 28.19 51.7%tomatoes US 1997 dicofol I 497 2.4% 0.065 5.11 9.4%tomatoes US 1997 dieldrin I 131 0.8% 0.005 4.90 9.0%tomatoes US 1997 chlorpyrifos I 483 4.1% 0.025 4.59 8.4%tomatoes US 1997 endosulfan II I 497 15.1% 0.014 2.12 3.9%tomatoes US 1997 omethoate I 483 2.5% 0.015 1.80 3.3%tomatoes US 1997 endosulfan I I 484 11.8% 0.015 1.73 3.2%tomatoes US 1997 endosulfan sulfate I 497 14.3% 0.012 1.70 3.1%tomatoes US 1997 chlorothalonil F 484 10.5% 0.115 1.44 2.6%tomatoes US 1997 permethrin I 483 10.1% 0.061 1.20 2.2%tomatoes US 1997 o-phenylphenol F 424 8.5% 0.062 0.40 0.7%tomatoes US 1997 ethion I 483 0.2% 0.049 0.27 0.5%tomatoes US 1997 esfenvalerate I 277 1.4% 0.038 0.27 0.5%tomatoes US 1997 benomyl F 496 1.6% 0.107 0.17 0.3%tomatoes US 1997 carbaryl I 497 0.4% 0.085 0.15 0.3%tomatoes US 1997 acephate I 483 0.8% 0.009 0.08 0.1%tomatoes US 1997 azinphos-methyl I 482 0.2% 0.013 0.07 0.1%tomatoes US 1997 diazinon I 483 0.2% 0.015 0.06 0.1%tomatoes US 1997 piperonyl butoxide I 92 1.1% 0.067 0.06 0.1%
Table 5.

Food Origin Year Pesticide TypeNumber of Samples
Percent Positive
Mean Residue
Toxicity Index
Share of Toxicity by Pesticide
tomatoes US 1997 fenvalerate I 483 0.8% 0.054 0.05 0.1%tomatoes US 1997 dimethoate I 482 0.2% 0.005 0.03 0.1%tomatoes US 1997 DDD I 327 0.3% 0.005 0.03 0.1%tomatoes US 1997 diphenylamine (DPA) F 488 0.6% 0.025 0.02 0.04%tomatoes US 1997 dicloran F 483 0.6% 0.060 0.02 0.04%tomatoes US 1997 vinclozolin F 483 0.4% 0.013 0.02 0.03%tomatoes US 1997 iprodione F 483 0.2% 0.025 0.02 0.03%
Totals 54.50 100.0%
tomatoes US 1996 methamidophos I 134 38.1% 0.035 30.00 47.6%tomatoes US 1996 dicofol I 132 3.8% 0.097 11.85 18.8%tomatoes US 1996 chlorothalonil F 134 14.9% 0.209 3.71 5.9%tomatoes US 1996 oxamyl I 134 1.5% 0.022 3.61 5.7%tomatoes US 1996 esfenvalerate I 68 8.8% 0.060 2.66 4.2%tomatoes US 1996 omethoate I 117 3.4% 0.015 2.40 3.8%tomatoes US 1996 chlorpyrifos I 134 3.0% 0.013 1.67 2.6%tomatoes US 1996 permethrin I 134 8.2% 0.093 1.47 2.3%tomatoes US 1996 azinphos-methyl I 134 1.5% 0.024 0.96 1.5%tomatoes US 1996 endosulfan II I 134 11.2% 0.007 0.82 1.3%tomatoes US 1996 carbofuran-3 OH I 134 0.7% 0.024 0.70 1.1%tomatoes US 1996 endosulfan sulfate I 134 9.0% 0.007 0.60 1.0%tomatoes US 1996 endosulfan I I 134 7.5% 0.008 0.56 0.9%tomatoes US 1996 iprodione F 134 1.5% 0.120 0.56 0.9%tomatoes US 1996 DDE I 134 1.5% 0.014 0.51 0.8%tomatoes US 1996 o-phenylphenol F 111 14.4% 0.031 0.33 0.5%tomatoes US 1996 fenvalerate I 134 3.0% 0.086 0.29 0.5%tomatoes US 1996 piperonyl butoxide I 24 4.2% 0.067 0.22 0.3%tomatoes US 1996 ethion I 134 0.7% 0.004 0.08 0.1%tomatoes US 1996 acephate I 134 0.7% 0.007 0.06 0.1%
Totals 63.06 100.0%
wheat US 1997 parathion-methyl I 623 0.2% 0.031 9.63 30.1%wheat US 1997 chlorpyrifos-methyl I 622 55.6% 0.106 8.06 25.2%wheat US 1997 malathion I 623 68.2% 0.213 6.77 21.2%wheat US 1997 chlorpyrifos I 623 6.4% 0.011 3.19 10.0%wheat US 1997 pirimiphos-methyl I 623 3.7% 0.003 1.77 5.5%wheat US 1997 methoxychlor I 617 5.2% 0.042 1.67 5.2%wheat US 1997 carbofuran I 623 1.0% 0.010 0.39 1.2%wheat US 1997 phorate sulfone I 564 0.2% 0.008 0.24 0.8%wheat US 1997 diazinon I 623 0.8% 0.013 0.20 0.6%wheat US 1997 imazalil F 543 1.5% 0.015 0.07 0.2%wheat US 1997 carbaryl I 623 0.3% 0.005 0.01 0.02%wheat US 1997 thiabendazole F 291 0.7% 0.020 0.00 0.01%
Totals 32.01 100.0%
wheat US 1996 chlorpyrifos-methyl I 340 73.2% 0.092 9.23 31.9%wheat US 1996 chlorpyrifos I 340 14.4% 0.011 7.24 25.0%wheat US 1996 parathion-methyl I 340 0.3% 0.010 5.69 19.7%wheat US 1996 malathion I 340 70.3% 0.070 2.30 7.9%wheat US 1996 disulfoton sulfone I 340 0.3% 0.025 1.14 3.9%wheat US 1996 parathion-ethyl I 340 0.3% 0.022 0.89 3.1%wheat US 1996 methoxychlor PP I 340 4.7% 0.024 0.88 3.1%wheat US 1996 phorate sulfone I 340 0.6% 0.008 0.81 2.8%wheat US 1996 azinphos-methyl I 340 0.9% 0.022 0.52 1.8%wheat US 1996 imazalil F 340 2.9% 0.011 0.11 0.4%wheat US 1996 diazinon I 340 0.3% 0.013 0.07 0.3%wheat US 1996 carbaryl I 340 0.3% 0.013 0.02 0.1%wheat US 1996 thiabendazole F 340 0.3% 0.012 0.00 0.003%
Totals 28.90 100.0%
wheat US 1995 chlorpyrifos-methyl I 600 54.2% 0.105 7.82 43.7%wheat US 1995 chlorpyrifos I 600 19.5% 0.006 5.49 30.7%wheat US 1995 malathion I 600 71.0% 0.101 3.28 18.3%wheat US 1995 diazinon I 600 3.0% 0.016 0.94 5.3%wheat US 1995 methoxychlor I 600 1.0% 0.042 0.32 1.8%wheat US 1995 carbaryl I 600 0.5% 0.008 0.02 0.1%wheat US 1995 imazalil F 600 0.5% 0.010 0.02 0.1%
Totals 17.89 100.0%
winter squash, fresh Honduras 1997 endosulfan sulfate I 10 90.0% 0.013 12.05 53.2%winter squash, fresh Honduras 1997 hexachlorobenzene F 10 10.0% 0.005 5.91 26.1%winter squash, fresh Honduras 1997 endosulfan I I 10 20.0% 0.012 2.41 10.6%winter squash, fresh Honduras 1997 endosulfan II I 10 10.0% 0.012 1.20 5.3%winter squash, fresh Honduras 1997 thiabendazole F 10 20.0% 0.248 1.07 4.7%
Totals 22.64 100.0%
Table 5.

Food Origin Year Pesticide TypeNumber of Samples
Percent Positive
Mean Residue
Toxicity Index
Share of Toxicity by Pesticide
winter squash, fresh Mexico 1997 dieldrin I 24 4.2% 0.006 32.12 78.3%winter squash, fresh Mexico 1997 endosulfan sulfate I 161 37.3% 0.014 5.36 13.1%winter squash, fresh Mexico 1997 endosulfan I I 161 7.5% 0.011 0.79 1.9%winter squash, fresh Mexico 1997 esfenvalerate I 125 0.8% 0.190 0.76 1.9%winter squash, fresh Mexico 1997 methamidophos I 161 5.0% 0.005 0.59 1.4%winter squash, fresh Mexico 1997 hexachlorobenzene F 161 0.6% 0.007 0.51 1.3%winter squash, fresh Mexico 1997 DDE I 161 1.2% 0.010 0.30 0.7%winter squash, fresh Mexico 1997 endosulfan II I 161 3.1% 0.008 0.24 0.6%winter squash, fresh Mexico 1997 acephate I 161 1.9% 0.008 0.17 0.4%winter squash, fresh Mexico 1997 chlorothalonil F 140 6.4% 0.014 0.11 0.3%winter squash, fresh Mexico 1997 fenvalerate I 161 0.6% 0.050 0.04 0.1%winter squash, fresh Mexico 1997 metalaxyl F 24 4.2% 0.010 0.03 0.1%winter squash, fresh Mexico 1997 permethrin I 161 0.6% 0.013 0.02 0.0%
Totals 41.03 100.0%
winter squash, fresh US 1997 dieldrin I 54 35.2% 0.034 1,541.74 90.4%winter squash, fresh US 1997 heptachlor epoxide I 47 8.5% 0.009 142.31 8.3%winter squash, fresh US 1997 oxychlordane I 30 3.3% 0.005 4.94 0.3%winter squash, fresh US 1997 endosulfan sulfate I 258 15.1% 0.021 3.21 0.2%winter squash, fresh US 1997 DDE I 258 6.6% 0.014 2.27 0.1%winter squash, fresh US 1997 chlordane cis I 30 3.3% 0.002 1.98 0.1%winter squash, fresh US 1997 chlordane trans I 30 3.3% 0.002 1.98 0.1%winter squash, fresh US 1997 DDT I 137 2.9% 0.010 1.45 0.1%winter squash, fresh US 1997 dicofol I 258 0.4% 0.081 1.02 0.1%winter squash, fresh US 1997 endosulfan I I 258 7.0% 0.013 0.90 0.1%winter squash, fresh US 1997 methamidophos I 258 2.7% 0.014 0.87 0.1%winter squash, fresh US 1997 endosulfan II I 258 6.6% 0.011 0.74 0.0%winter squash, fresh US 1997 chlorothalonil F 244 7.4% 0.077 0.67 0.0%winter squash, fresh US 1997 acephate I 258 1.2% 0.040 0.51 0.0%winter squash, fresh US 1997 permethrin I 258 3.1% 0.072 0.43 0.0%winter squash, fresh US 1997 piperonyl butoxide I 30 6.7% 0.067 0.35 0.0%winter squash, fresh US 1997 captan F 257 0.4% 1.600 0.15 0.0%winter squash, fresh US 1997 fenvalerate I 258 0.4% 0.070 0.03 0.0%winter squash, fresh US 1997 metalaxyl F 65 4.6% 0.011 0.03 0.0%winter squash, fresh US 1997 diazinon I 258 0.4% 0.003 0.02 0.0%winter squash, fresh US 1997 quintozene F 258 0.4% 0.010 0.02 0.0%winter squash, fresh US 1997 o-phenylphenol F 235 0.4% 0.017 0.01 0.0%winter squash, fresh US 1997 myclobutanil F 258 0.4% 0.013 0.00 0.0%winter squash, fresh US 1997 thiabendazole F 252 0.4% 0.015 0.00 0.0%
Totals 1,705.61 100.0%
winter squash, frozen Mexico 1997 endosulfan I I 20 40.0% 0.023 9.09 44.0%winter squash, frozen Mexico 1997 endosulfan sulfate I 20 40.0% 0.019 7.43 36.0%winter squash, frozen Mexico 1997 DDE I 20 10.0% 0.012 2.91 14.1%winter squash, frozen Mexico 1997 endosulfan II I 20 10.0% 0.012 1.20 5.8%
20.63 100.0%
winter squash, frozen US 1997 dieldrin I 91 73.6% 0.028 2,603.44 86.4%winter squash, frozen US 1997 heptachlor epoxide I 79 29.1% 0.007 362.17 12.0%winter squash, frozen US 1997 chlordane cis I 53 7.5% 0.011 25.17 0.8%winter squash, frozen US 1997 chlordane trans I 53 5.7% 0.005 8.39 0.3%winter squash, frozen US 1997 DDE I 199 8.0% 0.029 5.75 0.2%winter squash, frozen US 1997 oxychlordane I 53 3.8% 0.004 4.47 0.1%winter squash, frozen US 1997 endosulfan I I 199 2.5% 0.040 1.01 0.0%winter squash, frozen US 1997 endosulfan sulfate I 199 3.5% 0.017 0.59 0.0%winter squash, frozen US 1997 chlorpyrifos I 199 2.0% 0.005 0.45 0.0%winter squash, frozen US 1997 endosulfan II I 199 1.5% 0.016 0.24 0.0%winter squash, frozen US 1997 acephate I 199 0.5% 0.043 0.24 0.0%winter squash, frozen US 1997 ethion I 199 1.5% 0.005 0.20 0.0%winter squash, frozen US 1997 methamidophos I 199 0.5% 0.015 0.17 0.0%winter squash, frozen US 1997 carbaryl I 199 0.5% 0.042 0.09 0.0%winter squash, frozen US 1997 diphenylamine (DPA) F 199 0.5% 0.025 0.02 0.0%winter squash, frozen US 1997 metalaxyl F 78 1.3% 0.013 0.01 0.0%winter squash, frozen US 1997 thiabendazole F 199 2.0% 0.015 0.01 0.0%winter squash, frozen US 1997 o-phenylphenol F 155 0.6% 0.005 0.00 0.0%
3,012 100.0%
Table 5.

Pesticide FoodCountry of
OriginYear
Reference Concen-
tration (RfC) (ppm)
Number of Samples
Number of Positives
Percent Positive
Number Samples
>RfC
Percent Positive Samples
>RfC
Odds 100g Serving >RfD
Maximim Residue
Ratio of Max
Residue to RfC
Dieldrin Winter Squash, Frozen U.S. 1997 0.01 91 67 73.6% 44 65.7% 48.0% 0.1 10Heptachlor epoxide Winter Squash, Frozen U.S. 1997 0.002 79 23 29.1% 23 100% 29.1% 0.025 12.5
Combined odds: 77.1%
Methyl parathion Peaches U.S. 1996 0.004 198 82 41.4% 82 100% 41.4% 0.5 125Azinphos-methyl Peaches U.S 1996 0.3 198 17 8.6% 0 0.0% 0.0% 0.26 0.87
Combined odds: 41.4%
Methyl parathion Peaches Chile 1996 0.004 126 0 0.0% 0 0% 0.0% n.a. n.a.Azinphos-methyl Peaches Chile 1996 0.3 126 91 72.2% 5 5.5% 4.0% 0.41 1.37
Combined odds: 4.0%
Dieldrin Winter Squash, Fresh U.S. 1997 0.01 54 20 37.0% 15 75.0% 28.0% 0.093 9.3Heptachlor epoxide Winter Squash, Fresh U.S. 1997 0.002 47 4 8.5% 4 100% 8.5% 0.015 7.5
Combined odds: 36.5%
Methyl parathion Apples U.S. 1996 0.004 502 30 6.0% 30 100% 6.0% 0.21 52.5Chlorpyrifos Apples U.S. 1996 0.06 502 140 26.4% 20 14.3% 3.8% 0.23 3.83Azinphos-methyl Apples U.S. 1996 0.3 502 267 53.2% 3 1.1% 0.6% 0.44 1.47Dimethoate Apples U.S. 1996 0.1 502 15 3.0% 2 13.3% 0.4% 0.2 2.0
Combined odds: 10.8%
Methyl parathion Apples New Zealand 1996 0.004 15 0 0.0% 30 0% 0.0% n.a. n.a.Chlorpyrifos Apples New Zealand 1996 0.06 15 12 80.0% 3 25.0% 20.0% 0.09 1.50Azinphos-methyl Apples New Zealand 1996 0.3 15 14 93.3% 0 0.0% 0.0% 0.093 0.31Dimethoate Apples New Zealand 1996 0.1 15 0 0.0% 0 0.0% 0.0% n.a. n.a.
Combined odds: 20.0%
Methyl parathion Green Beans, Frozen U.S. 1997 0.004 691 32 4.6% 29 90.6% 4.2% 0.38 95.0Acephate Green Beans, Frozen U.S. 1997 0.24 654 303 46.3% 23 7.6% 3.5% 1.2 5.0
Combined odds: 7.7%
Omethoate Grapes Chile 1996 0.06 234 79 33.8% 19 24.1% 8.1% 0.23 3.83Dimethoate Grapes Chile 1996 0.1 279 79 28.3% 20 25.3% 7.2% 0.66 6.6Chlorpyrifos Grapes Chile 1996 0.06 279 56 20.1% 10 17.9% 3.6% 0.44 7.33
Combined odds: 18.9%
Omethoate Grapes U.S. 1996 0.06 183 4 2.2% 0 0.0% 0.0% 0.03 0.50Dimethoate Grapes U.S. 1996 0.1 211 3 1.4% 0 0.0% 0.0% 0.008 0.1Chlorpyrifos Grapes U.S. 1996 0.06 211 16 7.6% 0 0.0% 0.0% 0.059 0.98Dicofol Grapes U.S. 1996 0.24 211 17 8.1% 8 47.1% 3.8% 2.5 10.4
Table 6. Odds of Exceeding "Safe" Daily Doses for Selected Pesticides in Selected Foods Tested by the USDA Pesticide Data Program, 1996 and 1997

Pesticide FoodCountry of
OriginYear
Reference Concen-
tration (RfC) (ppm)
Number of Samples
Number of Positives
Percent Positive
Number Samples
>RfC
Percent Positive Samples
>RfC
Odds 100g Serving >RfD
Maximim Residue
Ratio of Max
Residue to RfC
Combined odds: 3.8%
Omethoate Spinach U.S. 1997 0.06 497 65 13.1% 27 41.5% 5.4% 0.76 12.7Dieldrin Spinach U.S. 1997 0.01 193 3 1.6% 2 66.7% 1.0% 0.016 1.6Dimethoate Spinach U.S. 1997 0.1 486 32 6.6% 8 25% 1.7% 1.9 19.0
Combined odds: 8.1%
Omethoate Spinach Mexico 1996 0.06 17 6 35.3% 1 16.7% 5.9% 0.43 7.2Dimethoate Spinach Mexico 1996 0.1 21 2 9.5% 2 100% 9.5% 0.81 8.1
Combined odds: 15.4%
Methyl parathion Pears U.S. 1997 0.004 588 35 6.0% 23 65.7% 3.9% 0.079 19.8Azinphos-methyl Pears U.S. 1997 0.3 582 395 67.9% 23 5.8% 4.0% 0.99 3.3
Combined odds: 7.9%
Methyl parathion Pears Chile 1997 0.004 66 0 0.0% 0 0.0% 0.0% n.a. n.a.Azinphos-methyl Pears Chile 1997 0.3 66 42 63.6% 2 4.8% 3.0% 0.48 1.6
Combined odds: 3.0%
Chlorpyrifos Soybeans U.S. 1997 0.06 157 126 80.3% 5 4.0% 3.2% 0.195 3.3
Chlorpyrifos Tomatoes Mexico 1997 0.06 191 71 37.2% 10 14.1% 5.2% 0.31 5.20Azinphos-methyl Tomatoes Mexico 1997 0.3 190 9 4.7% 1 11.1% 0.5% 0.71 2.36
Combined odds: 5.7%
Chlorpyrifos Tomatoes U.S. 1997 0.06 483 20 4.1% 2 10.0% 0.4% 0.081 1.35Methamidophos Tomatoes U.S. 1997 0.2 486 143 29.4% 6 4.2% 1.2% 0.35 1.75
Combined odds: 1.6%
Methyl parathion Peas, Canned/Frozen U.S. 1996 0.004 355 3 0.8% 3 100% 0.8% 0.007 1.75
NOTES:
(3) Occurrence of different residues is presumed to be independent, such that probabilities are additive. In cases where residues are coupled, the combined "odds" column overstates the percentage of samples exceeding the RfD for single chemicals but understates the degree to which a combined RfD would be exceeded.
(1) The Reference Concentration (RfC), expressed in ppm, is the residue concentration at which a 100-gram serving of the food will contain a Reference Dose (RfD), expressed in mg/kg/day, of the pesticide for a 20-kg child.(2) The Odds of getting a dose >RfD equal the percent positive for the residue times the percent of residues >RfC.

FoodCountry of
Origin
Total Number of Samples
0 1 2 3 4 5 6 7 8 9 10 11 12 13 14One or More
% Samples One or More
Apples U.S. 502 9 27 68 133 125 78 33 13 7 7 2 493 98.2%South Africa 6 0 1 1 2 2 6 100.0%
New Zealand 15 0 1 5 4 4 1 15 100.0%Canada 4 0 2 1 1 4 100.0%
Chile 3 0 2 1 3 100.0%All Sources 530 9 31 77 140 130 81 33 13 7 7 2 521 98.3%
Apple Juice U.S. 164 55 59 26 15 8 1 109 66.5%Argentina 11 2 3 4 1 1 9 81.8%
Mexico 1 0 1 1 100.0%Other Countries 3 3 0.0%
All Sources 179 60 63 30 16 9 1 119 66.5%
Grapes U.S. 211 65 61 46 20 14 4 1 146 69.2%Chile 279 29 42 79 47 38 30 9 4 1 250 89.6%
South Africa 10 0 5 2 3 10 100.0%Mexico 24 10 7 5 2 14 58.3%
Unknown 1 1 0All Sources 525 104 115 132 72 52 34 9 5 1 420 80.0%
Tomatoes U.S. 135 52 38 23 11 4 3 4 83 61.5%Mexico 34 6 8 5 3 6 1 3 2 28 82.4%
Canada 5 4 1 1 20.0%Netherlands 1 0 1 1 100.0%
Unknown 4 2 1 1 2 50.0%All Sources 179 64 48 29 15 10 4 7 0 2 115 64.2%
Peaches U.S. 199 12 24 47 40 44 18 12 1 1 187 94.0%Chile 130 1 15 27 32 24 15 6 6 3 1 129 99.2%
All Sources 329 13 39 74 72 68 33 18 7 4 1 316 96.0%
Carrots U.S. 481 107 133 126 78 21 14 1 1 374 77.8%Canada 10 1 2 1 2 2 2 9 90.0%Mexico 8 4 3 1 4 50.0%
Unknown 1 0 1 1 100.0%All Sources 500 112 138 128 81 23 16 1 1 388 77.6%
Oranges U.S 512 79 193 149 74 14 2 1 433 84.6%Australia 5 1 3 1 4 80.0%
Mexico 2 1 1 1 50.0%All Sources 519 81 197 150 74 14 2 1 438 84.4%
Sweet Potatoes U.S. 511 168 242 64 27 6 4 343 67.1%
Sweet Peas U.S. 346 273 45 26 2 73 21.1%Italy 1 0 1 1 100.0%
Canada 6 5 1 1Mexico 2 2 0 0.0%
All Sources 355 280 46 27 2 75 21.1%
Spinach U.S. 498 56 130 161 68 43 28 7 1 1 2 1 442 88.8%Mexico 22 3 1 9 3 1 2 1 1 1 19 86.4%
Unknown 5 2 1 3 60.0%All Sources 525 59 133 171 71 43 29 9 2 2 0 2 0 1 0 1 464 88.4%
Green Beans U.S. 525 240 80 126 48 22 5 2 1 1 285 54.3%Canada 5 5
Unknown 1 1All Sources 531 246 80 126 48 22 5 2 1 1 285 53.7%
Table 7. Multiple Pesticide Residues: Frequency Distribution of Samples With Different Numbers of Residues Detected by the USDA Pesticide Data Program, 1996
Number of Residues per Sample

1993 1994 1995 1996 1997Green Beans - 47,619 - 74,620 - Peas - - - - - Peaches - - - - - Potatotes - - - 169,260 369,750 Apples 905,585 - 1,029,553 - 909,610 Pears 167,752 - 158,130 - 130,284 Peaches 76,820 - 54,180 - 57,622 Grapes 4,896 - 11,025 - - Tomatoes - 8,547 - 8,320 - Apples 214,338 - 386,897 - 248,690 Pears 11,024 - 5,880 - 4,512 Peaches 109,719 - 36,330 - 26,602 Grapes 97,410 - 159,915 - 82,720 Oranges 162,122 - 176914 - 175864Green Beans - 16,650 - 17,030 - Apples 769,643 - 788,557 - 820,430 Peaches 48,931 - 43,470 - 19,458 Grapes 3,366 - 16,275 - 19,270 Oranges 330,733 - 612,150 - 1,108,536 Tomatoes - 82,584 - - -
Diazinon Peaches 142,952 86,835 35,156 Apples 199,048 - 68,096 - 51,740 Grapes 61,608 - 26,355 - 19,740 Green Beans - 7,215 - 6,110 - Peas - 13,320 - 8,320 - Peaches 13,694 - 4,620 - 1,880 Grapes - - - - - Green Beans - - - - - Potatoes - - 479,460 495,040 594,500 Tomatoes - 207,681 - 122,720 -
Methidathion Oranges 86,932 - 87026 - 48880- Methomyl Grapes 9,792 - 42,735 - -
Apples 155,124 - 181,545 - 363,480 Pears 4,368 - 10,605 - 25,944 Peaches 162,825 - 173,670 - 86,574 Green Beans 25,419 45,340 - Apples 48,650 - 42,560 - 43,810 Pears - - - - - Pears 62,088 - 46,200 - 40,420 Peaches 40,915 - 40,635 - 74,072
Totals Across 40 Uses 3,890,335 409,035 4,769,618 946,760 5,359,544
12.4%131.5%37.8%
Chlorpyrifos
Dimethoate
Formetanate HCL
Table 8. Applications of Selected High-Risk Pesticides to Selected Crops, 1993-1997
Azinphos-Methyl
Carbaryl
Aldicarb
Acephate
% Increase 95 to 97% Increase 94 to 96% Increase 93 to 97
Methamidophos
Methyl Parathion
Oxamyl
Phosmet


