Do the attributes of organic chicken influence the … Size, Share, Growth, Trends and Forecast,...
72
DO THE ATTRIBUTES OF ORGANIC CHICKEN INFLUENCE THE WILLINGNESS TO PAY OF ORGANIC CHICKEN? The influence of attributes on consumers purchase intention of organic chicken. 1
Transcript of Do the attributes of organic chicken influence the … Size, Share, Growth, Trends and Forecast,...

DO THE ATTRIBUTES OF ORGANIC CHICKEN INFLUENCE THE
WILLINGNESS TO PAY OF ORGANIC CHICKEN?
The influence of attributes on consumers purchase intention of organic chicken.
1

Do the attributes of organic chicken influence the willingness to pay of organic chicken?
The influence of attributes on consumers purchase intention of organic chicken.
Master Thesis
Pieter van der Ven
Student number 402415
Supervised by Chen Zhou
MSc. Economics and Business
Specialization Marketing
Erasmus School of Economics
Erasmus University Rotterdam
July 2014
2

Abstract
Companies have come to realize that organic food does not only contribute to the environment and
society but when it is managed properly organic food can also help the company’s image and position
in the market, with the consequence of better sales and profits.
The aim of the paper is to identify the key attributes and moderators that influence consumers’
willingness to purchase organic chicken. In order to make clear what the topic is in this study, the
following research question was developed:
‘How do the consumers value the key attributes of organic chicken and what is the influence of
moderating factors on those attributes valuations and the willingness to pay for organic chicken?’
In order to test the main research question empirically, the well-known research method called
‘multiple regression model’ was used. A questionnaire was used to collect the data. The online survey
was activated on the 15th of May and closed on the 21th of May. In that time period 688 respondents
completed the questionnaire online or hard copy. From all the respondents 88 did not complete all the
survey questions. The final dataset consisted of 600 respondents.
In the end it turned out that the most important attribute where consumers look at when they make the
decision between buying a conventional chicken or an organic chicken is the price, and the attribute
environmentally friendly becomes more important when consumers look for organic chicken with
more stars. The demographic features, gender, age, income and education did not have a significant
effect on the evaluation of the key attributes of organic chicken. The psychological feature
environmental concern did have a have a significant effect on the evaluation of the key attributes of
organic chicken. Consumers with high environmental concern are willing to pay more for the attribute
environmentally friendly than consumers with lower environmental concern. Consumers with high
environmental concern are willing to pay less for the attribute nutrition of organic chicken with three
stars.
3

Contents 1. INTRODUCTION ............................................................................................................................... 6
2. THEORETICAL BACKGROUND ........................................................................................................ 11
2.1 Organic products ................................................................................................................... 11
2.2 Theory of onsumption values................................................................................................. 13
2.2.1 Functional value ............................................................................................................ 14
2.2.2 Social value .................................................................................................................... 14
2.2.3 Emotional value ............................................................................................................. 14
2.2.4 Epistemic value .............................................................................................................. 15
2.2.5 Conditional value ........................................................................................................... 15
2.2.6 Consumption values are driven by circumstances ........................................................ 15
2.3 Main attributes influencing consumers choice for organic chicken ..................................... 16
2.3.1 Attribute nutrition (health) .......................................................................................... 16
2.3.2 Attribute taste ............................................................................................................... 17
2.3.3 Attribute environmentally friendly ............................................................................... 17
2.3.4 Attribute price ............................................................................................................... 18
2.4 Psychological factor moderates consumers choice for organic chicken ............................... 18
2.4.1 Environmental concern ................................................................................................. 19
2.5 Age moderates consumers choice for organic chicken ......................................................... 19
2.6 Gender moderates consumers choice for organic chicken .................................................. 20
2.7 Conceptual model ................................................................................................................. 21
3. METHODOLOGY ............................................................................................................................. 22
3.1 Choice of product category ................................................................................................... 23
3.2 Variables ................................................................................................................................ 24
3.3 Data collection ....................................................................................................................... 26
3.4 Statistical modeling ............................................................................................................... 28
4. RESULTS ......................................................................................................................................... 30
4.1 Factor analysis ....................................................................................................................... 30
4.2 Descriptive statistics .............................................................................................................. 31
4.3 Testing the hypotheses ......................................................................................................... 33
4.3.1 Model 1.......................................................................................................................... 33
4.3.2 Model 2.......................................................................................................................... 37
4.3.3 Model 3.......................................................................................................................... 39
4.3.4 Summary of hypotheses ................................................................................................ 40
4

4.4 Characteristics of high environmental concern consumers .................................................. 41
5. Conclusion ..................................................................................................................................... 42
5.1 Discussion of the results ........................................................................................................ 42
5.2 Scientific implications ............................................................................................................ 45
5.3 Managerial implications ........................................................................................................ 45
5.4 Limitations and directions for future research ..................................................................... 46
Bibliography ........................................................................................................................................... 47
APPENDICES ........................................................................................................................................... 51
Appendix 1: Survey ........................................................................................................................ 51
Appendix 2: Factor analysis .......................................................................................................... 55
Appendix 3: Descriptive statistics ................................................................................................. 58
Appendix 4 : Transformations for lineair regression .................................................................... 59
Appendix 5: Results of model 1 ........................................................................................................ 60
Appendix 6: Results of model 2 ........................................................................................................ 63
Appendix 7: Results of model 3 ........................................................................................................ 66
5

1. INTRODUCTION This chapter ‘Introduction’ will start with the background of the study. After that, the current market
of organic food will be described, followed by the research questions and sub questions of this
research. At last, managerial and scientific relevance and the structure of this thesis will be presented.
During the last few decades green food products, also known as organic food, have been (and still are)
growing in interests rapidly. More often consumers are able to purchase organic food in supermarkets.
Consumers used to go to specialty stores when they wanted to purchase organic food but nowadays the
assortments of supermarkets are growing with organic options for all kinds of products, for instance
jam, honey, meat, chocolate, fruit, vegetables, milk and eggs. Transparency Market Research
published a new market research report ‘’Organic Food and Beverage Market – Global Industry
Analysis, Size, Share, Growth, Trends and Forecast, 2013 – 2019’’. According to that report, the
demand for organic food and beverages worldwide was valued at 70.7 billion US dollars in 2012 and
is expected to grow to 187.85 US dollars in 2019. Companies have come to realize that organic food
does not only contribute to the environment and society but when it is managed properly organic food
can also help the company’s image and position in the market, with the consequence of better sales
and profits. One example of the rise of organic products is found in the coffee market. In 1988 the first
packet of coffee gets the label of fair trade from Max Havelaar in the Netherlands. The Max Havelaar
foundation is an independent non-profit organization that licenses use of the Fairtrade Certification
Mark on products in the Netherlands in accordance with internationally agreed Fairtrade standards
(Max Havelaar, 2014). 22 years after the first introduction of fair trade coffee in the Netherlands, the
American company ’Starbucks’ sells only fair trade coffee (since 2010). Today in the coffee and
chocolate market, companies have to make their products ‘green’ otherwise they lack behind by their
competitors.
All companies are always looking for new upcoming markets where they can differentiate themselves
from the competitors and serve new customers and/ or preserve their existing customers. So also in the
food industry companies are looking for new opportunities to serve their customers. For organic food
the market is broadly segmented into organic fruits and vegetables, organic meat, fish and poultry
products, organic dairy products (milk, yoghurt, cheese, butter and ice cream), organic frozen and
processed food and others (condiments, tofu, sweeteners and seasonings). Organic fruits and
vegetables accounted for more than 36% share of the organic market, organic dairy products
accounted for 28% share of the market and organic coffee and tea accounted for more than 35% share
of the global organic beverages market (Transparency Market Research, 2013). Organic meat, fish and
poultry products occupied a very small share in the current market but are expected to exhibit the
fastest growth rate among other segments (Transparency Market Research, 2013). Pei-Chun Lin also
6
confirms that despite a lot of marketing effort the market share of organic meat, especially the fish and
poultry segment, is relative low (Lin & Huang, 2011). Particularly a lot of marketing effort goes to
the broiler chicken without the desired results. In order to stop the production of broiler chicken,
companies need to know how much consumers are willing to pay for organic chicken and what
influences the willingness to pay for organic chicken. How far should companies go with making their
chickens organic in order to get a good return on investment? To what extent do consumers look at
the taste, the nutrition or the welfare of the organic chicken? These are questions that will be answered
in this study. The aim of the paper is to identify the key attributes and moderators that influence
consumers’ willingness to purchase organic chicken. In order to make clear what the topic is in this
study, the following research question was developed:
‘How do the consumers value the key attributes of organic chicken and what is the influence of
moderating factors on those attributes valuations and the willingness to pay for organic chicken?’
For answering the research question, several sub-questions were developed. On behalf of the existing
literature and/or empirical evidence the sub-questions will be answered. The following sub-questions
were developed:
1. What does the definition ‘organic’ mean in general and for chicken specifically in the context
of this research?
2. What are the key attributes consumers’ value by making a purchase decision for organic
chicken?
3. How do the consumers value the key attributes of organic chicken by making a purchase
decision?
4. What are possible psychological factors that can influence the consumers attribute valuations
of organic chicken?
5. What demographic features will moderate the relation between the attributes of organic
chicken and the willingness to pay for organic chicken?
In order to test the main research question empirically, the well-known research method called
‘multiple regression model’ will be used. Multiple regression analysis is a technique which is used to
determine the causality between one dependent interval- or ratio-scaled variable (the explained
variable) and multiple independent interval- or ratio-scaled variables (the explanatory variable), in
other words, one tries to explain the variation in one dependent variable as much as possible on the
basis of the variation in a number of relevant independent variables (Janssens, Wijnen, De Pelsmacker,
& Van Kenhove, 2008). The multiple regression model requires a continuous dependent variable, for
instance customer satisfaction, market share or product evaluation (Vocht, 2010). In this research the
7

continuous dependent variable is the willingness to pay for organic chicken and the independent
variables will be the key attributes of organic chicken. A linear regression model in its general form is
expressed as follows:
Y = b0 + b1X1 + b2X2 + ….. +bnXn + ε
Where Y = dependent variable
Xi = independent variable
bi = parameter to be estimated, coefficient
ε = disturbance term
Besides the primary research goals ‘attributes’, ‘psychological factors’ and ‘demographics’, in order to
make sure that the analyses is complete and accurate, there will be looked at the control variable price
as well. Research has shown that price has a significant influence on the willingness to pay for organic
food (Boccaletti & Moro, 2000).
Consumer research recognizes environmental concern as a characteristic that influences all phases of
the decision making process (Laroche, Bergeron, & Forleo, 2001). Besides environmental concern, a
positive correlation is found between age and environmentally friendly behaviour (Kilbourne &
Pickett, 2008). The study of Ross, Patterson and Stutts (1992) has identified gender differences
in the way people engage in helping and supporting others, which might result in different
shopping behavior between men and women for organic food. The above mentioned factor;
environmental concern, age and gender, will therefore be further investigated and reviewed in
more detail in the following chapters. There are no good qualitative studies found that look at
attributes of food products but there are studies found that looked at why consumers buy
organic food. The reasons why consumers buy organic food are primarily because of health,
taste and concern of animal welfare and the environment (Renee, Pierre, & Andrea, 2007).
Therefore the attributes health (nutrition), taste and environmentally friendly are used as
independent variables. The independent variable price is added as control variable as stated
before.
The results of this research can be very useful for both the scientific and managerial areas.
While a lot of research about consumers’ purchase decisions is done, organic products change
those decisions processes of consumers. Organic food brings new psychological factors that
influence the purchase decision. The conclusions of this research will allow academicians to
further understand additional drivers of organic chicken purchase decisions, such as
8

environmental concern, age and gender that consumers can have. A lot of research is done on
psychological factors that influence organic purchase decisions (Batte, Hooker, Haab, &
Beaverson, 2006) (Cheah & Phau, 2011) and a lot of research is done on the reasons for
consumers to purchase organic food (Renee, Pierre, & Andrea, 2007). No study looked at
which food attributes consumers consider during their purchase decisions and what the
influence is of psychological and demographic factors in that process. This research will
provide information about the correlation between attributes preferences and the willingness
to pay for organic food products, in this case chicken, and the influence of psychological and
demographic factors on those correlations. The results of this research can also be used by
companies and non-profit organizations. Companies that produce organic food can get a better
understanding of consumers’ willingness to pay for each key attribute of organic food.
Besides, they get a better understanding of the psychological characteristics of current and/or
potential customers which allows them to better serve their customers’ wishes. Non-profit
organizations could also benefit from this research. For instance non-profit organization
‘Wakker dier’ puts its efforts in improving the lives of animals in the Netherlands. Currently
they are broadcasting a campaign about the broiler chicken. The goal of the campaign is to
make people aware of the horrible life a broiler chicken lived before it ends up on your dining
table. The conclusion of this research gives ‘Wakker dier’ information about what kind of
consumers they need to approach and which product attributes are important to them. So that
they will get an answer to the question: Should they make consumers aware of the horrible
life a broiler chicken had or should they tell them about the antibiotics that are in the broiler
chicken? Non-profit organizations can use their limited resources a little bit more effective in
order to reach their goals with this research. Understanding the trade-offs that consumers are
willing to make for purchasing an organically produced food product, will help managers
understand what trade-offs they should make when developing their products and marketing
campaigns, so that they can maximize its efficiency. Besides the fact that this will contribute
to increasing the return on investment, it will also help to increase the customer loyalty and
brand image of the company or organization. Additionally, but not less important, it can allow
a company to differentiate themselves or its products from the competitors, which is basically
the tasks and the largest challenge for a marketer.
The research will have the following structure: The upcoming chapter will explain the
theoretical framework of the research. The techniques that are used to collect the data will be
shown and explained in the chapter ‘methodology’. After the methodology the results will be
9

presented and discussed. The final chapter will include the conclusion with the implications of
the research and recommendations for further research.
10

2. THEORETICAL BACKGROUND The purpose of this chapter is to create the theoretical framework and finding theoretical arguments for
developing the hypotheses. Quite a lot of research is performed on the psychological factors that
influence the reasons why consumers purchase or do not purchase organic food products. With this in
mind, it is useful that the theoretical background is based on the readings of the previous studies that
are published and relevant for the topic of this paper. By following a ‘top-down’ process this chapter
will kick off with some general information about organic food. There will be a short explanation of
what organic food really means, how companies can benefit from organic food, what the size of the
organic market is today and there will be a short explanation what organic chicken means. After that,
the focus will shift from the product to the consumers. The theory of consumption values will explain
which values consumers have when they make certain purchase decisions. After a general introduction
of the theory of consumption values the focus will be on the functional values of consumers. Here the
product attributes of the chicken that will be analysed in this paper are introduced. When the
functional values of consumers are explained, the psychological and demographic influences
(moderators) will be examined in detail. This part will explain why certain moderators are chosen. At
the end of this chapter a visual representation of the hypotheses will be drawn in a conceptual model.
2.1 Organic products
First it is important to make clear what we really mean with organic products. The words ‘green’,
‘ethical’ and ‘organic’ are often used in the literature but do not always mean the same thing.
According to the Organization for Economic Cooperation and Development (OECD, 2009), green
products reflect what is achieved to prevent, limit, reduce, or correct harmful environmental impacts
on water, air and soil; they constitute at least one means of resolving problems related to waste, noise
and general detriment to the ecology, and are an avenue for generating beneficial products and
services. According to Uusitalo & Oksanen (2004), ethical consumerism refers to buyer behavior that
reflects a concern with the problems that arise from unethical and unjust global trades, such as child
and low-paid labor, infringement of human rights, animal testing, labor union suppressions,
inequalities in trading relations with the Third World and pollution of the environment (Strong, 1996).
As seen above ‘green’ and ‘ethical’ cannot be used as synonyms. By ‘green’ the focus is on the
environment (water, air and soil) and ‘ethical’ focuses on human and animal rights. In this paper the
focus is on both the environment and animal rights and therefore we need a mix of both definitions.
The word that has the best definition for what is meant in this paper is ‘organic’.
The word ‘organic’ is also defined differently in different jurisdictions, the general term ‘organic
farming’ responds to site-specific farming and crop conditions by integrating cultural, biological and
mechanical practices that foster recycling of resources, promote ecological balance and conserve
11

biodiversity. Synthetic pesticides and chemical fertilizers are generally not allowed, although certain
organically approved pesticides may be used under limited conditions. In general, organic foods are
also processed without using irradiation, industrial solvents or chemical food additives (Lin & Huang,
2011).
Organic foods are food products that can only be produced by the methods that are defined as organic
farming. The European Union, Canada, Japan, Mexico, the United States and many other countries
have rules that require organic farmers to obtain certification when they mark food as organic. In this
way consumers know if food products are produced in a way that meets the standards set by
international organizations and national governments. Therefore the organic food market is a heavily
regulated and controlled industry.
Most consumers believe that organic food is healthier, has a better taste, is better for the environment
and has a better quality (Foster, 2005). Little research is done to check if these beliefs are really
accurate. Studies comparing the nutrient composition of organic and non-organic foods are limited in
number, and there is a lack of good-qualitative research in this area. The few studies that are
performed on nutrition of organic food reported little differences in nutrient composition between
organic and non-organic foods, although there is some evidence that organically produced potatoes
and leafy vegetables may have higher vitamin C content and lower nitrate levels (Williamson, 2007).
Research of multiple food products is needed to really find out if organic food has a better nutrition
than non-organic food. The beliefs about taste and quality also need further research in order to
conclude that they are accurate. But despites it is not proven that organic products have better
nutrition, taste and quality people buy them for that reason.
Nowadays heavy competition and very small margins on mature products, makes retailers search for
the ‘next big thing’ in order to generate higher margins (Bezawada & Pauwels, 2013). Organic food
products are one of those products that can generate higher margins for retailers, others possibilities
are ready-to-serve entrées, health and wellness products (e.g. food supplements and weight loss bars)
and private labels (Food Marketing Institute 2009). Retailers hope that selling and promoting of
organic products will increase total category margins and store revenues, in addition to enhancing
stores’ long-term image, equity, and differentiated positioning (Chain store age, 2009). The gross
margins of organic (food?) products are 30% to 50% versus 20% to 25% for conventional products
(Roheim & D'Silva, 2009).
According to Transparency Market Research report ‘Organic Food and Beverage Market – Global
Industry Analysis, Size, Share, Growth, Trends and Forecast, 2013 – 2019’ the demand for organic
food and beverages worldwide was valued at 70.7 billion US dollars in 2012 and is expected to grow
12

to 187.85 US dollars in 2019. The consumer demand for organic products is concentrated in North
America and Europe; these two regions comprise 96 percent of global revenues in 2009 (IFOAM,
2012). The financial crisis has had a negative impact on the global market for organic products,
however, preliminary research finds that growth continued in 2009 in spite of the poor economic
conditions (IFOAM, 2012). The sales of organic products have grown 17%-21% in 2008 and 2009,
compared with a growth of 2% - 4% of conventional products (Bezawada & Pauwels, 2013).
As mentioned before, this paper will focus on organic chickens. Today consumers are able to buy 4
different types of chickens in the retail stores in the Netherlands; the accepted chickens (meets the
basic criteria of animal welfare), one star chickens (indoor spillway), two stars chickens (outdoor
spillway) and three stars chickens (more overall space and less treatments). The stars are given by the
quality mark ‘Beter leven’. Beter leven is a Dutch quality mark established by the animal protection
organization ‘Wakker dier’. They developed a star system which means the more stars a product has
the better it is for the animal’s well-being. The chicken with one or more stars are labeled as organic
chicken in this paper.
2.2 Theory of consumption values
The theory of consumption values is developed to better understand why consumers make certain
buying decisions. The theory focuses on consumption values, explaining why consumers make
decisions to buy or not buy (or to use or not use) a particular product, why consumers choose one
specific product type over another product type, and why consumers choose one brand over another
brand. The theory is proven to be applicable to choices involving a broad range of product types
(consumer nondurables, consumer durables, industrial goods and services).
The theory of consumptions values knows three fundamental propositions that are axiomatic:
1. Consumer choice is a function of multiple consumption values.
2. The consumption values make differential contributions in any given choice situation.
3. The consumption values are independent
The theory has been employed and tested in more than 200 applications, and has demonstrated
consistently good predictive validity (Sheth, Newman, & Gross, 1991).
The consumer choice behavior is influenced by five consumption values that are identified by the
theory of consumption values. The five consumption values are: functional value, social value,
emotional value, conditional value and epistemic value. A consumer’s purchase decision process may
be influenced by only one or perhaps all of the five consumption values (Sheth, Newman, & Gross,
1991). There will be a short explanation for each of the five consumption values.
13

2.2.1 Functional Value The functional value of an alternative is defined by Sheth, Newman and Gross (1991) as:
‘’The perceived utility acquired from an alternative’s capacity for functional, utilitarian, or physical
performance. An alternative acquires functional value the possession of salient functional, utilitarian,
or physical attributes. Functional value is measured on a profile of choice attributes’’.
The primary driver of consumers’ choice is traditionally the functional value. A reason to choose a
product over another product can derive from its characteristics or attributes, such as durability,
reliability and price. An example is the decision to buy a particular television based on the color and
resolution of the screen.
2.2.2 Social Value The social value of an alternative is defined by Sheth, Newman and Gross (1991) as:
‘’The perceived utility acquired from an alternative’s association with one or more specific social
groups. An alternative acquires social value through association with positively or negatively
stereotyped demographic, socioeconomic, and cultural-ethnic groups. Social value is measured on a
profile of choice imagery’’.
Product choices that are often driven by social value involve products that are highly visible (e.g.
jewellery, clothing) and goods or services that people give or share with other (e.g. gifts, products used
in entertaining). For instance, a particular television brand may be chosen more for the social image
evoked than for the functional performance of the television.
2.2.3 Emotional Value The emotional value of an alternative is defined by Sheth, Newman and Gross (1991) as:
‘’The perceived utility acquired from an alternative’s capacity to arouse feelings or affective states.
An alternative acquires emotional value when associated with specific feelings or when precipitating
or perpetuating those feelings. Emotional value is measured on a profile of feelings associated with
the alternative’’.
Emotional responses are frequently associated with goods and services (e.g. the romance aroused by a
candlelight dinner, the fear aroused while viewing a horror movie). Emotional value is often
associated with aesthetic alternatives (e.g. religion, causes). However, more material and seemingly
utilitarian products also have emotional value. For instance, some kinds of food give people the
feeling of comfort through their association with childhood experiences. Sometimes people say to
have a ‘’love affair’’ with a product, for instance a car.
14

2.2.4 Epistemic Value The epistemic value of an alternative is defined by Sheth, Newman and Gross (1991) as: ‘’The perceived utility acquired from an alternative’s capacity to arouse curiosity, provide novelty,
and/or satisfy a desire for knowledge. An alternative acquires epistemic value by questionnaire items
referring to curiosity, novelty and knowledge’’.
Epistemic value certainly comes from entirely new experiences. However, an alternative that provides
a simple change of pace can also be imbued with epistemic value. The alternative may be chosen
because the consumer is bored or satiated with his or her current brand (trying a new brand of beer), is
curious (as in visiting a new bar), or has the desire to learn (as in experiencing another culture).
2.2.5 Conditional Value The conditional value of an alternative is defined by Sheth, Newman and Gross (1991) as:
‘’The perceived utility acquired by an alternative as the result of the specific situation or set of
circumstances facing the choice maker. An alternative acquires conditional value in the presence of
antecedent physical or social contingencies that enhance its functional or social value. Conditional
value is measured on a profile of choice contingencies’’.
An alternative’s utility will most of the time depend on the situation the person is in. For instance,
some products or services have only value in particular seasons (e.g. Christmas cards), some are
associated with ‘once in a lifetime’ events (e.g. wedding gown), and some are only needed in
emergency cases (e.g. hospital service). However, a lot of products have more subtle conditional
associations (e.g. popcorn at the movies).
2.2.6 Consumption values are driven by circumstances The choices consumers make within a single product class, the brand, product type and ‘buy or not
buy’ may be driven by completely different consumption values. So the consumption value that has
the highest influence on the decision process is choice- or application-specific. For instance, the
decision if a person is going to move out of his parents’ home and buy or not buy a house (a ‘buy
versus no buy’ choice) involves a different set of consumption values as compared with the decision to
buy a condominium versus a single-family home (a product type decision).
Sheth, Newman and Gross did research to find out which consumption values influence the consumers
choice the most when they make ‘buy or not buy’, product type and brand choices. In their research
they looked at smoking cigarettes. Their results showed that the emotional value is the most influential
in discriminating the smokers from the non-smokers (‘buy or not buy’). In this paper we focus on
chicken and therefor is the ‘buy or not buy’ situation less interesting because almost everyone eats and
therefore buys chicken. For the second situation, product type, Sheth, Newman and Gross tested the
15

choice between filtered versus non-filtered cigarettes. The results showed that the two most
discriminating factors are functional value and social value. When they generalized their findings to
the entire cigarette market, parties hoping to influence choice between filtered and non-filtered product
types should emphasize salient functional concerns and social associations. The choice between
organic chicken and conventional chicken is also a product type choice. Therefore the main focus of
this paper will be the functional and social value of organic chicken. The last situation that Sheth,
Newman and Gross analysed was the brand choice between Marlboro versus Virginia Slims smokers.
The results indicated that the social value literally overwhelms the other consumptions values.
Empirical results indicated that consumers, if there are any brand choices between chicken, rarely look
at the brands behind the chicken (Renee, Pierre, & Andrea, 2007). Therefore there will be no focus on
the brand choice situation in this research. Based on the theory of consumption values this paper will
continue to focus on the functional value and social value of organic chicken.
2.3 Main attributes influencing consumers choice for organic chicken
As mentioned earlier, the primary driver of consumers’ choice between product types is the
functional value. In this research different product types of chicken (e.g. organic or non-
organic) will be examined. That means that a reason to choose a chicken over another chicken
can derive from its characteristics or attributes. If the price of a chicken seems too high, a
trade-off may be made as the consumer weights factors other than price in the product
selection and decision, but research trends indicate a lack of willingness to pay premium
prices for green products (D'Souza, Taghian , & Lamb, 2006). Bei and Simpson (1995)
indicated that consumers consider both the price and quality of recycled products. The quality
of a chicken consists off course of multiple attributes ( e.g. taste, smell, shelf life). There are
no studies found that look at those attributes and explained which attributes are most
important for the consumers. In order to decide which attributes are needed for this research,
studies about why consumers buy organic food are looked at. Consumers buy organic food
primarily because of health, taste and concern of animal welfare and environment (Renee,
Pierre, & Andrea, 2007). Therefore the attributes nutrition, taste and environmentally friendly
will be further discussed.
2.3.1 Attribute nutrition (health) In 2004, 66% of the people in England believed that organic food products are better for the humans’
health than conventional food products (Foster, 2005). They think that, because organic chicken is
grown without pesticides and chemical fertilizers. This contributes that organic chicken has no or less
negative effects on their health and has better nutrition than conventional food. Whether this
16

assumption is true or not, will not get any attention in this paper and further research is needed to
answer that question. The first attribute of the chicken is defined as ‘nutrition (health)’. The following
hypothesis is developed for this study:
H1: There is a positive relationship between nutrition (health) and consumer willingness-to-pay for
organic chicken.
2.3.2 Attribute taste In 2004, 49% of the people in England believed that organic food products taste better than
conventional food products (Foster, 2005). In retail stores and butcher’s shops the butcher often tells
his customers that the organic chicken tastes better than the conventional one. If this is really true or
not has never been proven. A butcher may say that organic chicken tastes better because of the higher
margin on the organic chicken. Further research should find out if organic food really tastes better or
not. Because consumers believe that organic chicken tastes better than conventional chicken, and
therefore have a reason to buy it, the second attribute is defined as ‘taste’. The following hypothesis is
developed for this study:
H2: There is a positive relationship between taste and consumer willingness-to-pay for organic
chicken.
2.3.3 Attribute environmentally friendly In 2004, 78% of the people in England believed that organic food products were better for the
environment and wildlife. The term ‘environmentally friendly’ involves making decisions and taking
action that are in the interests of protecting the natural world, with particular emphasis on preserving
the capability of the environment to support human life. In this paper the better animal welfare also
includes ‘environmentally friendly’. The third attribute will be defined as ‘environmentally friendly’
because ‘environmentally friendly’ is one of the main reasons that consumers buy organic chicken. As
said before there are different levels of environmentally friendly chicken (1, 2 or 3 stars of the quality
mark ‘Beter leven’). The prediction is that consumers get a higher utility from chickens with 3 stars
than from chickens with 1, 2 or no stars. Therefore the following hypothesis is developed for this
study:
H3: There is a positive relationship between environmentally friendliness and consumer
willingness-to-pay for organic chicken.
17

2.3.4 Attribute price When it comes to product related research, price is one of the most traditional product attributes.
Applying basic economics principles leads, for any normal goods, to expect that price will have a
negative effect on consumer choice. In other words, it is assumed that when price level is higher, the
utility of choosing a product will decrease. The question of interest in this research is whether the price
level of an organic chicken has any effect on the choice of the consumer. The literature review
concluded that price is not a reason why consumers buy organic food products, but it can be a reason
why consumers do not buy organic food products. As mentioned before, price is one of the most
traditional product attributes consumers look at and therefore price is the control variable in this
research. The higher price of organic chicken could also be the explanation for the conviction of
consumers of better taste and nutrition. The following hypothesis is developed for this study:
H4: There is a negative relationship between price and consumer willingness-to-pay for organic
chicken.
2.4 Psychological factor moderates consumers choice for organic chickens
Psychological information about consumers has received a lot of attention within the context of
environmental marketing (Laroche, Bergeron, & Forleo, 2001; McCarty and Shrum, 1994).
Psychological factors include attitudes, interpersonal influences, level of knowledge in a specific area
and values.
Social cognitive theory defines human behavior as a triadic, dynamic and reciprocal
interaction of personal factors, behavior and the environment (Bandura, 1977, 1986, 1989).
The theory suggests that the dynamic interplay of personal, behavioral and environmental
influences uniquely determines human functioning (an individual’s behavior) (Cheah & Phau,
2011). Furthermore, people are both products and producers of their environment (Bandura,
1977). A person’s behavior influences the aspects of the environment to which they are
exposed, and in turn that environment modifies the person’s behavior. For example, the role
of product knowledge or education (information derived from the environment) that affects a
purchase decision (purchase evaluation) is of primary importance to consumers
(Diamantopoulos, Schlegelmilch, Sinkovics, & Bohlen, 2003).
The way in which a person experiences the environment through selective attention can be
affected by a person’s behavior. Based on learned human preferences and competencies,
individuals select who they interact with and the activities in which they participate from a
vast range of possibilities. Therefore, behavior influences which of the many potential
18

environmental influences come into play, and which forms they take. In turn, the environment
partly influences the development and activation of one’s behavior (Bandura, 1977). What
this means is that every consumer that wants to buy chicken looks at the attributes differently
due to his own personal environment.
Therefore, this study will include the psychological factor; environmental concern as a
moderating effect.
2.4.1 Environmental concern
Environmental concern denotes the general orientation of individuals toward the environment
and their level of concern toward environmental issues (Choi & Kim, 2005). Owing to the
increased prominence of environmental concerns and the subsequence efforts of
governmental agencies, non-governmental organizations and local environmentalists to
increase awareness of society’s impact on the environment, environmentalism has become an
important global phenomenon (Brown, 2008) (Manaktola & Jauhari, 2007). While
consumers’ environmental concerns have moved into mainstream marketing, it is useful to
form a marketing perspective to investigate how consumers make informed choices about
green products (D'Souza, Taghian , & Lamb, 2006). Social marketing literature views green
consumer behavior as a form of ethically oriented consumer behavior that is motivated not
only by consumers’ own personal needs, but also by their concern for the welfare of society in
general (Diamantopoulos, Schlegelmilch, Sinkovics, & Bohlen, 2003) (Osterhus, 1997). It has
generally been found that there is a positive correlation between environmental concern and
environmentally friendly purchasing behavior (Straughan & Roberts, 1999). The study
proposes the following hypothesis:
H5: Price, taste, healthful/nutrition, environmentally friendly play a different role for high
environmental concern consumer and low environmental concern consumers.
2.5 Age moderates consumers choice for organic chickens
Fransson and Garling (2000) developed the hypothesis that younger persons are more likely to buy
organic food products than older persons. Van Liere and Dunlap (1980) proposed as a possible
explanation for this, that younger persons are less integrated in the existing social order. Since
solutions to environmental deterioration are often viewed as threatening to the current way of
existence, it is logical to expect that younger persons are more likely to support actions against
environmental deterioration than older persons. When Van Liere and Dunlap (1980) tested six
attitudes towards the environment, four of them were negatively correlated with age.
19

Howell and Laska (2002) found on three different occasions in a sequential cross-sectional study, that
younger persons expressed concern about environmental deterioration more often than older persons.
A possible explanation of these results from studies, older than ten years, could be that older persons
at that time did not receive information about environmental issues. Nowadays, with all the media
attention, the issue could hardly escape anyone’s attention. Therefore the differences between younger
and older persons may have decreased but has probably not completely disappeared.
Research found that there is a significant overall effect between age and the ability to taste (Mojet &
Heidema, 2001). They found that it is harder for older persons (60 – 75 years) to detect certain
ingredients in food than it is for younger persons (19 – 33 years). This study therefore predicts that age
influences the value of the attribute taste for organic chicken.
In the literature there are no good qualitative articles found about age and the concern with healthy
food. On average younger people have less health problems than older people do. This could mean
that younger people are less conscious about the importance of being healthy. Older people might be
more aware of their health and therefore consume more healthy food. Based on those assumptions this
study tries to find out if age influences the importance of the attribute nutrition (health).
The study proposes the following hypothesis: H6: Price, taste, healthful/nutrition, environmentally friendly play a different role for older
consumers than for younger consumers.
2.6 Gender moderates consumers choice for organic chickens The literature shows different results about the relationship between gender and the willingness to
behave in environmental friendly ways. Arcury and Christianson (1990) found that men were more
environmentally concerned than women. Stern et al. (1993) and Stern et al. (1995) found, however,
that women differed from men in that they expressed stronger intentions for pro-environmental action
and had stronger beliefs about the detrimental consequences of environmental degradation. Other
literature has identified gender differences in the way people engage in helping and supporting others
(Ross, Patterson and Stutts, 1992; Berger, Cunningham and Kozinets, 1999), favouring women as
more willing to behave in such ‘pro-social’ way. The researchers show that women are considered
more comprehensive information processors, and thus are more likely to respond to both subjective
and objective cues, while men tend to use heuristic processing and miss subtle cues. This leads to the
assumption that women, being a better information processor, value the attributes nutrition and
environmentally friendly different than men because they respond better to the information that is
given.
20
The study proposes the following hypothesis: H7: Price, taste, healthful/nutrition, environmentally friendly play a different role for women than
for men.
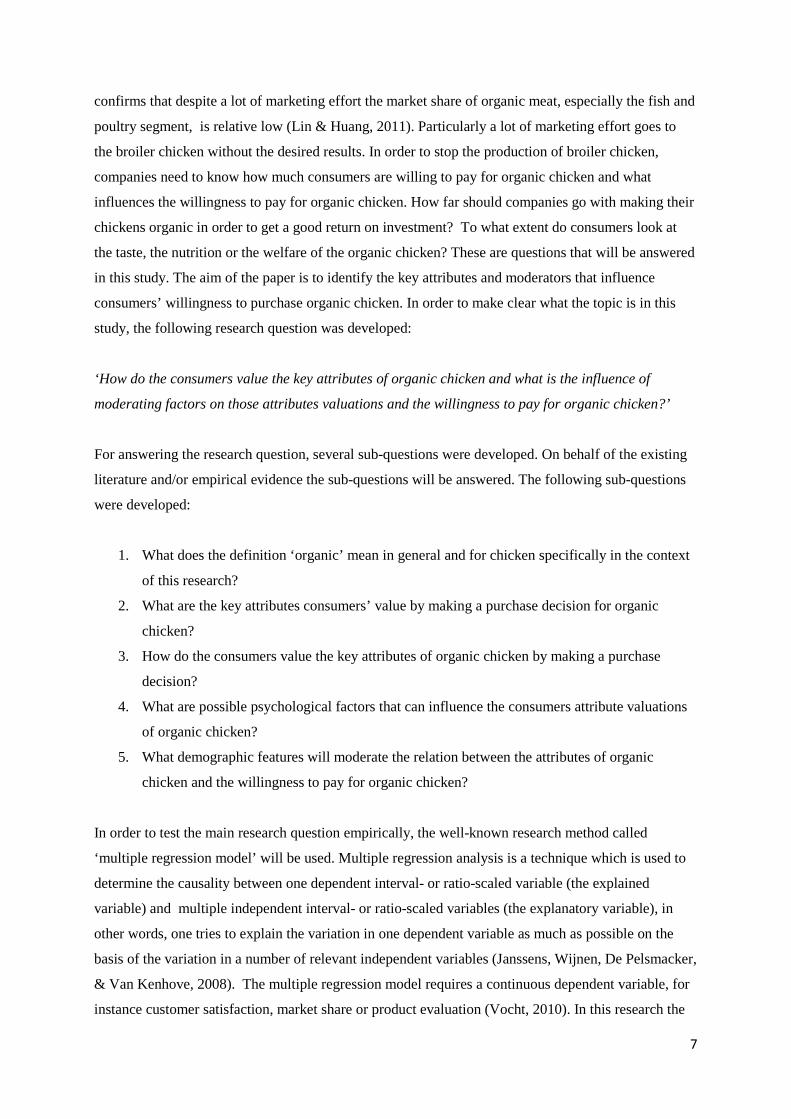
2.7 Conceptual model
The ‘conceptual model of consumer willingness-to-pay for organic chicken’ incorporates four
independent variables: price, taste, nutrition and environmentally friendly. The dependent variable is
willingness-to-pay for green food products. In addition, three moderation variables, environmental
concern and attitude are added to the model.
Independent variables H1 Dependent variable H2 H3 H4 Moderating variable
Nutrition
Taste
Environmentally friendly
Price
Willingness-to-pay
- Environmental concern H5 - Age H6 - Gender H7
21

3. METHODOLOGY
This chapter will start with the research design of the study in paragraph 3.1. After that, paragraph 3.2
will talk about the product category organic chicken. Paragraph 3.3 will explain the meaning of each
variable, followed by the method of data collection in paragraph 3.4. The last paragraph will focus on
the statistical modelling behind the models that will be used.
3.1 Research design
As stated before in the introduction, the marketing tool that will be used to test the research question is
the multiple regression analysis. A simple linear regression is used when there is only one independent
variable, in this report there are four independent variables and therefore the extension of the simple
linear regression is used; the multiple regression analysis. This analysis is used by marketers when
they want to predict the value of a dependent continuous variable based on the value of two or more
independent variables (Janssens, Wijnen, De Pelsmacker, & Van Kenhove, 2008). Compared to a
simple regression analysis a multiple regression model can run many explanatory variables that may
be correlated, which gives hope to infer causality in cases where simple regression analysis would be
misleading. The multiple regression analysis is useful in this research because it can estimate the
impact of selected product attributes on consumers choice for that particular product. Regression
analysis is a technique that checks if there is causality between one dependent interval- or ratio-scaled
variable (for instance willingness to pay) and one or more independent variables (for instance product
attributes). In other words marketers try to explain the variation in one dependent variable as much as
possible on the basis of the variation in a number of relevant independent variables (Janssens, Wijnen,
De Pelsmacker, & Van Kenhove, 2008). A linear regression model in its general form is illustrated as
follows:
Y = b0 + b1X1 + b2X2 + ….. +bnXn + ε
Where Y = dependent variable
Xi = independent variable
bi = parameter to be estimated, coefficient
ε = disturbance term
In this study there are observations for several subjects for a single point in time and therefore
a cross-section analysis is performed. The regression analysis will estimate the parameters for
the variables (b) in such a manner that the best possible fit is obtained between the actual and
predicted values for the dependent variable (Janssens, Wijnen, De Pelsmacker, & Van
22

Kenhove, 2008). The least squares method will determine these coefficients, which can be
positive and negative. The parameters of the formula are developed in such a way that the
sum of the square of each of the residuals, deviation between the actual and predicted value, is
as small as possible. In determining the importance of each variable included in the model, it
is possible to get in a situation in which keeping one or more variables in the model is no
longer appropriate. With regard to this problem, there are various approaches to solve this
problem and here is chosen to use the ‘enter’ method. In this method, all of the variables
indicated by the researcher are included in the model. The researcher may then, after
examining the analysis output, choose to eliminate variables which do not contribute
significantly to the explanation of the model and then perform a second analysis on the basis
of the ‘enter’ method. The significant variables work on a ceteris paribus condition. When
there occurs a change in one variable, the other variables stay fixed.
In this study it is important to know how much of the variation in willingness to pay for
organic chicken can be explained by the attributes: nutrition, taste, environmentally friendly
and price, but also the ‘relative contribution’ of each independent attribute in explaining the
variance. The multiple regression analysis is able to determine the overall fit of the model and
the relative contribution of each of the predictors to the total variance explained.
The multiple regression analysis has also some disadvantages. The design of the questions
does not match the real life decision making process. Respondents are asked to rate statements
on a 7 point Likert scale. They have to imagine themselves in certain situations and think
about how they behave in these situations. A disadvantage of this question design can be that
respondents say that they agree with a statement, but they don’t act like it in real life.
In order to develop a study that will provide reliable results, several steps need to be taken.
Step one will be a short explanation why the specific product category is chosen. Secondly, all
the variables will be discussed; dependent variable, independent variables and moderators.
The third step will include the data collection and step four will present the statistical
modeling.
3.2 Choice of product category In the new market research report, ’Organic Food and Beverage Market – Global Industry Analysis,
Size, Share, Growth, Trends and Forecast, 2013 – 2019’, that is published by Transparency Market
Research, the demand for organic food and beverages worldwide was valued at 70.7 billion US dollars
23

in 2012 and they predict a growth to 187.85 US dollars in 2019. In this fast growing market of organic
food, poultry products occupied a very small share of the market but are expected to exhibit the fastest
growth rate among other segments (Transparency Market Research, 2013). The small market share of
poultry is remarkable, especially because a lot of marketing effort is focused on organic meat, and
especially the poultry segment (Lin & Huang, 2011). Therefore this study is focusing on the poultry
segment and especially organic chicken.
Organic chicken is a good product for this study because it is consumed by most of the population in
the Netherlands and almost everybody is very familiar with it. As mentioned before, in this study there
are no brand names of chicken producers used in the questionnaires. The label of the organization
‘Beter leven’ is used to show how environmentally friendly the chicken is produced. Most of the
consumers are familiar with this label because all the big supermarkets (Albert heijn, C1000, Jumbo,
etc.) sell chicken with the label of ‘Beter leven’. The Table below demonstrates similar researches
with their product category of choice.
Table 1: Similar researches and their product categories
Researchers Product category
Lin, Huang Green products in general
Batte, Hooker, Haab, Beaverson Organic food (Thailand)
Gil, Gracia, Sanchez Organic food (Spain)
Laroche, Bergeron, Barbaro-Forleo Green products in general
Hadi, Selamat, Shansudin, Radan Vegetables
Vlosky, Ozanne, Fontenot Environmentally certified wood
3.3 Variables Nutrition: This attribute reflects the amount of nutrition that consumers think the chicken has.
The exact figures of the nutrition in a particular chicken are not given to the respondents because this
study wants to know what beliefs the respondents have. The questions are formulated in a way that
respondents have to compare the nutrition of conventional chicken with organic chicken. Beside the
comparison between organic and conventional chicken, respondents indicated how important the
attribute nutrition is for them. The goal was to investigate if people believe that organic chicken has
better nutrition than conventional chicken and how important the attribute nutrition is for them.
Taste: This attribute represents the perception of taste that consumers have about the chicken.
The questions about the taste are formulated in the same way as for the attribute nutrition.
Respondents were not asked about the taste of a specific chicken but were asked to compare the taste
of conventional chicken and organic chicken. Further, respondents indicated how important the
24

attribute taste is for them when they buy chicken. The goal was to investigate if people believe that
organic chicken has a better taste than conventional chicken and how important the attribute taste is
for them.
Environmentally friendly: The attribute environmentally friendly reflects on the different levels
of animal welfare the chickens had during the production. The levels are chosen on behalf of the
organization ‘Beter leven’. They label all the chicken in the major supermarkets with their quality
mark in the Netherlands. The chicken receives no label when it is produced in the least
environmentally friendly way, and receive an extra star when the circumstances for the chicken
improve. In short, the labels that are used were no star, one star, two stars and three stars. Because the
label ‘Beter leven’ operates since 2007 most of the consumers have seen it before, which makes the
questions more realistic. The goal was to investigate how much people value the chicken that is
produced in a more environmentally friendly way.
Price: The attribute price reflects how much consumers value the price of organic chicken
and how they perceive the price of organic chicken. Respondents are asked how important the attribute
price is when they make a purchase decision. Also the price perception of organic chicken compared
to conventional chicken is asked. The goal was to investigate if people perceive the price of organic
chicken as too high compared to conventional chicken and to find out how important the attribute
price is for them.
Environmental concern: This moderator indicates the degree of concern the respondent has
about the environment. The literature review provided 9 questions from top articles to measure the
environmental concern of the respondent. Questions are asked about how worried they are about the
environment but also if they perform actions that help the environment (for instance donating money
or recycling waste). The goal here was to measure the amount of concern the respondent experiences
about the environment.
Gender: The moderator gender simply indicates if the respondent is a male or a female. This is
asked because this study wants to find out if male and female valuate the attributes of organic chicken
differently.
Age: This moderator shows the age of the respondent. The respondents were able to choose
out of a age range from 0 till 100 years old. There is chosen not to make any age categories in advance
because the literature review did not give an indication at what age categories people behave
differently.
25

Willingness to pay: This dependent variable represents the amount of money in euro’s consumers
are willing to pay for each specific chicken. The price levels that were used in the questionnaire are
based on the selling price levels in the supermarket Albert Heijn. The willingness to pay is asked for
the chicken with one, two and three stars of the quality mark ‘Beter leven’. The respondents were
asked to indicate on a percentage scale how much they were willing to pay for chicken with one, two
and three stars compared to conventional chicken. The price of conventional chicken was stated as
7.99, - euro per kilo. Compared to conventional chicken is the price of chicken with 1 star is +50%,
chicken with 2 stars +100% and chicken with 3 stars +225%. The options in the questionnaire were
therefore: same price, +50%, +100%, +150%, +200%, +250% and +300% or more.
In order to measure each variable there are at least three questions (variables) that measure each
variable. A factor analysis will be performed to summarize the variables when this is possible.
Summarizing the variables will have consequences for the interpretation of the results.
3.4 Data collection
The method that is used to collect the data is a questionnaire. The survey consisted of a hardcopy
version and an online version. The online version was designed on the online survey platform
Qualitrics, which can be found in Appendix 1. In order to get a higher response rate there is chosen to
combine the survey questions of this research with the survey questions of another student, that has
the same topic. In this way the manpower to collect the data was doubled. Combining the research
questions with the other student did not result in a survey that consumed too much time of the
respondents. It took respondents 10 minutes to participate in the survey. The hardcopy version of the
survey was distributed in front of Albert Heijn, at a local soccer club and through relatives. The online
survey was spread through social media platforms, direct and indirect mailings. There are formulas
that calculate the minimum number of respondents to get a reliable result, but according to professor
Hans Franses from the Erasmus University Rotterdam it is better to check if there is enough variance
in the data presence. In order to get an indication of how many respondents should be reliable, the
target number of respondents is 300. The respondents were friendly asked to participate in a research
on consumer behavior in relation to organic food. Before the questions were asked the participants
were presented with a description of the term ‘organic’.
Next the content of the survey will be discussed, only the questions from the survey that are used in
this study will get attention. The survey can be roughly divided into three parts based on the type of
questions that are used. The first part of the questionnaire consisted of some general questions about
several demographics; age, gender, income and education. All question where asked in a multiple
26

choice form except for ‘age’, which was an open question. The second part of the questionnaire
incorporated two multi-item 7-point Likert scales, containing four and sixteen questions. The first 4
questions measure the amount of concern the respondent has about the environment. The other sixteen
questions measure the attitude respondents have towards the attributes of organic chicken. The first
four questions related to environmental concern are adapted from the research of William Kilbourne
and Gregory Pickett. The other sixteen questions come mainly from the research of Marvin Batte,
Neal Hooker, Timothy Haab and Jeremy Beaverson and the research of Susanne Padel and Carolyn
Foster. The third part of the questionnaire is measuring the willingness to pay of the respondent for
each level of organic chicken. The measurement is performed by a 7-point Likert scale based on
percentages. The price levels are based on the prices of the supermarket Albert Heijn. Table 2 shows
the structure of the questionnaire.
Table 2:Questionnaire structure
Question type Source Structure
Demographic questions
(Q1,Q2,Q3,Q4)
Age, gender, income , education Multiple choice and open
questions
Environmental concern questions
(Q14,Q15,Q16)
William Kilbourne & Gregory
Pickett (2007)
7-points Likert scale based
on agreements
Attributes questions
(Q26-Q38)
Marvin Batte etc. (2006) Susanne
Padel & Carolyn Foster (2005)
7-points Likert scale based
on agreements
Willingness-to-pay questions
(Q39,Q40,Q41)
Selling prices of Albert Heijn 7-points Likert scale based
on percentages
After the survey was designed, a little pre-test was conducted, especially to see if the questions were
clearly formulated and in order to see if the price options (willingness to pay) were wide enough. The
concept version of the questionnaire was given to 10 relatives. They all agreed to answer a couple
questions afterwards. In the short interviews participants were asked if the questions were clearly
formulated, and on behalf of the responses a couple adjustments were made. None of the participants
stated that they needed a wider price option than was given, so no adjustments were made here.
27

3.5 Statistical modeling
When there is a data set with n amount of statistical units, the regression
model expects a linear relationship between the yi (dependent variable) and the p-vector of the
regressors xi. In the formula there is an error term εi. The error term is an unobserved variable that
brings noise to the linear relationship between the yi and xi. Therefore the model will look as follows:
When these equations are put together and written in a different form it will look as follows:
Here you have
There will follow some explanations of the figures that are used above.
- The term can have multiple names in theory, namely: dependent variable, criterion
variable, response variable, measured variable, regressand and endogenous variable. The
dependent variable is the variable whose value is caused or influenced by one or multiple
independent variables.
- The term can be called: independent variables, exogenous variables,
input variables, covariates, predictor variables, regressors and explanatory variables. As
mentioned before the independent variables causes/predicts the value of the dependent
variable. This is the variable that is observed. Usually an intercept is added to the independent
variables which is a constant value. The intercept is the baseline of the dependent value.
- The term is often called regression coefficients or effects. The regression coefficients has
to be estimated by the linear regression.
- As mentioned before the term is called the error term. Other names are disturbance term or
noise. The error term includes all factors that have an impact on the dependent variables and
are not included as independent variables.
28

On behalf of the results of the factor analysis and the multiple regression analysis, the expected
equations for the models can be given:
Model 1: WTP1,2 or 3 = 0 + nutrition + taste + ef + price +
The first model used in the multiple regression analysis is investigating the influence of each product
attribute on the willingness to pay for organic chicken for each star (1, 2 or 3). The variables nutrition,
taste, environmentally friendly (ef) and price are the independent variables. The dependent variables
will be willingness to pay for organic chicken with one star, two stars and three stars. In the model the
three dependent variable options are demonstrated with ‘WTP1, 2 or 3’. There will be only one
dependent variable at a time, so the analysis will be performed three times. The intercept ( 0) will
serve as the reference category for the utility. Model 1 will test hypotheses H1, H2, H3 and H4.
Model 2: WTP1,2 or 3 = 0 + nutrition + taste + ef + price + nutrition X
highenvironmentalconcern + taste X highenvironmentalconcern + ef X
highenvironmentalconcern + price X highenvironmentalconcern +
nutrition X older + taste X older + ef X older + price X older +
nutrition X male + taste X male + ef X male + price X male +
The second model is based on the first model but also looks at the possible moderating effect of
environmental concern, age and gender. Model 1 is extended with dummy variables of respondents
that have high environmental concern, older respondents and respondents that are male. The reference
category will be younger females with low environmental concern. The second model investigates if
males, older persons or people with high environmental concern valuate the product attributes
differently than people that are female, younger and have low environmental concern. Model 2 will
test hypotheses 5, 6 and 7. Similar to model 1, the dependent variables in the analysis will be
willingness to pay for organic chicken with 1, 2 and 3 stars. The determination of which respondents
are young and which are old will be performed after the descriptive analysis of the data. When there
occurs multicolineary, the decision can be made to make three different models for each moderator.
29

4. RESULTS In this chapter the results of the analyses that are performed are described. Before the data is described
a factor analysis is performed. After the descriptive statistics of the data the hypotheses are tested
using the multiple regression analysis.
4.1 Factor analysis Before the factor analysis could be performed two variables needed to be recoded. The reason was that
all the statements were presented in a positive wording except for two variables. For all variables
counted a 7 on the multi-item scale a positive attitude towards the measurement except for the
variables Q30 (taste) and Q38 (environmentally friendly). Therefore a reverse coding was used for
these two variables.
The factor analysis is performed to reduce the size of the dataset (amount of variables) to underlying
factors. A reliability test was performed after the factors were made in the statistics program SPSS.
The reliability of the constructs of each factor was tested by Cronbach’s Alpha and the results are
demonstrated in table 3. The complete tables of the reliability test are shown in appendix 2. The
construct of the factor is reliable when the Cronbach’s Alpha is higher than the acceptable level of 0.7.
Factor Variables Cronbach’s Alpha
Environmental concern Q14 + Q15 + Q16 0.902
Nutrition Q26 + Q27 + Q28 0.781
Taste Q29 + Q30R 0.745
Price Q32 + Q33 + Q34 0.886
Environmentally friendly Q35 + Q36 + Q37 + Q38R 0.833
Because the factors are valid and reliable, the average of the variables can be taken in further analysis:
- Environmental concern = (Q14 + Q15 + Q16) / 3
- Nutrition = (Q26 + Q27 + Q28) / 3
- Taste = (Q29 + Q30R) / 2
- Price = (Q32 + Q33 + Q34) / 3
- Environmentally friendly = (Q35 + Q36 + Q37 + Q38R) / 4
30

4.2 Descriptive statistics
The online survey was activated on the 15th of May and closed on the 21th of May. In that time period
688 respondents completed the questionnaire online or hard copy. From all the respondents 88 did not
complete all the survey questions. They probably got enough of all the questions and did not answer
the last questions. Therefore, all the 88 respondents that did not complete the questionnaire were
deleted out of the dataset. The final dataset consisted of 600 respondents.
First there will be an exploration of the demographics of the population sample. It consist for 58.7%
out of males and 41.0% out of females (0.3% is missing). The youngest respondent in the sample is 18
years old and the oldest respondent is 81 years old. The average age in the data is 38.68 years with a
standard deviation of 12.842 years. More than half of the respondents, 53.2%, have an annual income
of 46.000 euro or higher. Of all the respondents has 15.5% an annual income of 15000 or less. In the
population sample the educational background is high. 19.7% of all respondents has an education that
is lower than a bachelor, 44.8% has a bachelor degree and the other 35.5% has at least a master’s
degree.
When looking at the willingness to pay for organic chicken compared to regular chicken the
distinction is made between the three stars of the quality mark ‘Beter Leven’. The statistics that are of
interest here are the means of the scale items. The values are 1 = same price, 2 = + 50%, 3 = + 100% 4
= 150%, 5 = 200%, 6 = + 250 % and 7 = + 300% or more. The means of the willingness to pay for
organic chicken with 1,2 or 3 stars are all above 1, indicating that on average respondents are willing
to pay more for chicken with a star(s) from ‘Beter Leven’ than for regular chicken. In table 4 the
means and standard deviation of the values are given, they indicate that on average the more stars the
chicken has the more respondents are willing to pay for it..
Table 4: Willingness to pay for each star
Willingness to pay Mean Standard deviation Min Max
Question: ‘Compared to conventional chicken I am willing to pay for chicken with 1 stars:’
1.48 0.812 1 7
Question: Compared to conventional chicken I am willing to pay for chicken with 2 stars:’
1.93 0.912 1 7
Question: ‘Compared to conventional chicken I am willing to pay for chicken with 3 stars:’
2.45 1.167 1 7
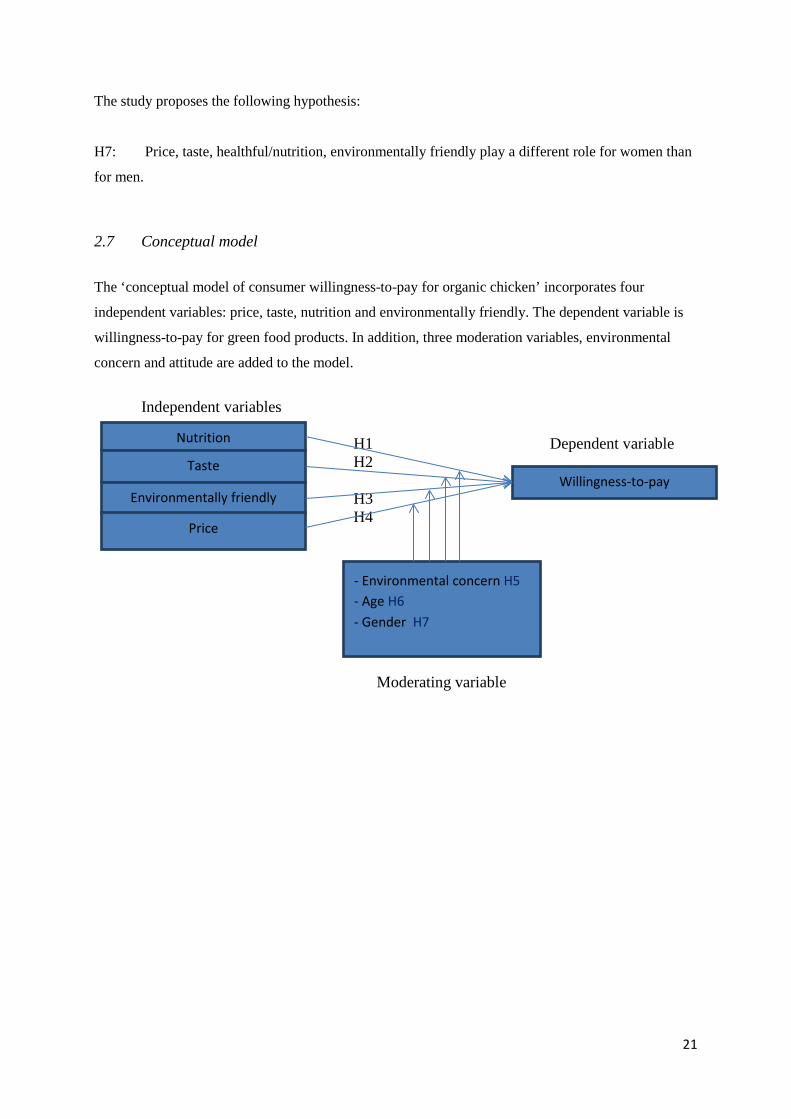
When looking at the environmental concern of the respondents, three questions of the survey are of
interest: question 14, 15 and 16. The questions are asked on behalf of a 7 point Likert-scale, where 1
means completely disagree and 7 means completely agree. The interesting statistics here is the means
31
of the scale items. The higher the means of the scale items are the higher the environmental concern is
of the respondent. In table 5 the means of the scale items of the 600 respondents can be found.
Table 5: Environmental concern
Willingness to pay Mean Standard deviation Min Max
Question: ‘I buy organic food because it is environmentally friendly:’
4,18 1.703 1 7
Question: ‘I buy organic food because it reduces pollution:’
3,90 1.642 1 7
Question: ‘I buy organic food because it is important to save natural resources:’
4,21 1.692 1 7
An interesting descriptive is that even though the literature stated that there is no proof that organic
chicken taste better or has better nutrition than conventional chicken a lot of respondents do think so.
A little more than 60% of the respondents agreed till a certain level with the statement that organic
chicken has better nutrition than conventional chicken. And also around 60% of the respondents stated
that they agreed with the statement that organic chicken tastes better than conventional chicken.
In table 6 the mean and standard deviation of each attribute is found. The mean of the attribute price is
3,82 on the 7-point Likert scale. This is close to the value 4 ’somewhat agree’. The mean of the
attributes nutrition and taste are between the values ‘somewhat agree’ and ‘mostly agree’. The mean of
the attribute environmentally friendly is above ‘mostly agree’. A higher mean indicates in general that
respondents indicated that the attribute is more important to them. In the next section there will be
looked at whether the attributes importance has a significant effect on the willingness to pay for
organic chicken.
Table 6: Attributes
Willingness to pay Mean Standard deviation Min Max
Nutrition 4.59 1.306 1 7
Taste 4.67 1.535 1 7
Price 3.82 1.632 1 7
Environmentally friendly 5.25 1.277 1 7
32

4.3 Testing the hypotheses Before a multiple regression model can be performed a few adjustments needed to be made in SPSS
for each of the dependent variables; WTP3,WTP2 and WTP1. The dependent variables had a
Skewness of above 1 and therefore needed to be corrected. A log transformation (log10) is performed
in SPSS to normalize the distribution which is positively skewed. The distribution is positively skewed
when a long right tail is noticeable in the distribution. The results of the log transformation are shown
by a normality test in the statistical program EViews and demonstrated in appendix 4. Also, some
outliers were found which were deleted from the data using the Mahalanobis distance in SPSS.
One reminder is important to state before the models will be developed. The equation, that will be the
result of the multiple regression model, are developed for the willingness to pay for organic chicken
compared to conventional chicken. It is important to keep in mind that this condition results in a
totally different equation than when the comparison is made between organic chicken and a
hamburger. It is possible that taste does not play a role in the decision between chicken and organic
chicken but does play a role in the decision between organic chicken and a hamburger. In this case
taste will not have a significant contribution in the equation for the decision between organic chicken
and conventional chicken but will have a significant contribution in the equation for the decision
between organic chicken and a hamburger.
4.3.1 Model 1
In the first model the attributes nutrition, taste, price and environmentally friendly are added as
independent variables. The model is used for three different dependent variables, namely the
willingness to pay for organic chicken with one star (WTP1), the willingness to pay for organic
chicken with two stars (WTP2) and the willingness to pay for organic chicken with three stars
(WTP3). When running a multiple linear regression model, the ‘ANOVA’ table is the first table that
needs to be looked at. In this table the meaningfulness of the model can be checked by looking at the
p-value. When the p-value is greater than 0.05 the null hypothesis; H0: ‘Adjusted R Square’ is 0, is
valid and therefore the model is not meaningful. When this occurs an interpretation of the other tables
is unnecessary. When the p-value is lower than 0.05 the null hypothesis is rejected. Which means that
there is a good fit between the data and the model, and the interpretation of the tables is allowed.
The first table that is provided by SPSS, when a regression is performed, is the ‘model summary’
table. The ‘R Square’, that can be found in the model summary table, indicates the percentages of the
variation in the dependent variable may be explained by the variation in the independent variables that
are included in the model. Next to the ‘R Square’ you find the ‘Adjusted R Square’ which is better to
look at because this statistic corrects for the number of independent variables in the regression model.
33

The last table that needs to be looked at is the ‘Coefficients’ table. This table provides the individual
effect of each of the independent variables. When the p-value is lower than 0.05, and therefore
significant, the independent variable can be added to the equation of the model. The results of model 1
are provided in the following paragraphs for each dependent variable.
- Willingness to pay for organic chicken with one star (WTP1)
In appendix 5 the ‘ANOVA’ table can be seen and it shows a p-value of 0.000 which means that the
interpretation of the tables is allowed. The ‘Adjusted R Square’ is 0.111, which means that 11.1% of
the variation in the dependent variable may be explained by the variation in the independent variables
that are significant.
The individual effect of each attribute on the dependent variable can be obtained from table 7 below.
Table 7: Coefficients WTP1
Coefficientsa
Model
Unstandardized Coefficients
Standardized
Coefficients
t Sig. B Std. Error Beta
1 (Constant) .121 .055 2.188 .029
Nutrition .006 .008 .041 .806 .420
Taste .002 .006 .017 .332 .740
Price -.029 .005 -.257 -5.404 .000
EnvirFriendly .015 .008 .094 1.811 .071
a. Dependent Variable: WTP1_Lg10
The only variable that contributes substantially to the model is the variable price, which has a
significance level of 0.000. Also the constant contributes to the model with a significance level of
0.029. By looking at the B coefficients in table 5, the equation can be written in the following way:
WTP1= 0.121 -0.029*price +
Where:
Price is the value of how important the attribute price is to the customer based on a 7-point Likert
scale.
34

What this equation indicates is that when the importance of price goes up by one point on the 7-point
Likert scale the willingness to pay for organic chicken with one star goes down by 0.029 cetris
paribus. The negative direction of the coefficient price is confirming the expectation that was based on
the theoretical background. This means that hypothesis 4 is accepted for the dependent variable
WTP1.
The attributes nutrition, taste and environmentally friendly do not have significant coefficients and
therefore are hypothesis 1, 2 and 3 rejected for the dependent variable WTP1.
- Willingness to pay for organic chicken with two stars (WTP2)
Just like WTP1 the interpretation of the tables of WTP2 are allowed, which can be seen in appendix 5.
The ‘Adjusted R Square’ is 0.219, which means that 21,9% of the variation in the WTP2 may be
explained by the variation in the independent variables that are significant.
The individual effect of each attribute on the dependent variable can be obtained from table 8 below.
Table 8: Coefficients WTP2
Coefficientsa
Model
Unstandardized Coefficients
Standardized
Coefficients
t Sig. B Std. Error Beta
1 (Constant) .185 .055 3.332 .001
Nutrition .011 .008 .067 1.388 .166
Taste .002 .006 .016 .338 .735
Price -.039 .005 -.324 -7.277 .000
EnvirFriendly .028 .008 .167 3.427 .001
a. Dependent Variable: WTP2_Lg10
Compared to WTP1 not only the constant and the attribute price has a significance level of below 0.05
but also environmentally friendly has a significance level of below 0.05. So two variables contribute
substantially to the model, namely the attributes price and environmentally friendly. By looking at the
B coefficients in table 8, the equation can be written in the following way:
WTP2= 0.185 + 0.028*environmentallyfriendly – 0.039*price +
Where, additionally to the variable price that is already explained:
35

Environmentally friendly is the value of how important the attribute environmentally friendly is to the
consumer based on a 7-point Likert scale.
The equation shows that when the importance of the attribute environmentally friendly goes up by one
point on the 7-point Likert scale cetris paribus consumers are willing to pay for organic chicken with
two stars 0.028 more. When the importance of price goes up by one on the 7-point Likert scale the
willingness to pay for organic chicken with two star goes down by 0.039 cetris paribus. In order to
check which attribute, price or environmentally friendly, is more important here the Beta can be
compared because the independent variables are measured with the same 7-point Likert scale.
Environmentally friendly has a Beta of 0.028 and price has a Beta of -0.039, the Beta of price is here a
higher number which means that the attribute price is more important to customers than the attribute
environmentally friendly.
Because the coefficients of nutrition and taste are not significant, hypothesis 1 and 2 can be rejected
for WTP2. Hypothesis 3 and 4 are accepted because as mentioned before there is a positive
relationship between environmentally friendly and WTP2 and there is a negative relationship between
price and WTP2.
- Willingness to pay for organic chicken with three stars (WTP3)
Similar to WTP1 and WTP2 the interpretation of the tables of WTP3 are allowed, which can be seen
in appendix 5. Compared to WTP1 and WTP2 the ‘Adjusted R Square’ increased again and has a
value of 0.335. The ‘Adjusted R Square’ increased each time because the significance level improved
each time. The individual effect of each attribute on the dependent variable can be obtained from table
9 below.
Table 9: Coefficients WTP3
Coefficientsa
Model
Unstandardized Coefficients
Standardized
Coefficients
t Sig. B Std. Error Beta
1 (Constant) .183 .054 3.394 .001
Nutrition .006 .007 .033 .736 .462
Taste .002 .006 .013 .289 .773
Price -.043 .005 -.335 -8.180 .000
EnvirFriendly .055 .008 .315 6.996 .000
a. Dependent Variable: WTP3_Lg10
36

As stated before the significance level has improved when the comparison is made between the
dependent variables (EnvirFriendly from 0.001 now 0.000). The attributes nutrition and taste still have
a significance level of above 0.05 and therefore hypotheses 1 and 2 will be rejected for WTP3. Price
and environmentally friendly do again contribute substantially to the model and will be added to the
equation. By looking at the B coefficients in table 9, the equation will be written in the following way:
WTP3 = 0.183 + 0.055*environmentallyfriendly - 0.043*price +
The variables in the equation are explained in the paragraphs above.
The equation above shows that when the importance of the attribute environmentally friendly goes up
by one point on the 7-point Likert scale cetris paribus consumers are willing to pay for organic
chicken with two stars 0.055 more. When the importance of price goes up by one on the 7-point
Likert scale the willingness to pay for organic chicken with two stars goes down by 0.043 cetris
paribus. Notice that for WTP3 the attribute environmentally friendly is more important than the
attribute price. For WTP2 this was the other way around. An possible explanation for this change is
that organic chicken with 3 stars is ‘more’ organic than organic chicken with 1 or 2 stars and therefore
the attribute becomes more important to the costumer. Similar to WTP2 hypothesis 3 and 4 will be
accepted for WTP3.
4.3.2 Model 2
The second model is based on the first model but also looks at the possible moderating effect of
environmental concern, age and gender as mentioned in the methodology. Model 1 is extended with
dummy variables of respondents that have high environmental concern, older respondents and
respondents that are males. The interpretation of the results in the ‘model summary’ table and the
‘ANOVA’ table of model 2 are the same as for model 1. Only the interpretation of the ‘Coefficient’
table is a little different as mentioned in the methodology. The second model is also used for the three
dependent variables: WTP1, WTP2 and WTP3.
- Willingness to pay for organic chicken with one star (WTP1) with moderating effects
The results of the multiple regression model with moderating effects shows in the ‘ANOVA’ table a p-
value of 0.000 (see appendix 6), which indicated that the interpretation of the tables is allowed. The
‘Adjusted R Square’ is 0.099. Compared to the ‘Adjusted R Square’ of model 1 with WTP1 as
dependent variable the value is 0.002 less. This means that the second model explained less of the
variation in the dependent variable (WTP1) by the variation in the independent variables. Therefore
37

the equation of WTP1 in the first model will be used. The ‘Coefficient’ table in appendix 6 shows that
all the dummy variables are insignificant indicating that younger and older respondents, males and
females and high and low environmental concern respondents valuate the attributes of organic chicken
with one star the same. The hypotheses 1, 2, 4, 5, 6 and 7 for the dependent variable WTP1 can be
rejected.
- Willingness to pay for organic chicken with two stars (WTP2) with moderating effects
Just like WTP1, the interpretation of the output tables of WTP2 are allowed, as demonstrated in
appendix 6. On behalf of the ‘Coefficient’ table, in appendix 6, the following equation is written:
WTP2= 0.180 – 0.031*price + 0.031*Nutrition – 0.037*nutritionHighenvironmentalconcern +
Where, additionally to the variables that are already explained:
Nutrion is the value of how important the attribute nutrition is to the consumer based on a 7-point
Likert scale.
NutritionHighenvironmentalconcern is the value of how important the attribute nutrition is to
consumers that express high environmental concern.
What is interesting here is that the variables nutrition and nutrition_Highenvironmentalconcern were
not significant in the first model but are significant in model 2. Another interesting observation is that
the variable environmentally friendly was significant in the first model but is not significant in the
second model. In order to choose which model is better to use the ‘Adjusted R Square’ needs to be
looked at. The ‘Adjusted R Square’ of model 2 decreased by 0.007 compared to model 1. What this
means is that the percentage of the variation in the dependent variable that is explained by the
variation in the independent variables of model 1 is higher than that of model 2. Therefore model 1 is
used in the analysis of WTP2. The interpretation of the equation of model 2 will be ignored. The
hypotheses 1, 2, 5, 6 and 7 for the dependent variable WTP2 can be rejected.
- Willingness to pay for organic chicken with three stars (WTP3) with moderating effects
Just like the other dependent variables: WTP1 and WTP2, the interpretation of the output tables of
WTP3 are allowed, as demonstrated in appendix 6. On behalf of the ‘Coefficient’ table, in appendix 6,
the following equation is written:
38

WTP3= 0.196 + 0.043*environmentallyfriendly – 0.044*price -0.039*nutritionECHIGH +
0.036*environmentallyfriendlyECHIGH +
Where, additionally to the variables that are already explained:
NutritionECHIGH is the value of how important the attribute nutrition is to consumers that have high
environmental concern.
EnvironmentallyfriendlyECHIGH is the value of how important the attribute environmentally friendly
is to consumers that have high environmental concern.
Interesting here is that, compared to model 1, two dummy variables are added to the equation. The
‘Adjusted R square’ for model 2 has increased by 0.012 when the comparison is made between model
1 and 2. Therefore the equation of model 2 will be used in this paper.
The equation demonstrates that when the importance of the attribute environmentally friendly goes up
by one point on the 7-point Likert scale cetris paribus consumers are willing to pay for organic
chicken with three stars 0.043 more. When the importance of the price goes up by one point on the 7-
point Likert scale cetris paribus consumers are willing to pay for organic chicken with three stars
0.044 more. If the importance of nutrition goes up by one point on the 7-point Likert scale cetris
paribus for consumers with high environmental concern, they are willing to pay for organic chicken
with three stars 0.039 less. This negative coefficient is a surprising result, because the literature review
said that people believe organic food has better nutrition than conventional food. A possible
explanation for the negative coefficient cannot be given in this paper. When the importance of
environmentally friendly goes up by one point on the 7-point Likert scale cetris paribus for consumers
with high environmental concern, they are willing to pay for organic chicken with three stars 0.079
more. So consumers with high environmental concern value the attribute environmentally friendly
more than consumers with less environmental concern. The importance of the attributes price and
environmentally friendly are about the same for consumers with less environmental concern, looking
at the Beta of both attributes. From the equation given above, hypotheses 1, 2, 6 and 7 can be rejected
and hypotheses 3, 4 and 5 can be accepted.
4.3.3 Model 3
Even though the theoretical framework of this paper was only about the first two models, the survey
that is used to collect the data also asked about the educational background and the income of the
respondents. It could be interesting to see if educational background and/ or income are moderating
effects on the three dependent variables in this paper. The assumption is made that consumers with
39
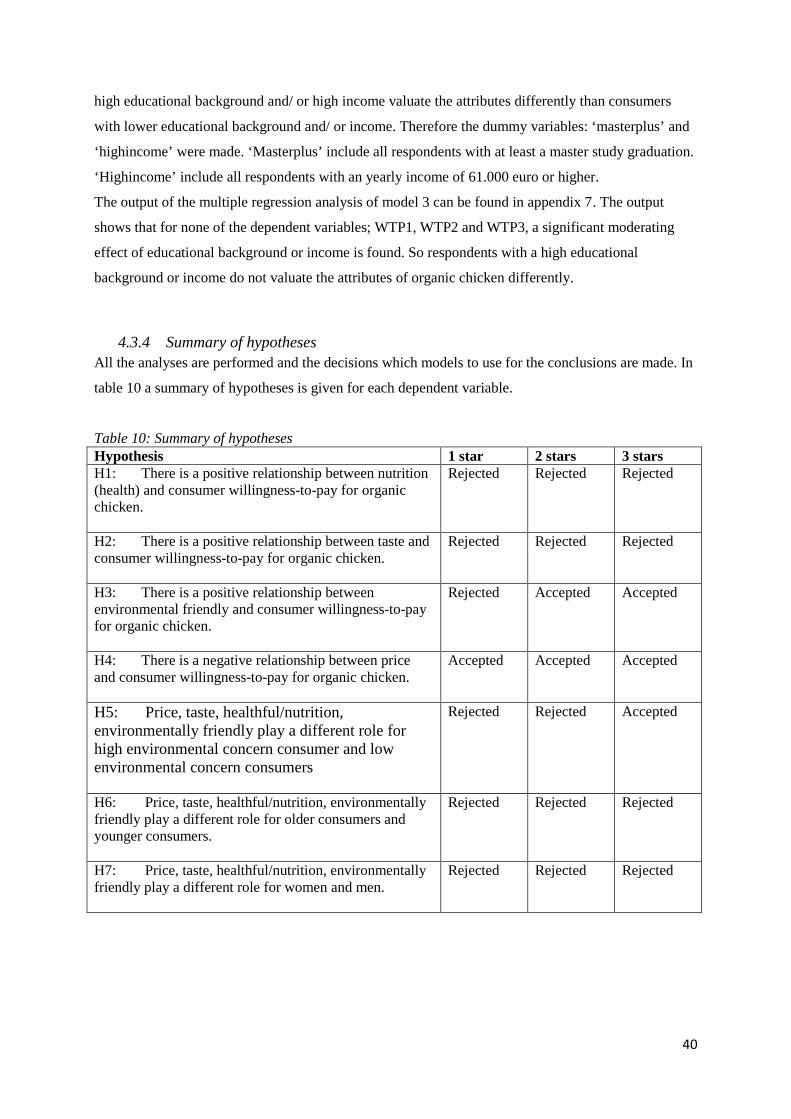
high educational background and/ or high income valuate the attributes differently than consumers
with lower educational background and/ or income. Therefore the dummy variables: ‘masterplus’ and
‘highincome’ were made. ‘Masterplus’ include all respondents with at least a master study graduation.
‘Highincome’ include all respondents with an yearly income of 61.000 euro or higher.
The output of the multiple regression analysis of model 3 can be found in appendix 7. The output
shows that for none of the dependent variables; WTP1, WTP2 and WTP3, a significant moderating
effect of educational background or income is found. So respondents with a high educational
background or income do not valuate the attributes of organic chicken differently.
4.3.4 Summary of hypotheses All the analyses are performed and the decisions which models to use for the conclusions are made. In
table 10 a summary of hypotheses is given for each dependent variable.
Table 10: Summary of hypotheses Hypothesis 1 star 2 stars 3 stars H1: There is a positive relationship between nutrition (health) and consumer willingness-to-pay for organic chicken.
Rejected Rejected Rejected
H2: There is a positive relationship between taste and consumer willingness-to-pay for organic chicken.
Rejected Rejected Rejected
H3: There is a positive relationship between environmental friendly and consumer willingness-to-pay for organic chicken.
Rejected Accepted Accepted
H4: There is a negative relationship between price and consumer willingness-to-pay for organic chicken.
Accepted Accepted Accepted
H5: Price, taste, healthful/nutrition, environmentally friendly play a different role for high environmental concern consumer and low environmental concern consumers
Rejected Rejected Accepted
H6: Price, taste, healthful/nutrition, environmentally friendly play a different role for older consumers and younger consumers.
Rejected Rejected Rejected
H7: Price, taste, healthful/nutrition, environmentally friendly play a different role for women and men.
Rejected Rejected Rejected
40

4.4 Characteristics of high environmental concern consumers
As can been seen in table 10, the only moderating effect is environmental concern for WTP3. For
consumers with higher environmental concern the attribute environmentally friendly is more
important. It can be useful for companies in this branch to know what kind of people are more likely to
have high environmental concern. Table 11 shows some characteristics and the percentage of them
that has high environmental concern. In general around 30% of the respondents is defined as high
environmental concern. The most interesting descriptive statistics are that females and especially older
people are more likely to have high environmental concern.
Table 11: Characteristics consumers with high environmental concern
Characteristics % with high environmental concern
Male 26.67
Female 33.04
Income under 61.000 28.08
Income above 61.000 31.43
Degree lower than master 28.77
Master or higher 29.44
Younger than 30 years 27.33
Between 29 and 50 years old 26.91
50 years or older 44.26
41

5. Conclusion
This chapter will start with a discussion of the results. Then scientific and managerial implications of
the conclusions will be given. The limitations of this research and areas for future research will be
given at the end of the chapter.
5.1 Discussion of the results The goal of this paper, was to investigate how consumers value the key attributes of organic chicken
and what the influence is of possible moderating factors on those attributes valuations and the
willingness to pay for organic chicken.
The word ‘organic’ is defined differently in different jurisdictions, the general term organic farming
responds to site-specific farming and crop conditions by integrating cultural, biological and
mechanical practices that foster recycling of resources, promote ecological balance and conserve
biodiversity. Synthetic pesticides and chemical fertilizers are generally not allowed, although certain
organically approved pesticides may be used under limited conditions. In general, organic foods are
also processed without using irradiation, industrial solvents or chemical food additives (Lin & Huang,
2011). In other words, in this paper the word ‘organic’ chicken means chicken that is better for the
environment and is more ethical.
5.1.1 Attributes Nutrition, taste, price and environmentally friendly were defined as key attributes in the theoretical
framework. Below a small conclusion for each attribute will be given.
5.1.1.1 taste It turned out that the attribute taste was always statistically insignificant in this research. As mentioned
before in chapter 4 this research focused on the purchase decision between conventional chicken and
organic chicken. This data shows that in general consumers don’t think about the attribute taste when
they make the purchase decision between conventional and organic chicken. Most of the consumers
probably think that the taste of conventional chicken and organic chicken is the same.
5.1.1.2 Price The attribute price turned out to be a key attribute for organic chicken with one, two and three stars.
As expected, price does play an important role in the purchase decision of the consumer. There is a
negative relationship between price and the dependent variable willingness to pay. When price
becomes more important to a consumer, he or she is willing to pay less for organic chicken. It also
seems like there is a trend going on between the amount of stars the organic chicken has and the
importance of the attribute price. When consumers look for organic chicken with more stars the
attribute price becomes less important to them.
42

5.1.1.3 Environmentally friendly The attribute environmentally friendly is only a key attribute for organic chicken with two or three
stars. When environmentally friendly becomes more important to a consumer he or she is willing to
pay more for organic chicken with two and three stars. A possible explanation that the attribute
environmentally friendly is insignificant for organic chicken with one star is that consumers think that
organic chicken with one star is not that much environmentally friendlier than conventional chicken.
So when consumers care more about the welfare they don’t want to pay more for organic chicken with
one star but they are willing to pay more for organic chicken with two or three stars. As mentioned
above price becomes less important when consumers look for organic chicken with more stars. The
attribute environmentally friendly is more important for consumers that look for organic chicken with
three stars instead of two stars.
5.1.1.4 Nutrition The last key attribute that was defined by the theoretical framework was nutrition. The results show
that nutrition is only a key attribute for organic chicken with three stars for consumers with high
environmental concern. Surprisingly the results show that there is a negative relationship between the
attribute nutrition and willingness to pay for organic chicken with three stars. This research can
unfortunately not give a possible explanation why consumers with high environmental concern are
willing to pay less for organic chicken with three stars when nutrition becomes more important to
them.
Now the key attributes are defined for organic chicken with one, two and three stars, it is important to
find out which key attribute is most important to the consumer. As mentioned before WTP1 knows
only one key attribute (price), which is therefore also the most important attribute. WTP2 has two key
attributes; environmentally friendly and price. Price is the most important attribute to consumers here.
For consumers with high environmental concern the attribute environmentally friendly is the most
important to them when they buy organic chicken with three stars, the attribute price is second and the
attribute nutrition is the third. For consumers with no high environmental concern the attributes
environmentally friendly and price have about the same importance.
5.1.2 High environmental concern The theoretical framework defined environmental concern as a possible psychological factor that can
influence the consumers attribute valuations of organic chicken. Indeed, high environmental concern
turned out to influence consumers attribute valuations of organic chicken with three stars. Consumers
with high environmental concern are willing to pay more for the attribute environmentally friendly
than consumers with lower environmental concern. As mentioned before consumers with high
environmental concern are strangely enough willing to pay less for the attribute nutrition of organic
chicken with three stars. So high environmental concern consumers are only willing to pay more
43

money for organic chicken with two or three stars when the attribute environmentally friendly
increases.
5.1.3 Demographic features In the theoretical framework the demographic features age and gender were described as possible
moderating effects. The results showed that the age of gender of the respondent has no significant
effect on the evaluation of the key attributes of organic chicken. Also the extra demographic features
that were added in model 3, income and educational background, had no significant effect. However,
that does not necessarily mean that the valuations of the attributes of organic chicken can’t be
moderated by different psychological factors or demographic features, or in a different comparison
than organic chicken and conventional chicken.
In the end it turned out that the most important attribute where consumers look at when they make the
decision between buying a conventional chicken or an organic chicken is the price, and the attribute
environmentally friendly becomes more important when consumers look for organic chicken with
more stars. About 63,1% of the respondents doesn’t want to pay more money for organic chicken with
1 star than for conventional chicken. Around 30,5% of the respondents indicated that they are willing
to pay 50% more money for organic chicken with one star. Only 32.7% of the respondents indicated
that they don’t want to pay more for organic chicken with 2 stars than for conventional chicken. About
50,3% is willing to pay 50% more and 13.3% is willing to pay 100% more. For organic chicken with 3
stars 17.1% of the respondents is not willing to pay more money than for conventional chicken. 42.9%
is willing to pay 50% more and 25.3% is willing to pay 100% more. The figure is demonstrated in
table 12 below. Despite that many respondents indicated that they are willing to pay more for organic
chicken, a lot of them won’t buy organic chicken as long as the cheaper alternative of conventional
chicken is available. The attribute price is more important to them than the attribute environmentally
friendly. When organic chicken can be sold for a lower price or conventional chicken becomes more
expensive it is very likely that consumers start buying organic chicken more often.
Table 12: willingness to pay for each star
Stars % doesn’t want to pay more % willing to pay 50% more % willing to pay 100% more
1 63,1 30,5 4,0
2 32,7 50,3 13,3
3 17,1 42,9 25,3
44

5.2 Scientific implications
Building on the growing body of existing literature focusing on psychological factors that
influence purchase decisions of organic food (Batte, Hooker, Haab, & Beaverson, 2006)
(Cheah & Phau, 2011), this research has identified that the psychological factor
environmental concern can have impact on the attributes environmentally friendly and
nutrition. An important finding for further research is that particular psychological factors do
influence purchase decisions of organic food in one situation and do not in another situation.
Till now the literature stated that environmental concern always influences the purchase
decisions of organic food but in this paper it only appeared for organic chicken with three
stars. Researchers should be aware that psychological factors can have different influences on
purchase decisions in different situations.
This study also adds knowledge to the existing literature by demonstrating that product
attributes can play different roles in different purchase decisions that consumers have to
make. Findings in this study help deepen the understanding of the decision making process of
buying organic food and especially for organic chicken. In addition, this research excluded
some demographic characteristics that do not influence the decisions making process.
5.3 Managerial implications
The findings of this study provide usable information for managers from both companies as non-profit
organizations. Producers and supermarkets that sell organic chicken have a better insight in the trade-
offs consumers make. They can see, probably as expected, that price is the most important factor. The
paper gives a better understanding of consumers’ willingness to pay for each key attribute of organic
chicken for each star the chicken has. It is also useful to know for producers and supermarkets that
taste and nutrition currently do not play a role in the decision making process of most consumers.
Producers and supermarkets could see this conclusion as a situation they have to deal with or as an
opportunity. Maybe with some marketing effort they can differentiate themselves by showing the
consumers there are differences in taste. The segmentation producers and supermarkets can use the
information that no demographic characteristics were found that influence the decision making process
of consumers, which may indicate that managers should keep a broad target group.
Non-profit organization, like ‘Wakker dier’, could also benefit from this research. As mentioned
before the key attributes of organic chicken in general are environmentally friendly and price. Price is
the most important one of the two. In order to make organic chicken more popular non-profit
45

organizations and companies involved in the industry should make the attribute price less important or
the attribute environmentally friendly more important. Currently ‘Wakker dier’ is trying to do this by
broadcasting a campaign about the broiler chicken. The goal of the campaign is to make people aware
of the horrible life a broiler chicken has lived before it ends up on your dining table and aims to make
the attribute environmentally friendly more important than the attribute price. ‘Wakker dier’ also puts
a lot of effort in eliminating broiler chicken in super markets. This will lead to higher prices of
conventional chicken, which will lead to a smaller price difference between organic chicken and
conventional chicken. In this way they hope the attribute price of organic chicken becomes less
important compared to conventional chicken. This research confirms that the strategy of ‘Wakker dier’
is the right strategy to make the organic chicken more popular.
5.4 Limitations and directions for future research
Just like in any other research, there are some limitations in this study that need to be taken into
consideration. First of all, the data is collected using a survey that is distributed online and hardcopy.
Respondents were asked to answer the questions as honest as possible, but this may be doubted
because the respondents were not in a decision making setting and humans don’t always act the way
they say they would act. For instance the question about the willingness to pay for organic chicken, a
respondent can say that he is willing to pay more money but in real life he or she is not actually
willing to pay more.
Another limitation of this research is that the data showed heteroscedasity. Before a multiple
regression model is performed nine assumptions needs to be tested. The Breasch pagan test was
performed in Eviews and indicated the data had heteroskedasticity instead of homoscedasticity. More
data could solve this problem but was not available for this research.
This research focused on organic chicken. For further research it could be interesting to find out if the
attribute evaluation is differently across product categories. Maybe for products that are already
expensive, like steak the evaluation is differently or for products that are cheaper compared to chicken,
like vegetables. In this study the only psychological factor that has been looked at is environmental
concern and turned out to have a moderating effect. In order to better understand psychological effects
on the attribute valuations further research is needed. A few respondents indicated that they had too
little knowledge of organic food to answer the questionnaire. Therefore it could be interesting to look
at knowledge as a moderating effect.
46

Bibliography Amyx, D., De Jong, P., Lin, X., Chakraborty, G., & Weiner, J. (1994). Influencers of purchase intentions
for ecologically safe products. AMA Winter Educators' Conference Proceedings, 82 (3), 340-352.
Antil, J. (1978). The construction and validation of an instrument to measure socially responsible consumer behaviour: a study of the socially responsible consumer'. Pennsylvania state University, 52 (2), 20-31.
Arcury, T., & Christianson, E. (1990). Environmental worldview in response to environmental problems kentucky 1984 and 1988 compared. Environment and behavior, 43 (3) 32-39 .
Bandura, A. (1977). Self-efficacy: toward a unifying theory of behavior change. Psychological review, 72 (2), 223-235.
Banerjee, S., Iyer, E., & Kashyap, R. (2003). Corporate environmentalism: antecedents and influence of industry type. Journal of marketing, 12 (3), 431-447.
Batte, M., Hooker, N., Haab, T., & Beaverson, J. (2006). Putting their money where their mouths are: Consumer willingness to pay for multi-ingredient, processed organic food products. Elsevier, 25 (2012), 470-482.
Bei, L., & Simpson, E. (1995). The determinants of consumer' purchase decisions for rycycled products. Advances in Consumers Research 27, 261-270.
Berger, I., & Corbin, R. (1992). Perceived consumer effectiveness and faith in others as moderators of environmentally responsible behaviors. Journal of public policy and marketing, 10 (4), 104-110.
Bezawada, R., & Pauwels, K. (2013). What is special about marketing organic products? How organic assortment, price and promotion drive retailer promotions? Journal of marketing, 77 (1), 31-40.
Birgit Roitner-Schobesberger, I. D. (2007). Consumer perceptions of organic foods in Bangkok, Thailand. Elsevier, 33 (2), 98-110.
Boccaletti, S., & Moro, D. (2000). CONSUMER WILLINGNESS-TO-PAY FOR GM FOOD PRODUCTS IN ITALY. AgBioForum 34 (3), 374-384.
Brown, D. (2008). It is good to be green: environmentally friendly credentials are influencing business outsourcing decisions. Strategic outsourcing: an international journal, 1 (1), 87-95.
Chain store age. (2009). "Forty Under 40: Small Chains Flourish". Chain Store Age.
Cheah, I., & Phau, I. (2011). Attitudes towards environmentally friendly products. Emerald 29, (5) 212-227.
Choi, M., & Kim, Y. (2005). Antecendents of green purchase behavior: an examination of collectivism, environmental concern, and PCE. Advances in Consumer research, 25 (1), 1-15.
47

Diamantopoulos, A., Schlegelmilch, B., Sinkovics, R., & Bohlen, M. (2003). Can socio-demographics still play a role in profilling green consumers? A review of the evidence and an empirical investigation. Journal of business research, 56 (3), 465-480.
D'Souza, C., Taghian , M., & Lamb, P. (2006). An empirical study on the influence of enivromental labels on consumers. Corporate communications: an international journa 11 (2) 162-170.
Ellen, P., Wiener, J., & Cobb-Walgren, C. (1991). The role of precieved consumer effectiveness in motivation environmentally conscious behaviors. Journal of public policy and marketing 23 (1), 80-88.
Foster, C. (2005). Exploring the gap between attitude and behaviour understanding why consumers buy or do not buy organic food. British food journal 107 (8) 606-625.
Fransson, N., & Garling, T. (2000). Environmental concern: conceptual definitions, measurement, methods and research findings. Goteborg: Journal of environmental psychology23 (2), 109-123 .
Gil, J., Gracia, A., & Sánchez, M. (2000). Market segmentation and willingness to pay for organic products in Spain. Elsevier, 3 (2), 207-222.
grocer, p. (2009). outside the bubble, 32-45.
IFOAM, F. a. (2012). The world of organic agriculture, 1-340.
Janssens, W., Wijnen, K., De Pelsmacker, P., & Van Kenhove, P. (2008). Marketing research with SPSS. Edinburgh gate: Prentice Hall.
Kärnä, J., Hansen, E., & Juslin, H. (2003). Social responsibility in environmental marketing planning. European Journal of Marketing, 37 (5/6), 245-262.
Kilbourne, W., & Pickett, G. (2008). How materialism affects environmental marketing environmental beliefs, concern and environmentally responsible behavior. Journal of business research, 32 (4), 402-422.
Kinnear, T., Taylor, J., & Ahmed, S. (1974). Ecologically concerned consumers: who are they? Journal of marketing, 41 (2), 267-279.
Laroche, M., Bergeron, J., & Forleo, G. (2001). Targeting consumers who are willing to pay more for environmentally friendly products. Journal of consumer marketing, 46 (3), 187-198.
Lee, K. (2008). Opportunities for green marketing: young consumers. Emerald 32 (2), 502-516.
Lin, P.-C., & Huang, Y.-H. (2011). The influence factors on choice behavior regarding green products based on the theory of consumption values. Elsevier, 20 (3), 34-47.
lin, P.-C., & Huang, Y.-H. (2012). The influence factors on choice behavior regarding green products based on the theory of consumption values. Elsevier, 87 (1), 167-187.
Long, M., & Schiffman, L. (2000). Consumption values and relationships: segmenting the market for frequency programs. Journal of Consumer Marketing, 65 (3), 214-232.
48

Manaktola, K., & Jauhari, V. (2007). Exploring consumer attitude and behaviour towards green practices in the lodging industry in india. International journal of comtemporary hospitality management, 22 (4), 344-357.
Max Havelaar. (2014). Info over Max Havelaar. Retrieved from Website van Max Havelaar: http://www.maxhavelaar.nl/64/english
McCarty, & Shrum, L. (1994). The recycling of solid wastes:personal values, value orientations and attitudes about recycling as antecedents of rycycling behavior. Journal of business research, 12 (3), 67-75.
Mojet, J., & Heidema, J. (2001). Taste Perception with Age: Generic or Specific Losses in Threshold Sensitivity to the Five Basic Tastes? Vlaardingen: Chemical senses 32 (1), 42-57.
Mostafa, M. M. (2007). A Hierarchical Analysis of the Green Consciousness of the Egyptian Consumer. Psychology & Marketing 89 (5), 502-522.
OECD. (2009). Sustainable manufactering and eco-innovation: towards a green economy. Policy Brief June, 12 (2), 56-69.
Osterhus, T. (1997). Pro-social consumer influences strategies: when and how do they work? Journal of marketing, 23 (3), 242-251.
Renee, H., Pierre, M., & Andrea, P. (2007). Who are organic food consumers? a compilation and review of wy people purchase organic food. Journal of consumer behaviour, 52 (6), 189-200.
Rex, E., & Baumann, H. (1993). Beyond ecolabels: what green marketing can learn from conventional marketing. Journal of Cleaner Production, 19 (4), 488-493.
Roberts, J., & Bacon, D. (1997). Exploring the subtle relationships between environmental concern and ecologically conscious consumer behaviour. Journal of business research, 76 (1), 405-414.
Roheim, C., & D'Silva, R. (2009). Illustration of the U.S. Organic Agricultural Produce Price Premiums. University of Rhode Island, 12 (1), 56-67.
Ross, J., Patterson, L., & Stutts, M. (1992). Consumer perceptions of organizations that use cause-related mareting. Journal of the Academy of Marketing Science, 76 (1), 378-389.
Sheth, J., Newman, B., & Gross, B. (1991). Why we buy what we buy: a theory of consumption values. Journal of business Research, 42 (2), 159-170.
Straughan, R., & Roberts, J. (1999). Environmental segmentation alternatives: a look at green consumer behaviour in the new millenium. Journal of consumer marketing, 20 (1), 558-575.
Strong, C. (1996). Features contributing to the growth of ethical consumerism a preliminary investigation. Marketing intelligence & planning, 65 (5), 589-602.
Sweeney, J, & Soutar, G. (2001). Consumer preceived value: the development of a multiple item scale. Journal of Retailing, 45 (4), 402-409.
49

Transparency Market Research. (2013). Organic Food and Beverage Market - Global Industry Analysis, Size, Share, Growth, Trends and Forecast, 2013 - 2019. Albany: Transparency Market Research, 1 (1), 1- 360.
Uusitalo, O., & Oksanen, R. (2004). Ethical consumerism: a view from Finland. International journal of consumer studies, 32 (2), 221-230.
Van liere, K., & Dunlab, R. (1980). The social bases of environmental concern: a review of hypotheses, explanation and emperical evidence. Oxford: Public opinion quarterly, 3 (2), 432-442.
Vlosky, R., Ozanne, L., & Fontenot, R. (1999). A conceptual model of US consumer willingness-to-pay for environmentally certified wood products. Journal of consumer marketing, 78 (1), 553-565.
Vocht, A. d. (2010). Basishandboek spss 18. Utrecht: BIJLEVELD PRESS.
Williamson, C. (2007). Is organic food better for our health? Food and nutrition bulletin, 23 (1), 54-67.
Young, W., Hwang, K., McDonald, S., & Oates, C. (2009). Sustainable consumption: green consumer behaviour when purchasing products. Sustainable Development, 40 (3), 120-140.
50

APPENDICES
Appendix 1: Survey
Thank you in advance for taking your time to complete this survey. I am a student at the Erasmus University of Rotterdam and I am conducting a research on “Consumer behaviour in relation to organic food” for my Master’s Thesis. It should only take about 10 minutes of your time.
Before you start to answer the survey, it is important that you understand the term “organic food”. Organic foods are grown without the use of synthetic pesticides, growth hormones, antibiotics, modern genetic engineering techniques (including genetically modified crops), chemical fertilizers, or sewage sludge.
51

Please cross the box next to the answer of your choice or write your answer in the space provided.
1. What is your age? ________
2. What is your gender?
Male Female 3. What is your yearly income?
0 – 15 000 16 000-
30 000 31 000 – 45 000
46 000 – 60 000 61 000 –
higher
4. What is the highest degree or level of school you have completed?
Lower than bachelor Bachelor’s degree Master’s degree Doctorate degree
5. What is your status?
Single living together Married Widowed Divorced Other_________________
6. Do you have children?
Yes, How Many ______ No
7. If you have children that live at home, in which range of age are they?
From 0 to 6 years From 6 to 12 years Older than 12 years
8. How many people make up your household?
I person 2 persons 3-4 persons 5 or more persons
9. What is your cultural background
Dutch (Nederlandse) Dutch Indonesian (Indonesisch) Dutch Surinamese (Surinaamse) Dutch Antillian (Antilliaanse) Dutch Aruban (Arubaanse) Turkish (Turkse) Moroccan (Marokkaanse) Other cultural background (Andere nationaliteit) __________________________
x
52

53

54

Appendix 2: Factor analysis
Environmental concern:
Reliability Statistics
Cronbach's
Alpha N of Items
.902 3
Item-Total Statistics
Scale Mean if
Item Deleted
Scale Variance
if Item Deleted
Corrected Item-
Total
Correlation
Cronbach's
Alpha if Item
Deleted
Environmental concern
(Q14) 8.11 9.714 .809 .856
Environmental concern
(Q15) 8.39 9.930 .830 .839
Environmental concern
(Q16) 8.07 10.021 .777 .883
In this factor all the three questions are used, so environmental concern = (Q14 + Q15 + Q16) / 3
Nutrition:
Reliability Statistics
Cronbach's
Alpha N of Items
.781 3
Item-Total Statistics
Scale Mean if
Item Deleted
Scale Variance
if Item Deleted
Corrected Item-
Total
Correlation
Cronbach's
Alpha if Item
Deleted
Nutrition (Q26) 8.98 8.383 .579 .748
Nutrition (Q27) 9.10 6.866 .677 .638
Nutrition (Q28) 9.40 7.532 .608 .717
For this factor all the three questions are used, so nutrition = (Q26 + Q27 + Q28) / 3
55

Taste:
Reliability Statistics
Cronbach's
Alpha N of Items
.616 3
Item-Total Statistics
Scale Mean if
Item Deleted
Scale Variance
if Item Deleted
Corrected Item-
Total
Correlation
Cronbach's
Alpha if Item
Deleted
Taste (Q29) 9.8545 5.592 .623 .207
Taste Q30R 10.4247 5.260 .483 .439
Taste (Q31) 9.3395 9.411 .223 .745 For this factor the questions Q 29 and Q30R are used, so price = (Q29 + Q30R) / 2
Price:
Reliability Statistics
Cronbach's
Alpha N of Items
.886 3
Item-Total Statistics
Scale Mean if
Item Deleted
Scale Variance
if Item Deleted
Corrected Item-
Total
Correlation
Cronbach's
Alpha if Item
Deleted
Price (Q32) 7.52 10.981 .788 .830
Price (Q33) 8.05 11.728 .750 .863
Price (Q34) 7.35 11.044 .798 .821
In this factor all the three questions are used, so price = (Q32 + Q33 + Q34) / 3
56

Environmentally friendly:
Reliability Statistics
Cronbach's
Alpha N of Items
.833 4
Item-Total Statistics
Scale Mean if
Item Deleted
Scale Variance
if Item Deleted
Corrected Item-
Total
Correlation
Cronbach's
Alpha if Item
Deleted
Environmentally friendly
(Q35) 16.1882 14.594 .700 .772
Environmentally friendly
(Q36) 15.0588 17.490 .563 .830
Environmentally friendly
(Q37) 15.8454 14.663 .797 .730
Environmentally friendly
Q38R 15.9378 15.207 .609 .816
The factor is reliable when all questions are used, so environmentally friendly = (Q35 + Q36 + Q37 + Q38R) / 4
57

Appendix 3: Descriptive statistics
Gender
Frequency Percent Valid Percent
Cumulative
Percent
Valid Male 352 58.7 58.9 58.9
Female 246 41.0 41.1 100.0
Total 598 99.7 100.0 Missing System 2 .3 Total 600 100.0
Descriptive Statistics
N Minimum Maximum Mean Std. Deviation
Age 592 18 81 38.68 12.842
Valid N (listwise) 592
58

Income
Frequency Percent Valid Percent
Cumulative
Percent
Valid 0 - 15000 93 15.5 15.8 15.8
16000 - 30000 62 10.3 10.5 26.3
31000 - 45000 121 20.2 20.5 46.8
46000 - 60000 127 21.2 21.5 68.3
61000 - higher 187 31.2 31.7 100.0
Total 590 98.3 100.0 Missing System 10 1.7 Total 600 100.0
Education
Frequency Percent Valid Percent
Cumulative
Percent
Valid Lower than bachelor 118 19.7 19.7 19.7
Bachelor 269 44.8 44.9 64.6
Master 182 30.3 30.4 95.0
Doctoral 30 5.0 5.0 100.0
Total 599 99.8 100.0 Missing System 1 .2 Total 600 100.0
Descriptive Statistics
N Minimum Maximum Mean Std. Deviation
WTP 1 598 1 7 1.48 .812
WTP 2 598 1 7 1.93 .921
WTP 3 599 1 7 2.45 1.167
Valid N (listwise) 597
Descriptive Statistics
N Minimum Maximum Mean Std. Deviation
Environmental concern
(Q14) 600 1 7 4.18 1.703
Environmental concern
(Q15) 600 1 7 3.90 1.642
Environmental concern
(Q16) 598 1 7 4.21 1.692
Valid N (listwise) 598
Appendix 4 : Transformations for lineair regression
59

Normal distribution transformation Normal distribution: WTP1 WTP2 WTP3
After Log10 transformation: WTP1 WTP2 WTP3
Outliers :
Outliers are deleted with a Mahalanobis distance of higher than the critical value of 9.488
Appendix 5: Results of model 1 Output multiple regression analysis
60

WTP1: Model Summary
Model R R Square
Adjusted R
Square
Std. Error of the
Estimate
1 .342a .117 .111 .16937
a. Predictors: (Constant), EnvirFriendly, Taste, Price, Nutrition
ANOVAa
Model Sum of Squares df Mean Square F Sig.
1 Regression 2.096 4 .524 18.268 .000b
Residual 15.778 550 .029
Total 17.874 554
a. Dependent Variable: WTP1_Lg10
b. Predictors: (Constant), EnvirFriendly, Taste, Price, Nutrition
Coefficientsa
Model
Unstandardized Coefficients
Standardized
Coefficients
t Sig. B Std. Error Beta
1 (Constant) .121 .055 2.188 .029
Nutrition .006 .008 .041 .806 .420
Taste .002 .006 .017 .332 .740
Price -.029 .005 -.257 -5.404 .000
EnvirFriendly .015 .008 .094 1.811 .071
a. Dependent Variable: WTP1_Lg10
WTP2:
Model Summary
Model R R Square
Adjusted R
Square
Std. Error of the
Estimate
1 .474a .224 .219 .16970
a. Predictors: (Constant), EnvirFriendly, Taste, Price, Nutrition
ANOVAa
Model Sum of Squares df Mean Square F Sig.
1 Regression 4.585 4 1.146 39.805 .000b
61

Residual 15.838 550 .029
Total 20.424 554
a. Dependent Variable: WTP2_Lg10
b. Predictors: (Constant), EnvirFriendly, Taste, Price, Nutrition
Coefficientsa
Model
Unstandardized Coefficients
Standardized
Coefficients
t Sig. B Std. Error Beta
1 (Constant) .185 .055 3.332 .001
Nutrition .011 .008 .067 1.388 .166
Taste .002 .006 .016 .338 .735
Price -.039 .005 -.324 -7.277 .000
EnvirFriendly .028 .008 .167 3.427 .001
a. Dependent Variable: WTP2_Lg10
WTP3:
Model Summary
Model R R Square
Adjusted R
Square
Std. Error of the
Estimate
1 .583a .340 .335 .16502
a. Predictors: (Constant), EnvirFriendly, Taste, Price, Nutrition
ANOVAa
Model Sum of Squares df Mean Square F Sig.
1 Regression 7.748 4 1.937 71.134 .000b
Residual 15.032 552 .027
Total 22.780 556
a. Dependent Variable: WTP3_Lg10
b. Predictors: (Constant), EnvirFriendly, Taste, Price, Nutrition
Coefficientsa
62

Model
Unstandardized Coefficients
Standardized
Coefficients
t Sig. B Std. Error Beta
1 (Constant) .183 .054 3.394 .001
Nutrition .006 .007 .033 .736 .462
Taste .002 .006 .013 .289 .773
Price -.043 .005 -.335 -8.180 .000
EnvirFriendly .055 .008 .315 6.996 .000
a. Dependent Variable: WTP3_Lg10
Appendix 6: Results of model 2 Output multiple regression analysis with moderating effects WTP1:
Model Summary
Model R R Square
Adjusted R
Square
Std. Error of the
Estimate
1 .355a .126 .099 .17112
a. Predictors: (Constant), EnFriendly_Males, Price_ECHIGH, Price,
Price_Older, Nutrition, Taste, EnvirFriendly, Taste_Older,
Taste_ECHIGH, Price_Males, Taste_Males, EnFriendly_Older,
Nutrtion_ECHIGH, Nutrition_Males, Nutrition_Older,
EnFriendly_ECHIGH
Coefficientsa
63

Model
Unstandardized Coefficients
Standardized
Coefficients
t Sig. B Std. Error Beta
1 (Constant) .111 .059 1.872 .062
Nutrition .012 .015 .080 .817 .414
Taste .004 .011 .035 .398 .691
Price -.020 .008 -.176 -2.434 .015
EnvirFriendly .003 .014 .018 .200 .842
Nutrtion_ECHIGH -.015 .018 -.201 -.832 .406
Taste_ECHIGH -.006 .014 -.080 -.402 .688
Price_ECHIGH -.003 .010 -.030 -.321 .748
EnFriendly_ECHIGH .017 .016 .265 1.039 .299
Nutrition_Older .018 .016 .252 1.104 .270
Taste_Older -.010 .013 -.146 -.767 .444
Price_Older -.005 .008 -.051 -.612 .541
EnFriendly_Older -.001 .014 -.011 -.048 .962
Nutrition_Males -.016 .016 -.223 -1.013 .312
Taste_Males .004 .012 .054 .312 .755
Price_Males -.009 .007 -.109 -1.178 .239
EnFriendly_Males .016 .014 .249 1.137 .256
a. Dependent Variable: WTP1_Lg10
WTP2: Model Summary
Model R R Square
Adjusted R
Square
Std. Error of the
Estimate
1 .485a .235 .212 .17107
a. Predictors: (Constant), EnFriendly_Males, Price_ECHIGH, Price,
Price_Older, Nutrition, Taste, EnvirFriendly, Taste_Older,
Taste_ECHIGH, Price_Males, Taste_Males, EnFriendly_Older,
Nutrtion_ECHIGH, Nutrition_Males, Nutrition_Older,
EnFriendly_ECHIGH
64

Coefficientsa
Model
Unstandardized Coefficients
Standardized
Coefficients
t Sig. B Std. Error Beta
1 (Constant) .180 .059 3.048 .002
Nutrition .031 .015 .190 2.076 .038
Taste -.003 .011 -.023 -.276 .783
Price -.037 .008 -.308 -4.541 .000
EnvirFriendly .014 .014 .081 .980 .327
Nutrtion_ECHIGH -.037 .018 -.473 -2.087 .037
Taste_ECHIGH .005 .014 .062 .335 .738
Price_ECHIGH .004 .010 .036 .415 .678
EnFriendly_ECHIGH .025 .016 .364 1.526 .128
Nutrition_Older -.011 .016 -.140 -.656 .512
Taste_Older .002 .013 .035 .195 .845
Price_Older -.003 .008 -.028 -.359 .720
EnFriendly_Older .008 .014 .127 .600 .549
Nutrition_Males -.006 .016 -.077 -.375 .708
Taste_Males .007 .012 .088 .552 .581
Price_Males -.004 .007 -.042 -.488 .625
EnFriendly_Males .003 .014 .043 .212 .832
a. Dependent Variable: WTP2_Lg10
WTP3:
Model Summary
Model R R Square
Adjusted R
Square
Std. Error of the
Estimate
1 .605a .366 .347 .16308
a. Predictors: (Constant), EnFriendly_Males, Price_ECHIGH, Price,
Price_Older, Nutrition, Taste, EnvirFriendly, Taste_Older,
Taste_ECHIGH, Price_Males, Taste_Males, EnFriendly_Older,
Nutrtion_ECHIGH, Nutrition_Males, Nutrition_Older,
EnFriendly_ECHIGH
Coefficientsa
65

Model
Unstandardized Coefficients
Standardized
Coefficients
t Sig. B Std. Error Beta
1 (Constant) .196 .056 3.483 .001
Nutrition .023 .014 .135 1.611 .108
Taste .000 .010 -.002 -.028 .978
Price -.044 .008 -.346 -5.614 .000
EnvirFriendly .043 .013 .247 3.268 .001
Nutrtion_ECHIGH -.039 .017 -.466 -2.258 .024
Taste_ECHIGH -.005 .014 -.061 -.361 .718
Price_ECHIGH .005 .010 .038 .482 .630
EnFriendly_ECHIGH .036 .016 .494 2.278 .023
Nutrition_Older -.009 .015 -.119 -.614 .539
Taste_Older -.002 .012 -.021 -.128 .898
Price_Older -.006 .007 -.057 -.805 .421
EnFriendly_Older .009 .013 .133 .695 .488
Nutrition_Males -.001 .015 -.014 -.075 .940
Taste_Males .009 .012 .109 .749 .454
Price_Males -.001 .007 -.012 -.159 .874
EnFriendly_Males -.008 .014 -.108 -.582 .561
a. Dependent Variable: WTP3_Lg10
Appendix 7: Results of model 3
WTP1: Model Summary
Model R R Square
Adjusted R
Square
Std. Error of the
Estimate
1 .364a .132 .092 .17189
a. Predictors: (Constant), EnFriendly_Masterplus, Price_Males,
Price_ECHIGH, Taste_Highincome, Price_Older, Nutrition, Price,
Taste, EnvirFriendly, Taste_Males, Price_Highincome, Taste_ECHIGH,
Price_Masterplus, Taste_Older, Taste_Masterplus, EnFriendly_Males,
Nutrition_Older, Nutrtion_ECHIGH, EnFriendly_Highincome,
Nutrition_Masterplus, Nutrition_Males, EnFriendly_Older,
Nutrition_Highincome, EnFriendly_ECHIGH
ANOVAa
66

Model Sum of Squares df Mean Square F Sig.
1 Regression 2.333 24 .097 3.290 .000b
Residual 15.305 518 .030
Total 17.638 542
a. Dependent Variable: WTP1_Lg10
b. Predictors: (Constant), EnFriendly_Masterplus, Price_Males, Price_ECHIGH,
Taste_Highincome, Price_Older, Nutrition, Price, Taste, EnvirFriendly, Taste_Males,
Price_Highincome, Taste_ECHIGH, Price_Masterplus, Taste_Older, Taste_Masterplus,
EnFriendly_Males, Nutrition_Older, Nutrtion_ECHIGH, EnFriendly_Highincome,
Nutrition_Masterplus, Nutrition_Males, EnFriendly_Older, Nutrition_Highincome,
EnFriendly_ECHIGH
67

Coefficientsa
Model
Unstandardized Coefficients
Standardized
Coefficients
t Sig. B Std. Error Beta
1 (Constant) .112 .060 1.863 .063
Nutrition .011 .017 .072 .670 .503
Taste .006 .012 .045 .451 .652
Price -.018 .009 -.163 -2.081 .038
EnvirFriendly .000 .015 .001 .012 .991
Nutrtion_ECHIGH -.012 .018 -.165 -.669 .504
Taste_ECHIGH -.007 .014 -.102 -.506 .613
Price_ECHIGH -.003 .011 -.024 -.254 .800
EnFriendly_ECHIGH .016 .017 .251 .964 .336
Nutrition_Older .011 .018 .161 .635 .526
Taste_Older -.012 .014 -.174 -.840 .402
Price_Older -.003 .009 -.035 -.377 .706
EnFriendly_Older .005 .015 .086 .348 .728
Nutrition_Males -.021 .017 -.278 -1.195 .233
Taste_Males .003 .013 .040 .220 .826
Price_Males -.006 .008 -.076 -.800 .424
EnFriendly_Males .018 .015 .276 1.209 .227
Nutrition_Highincome .018 .020 .239 .920 .358
Taste_Highincome .006 .015 .080 .374 .709
Price_Highincome -.008 .010 -.072 -.755 .450
EnFriendly_Highincome -.013 .017 -.197 -.771 .441
Nutrition_Masterplus .003 .017 .040 .179 .858
Taste_Masterplus -.005 .013 -.062 -.353 .724
Price_Masterplus -.003 .008 -.038 -.398 .691
EnFriendly_Masterplus .005 .015 .082 .368 .713
a. Dependent Variable: WTP1_Lg10
WTP2:
Model Summary
Model R R Square
Adjusted R
Square
Std. Error of the
Estimate
1 .491a .241 .206 .17162
68

a. Predictors: (Constant), EnFriendly_Masterplus, Price_Males,
Price_ECHIGH, Taste_Highincome, Price_Older, Nutrition, Price,
Taste, EnvirFriendly, Taste_Males, Price_Highincome, Taste_ECHIGH,
Price_Masterplus, Taste_Older, Taste_Masterplus, EnFriendly_Males,
Nutrition_Older, Nutrtion_ECHIGH, EnFriendly_Highincome,
Nutrition_Masterplus, Nutrition_Males, EnFriendly_Older,
Nutrition_Highincome, EnFriendly_ECHIGH
ANOVAa
Model Sum of Squares df Mean Square F Sig.
1 Regression 4.852 24 .202 6.864 .000b
Residual 15.257 518 .029
Total 20.109 542
a. Dependent Variable: WTP2_Lg10
b. Predictors: (Constant), EnFriendly_Masterplus, Price_Males, Price_ECHIGH,
Taste_Highincome, Price_Older, Nutrition, Price, Taste, EnvirFriendly, Taste_Males,
Price_Highincome, Taste_ECHIGH, Price_Masterplus, Taste_Older, Taste_Masterplus,
EnFriendly_Males, Nutrition_Older, Nutrtion_ECHIGH, EnFriendly_Highincome,
Nutrition_Masterplus, Nutrition_Males, EnFriendly_Older, Nutrition_Highincome,
EnFriendly_ECHIGH
69

Coefficientsa
Model
Unstandardized Coefficients
Standardized
Coefficients
t Sig. B Std. Error Beta
1 (Constant) .177 .060 2.959 .003
Nutrition .031 .017 .187 1.858 .064
Taste -.007 .012 -.053 -.568 .570
Price -.038 .009 -.315 -4.304 .000
EnvirFriendly .017 .015 .104 1.128 .260
Nutrtion_ECHIGH -.032 .018 -.404 -1.754 .080
Taste_ECHIGH .006 .014 .075 .396 .693
Price_ECHIGH .005 .010 .041 .466 .641
EnFriendly_ECHIGH .019 .017 .280 1.153 .250
Nutrition_Older -.016 .018 -.219 -.924 .356
Taste_Older .010 .014 .134 .692 .489
Price_Older .000 .009 -.004 -.051 .960
EnFriendly_Older .007 .015 .100 .433 .665
Nutrition_Males -.011 .017 -.135 -.621 .535
Taste_Males .012 .013 .158 .926 .355
Price_Males -.002 .008 -.019 -.213 .831
EnFriendly_Males .001 .015 .018 .085 .933
Nutrition_Highincome .015 .020 .187 .770 .442
Taste_Highincome -.020 .015 -.262 -1.305 .193
Price_Highincome -.009 .010 -.079 -.885 .377
EnFriendly_Highincome .009 .017 .128 .536 .592
Nutrition_Masterplus .003 .017 .039 .185 .853
Taste_Masterplus .009 .013 .120 .728 .467
Price_Masterplus .002 .008 .020 .232 .817
EnFriendly_Masterplus -.009 .015 -.129 -.620 .535
a. Dependent Variable: WTP2_Lg10
WTP3:
Model Summary
Model R R Square
Adjusted R
Square
Std. Error of the
Estimate
1 .614a .377 .348 .16261
70

a. Predictors: (Constant), EnFriendly_Masterplus, Price_Males,
Price_ECHIGH, Taste_Highincome, Price_Older, Nutrition, Price,
Taste, EnvirFriendly, Taste_Males, Price_Highincome, Taste_ECHIGH,
Price_Masterplus, Taste_Older, Taste_Masterplus, EnFriendly_Males,
Nutrition_Older, EnFriendly_Highincome, Nutrtion_ECHIGH,
Nutrition_Masterplus, Nutrition_Males, EnFriendly_Older,
Nutrition_Highincome, EnFriendly_ECHIGH
ANOVAa
Model Sum of Squares df Mean Square F Sig.
1 Regression 8.318 24 .347 13.107 .000b
Residual 13.749 520 .026
Total 22.067 544
a. Dependent Variable: WTP3_Lg10
b. Predictors: (Constant), EnFriendly_Masterplus, Price_Males, Price_ECHIGH,
Taste_Highincome, Price_Older, Nutrition, Price, Taste, EnvirFriendly, Taste_Males,
Price_Highincome, Taste_ECHIGH, Price_Masterplus, Taste_Older, Taste_Masterplus,
EnFriendly_Males, Nutrition_Older, EnFriendly_Highincome, Nutrtion_ECHIGH,
Nutrition_Masterplus, Nutrition_Males, EnFriendly_Older, Nutrition_Highincome,
EnFriendly_ECHIGH
71

Coefficientsa
Model
Unstandardized Coefficients
Standardized
Coefficients
t Sig. B Std. Error Beta
1 (Constant) .193 .057 3.401 .001
Nutrition .022 .016 .128 1.396 .163
Taste -.004 .012 -.031 -.365 .715
Price -.047 .008 -.374 -5.650 .000
EnvirFriendly .048 .015 .278 3.330 .001
Nutrtion_ECHIGH -.034 .017 -.411 -1.971 .049
Taste_ECHIGH -.003 .014 -.042 -.249 .804
Price_ECHIGH .005 .010 .037 .465 .642
EnFriendly_ECHIGH .031 .016 .423 1.925 .055
Nutrition_Older -.007 .017 -.090 -.419 .675
Taste_Older .001 .013 .012 .068 .946
Price_Older -.003 .008 -.030 -.379 .705
EnFriendly_Older .005 .015 .071 .341 .733
Nutrition_Males .001 .016 .009 .048 .962
Taste_Males .009 .012 .117 .755 .451
Price_Males .001 .007 .006 .071 .944
EnFriendly_Males -.011 .014 -.144 -.744 .457
Nutrition_Highincome -.011 .019 -.126 -.576 .565
Taste_Highincome -.004 .015 -.052 -.285 .776
Price_Highincome -.006 .010 -.051 -.624 .533
EnFriendly_Highincome .014 .016 .183 .849 .397
Nutrition_Masterplus .007 .016 .082 .430 .667
Taste_Masterplus .010 .012 .122 .820 .413
Price_Masterplus .007 .008 .074 .927 .354
EnFriendly_Masterplus -.014 .014 -.187 -.996 .320
a. Dependent Variable: WTP3_Lg10
72