Do Takeover Defenses Deter Takeovers?
52
1 Do takeover defenses deter takeovers? Jonathan M. Karpoff Robert Schonlau Eric Wehrly Foster School of Business Marriott School of Management Albers School of Business University of Washington Brigham Young University Seattle University Seattle, WA 98195 Provo, UT 84602 Seattle, WA 98122 [email protected] [email protected] [email protected] Under construction: March 12, 2015 Abstract: The G-index and E-index are used extensively in finance research to measure firms’ takeover defenses. Yet almost no empirical evidence exists that quantifies whether, or how much, various takeover defenses or combinations of defenses actually affect a firm’s takeover likelihood. In simple tests that do not account for endogeneity, the G-index and E-index are not significantly related to takeover likelihood. We account for endogeneity using two new instruments for a firm’s use of takeover defenses based on the firm’s geography and IPO cohort. Using these instruments, both the G-index and E-index are negatively and significantly related to takeover likelihood. The relation between takeover likelihood and the G-index is driven by a subset of 14 provisions, many of which are not captured by the E-index, and four of which have impacts on takeover likelihood opposite to how they are counted in the G-index. We propose that this empirically driven subset of 14 takeover defenses better reflects a firm’s takeover defense posture than previous indices. JEL classification: G34, K22, L14 Keywords: Anti-takeover provisions, takeover defenses, G-index, E-index, acquisitions We thank participants at the finance seminar at Brigham Young University for helpful comments on a preliminary draft of this paper.
Transcript of Do Takeover Defenses Deter Takeovers?

1
Do takeover defenses deter takeovers?
Jonathan M. Karpoff Robert Schonlau Eric Wehrly Foster School of Business Marriott School of Management Albers School of Business University of Washington Brigham Young University Seattle University Seattle, WA 98195 Provo, UT 84602 Seattle, WA 98122 [email protected] [email protected] [email protected]
Under construction: March 12, 2015 Abstract: The G-index and E-index are used extensively in finance research to measure firms’ takeover defenses. Yet almost no empirical evidence exists that quantifies whether, or how much, various takeover defenses or combinations of defenses actually affect a firm’s takeover likelihood. In simple tests that do not account for endogeneity, the G-index and E-index are not significantly related to takeover likelihood. We account for endogeneity using two new instruments for a firm’s use of takeover defenses based on the firm’s geography and IPO cohort. Using these instruments, both the G-index and E-index are negatively and significantly related to takeover likelihood. The relation between takeover likelihood and the G-index is driven by a subset of 14 provisions, many of which are not captured by the E-index, and four of which have impacts on takeover likelihood opposite to how they are counted in the G-index. We propose that this empirically driven subset of 14 takeover defenses better reflects a firm’s takeover defense posture than previous indices. JEL classification: G34, K22, L14 Keywords: Anti-takeover provisions, takeover defenses, G-index, E-index, acquisitions
We thank participants at the finance seminar at Brigham Young University for helpful comments on a preliminary draft of this paper.
2
Do takeover defenses deter takeovers?
1. Introduction
The G-index and E-index are workhorses of empirical corporate finance research. Each
counts the number of takeover defenses a firm has and is often used as a summary measure of the
firm’s protection from unsolicited takeover bids (see Gompers, Ishii, and Metrick, 2003; and
Bebchuk, Cohen, and Ferrell, 2009). But do these indices actually measure takeover deterrence?
This is an important question because a substantial number of empirical findings and
their interpretations are based on the assumption that takeover defense indices indeed measure
takeover deterrence. For example, researchers have used the G-index and E-index to examine
whether takeover defenses are associated with various firm outcomes including low stock returns
(e.g., Gompers, Ishii, and Metrick, 2003; Cremers, Nair, and John, 2009; Cremers and Ferrell,
2013), firm value (Bebchuk, Cohen, and Ferrell, 2009; Cremers and Ferrell, 2014), acquisition
returns (Masulis, Wang, and Xie, 2007), takeover premiums (Sokolyk, 2011; Kadyrzhanova and
Rhodes-Kropf, 2011), increased risk taking (John, Litov and Yeung, 2008), internal capital
markets (Duchin and Sosyura, 2013), credit risk and pricing (Cremers, Nair, and Wei, 2007;
Klock, Mansi and Maxwell, 2005), operating performance (Core, Guay, and Rusticus, 2006;
Giroud and Mueller, 2011), the value and use of cash holdings (Dittmar and Mahrt-Smith, 2007;
Harford, Mansi and Maxwell, 2008), and corporate innovation (Atanassov, 2013). Researchers
also have used takeover indices to examine whether takeover defenses serve primarily to
entrench managers at shareholders’ expense (Masulis, Wang, and Xie, 2007), or to increase firm
value through bargaining or contractual bonding (Chemmanur and Jiao, 2012; Cen, Dasgupta,
and Sen, 2011; Johnson, Karpoff, and Yi, 2014; Humphery-Jenner, 2014). The common basis in
all of these tests is the foundational assumption that the G-index and/or E-index measure
3
takeover deterrence. Even conclusions that takeover defenses increase firm value are based on
the assumption that they deter unsolicited acquisitions (e.g., Chemmanur and Jiao, 2012;
Humphery-Jenner, 2014).
For such a foundational assumption, however, the notion that takeover defenses deter
takeovers has surprisingly little empirical support. If anything, the available evidence indicates
that there is no meaningful relation between takeover frequencies and the G-index (see Core,
Guay, and Rusticus, 2006; Bates, Becher, and Lemmon, 2008; Kadyrzhanova and Rhodes-Kropf,
2011; Sokolyk, 2011). There is some evidence that isolated provisions in these indices, e.g.,
classified boards, are associated with lower takeover likelihood (e.g., see Bates, Becher, and
Lemmon, 2008; Kadyrzhanova and Rhodes-Kropf, 2011; Sokolyk, 2011), but this evidence also
is mixed (e.g., see Comment and Schwert, 1995). Some researchers focus on small subsets of
takeover defenses (e.g., Cremers, Nair, and John, 2009; Kadyrzhanova and Rhodes-Kropf, 2011;
Harford, Humphery-Jenner, and Powell, 2012), but such individualized choices only underscore
the absence of systematic evidence on whether certain takeover defenses do, in fact, deter
takeovers, and if so, which ones.
The issue is, of course, endogeneity. Firms that deploy takeover defenses may do so
precisely because they are likely to receive unsolicited takeover bids. The absence of an
empirical correlation between takeover defenses and firm independence cannot rule out the
hypothesis that takeover defenses do in fact deter takeovers, but tend to be deployed by firms
with high takeover likelihoods. Stated differently, the lack of an empirical correlation between
defenses and takeover frequencies might simply indicate that the defenses are endogenous, not
ineffective.

4
The purpose of this paper is to examine whether takeover defenses, and particularly the
G-index and E-index, do in fact measure takeover deterrence. Using standard acquisition
likelihood models without controlling for endogeneity, we find that acquisition likelihood is
significantly related to firm characteristics and performance, but not to a firm’s G-index or E-
index. This result for the overall G-index is consistent with previous findings (e.g., see Core,
Guay, and Rusticus, 2006; Bates, Becher, and Lemmon, 2008; Kadyrzhanova and Rhodes-Kropf,
2011).
We then account for the endogenous adoption of defenses by deploying two instrumental
variables that capture arbitrary variation in firms’ use of defenses. The first instrument is based
on the defenses deployed by firms with headquarters in the same geographical area as the subject
firm, but not in the same industry. The rationale for this instrument is twofold: First, managers
of firms in geographical proximity are likely to interact and influence each others’ decisions on a
broad range of corporate matters, including takeover defenses. Second, firms from the same area
are more likely to share law firms who do business in their area. Law firms are known to
influence their client firms’ use of takeover defenses (see Coates, 2001), so this geographical
overlap also indicates that firms from the same area tend to use takeover defenses in similar ways
for reasons that are not directly related to their specific takeover likelihoods. Similar arguments
for the importance of geographical network effects are made by Davis and Greve (1997)
regarding golden parachutes, Kedia and Rajgopal (2009) regarding the adoption of stock option
plans, and Parsons, Sulaeman, and Titman (2014) regarding financial misconduct. Consistent
with these arguments, we find a strong correlation between a firm’s takeover provisions and
those of its geographically proximate non-industry peers.
5
Our second instrument is the number of takeover defenses adopted by firms that went
public within one year of the subject firm but that are not in the same industry. Daines and
Klausner (2001) and Field and Karpoff (2002) document a strong time component to the
adoption of takeover defenses by IPO firms, and Hannes (2006) documents that a firm’s use of
takeover defenses is sticky over time. These results imply that a firm’s use of takeover defenses
is strongly influenced by the year it went public. We therefore use the provisions adopted by
unrelated firms in a subject firm’s IPO cohort to measure arbitrary variation in a firm’s takeover
defenses that is not directly related to the firm’s specific takeover likelihood. Empirically, we
find a strong correlation between a firm’s takeover provisions and the takeover provisions
adopted by that firm’s IPO-year-cohort.
Following guidelines discussed in the literature, we test and confirm that both our
instruments meet the necessary conditions for the identification of strong instruments. Using
these instruments to account for endogeneity has a large effect on our empirical results, as we
find that takeover likelihood is negatively and significantly related to both the G-index and E-
index. A one-standard deviation increase in the instrumented value of a firm’s G-index results in
a 9.7% reduction in the probability that the firm will be acquired within one year and a 21.1%
reduction in the probability the firm will be acquired within five years. A one-standard deviation
increase in the instrumented value of a firm’s E-index reduces the probability that the firm will
be acquired within one year by 11.0%, and within five years by 19.8%. These results are robust
to several different methodological approaches to modeling the relation between takeover
likelihood and provision use. These results provide the first direct empirical support for the
widespread assumption that takeover defenses do in fact deter takeovers.

6
To compare the ability of the G-index or E-index to characterize a firm’s takeover
deterrence, we conduct several additional tests. First, we document that an index constructed
from the provisions that are included in the G-index but excluded from the E-index – which
Straska and Waller (2014) label the Other Index or O-index – is significantly and negatively
related to takeover likelihood. In fact, the predictive power of the O-index is more than half as
large as that of the E-index, as a one-standard deviation increase in the instrumented value of a
firm’s O-index is associated with a 7.9% reduction in the probability that the firm will be
acquired within one year and a 17.5% reduction in the probability the firm will be acquired
within five years. These results indicate that the provisions included in the G-index but excluded
from the E-index are, as a group, also associated with takeover deterrence.
Next, we use our approach to address endogeneity to investigate the effects of each
individual provision on takeover likelihood. For each provision, we use a firm’s non-industry
geographic peer firms’ incidence of that provision as one instrument and the firm’s non-industry
IPO-year cohorts’ incidence of that provision as a second instrument. These instruments identify
variation in the use of these provisions that is strongly correlated with the incidence of the
provision at the subject firm but that is not related to the anticipated takeover likelihood for that
specific firm. Using this approach, we then test for the relation between each provision and
takeover likelihood while controlling for the rest of the provisions. We find that 14 of the
original 24 provisions in the G-index are individually related to takeover deterrence. Of these,
ten have the expected sign suggesting they deter takeovers while four have the opposite sign,
indicating that they positively affect takeover likelihood.
The ten provisions that deter takeovers after controlling for endogeneity are anti-
greenmail provisions, classified boards, director indemnification, limitations on director liability,

7
directors’ duties provisions, director contracts, fair price restrictions, cashout laws, supermajority
requirements, and unequal voting rights. 1 The provisions that are positively related to takeover
likelihood are compensation plans with change-in-control provisions, golden parachutes,
limitations on written consent, and straight (i.e., not cumulative) voting. The fact that these four
provisions are positively related to takeover likelihood runs counter to the assumptions behind
the widespread use of the G-index. The results for the two compensation-related provisions have
intuitively appealing interpretations: if offered generous payouts once their firm is acquired,
managers are more likely to seek acquirers or agree to be acquired.
Finally, we use our empirical results for the individual provisions to aggregate and
construct a new empirically-based index of takeover defenses and show that it is strongly related
to takeover deterrence. We construct this new index by adding 1 to the index total for each of
the 10 provisions that has a negative relation to takeover incidence. Unlike the G-index and E-
index, however, we add 1 to the index for each of the four provisions that is positively related to
takeover incidence if the provision is absent. We call the resulting subset of strong takeover
defenses the Deterrence index or D-index, and show that the D-index strongly predicts takeover
likelihood with or without corrections for endogeneity. Furthermore, of the 24 provisions in the
G-index (or the six provisions in the E-index), the only subsets of provisions that are statistically
related to takeover incidence are those that are included in the D-index. After correcting for
endogeneity, all of the predictive power in the G-index and E-index (as well as two other indices
used in other papers) for takeover deterrence is attributable to those provisions that overlap with
the D-index.
1 This list notably excludes poison pills, a finding that is consistent with arguments that virtually all firms have at least latent, or shadow, poison pills (e.g., Coates, 2000). As discussed in Appendix A, however, our evidence regarding poison pills’ empirical relation to takeover likelihood is mixed. In Table 6 we therefore consider an augmented version of the D-index in which poison pills are included as one of the provisions that deter takeovers.

8
Our investigation draws upon previous findings that the G-index and E-index are not
empirically related to takeover likelihood (Core, Guay, and Rusticus, 2006; Bates, Becher, and
Lemmon, 2008; Kadyrzhanova and Rhodes-Kropf, 2011; Sokolyk, 2011). Bates, Becher, and
Lemmon (2008) argue that these findings have wide-ranging implications, as they “…challenge
the common perception that these factors, independently or as indexed, provide a reliable proxy
for managerial entrenchment or a firm’s exposure to the market for corporate control.” Our
paper, in contrast, provides empirical support for the widespread use of the G-index and E-index
to measure takeover deterrence.
Our paper also is related to several papers that use various identification strategies to
examine the relation between takeover defenses and outcome variables such as Tobin’s q and
takeover premiums. Goktan and Kieschnick (2012) use a Heckman probit model approach with
a selection equation to try to address selection issues. Straska and Waller (2010), Bebchuk and
Cohen (2005), and Bebchuk, Cohen, and Ferrell (2009) use anti-takeover provisions from several
years before the year of analysis in an attempt to address simultaneity concerns. Cremers and
Ferrell (2014) focus on differences in the relation between firm value and antitakeover
provisions before and after the 1985 Moran v. Household case to achieve identification.
Kadyrzhanova and Rhodes-Kropf (2011) use age-at-IPO as an instrument in a two-step
estimation approach aimed at estimating the relation between governance provisions and
takeover premiums. Our paper, in contrast, examines all 24 of the G-index provisions and their
relations to takeover likelihood, as opposed to the indices’ relations with other outcome
variables.
This paper makes four contributions to the literature. First, we argue that the absence of
an empirical correlation between takeover likelihood and the G-index or E-index reflects the

9
endogenous adoption of takeover defenses. We propose two instruments that allow for a direct
empirical investigation of the relation between each of the 24 provisions used in the G-index
(and those in the E-index) and takeover likelihood. The validity of each instrument, and our
overall findings, are corroborated by the fact that the instruments are created using two
fundamentally different peer effects yet our main qualitative results are similar and robust to
using either instrument. Second, we show that both the G-index and E-index are negatively and
significantly related to takeover likelihood. These results support the widespread assumption
that these indices measure takeover deterrence, as well as the large body of empirical inferences
that are based on this assumption. To our knowledge, our paper is the first to document a causal
effect where higher numbers of takeover defenses are shown to cause lower takeover likelihoods.
Third, our provision-level results show that the G-index and E-index are particularly noisy
measures of takeover deterrence, as their predictive power comes from a subset of provisions,
many of which are outside the E-index. And fourth, we construct a more efficient index, the D-
index, based on the empirical relations between each individual provision and takeover
likelihood. This new index contains the 14 provisions that most significantly relate to takeover
likelihood, and adjusts for the finding that four of the provisions increase takeover likelihood.
We demonstrate that the G-index and E-index are negatively related to takeover likelihood only
because some of their provisions overlap with the provisions in the D-index.
The paper proceeds as follows. In section 2 we describe the data, discuss endogeneity
issues in our empirical approach, and motivate our specific instruments. In section 3 we report
the relation between takeover likelihood and both the G-index and E-index. We report these
results first without correcting for endogeneity and then after correcting for endogeneity. In
section 4 we investigate how each individual takeover defense relates to takeover likelihood. In

10
section 5 we use the section 4 results to create the D-index and demonstrate how it compares to
the G-index, E-index, and other subsets of provisions within these indices in explaining takeover
incidence. Section 6 concludes.
2. Descriptive information, endogeneity concerns, and instruments
2.1 Data and sample descriptive information
To address the question of whether the antitakeover provisions from the G-index and E-
index do, in fact, relate to takeover deterrence we require information on firm acquisitions, firm-
and industry-level control variables known from prior research to relate to takeover likelihood,
and information on which provisions existed at each firm each year. Our acquisition data come
from the Thomson’s Securities Data Company (SDC) database, the firm- and industry-level
information is from Compustat and CRSP, and the provision-level data are from the Investor
Responsibility Research Center (IRRC) database.2
Institutional Shareholder Services (ISS) acquired IRRC in 2005. Riskmetrics then
acquired ISS and starting in 2007 made significant changes to the format and scope of the
governance data collected each year such that roughly only half of the original 24 components of
the G-index are available in some form via Riskmetrics after 2006. Riskmetrics not only
changed the exact information collected but also the manner of collecting and reporting the
information such that even for the subset of variables collected by both IRRC and Riskmetrics
there is a large structural change in 2006, despite the focus that both data sets had on S&P1500
firms. For example, both the IRRC and Riskmetrics data sets collect a binary variable named
“labylw” signaling limits on shareholders’ ability to amend bylaws. In 2006, the IRRC file
2 The following SDC Filters were used in identifying IRRC targets: US Targets with deal form AR, M, AM, or AA and a completed status. The IRRC data have been acquired and alternatively controlled by ISS, Riskmetrics, and MSCI, and have been listed on the WRDS platform alternatively under the Riskmetrics and ISS names. To avoid confusion, in this paper we refer to the 1990-2006 data collected by IRRC as IRRC.

11
reports that 22.4% of firms have such limits whereas Riskmetrics reports that 85.0% of firms
have such limits in 2007. Given the lack of many of the necessary variables after 2006 in
Riskmetrics, and the extensive changes made to the way the data were collected even for the
subset of variables that are common to the two data sets, we focus only on the IRRC data
through 2006 and assume that the provisions constituting the G-index in 2006 carry forward for
those firms for four more years. This approach also ensures that our analysis directly relates to
the large body of existing research, which relies extensively on the IRRC data.
Projecting the data forward in time is consistent with the standard approach used in the
literature for previous years in which IRRC did not report firm-level data. From 1990-2006,
IRRC published governance data for 1990, 1993, 1995, 1998, 2000, 2002, 2004, and 2006, with
each volume including corporate governance information for between 1,400 and 2,000 firms.
Like previous studies, we fill in data from missing years by projecting forward from the most
recent IRRC data. For example, the IRRC governance data from 1993 are used in 1994 and the
1995 data are used for 1996 and 1997.
Following the procedures of Gompers et al. (2003), we distill the 45 IRRC data elements
into 24 corporate governance provisions, and report the G-index as a simple sum of the
constituent provisions. The E-index described in Bebchuk et al. (2009) is calculated in the same
manner as the G-index, by adding one for each provision in effect. The E-index is comprised of
six governance provisions: poison pills, golden parachutes, classified boards, limits to
shareholder amendments of the bylaws, supermajority requirements for mergers, and
supermajority requirements for charter amendments.3 Appendix A, Table A1 reports on the
annual frequencies of each provision in our sample.
3 Gompers, Ishii, and Metrick (2003) contains a detailed discussion of the 24 provisions in the G-index.

12
Firm-specific financial and operating control variables are from Compustat and CRSP
and are motivated by prior work on takeover likelihood.4 These variables include firm size (AT),
leverage (DLTT/AT), the market-to-book ratio ((CSHO*PRC + DLTT)/AT), industry-adjusted
operating return on assets (ROA = OIADP/AT), the property ratio (PPEGT/AT), the liquidity
ratio ((ACT-LCT)/AT), average sales growth over 3 years (average((SALEt0 - SALEt-1)/ SALEt-
1)), the prior one-year market-adjusted return, and industry concentration as measured by the
Herfindahl-Hirschman index using sales.5 Industry adjustments are made using the Fama-French
49 industries.
Our initial sample consists of 32,229 firm-years from the intersection of firms in the
IRRC and Compustat databases from 1990-2010. Missing control variables cause 6,319 firm-
years to be eliminated from the sample. One of the required variables includes the requirement
that each firm have at least 1 non-industry geographic peer firm within its state and at least 1
non-industry IPO-year peer for the calculation of the instrumental variables described in more
detail in section 2.3. These data requirements result in the 25,910 firm-year observations that
serve as our basic sample for all tests.
[Insert Table 1]
Using this basic sample, Table 1 reports the number of firms and takeovers and the mean
G-index and E-index values by year. The mean G-index ranges from 8.7 to 9.3 during our
sample period of 1990-2010, and is relatively stable across time.6 For comparison, Gompers et
4 For examples, see Palepu (1986), Ambrose and Megginson (1992), Song and Walkling (1993), Comment and Schwert (1995), and Field and Karpoff (2002). 5 If PPEGT is missing but PPENT is not, we use PPENT to calculate the property ratio. ACT and LCT are not reported in Compustat for banks, so requiring these variables eliminates banks from our sample. 6 The variation in the mean G-index and E-index values across proximate years is due to firms dropping from the sample. For example, consider the 1990 and 1991 values. The 1990 G-index values are used to populate 1990

13
al. (2003) report an annual average G-index of 8.9 to 9.3 during the 1990-1998 period. The E-
index ranges from 2.4 to 2.8 during our sample period, again largely comparable to the figures
reported for the 1990-2002 sample in Bebchuk et al. (2009). The trends in takeover frequency
shown in Table 1, with peaks in the late 1990s and mid-2000s, are similar to those documented
by Masulis, Wang and Xie (2007). Table 2 provides additional descriptive information for the
firms in the final sample of 25,910 firm-year observations. Most of the sample characteristics
are standard for research in this area, and the summary statistics for them are similar to those of
other samples based on IRRC data (e.g., see Core, Guay, and Rusticus, 2006; Sokolyk, 2011).
[Insert Table 2]
2.2 Endogeneity concerns
Our research question is whether the takeover provisions as constituted within the G-
index or E-index affect takeover likelihood. A naïve approach to this question would involve
estimating a simple regression of a binary variable for being acquired ( ) on the takeover index
variable ( ) as well as whatever control variables ( - ) appear in the model as shown in
equation (1) below.
⋯ (1) Given the endogenous nature of , this approach would result in biased and inconsistent
estimates of because E( | , … ) ≠ 0. Intuitively, endogeneity arises if managers’ use of
takeover defenses is affected by their assessment of the likelihood the firm will receive a
takeover bid or if the adoption of the defenses is correlated with managers’ underlying openness
to being acquired. In this paper, we achieve identification by directly modeling the endogenous
through 1992, but the table above reports a slightly different annual mean in 1990 and 1991. The difference arises because not all of the firms that were included in 1990 still exist in 1991.
14
variable as a function of two instrumental variables ( ) as shown in equation (2) and then using
information from both equations to estimate .
⋯ 2
A valid instrument must meet both relevance and exclusion conditions (see Roberts and
Whited, 2012). For the relevance condition, we report the first-stage F-statistic and the R-
squared value for each of our tests. Staiger and Stock (1997) suggest a rule-of-thumb that the F-
statistic be at least 10 for a strong instrument. Stock and Yogo (2005) tabulate various
guidelines for identifying weak instruments depending on (1) the estimation bias and test statistic
size distortion that the researcher is willing to accept relative to OLS estimation, (2) the number
of endogenous variables involved, and (3) the number of instruments. Since we have one
endogenous variable and up to two instruments, only the size distortion guidelines apply (the
tabulated bias guidelines require three or more instruments). The Stock and Yogo (2005) size
distortion guidelines for our application, assuming less than 10% size distortion (10% is the
smallest category they consider) thus imply that the 2SLS first-stage F-statistics should be at
least 19.9 for a strong instrument. When we use a limited-information maximum likelihood
(LIML) approach, the first-stage F-statistics should be at least 8.7 for a strong instrument.
The exclusion condition requires that cov( , ) = 0 and can be thought of as the
requirement that the instrument only affect whether a firm is acquired ( ) via its relation with
the endogenous index ( ) and not via some other pathway captured in the error term. Because
the exclusion condition is not directly testable we discuss the creation of our instruments in detail
in section 2.3 and argue that the exclusion condition is met.
15
Most of our empirical tests focus on systems of equations like those described in (1) and
(2) above. In Tables 4 and 6 the endogenous variable is an index of provisions (i.e., G-index, E-
index) that is treated as a pseudo-continuous variable. In Table 5, the endogenous variable is a
single binary provision. When the dependent variable in (1) is binary we have the option either
to impose a cumulative distribution function on the outcome or to estimate a linear probability
model (LPM). Given that 2SLS in a LPM context allows for either binary or continuous
endogenous regressors (both of which we use) we choose to use 2SLS with a LPM. This
approach is similar to that discussed in econometrics texts such as Angrist and Pischke (2009,
page 198) and Cameron and Trivedi (2010, page 485). Cameron and Trivedi specifically note
that using a 2SLS approach with a LPM results in consistent estimates but that
heteroskedasticity-robust standard errors must be used for inference. As alternatives to the 2SLS
approach, for robustness we also employ a recursive bivariate probit model and a limited-
information maximum likelihood (LIML) approach to estimate and obtain qualitatively similar
results. As noted by Stock and Yogo (2005) and Hayashi (2000, page 542), 2SLS and LIML
estimators have the same asymptotic distributions but LIML is more robust to small sample bias
and to weak instruments.
2.3 Instrumental variables
Given the relevance and exclusion requirements described above, our instruments at the
index level should (1) strongly correlate with index values at the firm, and (2) not relate to the
likelihood of takeover at that firm in other ways. We use two instruments in this paper. The first
instrument is based on the incidence of provisions at geographically-proximate firms that are not
in the same industry as the subject firm. The second instrument is based on the incidence of
provisions at firms that went public within one year of the firm in question.

16
To create the first instrument we first use zip codes to identify all firms within a 100-mile
radius of the subject firm’s headquarters. We then eliminate firms within this group if they (1)
have the same Fama-French 49 industry classification as the subject firm or (2) are located in a
different state. If no peer firms are found using this approach then a statewide net is used instead
of a 100-mile radius. To illustrate the construction of the geography-based instrument assume
that the antitakeover index has two provisions (provisions A and B). Assume the firm in
question has four geographically-proximate peer firms; the presence of provision A using binary
variables at these four firms is (0,0,1,1) and the presence of provision B at these four firms is
(1,1,0,1). Using these numbers, 50% of the geographically-proximate firms have provision A
and 75% have provision B. Thus the instrument at the index level for this firm would be 0.50 +
0.75 = 1.25. At the provision level, the instrument for provision A would be 0.50 and the
instrument for provision B would be 0.75.
In creating this instrument we purposely purge the peer group of within-industry peers to
isolate geographic-peer effects in takeover provisions that are not related to industry. We argue
that this process picks up commonalities in takeover provisions that are driven by geographical
proximity and that these (non-industry) trends arguably are not related to the specific takeover
likelihood of the firm in question. Geographic proximity could explain takeover defenses if
there is a spillover of management ideas at the local level (e.g., university-sponsored CEO
forums) or shared legal or consulting services. The geographic proximity instrument is based on
headquarters location and not state of incorporation, so the instrument does not pick up the
tendency for firms to select Delaware or other specific states due to their laws.7 Also, the
instrument is based on location decisions by both the sample firm and its non-industry peers that
typically were made many years before the year in which we measure takeover likelihood, 7 For examples, see Bebchuk and Cohen (2003) or Dyreng, Lindsey, and Thornock (2014).
17
further implying that this instrument satisfies the exclusion condition. Figure 1 plots the
headquarters in our sample and shows that these headquarters are distributed widely across the
US.8
[Insert Figure 1]
To create the second instrument we follow a similar approach but identify peer firms
from all firms in the sample that went public within one year of the subject firm but that are not
in the same industry. This instrument is based on evidence that a firm’s use of takeover defenses
is strongly influenced by the year it went public. Daines and Klausner (2001) and Field and
Karpoff (2002) show that IPO firms’ use of takeover defenses varies systematically over time,
and Hannes (2006) reports that a firm’s use of takeover defenses does not change much after the
IPO. Similarly, Johnson, Karpoff, and Yi (2015) find that 83% of firms that went public
between 1997 and 2011 never changed their takeover defenses through the end of 2013.
Given the size of firms covered in IRRC, many of the firms in our sample went public
years before our sample period (1990-2010). To capture variation in takeover defenses over time
we define IPO-year cohorts starting in 1950 and move forward year-by-year through 2010. All
firms that went public before 1950 are included as part of the 1950 cohort. Using this approach
results in most years having 10 or more peer firms, with some years in the 1980s and 1990s
having more than 100 peer firms per year. Following the logic introduced with the geography-
based instrument, the provision-level instrument for a given firm is the percent of non-industry
IPO-year cohort firms that have the same provision. The index-level instrument is the sum of the
provision-level instruments. Appendix A Table A2 provides the number of IPOs in each year for
our sample.
8 Although not depicted, firms from both Hawaii and Alaska are also in our sample.

18
Similar to the geography-based instrument, we argue that whatever sets of provisions a
firm’s non-industry IPO-year cohort of firms chose to have years in the past should have no
direct relation with the specific takeover likelihood of the firm in question in year t+1 and hence
the exclusion requirement is met. The two instruments are calculated using two different peer
effects – one geographic in nature, and the other year-based in nature. The differences in
approaches are reflected in the relatively low correlation the instruments have with each other
(correlation of .11 and .04, respectively, for the G-index and E-index instruments). The two
instruments are based on fundamentally different peer effect arguments, yet nearly all of our
results are not sensitive to whether we use only the geography-based, only the IPO-year-based,
or both instruments together. These results suggest that each instrument does, in fact, identify
exogenous and independent variation in the endogenous variables of interest.
3. Governance indices, individual provisions, and takeover deterrence
3.1 Takeover deterrence and the G-index and E-index
We begin our investigation of the relation between the indices and takeover deterrence in
a traditional setting without regard to endogeneity. Columns 1-4 of Table 3 report coefficients
from probit models, and columns 5-8 report results from linear probability models (for
comparison purposes with subsequent tables). In all cases, the G-index and E-index are not
significantly related to takeover likelihood within one year or within five years. The G-index
results are consistent with earlier findings (Core, Guay, and Rusticus, 2006; Bates, Becher, and
Lemmon, 2008; Kadyrzhanova and Rhodes-Kropf, 2011; Sokolyk, 2011), and the E-index result
consistent with a result reported but not tabulated in Bates, Becher, and Lemmon (2008). Again,
19
these results are difficult to interpret because these tests do not attempt to control for
endogeneity.
[Insert Table 3]
If firms with greater ex-ante exposure to unsolicited takeover bids deploy and maintain
defenses, or if takeover defenses are related to managers’ underlying willingness to accept
takeover overtures, the models in Table 3 yield biased estimates. To address the bias that arises
from firms’ endogenous use of takeover defenses and takeover likelihood, we employ the
estimation techniques and instrumental variables discussed in sections 2.2 and 2.3. Table 4
reports the results from takeover likelihood tests after correcting for endogeneity using both the
geography-based and IPO-year-based instruments.9 In addition to the G-index and E-index, we
examine what Straska and Waller (2014) call the “O-index,” which is the set of provisions
outside the E-index but in the G-index. In Table 4, columns 1-3 (4-6) the dependent variable is
set to 1 if the subject firm was acquired in year t+1 (years t+1 through t+5). The last two
columns report the standardized coefficients for the G-index, E-index, and O-index from
columns 1–6. The standardized results imply that a one standard deviation increase in the
instrumented value of the G-index results in a 9.7% reduction in the likelihood of being acquired
within one year and a 21.1% reduction within five years. A one standard deviation increase in
the instrumented value of the E-index results in an 11.0% reduction in the likelihood of being
acquired within one year and a 19.8% reduction within five years. The instrumented O-index
also is negatively and significantly related to takeover likelihood.
[Insert Table 4]
9 The results in Table 4 are from overidentified models. The just-identified results are qualitatively similar for the G-index using either instrument in isolation, but are significant for the E-index only with the geography-based instrument. The just-identified results are tabulated in Appendix A, Tables A3 and A4.

20
The bottom of Table 4 reports F-statistics from the first-stage regressions estimated with
the second-stage results reported in the first six columns. In all cases, the F-statistics are large
and easily exceed the guidelines outlined in Staiger and Stock (1997) and Stock and Yogo (2005)
to identify “strong” instruments, as discussed in section 2.1. 10 , 11 Based on our economic
argument that these instruments are not directly related to takeover likelihood, we interpret the
results in Table 4 as providing evidence that the G-index and E-index are indeed negatively
related to takeover likelihood after controlling for endogeneity. This evidence supports the
literature’s widespread use of the G-index and E-index as proxies for a firm’s takeover
vulnerability. Furthermore, the O-index results indicate that some provisions in the G-index but
excluded from the E-index also work to deter takeovers.
4. Individual anti-takeover provisions as measures of takeover deterrence
In this section we move our attention from the index level to the individual provisions
from which the indices are constituted. Our empirical strategy is the same as before: we rely on
two equations in which one equation (the structural or takeover equation) models takeover
likelihood as a function of the provision and other firm- and industry-level control variables
10 Roberts and Whited (2012) discuss common problems with tests regarding overidentification and the exclusion criterion. Following this discussion, we rely more on our arguments in section 2 for instrument validity than on specification tests. Nonetheless, we take advantage of having two instruments by using the robust version of the Hausman overidentification test to test for instrument validity. The null hypothesis in this test is a joint null of both (1) correct model specification, and (2) instrument validity. The robust version of the Hausman test is appropriate because our models correct for heteroskedastic errors and cluster by firm (see Wooldridge 2002, page 123). Using this test, we reject the joint null for columns 1 and 2 at the 5% level but fail to reject the joint null for columns 3-6 (all have p-values > 0.10, with the largest p-value = 0.588). Given that the only difference between columns 1 and 4 and columns 2 and 5 is the use of different time horizons for the dependent variable and not a change in instruments, and that the qualitative conclusions are the same, we interpret the test results as providing corroborating evidence that our instruments are valid. 11 The Stock and Yogo (2005) test statistics were derived in a setting with homoskedastic errors. Consistent with the discussion in Cameron and Trivedi (2010, page 199) and the lack of published guidelines on how to relate the test statistics to F-statistics in the context of heteroskedastic-robust errors, we follow Cameron and Trivedi and note that our F-statistics using robust standard errors greatly exceed the published guidelines and hence likely satisfy the test and reject the null of weak instruments.

21
while the other equation (the first stage in a 2SLS context) models the potentially endogenous
presence of the provision as a function of the instruments and other exogenous variables.
Columns 1, 2, 7, 8 and 9 of Table 5 report the marginal effect that each provision has on
takeover likelihood. A challenge that arises in these tests is how best to control for the other 23
provisions when examining the specific effect any one provision might have on takeover
likelihood. Columns 1 and 2 of Table 5 present two approaches to this challenge. In column 1,
the results come from a single takeover equation that includes 24 separate binary variables for
each of the 24 provisions included together at the same time. In column 2, the results come from
24 separate takeover equations, estimated one at a time, in which a single provision is included
as the binary variable of interest. In the column 2 models, we include as a control variable an
index that sums up the remaining 23 provisions (i.e., an index that could range in value from 0 to
23) in each of the 24 regressions. All specifications in Table 5 also include the 75 firm-level and
industry-level control variables from Table 4.
Neither of the approaches in columns 1 or 2 deal with endogeneity, but the results are
presented in this way to show that the signs, sizes, and significance of the coefficients in columns
1 and 2 are generally similar using either approach. This result suggests that we can control for
the net effect of the remaining 23 provisions collectively while parsimoniously looking at the
specific effect that each provision has on takeover likelihood, considered in isolation.12 The
marginal effects reported in columns 7, 8, and 9 start with the general approach in column 2 by
including an index of the 23 provisions, and use 2SLS, recursive bivariate probit model (RBPM),
12 In additional robustness tests we re-estimate all specifications in Table 5 using the same two equations that appear in the Table 5 heading but in each case without the index of 23 provisions (i.e., the Index23 variable) to ensure that this modeling assumption is not driving our results. We find that the same coefficients that are significant in Table 5 are significant and they have the same signs. One difference using this alternative approach is that the negative marginal effects of poison pills on takeover likelihood becomes significant in some of the 2SLS and LIML results in addition to the RBPM results suggesting that poison pills are significant in explaining takeover likelihood. The F-statistic for poison pills in the robustness table also exceeds 10. See Appendix A Table A6. In Table 6 we report on a supplemental test in which the D-index includes poison pills.
22
and LIML methodologies, respectively, to account for endogeneity. In each case the results are
estimated using both the takeover and provision equations together with exogenous variation in
each provision’s incidence being identified using the provision-level instruments.
[Insert Table 5]
Column 7 of Table 5 reports the marginal effects of each of the 24 provisions as
estimated using 2SLS with a linear probability model (LPM) with 24 separate regressions in
which each provision is treated, in turn, as the endogenous binary variable of interest. Columns
3-6 report diagnostic information related to these same 24 2SLS regressions. Column 3 reports
the first-stage R-squared value. Column 4 reports the F-statistic from the first-stage of each
specification to provide information about the strength of the provision-level instrument.
Column 5 summarizes this information by highlighting which provisions have strong instruments
using the rule-of-thumb from Staiger and Stock (1997) that requires an F-statistic greater than
10. Column 6 reports a “Yes” if the p-value from a regression-based test of exogeneity is
smaller than 10% and hence provides supporting evidence that the variable in question is actually
endogeneous.13 To be conservative, we purposely use a 10% cutoff for this test rather than a 5%
cutoff.
For robustness, columns 8 and 9 report the marginal effects of the 24 provisions on
takeover likelihood using two alternative estimation approaches that are based on the same two
underlying equations but that use different modeling assumptions and hence are not subject to
the same weaknesses as 2SLS. The column 8 results are estimated using a recursive bivariate
13 The errors for a LPM are known to be heteroskedastic. In our specifications the errors are also clustered by firm. Hence, the test for endogeneity is not done using the traditional Hausman or Durbin-Wu-Hausman approaches but instead uses a variation of the Durbin-Wu-Hausman test that is robust to heteroskedastic and clustered errors. See Wooldridge (2002, pages 118-121) for a discussion of the traditional approach. Cameron and Trivedi (2010) discuss the robust test (page 190) as the “robustified” Durbin-Wu-Hausman test. The test was implemented in Stata and is referred to in the Stata documentation for the ivregress/estat endogeneous command as the “regression-based test”.

23
probit model (RBPM). Under this approach, the two equations are estimated as simultaneous
equations using maximum likelihood techniques that allow for correlation between the errors in
the two equations. As discussed in Greene (2003, pages 715-716), this type of approach can be
used to consistently estimate the marginal effects of an endogeneous binary regressor in a system
of equations like the system we are using in which both equations in the system have binary
outcomes. Given that the correlation in errors is allowed and modeled, this approach is not as
sensitive to some of the assumptions needed to motivate the 2SLS approach. Following Greene
(2003, page 716) we estimate the marginal effects in column 8 as the average difference in each
firm-year’s predicted probability of observing a takeover conditional on having or not having the
provision in place while holding all other characteristics at the firm constant. A comparison of
the results in columns 7 and 8 reveals that the signs and significance of the RBPM marginal
effects are for the most part similar to the 2SLS results.
As an additional robustness test, in column 9 we report the marginal effects from a
limited-information maximum likelihood (LIML) estimation of the two underlying equations.
As noted in Stock and Yogo (2005) and in Hayashi (2000, page 542), 2SLS and LIML estimators
have the same asymptotic distributions but LIML is more robust to small sample bias and to
weak instruments. A comparison of the marginal effects using the 2SLS, RBPM, and LIML
approaches show a few differences, but all of the significant results from the 2SLS approach are
confirmed significant by one of the alternative robustness approaches, with only two results
lacking unanimous support.14
14The Table 5 2SLS LPM results are based on an overidentified model using both the geography-based and IPO-year-based instruments together. The just-identified version of the 2SLS LPM results for Table 5 are tabulated in Appendix A in Table A5. In all cases if a variable is found to be significant using the 2SLS LPM approach with an overidentified model (Table 5) then it also appears significant in at least one of the just-identified models shown in Table A5. The F-statistics in Table A5 show how for certain provisions the IPO-based instrument is better while for others the geography-based instrument is better. Using the instruments together in Table 5 generally leads to results

24
Column 10 summarizes how we use the results in Table 5 to identify the provisions that
are most significantly related to acquisition likelihood, and which constitute the basis for our
empirically-driven deterrence index, or D-index. We first focus on the signs and significance of
the 2SLS results for provisions that have a strong instrument. This is because 2SLS coefficients
with strong instruments are consistent. By this criterion, the following provisions are negatively
related to acquisition likelihood: anti-greenmail provisions, director indemnification, director
contracts, limitations on director liability, directors’ duties provisions, fair price restrictions,
cashout laws, and supermajority requirements. By this criterion, straight (not cumulative) voting
and restrictions on action by written consent are positively related to acquisition likelihood. For
each of these provisions, the RBPM or LIML results, or both, provide corroborating evidence.
For several other provisions, the F-statistics in column 4 indicate the absence of strong
instruments, and the regression-based-test for exogeneity (see footnote 13) fails to indicate
evidence of endogeneity. For these provisions, we rely on the signs and significance of the LPM
results in columns 1 and 2. This is because, in the absence of endogeneity, OLS estimation
(columns 1 and 2) is more efficient than 2SLS estimation (column 7). By this criterion,
classified boards and unequal voting rights are negatively related to acquisition likelihood, while
compensation plans and golden parachutes are positively related to acquisition likelihood.
Using this logic, a total of 14 of the 24 provisions in the G-index are individually and
significantly related to takeover likelihood. Column 10 indicates the direction of effect for each
of these 14 provisions.
Three additional provisions have mixed or weaker evidence. First, limitations on making
amendments to the charter appear weakly significant in column 2 and hence are a candidate for
for each provision that mirror the just-identified results for whichever instrument has the higher F-statistic for that provision.

25
inclusion in column 10. We do not include it because the signs of the 2SLS, RBPM, and LIML
marginal effects are opposite the sign in column 2 and appear in some cases to be significant.
Second, the coefficient for executive severance is significant in column 2, but we do not include
it in column 10 because of severe limitations with the IRRC severance data.15
The third provision with mixed evidence is poison pills. Pills are not included in column
10 based on the absence of a strong instrument and the insignificance of the poison pill
coefficient in columns 1 and 2. In Appendix A Table A6 we explore the robustness of our
results using a slightly different model. The results in Table A6 are similar to those in Table 5
except for poison pills. In Table A6, the F-statistic for poison pills is larger than 10 and the
marginal effects appear negatively and significantly related to takeover likelihood in some
specifications. Our mixed evidence regarding poison pills mirrors an ongoing theoretical debate
about the importance of a firm’s explicit adoption of a poison pill. Pills are widely regarded as
having a strong deterrence effect on unsolicited takeovers, an argument that Bebchuk et al.
(2009) use to include poison pills in the E-index. Coates (2000) and others, however, point out
that nearly all firms have the legal right to adopt poison pills at any time, even after receiving an
unsolicited takeover bid, a right affirmed in a 1995 Delaware Supreme Court decision. By this
argument, the nearly universal availability of such latent poison pills eliminates the incremental
deterrence of observed poison pills. In our main tests, we rely on the Table 5 results and exclude
poison pills from the D-index, a decision that is consistent with the argument that all firms have
15 Before 2006 firms were not required to report their severance agreements; hence, IRRC was only able to detect severance arrangements for the subset of firms that chose to disclose their severance arrangements. Starting in 2006 firms were required to disclose more information about existing severance arrangements and Execucomp started reporting the dollar amount of severance in the event of involuntary termination. Comparing the percent of CEOs in the IRRC dataset reported as having a severance package in 2006 with those in Execucomp reveals the problem with the IRRC severance data: both datasets focus on S&P1500 firms and while IRRC reports that only 3.8% of CEOs had severance in 2006, Execucomp reports that 50.5% of CEOs had severance arrangements.

26
latent pills. In a sensitivity test reported in Table 6, however, we develop an augmented D-index
that includes poison pills.
Four provisions have the opposite effect on takeover likelihood than assumed in the
construction of the G-index: compensation plans with change-in-control provisions, golden
parachutes, limitations on written consent, and the lack of cumulative voting. The positive
effects of the two compensation-related variables have a simple interpretation: if offered a
generous payout conditional on their firm being acquired, managers will be more likely to seek
acquirers or to agree to be acquired if an unsolicited bid arises.
The positive effects of the other two variables do not have easy interpretations. The
positive marginal effect of limitations on shareholders’ ability to act by written consent
corresponds with a finding in Sokolyk (2011), albeit using a substantially different methodology.
It is conceivable that such limitations decrease outside activists’ ability to force specific changes
in corporate policy, increasing the marginal value of a takeover attempt. Similarly, most prior
researchers argue that straight voting discourages takeover attempts because dissidents are
unable to cumulate their votes to elect one or two dissident-backed directors to the corporate
board. It is possible, however, that precluding such dissident activity encourages outside
activists to substitute away from activist efforts and toward takeover of the whole firm. Such
interpretations are consistent with our findings that limitations on action by written consent and
straight voting are positively related to acquisition likelihood, but these interpretations are highly
speculative.

27
5. An empirically based deterrence index
The results in Tables 4 and 5 and the related results in Appendix A imply the following
four conclusions:
(1) After controlling for endogeneity using either the geography-based or IPO-year-based
instruments, or both instruments together, higher levels of the G-index are associated
with significantly lower takeover likelihood. These results corroborate the assumption
used in many studies, that the G-index is a measure of takeover deterrence.
(2) After controlling for endogeneity using the geography-based instrument, or both
instruments together – but not the IPO-year-based instrument on its own – higher levels
of the E-index are associated with a significantly lower takeover likelihood. The
insignificant results for the E-index using the IPO-year-based instrument could reflect the
E-index’s relatively strong reliance on golden parachutes, as in Table 5 we find that
golden parachutes, by themselves, are positively related to takeover likelihood.
(3) After controlling for endogeneity using either the geography-based or IPO-year-based
instruments, or both instruments together, an index based on only the provisions that are
included in the G-index but excluded from the E-index (the “O-index”) is negatively and
significantly related to takeover likelihood.
(4) After controlling for endogeneity, there is strong evidence that ten of the individual
provisions in the G-index have negative marginal effects on takeover likelihood and four
individual provisions have positive marginal effects on takeover likelihood. These 14
provisions are identified in Table 5.
In this section we take a purely empirical and atheoretic approach to construct a new
index that, empirically, best reflects a firm’s overall takeover defenses. We call this the
Deterrence Index, or D-index. In creating the D-index we draw from column 10 of Table 5 and
add 1 for each of the 10 provisions that have significant negative marginal effects on takeover
likelihood, and add 1 for the absence of each of the four provisions that have significant positive
effects. The index therefore ranges in value from 0 to 14.

28
Figure 2 illustrates the relationships between the D-index, G-index, and E-index. The
figure also includes two lesser-used indices, the FK-index used by Field and Karpoff (2002),
Chemmanur et al. (2011), and Johnson et al. (2014), and the Alternative Takeover Index (ATI)
described by Cremers and Nair (2005). The D-index consists of a subset of the provisions in the
G-index that partially overlaps with the provisions in each of the E-index, FK-index, and ATI.
[Insert Figure 2]
Table 6 reports on tests that compare each index’s empirical relation to takeover
likelihood. Column 1 reports the marginal effect of each set of provisions on takeover likelihood
using a linear probability model without correcting for endogeneity. As noted previously,
neither the G-index nor the E-index correlates with takeover likelihoods in tests that do not
account for endogeneity. The ATI also is not significantly related to takeover likelihood,
although the FK-index is negatively related to takeover likelihood at the 10% level.
[Insert Table 6]
Column 2 reports the marginal effect of each set of provisions as estimated from the
takeover equation after accounting for endogeneity using a 2SLS approach. For each index, we
calculate index-specific geography-based and IPO-year-based instruments by summing the
provision-level instruments for the set of provisions included in the index. In these tests, after
correcting for endogeneity, the G-index, E-index, O-index, and FK-index all are negatively
related to takeover likelihood.16 Column 3 reports standardized coefficients, and columns 4 and
16 In the original ATI some of the provisions were considered jointly. For example, a value of 1 was added to the index if the firm had either limitations on calling special meetings or limitations on acting by written consent. Similarly a value of 1 was added to the index if the firm had either a blank check provision or a poison pill. Given that various indices treated the provisions jointly whereas others treated them separately and to ensure we could compare the various indices and subsets of provisions in Table 6, we coded the indices in Table 6 as though each of the provisions were considered separately. Hence a value of 2 would be added to the ATI index in Table 6 if the firm in question has both a blank check and a poison pill rather than 1.

29
5 report results from the first-stage regressions indicating the presence of strong instruments for
each index.
Rows 6-8 report results for the new Deterrence Index, or D-index. Rows 6 and 7 enter
the D-index provisions with the corrected signs for the four provisions that empirically are
positively related to takeover likelihood, and row 8 enters the D-index provisions with the
original signs as used by previous researchers. The results in row 6 show that the D-index is
significantly and negatively related to takeover likelihood with or without correcting for
endogeneity. This provides evidence that, collectively, the provisions in the D-index are strongly
negatively related to takeover likelihood, and given the strength and validity of our instruments
the estimated relation is causal. Row 7 displays similar results for an augmented D-index that
includes poison pills. As shown by row 8, D-index provisions entered without corrected signs
remain negatively related to takeover likelihood only after accounting for the endogeneity,
similar to the results for G-index and E-index in rows 1 and 2, respectively. Collectively, these
results imply that effective measures of takeover deterrence should both correct for individual
provisions’ directional effects on takeover likelihood, and account for endogeneity.
The results in rows 9-12 illustrate which subsets of the various provisions actually reflect
takeover deterrence, and which constitute noise. Each row reports the effect on takeover
likelihood of the subset of provisions in a given index that are not in the D-index. In each case,
the non-D-index provisions are not significantly related to takeover likelihood with or without
correcting for endogeneity. We note that the F-statistics from the first-stage regressions
associated with rows 9-12 all easily exceed the guidelines from the literature for the
identification of strong instruments. Hence the lack of significance in these rows is not due to
weak instruments.

30
These results are corroborated by the results in rows 13-20. Each row reports the relation
to takeover likelihood for the subset of an index’s provisions that are also in the D-index. We
report two sets of results for each index. The first enters the D-index provisions with the
corrected signs for the four provisions, and the second enters the D-index provisions with the
original signs as used by previous researchers.
In row 13, the E-index provisions that also are in the D-index are negatively related to
takeover likelihood with or without treatments for endogeneity if we count the absence of a
golden parachute instead of its presence consistent with the sign of the marginal effect as
reported in Table 5. Without correcting the sign on golden parachutes, the E-index provisions
that also are in the D-index are negatively related to takeover likelihood only after correcting for
endogeneity. Similarly, the subsets of each of the other indices that are in the D-index are
negatively related to takeover likelihood, but the relation becomes smaller or insignificant in
tests that do not control for endogeneity if the provisions are not entered taking into account the
positive marginal effects of four of the provisions. We conclude from these results that, although
the G-index, E-index, O-index, and FK-index are negatively related to takeover likelihood after
controlling for endogeneity, these relations are wholly attributable to the set of provisions that
constitute the D-index.17
Six provisions in the D-index are not in any of the other indices (other than the G-index):
cashouts, compensation plans, director indemnification, straight voting, director liability, and
director contracts. The inclusion of these six provisions could surprise some researchers simply
because they generally are treated as not materially affecting takeover deterrence. By selecting
17 In additional untabulated tests, we estimate takeover likelihood models that include both the D-index and indices constructed from G-index (or E-index) provisions that are not in the D-index as explanatory variables. The D-index coefficient is negative and significant, while the coefficients for the non-D-index provisions are not statistically significant.
31
other provisions as the most important, the authors of the E-index, FK-index, and ATI implicitly
assert these six D-index provisions are not important. We do not take a stand on whether we
should or should not expect these six provisions to be important. But as demonstrated in rows 21
and 22 of Table 6, these six provisions, as a group, are empirically important.
6. Conclusion
The G-index and E-index are used extensively in the literature as proxies for takeover
vulnerability. Yet, because of endogeneity, almost no empirical evidence exists that quantifies
whether, or how much, various takeover defenses, or combination of defenses, actually affect a
firm’s likelihood of being acquired. Indeed, we find that, in simple tests that do not account for
endogeneity, there is no empirical relation between a firm’s G-index or E-index and its takeover
likelihood.
In this paper we use two new instruments to achieve identification in tests of the relation
between takeover defenses and takeover likelihood. The first instrument is based on the use of
takeover defenses by geographically proximate firms that are not in the same industry as the
subject firm, and the second instrument is based on the use of takeover defenses by firms in the
same IPO cohort as the subject firm but not in the same industry. Previous findings indicate that
a firm’s geography and IPO year have strong effects on its use of takeover defenses that are
related to networking and law firm influence rather than a direct concern about takeover
vulnerability. These instruments thus help to simulate arbitrary variation in a firm’s use of
takeover defenses to test for the relation between the use of such defenses and takeover
likelihood.
Using these instruments to account for endogeneity, we find that a one-standard deviation
increase in the instrumented value of a firm’s G-index (E-index) results in a 9.7% (11.0%)

32
reduction in the probability that the firm will be acquired within one year. At the provision level
we find strong evidence that 10 provisions negatively affect takeover likelihood: anti-greenmail
provisions, classified boards, director indemnification, limitations on director liability, director
contracts, directors’ duties provisions, fair price provisions, cashout laws, supermajority vote
requirements, and unequal voting rights. We also find mixed evidence that poison pills are
negatively related to takeover likelihood. Four provisions counted as takeover deterrents in the
G-index are positively and significantly related to takeover likelihood: change-in-control
compensation plans, golden parachutes, the absence of cumulative voting, and limits on
shareholders acting by written consent.
Overall, our results provide the first direct empirical support for the widespread use of the
G-index and E-index as measures of takeover deterrence because – after taking endogeneity into
account – higher values of both indices are shown to have a negative causal effect on takeover
likelihood. However, we also show that the relation between takeover likelihood and the G-
index is driven by a subset of provisions that, collectively, we call the Deterrence Index or D-
index. The D-index is a purely empirically-based collection of 14 provisions that, we propose,
best reflects a firm’s takeover defense posture. Many of these provisions are excluded from the
E-index, and four of them are counted with the opposite sign from how they are included in the
G-index. While the D-index provisions individually and jointly are significantly related to
takeover likelihood, the G-index and E-index provisions that are not in the D-index are not
significantly related to takeover deterrence.

33
References Ambrose, B. W. and Megginson, W. L., 1992. The role of asset structure, ownership structure, and
takeover defenses in determining acquisition likelihood. Journal of Financial and Quantitative Analysis 27, 575-590.
Angrist, J. D., and Pischke, J., 2009. Mostly Harmless Econometrics: An Empiricist’s Companion.
Princeton University Press. Atanassov, J., 2013. Do Hostile Takeovers Stifle Innovation? Evidence from Antitakeover Legislation
and Corporate Patenting. Journal of Finance 68, 1097-1131. Bates, T.W., Becher, D.A., and Lemmon, M.L., 2008. Board classification and managerial entrenchment:
evidence from the market for corporate control. Journal of Financial Economics 87, 656–677. Bebchuk, Lucian A. and Cohen, A., 2003. Firms' Decisions Where to Incorporate. Journal of Law and
Economics 46, 383-425. Bebchuk, L. A. and Cohen, A., 2005. The Costs of Entrenched Boards. Journal of Financial Economics
78, 409-433.
Bebchuk, Lucian, Cohen, A., and Ferrell, A., 2009. What Matters in Corporate Governance? Review of Financial Studies 22, 783-827.
Cameron, A. C., and Trivedi, P. K., 2010. Microeconometrics Using Stata, Revised Edition, Stata Press. Cen, L., Dasgupta, S., and Sen, R., 2011. Discipline or disruption? Stakeholder relationships and the
effect of takeover threat. Working Paper available at SSRN: http://ssrn.com/abstract=1746422. Chemmanur, T, and Jiao, Y., 2012. Dual Class IPOs: A Theoretical Analysis. Journal of Banking and
Finance 36, 305-319. Chemmanur, T., Paeglis, I., and Simonyan, K., 2011. Management quality and anti-takeover provisions.
Journal of Law and Economics 54, 651-692. Coates, J., 2001. Explaining variation in takeover defenses: Blame the lawyers. California Law Review
89, 1301-1422. Coates, J., 2000. Takeover defenses in the shadow of the pill: a critique of the scientific evidence. Texas
Law Review 79, 271-382. Comment, R., and Schwert, G. W., 1995. Poison or Placebo? Evidence on the Deterrence and Wealth
Effects of Modern Antitakeover Measures. Journal of Financial Economics 39, 3–43. Core, J. E., Guay, W. R., and Rusticus, T. O., 2006. Does Weak Governance Cause Weak Stock Returns?
An Examination of Firm Operating Performance and Investors' Expectations. Journal of Finance 61, 655-687.
Cremers, M. and Ferrell, A., 2014. Thirty Years of Shareholder Rights and Firm Valuation. Journal of
Finance 69, 1167-1196.

34
Cremers, M. and Nair, V., 2005. Governance Mechanisms and Equity Prices. Journal of Finance 60, 2859-2894.
Cremers, M., Nair, V., and John, K., 2009. Takeovers and the cross-section of returns. Review of
Financial Studies 22, 1409–1445. Cremers, M., Nair, V., and Wei, C., 2007. Governance Mechanisms and Bond Prices. Review of
Financial Studies 20, 1359-1388. Daines, Robert, and Klausner, Michael, 2001. Do IPO charters maximize firm value? Antitakeover
provisions in IPOs. Journal of Law, Economics, and Organization 17, 83–120. Davis, G. F., and Greve, H. R., 1997. Corporate Elite Networks and Governance Changes in the 1980s.
American Journal of Sociology 103, 1-37. Dittmar, A. and Mahrt-Smith, J., 2007. Corporate Governance and the Value of Cash Holdings. Journal of
Financial Economics 83, 599-634. Duchin, R., and Sosyura, D., 2013. Divisional managers and internal capital markets. Journal of Finance
68, 387-429. Dyreng, S., Lindsey, B. P. and Thornock, J. R., 2014. Exploring the Role Delaware Plays as a Domestic
Tax Haven. Journal of Financial Economics, forthcoming. Field, L., and Karpoff, J. M., 2002. Takeover Defenses of IPO Firms. Journal of Finance 57, 1857-1890. Giroud, X., and Mueller, H., 2011. Corporate governance, product market competition, and equity prices.
Journal of Finance 66, 563-600. Goktan, M. S., and Kieschnick, R., 2012. A Target's Perspective on the Effects of ATPs in Takeovers
after Recognizing Its Choice in the Process. Journal of Corporate Finance 18, 1088-1103. Gompers, Paul A., Joy Ishii, and Andrew Metrick, 2003. Corporate Governance and Equity Prices. The
Quarterly Journal of Economics 118, 107-155. Greene, W., 2003. Econometric Analysis, 5th ed., Pearson Education, Inc., Upper Saddle River, NJ. Hannes, S., 2006. A demand-side theory of antitakeover defenses. Journal of Legal Studies 35, 475-524. Harford, J., Humphery-Jenner, M., and Powell, R., 2012. The Sources Of Value Destruction In
Acquisitions By Entrenched Managers. Journal of Financial Economics 106, 247-261. Harford, J., Mansi, S., and Maxwell, W., 2008. Corporate Governance and Firm Cash Holdings. Journal
of Financial Economics 87, 535-555. Hayashi, F., 2000. Econometrics, Princeton University Press. Humphrey-Jenner, M., 2014. Takeover defenses, innovation, and value creation: Evidence from
acquisition decisions. Strategic Management Journal 35, 668-690.

35
John, K., Litov, L., and Yeung, B., 2008. Corporate governance and risk-taking. Journal of Finance 63, 1679–1728.
Johnson, W. C., Karpoff, J. M., and Yi, S., 2014. The bonding hypothesis of takeover defenses: Evidence
from IPO firms. Journal of Financial Economics, forthcoming. Johnson, W. C., Karpoff, J. M., and Yi, S., 2015. The life-cycle of firms’ use of takeover defenses,
working paper. Kadyrzhanova, D. and Rhodes-Kropf, M., 2011. Concentrating on governance. Journal of Finance 66,
1649-1685. Kedia, S., Rajgopal, S., 2009. Neighborhood matters: the impact of location on broad based stock option
plans. Journal of Financial Economics 92, 109-127. Klausner, M., 2002. Institutional shareholders’ split personality on corporate governance: active in
proxies, passive in IPOs. Directorship 28, 7-13. Klock, M., Mansi, S., and Maxwell, W., 2005. Does Corporate Governance Matter to Bondholders?
Journal of Financial and Quantitative Analysis 40, 693-719. Masulis, W., Wang, C., and Xie, F., 2007. Corporate Governance and Acquirer Returns. Journal of
Finance 39, 1851-1889. Palepu, K. G., 1986. Predicting Takeover Targets: A methodological and empirical analysis. Journal of
Accounting and Economics 8, 3-35. Parsons, C. A., Sulaeman, J., and Titman, S., 2014. The Geography of Financial Misconduct. Available at
SSRN: http://ssrn.com/abstract=2412970. Roberts, M., and Whited, T., 2012. Endogeneity in Empirical Corporate Finance, Simon School Working
Paper No. FR 11-29. Sokolyk, T., 2011. The Effects of Antitakeover Provisions on Acquisition Targets. Journal of Corporate
Finance 17, 612-627. Song, M. H., and Walking, R. A. 1993. The Impact of Managerial ownership on Acquisition Attempts
and Target Shareholder Wealth. Journal of Financial and Quantitative Analysis 28, 439-457. Staiger, D., and Stock, J. H., 1997. Instrumental Variables Regression with Weak Instruments.
Econometrica 65, 557-586. Stock, J. H., and Yogo, M., 2005. Testing for Weak Instruments in Linear IV Regression. In D. K.
Andrews, J. H. Stock (Eds.), Identification and Inference for Econometric Models: Essays in Honor of Thomas Rothenberg, pp. 80-108.
Straska, M., and Waller, G., 2014. Antitakeover Provisions and Shareholder Wealth: A Survey of the
Literature, forthcoming Journal of Financial and Quantitative Analysis. Straska, M., and Waller, G., 2010. Do Antitakeover Provisions Harm Shareholders? Journal of Corporate
Finance 16, 487-497.

36
Wooldridge, J., 1995. Score diagnostics for linear models estimated by two stage least squares. In:
Advances in Econometrics and Quantitative Economics: Essays in Honor of Professor C. R. Rao, ed. G. S. Maddala, P. C. B. Phillips, and T. N. Srinivasan, 66–87. Oxford: Blackwell.
Wooldridge, J., 2002. Econometric Analysis of Cross Section and Panel Data, The MIT Press, MA.
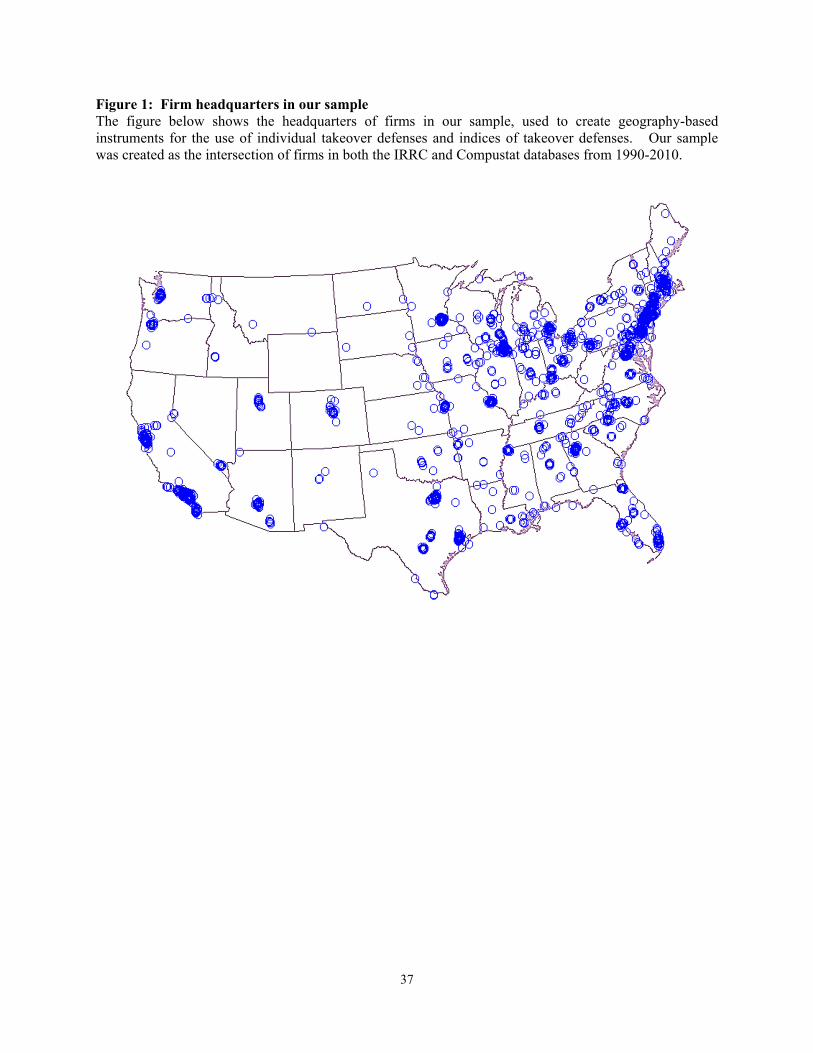
37
Figure 1: Firm headquarters in our sample The figure below shows the headquarters of firms in our sample, used to create geography-based instruments for the use of individual takeover defenses and indices of takeover defenses. Our sample was created as the intersection of firms in both the IRRC and Compustat databases from 1990-2010.

38
Figure 2: Visual portrayal of the relations between different takeover indices
In the figure below the 24 provisions covered in the G-index are represented visually by the largest circle. Each of the shapes within the circle represents other takeover indices used in the literature to proxy for takeover vulnerability. The shaded regions identify which provisions are shared between indices. The figure visually highlights the differences in opinions that exist in the finance literature about which provisions relate to takeover likelihood, and helps motivate the empirical measures used in Table 6. The G-index, E-index, FK-index, and ATI are described in Gompers, Ishii, and Metrick (2003), Bebchuk, Cohen, and Ferrell (2009), Field and Karpoff (2002), and Cremers, Nair, and John (2009), respectively. The O-index includes the G-index provisions minus the E-index provisions and is shown in the figure using the circular hatch marks. The four provisions shown with negative signs indicate that based on evidence from Table 5 the presence of these provisions is empirically linked to higher, not lower, takeover likelihood.

39
Table 1: Sample information across years
The table reports the number of firms (year t) and the number of takeovers (year t+1) in each year of our sample. The last two columns report the mean G-index and E-index values for the firms in the sample. The sample is based on the intersection of the IRRC and Compustat databases each year from 1990 through 2010.
Year Number of
Firms Number of Takeovers
G-Index E-index
1990 1,043 24 8.96 2.38 1991 1,024 22 8.98 2.39 1992 1,004 18 9.00 2.41 1993 1,105 25 9.19 2.47 1994 1,081 40 9.21 2.48 1995 1,148 39 9.28 2.53 1996 1,115 60 9.28 2.54 1997 1,044 59 9.30 2.54 1998 1,434 131 8.75 2.53 1999 1,320 110 8.78 2.53 2000 1,306 64 9.02 2.65 2001 1,215 30 9.04 2.65 2002 1,535 51 9.06 2.72 2003 1,481 42 9.08 2.73 2004 1,498 73 9.13 2.78 2005 1,426 75 9.16 2.79 2006 1,387 104 9.10 2.79 2007 1,280 58 9.10 2.79 2008 1,199 31 9.12 2.79 2009 1,156 44 9.12 2.79 2010 1,109 64 9.15 2.80

40
Table 2: Descriptive statistics
The mean and median values of the variables described below are shown for all firms in the sample from 1990–2010. The sample is based on the intersection of IRRC and Compustat firms. Firm size is measured as the book value of assets. Leverage is measured as long-term debt divided by book value of assets. Market to book is the sum of the book value of debt and the market value of equity all divided by the book value of assets. ROA is calculated as operating income after depreciation divided by the book value of assets. It is adjusted by subtracting the median industry ROA each year using Fama-French 49 industries. The property ratio is calculated as the gross property, plant, and equipment divided by the book value of assets. The liquidity ratio is the difference between current assets and liabilities divided by the book value of assets. Sales growth is the average annual sales growth calculated over years t, t-1, and t-2. Market-adjusted returns are the buy-and-hold returns at the firm over the prior calendar year minus the buy-and-hold return on the CRSP value-weighted index over the same time period. Industry concentration is measured as the Herfindahl-Hirshman index using Compustat sales information.
Variable Mean Median Observations
G-index 9.08 9 25,910
E-index 2.63 3 25,910
Target 0.04 0 25,910
Firm size ($ millions) 4,903.59 1,270.88 25,910
Market value of equity ($ millions) 5,769.42 1,227.51 25,910
Leverage 0.21 0.19 25,910
Market to book 1.52 1.13 25,910
Industry-adjusted ROA 0.05 0.03 25,910
Property ratio 0.61 0.54 25,910
Liquidity ratio 0.20 0.17 25,910
Sales growth 0.09 0.07 25,910
3-year sales growth 0.03 0.02 25,910
Market-adjusted return 0.02 -0.03 25,910
Industry concentration 6.41 5.11 25,910

41
Table 3: Takeover likelihood and takeover indices without accounting for endogeneity
Coefficients from probit and linear probability models are shown in columns 1–4 and 5–8, respectively. In columns 1–2 and 5–6 (3–4 and 7–8) the dependent variable is set to one if the firm was acquired over the next year (five years). The control variables are described in Table 2. The sample is constructed from the intersection of the IRRC and Compustat databases from 1990–2010. The number of observations drops slightly in models 1 and 2 because some industry-year cells do not contain observations with variation in the dependent variable (i.e., both 1 and 0). p-values are shown in parentheses below the coefficients with significance at the 10%, 5%, and 1% levels noted using *, **, ***, respectively. The errors are robust to heteroskedasticy and clustered at the firm level.
Probit Models Linear Probability Models
(1) (2) (3) (4) (5) (6) (7) (8)
(t+1) (t+1) (t+1, t+5) (t+1, t+5) (t+1) (t+1) (t+1, t+5) (t+1, t+5)
G-index -0.004 0.001 -0.001 0.000
(0.451) (0.947) (0.331) (0.951)
E-index 0.005 0.021 0.000 0.006
(0.732) (0.222) (0.822) (0.195)
Firm size -0.114*** -0.116*** -0.139*** -0.139*** -0.011*** -0.011*** -0.037*** -0.037***
(<0.001) (<0.001) (<0.001) (<0.001) (<0.001) (<0.001) (<0.001) (<0.001)
Leverage 0.191** 0.190** 0.396*** 0.393*** 0.016 0.016 0.110*** 0.109***
(0.020) (0.020) (<0.001) (<0.001) (0.104) (0.104) (<0.001) (<0.001)
Market to book -0.088*** -0.088*** -0.120*** -0.119*** -0.002 -0.002 -0.010* -0.010*
(<0.001) (<0.001) (<0.001) (<0.001) (0.102) (0.103) (0.080) (0.080)
Property ratio -0.147*** -0.151*** -0.093 -0.096 -0.015*** -0.016*** -0.031 -0.031
(0.007) (0.005) (0.171) (0.157) (0.005) (0.004) (0.125) (0.115)
Liquidity ratio -0.423*** -0.421*** -0.329*** -0.323*** -0.053*** -0.052*** -0.117*** -0.115***
(<0.001) (<0.001) (0.001) (0.001) (<0.001) (<0.001) (<0.001) (<0.001)
Sales growth -0.161** -0.159** -0.062 -0.061 -0.020*** -0.020*** -0.029** -0.029**
(0.011) (0.011) (0.159) (0.165) (0.001) (0.002) (0.029) (0.031)
Industry-adjusted ROA -0.233 -0.236 -0.279 -0.285 -0.044** -0.045** -0.173*** -0.173***
(0.131) (0.126) (0.130) (0.123) (0.011) (0.011) (0.003) (0.003)
Market-adjusted return 0.013 0.012 -0.016 -0.017 0.000 0.000 -0.010* -0.010*
(0.685) (0.707) (0.387) (0.352) (0.884) (0.899) (0.075) (0.067)
Industry concentration -0.005 -0.005 -0.014* -0.014* -0.000 -0.000 -0.003* -0.003*
(0.463) (0.476) (0.055) (0.061) (0.319) (0.341) (0.063) (0.074)
Constant -0.777*** -0.818*** 0.201 0.155 0.138*** 0.134*** 0.474*** 0.459***
(0.002) (0.001) (0.502) (0.605) (<0.001) (<0.001) (<0.001) (<0.001)
Year controls Yes Yes Yes Yes Yes Yes Yes Yes
Industry controls Yes Yes Yes Yes Yes Yes Yes Yes
Observations 25,806 25,806 25,910 25,910 25,910 25,910 25,910 25,910
Pseudo R-square 0.066 0.066 0.061 0.061
Chi-square 636.412 636.080 551.567 551.425
R-square 0.025 0.025 0.059 0.059

42
Table 4: Takeover likelihood and takeover indices accounting for endogeneity
The table below shows the second stage coefficients from a linear probability model after instrumenting the G-index, E-index, and O-index variables using both the geography-based and IPO-year-based instruments described in section 2.3. In columns 1–3 (4–6) the dependent variable is set to one if the firm was acquired in the next year (five years). The control variables are described in Table 2. The last two columns report the second stage coefficients from six regressions that mirror those in columns 1–3, and 4–6, respectively, but using standardized versions of the G-index, E-index, and O-index variables where a one-unit increase in the standardized variable represents a standard deviation increase in the underlying index. To save space only the main variables of interest are reported (and stacked) in the last two columns from six separate regressions that in each case include the same control variables as shown in columns 1–6. p-values are shown in parenthesis below the coefficients with significance at the 10%, 5%, and 1% levels noted using *, **, ***, respectively. Errors are robust to heteroskedasticity and clustered at the firm level.
Column: (1) (2) (3) (4) (5) (6) Columns 1–3,
standardized coefficients
Columns 4–6,
standardized coefficients
Acquired within one year Acquired within five years
(t+1) (t+1) (t+1) (t+1,t+5) (t+1,t+5) (t+1,t+5)
G-index -0.008*** -0.032*** -0.097*** -0.211*** (<0.001) (<0.001) (<0.001) (<0.001)
E-index -0.019** -0.069** -0.110** -0.198** (0.023) (0.041) (0.023) (0.041)
O-index -0.008*** -0.036*** -0.079*** -0.175*** (<0.001) (<0.001) (<0.001) (<0.001)
Firm size -0.009*** -0.011*** -0.008*** -0.027*** -0.037*** -0.027*** (<0.001) (<0.001) (<0.001) (<0.001) (<0.001) (<0.001)
Leverage 0.016 0.019* 0.015 0.110*** 0.121*** 0.104*** (0.113) (0.062) (0.142) (<0.001) (<0.001) (<0.001)
Market to book -0.003* -0.003 -0.003* -0.012* -0.012* -0.011* (0.096) (0.106) (0.093) (0.078) (0.088) (0.073)
Property ratio -0.011* -0.013** -0.012** -0.010 -0.020 -0.013 (0.052) (0.024) (0.035) (0.636) (0.333) (0.529)
Liquidity ratio -0.059*** -0.061*** -0.056*** -0.144*** -0.148*** -0.131*** (<0.001) (<0.001) (<0.001) (<0.001) (<0.001) (<0.001)
Sales growth -0.023*** -0.021*** -0.022*** -0.043*** -0.035** -0.041*** (<0.001) (0.001) (<0.001) (0.002) (0.012) (0.002)
Industry-adjusted ROA -0.043** -0.044** -0.043** -0.166*** -0.171*** -0.166*** (0.017) (0.016) (0.015) (0.007) (0.006) (0.006)
Market-adjusted return 0.001 0.001 0.001 -0.007 -0.007 -0.008 (0.720) (0.697) (0.789) (0.259) (0.267) (0.167)
Industry concentration -0.001 -0.001* -0.000 -0.004** -0.004** -0.003* (0.173) (0.093) (0.294) (0.029) (0.016) (0.061)
Constant 0.188*** 0.184*** 0.171*** 0.704*** 0.652*** 0.637*** (<0.001) (<0.001) (<0.001) (<0.001) (<0.001) (<0.001)
Year controls Yes Yes Yes Yes Yes Yes Industry controls Yes Yes Yes Yes Yes Yes Observations 25,910 25,910 25,910 25,910 25,910 25,910 Chi-square (2nd stage) 516.2 509.8 520.4 579.5 561.6 588.2 Prob < Chi-square (2nd stage) <0.001 <0.001 <0.001 <0.001 <0.001 <0.001 F-statistic (1st stage) 80.0 28.6 124.2 80.0 28.6 124.2 R-square (1st stage) 0.166 0.110 0.190 0.166 0.110 0.190
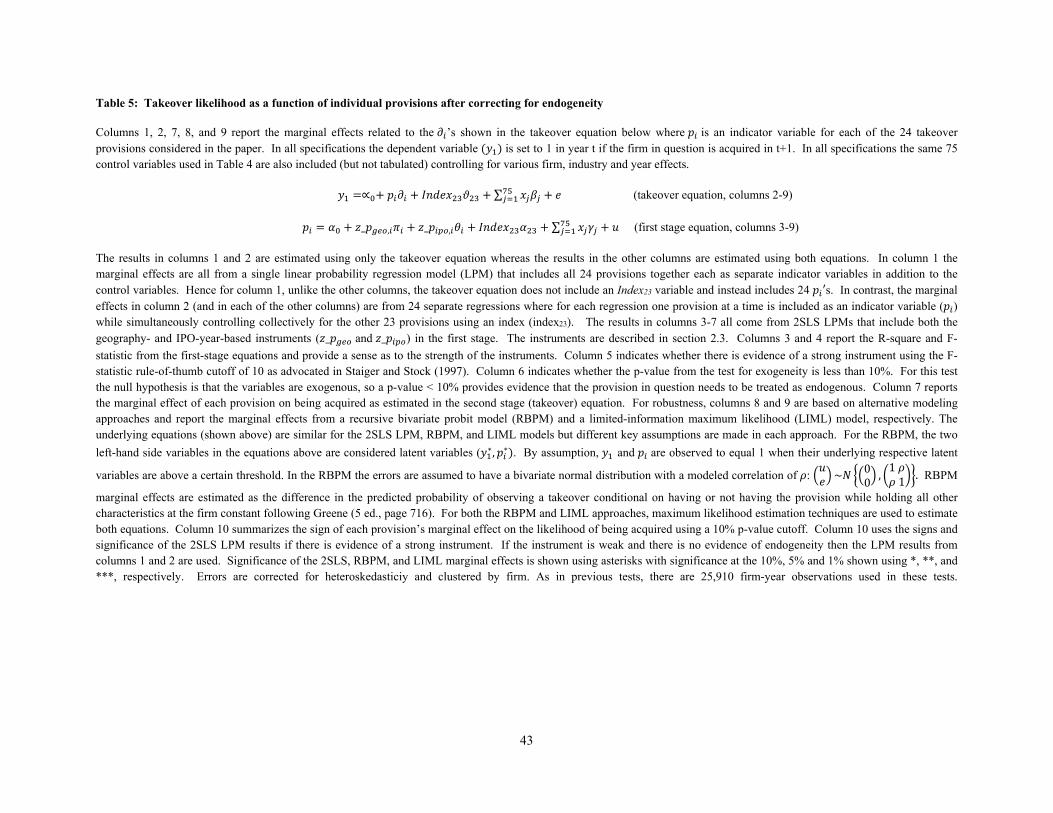
43
Table 5: Takeover likelihood as a function of individual provisions after correcting for endogeneity
Columns 1, 2, 7, 8, and 9 report the marginal effects related to the ’s shown in the takeover equation below where is an indicator variable for each of the 24 takeover provisions considered in the paper. In all specifications the dependent variable is set to 1 in year t if the firm in question is acquired in t+1. In all specifications the same 75 control variables used in Table 4 are also included (but not tabulated) controlling for various firm, industry and year effects.
∝ ∑ (takeover equation, columns 2-9)
_ , _ , ∑ (first stage equation, columns 3-9)
The results in columns 1 and 2 are estimated using only the takeover equation whereas the results in the other columns are estimated using both equations. In column 1 the marginal effects are all from a single linear probability regression model (LPM) that includes all 24 provisions together each as separate indicator variables in addition to the control variables. Hence for column 1, unlike the other columns, the takeover equation does not include an Index23 variable and instead includes 24 ′s. In contrast, the marginal effects in column 2 (and in each of the other columns) are from 24 separate regressions where for each regression one provision at a time is included as an indicator variable ( ) while simultaneously controlling collectively for the other 23 provisions using an index (index23). The results in columns 3-7 all come from 2SLS LPMs that include both the geography- and IPO-year-based instruments ( _ and _ ) in the first stage. The instruments are described in section 2.3. Columns 3 and 4 report the R-square and F-
statistic from the first-stage equations and provide a sense as to the strength of the instruments. Column 5 indicates whether there is evidence of a strong instrument using the F-statistic rule-of-thumb cutoff of 10 as advocated in Staiger and Stock (1997). Column 6 indicates whether the p-value from the test for exogeneity is less than 10%. For this test the null hypothesis is that the variables are exogenous, so a p-value < 10% provides evidence that the provision in question needs to be treated as endogenous. Column 7 reports the marginal effect of each provision on being acquired as estimated in the second stage (takeover) equation. For robustness, columns 8 and 9 are based on alternative modeling approaches and report the marginal effects from a recursive bivariate probit model (RBPM) and a limited-information maximum likelihood (LIML) model, respectively. The underlying equations (shown above) are similar for the 2SLS LPM, RBPM, and LIML models but different key assumptions are made in each approach. For the RBPM, the two
left-hand side variables in the equations above are considered latent variables ( ∗, ∗ . By assumption, and are observed to equal 1 when their underlying respective latent
variables are above a certain threshold. In the RBPM the errors are assumed to have a bivariate normal distribution with a modeled correlation of : ~ 00,11 . RBPM
marginal effects are estimated as the difference in the predicted probability of observing a takeover conditional on having or not having the provision while holding all other characteristics at the firm constant following Greene (5 ed., page 716). For both the RBPM and LIML approaches, maximum likelihood estimation techniques are used to estimate both equations. Column 10 summarizes the sign of each provision’s marginal effect on the likelihood of being acquired using a 10% p-value cutoff. Column 10 uses the signs and significance of the 2SLS LPM results if there is evidence of a strong instrument. If the instrument is weak and there is no evidence of endogeneity then the LPM results from columns 1 and 2 are used. Significance of the 2SLS, RBPM, and LIML marginal effects is shown using asterisks with significance at the 10%, 5% and 1% shown using *, **, and ***, respectively. Errors are corrected for heteroskedasticiy and clustered by firm. As in previous tests, there are 25,910 firm-year observations used in these tests.

44
Table 5, continued
(1) (2) (3) (4) (5) (6) (7) (8) (9) (10)
Provision
LPM marginal
effects (all together)
LPM marginal
effects (one at a time)
LPM 2SLS first-stage R-
Square
LPM 2SLS first-stage F-
Statistic
Evidence of a strong
instrument
Evidence of endog-
eneity?
LPM 2SLS marginal effects
Recursive Bivariate
Probit marginal effects
LIML marginal effects
Include in D-index?
Anti-greenmail -0.004 -0.007** 0.250 156.603 yes yes -0.027*** -0.006*** -0.027*** -
Blank check -0.007* -0.004 0.108 38.368 yes yes 0.038 0.011 0.038
Classified board -0.006** -0.003 0.155 4.129 -0.017 0.000 -0.018 -
Compensation plans 0.006* 0.007** 0.132 0.766 -0.203 0.014 -0.225 +
Not cumulative voting 0.000 0.003 0.131 36.933 yes yes 0.035** 0.015 0.035** +
Director indemnification 0.001 -0.005* 0.212 122.747 yes yes -0.033*** -0.008*** -0.033*** -
Director contracts -0.008** -0.009** 0.072 18.987 yes -0.058* -0.004 -0.058* -
Director liability -0.008** -0.008*** 0.439 430.945 yes yes -0.018*** -0.009*** -0.018*** -
Directors duties -0.003 -0.007 0.149 41.304 yes yes -0.039*** -0.005*** -0.039*** -
Fair price -0.002 -0.007** 0.258 112.707 yes yes -0.047*** -0.022*** -0.047*** -
Golden parachutes 0.016*** 0.017*** 0.137 0.065 -0.209 0.027 -1.148 +
Bylaws 0.000 0.003 0.088 33.906 yes 0.030 0.004 0.030
Charter 0.017 0.018* 0.055 2.859 -0.149 -0.010*** -0.150
Cashouts -0.001 -0.008 0.299 32.579 yes yes -0.030** -0.001** -0.030** -
Special meeting -0.004 0.002 0.176 74.202 yes 0.019 0.006 0.019
Written consent 0.010*** 0.010*** 0.179 100.519 yes yes 0.032** 0.009** 0.032** +
Pension parachutes -0.002 0.003 0.060 4.312 -0.135 -0.004*** -0.135
Business combination 0.000 0.001 0.170 82.135 yes -0.007 -0.003 -0.007
Poison pill 0.000 0.004 0.140 2.675 -0.090 -0.036** -0.090
Not secret ballot -0.005 -0.004 0.164 12.830 yes yes -0.043 0.006 -0.043
Executive severance -0.001 -0.009* 0.043 0.812 0.321 -0.001 0.322
Silver parachutes 0.002 0.002 0.059 0.563 -0.502 -0.003** -0.760
Supermajority -0.008*** -0.010*** 0.203 156.398 yes yes -0.042*** -0.018*** -0.043*** -
Unequal voting -0.018** -0.022** 0.029 1.349 0.712 -0.001 0.719 -

45
Table 6: Which sets of provisions explain takeover likelihood?
The table below reports the regression coefficients in columns 1 and 2 from limited probability models (LPM) where in each row a different set of provisions is included as the key variable of interest. In all cases the same 75 control variables shown in Table 4 for various firm, industry and year effects are included in these regressions but not tabulated. The dependent variable (y1) is set to 1 in year t if the firm was acquired in year t+1. The ’s in column 1 were estimated without correcting for endogeneity using just the takeover model shown below.
∝ ∑ (takeover equation)
_ _ ∑ (first stage equation)
In the equations, refers to each of the 22 sets of provisions listed in Table 6. These particular sets of provisions correspond with either (1) the anti-takeover indices used in the literature, or (2) subsets of these indices that either do or do not overlap with the provisions found to be significant in explaining takeover likelihood in Table 5. For example, row 1 corresponds with the G-index as discussed in Gompers, Ishii, and Metrick (2003) and row 9 corresponds with the subset of provisions in the G-index that are not also in D-index. The D-index refers to the sets of provisions identified in column 10 of Table 5. The ’s in column 2 were estimated after correcting for endogeneity using a 2SLS approach with the geography- and IPO-year-based instruments ( _ , _ ) described in section 2.3. The ’s in column 3 are standardized versions of those in column 2. The last 2 columns report the F-statistic and R-square values form the 1st stage equations used when estimating the ’s in columns 2 and 3. The significance of the ’s is shown at the 10%, 5%, and 1% levels using *, **, ***, respectively. The errors are robust to heteroskedasticity and clustered at the firm-level. The sets of provisions noted as having corrected signs indicate that those sets of provisions were aggregated using the signs from Table 5 meaning that the absence of golden parachutes and compensation plans and the presence of cumulative voting and limitations on written consent were added to these sets. As in previous tests, observations number 25,910.
(1) (2) (3) (4) (5) 2SLS 2SLS 1st Stage 1st Stage Sets of Provisions LPM LPM LPM std F-statistic R-Square ∂'s ∂'s ∂'s
Anti-takeover indices used in literature 1 All provisions in G-index -0.001 -0.008*** -0.097*** 80.011 0.1662 All provisions in E-index 0.000 -0.019** -0.110** 25.593 0.1103 All provisions in O-index -0.001 -0.008*** -0.079*** 124.182 0.1904 All provisions in FK-index -0.001* -0.014*** -0.126*** 44.780 0.1275 All provisions in ATI 0.001 0.007 0.045 43.527 0.113
New takeover deterrence –index based on Table 5 results column 10 6 All provisions in D-index (corrected signs) -0.005*** -0.008*** -0.077*** 295.846 0.3857 D-index provisions plus poison pills (corrected signs) -0.005*** -0.007*** -0.074*** 302.620 0.3838 All provisions in D-index (original signs) -0.001 -0.008*** -0.083*** 153.813 0.247
Subsets of provisions from takeover indices that are NOT also in the D-index 9 G-index provisions not in D-index 0.000 0.001 0.005 20.643 0.07510 E-index provisions not in D-index 0.001 0.025 0.071 35.597 0.07511 O-index provisions not in D-index -0.002 0.004 0.015 28.662 0.07112 ATI and FK-index provisions not in D-index 0.001 0.012 0.049 20.543 0.113
Subsets of provisions from takeover indices that ARE also in the D-index 13 E-index provisions also in D-index (corrected signs) -0.010*** -0.036*** -0.145*** 42.172 0.10614 E-index provisions also in D-index 0.000 -0.034*** -0.150*** 54.234 0.13815 O-index provisions also in D-index (corrected signs) -0.005*** -0.008*** -0.064*** 351.472 0.40416 O-index provisions also in D-index -0.002* -0.009*** -0.069*** 181.68 0.26217 FK-index provisions also in D-index (corrected signs) -0.005*** -0.014*** -0.092*** 220.771 0.28618 FK-index provisions also in D-index -0.003*** -0.018*** -0.120*** 80.341 0.17319 ATI provisions also in D-index (corrected signs) -0.008*** -0.079*** -0.231*** 23.93 0.09420 ATI provisions also in D-index 0.002 0.013 0.048 46.957 0.081
Subset of provisions in D-index not also in E-index, KF, or ATI indices 21 Six provisions unique to D-index (corrected signs) -0.005*** -0.009*** -0.051*** 275.027 0.34822 Six provisions unique to D-index (original signs) -0.002 -0.010*** -0.055*** 233.103 0.263

46
Appendix A
Table A1: Percent of firms with each provision during the sample period. Each year’s data is used in the subsequent year(s) until the next IRRC volume becomes available. In the G-index, 1 was added to the index if the firm did not allow cumulative voting or did not allow secret ballots. In this table Cumulative vote is set equal to 1 if the firm had a cumulative vote, and secret ballot is set equal to 1 if the firm allowed secret ballots. Provision 1990 1993 1995 1998 2000 2002 2004 2006Blank check 77.0 79.7 84.7 87.0 88.7 90.2 90.3 91.3Classified board 57.2 58.4 59.8 57.9 58.3 59.3 58.7 55.4Special meeting 24.6 28.3 30.4 31.5 36.4 47.9 50.7 52.0Written consent 24.6 28.4 31.1 30.9 35.1 44.6 46.5 48.3Compensation plans 42.2 63.4 70.9 61.2 71.2 73.7 75.9 75.7Director contracts 17.9 15.9 13.3 11.3 9.7 8.5 7.7 7.7Golden parachutes 49.8 52.5 53.3 54.6 62.3 67.2 73.4 77.9Director indemnification 40.9 38.6 37.3 23.2 23.6 18.6 17.4 18.1Director liability 73.6 68.8 65.2 46.4 43.9 33.1 31.4 30.6Executive severance 13.6 5.2 10.3 12.2 10.6 7.0 6.5 3.7Bylaws 13.6 15.4 15.2 16.5 18.9 21.4 22.2 21.2Charter 2.5 2.6 2.5 2.6 2.5 2.0 1.9 2.1Cumulative vote 18.7 16.9 15.7 12.4 11.2 9.1 8.9 8.7Secret ballot 2.5 9.1 11.5 9.1 10.3 10.0 11.6 13.0Supermajority 38.0 38.6 37.9 34.3 33.9 31.7 31.6 31.4Unequal voting 2.2 2.1 2.0 1.8 1.2 1.1 0.8 0.6Anti-greenmail 6.9 6.8 6.5 5.0 4.7 3.4 3.3 3.5Directors' duties 5.5 6.7 6.6 6.3 6.7 6.7 7.2 6.9Fair price 33.7 35.1 33.4 26.8 26.3 20.8 20.0 19.8Pension parachutes 4.2 5.1 3.9 2.3 1.4 1.0 0.9 0.7Poison pill 52.7 55.0 54.4 52.7 56.3 57.1 58.0 54.1Silver parachutes 4.1 4.9 3.5 2.6 1.8 1.5 1.1 1.2Anti-greenmail law 17.9 17.4 16.9 14.2 14.9 13.7 13.6 13.8Business combination law 86.2 89.5 89.8 90.8 92.0 92.7 92.0 92.6Cash out law 4.5 4.3 4.2 3.2 3.1 2.9 2.9 3.1Directors' duties law 5.5 5.3 5.3 4.3 4.0 3.9 4.1 4.3Fair price law 34.3 35.2 34.2 31.2 31.5 28.7 28.9 29.7Control-share acquisition law 28.1 28.4 28.0 26.7 26.3 24.8 24.9 25.4
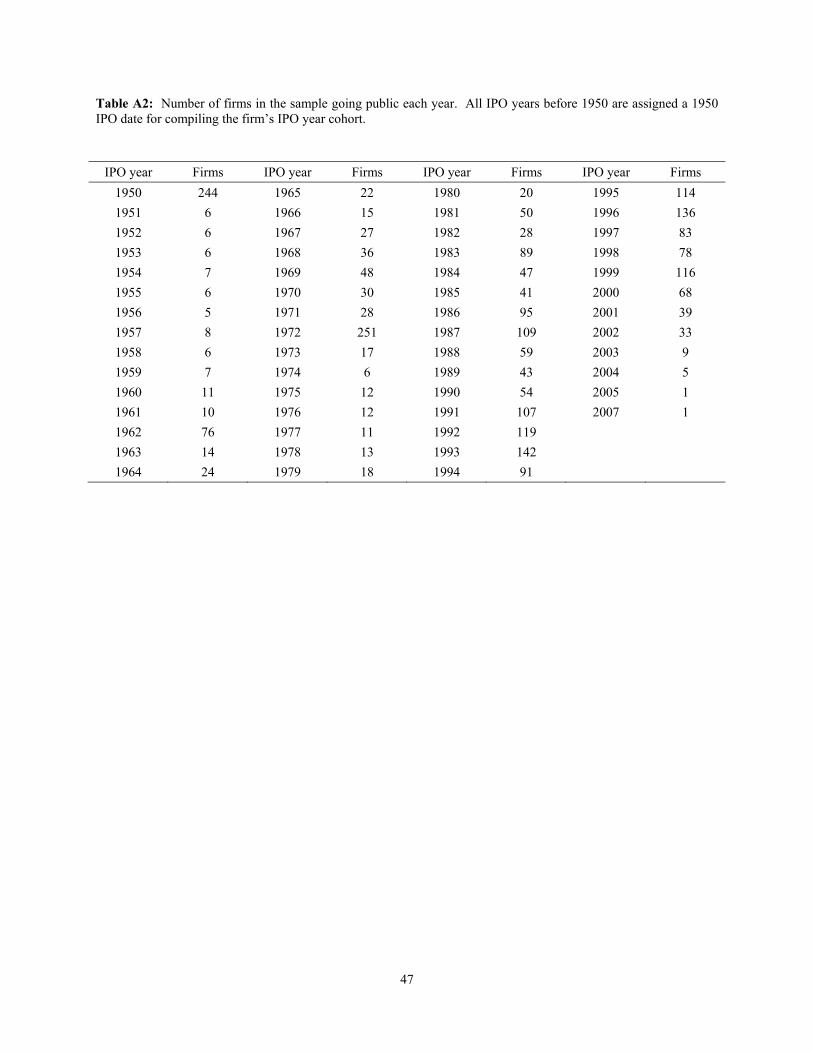
47
Table A2: Number of firms in the sample going public each year. All IPO years before 1950 are assigned a 1950 IPO date for compiling the firm’s IPO year cohort.
IPO year Firms IPO year Firms IPO year Firms IPO year Firms
1950 244 1965 22 1980 20 1995 114
1951 6 1966 15 1981 50 1996 136
1952 6 1967 27 1982 28 1997 83
1953 6 1968 36 1983 89 1998 78
1954 7 1969 48 1984 47 1999 116
1955 6 1970 30 1985 41 2000 68
1956 5 1971 28 1986 95 2001 39
1957 8 1972 251 1987 109 2002 33
1958 6 1973 17 1988 59 2003 9
1959 7 1974 6 1989 43 2004 5
1960 11 1975 12 1990 54 2005 1
1961 10 1976 12 1991 107 2007 1
1962 76 1977 11 1992 119
1963 14 1978 13 1993 142
1964 24 1979 18 1994 91

48
Table A3: Takeover likelihood as a function of index values after correcting for endogeneity – using only the geography-based instrument.
This table corresponds to Table 4 in the main body of the paper. Table 4 in the main body of the paper presents the overidentified results using both instruments. This table shows the second stage coefficients from a linear probability model after instrumenting the G-index, E-index, and O-index variables using only the geography-based instrument described in section 2.3 of the paper. In columns 1–3 (4–6) the dependent variable is set to 1 if the firm was acquired in the next year (five years). The control variables are described in Table 2 in the paper. p-values are shown in parentheses below the coefficients with significance at the 10%, 5%, and 1% levels noted using *, **, ***, respectively. Errors are robust to heteroskedasticity and are clustered at the firm level.
Using only the geography-based instrument
(1) (2) (3) (4) (5) (6) (t+1) (t+1) (t+1) (t+1, t+5) (t+1, t+5) (t+1, t+5) G-index -0.017*** -0.051***
(0.001) (0.005) E-index -0.053*** -0.142**
(0.003) (0.020) O-index -0.014*** -0.044**
(0.002) (0.015) Firm size -0.006*** -0.011*** -0.007*** -0.022*** -0.037*** -0.024***
(0.004) (<0.001) (<0.001) (0.002) (<0.001) (<0.001) Leverage 0.016 0.024** 0.014 0.110*** 0.132*** 0.103***
(0.142) (0.040) (0.183) (<0.001) (<0.001) (<0.001) Market to book -0.003* -0.004 -0.003* -0.013* -0.014* -0.012*
(0.093) (0.117) (0.089) (0.080) (0.099) (0.073) Property ratio -0.005 -0.008 -0.009 0.002 -0.010 -0.009
(0.489) (0.254) (0.147) (0.935) (0.679) (0.688) Liquidity ratio -0.067*** -0.076*** -0.058*** -0.159*** -0.180*** -0.134***
(<0.001) (<0.001) (<0.001) (<0.001) (<0.001) (<0.001) Sales growth -0.027*** -0.024*** -0.024*** -0.050*** -0.041*** -0.044***
(<0.001) (<0.001) (<0.001) (0.001) (0.008) (0.003) Industry-adjusted ROA -0.041** -0.043** -0.042** -0.161** -0.168** -0.164***
(0.037) (0.043) (0.021) (0.012) (0.013) (0.007) Market-adjusted return 0.002 0.003 0.001 -0.005 -0.004 -0.007
(0.520) (0.428) (0.712) (0.459) (0.615) (0.205) Industry concentration -0.001* -0.001** -0.000 -0.004** -0.006*** -0.003*
(0.087) (0.023) (0.276) (0.023) (0.008) (0.062) Constant 0.258*** 0.269*** 0.199*** 0.837*** 0.836*** 0.675***
(<0.001) (<0.001) (<0.001) (<0.001) (<0.001) (<0.001) Year controls Yes Yes Yes Yes Yes Yes Industry controls Yes Yes Yes Yes Yes Yes Observations 25910 25910 25910 25910 25910 25910 Chi-square(2nd stage) 448.3 435.3 491.5 546.1 504.4 573.3 Prob< Chi-square(2ndstage) <0.001 <0.001 <0.001 <0.001 <0.001 <0.001 F-statistic(1st stage) 33.5 18.0 54.5 33.5 18.0 54.5 R-square(1st stage) 0.117 0.097 0.123 0.117 0.097 0.123

49
Table A4: Takeover likelihood as a function of index values after correcting for endogeneity – using only the IPO-year-based instrument.
This table corresponds to Table 4 in the main body of the paper. Table 4 in the main body of the paper presents the overidentified results using both instruments. This table shows the second stage coefficients from a linear probability model after instrumenting the G-index, E-index, and O-index variables using only the IPO-year-based instrument described in section 2.3 of the paper. In columns 1–3 (4–6) the dependent variable is set to 1 if the firm was acquired in the next year (five years). The control variables are described in Table 2 in the paper. p-values are shown in parentheses below the coefficients with significance at the 10%, 5%, and 1% levels noted using *, **, ***, respectively. Errors are robust to heteroskedasticity and are clustered at the firm level.
Using only the IPO-year-based instrument (1) (2) (3) (4) (5) (6)
(t+1) (t+1) (t+1) (t+1, t+5) (t+1, t+5) (t+1, t+5) G-index -0.005*** -0.028***
(0.010) (0.002) E-index -0.004 -0.035
(0.713) (0.390) O-index -0.007*** -0.034***
(0.005) (0.001) Firm size -0.009*** -0.011*** -0.009*** -0.029*** -0.037*** -0.027***
(<0.001) (<0.001) (<0.001) (<0.001) (<0.001) (<0.001) Leverage 0.016 0.017* 0.015 0.110*** 0.116*** 0.105***
(0.109) (0.094) (0.134) (<0.001) (<0.001) (<0.001) Market to book -0.003* -0.002 -0.003* -0.012* -0.011* -0.011*
(0.098) (0.107) (0.095) (0.078) (0.086) (0.074) Property ratio -0.012** -0.015*** -0.013** -0.013 -0.025 -0.014
(0.029) (0.007) (0.025) (0.555) (0.225) (0.499) Liquidity ratio -0.057*** -0.054*** -0.055*** -0.141*** -0.133*** -0.130***
(<0.001) (<0.001) (<0.001) (<0.001) (<0.001) (<0.001) Sales growth -0.022*** -0.020*** -0.022*** -0.041*** -0.032** -0.040***
(0.001) (0.001) (0.001) (0.003) (0.020) (0.003) Industry-adjusted ROA -0.043** -0.044** -0.043** -0.167*** -0.172*** -0.166***
(0.015) (0.011) (0.014) (0.006) (0.004) (0.005) Market-adjusted return 0.001 0.001 0.001 -0.007 -0.008 -0.008
(0.767) (0.858) (0.808) (0.228) (0.166) (0.160) Industry concentration -0.001 -0.000 -0.000 -0.004** -0.004** -0.003*
(0.208) (0.299) (0.299) (0.032) (0.042) (0.061) Constant 0.173*** 0.144*** 0.165*** 0.676*** 0.565*** 0.627***
(<0.001) (<0.001) (<0.001) (<0.001) (<0.001) (<0.001) Year controls Yes Yes Yes Yes Yes Yes Industry controls Yes Yes Yes Yes Yes Yes Observations 25910 25910 25910 25910 25910 25910 Chi-square(2nd stage) 524.2 542.4 521.6 578.9 574.6 585.1 Prob < Chi-square(2nd stage) <0.001 <0.001 <0.001 <0.001 <0.001 <0.001 F-statistic(1st stage) 140.3 39.2 208.5 140.3 39.2 208.5 R-square(1st stage) 0.157 0.104 0.176 0.157 0.104 0.176

50
Table A5: Takeover likelihood as a function of individual provisions after correcting for endogeneity
This table corresponds to Table 5 in the main body of the paper. See the Table 5 heading for a detailed explanation of the two equations and variables used in the 2SLS equations. The 2SLS LPM results presented in Table 5 are for the over-identified models using both the geography-based and IPO-year-based instruments. In this table the just-identified results are presented for comparison. *, **, and *** indicate statistical significance at the 10%, 5% and 1% level, respectively. Errors are corrected for heteroskedasticiy and are clustered by firm.
Just-identified model (Geography IV)
Just-identified model (IPO-year IV)
Over-identified model (both IVs)
Provision
LPM 2SLS First-stage F-
Statistic (Geography
IV)
LPM 2SLS Marg. Eff.
(Geography IV)
LPM 2SLS First-stage F-Statistic (IPO year
IV)
LPM 2SLS Marg. Eff. (IPO-year
IV)
LPM 2SLS First-stage F-
Statistic (Geography
and IPO-year IV)
LPM 2SLS Marg. Eff.
Anti-greenmail 278.863 -0.022*** 36.918 -0.090*** 156.603 -0.027***
Blank check 2.150 0.087 75.211 0.037 38.368 0.038
Classified board 0.158 -0.811 8.117 -0.010 4.129 -0.017
Compensation plans 0.769 -0.405 0.779 -0.076 0.766 -0.203
Not Cumulative voting 62.431 0.024 15.639 0.108* 36.933 0.035**
Director indemnification 64.681 -0.031* 182.736 -0.034*** 122.747 -0.033***
Director contracts 7.424 0.027 35.031 -0.077** 18.987 -0.058*
Director liability 73.990 -0.020 704.996 -0.018*** 430.945 -0.018***
Directors' duties 82.601 -0.039*** 0.007 1.186 41.304 -0.039***
Fair price 134.078 -0.048*** 81.792 -0.048*** 112.707 -0.047***
Golden parachutes 0.022 -1.629 0.105 0.077 0.065 -0.209
Bylaws 3.800 -0.074 63.877 0.037 33.906 0.030
Charter 4.739 -0.236 2.781 0.048 2.859 -0.149
Cashouts 64.929 -0.029** 2.781 -0.385 32.579 -0.030**
Special meeting 30.921 0.005 117.451 0.023 74.202 0.019
Written consent 14.033 0.119** 183.649 0.025* 100.519 0.032**
Pension parachutes 3.473 -0.100 6.261 -0.148 4.312 -0.135
Business combination 157.112 -0.005 10.445 -0.082 82.135 -0.007
Poison pill 0.956 -0.083 4.323 -0.091 2.675 -0.090
Not secret ballot 0.529 -0.143 25.158 -0.042 12.83 -0.043
Executive severance 0.597 0.204 1.084 0.342 0.812 0.321
Silver parachutes 0.847 0.166 0.207 -1.673 0.563 -0.502
Supermajority 231.506 -0.039*** 72.786 -0.054*** 156.398 -0.042***
Unequal voting 2.185 0.601 0.346 0.994 1.349 0.712
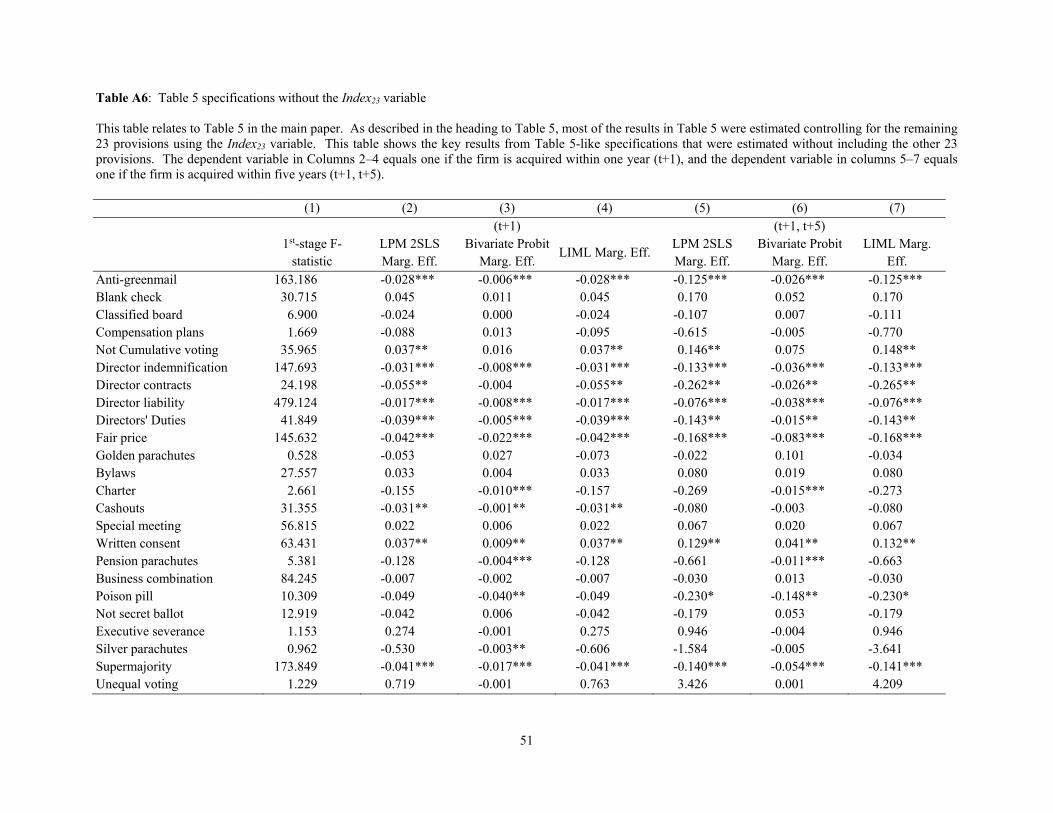
51
Table A6: Table 5 specifications without the Index23 variable This table relates to Table 5 in the main paper. As described in the heading to Table 5, most of the results in Table 5 were estimated controlling for the remaining 23 provisions using the Index23 variable. This table shows the key results from Table 5-like specifications that were estimated without including the other 23 provisions. The dependent variable in Columns 2–4 equals one if the firm is acquired within one year (t+1), and the dependent variable in columns 5–7 equals one if the firm is acquired within five years (t+1, t+5).
(1) (2) (3) (4) (5) (6) (7) (t+1) (t+1, t+5)
1st-stage F-statistic
LPM 2SLS Marg. Eff.
Bivariate Probit Marg. Eff.
LIML Marg. Eff. LPM 2SLS Marg. Eff.
Bivariate Probit Marg. Eff.
LIML Marg. Eff.
Anti-greenmail 163.186 -0.028*** -0.006*** -0.028*** -0.125*** -0.026*** -0.125*** Blank check 30.715 0.045 0.011 0.045 0.170 0.052 0.170 Classified board 6.900 -0.024 0.000 -0.024 -0.107 0.007 -0.111 Compensation plans 1.669 -0.088 0.013 -0.095 -0.615 -0.005 -0.770 Not Cumulative voting 35.965 0.037** 0.016 0.037** 0.146** 0.075 0.148** Director indemnification 147.693 -0.031*** -0.008*** -0.031*** -0.133*** -0.036*** -0.133*** Director contracts 24.198 -0.055** -0.004 -0.055** -0.262** -0.026** -0.265** Director liability 479.124 -0.017*** -0.008*** -0.017*** -0.076*** -0.038*** -0.076*** Directors' Duties 41.849 -0.039*** -0.005*** -0.039*** -0.143** -0.015** -0.143** Fair price 145.632 -0.042*** -0.022*** -0.042*** -0.168*** -0.083*** -0.168*** Golden parachutes 0.528 -0.053 0.027 -0.073 -0.022 0.101 -0.034 Bylaws 27.557 0.033 0.004 0.033 0.080 0.019 0.080 Charter 2.661 -0.155 -0.010*** -0.157 -0.269 -0.015*** -0.273 Cashouts 31.355 -0.031** -0.001** -0.031** -0.080 -0.003 -0.080 Special meeting 56.815 0.022 0.006 0.022 0.067 0.020 0.067 Written consent 63.431 0.037** 0.009** 0.037** 0.129** 0.041** 0.132** Pension parachutes 5.381 -0.128 -0.004*** -0.128 -0.661 -0.011*** -0.663 Business combination 84.245 -0.007 -0.002 -0.007 -0.030 0.013 -0.030 Poison pill 10.309 -0.049 -0.040** -0.049 -0.230* -0.148** -0.230* Not secret ballot 12.919 -0.042 0.006 -0.042 -0.179 0.053 -0.179 Executive severance 1.153 0.274 -0.001 0.275 0.946 -0.004 0.946 Silver parachutes 0.962 -0.530 -0.003** -0.606 -1.584 -0.005 -3.641 Supermajority 173.849 -0.041*** -0.017*** -0.041*** -0.140*** -0.054*** -0.141*** Unequal voting 1.229 0.719 -0.001 0.763 3.426 0.001 4.209

52
Table A7: Summary of the criteria for each provision’s inclusion in, or exclusion from, the D-index This table draws on the information from Table 5 in the paper as well as from Tables A5 and A6 in Appendix A and summarizes the statistical evidence used to decide which provisions to include in the D-index. LPM refers to linear probability models. 2SLS refers to two-stage-least squares. RBPM refers to recursive bivariate probit models. LIML refers to limited-information maximum likelihood models. Robustness tests refer to the tests reported in Tables A5 and A6.
Marginal Effect
Decision for inclusion in D-
index? Evidence for inclusion (exclusion) in D-index based on Table 5 and appendix Tables A5 and A6
Anti-greenmail - Include Strong IV and strong 2SLS, RBPM, and LIML results. Blank check Exclude Strong IV but not found to be significant in the 2SLS, RBPM, and LIML results. Classified board - Weak Include Lacking strong IV but no evidence of endogeneity and significant in some of the LPM results. Compensation plans + Include Lacking strong IV but no evidence of endogeneity and significant in LPM results Not cumulative voting + Include Strong IV and strong 2SLS results and LIML results. Director indemnification - Include Strong IV and strong 2SLS, RBPM, and LIML results. Director contracts - Include Strong IV and weak but consistent 2SLS results and LIML results. Additional support in robustness tests. Director liability - Include Strong IV and strong 2SLS results and LIML results. Directors' duties - Include Strong IV and strong 2SLS results and LIML results. Fair price - Include Strong IV and strong 2SLS results and LIML results. Golden parachutes + Include Lacking strong IV but no evidence of endogeneity and significant in LPM results Bylaws Exclude Not significant in tests
Charter Weak Exclude Lacking strong IV. Marginally significant in LPM results but sign on LPM results is opposite the 2SLS, RBPM, and LIML results. Given the difference in sign between the 2 significant results we left this out of the D-index.
Cashouts - Include Strong IV and strong 2SLS, RBPM, and LIML results. Special meeting Exclude Not significant in tests Written consent Include Strong IV and strong 2SLS, RBPM, and LIML results. Pension parachutes Weak Exclude Lacking strong IV and not significant in LPM results Business combination Exclude Not significant in tests Poison pill - Weak Exclude Lacking strong IV but significant in RBPM results. Also significant in some of the robustness tests. Not secret ballot Exclude Not significant in tests Executive severance Weak Exclude Lacking strong IV but no evidence of endogeneity and significant in some of the LPM results. Problems with data. Silver parachutes Exclude Lacking strong IV and not significant in LPM results Supermajority - Include Strong IV and strong 2SLS, RBPM, and LIML results. Unequal voting - Weak Include Lacking strong IV but no evidence of endogeneity and significant in LPM results