DO STRONGER EMPLOYMENT DISCRIMINATION …
123
DO STRONGER EMPLOYMENT DISCRIMINATION PROTECTIONS DECREASE RELIANCE ON SOCIAL SECURITY DISABILITY INSURANCE? EVIDENCE FROM THE U.S. SOCIAL SECURITY REFORMS Patrick Button, Mashfiqur R. Khan, and Mary Penn CRR WP 2021-7 April 2021 Center for Retirement Research at Boston College Hovey House 140 Commonwealth Avenue Chestnut Hill, MA 02467 Tel: 617-552-1762 Fax: 617-552-0191 https://crr.bc.edu Patrick Button is an assistant professor at Tulane University, a faculty research fellow at the NBER, and a research affiliate at the IZA Institute of Labor Economics. Mashfiqur R. Khan is an economist at Bates White Consulting. Mary Penn is a Ph.D. Candidate at Tulane University. The research reported herein was derived in whole or in part from research activities performed pursuant to a grant from the U.S. Social Security Administration (SSA) funded as part of the Retirement and Disability Research Consortium. The opinions and conclusions expressed are solely those of the authors and do not represent the opinions or policy of SSA, any agency of the federal government, Tulane University, NBER, IZA Institute of Labor Economics, Bates White Consulting, or Boston College. Neither the United States Government nor any agency thereof, nor any of their employees, make any warranty, express or implied, or assumes any legal liability or responsibility for the accuracy, completeness, or usefulness of the contents of this report. Reference herein to any specific commercial product, process or service by trade name, trademark, manufacturer, or otherwise does not necessarily constitute or imply endorsement, recommendation or favoring by the United States Government or any agency thereof. The authors thank Nicole Maestas, Kathleen Mullen, Matthew Rutledge, and Till von Wachter, seminar participants at the 2019 NBER Summer Institute, 2019 CELS conference, Tulane Law School, the 2020 SEA, and students in Button’s labor economics classes for helpful comments. They thank Allison Hewitt Colosky and Ashley Fondo for help with editing and proofing. The authors especially thank Alexander Strand for providing aggregated SSDI application and receipt data. © 2021, Patrick Button, Mashfiqur R. Khan, and Mary Penn. All rights reserved. Short sections of text, not to exceed two paragraphs, may be quoted without explicit permission provided that full credit, including © notice, is given to the source.
Transcript of DO STRONGER EMPLOYMENT DISCRIMINATION …
DO STRONGER EMPLOYMENT DISCRIMINATION PROTECTIONS DECREASE RELIANCE ON SOCIAL SECURITY DISABILITY INSURANCE?
EVIDENCE FROM THE U.S. SOCIAL SECURITY REFORMS
Patrick Button, Mashfiqur R. Khan, and Mary Penn
CRR WP 2021-7 April 2021
Center for Retirement Research at Boston College Hovey House
140 Commonwealth Avenue Chestnut Hill, MA 02467
Tel: 617-552-1762 Fax: 617-552-0191 https://crr.bc.edu
Patrick Button is an assistant professor at Tulane University, a faculty research fellow at the NBER, and a research affiliate at the IZA Institute of Labor Economics. Mashfiqur R. Khan is an economist at Bates White Consulting. Mary Penn is a Ph.D. Candidate at Tulane University. The research reported herein was derived in whole or in part from research activities performed pursuant to a grant from the U.S. Social Security Administration (SSA) funded as part of the Retirement and Disability Research Consortium. The opinions and conclusions expressed are solely those of the authors and do not represent the opinions or policy of SSA, any agency of the federal government, Tulane University, NBER, IZA Institute of Labor Economics, Bates White Consulting, or Boston College. Neither the United States Government nor any agency thereof, nor any of their employees, make any warranty, express or implied, or assumes any legal liability or responsibility for the accuracy, completeness, or usefulness of the contents of this report. Reference herein to any specific commercial product, process or service by trade name, trademark, manufacturer, or otherwise does not necessarily constitute or imply endorsement, recommendation or favoring by the United States Government or any agency thereof. The authors thank Nicole Maestas, Kathleen Mullen, Matthew Rutledge, and Till von Wachter, seminar participants at the 2019 NBER Summer Institute, 2019 CELS conference, Tulane Law School, the 2020 SEA, and students in Button’s labor economics classes for helpful comments. They thank Allison Hewitt Colosky and Ashley Fondo for help with editing and proofing. The authors especially thank Alexander Strand for providing aggregated SSDI application and receipt data.
© 2021, Patrick Button, Mashfiqur R. Khan, and Mary Penn. All rights reserved. Short sections of text, not to exceed two paragraphs, may be quoted without explicit permission provided that full credit, including © notice, is given to the source.
About the Steven H. Sandell Grant Program
This paper received funding from the Steven H. Sandell Grant Program for Junior Scholars in Retirement Research. Established in 1999, the Sandell program’s purpose is to promote research on retirement issues by scholars in a wide variety of disciplines, including actuarial science, demography, economics, finance, gerontology, political science, psychology, public administration, public policy, sociology, social work, and statistics. The program is funded through a grant from the Social Security Administration. For more information on the Sandell program, please visit our website at: https://crr.bc.edu/, send e-mail to [email protected], or call (617) 552-1762.
About the Center for Retirement Research
The Center for Retirement Research at Boston College, part of a consortium that includes parallel centers at the National Bureau of Economic Research, the University of Michigan, and the University of Wisconsin-Madison, was established in 1998 through a grant from the U.S. Social Security Administration. The Center’s mission is to produce first-class research and forge a strong link between the academic community and decision-makers in the public and private sectors around an issue of critical importance to the nation’s future. To achieve this mission, the Center conducts a wide variety of research projects, transmits new findings to a broad audience, trains new scholars, and broadens access to valuable data sources.
Center for Retirement Research at Boston College Hovey House
140 Commonwealth Ave Chestnut Hill, MA 02467
Tel: 617-552-1762 Fax: 617-552-0191 https://crr.bc.edu/
Affiliated Institutions: The Brookings Institution
Mathematica – Center for Studying Disability Policy Syracuse University
Urban Institute
Abstract
This paper examines spillovers onto Social Security Disability Insurance (SSDI) that
occurred due to the Social Security Amendments of 1983, which, among other changes,
gradually increased the retirement age for full benefits from 65 to 67. We determine whether the
spillovers onto SSDI were different in states with age and disability discrimination laws that
were broader (covered more people) or stronger (allowed for more damages for plaintiffs) than
the federal Age Discrimination in Employment Act and the Americans with Disabilities Act.
Our paper uses three sources of data: (1) counts of the universe of SSDI applications and
receipts by state, age group, sex, and year; (2) the Health and Retirement Study, merged with
restricted-access state identifiers; and, (3) the Health and Retirement Study, merged with
restricted access state identifiers and Social Security Administration Form-831 disability records.
To quantify the moderating impact of existing state laws on spillovers onto SSDI
applications, receipts and employment, we use a difference-in-differences approach, comparing
age cohorts who were affected by the reforms to similar age cohorts who were unaffected, and
then this comparing this affected-unaffected difference across states by state law. Using the
Health and Retirement Study data, we also conduct heterogeneity analysis to determine if effects
differed for different age groups (ages 55-61, ages 62-64, ages 65 to the full benefits retirement
age), those with or without disabilities, and by sex.
The paper found that:
• Spillovers to SSDI application and receipt occurred mostly at ages 55-61 rather and ages
closer to traditional retirement ages. These spillovers almost exclusively occurred for
those with disabilities only. The employment effects from the Social Security
Amendments instead affected those without disabilities and those closer to traditional
retirement ages more. Women faced larger spillovers to both SSDI application and
receipt and to employment.
• States with a medical definition of disability, which much more broadly covers
individuals by state employment discrimination laws compared to the restrictive federal
Americans with Disabilities Act, had reduced spillovers to SSDI application. In some
cases, this was also associated with reductions in SSDI receipt, but our strongest evidence
suggests just a decrease in SSDI applications.
• There is weak evidence that other broader or stronger features of state disability
discrimination laws reduce SSDI application and receipt.
• We do not find any clear moderating effect of disability discrimination laws on
employment.
• We do not find any moderating effect of broader or stronger features of state age
discrimination laws and SSDI application and receipt, but we do find evidence that these
features boost employment for those approaching traditional retirement age.
The policy implications of the findings are:
• A broader definition of disability under discrimination law, like the medical definition of
disability, seems to be associated with reduced SSDI applications. These foregone SSDI
applications, which we argue in the paper were likely unsuccessful, reduced costs both
for applicants and for SSA, given the large and indirect costs of SSDI application,
especially given the long wait times for a final decision.
• Other stronger and broader features of disability discrimination laws may also reduce
reliance on SSDI.
• There is not clear evidence that disability discrimination laws boost or reduce
employment, suggesting that they may not have a strong role in affecting employment
outcomes for individuals with disabilities and/or older workers.
Introduction
The Social Security Amendments of 1983 (SSA1983) made many significant cuts to the
Social Security program in the United States. SSA1983 increased the full retirement age (FRA),
the age at which individuals could retire with full Social Security benefits. The FRA increased
gradually from 65 to 67 for cohorts born in 1938 or later, based on a graduated scale that
increased for cohorts born later. SSA1983 also increased the penalty of claiming Old Age
Survivor Insurance (OASI) benefits before the FRA for cohorts born from 1938 or later. Table 1
shows how the SSA1983 increased the FRA and reduced OASI benefits at different retirement
ages, by year of birth. For example, for an eligible worker born in 1937 and unaffected by
SSA1983, the monthly OASI benefit was 20 percent lower each month if benefits were claimed
starting at age 62 relative to if claiming started at the FRA. However, for an eligible worker born
in 1943, who was affected by the SSA1983, the monthly OASI benefit was 25 percent lower at
age 62 than at the FRA.
This amendment meant a cut in benefits for people retiring at the previous FRA of 65 or
earlier, forcing individuals to choose between a cut in benefits or attempting to work longer to
delay retirement. The intention of SSA1983 was to increase employment and delay OASI
benefit claiming to achieve the program’s financial solvency in the long run. Standard labor
economic theory suggests that the SSA1983 did increase labor supply,1 and Neumark and Song
(2013), Behaghel and Blau (2012), and Song and Manchester (2007) document this empirically.
However, part of the reduction in spending for OASI benefits in the short run through
these reforms is offset by the spillover effects onto the Social Security Disability Insurance
(SSDI) program. For many older individuals, SSDI and OASI benefits are substitutes,2 making
SSDI relatively more generous after the cut imposed by the SSA1983, at all ages before reaching
the FRA for the affected cohorts. Li and Maestas (2008) document these spillovers, finding that
an average four month increase in the FRA for those born between 1938 and 1940 increases the
SSDI application rate by 0.04-0.30 percentage points, a moderate increase relative to the
application rate of 4.3 percent for the affected cohort. They find a much stronger effect, ranging
1 The SSA1983 reduces the expected discounted value of Social Security benefits, which is effectively a cut in benefits, leading to a negative income effect and an increase in labor supply under the realistic assumption that leisure is a normal good. See Neumark and Song (2013) for a more detailed discussion. 2 Since the incidence of disability rises with age (see, e.g., Ameri et al. 2018; Neumark, Song, and Button 2017), many older workers may be eligible or perceive that they are eligible for both programs.
from a 0.22 to a 0.89 percentage point increase, for individuals at or above age 62 and those with
work-limiting health problems. Duggan, Singleton, and Song (2007) find that 0.6 percent of men
and 0.9 percent of women between the ages of 45 and 64 enrolled in the SSDI program in 2005
due to the relative induced generosity of the SSDI program.
This paper explores whether stronger disability and age discrimination laws moderated
the spillover effects of SSA1983 on SSDI application and receipt. The intention of disability and
age discrimination laws is to improve employment of individuals with disabilities and older
workers by reducing employment discrimination. Disability discrimination laws have the added
requirement that employers provide “reasonable accommodations” to workers with disabilities.
These discriminatory protections and on-the-job accommodations are important for some older
individuals caught by the SSA1983 who become possible applicants for SSDI. Reducing
discrimination and improving on-the-job accommodations can increase hiring or employment or
reduce labor force exit and subsequent SSDI application. Thus, stronger discrimination
protections could reduce barriers to work for those close to retirement who are affected by the
SSA1983 and could also reduce spillovers onto SSDI.
To explore how disability and age discrimination laws affect spillovers to SSDI, we focus
on the differences in state discrimination laws, which are often stronger or broader than the
federal Americans with Disabilities Act of 1990 (ADA) (Long 2004; Neumark, Song, and Button
2017) and the federal Age Discrimination in Employment Act of 1967 (ADEA). Many state
laws are stronger or broader than the ADA or ADEA in three primary ways:
1) by lowering the burden of proof, relative to the ADA, for plaintiffs to establish
under law that they have a disability (“medical definition of disability”);
2) by covering employers with fewer than 15 employees (the minimum for the ADA to
apply) or 20 employees (ADEA), “lower firm size (disability),” “lower firm size
(age)”; and
3) by allowing plaintiffs to sue for more damages than allowed by the ADA or the
ADEA “larger damages (disability),” “larger damages (age).”
Using a difference-in-differences (DD) regression analysis, we estimate the effects of
these stronger and broader discrimination laws on SSDI application, SSDI receipt, and
employment. We compare cohorts affected and unaffected by SSA1983 in states with and
2
without discrimination law features, controlling for age. If, for example, SSDI application rates
are higher for those affected by the SSA1983 (as we and others document), but this effect is
weaker in states with stronger or broader discrimination laws, this suggests that these laws
decrease spillovers and reduce barriers to employment.
To quantify these effects in our DD, we use three sources of data: (1) aggregated counts
of the universe of SSDI applications and receipts by year, state, age cohort, and sex in the United
States, (2) the Health and Retirement Study (HRS) to quantify impacts on employment, and (3)
the HRS matched with Form-831 Social Security Administration (SSA) disability records to
quantify impacts on SSDI applications and receipts. While (1) provides a more precise
estimation of effects on SSDI applications and receipts by leveraging the universe of records,
rather than a sample, (3) allows us to explore heterogeneous effects on SSDI applications and
receipts by finer age cohorts and disability status.
This paper provides several contributions to the literature. First, the effect of disability
and age discrimination laws on labor market outcomes is still not yet clear. Theory suggests
ambiguous impacts of discrimination law on employment outcomes, as the laws could reduce
terminations by increasing firing costs and improving employer accommodations. However,
these increased costs could reduce hiring by making individuals with disabilities more expensive
to hire (Acemoglu and Angrist 2001). Empirical studies have not settled the question either, as
they often reach different conclusions. There is no clear consensus in the disability
discrimination law literature (see discussions in Button [2018]; Button, Armour, and Hollands
[2018a]) or the age discrimination law literature (see discussions in Neumark and Button [2014];
Neumark et al. [2019]). The literature on the effect of disability discrimination laws on older
workers is even less developed (Neumark, Song, and Button 2017; Neumark et al. 2019; Stock
and Beegle 2004).
The SSA1983 provides an important, exogenous source of variation to identify the effects
of these laws on labor market outcomes and SSDI application and receipt. The SSA1983 affects
older workers uniformly in a way that is not correlated with existing state laws. Therefore, we
avoid the possible endogeneity of discrimination laws, which could have been a problem in prior
work, such as studies that just exploit federal law changes (e.g., Acemoglu and Angrist 2001),
the adoption of state laws over time (e.g., Beegle and Stock 2003; Button 2018; Stock and
Beegle 2004) or, worse, conduct a cross-sectional comparison of outcomes by state laws (e.g.,
3
Neumark, Song, and Button 2017). If state laws are endogenous, this can lead to biased
estimates of their impact (Besley and Case 2000).3
Our research design allows us to identify the effects of the SSA1983 using a more
realistic control group than in much of the prior literature. Many studies (e.g., Acemoglu and
Angrist 2001; DeLeire 2000, 2001) use control groups (e.g., individuals with vs. without
disabilities) that violate parallel trend assumptions because the groups have significantly
different trends (Button 2018; Mora and Reggio 2019). For our study, we can use more similar
cohorts, those affected (cohorts born 1938-1951) and unaffected (1931-1937) by the SSA1983,
controlling for age, which provides for a control group that is more likely to have similar trends.
We go beyond this by comparing the affected and unaffected cohorts across states by existing
state law, thus controlling for any differences in trends between these two groups. Our
assumption to identify an unbiased causal effect of state laws is that the age-specific trend
difference between affected and unaffected cohorts does not vary by existing state law. This is a
much weaker assumption than in much of the previous literature that studies the effects of
discrimination laws on labor market outcomes.
Second, we know very little about how disability and age discrimination laws affect the
application and receipt of SSDI.4 Our paper provides evidence of the effectiveness of important
labor demand-side policies that could reduce the spillover effects of the Social Security reforms
and otherwise reduce employment barriers and help alleviate strain on the Social Security Trust
Fund. This is critical because the combined OASI and DI funds are projected to be exhausted by
2035 as the population continues to age, leading to increased withdrawals from the fund in the
form of a higher caseload for OASI and SSDI (Board of Trustees 2017, 2020).
Background on Social Security Programs
Social Security Amendments of 1983 (SSA1983)
Since 1975, the Old-Age, Survivors, and Disability Insurance (OASDI) program
expenditures exceeded the existing law’s revenues. It was anticipated that, without any
3 For example, if states are more likely to adopt stronger discrimination laws when protected groups fare worse, this negatively biases the estimated impact of these laws. 4 To our knowledge, the only study to look at how disability discrimination laws affect SSDI is Jolls and Prescott (2004), who analyzed this briefly in their NBER working paper. However, there is some related work on how age discrimination laws affect claiming OASI (Neumark and Song 2013).
4
legislative changes to the program, it would have been impossible to pay the OASDI cash
benefits on time, beginning in July 1983. To deal primarily with the short-and long-term
financial challenges faced by the OASDI program, the SSA1983 was signed into law on April
20, 1983. This law made sweeping changes in Social Security coverage, financing, and benefit
structure. The changes brought about by this law include an increase in the payroll tax rate,5
expansion of the program to some federal government employees,6 and an increase in the
actuarial adjustment factors beyond the FRA, increasing the benefit of retiring after the FRA
(Svahn and Ross 1983).7 Perhaps the most significant change was a maximum of a two-year
increase in the FRA and a corresponding increase from 20-30 percent in the penalty for claiming
OASI benefits at the early retirement age of 62.
As we show in Table 1, these reductions in OASI benefits' generosity were phased in
gradually and occurred in two main stages. Individuals born in 1937 or earlier were unaffected
by the change. The FRA then increased in two-month increments by subsequent birth cohort
until reaching 66 for those born in 1943. For individuals born between 1943 and 1954
(inclusive), the FRA remained 66 years until again increasing in two-month increments from the
1955-1960 cohorts. Along with this change, the proportion of full benefits that individuals could
receive at the early retirement age of 62 fell from 80 percent for those born in 1937 to 75 percent
for those born between 1943 and 1954, and to 70 percent for those born in 1960 or later.8 While
these amendments changed the OASI benefit structure, they did not change the benefit structure
of the SSDI program, leading SSDI to be relatively more generous for some affected older
workers.
5 SSA1983 increased the Social Security tax rates, which included the Hospital Insurance tax rates, for employers and employees from 7.0 percent in 1984 (subject to a credit of 0.3 percent to employees) to 7.65 percent in 1990 and thereafter. 6 SSA1983 added the following groups under the Social Security system: (i) all federal employees hired on or after January 1, 1984; (ii) employees of the legislative branch not participating in the Civil Service Retirement System on December 31, 1983; and (iii) all members of Congress, the president and the vice president, federal judges, and other political appointees of the federal government, effective January 1, 1984. 7 SSA1983 increased the delayed retirement credits gradually from 3 percent for workers reaching FRA before 1990 to 8 percent for workers reaching the FRA after 2008.8 This policy also changed the actuarial adjustment factors beyond the age of 62 from five-ninths of a percentage point per month to five-twelfths of a percentage point per month. This converted back to five-ninths of a percentage point 36 months before the full retirement age. Thus, a person born in 1943 could receive 75 percent of his or her PIA at the age of 62, 80 percent at the age of 63, 86.67 percent at the age of 64, 93.33 percent at the age of 65, and 100 percent at age 66.
5
Social Security Disability Insurance
The SSDI program is a social insurance program for workers with disabilities, with
eligibility conditioned on previous sufficient employment in jobs covered by Social Security.9 It
is a part of Social Security’s larger OASDI program. The SSDI program defines disability as the
“inability to engage in substantial gainful activity (SGA) by reason of any medically
determinable physical or mental impairment(s) which can be expected to result in death, or
which has lasted or can be expected to last for a continuous period of not less than 12 months.”10
An activity is considered “substantial” if it involves significant physical or mental exertion and
“gainful” if performed for pay or profit. SSA implements the definition of SGA by setting an
earnings threshold, which is adjusted over time. For example, in 2018, the earnings threshold
was $1,180 per month for nonblind individuals and $1,970 per month for blind individuals.11
Anyone earning over the threshold is considered engaging in SGA and is therefore disqualified
from participating in the SSDI program.
Individuals apply for SSDI benefits at their local field office, which screens out those
who are not currently insured (have insufficient work history covered by Social Security) or
engaging in SGA. These are labeled as “technical denials” and do not receive further review.
The remaining applications are forwarded to a state Disability Determination Services (DDS)
office, where cases are assigned randomly to disability examiners for review. The disability
examiner makes the determination of disability using eligibility rules and medical and vocational
criteria laid out in the code of federal regulations. The rejected applicants at the DDS level are
then entitled to a series of appeals.12 The applicants can bring in new information to each level
of appeals to make their case stronger. Because the appeal process can take months or
sometimes years, some applicants who appeal to the DDS rejection may simultaneously file a
new application to get final adjudication.
9 To qualify for SSDI, the required amount of labor force attachment depends on the age of disability onset. Generally, one needs to have worked 10 years, 5 of which need to be during the 10 years preceding the SSDI application year. Relatively younger workers may qualify with less work experience than this general rule. 10 Code of Federal regulation § 404.1505 at https://www.ssa.gov/OP_Home/cfr20/404/404-1505.htm (accessed September 13, 2018).11 DI 10501.015 - Tables of SGA Earnings Guidelines and Effective Dates Based on Year of Work Activity at http://policy.ssa.gov/poms.nsf/lnx/0410501015 (accessed August 2, 2018). 12 Reconsideration is the first stage, where the application returns to the original DDS to be reviewed by a different disability examiner. The application is then sent to the Administrative Law Judge, then to an Appeals Council, and finally to the federal court system.
6
In 2016, approximately 8.8 million individuals with disabilities received SSDI benefits.13
Among these beneficiaries, 4.5 million were men and 4.3 million were women. The average age
of beneficiaries was 54 years. Of the population ages 18–64, 4.7 percent received SSDI benefits
in 2016. The average cash benefit received was $1,171 in 2016 ($1,293 for men, $1,043 for
women), for a total of $11.3 billion across all beneficiaries. On average, two-thirds of the SSDI
applicants are denied benefits at the Disability Determination Services (DDS) office. In 2015
alone, 2.4 million individuals applied for SSDI and 1.5 million were denied at the DDS level.
However, a fraction of these denied applicants appeal their initial denial and get approved for the
benefits.
Literature Review
Social Security Programs
SSDI is a federal program, and the Social Security Act and the regulations implementing
it set up universal criteria to determine the disability status of someone who applies for SSDI
benefits. Historically, not only are there variations in the application rate for SSDI across states14
and over time, but there also are similar variations in the receipt rate of SSDI (McVicar 2006;
Stapleton et al. 1998). Much of the variations in application and receipt rates can be explained
by economic, health, and demographic factors (Coe et al. 2011; Gruber and Kubik 1997; Strand
2002). We contribute to this literature by incorporating state discrimination laws in explaining
the variations in SSDI application and receipt rates across states.
Both OASI and SSDI’s cash benefits are calculated based on earnings history (see Online
Appendix B for more details). The main difference between the OASI and SSDI benefit
calculations is that actuarial adjustment factors apply only to OASI when an individual between
age 62 and the FRA claims the benefit. The SSA1983 increased the FRA for cohorts born after
1937 and the penalty of claiming OASI benefits earlier than the FRA. Individuals may apply for
SSDI benefits up to their FRA, and there is no penalty in claiming the SSDI benefits earlier than
the FRA. The fact that SSDI benefits, unlike OASI benefits, are not subject to actuarial
13 This is 87 percent of awards to all SSDI beneficiaries, with the remaining 13 percent going to disabled widow(er)s and disabled adult children (Social Security Administration 2017). 14 In three states—Alaska, Hawaii, and Utah—the SSDI beneficiaries represent less than 3 percent of the state population. On the other hand, six states with the highest level of SSDI beneficiaries—7 percent or more of the state population—were Alabama, Arkansas, Kentucky, Maine, Mississippi, and West Virginia.
7
reduction makes SSDI application quite valuable to individuals who think that they are disabled
enough to qualify for SSDI.
The present value of OASI benefits at any given age is considerably lower for cohorts
affected by the SSA1983, and the reduction is greater for the cohorts with a higher FRA, making
SSDI relatively more generous than OASI for younger cohorts insured under both programs
(Duggan, Singleton, and Song 2007). Theoretically, this relative generosity provides greater
incentives for people who would have claimed the OASI benefits earlier than the FRA to apply
for and possibly enroll in the SSDI program.
As birth year and age are the key determinants in reducing the OASI benefits claimed
before the FRA, all else remaining the same, the incentive to apply for SSDI is higher for cohorts
born in more recent years and for those who are closer to the age of claiming OASI benefits (see
Table 1). Consequently, this incentive is proportionately greater at any given age for workers
born on or after 1938, depending on their FRA, compared to people born on or before 1937. As
a result, the incentive to apply for SSDI is proportionately greater for workers with higher FRA
at any age before their FRA. Duggan, Singleton, and Song (2007) and Li and Maestas (2008)
provide empirical evidence that the SSA1983 did indeed increase the SSDI application and
receipt of workers affected by the law. Our paper contributes to this literature by providing
evidence of differential spillover effects of the SSA1983 on SSDI programs across states due to
the variations in state discrimination laws.
Effects of Employment Discrimination Laws
There are three lines of related literature on the effects of discrimination laws on labor
market outcomes. First, there is literature on the effect of disability discrimination laws on labor
market outcomes, and sometimes SSDI claiming, for individuals with disabilities. Second, there
is a larger literature on the effect of age discrimination laws on labor market outcomes and
retirement for older workers. Third, there is a small but growing literature on the effect of
disability discrimination laws on older workers' labor market outcomes. Also related are
discrimination laws covering other groups, summarized by Button (2018).
Broadly speaking, the research on the effects of discrimination laws on labor market
outcomes does not come to a clear conclusion. Theory suggests mixed impacts, where
discrimination laws could reduce terminations but reduce hiring (Bloch 1994). For disability,
8
laws could also improve workplace accommodations, increasing productivity and tenure of
employees, but the hiring disincentive could be larger (Acemoglu and Angrist 2001). The
empirical literature also finds mixed impacts, although most studies find effects that lean positive
or non-negative. We summarize each of these types of literature in depth in Online Appendix A
and provide summary tables for all the studies (Online Appendix Tables A1, A2, and A3).
Data
Disability Discrimination Laws
We use a database of state disability discrimination laws first created by Neumark, Song,
and Button (2017) and then updated by Neumark et al. (2019). The creation of this database
required extensive background research on statutes in states and D.C.,15 and their histories
(primarily found through Westlaw), acts that amended these statutes (primarily found using Hein
Online), and many other sources (e.g., case law, secondary sources, law journal articles, state
offices). See Neumark et al. (2019), and especially its online appendix, for a more detailed
discussion of how these laws were coded.
This database includes three dimensions of how state disability discrimination laws are
broader or stronger than the federal ADA: “medical definition of disability,” “lower firm size
(disability),” and “larger damages (disability).” Table 2 shows how these characteristics of
disability discrimination laws vary by state and how we code these laws into indicator variables.
First, and most importantly, some states have a lower burden of proof to establish a disability
than under the definition of disability in the ADA, leading to increased coverage of disability
discrimination law in those states. These “medical definition” states define individuals with a
medically diagnosed condition to be disabled under the law, regardless of whether their condition
“substantially limits” a “major life activity.” Second, the ADA applies only to firms with at least
15 employees, but state laws often cover firms with fewer workers “lower firm size (disability).”
Third, many states also allow for plaintiffs to sue for more damages than the ADA, leading state
laws to have more bite than the ADA “larger damages (disability)” (Button, Armour, and
Hollands 2017a,b; Neumark, Song, and Button 2017; Neumark et al. 2019). Below we
15 For our analysis purposes, we consider D.C. to be a "state" since it has similar discrimination laws as the 50 other states, and all our data is also available for D.C. This follows the approach of similar studies that examine state laws (e.g., Neumark and Song 2013; Neumark, Song, and Button 2017).
9
summarize this legal variation, and we refer the reader to Neumark et al. (2019) for more
information.
Medical Definition of Disability. The federal disability discrimination in employment
law, Title I of the Americans with Disabilities Act of 1990 (effective July 1992), is significantly
less broad in its coverage compared to employment discrimination laws covering other groups.16
This stems from a narrow definition of disability. For plaintiffs to establish that they have a
disability under the ADA, and to thus even have a prima facie case that can go forward, they
must meet one of the three definitions of disability in the ADA:
“The term ‘disability’ means, with respect to an individual, (A) a physical or mental
impairment that substantially limits one or more major life activities17 of such
individual; (B) a record of such an impairment; or (C) being regarded as having such an
impairment.” (42 U.S. Code §12102 (1))
The difficulty for plaintiffs was proving that the condition was “substantial.” The burden
of proof for “substantially limits” was high, leading plaintiffs to have their cases effectively
thrown out because they did not meet the standard (Burgdorf 1997; Colker 1999).
Four states (Connecticut, Illinois, New Jersey, and New York) have a broader definition
of disability whereby individuals are considered disabled under state law if they have a
diagnosed medical condition.18 This is irrespective of if the condition “substantially limits” a
“major life activity, thus significantly lowering the burden of proof for individuals in these states
to be covered by state disability discrimination law (Long 2004; Neumark, Song, and Button
2017).
16 Title VII of the Civil Rights Act of 1964 (race, color, religion, sex, national origin) and the Age Discrimination in Employment Act of 1967 (age).17 Major life activities were not defined in the ADA but were defined later in guidance documents provided by the EEOC. However, these evolved over time, and the Supreme Court even weighed in on if the EEOC even had the mandate to define major life activities. See Button, Armour, and Hollands (2017a) for a detailed discussion. 18 As of May 2007, Washington also had a medical definition of disability, but we do not include Washington in this list since it does not provide identification in our regression models given the data that we use. California and Minnesota also have a lower burden of proof to provide disability. See Button (2018). For California, it established this new definition of disability in 2001, which does not provide identification given our data. However, we do a robustness check where we include Minnesota with the medical definition states. These results are similar but a bit weaker, reflecting that Minnesota's definition is not as broad. See Online Appendix Table D9.
10
Lower Firm Size Minimum (Disability). The ADA covers firms with at least 15
employees. As Table 2 shows, 34 states as of 1992 had disability discrimination laws with firm
size minimums lower than 10, 25 states that are lower than 5, and 15 states that cover all
employees regardless of firm size. The smaller firm size matters since older workers are more
likely to work at smaller firms.19 Following previous studies (Neumark, Song, and Button 2017;
Neumark et al. 2019), in our analysis, we create an indicator variable equal to 1 if the firm size is
less than 10, 0 otherwise, and compare states with a firm size of less than 10 versus greater than
10.
Larger Damages (Disability). There is also variation in damages available under state
law. Many states allow more damages than the capped sum of compensatory and punitive
damages that are allowed under the federal ADA, which range from $50,000-$300,000,
depending on firm’s size.20 Following Neumark, Song, and Button (2017) and Neumark et al.
(2019), we deem states to have “larger damages (disability)” if they have damage caps that
exceed the ADA, or allow uncapped punitive damages, as punitive damages are likely to drive
large judgments. As shown in Table 2, 13 states, as of 1992, allow larger damages than the
ADA.
Age Discrimination Laws
We use the age discrimination laws as determined and coded by Neumark and Song
(2013). While there are several dimensions of state laws, the important two that the literature
focuses on (Neumark and Button 2014; Neumark and Song 2013; Neumark et al. 2019) are the
availability of damages and the firm size minimum. The idea behind both is like their
counterparts for disability, but they differ in realization.
Lower Firm Size Minimum (Age). Firm size operates similarly, except that the federal
ADEA covers only firms with at least 20 employees, while the ADA covers firms with at least
15 employees. As shown in Table 2, 46 states with a lower firm size than the ADEA, 36 states
with a firm size less than 15, 35 less than 10, 26 less than 5, and 16 that cover all firms. The firm
19 See discussion in Neumark and Song (2013) and Neumark and Button (2014, footnote 11). 20 15–100 employees ($50,000), 101–200 employees ($100,000), 201–500 employees ($200,000), and 500 or more employees ($300,000).
11
size for age and disability tends to match since both often are in the same statute, but this is not
the case for nine states as of 1992.21
Larger Damages (Age). Damages available are different for age laws. Instead of caps on
compensatory and punitive damages, as in the ADA, the ADEA does not allow compensatory or
punitive damages. It allows for back pay and benefits—and double this amount (“liquid
damages”) if there is willful violation (Neumark and Song 2013). We follow Neumark and Song
(2013) and deem any state that allows compensatory or punitive damages as having “larger
damages (age).” As shown in Table 2, 27 states have larger damages for age discrimination law
as of 1992. More states have larger damages for age than for disability because of the restrictive
way that damages are treated in the ADEA. Because of this, the overlap for damages for age and
disability under state laws is much lower than it is for firm size.22
Aggregated SSDI Application and Receipt Data
We use aggregated SSDI application and receipt data from the Form-831 disability
records, generated at state Disability Determination Services (DDS) offices and provided to us
by the Social Security Administration.23 This SSA data includes the universe of the yearly total
number of applications and receipt of SSDI for each state by sex and age cohorts (age 45–49,
50–54, 55–59, and 60– 64) from 1992 to 2013. Using the year and age cohort information, we
categorize individuals as either being affected by SSA1983 or unaffected by SSA1983.24
21 Since we use the less than 10 cutoff, as in the previous literature, to group states into categories based on minimum firm size, there are 7 states where their disability and age firm size minimums cause them to fall into different categories: Arkansas (disability = 9, age = no law), Georgia and Indiana (disability = 15, age = 1), Illinois (disability = 1, age = 15), Kentucky and Louisiana (disability = 15, age = 8), and South Dakota (disability = 1, age = no law). 22 Eighteen states have larger damages for disability, but not age, 3 states that have larger damages for age, but not disability, 10 states that have larger damages for both, and 20 states that have no larger damages. 23 We thank Alexander Strand for providing the aggregated SSDI application and receipt data. 24 For example, the SSDI application and receipt data for the age cohort 55–59 and year 1992 represent the data for the birth cohorts of 1933–1937, which are a part of the cohorts unaffected by the SSA1983. Age cohort 55–59 and the year 1997 represent the application and award information of birth cohorts of 1938–1942, who are a part of the cohorts affected by the SSA1983.
12
State-by-Year Demographic and Economic Variables
We use the Current Population Survey (CPS) Annual Social and Economic Supplement
(ASEC) (Flood et al. 2018) to get population estimates by sex, state, and age cohort from 1992-
2013. We generate SSDI application and receipt rates by dividing the number of SSDI
applications and receipts, respectively, by the sex and age cohort-specific population in each
state from 1992–2013.
We also use the CPS ASEC to generate state- and year-specific population estimates by
age cohort and sex, estimates of labor force participation rates, unemployment rates, proportion
African American/black in the working-age population, proportion Hispanic in the working-age
population, the proportion of the population who have completed a high school education, the
proportion of population reporting a work-limiting disability, and proportion of the population
work in the agriculture, mining, and construction industries.25 We use per capita disposable
personal income data in current dollars by state and year from the Bureau of Economic Analysis
website.26 We use the Consumer Price Index (CPI) of all urban consumers from the Bureau of
Labor Statistics to generate real per capita disposable personal income in 2012 dollars.27
The Health and Retirement Study (HRS) and Form-831 Social Security Administration Disability Records
To complement the aggregated SSDI data, we also use data from the Health and
Retirement Study (HRS). The HRS is a nationally representative longitudinal household survey
that interviews Americans over the age of 50 every two years. We use 12 waves of data in 1992-
2014. We primarily use the RAND HRS version P data (Bugliari et al. 2016). We complement
this data with additional variables from different HRS modules, downloaded directly from the
HRS website.28
The HRS also has data on employment, which allows us to test the mechanisms of how
state discrimination laws could impact spillovers onto SSDI. We can see if stronger or broader
25 The literature shows that these variables can explain half of the variation of the SSDI application and receipt rates across states (see, for example, Strand [2002]). 26 https://apps.bea.gov/iTable/index_regional.cfm (accessed August 21, 2018). 27 https://data.bls.gov/pdq/SurveyOutputServlet (accessed August 21, 2018). 28 https://hrs.isr.umich.edu/data-products (accessed August 11, 2018).
13
laws increase (decrease) employment and if this is associated with a decrease (increase) in SSDI
application or receipt.
Given that the HRS data is at the individual level (rather than the state-by-age cohort-by-
sex-by-year level as with the aggregated SSDI data) we can use the HRS data to better explore
heterogeneity by demographic factors, namely by disability status and more refined age cohorts.
However, this is at the cost of significantly reduced precision since the aggregated SSDI data
includes the universe of SSDI applications and receipts, while the HRS data is just a population-
representative sample.
To analyze SSDI application and receipt using the HRS data, we combine the public HRS
data files with the SSA’s administrative Form-831 disability records. The Form-831 data allows
us to determine if and when HRS respondents applied for or received SSDI, allowing us to make
similar SSDI application and receipt variables as we do with the aggregated SSDI data. Our
combined HRS-Form-831 data covers eleven waves of data from 1992-2012. For more
information on this Form-831 data, see Online Appendix B.29
We code individuals in the HRS as having a disability using two different measures. This
is important since there are numerous types of disabilities and different classifications have pros
and cons.30 First, we use the work-limiting measure of disability. Individuals have a work-
limiting disability if they answer “yes” to having any impairment or health problem that limits
the kind or amount of paid work. Second, we use the Activities of Daily Life (ADL) limitations
measure of disability. Under this measure, we consider individuals to have a disability if they
report one or more ADL limitations.
Summary Statistics
Table 3 presents summary statistics for the aggregated SSDI application and receipt data,
and Online Appendix Table B1 presents summary statistics for the associated CPS ASEC
controls. Across all states and D.C. (Column [1]), the SSDI application rate is 1.33 percent per
year, and the SSDI receipt rate is 0.72 percent per year. Notably, SSDI application rates are
29 The SSA Form-831 file data is not publicly available as it contains sensitive, confidential information of applicants. It is available for the HRS respondents as restricted use data, which can be accessed through the virtual desktop infrastructure (VDI) system from a secure data enclave maintained by the Michigan Center for the Demography of Aging (MiCDA). More information about the data access can be found here: https://hrs.isr.umich.edu/data-products/restricted-data/available-products/9695 (accessed September 15, 2018). 30 See earlier discussion under the subsection “Disability discrimination laws and individuals with disabilities.”
14

lower in states with a medical definition of disability (1.18 percent, Column [2]), compared to
states without any broader or stronger disability discrimination laws (1.44 percent), although the
difference is much smaller for receipt (0.70 percent versus 0.73 percent). States also differ in the
control variables, which are correlated with SSDI program use according to the previous
literature (Coe et al. 2011; Gruber and Kubik 1997; Strand 2002). Online Appendix B2 presents
a similar table with similar results to Table 3, but using the HRS matched with Form-831
disability records data.
Table 4 presents summary statistics for any employment, work-limiting disability status,
and ADL limitation status from the HRS data by state age and disability discrimination laws.
For the entire sample, the employment rate is 61.3 percent, 23.7 percent have a work-limiting
disability, and 63.0 percent have at least one ADL limitation. Online Appendix Table B3
presents summary statistics for control variables from the HRS data.
Table 5 presents any employment rates by disability status for the HRS data. The rate of
any employment for the entire sample is 61.3 percent and varies significantly by disability status.
Those with (without) a work-limiting disability have an employment rate of 25.6 percent (72.4
percent). This disparity is smaller between those with (without) an ADL limitation: 54.4 percent
(73.1 percent).
Table 6 presents SSDI application and receipt rates from the HRS data matched with
Form-831 SSDI records by disability status. For the entire sample, the SSDI application
(receipt) rate is 1.17 percent (0.70 percent) for every two years. This varies significantly by
disability status. For those with (without) a work-limiting disability, their SSDI application rate
is 2.73 percent (0.69 percent). This difference is even larger for SSDI receipt: 1.89 percent
versus 0.32 percent, which is not surprising since those with disabilities would have a stronger
case for receiving SSDI. The differences in SSDI application and receipt rates by ADL
limitation is similar but less pronounced. Those with (without) an ADL limitation have an SSDI
application rate of 1.58 percent (0.49 percent) and an SSDI receipt rate of 0.97 percent (0.23
percent). We also see that those with a work-limiting disability have higher SSDI application
and receipt rates than those with an ADL limitation. This could indicate that work-limiting
disabilities may be more severe than having an ADL limitation, which seems right given its
lower incidence in the population and the fact that those who receive accommodations may not
15
report being work-limited (Kruse and Schur 2003). However, it may also reflect the economic
motive to apply for SSDI when disability limits work capacity.31
Methodology
Aggregated SSDI Application and Receipt Data
We first use SSDI application and receipt counts by state, year, age cohort, and sex. We
exploit state variation in the degree of disability (age) discrimination protections relative to the
ADA (ADEA) to identify the moderating effects of stronger or broader discrimination laws on
the spillover effects of SSA1983 for those of any sex of ages 50-64. Using a difference-in-
differences (DD) framework, we estimate the effects of stronger and broader discrimination laws
on SSDI application and receipt, based on the differences in SSDI application and receipt of
cohorts affected by SSA1983 and unaffected cohorts observed at the same age across states. Our
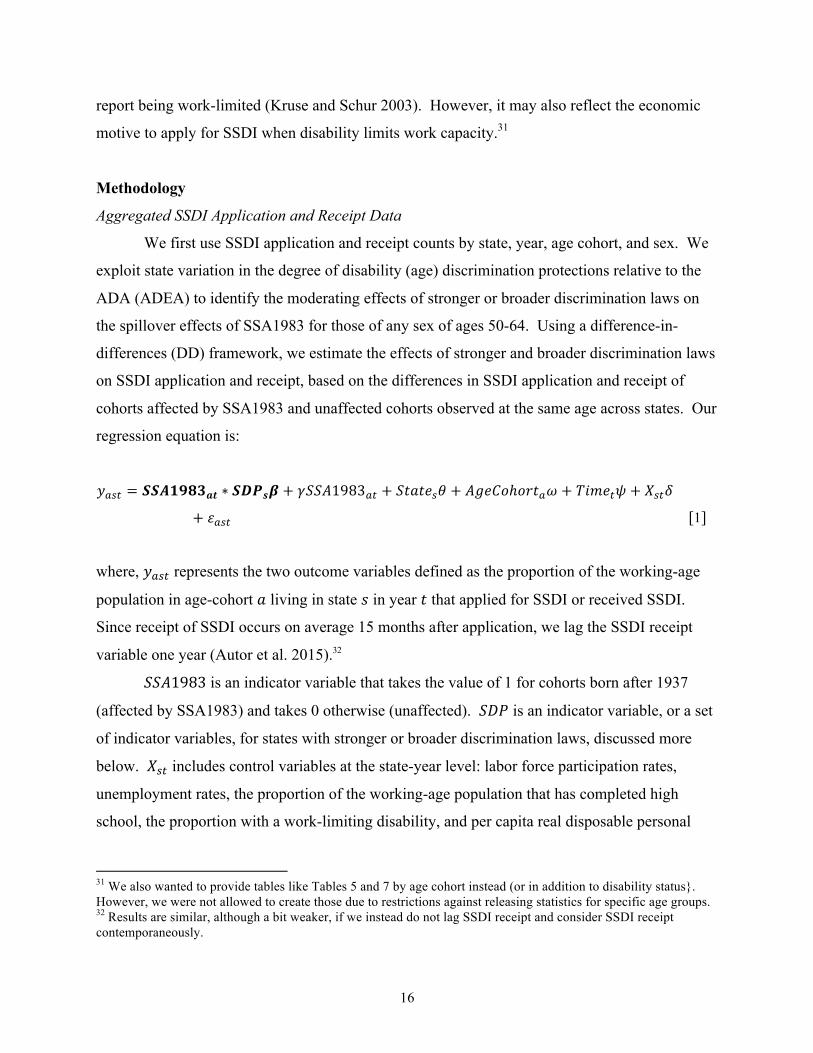
regression equation is:
�!"# = ��������� ∗ ����� + ����1983!" + �����!� + �����ℎ���!� + ����!� + �!"�
+ �!"# [1]
where, �!"# represents the two outcome variables defined as the proportion of the working-age
population in age-cohort � living in state � in year � that applied for SSDI or received SSDI.
Since receipt of SSDI occurs on average 15 months after application, we lag the SSDI receipt
variable one year (Autor et al. 2015).32
���1983 is an indicator variable that takes the value of 1 for cohorts born after 1937
(affected by SSA1983) and takes 0 otherwise (unaffected). ��� is an indicator variable, or a set
of indicator variables, for states with stronger or broader discrimination laws, discussed more
below. �!" includes control variables at the state-year level: labor force participation rates,
unemployment rates, the proportion of the working-age population that has completed high
school, the proportion with a work-limiting disability, and per capita real disposable personal
31 We also wanted to provide tables like Tables 5 and 7 by age cohort instead (or in addition to disability status}. However, we were not allowed to create those due to restrictions against releasing statistics for specific age groups. 32 Results are similar, although a bit weaker, if we instead do not lag SSDI receipt and consider SSDI receipt contemporaneously.
16
income. We include age-cohort fixed effects (AgeCohort), state fixed effects (State), year fixed
effects (Time). We cluster our standard errors at the state level.
� captures the DD estimate, which represents the change in the outcome variable for the
cohorts affected by the SSA1983 living in states with stronger or broader discrimination laws
compared to both the unaffected cohorts and the affected cohorts living in control states without
stronger or broader discrimination laws. Our key identifying assumption is that the trends in the
unobserved factors affecting the SSDI application and receipt of different cohorts do not
systematically vary across states based on their discrimination laws.
In our analysis, we start by examining state laws one at a time, following Neumark, Song,
and Button (2017). We first examine disability discrimination laws. In our main specifications,
the SDP indicator variable equals 1 for states with a broader or stronger dimension of disability
discrimination law (e.g., medical definition) and 0 for states with no stronger or broader
disability discrimination law features at all (i.e., no medical definition, no larger damages, and a
firm size greater than or equal to 10).33
Next, following Neumark, Song, and Button (2017), we include all three disability
discrimination law features in the same regressions. We then follow the same approach for age
discrimination laws, examining lower firm size, then larger damages, and then both at the same
time. Finally, we follow Neumark et al. (2019) and do a combined analysis with all disability
and age discrimination laws. Since the lower firm size for age and disability are very similar, we
follow Neumark et al. (2019) and create one indicator variable for whether either the age or
disability discrimination law has a firm size minimum of less than 10.
Health and Retirement Study Data
Average Spillovers of SSA1983 to SSDI and Employment. Before investigating state
discrimination laws, we first estimate the average spillovers to SSDI applications and receipt and
33 Our main specifications differ slightly from Neumark and Song (2013) and Neumark, Song, and Button (2017). Their indicator variable equals zero for states that do not have that specific legal feature, regardless of which other legal features the state has. Our default approach provides a cleaner comparison by having the control group (SDP = 0) exclude states with other stronger or broader legal features. As a robustness check, we re-estimate all our results (see Online Appendix Tables D1 and D2) with all states without the legal feature making up the control group. Our results are similar but slightly weaker. This is expected since our results show that stronger or broader laws reduce spillovers and adding states to the control group which have other stronger or broader laws leads to less of a difference between the treatment and control group.
17
effects on employment, induced by SSA1983. We start by estimating effects on the entire
sample (ages 55 to the FRA), then by age cohort (ages 55 to 61, ages 62 to 64, and ages 65 to the
FRA34), disability status, sex, and intersections of these groups. The general structure of these
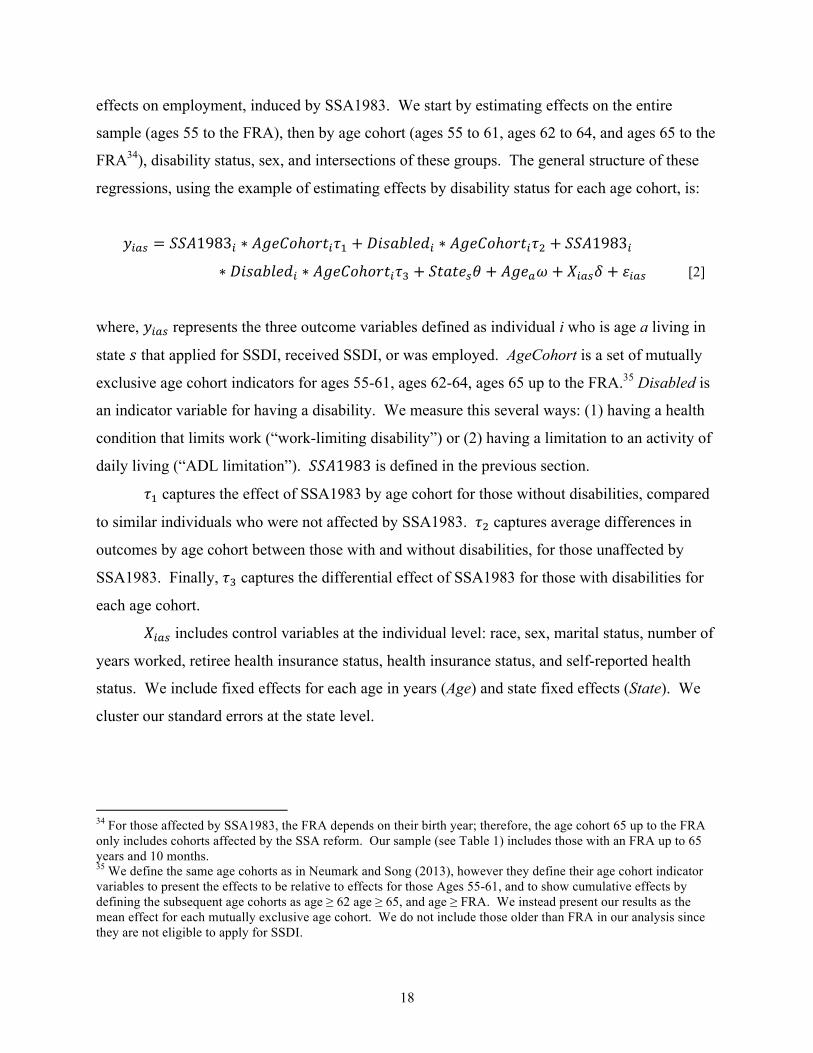
regressions, using the example of estimating effects by disability status for each age cohort, is:
�!"# = ���1983! ∗ �����ℎ���!�! + ��������! ∗ �����ℎ���!�! + ���1983! ∗ ��������! ∗ �����ℎ���!�! + �����!� + ���!� + �!"#� + �!"# [2]
where, �!"# represents the three outcome variables defined as individual i who is age a living in
state � that applied for SSDI, received SSDI, or was employed. AgeCohort is a set of mutually
exclusive age cohort indicators for ages 55-61, ages 62-64, ages 65 up to the FRA.35 Disabled is
an indicator variable for having a disability. We measure this several ways: (1) having a health
condition that limits work (“work-limiting disability”) or (2) having a limitation to an activity of
daily living (“ADL limitation”). ���1983 is defined in the previous section.
�! captures the effect of SSA1983 by age cohort for those without disabilities, compared
to similar individuals who were not affected by SSA1983. �! captures average differences in
outcomes by age cohort between those with and without disabilities, for those unaffected by
SSA1983. Finally, �! captures the differential effect of SSA1983 for those with disabilities for
each age cohort.
�!"# includes control variables at the individual level: race, sex, marital status, number of
years worked, retiree health insurance status, health insurance status, and self-reported health
status. We include fixed effects for each age in years (Age) and state fixed effects (State). We
cluster our standard errors at the state level.
34 For those affected by SSA1983, the FRA depends on their birth year; therefore, the age cohort 65 up to the FRA only includes cohorts affected by the SSA reform. Our sample (see Table 1) includes those with an FRA up to 65 years and 10 months. 35 We define the same age cohorts as in Neumark and Song (2013), however they define their age cohort indicator variables to present the effects to be relative to effects for those Ages 55-61, and to show cumulative effects by defining the subsequent age cohorts as age ≥ 62 age ≥ 65, and age ≥ FRA. We instead present our results as the mean effect for each mutually exclusive age cohort. We do not include those older than FRA in our analysis since they are not eligible to apply for SSDI.
18
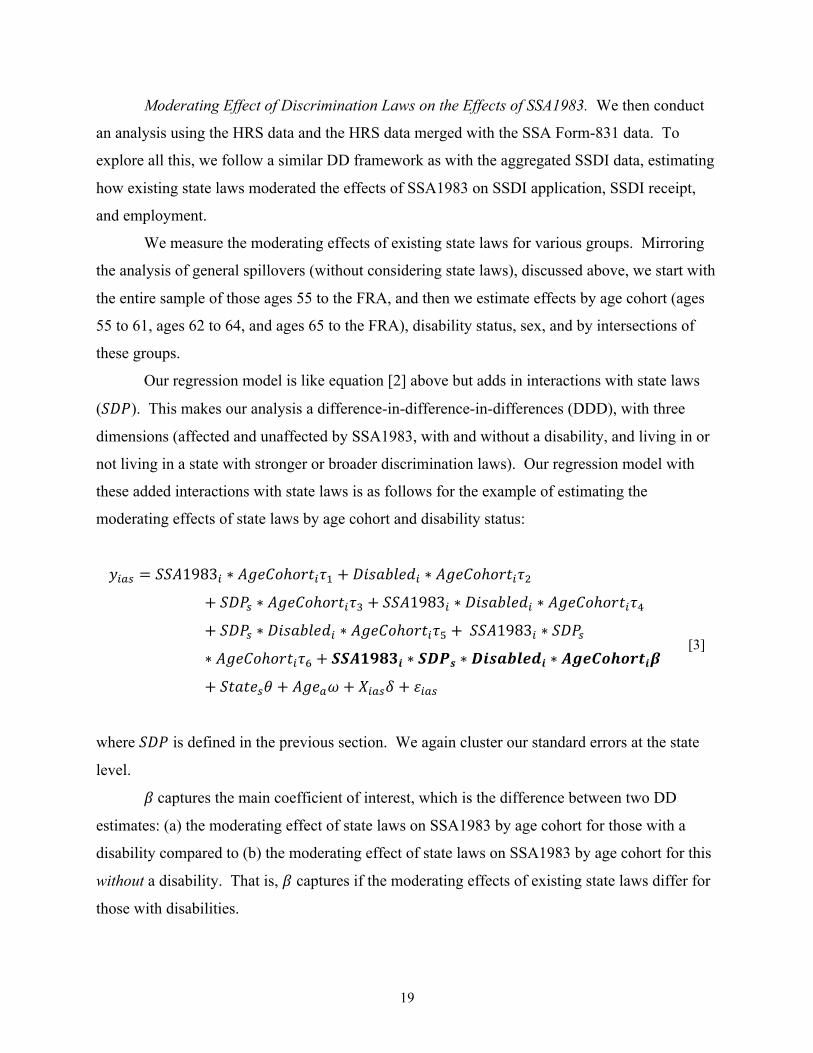
Moderating Effect of Discrimination Laws on the Effects of SSA1983. We then conduct
an analysis using the HRS data and the HRS data merged with the SSA Form-831 data. To
explore all this, we follow a similar DD framework as with the aggregated SSDI data, estimating
how existing state laws moderated the effects of SSA1983 on SSDI application, SSDI receipt,
and employment.
We measure the moderating effects of existing state laws for various groups. Mirroring
the analysis of general spillovers (without considering state laws), discussed above, we start with
the entire sample of those ages 55 to the FRA, and then we estimate effects by age cohort (ages
55 to 61, ages 62 to 64, and ages 65 to the FRA), disability status, sex, and by intersections of
these groups.
Our regression model is like equation [2] above but adds in interactions with state laws
(���). This makes our analysis a difference-in-difference-in-differences (DDD), with three
dimensions (affected and unaffected by SSA1983, with and without a disability, and living in or
not living in a state with stronger or broader discrimination laws). Our regression model with
these added interactions with state laws is as follows for the example of estimating the
moderating effects of state laws by age cohort and disability status:
�!"# = ���1983! ∗ �����ℎ���!�! + ��������! ∗ �����ℎ���!�!
+ ���! ∗ �����ℎ���!�! + ���1983! ∗ ��������! ∗ �����ℎ���!�!
+ ���! ∗ ��������! ∗ �����ℎ���!�! + ���1983! ∗ ���! [3]
∗ �����ℎ���!�! + �������� ∗ ���� ∗ ��������� ∗ �����������
+ �����!� + ���!� + �!"#� + �!"#
where ��� is defined in the previous section. We again cluster our standard errors at the state
level.
� captures the main coefficient of interest, which is the difference between two DD
estimates: (a) the moderating effect of state laws on SSA1983 by age cohort for those with a
disability compared to (b) the moderating effect of state laws on SSA1983 by age cohort for this
without a disability. That is, � captures if the moderating effects of existing state laws differ for
those with disabilities.
19
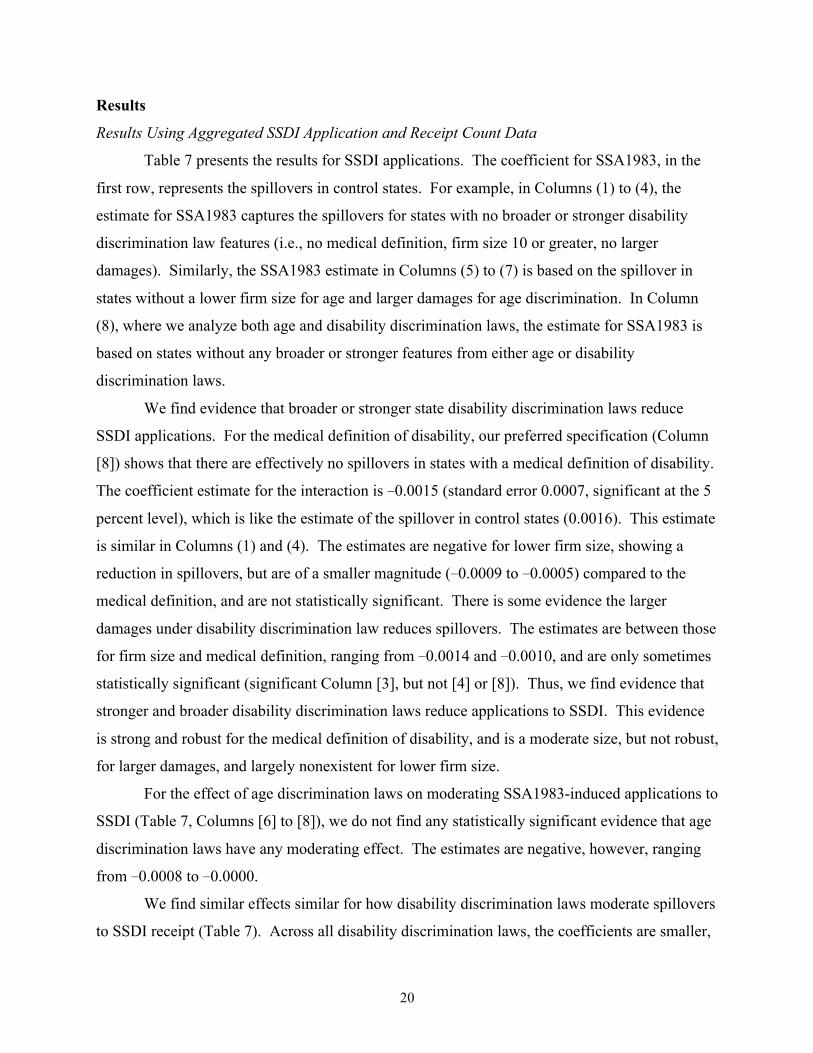
Results
Results Using Aggregated SSDI Application and Receipt Count Data
Table 7 presents the results for SSDI applications. The coefficient for SSA1983, in the
first row, represents the spillovers in control states. For example, in Columns (1) to (4), the
estimate for SSA1983 captures the spillovers for states with no broader or stronger disability
discrimination law features (i.e., no medical definition, firm size 10 or greater, no larger
damages). Similarly, the SSA1983 estimate in Columns (5) to (7) is based on the spillover in
states without a lower firm size for age and larger damages for age discrimination. In Column
(8), where we analyze both age and disability discrimination laws, the estimate for SSA1983 is
based on states without any broader or stronger features from either age or disability
discrimination laws.
We find evidence that broader or stronger state disability discrimination laws reduce
SSDI applications. For the medical definition of disability, our preferred specification (Column
[8]) shows that there are effectively no spillovers in states with a medical definition of disability.
The coefficient estimate for the interaction is −0.0015 (standard error 0.0007, significant at the 5
percent level), which is like the estimate of the spillover in control states (0.0016). This estimate
is similar in Columns (1) and (4). The estimates are negative for lower firm size, showing a
reduction in spillovers, but are of a smaller magnitude (−0.0009 to −0.0005) compared to the
medical definition, and are not statistically significant. There is some evidence the larger
damages under disability discrimination law reduces spillovers. The estimates are between those
for firm size and medical definition, ranging from −0.0014 and −0.0010, and are only sometimes
statistically significant (significant Column [3], but not [4] or [8]). Thus, we find evidence that
stronger and broader disability discrimination laws reduce applications to SSDI. This evidence
is strong and robust for the medical definition of disability, and is a moderate size, but not robust,
for larger damages, and largely nonexistent for lower firm size.
For the effect of age discrimination laws on moderating SSA1983-induced applications to
SSDI (Table 7, Columns [6] to [8]), we do not find any statistically significant evidence that age
discrimination laws have any moderating effect. The estimates are negative, however, ranging
from −0.0008 to −0.0000.
We find similar effects similar for how disability discrimination laws moderate spillovers
to SSDI receipt (Table 7). Across all disability discrimination laws, the coefficients are smaller,
20
ranging from −0.0012 to −0.0003, and statistically significant for lower firm size and larger
damages. Thus, there is some evidence to claim that disability discrimination laws reduced the
number of individuals receiving SSDI.
Given that we also find few effects of age discrimination laws on SSDI application, we
find few effects for SSDI receipt. These results are presented in Table 8. These estimates are
like those for SSDI application (Table 7), but in this case, there is some statistical significance.
We find a statistically significant effect (at the 10 percent level) for lower firm size in one case
(Column [7]), but the other two cases (Columns [5] and [8]) are not statistically significant.
Heterogeneous Effects by Sex on SSDI Application and Receipt
Our main estimates include women and men and cover affected cohorts of the age
cohorts 50–54, 55–59, and 60–64. We explore how our estimates may vary for these age cohorts
and by sex, although our ability to explore heterogeneous effects is much better with the HRS
data. Our analysis by sex is important since age discrimination varies by sex, as does the
effectiveness of age (and perhaps disability) discrimination laws.36 We also could find a greater
effect of discrimination laws on SSDI application and receipt for men because men in the HRS
sample are also more likely to meet the employment requirements to qualify for SSDI (Neumark
and Song 2013). However, we may find a greater impact of disability discrimination laws on
women because women are more likely to have a disability (Murtagh et al. 2004; O’Hara 2004).
We start by estimating effects separately for women and men. Most of the literature
investigating the effects of discrimination laws focuses on men only, while just a few studies
explore more in-depth age and sex intersectionality (Neumark and Button 2014; Lahey and
Beasley 2018; Neumark, Burn, and Button 2019; McLaughlin 2020). This turns out to
sometimes be important, especially if women face more age discrimination (Neumark, Burn, and
Button 2019; Lahey and Oxley 2018; Neumark et al. 2019) and age discrimination laws are less
able to protect older women (Burn et al. 2020; Button 2020; McLaughlin 2020).
36 Studies show that women experience a higher instance of age discrimination than men (Neumark, Burn, and Button 2019; Neumark et al. 2019). For this and other legal reasons, age discrimination laws also fail to protect against intersectional age discrimination against women (Burn et al. 2020; McLaughlin 2019; Burn et al. 2020). Thus, age discrimination laws may have a stronger impact on men than women (McLaughlin 2020). Women could also be less protected by disability discrimination laws if they face intersectional discrimination based on sex and disability status, for similar reasons, as discussed in the above-cited literature for age, but this has not been well explored.
21
Online Appendix Tables D1 and D2 present estimates for SSDI applications and receipts,
respectively, for men only, and Online Appendix Tables D3 and D4 present the same but for
women only. For men only, the estimates for how the medical definition of disability affects
SSDI application (Online Appendix Table D1) are still large in magnitude but are now less
precise than the pooled results in Table 7 and are now statistically insignificant. For men only,
there are no statistically significant interaction effects with state laws for SSDI application. For
SSDI receipt, there is some weak evidence of effects. Both lower firm size under the age and
disability discrimination laws have interaction effects that are significant at 10 percent level
(Columns [2] and [7]). However, these are not robust to the inclusion or exclusion of other laws.
For women, Online Appendix Table D3 shows that the magnitude of the effects of the
medical definition on spillovers to SSDI applications is similar for men. However, the estimates
for women are far more precise, leading to the coefficients in all three regressions to be
significant at the 1 percent level. Similarly, larger damages for disability also decrease SSDI
applications for women only, with larger and more precise coefficients than men only or the
pooled estimates. Two of these estimates are significant at the 1 percent level, while one is
significant at the 5 percent level. There is also weak evidence that the firm size for disability
matters for women only, via the statistically significant estimate in Column (2) (5 percent level),
but this is not robust to the inclusion of other laws (Columns [4] and [8]). Age discrimination
laws again do not affect spillovers.
For women only, there appear to be statistically significant effects on SSDI receipt. As
Online Appendix Table D4 shows, larger damages for disability lead to reductions in SSDI
receipt. The magnitude of the spillover reduction is roughly the same size as the spillover,
suggesting no spillover in these states. These estimates are statistically significant at the 5
percent level in all three cases. There is also evidence that lower firm size, under both age
(Column [7]) and disability (Column [2]) discrimination laws, reduces SSDI receipt for women,
which mirrors the pooled results (Table 8). However, these estimates are only significant at the
10 percent level and are not robust to the inclusion or exclusion of other laws in the regression.
Like the pooled results, the medical definition of disability has no statistically significant effect
on SSDI receipt, despite the large effect on applications.
We next estimate results without age cohort 50–54, thus including only age cohorts 55–
59 and 60–64, who are relatively more affected by SSA1983. Online Appendix Tables D5 and
22
D6 present the estimates for SSDI applications and receipts, respectively. These results are
generally similar and stronger. For SSDI application, the estimates are larger and more
statistically significant for the medical definition of disability and larger damages for disability.
However, the one estimate that was marginally statistically significant (10 percent level) for
lower firm size for disability in the main results (Table 7, Column [2]) is now not significant.
There are still no statistically significant effects of age discrimination laws outside of the same
marginally significant estimate (Column [7]) for the effects of firm size for age on SSDI receipt.
Robustness Checks
We conduct several robustness checks, considering other plausible specifications. We
present these results fully in Online Appendix D. To summarize, we check whether our results
vary based on the following:
1) Using a similar control group to as in Neumark, Song, and Button (2017), where all states
are included in the regressions for Columns (1), (2), (3), (5), and (6) rather than having
the control group only include states without any broader or stronger law features (Online
Appendix Tables E1 and E2).
2) Weighting the regression by the population of the state of age 50 and older (Online
Appendix Tables E3 and E4).
3) Dropping 2009 and 2010 from the analysis to remove possible effects from the Great
Recession (Online Appendix Tables E5 and E6).37
4) Removing the CPS ASEC control variables (Online Appendix Tables E7 and E8).
5) Rerunning the “medical definition of disability” results adding Minnesota, which also has
a broader (but not medical) definition of disability (Online Appendix Table E9).
Tables 9 and 10 summarize the main results for SSDI application and receipt, respectively,
and how robust they are based on these checks (excluding number 5 above) and the
heterogeneity analysis in Online Appendix C. For SSDI application, the results for the medical
definition of disability are somewhat robust, with 17 out of 22 possible estimates being
statistically significant at the 10 percent level and 13 out of 22 at the 5 percent level. Two
37 While the Great Recession officially occurred from December 2007 to June 2009, according to the NBER Business Cycle Dating Committee (see http://www.nber.org/cycles/cyclesmain.html, accessed September 29, 2018), the effects on the labor market were lagged (see Neumark and Button 2014). We chose to drop 2009 and 2010 for this reason, and because decisions around SSDI application may also come after these delayed labor market effects.
23
factors have a meaningful impact on the results. First, the statistical significance goes away for
men only due to increased standard errors (Online Appendix Table D1). Statistical significance
also decreases from 5 percent, 10 percent, and 5 percent (Columns [1], [4], and [8], respectively)
in Table 8 to 5 percent, insignificant, and insignificant when the CPS ASEC control variables are
removed (Online Appendix Table E7). These control variables are important in explaining SSDI
application, and thus removing them reduces precision. All other robustness or heterogeneity
checks have a smaller effect on the results. Since the main results (Table 7) are either significant
at the 5 percent level (2 out of 3 times) or the 10 percent level (1 out of 3), all the other
robustness checks often cause the estimates to change a bit, such that they move to 5 percent
from 10 percent or vice versa.
For larger damages, the results are much less robust. For example, only 5 out of 22
estimates are statistically significant at the 5 percent level. There appear to be results for larger
damages only when looking at the most affected subpopulations: women (Online Appendix
Table D3 and ages 55–64 (Online Appendix Table D5) rather than 50–64. There is almost no
evidence of effects for firm size (either age or disability) and larger damages (age).
For SSDI receipt, the results are much more marginally significant and less robust than
those for SSDI applications. For larger damages for disability, where there is the largest
evidence of effects, 6 out of 22 estimates are significant at the 5 percent level, and 12 are
significant at at least the 10 percent level. Thus, the evidence here that larger damages for
disability decreases spillovers onto SSDI receipt is not particularly strong, outside of the strong
and statistically significant effects for women only. There is similarly weak evidence of lower
firm size for disability decreasing spillovers, but this is even less robust: only 2 out of 22
estimates are significant at the 5 percent level, and only 7 are significant at at least the 10 percent
level. There are similarly only seven estimates that are significant at least the 10 percent level
for firm size for age, but no significance beyond that. Across all specifications and tables, no
estimates are statistically significant for the medical definition of disability or larger damages for
age.
Results for Health and Retirement Study and Form-831 SSA Data
Average Spillovers of SSA1983 to SSDI and Employment Changes, by Age Cohort. We
start by estimating the average spillover effects of SSA1983, ignoring, for now, the possible
24
moderating effects of existing state discrimination laws. Given that the effects of SSA1983 vary
by age (e.g., Neumark and Song 2013), we first estimate separate effects of SSA1983 for those
ages 55 to just before 62, 62 to just before 65, and 65 to just before their eligibility age for full
retirement benefits (the FRA). Table 11 presents the effects of SSA1983 on SSDI application
(Column [1]), SSDI receipt (Column [2]), and any employment (Column [3]). The youngest
cohort, ages 55-61, experience the largest effects on SSDI application and receipt, which
declines with age. Those ages 55-61 face an increase in SSDI applications of 0.00392
(statistically significant at the 1 percent level), which is a large 33.5 percent increase compared
to the mean rate of 0.0117 across all states and age groups. For SSDI receipt, this is 0.00292
(significant at the 1 percent level), a 42.0 percent increase compared to the mean rate. Those
ages 62-64 face an insignificant increase in SSDI applications of about a third of the magnitude
of those ages 55-61, although this group does face a decrease in SSDI receipt that is only slightly
smaller than for those ages 55-61: a decrease of 0.00225 (significant at the 5 percent level). For
those ages 65 to the FRA, the effects on SSDI applications and receipts are very close to zero.
However, they are imprecisely estimated, likely due to the smaller sample for this group.
For employment (Column [3]), the employment effects increase by age instead of
decreasing by age as we saw for SSDI application and receipt. For ages 55-61, employment
decreases by 3.10 percentage points (significant at the 1 percent level) but increases by 1.32 for
ages 62-64 (significant at the 10 percent level) and increases by a much larger 4.62 percentage
points (significant at the 5 percent level) for those ages 65-FRA.
Average Spillovers of SSA1983 to SSDI and Employment Changes, by Age Cohort and
Disability Status. Next, we consider if spillover effects from SSA1983 differ by disability status
in addition to age cohort, estimating separate effects for those with and without a disability.
Tables 12 and 13 present the effects of SSA1983 on SSDI application, SSDI receipt, and any
employment by age cohort and disability status. Those without a disability, measured either as
having a work-limiting disability or an ADL limitation, do not experience any statistically
significant spillovers onto SSDI application or receipt.
Looking at people with disabilities, we see that spillovers onto SSDI application and
receipt occurred for ages 55-61, regardless of the disability measure used. Individuals ages 55-
61 with a work-limiting disability (Table 12) who were affected by SSA1983 had an increased
25
rate of SSDI application (receipt) of 0.0108 (0.00861), statistically significant at the 5 percent
level. For those with an ADL limitation (Table 13), this was a somewhat smaller increase in
SSDI application (receipt) of 0.00870 (0.00709), statistically significant at the 1 percent level.
These are large increases relative to the rate of SSDI application and receipt for individuals with
disabilities in general.38 We may be finding a larger increase in SSDI applications and receipts
for those with a work-limiting disability because the rate of this disability is lower than the rate
of having an ADL limitation, suggesting that work-limiting disabilities are more severe than
ADL limitations. However, those with work-limiting disabilities may be more induced to apply
for SSDI due to SSA1983 because they have less work capacity.
We find smaller and often insignificant spillovers to SSDI application and receipt for
those ages 62-64 with disabilities. The only statistically significant effect for those ages 62-64 is
an increase in SSDI receipt of 0.00293 for those with an ADL limitation (significant at the 10
percent level).
Surprisingly, at ages 65-FRA, the SSA1983 induces a decrease in SSDI application of
0.00408 (work-limiting disability) or 0.00329 (ADL limitation), both statistically significant at
the 1 percent level. There is some evidence that this materializes into decreased SSDI receipt.
We find a decrease in SSDI receipt of 0.00308 for those with work-limiting disabilities (and a
smaller, statistically insignificant effect for those with an ADL limitation).
While those with disabilities faced more spillovers onto SSDI application and receipt,
they faced fewer changes in employment, relative to those without disabilities, due to SSA1983.
As shown in Column (3) of Tables 12 and 13, SSA1983 induces large increases in employment
for those ages 65-FRA without disabilities. However, there is either no effect (for those with
ADL limitations) or a negative effect (for those with work-limiting disabilities) on employment
for ages 65-FRA.
Average Spillovers of SSA1983 to SSDI and Employment Changes, by Age Cohort,
Disability Status, and Sex. We then explore how spillover effects from SSA1983 vary by sex in
addition to age cohort and disability status. In general, we find that women with a work-limiting
disability experience more spillovers than men to SSDI application and receipt (Online Appendix
38 For those with a work-limiting disability (ADL limitation), the rate of SSDI application is 0.0208 (0.0122), and the rate of SSDI receipt is 0.0144 (0.00744).
26
Tables I1) due to SSA1983, indicating that the results from our earlier pooled analysis appear
driven by women only. When we use the ADL limitation, we see fewer differences by sex
(Online Appendix Table I2). Using the work-limiting definition of disability, SSA1983 induced
more of an impact on employment for women than men. Again, these differences by sex are less
pronounced when we use the ADL limitation measure of disability.
In sum, the spillovers to SSDI applications and receipts due to SSA1983 are larger for
ages 52-61, decline with age, and are higher for women with disabilities. However, the
employment effects induced by SSA1983 instead increase with age: they are negative for those
ages 55-61, then are positive for those ages 62-64, and large and positive for those ages 65 to the
FRA. These employment effects are smaller for those with disabilities, with there being no
employment (or even a decrease) for individuals with disabilities of ages 65-FRA. We again,
however, find that women face stronger employment changes due to SSA1983 than men.
Moderating Effects of Laws on SSDI Applications and Receipts, and Employment, Entire
Sample. We now move to our main analysis: estimating possible moderating effects of state
discrimination laws on SSA1983 using the HRS data and the HRS matched with Form-831 data.
As we did for estimating the general spillovers, we build up to our primary results by age cohort
and disability status. We start by estimating the effects of SSA1983 for the entire sample of
those ages 55-FRA. We present our regression equation and results in Online Appendix F. We
find no statistically significant moderating effects of state laws.
Moderating Effects of Laws on SSDI Applications and Receipts, and Employment, by Age
Cohort. Next, we re-estimate these moderating effects of laws on SSA1983 by age cohort.
Online Appendix Tables G1 and G2 present these results for SSDI application and receipt,
respectively. We find virtually no moderating effects of existing state laws on SSDI application
for any age cohort. We find non-robust evidence, often only significant at the 10 percent level,
of effects on SSDI receipt, but these effects are of mixed sign.
However, for employment (Online Appendix Table G3), we see some effects for those
close to traditional retirement ages. This corresponds with our earlier result that those closer to
retirement ages faced employment increases due to SSA1983. For ages 62-64, we find that a
lower firm size for age discrimination and larger damages for age discrimination are associated
27
with increased employment. For this age group in states without stronger or broader age
discrimination laws, SSA1983 induces a decrease in employment of about 1.85 percentage
points, which is more than offset in states with stronger or broader age discrimination laws. This
result seems to mirror Neumark and Song (2013), who found that these age discrimination laws
increased employment differentially more for those affected by SSA1983.
For ages 65-FRA, we find some evidence that the medical definition of disability
increases employment by 6.0 percentage points. However, this estimate is statistically
significant only when including all disability discrimination laws (Column [4]) and not when
adding in age discrimination laws (Column [8]). We find an even stronger and robust effect of
larger damages for disability on employment: these are associated with an increase in
employment for between 10.0 and 11.9 percentage points, with all estimates significant at the 1
percent level. We generally do not find any evidence of moderating the effects of existing state
discrimination laws for ages 55-61.
Moderating Effects of Laws on SSDI Applications and Receipts, and Employment, by
Disability Status. We also estimate the moderating effects of laws by disability status only
before moving to estimate effects by age cohort and disability status. Online Appendix H
presents these results. We find weak evidence that the medical definition of disability is
associated with reduced SSDI application and receipt for those without work-limiting disabilities
(Online Appendix Tables H1 and H2). However, these results are not robust to using the ADL
limitation categorization of disability (Online Appendix Tables H4 and H5). We also find weak
evidence that a lower firm size for disability discrimination is associated with increased SSDI
application only for those without an ADL limitation. Outside of this, there are no notable
moderating effects of other state laws by disability status only.
Moderating Effects of Laws on SSDI Applications and Receipts, and Employment, by Age
Cohort and Disability Status. Finally, we move to our main estimates of the impact of SSA1983
by existing state disability and age discrimination laws, age cohort, and disability status. This
builds on our earlier results presented in Tables 12 and 143that the effects of SSA1983 differed
significantly based on the intersection of age and disability. While this analysis, splitting the
effects of SSA1983 by age cohort, disability status, and state, does cut the data relatively thin, we
28
find some moderating effects of state disability and age discrimination laws on the effects of
SSA1983.
We present these results in Tables 14 to 19. Given the number of interactions in these
regression models, we only present the key coefficient estimates that show the effects of
SSA1983 on individuals with disabilities. We start by presenting the effects of SSA1983 on
individuals with disabilities, by age cohort, in states without stronger or broader discrimination
laws (first three rows). Then, we show how these effects differ for those in states with stronger
or broader law features.
Table 14 presents effects on SSDI application using the work-limiting measure of
disability. We do not find any statistically significant moderating effects of any laws. However,
we find effects of some laws using the ADL limitation measure of disability instead (Table 15).
In our preferred specification that includes all state laws simultaneously (Column [8]), we find a
decrease in SSDI applications of 0.357 percentage points, significant at the 1 percent level, for
ages 65-FRA with an ADL limitation in states with the medical definition of disability. Across
all columns, the effect ranges between a decrease in SSDI application of 0.215 to 0.563
percentage points, with statistical significance ranging from the 10 percent to 1 percent level.
While the corresponding coefficients for those who are just slightly younger – ages 62-64 – are
larger in magnitude, perhaps suggesting a larger reduction in SSDI applications for this age
group, these coefficients are rarely statistically significant. Other than this reduction in SSDI
applications under the medical definition of disability for those ages 65-FRA with an ADL
limitation, we only find one other possible effect: non-robust evidence that larger damages for
disability is associated with a differential decrease in SSDI applications for those ages 65-FRA
with an ADL limitation (Column [8]). This is only significant at the 10 percent level.
Table 16 presents effects on SSDI receipt using the work-limiting measure of disability.
For SSDI application and the work-limiting measure of disability, we do not find any moderating
effects of state laws. Table 17 presents effects on SSDI receipt using the ADL limitation
definition of disability. With the ADL limitation definition, we find a reduction in SSDI receipt
associated with the medical definition of disability for those ages 65 to the FRA with an ADL
limitation. This is a decrease of 0.270 percentage points, significant at the 5 percent level
(Column [8]), although this estimate is less robust across columns. There is also some evidence
of a lower firm size minimum for disability discrimination laws decreasing SSDI receipt for
29
those ages 62-64 with an ADL limitation (Column [2]). However, this estimate is not robust to
the inclusion of other laws. Otherwise, we do not find a clear association between laws and
SSDI receipt.
Table 18 presents effects on any employment using the work-limiting measure of
disability, where we again find no moderating effect of laws using this work-limiting measure.
Table 19 presents effects on employment using the ADL limitation definition of disability. We
also find weak evidence that larger damages under disability discrimination law is associated
with increased employment for ages 55-61 with an ADL limitation.
More notably, we find that the medical definition of disability is associated with a large
relative decrease in employment at ages 65-FRA. More specifically, the relative decrease in
employment induced by SSA1983 for those ages 65-FRA with ADL limitations is about twice as
large in medical definition of disability states. This is surprising since we would expect the
decreases in SSDI application and receipt for ages 65-FRA with an ADL limitation (Tables 15
and 17) to stem from increases in employment, not decreases, which we see in Table 19.
Comparing the negative differential employment effects on those ages 65-FRA with an ADL
limitation (Table 19) with the positive employment effects for the pooled sample (Online
Appendix Table G3) suggests that the positive employment effects due to the medical definition
of disability only occur with those without an ADL limitation.
Moderating Effects of Laws on SSDI Applications and Receipts, and Employment, by Age
Cohort, Disability Status, and Sex. We then explore if the moderating effects of state
discrimination laws on SSA1983 differ by sex, estimating equation [3] separately for a sample of
women and men only, rather than using our default pooled sample. We present these results in
Online Appendix I.
We find that the moderating effects of the medical definition of disability on those with
disabilities of ages 65-FRA are concentrated more in men than in women. That is, men with
disabilities of ages 65-FRA in medical definition of disability states faced a differentially larger
decrease in spillovers to SSDI application and receipt and a differentially larger increase in
employment. However, we do not find that the moderating effects of larger damages and lower
firm size minimums for disability or age discrimination differ by sex. This result is not
surprising since we found few moderating effects of those laws to begin with in the HRS data.
30
For employment, we find that the earlier differential employment decrease associated
with the medical definition of disability for ages 65-FRA with an ADL limitation (Table 19)
occurs for women only. In Online Appendix Table I13, we find large statistically significant
decreases for women, significant at the 1 percent level for two of the three specifications. In
contrast, for men the estimates are less negative and are insignificant (Online Appendix Table
I14). We do not find any difference by sex for the medical definition of disability using work-
limiting disability. We do not find clear differences by sex in the moderating effects of other
discrimination laws.39
Discussion
SSDI Application and Receipt and the Medical Definition of Disability
We start by discussing and contextualizing our primary result: the moderating effects of
the medical definition of disability on SSDI applications (and sometimes SSDI receipt). In the
aggregated SSDI count data, we find a strong and robust association between the medical
definition of disability and reduced SSDI applications, to the point that, in many cases, there is
no estimated spillover to SSDI applications in states with the medical definition of disability.
This result is stronger for women than for men and is stronger for ages 55–64 than for ages 50–
64.
In our analysis of the HRS and Form-831 data, we again confirm the spillovers onto
SSDI application and receipt from SSA1983 that we observed with the aggregated SSDI data, as
confirmed in prior work. However, unlike with the aggregated SSDI count data, we find few
moderating effects of any discrimination laws on SSDI application for those ages 55-61 or ages
62-64 when we use the HRS data matched with Form-831 data.40 This lack of moderating effects
of discrimination laws occurs regardless of the sample or sub-sample we use.41
39 See Online Appendix I for a more detailed discussion of the results. 40 The only cases we find are: (a) a marginally significant decrease (significant at the 10 percent level) in SSDI application associated with the medical definition of disability for those without a work-limiting disability (Online Appendix table H1), (b) a marginally significant increase in SSDI application associated with larger damages for age discrimination for men ages 62-64 with an ADL limitation (Online Appendix Table I4), and (c) a marginally significant increase in SSDI application associated with a lower firm size minimum for disability for those without an ADL limitation (Online Appendix Table H4). 41 The entire pooled sample, by age cohort, by disability status, by sex, or by their intersections.
31
Therefore, the HRS matched with Form-831 data does not confirm our earlier results
using the aggregated SSDI count data for a similar sample. While this is surprising, the HRS
matched with Form-831 data is much less precise since it is only a sample rather than the
universe of SSDI applications and receipt, as we observe with the aggregated SSDI data.
However, the HRS matched with Form-831 data does find that the medical definition of
disability is associated with a decrease in SSDI applications for an older group not included in
the aggregated data: those ages 65-FRA with an ADL limitation42 (and men ages 65-FRA with
either an ADL limitation or a work-limiting disability). So, the two data sources do not find
entirely inconsistent results.
For SSDI receipt, we do not ever find that the medical definition of disability is
associated with differences in SSDI receipt for those younger than 65. In this way, the two
datasets agree. However, for the HRS data matched with the Form-831 data, we instead find
some evidence that the reduction in SSDI applications associated with the medical definition of
disability for those ages 65-FRA with an ADL limitation (and men ages 65-FRA with either an
ADL limitation or a work-limiting disability) materializes into corresponding reductions in SSDI
receipt.
At first blush, it may appear odd that the decrease in SSDI applications was not met with
a corresponding decrease in SSDI receipt in the aggregated SSDI count data. However, this
makes sense for two reasons. First, the medical definition of disability covers individuals with
less severe conditions that are medically diagnosed but do not meet the often disqualifying
“substantially limit” requirement. If these individuals with less severe conditions can find work
then they do not have to submit costly SSDI applications that would have been much more likely
to be denied.
Second, for the aggregated SSDI count data, we use the entire universe of applicants,
which includes those with and without disabilities. For the HRS-Form-831 data, we find the
reduction in SSDI application, and often SSDI receipt, occur amongst those with disabilities.
42 The aggregated SSDI only goes up to age 64, and does not include any information on disability. The fact that this result does not occur for work-limiting disability for several reasons. It could be that our results are not that robust. On the other hand, the effects for ADL limitations would be expected to be larger given that ADL limitations better match the definition of disability under the medical definition, compared to the work-limiting measure.
32
Those with a disability would be more likely to have a successful SSDI application than those in
the aggregated SSDI data sample, where only some have a disability.
We find another possible contradiction between our results by sex using the aggregated
SSDI count data and the HRS-Form-831 data. In the aggregated SSDI data, we found that the
moderating effects of disability discrimination laws on reducing SSDI application and receipt
were larger for women than men. In the HRS-Form-831 data, we find that the moderating effect
of the medical definition of disability on reducing SSDI application and receipt and increasing
employment for those ages 65-FRA with disabilities were larger for men than for women. These
results could again be a contradiction, making it unclear if disability discrimination laws
moderated effects of SSA1983 differently by sex. However, it could be the case that disability
discrimination laws reduce spillovers to SSDI more for women younger than 65 (aggregated
SSDI data), while less-so for women older than 65, or less so for women who specifically have a
disability (HRS-Form-831 data). Further research would be useful to explore this, especially
since the empirical research into how discrimination laws differentially affect women and men,
specifically disability discrimination laws, is only in its infancy.
SSDI Application and Receipt and other Disability and Age Discrimination Laws
Using the aggregated SSDI data, we find that larger damages for disability are sometimes
associated with reduced SSDI applications, with matching reductions in SSDI receipt. We also
occasionally find reductions in SSDI applications for a lower firm size for disability, but these
results are not robust. All these results are stronger for women than men and are greater for
those ages 55–64 rather than ages 50–64.
For SSDI receipt using the aggregated SSDI data, we find some evidence of reduced
spillovers, especially for women, in states with larger damages under disability discrimination
law. There is also some evidence, albeit weaker, that lower firm sizes for disability or age
discrimination laws may also reduce spillovers to SSDI receipt.
Using the HRS data matched with Form-831 disability records, we find few effects of
lower firm size minimums or larger damages for age or disability on SSDI application or receipt.
We find no effects for those younger than 65 (the group covered in the aggregated SSDI data)
33
except one.43 Therefore, our analysis of the HRS data matched with Form-831 disability records
does not seem to find any effects of laws other than the medical definition of disability, even
across all specifications and sample restrictions (e.g., by age cohort, disability, sex, and their
intersections). Taken together with the aggregated SSDI data results, there appears to be weak
and non-robust evidence that larger damages and a lower firm size minimum for disability are
associated with reductions in SSDI application and receipt. Also, there appear to be almost no
effects of age discrimination laws on SSDI application and receipt.
Employment
Our results from the aggregated SSDI count data showing that discrimination laws were
associated with reduced SSDI applications and sometimes reduced SSDI receipt perhaps suggest
that the decreased spillovers to SSDI occurred because of greater access to employment. Our
analysis of the HRS data does not suggest this. While we sometimes find that discrimination
laws are associated with increased employment in cases where there is decreased SSDI
application,44 these results are not always strong or robust. For the cases where we find the
largest and most robust decrease in SSDI applications (individuals ages 55-64 under the medical
definition of disability in the aggregated SSDI data), we do not find any corresponding effects on
employment associated with the medical definition of disability for ages 55-64 using the HRS-
Form-831 data.
There are two possible interpretations of why we do not find corresponding employment
effects where we find robust decreases in SSDI applications. First, there could be no moderating
effect of the medical definition of disability on employment at all, and the decrease in SSDI
applications is attributable to some other, unclear, mechanism. Second, our analysis with the
HRS data is underpowered and, thus, inconclusive as to what extent discrimination laws
moderate the employment effects of SSA1983. We think the latter interpretation is more
realistic, especially given that our estimated effects on employment are not precise.
However, this is additional evidence that employment increases may not be the
mechanism that leads to the decrease in SSDI application due to the medical definition of
43 We find some non-robust evidence that larger damages for age discrimination reduces SSDI receipt for those ages 55 to 61 (Online Appendix Table G2). We find slightly more, but still few, effects for those ages 65-FRA. These effects concentrate in men with disabilities but are generally weakly statistically significant and are not robust. 44 We find that larger damages for disability are associated with differentially increased employment for men ages 55 to 62 with an ADL limitation, significant at only the 10 percent level.
34
disability. In the HRS-Form-831 data, we instead find that the medical definition of disability is
associated with relative decreases in SSDI application and receipt for ages 65-FRA with an ADL
limitation (rather than ages 55-64 as in the aggregated SSDI data). Surprisingly, we find that this
decrease in SSDI application and receipt for those ages 65-FRA with an ADL limitation is
associated with decreased employment for this group (but mostly for women in this group).
Overall, our evidence suggests that the decrease in SSDI application, and sometimes
receipt, associated with the medical definition of disability does not arise through the mechanism
of increased employment. We hope that future research can continue to explore this, especially
given the statistical power limitations in the HRS data.
A separate and important question is how discrimination laws affect employment more
generally. We find effects of age discrimination laws on employment for age cohorts older than
62 and especially at ages 62-64. We find evidence mirroring Neumark and Song (2013) that
larger damages and a lower firm size minimum for age discrimination are associated with
differentially increased employment due to SSA1983. For disability discrimination laws, the
moderating effects are mostly null or, when they are significant, are of mixed sign. Generally, it
does not appear that disability discrimination laws had much of a moderating effect of SSA1983
on employment.
Conclusion
We study state disability and age discrimination laws that are broader or stronger than the
federal Americans with Disabilities Act or the Age Discrimination in Employment Act to see
how they affect Social Security Disability Insurance (SSDI) application, SSDI receipt, and
employment for older people. There is minimal research quantifying the impact of
discrimination laws on Social Security program use, especially SSDI. While there is much more
literature on the employment impacts of discrimination laws, the theoretical and the empirical
literature are mixed. We also contribute to the nascent literature on how disability discrimination
laws affect older workers.
To investigate how broader and stronger features of existing state age and disability
discrimination laws affect SSDI application, SSDI receipt, and employment, we leverage the
Social Security Amendments Act of 1983 (SSA1983). SSA1983 was an exogenous policy
change that gradually increased the full retirement age from 65 to 67 and increased the penalty to
35
claiming Social Security benefits early. However, by reducing the benefits available under
Social Security, particularly for people who want to retire early, SSA1983 made SSDI more
attractive, leading to increased SSDI applications and receipts (Li and Maestas 2008; Duggan,
Singleton, and Song 2007; our earlier results). If stronger and broader discrimination laws do
affect employment opportunities for older workers, then we should see that they moderate the
effect of these spillovers onto SSDI application and receipt induced by SSA1983.
To quantify how existing state disability and age discrimination laws moderate the effects
of SSA1983, we use a difference-in-differences identification strategy—comparing cohorts who
are affected by SSA1983 to cohorts of a similar age who are not affected—and then comparing
this difference by state laws. We use three sources of data. First, our primary data source is
aggregated counts of the universe of SSDI applications and receipts by year, state, age cohort,
and sex. Then, we use HRS data and the HRS matched with Form-831 SSDI records. These
datasets allow us to quantify employment effects and explore heterogeneous effects by disability
status and by finer age cohorts.
We find that disability discrimination laws are associated with reductions in SSDI
application and sometimes SSDI receipt. Our most striking evidence comes from the medical
definition of disability, where we find strong and robust evidence in the aggregated SSDI count
data that this broader feature of state disability discrimination law reduces spillovers onto SSDI
applications (but not SSDI receipt). We also find some weaker evidence in the aggregated SSDI
data that larger damages and a lower firm size minimum under disability discrimination law
reduce SSDI application and receipt. However, this evidence is not robust across all our
robustness checks and specifications.
Regardless of the sample or specification we use, we rarely find effects of larger damages
and a lower firm size for disability discrimination laws on SSDI application or receipt using the
HRS data matched with the Form-831 disability records data. This suggests that the evidence is
weak that broader or stronger features of disability discrimination laws other than the medical
definition of disability have moderated spillovers onto SSDI application and receipt.
Across both our aggregated SSDI count data and our HRS data matched with Form-831
disability records data, we find almost no effects of stronger or broader state age discrimination
laws on SSDI application and receipt. While prior work (especially Neumark and Song 2013)
establishes that these laws are often associated with improved labor market outcomes and delay
36
retirement, we generally do not find that this translates into impacts on SSDI application and
receipt.
In addition to using the HRS data to explore heterogeneous effects of laws by disability
status and finer age cohorts, we also use the HRS data to determine if state age and disability
discrimination laws moderate the effects of SSA1983 on employment. Despite hoping to clarify
the literature on the broader question of the effects of discrimination laws on employment, we
find no clear effect of broader and stronger state discrimination laws on employment.
At best, our takeaways from this study are that the medical definition of disability
decreases SSDI applications, but perhaps not SSDI receipt, and larger damages and a lower firm
size for disability discrimination laws may reduce SSDI applications and receipt. At worst, we
could only conclude that the medical definition of disability is associated with reductions in
SSDI application. However, even this more pessimistic view of our results – that only SSDI
applications decrease, and not SSDI receipt, due to states having a broader medical definition of
disability – has important policy implications.
SSDI applications are costly for both applicants and the Social Security Administration to
process, especially if cases are appealed. The SSDI application process imposes both direct and
indirect costs on applicants. The direct costs include time and resources spent gathering all the
necessary documentation required for the application. There are also monetary costs if lawyers
are involved, which is common.
The indirect costs, however, may be even larger than the direct costs. Indirect costs come
from applicants' potential employment and earnings losses due to the determination process for
SSDI eligibility. These costs are faced regardless of the ultimate acceptance or denial of the
claim. To satisfy the “inability to engage in substantial gainful activity (SGA)” clause of
eligibility for SSDI, most SSDI applicants drop out of the labor force well before applying and
stay out of the labor force during the process of determination, which can vary from six months
to several years (Autor et al. 2015). This prolonged determination process together with human
capital deterioration due to long nonemployment status results in large employment and earnings
losses, especially for denied SSDI applicants in the short run as well as in the long run (Autor et
al. 2015; Khan 2018; von Wachter, Song, and Manchester 2011). The proportion of workers
37
who are bearing these costs without ultimately receiving SSDI benefits are rising over time.45
Thus, preventing these SSDI applications through providing more appropriate employment
opportunities could have a large impact both on marginal SSDI applicants and on the strained
Social Security Trust Fund.
These high costs of SSDI applications are also, unfortunately, more likely to be realized
for the marginal applicants who are induced to apply to SSDI based on the economic shock of
SSA1983. These marginal applicants who apply for economic reasons have less severe
conditions and are more likely to face denial. We find in our strongest and most robust results
that, in the aggregated SSDI data, the medical definition of disability decreases SSDI
applications but not SSDI receipt. This suggests that these foregone SSDI applications were less
likely to have been successful. So, the medical definition of disability is associated with reducing
costly SSDI applications that would not have been successful anyways.
This issue of preventing marginal applicants who would not get approved for SSDI from
applying in the first place is especially crucial now, given the devastating COVID-19 recession,
which also appears to be impacting those near traditional retirement ages more (Bui, Button, and
Picciotti 2020). As we saw with the Great Recession (Maestas, Mullen, and Strand 2015, 2018;
Mueller, Rothstein, and von Wachter 2016), SSDI applications should increase during and after
this COVID-19 recession, adding even more pressure on the Social Security Trust Fund.
45 The total number of workers who applied for SSDI has gone up from 1.3 million in 1992 to 2.6 million in 2013, the sample period analyzed in this paper. The proportion of people who received benefits decreased from 53 percent in 1992 to 40 percent in 2008 (Social Security Administration 2017).
38
References
Acemoglu, Daron and Joshua D. Angrist. 2001. “Consequences of Employment Protection? The Case of the Americans with Disabilities Act.” Journal of Political Economy 109(5): 915-957.
Ameri, Mason, Lisa Schur, Meera Adya, F. Scott Bentley, Patrick McKay, and Douglas Kruse. 2018. “The Disability Employment Puzzle: A Field Experiment on Employer Hiring Behavior.” ILR Review 71(2): 329-364.
Armour, Philip, Patrick Button, and Simon Hollands. 2018. “Disability Saliency and Discrimination in Hiring.” American Economic Association Papers and Proceedings 108: 262-266.
Autor, David H., Nicole Maestas, Kathleen J. Mullen, and Alexander Strand. 2015. “Does Delay Cause Decay? The Effect of Administrative Decision Time on the Labor Force Participation and Earnings of Disability Applicants.” Working Paper No. 20840. Cambridge, MA: National Bureau of Economic Research.
Beegle, Kathleen and Wendy A. Stock. 2003. “The Labor Market Effects of Disability Discrimination Laws.” Journal of Human Resources 38: 806-859.
Behaghel, Luc and David M. Blau. 2012. “Framing Social Security Reform: Behavioral Responses to Changes in the Full Retirement Age.” American Economic Journal: Economic Policy 4(4): 41-67.
Besley, Timothy and Anne Case. 2000. “Unnatural Experiments? Estimating the Incidence of Endogenous Policies.” Economic Journal 110(467): F672-F694.
Bloch, Farrell. 1994. Antidiscrimination Law and Minority Employment: Recruitment Practices and Regulatory Constraints. Chicago, IL: University of Chicago Press.
Board of Trustees. 2017. The 2017 Annual Report of the Board of Trustees of the Federal Old-Age and Survivors Insurance and Federal Disability Insurance Trust Funds. Washington, DC: U.S. Social Security Administration.
Board of Trustees. 2020. The 2020 Annual Report of the Board of Trustees of the Federal Old-Age and Survivors Insurance and Federal Disability Insurance Trust Funds. Washington, DC: U.S. Social Security Administration.
Bugliari, Delia, Nancy Campbell, Chris Chan, Orla Hayden, Jessica Hayes, Michael Hurd, Adam Karabatakis et al. 2019. “RAND HRS Longitudinal File 2016 (V1) Documentation.” Santa Monica, CA: RAND Center for the Study of Aging.
39
Bui, Truc Thi Mai, Patrick Button, and Elyce G Picciotti. 2020. “Early Evidence on the Impact of Coronavirus Disease 2019 (COVID-19) and the Recession on Older Workers.” Public Policy & Aging Report 30(4): 154-159.
Burgdorf, Robert L. 1997. “Substantially Limited: Protection from Disability Discrimination: The Special Treatment Model and Misconstructions of the Definition of Disability.” Villanova Law Review 42(2): 409-586.
Burn, Ian, Patrick Button, Theodore F. Figinski, and Joanne Song McLaughlin. 2020. “Why Retirement, Social Security, and Age Discrimination Policies Need to Consider the Intersectional Experiences of Older Women.” Public Policy & Aging Report 30(3): 101-106.
Button, Patrick. 2018. “Expanding Disability Discrimination Protections for Individuals with Disabilities: Evidence from California.” ILR Review 71(2): 365-393.
———. 2020. “Population Aging, Age Discrimination, and Age Discrimination Protections at the 50th Anniversary of the Age Discrimination in Employment Act.” In Current and Emerging Trends in Aging and Work, edited by Sara Czaja, Joseph Sharit, and Jacquelyn James, 163-188. New York, NY: Springer.
Button, Patrick, Philip Armour, and Simon Hollands. 2017a. “A Comprehensive Analysis of the Effects of U.S. Disability Discrimination Law on the Employment of Individuals with Disabilities.” Unpublished Working Paper.
———. 2017b. “Do State Disability Discrimination Laws Increase Employment for Individuals with Disabilities?” Unpublished Working Paper.
Coe, Norma B., Kelly Haverstick, Alicia H. Munnell, and Anthony Webb. 2011. “What Explains State Variation in SSDI Application Rates?” Working Paper 2011-23. Chestnut Hill, MA: Center for Retirement Research at Boston College.
Colker, Ruth. 1999. “The Americans with Disabilities Act: A Windfall for Defendants.” Harvard Civil Rights Civil Liberties Law Review 34: 99-162.
DeLeire, Thomas. 2000. “The Wage and Employment Effects of the Americans with Disabilities Act.” Journal of Human Resources 35(4): 693-715.
———. 2001. “Changes in Wage Discrimination against People with Disabilities: 1984-93.” Journal of Human Resources 36(1): 144-58.
Duggan, Mark, Perry Singleton, and Jae Song. 2007. “Aching to Retire? The Rise in the Full Retirement Age and Its Impact on the Social Security Disability Rolls.” Journal of Public Economics 91(7-8): 1327-1350.
40

Flood, Sarah, Miriam King, Renae Rodgers, Steven Ruggles, and J. Robert Warren. 2018. “Integrated Public Use Microdata Series, Current Population Survey: Version 6.0 [Machine-Readable Database].” Minneapolis, MN: University of Minnesota.
Gruber, Jonathan and Jeffrey D. Kubik. 1997. “Disability Insurance Rejection Rates and the Labor Supply of Older Workers.” Journal of Public Economics 64(1): 1-23.
Jolls, Christine and J. J. Prescott. 2004. “Disaggregating Employment Protection: The Case of Disability Discrimination.” Working Paper No. 10740. Cambridge, MA: National Bureau of Economic Research.
Khan, Mashfiqur R. 2018. “The Effect of the Disability Insurance Application Decision on the Employment of Denied Applicants.” American Economic Association Papers and Proceedings 108: 267-271.
Kruse, Douglas and Lisa Schur. 2003. “Employment of People with Disabilities Following the ADA.” Industrial Relations 42(1): 31-64.
Lahey, Joanna N. and Ryan Beasley. 2018. “Technical Aspects of Correspondence Studies.” In Audit Studies: Behind the Scenes with Theory, Method, and Nuance, edited by S. Michael Gaddis, 81-101. New York, NY: Springer.
Lahey, Joanna N. and Douglas R. Oxley. 2018. “Discrimination at the Intersection of Age, Race, and Gender: Evidence from a Lab-in-the-Field Experiment.” Working Paper No. 25357. Cambridge, MA: National Bureau of Economic Research.
Li, Xiaoyan and Nicole Maestas. 2008. “Does the Rise in the Full Retirement Age Encourage Disability Benefits Applications? Evidence from the Health and Retirement Study.” Working Paper No. 2008-198. Ann Arbor, MI: Michigan Retirement Research Center.
Long, Alex B. 2004. “State Anti-Discrimination Law as a Model for Amending the Americans with Disabilities Act.” University of Pittsburgh Law Review 65: 597-653.
Maestas, Nicole, Kathleen J. Mullen, and Alexander Strand. 2015. “Disability Insurance and the Great Recession.” American Economic Review 105(5): 177-182.
———. 2018. “The Effect of Economic Conditions on the Disability Insurance Program: Evidence from the Great Recession.” Working Paper 25338. Cambridge, MA: National Bureau of Economic Research.
McLaughlin, Joanne Song. 2019. “Limited Legal Recourse for Older Women’s Intersectional Discrimination Under the Age Discrimination in Employment Act.” The Elder Law Journal 26(2): 287-321.
———. 2020. “Falling Between the Cracks: Discrimination Laws and Older Women.” LABOUR 34(2): 215-238.
41
McVicar, Duncan. 2006. “Why Do Disability Benefit Rolls Vary between Regions? A Review of the Evidence from the USA and the UK.” Regional Studies 40(5): 519-533.
Mueller, Andreas I., Jesse Rothstein, and Till M. Von Wachter. 2016. “Unemployment Insurance and Disability Insurance in the Great Recession.” Journal of Labor Economics 34(S1): S445-S475.
Mora, Ricardo and Iliana Reggio. 2019. “Alternative Diff-in-Diffs Estimators with Several Pretreatment Periods.” Econometric Reviews 38(5): 465-486.
Murtagh, Kirsten Naumann and Helen B. Hubert. 2004. “Gender Differences in Physical Disability among an Elderly Cohort.” American Journal of Public Health 94(8): 1406-1411.
Neumark, David, Ian Burn, and Patrick Button. 2019. “Is It Harder for Older Workers to Find Jobs? New and Improved Evidence from a Field Experiment.” Journal of Political Economy 127(2): 922-970.
Neumark, David, Ian Burn, Patrick Button, and Nanneh Chehras. 2019. “Do State Laws Protecting Older Workers from Discrimination Reduce Age Discrimination in Hiring? Evidence from a Field Experiment.” Journal of Law and Economics 62(2): 373-402.
Neumark, David and Patrick Button. 2014. “Did Age Discrimination Protections Help Older Workers Weather the Great Recession?” Journal of Policy Analysis and Management 33(4): 566-601.
Neumark, David and Joanne Song. 2013. “Do Stronger Age Discrimination Laws Make Social Security Reforms More Effective?” Journal of Public Economics 108: 1-16.
Neumark, David, Joanne Song, and Patrick Button. 2017. “Does Protecting Older Workers from Discrimination Make It Harder to Get Hired? Evidence from Disability Discrimination Laws.” Research on Aging 39(1): 29-63.
O’Hara, Brett. 2004. “Twice Penalized: Employment Discrimination Against Women with Disabilities.” Journal of Disability Policy Studies 15(1): 27-34.
Social Security Administration. 2017. Annual Statistical Report on the Social Security Disability Insurance Program, 2016. Washington, DC.
Song, Jae G. and Joyce Manchester. 2007. “New Evidence on Earnings and Benefit Claims Following Changes in the Retirement Earnings Test in 2000.” Journal of Public Economics 91(3-4): 669-700.
42
Stapleton, David C., Kevin Coleman, Kimberly Dietrich, and Gina Livermore. 1998. “Empirical Analyses of DI and SSI Application and Award Growth.” In Growth in Disability Benefits: Explanations and Policy Implications, 1st edition, edited by Kalman Rupp and David C. Stapleton, 31-108. Kalamazoo, MI: W.E. Upjohn Institute for Employment Research.
Stock, Wendy A. and Kathleen Beegle. 2004. “Employment Protections for Older Workers: Do Disability Discrimination Laws Matter?” Contemporary Economic Policy 22(1): 111-126.
Strand, Alexander. 2002. “Social Security Disability Programs: Assessing the Variation in Allowance Rates.” Working Paper No. 98. Washington, DC: U.S. Social Security Administration, Office of Research, Evaluation, and Statistics.
Svahn, John A. and Mary Ross. 1983. “Social Security Amendments of 1983: Legislative History and Summary of Provisions.” Social Security Bulletin 46(7): 3-48.
Wachter, Till von, Jae Song, and Joyce Manchester. 2011. “Trends in Employment and Earnings of Allowed and Rejected Applicants to the Social Security Disability Insurance Program.” American Economic Review 101(7): 3308-3329.
43
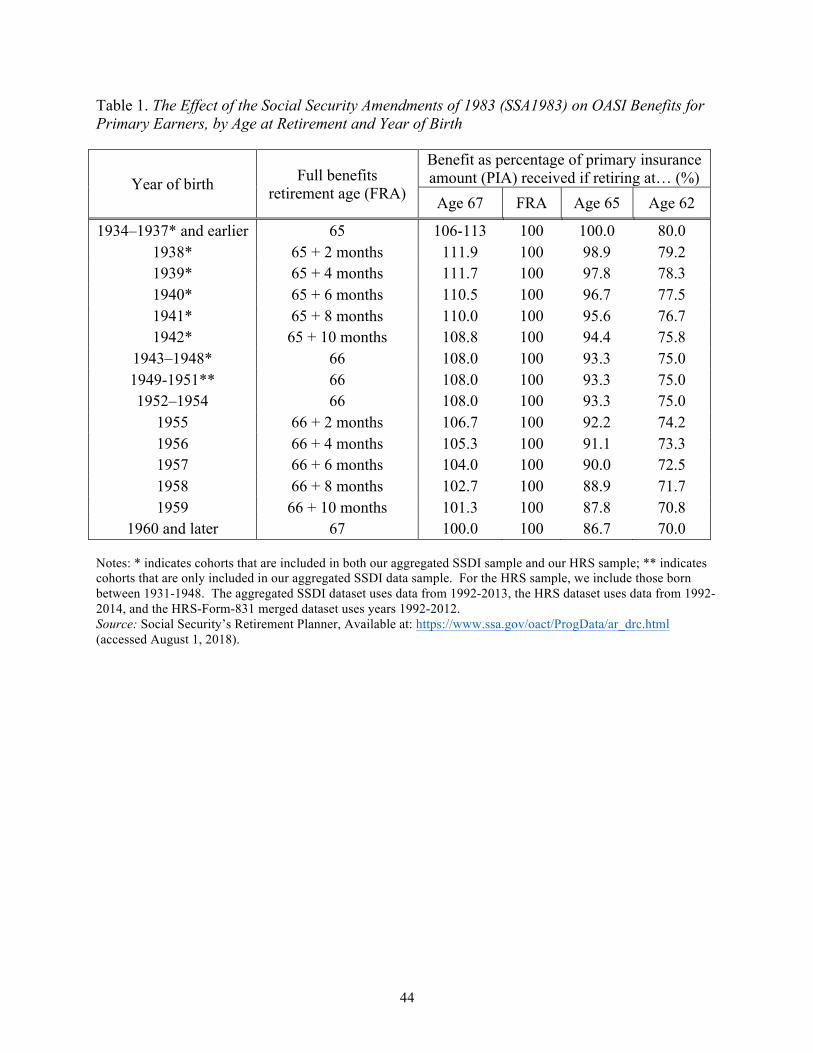
Table 1. The Effect of the Social Security Amendments of 1983 (SSA1983) on OASI Benefits for Primary Earners, by Age at Retirement and Year of Birth
Year of birth Full benefits retirement age (FRA)
Benefit as percentage of primary insurance amount (PIA) received if retiring at… (%) Age 67 FRA Age 65 Age 62
1934–1937* and earlier 65 106-113 100 100.0 80.0 1938* 65 + 2 months 111.9 100 98.9 79.2 1939* 65 + 4 months 111.7 100 97.8 78.3 1940* 65 + 6 months 110.5 100 96.7 77.5 1941* 65 + 8 months 110.0 100 95.6 76.7 1942* 65 + 10 months 108.8 100 94.4 75.8
1943–1948* 66 108.0 100 93.3 75.0 1949-1951** 66 108.0 100 93.3 75.0 1952–1954 66 108.0 100 93.3 75.0
1955 66 + 2 months 106.7 100 92.2 74.2 1956 66 + 4 months 105.3 100 91.1 73.3 1957 66 + 6 months 104.0 100 90.0 72.5 1958 66 + 8 months 102.7 100 88.9 71.7 1959 66 + 10 months 101.3 100 87.8 70.8
1960 and later 67 100.0 100 86.7 70.0
Notes: * indicates cohorts that are included in both our aggregated SSDI sample and our HRS sample; ** indicates cohorts that are only included in our aggregated SSDI data sample. For the HRS sample, we include those born between 1931-1948. The aggregated SSDI dataset uses data from 1992-2013, the HRS dataset uses data from 1992-2014, and the HRS-Form-831 merged dataset uses years 1992-2012. Source: Social Security’s Retirement Planner, Available at: https://www.ssa.gov/oact/ProgData/ar_drc.html (accessed August 1, 2018).
44
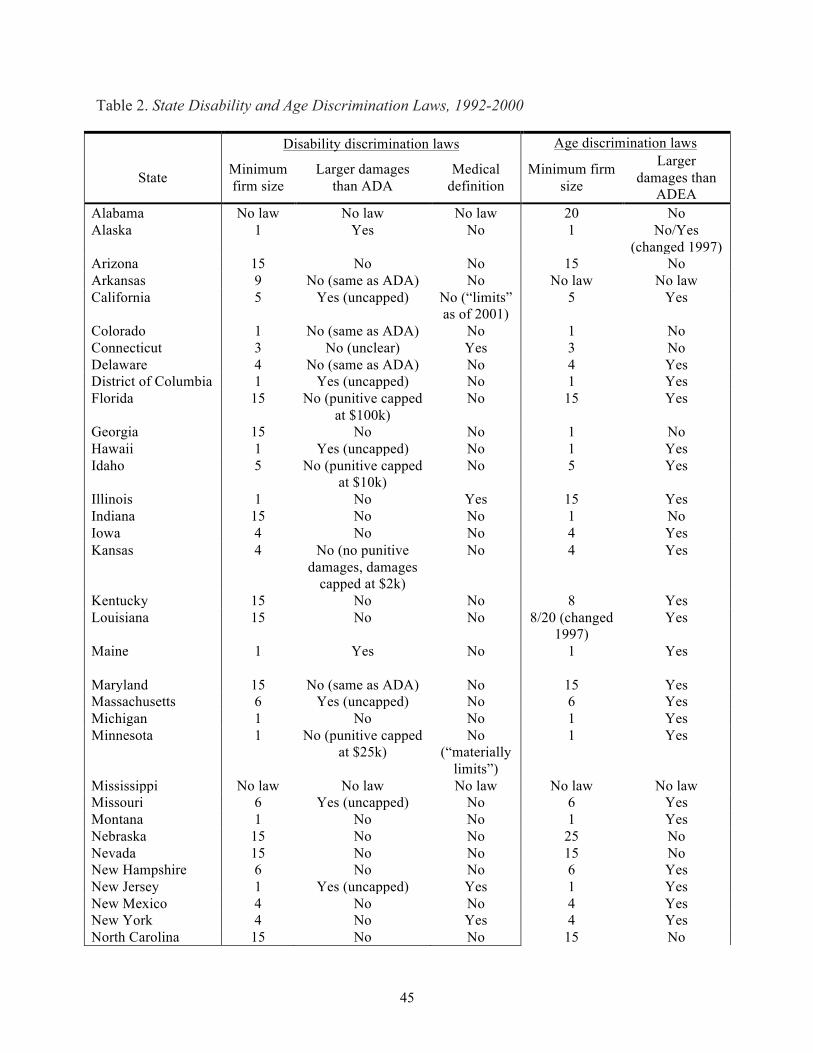
Table 2. State Disability and Age Discrimination Laws, 1992-2000
State
Disability discrimination laws
Minimum Larger damages Medical firm size than ADA definition
Age discrimination laws Larger Minimum firm damages than size ADEA
Alabama Alaska
Arizona Arkansas California
Colorado Connecticut Delaware District of Columbia Florida
Georgia Hawaii Idaho
Illinois Indiana Iowa Kansas
Kentucky Louisiana
Maine
Maryland Massachusetts Michigan Minnesota
Mississippi Missouri Montana Nebraska Nevada New Hampshire New Jersey New Mexico New York North Carolina
No law No law No law 1 Yes No
15 No No 9 No (same as ADA) No 5 Yes (uncapped) No (“limits”
as of 2001) 1 No (same as ADA) No 3 No (unclear) Yes 4 No (same as ADA) No 1 Yes (uncapped) No
15 No (punitive capped No at $100k)
15 No No 1 Yes (uncapped) No 5 No (punitive capped No
at $10k) 1 No Yes
15 No No 4 No No 4 No (no punitive No
damages, damages capped at $2k)
15 No No 15 No No
1 Yes No
15 No (same as ADA) No 6 Yes (uncapped) No 1 No No 1 No (punitive capped No
at $25k) (“materially limits”)
No law No law No law 6 Yes (uncapped) No 1 No No
15 No No 15 No No 6 No No 1 Yes (uncapped) Yes 4 No No 4 No Yes
15 No No
20 No 1 No/Yes
(changed 1997) 15 No
No law No law 5 Yes
1 No 3 No 4 Yes 1 Yes
15 Yes
1 No 1 Yes 5 Yes
15 Yes 1 No 4 Yes 4 Yes
8 Yes 8/20 (changed Yes
1997) 1 Yes
15 Yes 6 Yes 1 Yes 1 Yes
No law No law 6 Yes 1 Yes
25 No 15 No 6 Yes 1 Yes 4 Yes 4 Yes
15 No
45
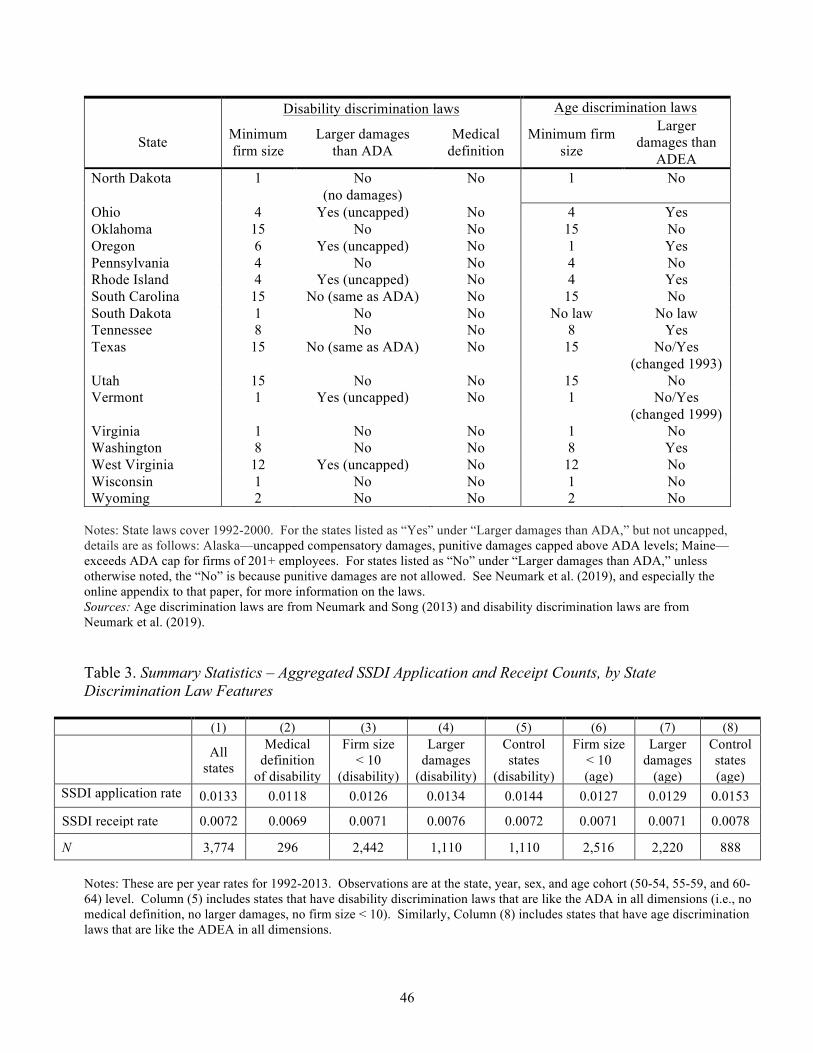
State
Disability discrimination laws
Minimum Larger damages Medical firm size than ADA definition
Age discrimination laws Larger Minimum firm damages than size ADEA
North Dakota
Ohio Oklahoma Oregon Pennsylvania Rhode Island South Carolina South Dakota Tennessee Texas
Utah Vermont
Virginia Washington West Virginia Wisconsin Wyoming
1 No No (no damages)
4 Yes (uncapped) No 15 No No 6 Yes (uncapped) No 4 No No 4 Yes (uncapped) No
15 No (same as ADA) No 1 No No 8 No No
15 No (same as ADA) No
15 No No 1 Yes (uncapped) No
1 No No 8 No No
12 Yes (uncapped) No 1 No No 2 No No
1 No
4 Yes 15 No 1 Yes 4 No 4 Yes
15 No No law No law
8 Yes 15 No/Yes
(changed 1993) 15 No 1 No/Yes
(changed 1999) 1 No 8 Yes
12 No 1 No 2 No
Notes: State laws cover 1992-2000. For the states listed as “Yes” under “Larger damages than ADA,” but not uncapped, details are as follows: Alaska—uncapped compensatory damages, punitive damages capped above ADA levels; Maine— exceeds ADA cap for firms of 201+ employees. For states listed as “No” under “Larger damages than ADA,” unless otherwise noted, the “No” is because punitive damages are not allowed. See Neumark et al. (2019), and especially the online appendix to that paper, for more information on the laws. Sources: Age discrimination laws are from Neumark and Song (2013) and disability discrimination laws are from Neumark et al. (2019).
Table 3. Summary Statistics – Aggregated SSDI Application and Receipt Counts, by State Discrimination Law Features
(1) (2) (3) (4) (5) (6) (7) (8)
All states
Medical definition
of disability
Firm size < 10
(disability)
Larger damages
(disability)
Control states
(disability)
Firm size < 10 (age)
Larger damages
(age)
Control states (age)
SSDI application rate 0.0133 0.0118 0.0126 0.0134 0.0144 0.0127 0.0129 0.0153
SSDI receipt rate 0.0072 0.0069 0.0071 0.0076 0.0072 0.0071 0.0071 0.0078
N 3,774 296 2,442 1,110 1,110 2,516 2,220 888
Notes: These are per year rates for 1992-2013. Observations are at the state, year, sex, and age cohort (50-54, 55-59, and 60-64) level. Column (5) includes states that have disability discrimination laws that are like the ADA in all dimensions (i.e., no medical definition, no larger damages, no firm size < 10). Similarly, Column (8) includes states that have age discrimination laws that are like the ADEA in all dimensions.
46
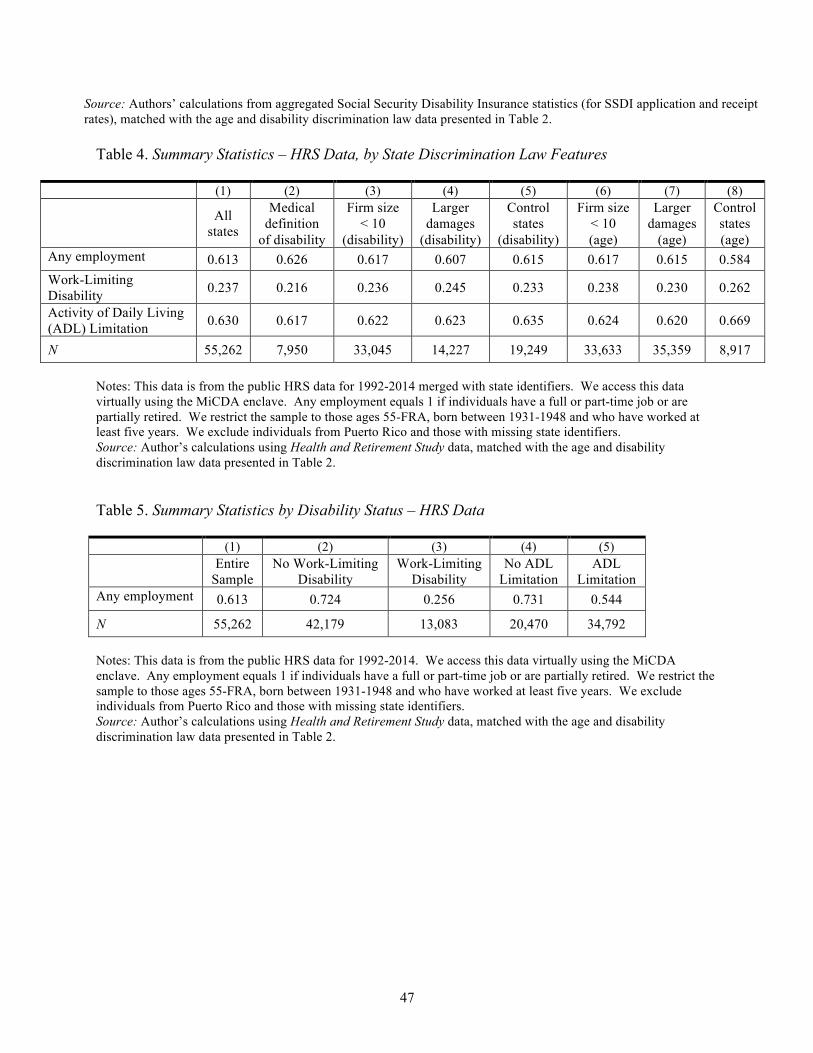
Source: Authors’ calculations from aggregated Social Security Disability Insurance statistics (for SSDI application and receipt rates), matched with the age and disability discrimination law data presented in Table 2.
Table 4. Summary Statistics – HRS Data, by State Discrimination Law Features
(1) (2) (3) (4) (5) (6) (7) (8)
All states
Medical definition
of disability
Firm size < 10
(disability)
Larger damages
(disability)
Control states
(disability)
Firm size < 10 (age)
Larger damages
(age)
Control states (age)
Any employment 0.613 0.626 0.617 0.607 0.615 0.617 0.615 0.584 Work-Limiting Disability 0.237 0.216 0.236 0.245 0.233 0.238 0.230 0.262
Activity of Daily Living (ADL) Limitation 0.630 0.617 0.622 0.623 0.635 0.624 0.620 0.669
N 55,262 7,950 33,045 14,227 19,249 33,633 35,359 8,917
Notes: This data is from the public HRS data for 1992-2014 merged with state identifiers. We access this data virtually using the MiCDA enclave. Any employment equals 1 if individuals have a full or part-time job or are partially retired. We restrict the sample to those ages 55-FRA, born between 1931-1948 and who have worked at least five years. We exclude individuals from Puerto Rico and those with missing state identifiers. Source: Author’s calculations using Health and Retirement Study data, matched with the age and disability discrimination law data presented in Table 2.
Table 5. Summary Statistics by Disability Status – HRS Data
(1) (2) (3) (4) (5) Entire
Sample No Work-Limiting
Disability Work-Limiting
Disability No ADL
Limitation ADL
Limitation Any employment 0.613 0.724 0.256 0.731 0.544
N 55,262 42,179 13,083 20,470 34,792
Notes: This data is from the public HRS data for 1992-2014. We access this data virtually using the MiCDA enclave. Any employment equals 1 if individuals have a full or part-time job or are partially retired. We restrict the sample to those ages 55-FRA, born between 1931-1948 and who have worked at least five years. We exclude individuals from Puerto Rico and those with missing state identifiers. Source: Author’s calculations using Health and Retirement Study data, matched with the age and disability discrimination law data presented in Table 2.
47
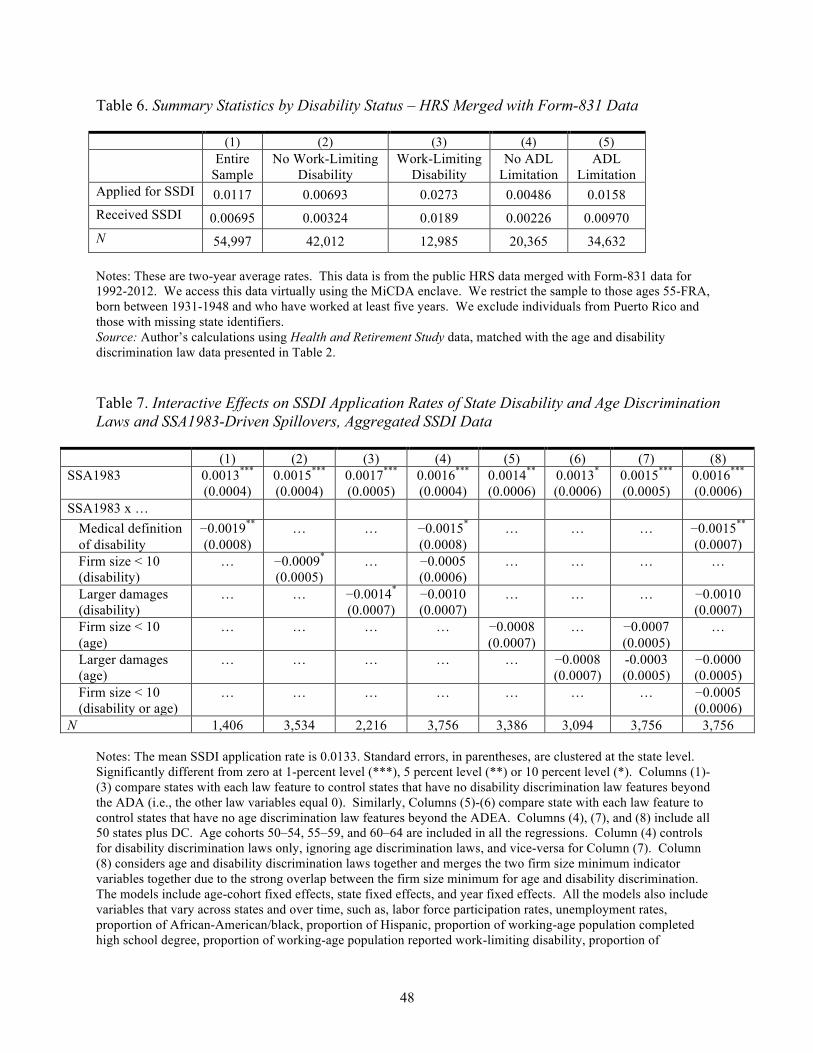
Table 6. Summary Statistics by Disability Status – HRS Merged with Form-831 Data
(1) (2) (3) (4) (5) Entire
Sample No Work-Limiting
Disability Work-Limiting
Disability No ADL
Limitation ADL
Limitation Applied for SSDI 0.0117 0.00693 0.0273 0.00486 0.0158 Received SSDI 0.00695 0.00324 0.0189 0.00226 0.00970 N 54,997 42,012 12,985 20,365 34,632
Notes: These are two-year average rates. This data is from the public HRS data merged with Form-831 data for 1992-2012. We access this data virtually using the MiCDA enclave. We restrict the sample to those ages 55-FRA, born between 1931-1948 and who have worked at least five years. We exclude individuals from Puerto Rico and those with missing state identifiers. Source: Author’s calculations using Health and Retirement Study data, matched with the age and disability discrimination law data presented in Table 2.
Table 7. Interactive Effects on SSDI Application Rates of State Disability and Age Discrimination Laws and SSA1983-Driven Spillovers, Aggregated SSDI Data
(1) (2) (3) (4) (5) (6) (7) (8) SSA1983 0.0013***
(0.0004) 0.0015***
(0.0004) 0.0017***
(0.0005) 0.0016***
(0.0004) 0.0014**
(0.0006) 0.0013*
(0.0006) 0.0015***
(0.0005) 0.0016***
(0.0006) SSA1983 x …
Medical definition of disability
−0.0019**
(0.0008) … … −0.0015*
(0.0008) … … … −0.0015**
(0.0007) Firm size < 10 (disability)
… −0.0009*
(0.0005) … −0.0005
(0.0006) … … … …
Larger damages (disability)
… … −0.0014*
(0.0007) −0.0010 (0.0007)
… … … −0.0010 (0.0007)
Firm size < 10 (age)
… … … … −0.0008 (0.0007)
… −0.0007 (0.0005)
…
Larger damages (age)
… … … … … −0.0008 (0.0007)
-0.0003 (0.0005)
−0.0000 (0.0005)
Firm size < 10 (disability or age)
… … … … … … … −0.0005 (0.0006)
N 1,406 3,534 2,216 3,756 3,386 3,094 3,756 3,756
Notes: The mean SSDI application rate is 0.0133. Standard errors, in parentheses, are clustered at the state level. Significantly different from zero at 1-percent level (***), 5 percent level (**) or 10 percent level (*). Columns (1)-(3) compare states with each law feature to control states that have no disability discrimination law features beyond the ADA (i.e., the other law variables equal 0). Similarly, Columns (5)-(6) compare state with each law feature to control states that have no age discrimination law features beyond the ADEA. Columns (4), (7), and (8) include all 50 states plus DC. Age cohorts 50–54, 55–59, and 60–64 are included in all the regressions. Column (4) controls for disability discrimination laws only, ignoring age discrimination laws, and vice-versa for Column (7). Column (8) considers age and disability discrimination laws together and merges the two firm size minimum indicator variables together due to the strong overlap between the firm size minimum for age and disability discrimination. The models include age-cohort fixed effects, state fixed effects, and year fixed effects. All the models also include variables that vary across states and over time, such as, labor force participation rates, unemployment rates, proportion of African-American/black, proportion of Hispanic, proportion of working-age population completed high school degree, proportion of working-age population reported work-limiting disability, proportion of
48
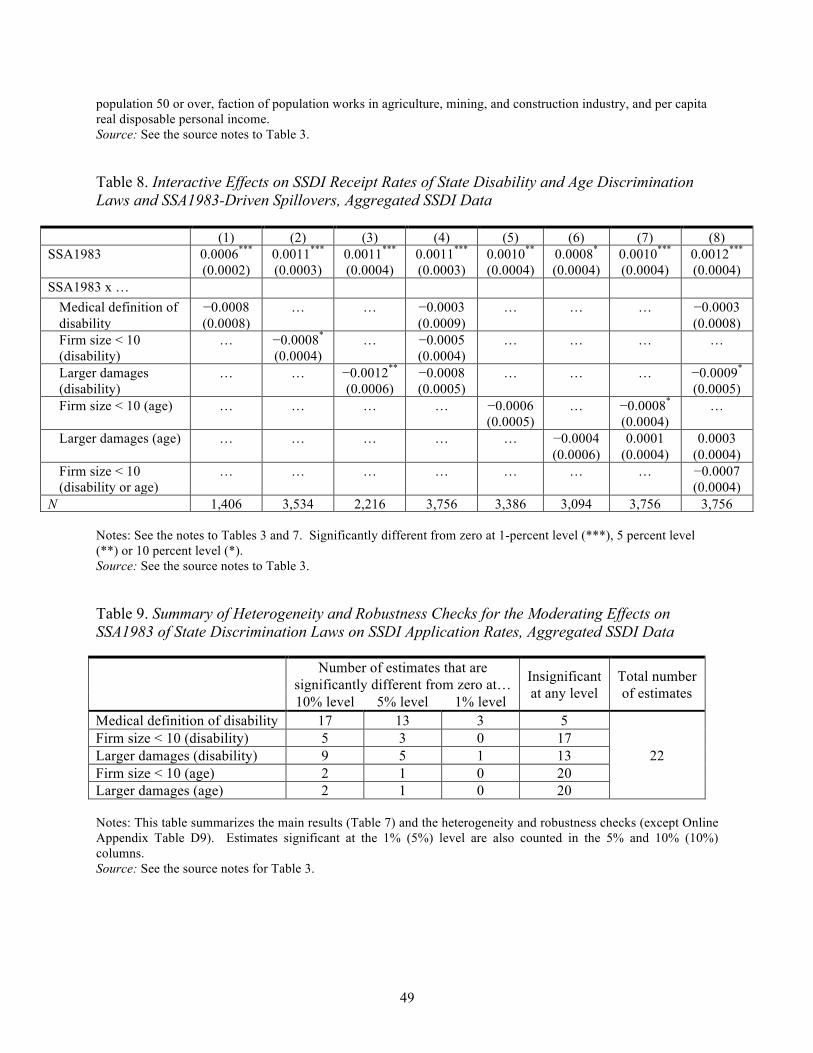
population 50 or over, faction of population works in agriculture, mining, and construction industry, and per capita real disposable personal income. Source: See the source notes to Table 3.
Table 8. Interactive Effects on SSDI Receipt Rates of State Disability and Age Discrimination Laws and SSA1983-Driven Spillovers, Aggregated SSDI Data
(1) (2) (3) (4) (5) (6) (7) (8) SSA1983 0.0006***
(0.0002) 0.0011***
(0.0003) 0.0011***
(0.0004) 0.0011***
(0.0003) 0.0010**
(0.0004) 0.0008*
(0.0004) 0.0010***
(0.0004) 0.0012***
(0.0004) SSA1983 x …
Medical definition of disability
−0.0008 (0.0008)
… … −0.0003 (0.0009)
… … … −0.0003 (0.0008)
Firm size < 10 (disability)
… −0.0008*
(0.0004) … −0.0005
(0.0004) … … … …
Larger damages (disability)
… … −0.0012**
(0.0006) −0.0008 (0.0005)
… … … −0.0009*
(0.0005) Firm size < 10 (age) … … … … −0.0006
(0.0005) … −0.0008*
(0.0004) …
Larger damages (age) … … … … … −0.0004 (0.0006)
0.0001 (0.0004)
0.0003 (0.0004)
Firm size < 10 (disability or age)
… … … … … … … −0.0007 (0.0004)
N 1,406 3,534 2,216 3,756 3,386 3,094 3,756 3,756
Notes: See the notes to Tables 3 and 7. Significantly different from zero at 1-percent level (***), 5 percent level (**) or 10 percent level (*). Source: See the source notes to Table 3.
Table 9. Summary of Heterogeneity and Robustness Checks for the Moderating Effects on SSA1983 of State Discrimination Laws on SSDI Application Rates, Aggregated SSDI Data
Number of estimates that are significantly different from zero at… 10% level 5% level 1% level
Insignificant at any level
Total number of estimates
Medical definition of disability 17 13 3 5
22 Firm size < 10 (disability) 5 3 0 17 Larger damages (disability) 9 5 1 13 Firm size < 10 (age) 2 1 0 20 Larger damages (age) 2 1 0 20
Notes: This table summarizes the main results (Table 7) and the heterogeneity and robustness checks (except Online Appendix Table D9). Estimates significant at the 1% (5%) level are also counted in the 5% and 10% (10%) columns. Source: See the source notes for Table 3.
49
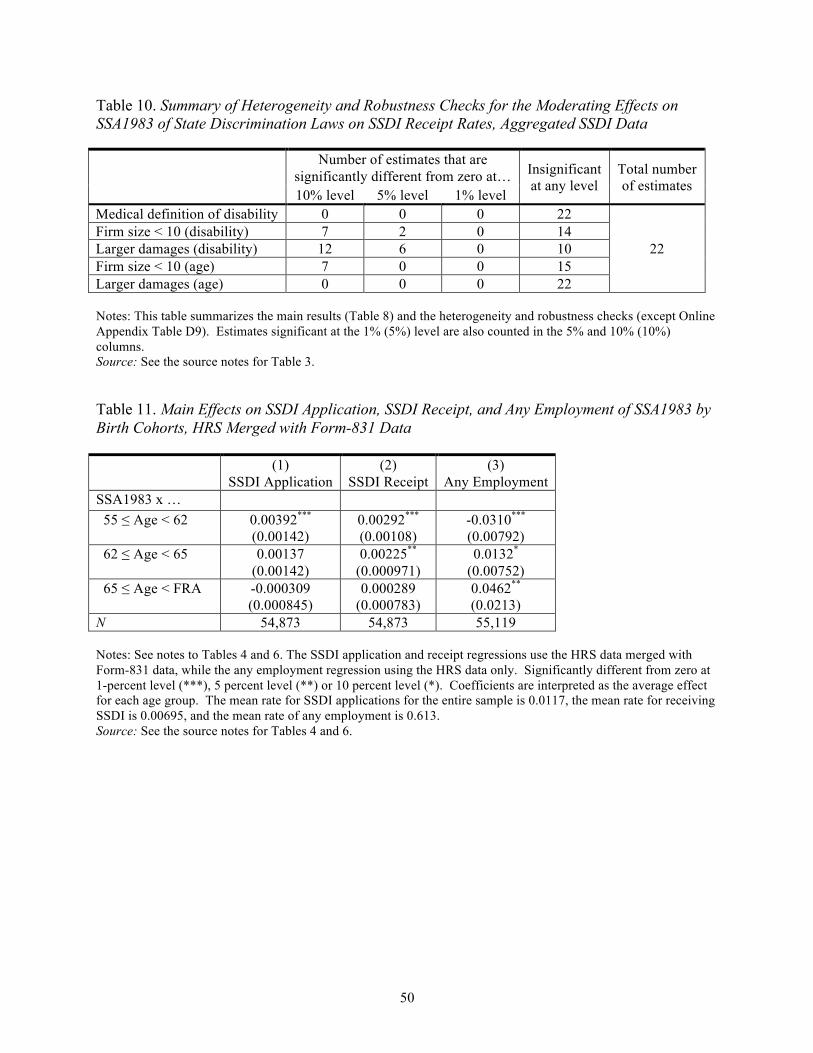
Table 10. Summary of Heterogeneity and Robustness Checks for the Moderating Effects on SSA1983 of State Discrimination Laws on SSDI Receipt Rates, Aggregated SSDI Data
Number of estimates that are significantly different from zero at… 10% level 5% level 1% level
Insignificant at any level
Total number of estimates
Medical definition of disability 0 0 0 22
22 Firm size < 10 (disability) 7 2 0 14 Larger damages (disability) 12 6 0 10 Firm size < 10 (age) 7 0 0 15 Larger damages (age) 0 0 0 22
Notes: This table summarizes the main results (Table 8) and the heterogeneity and robustness checks (except Online Appendix Table D9). Estimates significant at the 1% (5%) level are also counted in the 5% and 10% (10%) columns. Source: See the source notes for Table 3.
Table 11. Main Effects on SSDI Application, SSDI Receipt, and Any Employment of SSA1983 by Birth Cohorts, HRS Merged with Form-831 Data
(1) SSDI Application
(2) SSDI Receipt
(3) Any Employment
SSA1983 x … 55 ≤ Age < 62 0.00392***
(0.00142) 0.00292***
(0.00108) -0.0310***
(0.00792) 62 ≤ Age < 65 0.00137
(0.00142) 0.00225**
(0.000971) 0.0132*
(0.00752) 65 ≤ Age < FRA -0.000309
(0.000845) 0.000289
(0.000783) 0.0462**
(0.0213) N 54,873 54,873 55,119
Notes: See notes to Tables 4 and 6. The SSDI application and receipt regressions use the HRS data merged with Form-831 data, while the any employment regression using the HRS data only. Significantly different from zero at 1-percent level (***), 5 percent level (**) or 10 percent level (*). Coefficients are interpreted as the average effect for each age group. The mean rate for SSDI applications for the entire sample is 0.0117, the mean rate for receiving SSDI is 0.00695, and the mean rate of any employment is 0.613. Source: See the source notes for Tables 4 and 6.
50
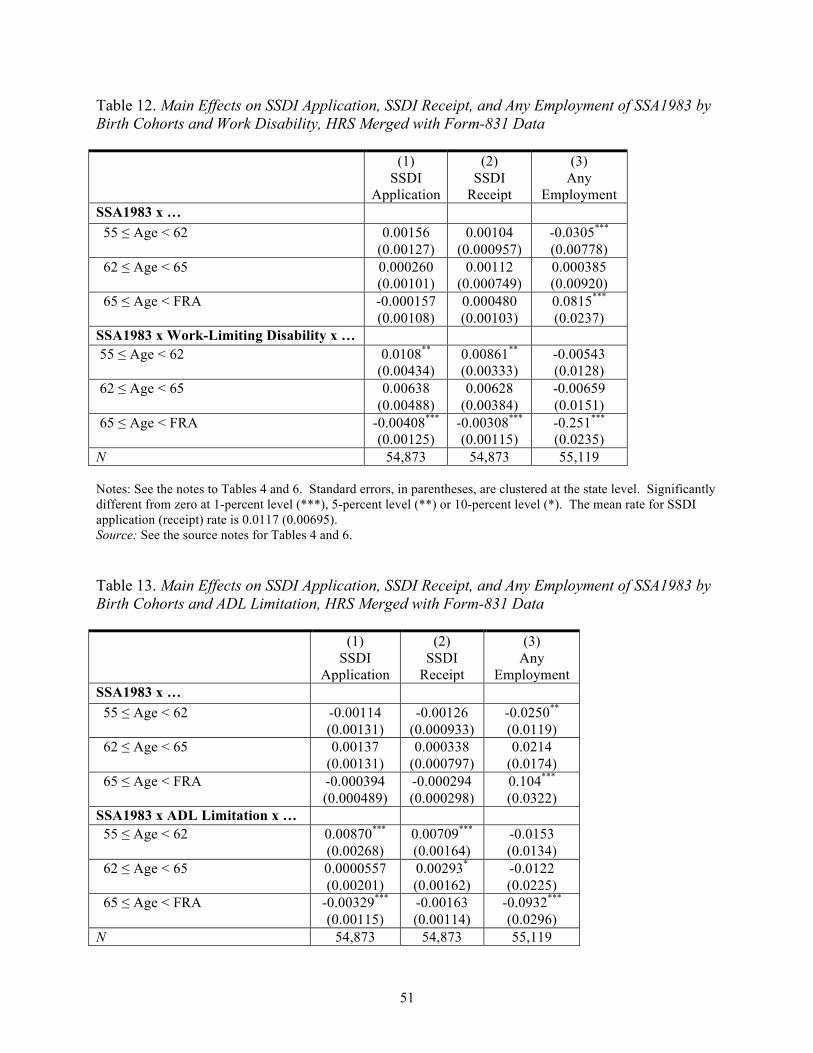
Table 12. Main Effects on SSDI Application, SSDI Receipt, and Any Employment of SSA1983 by Birth Cohorts and Work Disability, HRS Merged with Form-831 Data
(1) SSDI
Application
(2) SSDI
Receipt
(3) Any
Employment SSA1983 x …
55 ≤ Age < 62 0.00156 (0.00127)
0.00104 (0.000957)
-0.0305***
(0.00778) 62 ≤ Age < 65 0.000260
(0.00101) 0.00112
(0.000749) 0.000385 (0.00920)
65 ≤ Age < FRA -0.000157 (0.00108)
0.000480 (0.00103)
0.0815***
(0.0237) SSA1983 x Work-Limiting Disability x … 55 ≤ Age < 62 0.0108**
(0.00434) 0.00861**
(0.00333) -0.00543 (0.0128)
62 ≤ Age < 65 0.00638 (0.00488)
0.00628 (0.00384)
-0.00659 (0.0151)
65 ≤ Age < FRA -0.00408***
(0.00125) -0.00308***
(0.00115) -0.251***
(0.0235) N 54,873 54,873 55,119
Notes: See the notes to Tables 4 and 6. Standard errors, in parentheses, are clustered at the state level. Significantly different from zero at 1-percent level (***), 5-percent level (**) or 10-percent level (*). The mean rate for SSDI application (receipt) rate is 0.0117 (0.00695). Source: See the source notes for Tables 4 and 6.
Table 13. Main Effects on SSDI Application, SSDI Receipt, and Any Employment of SSA1983 by Birth Cohorts and ADL Limitation, HRS Merged with Form-831 Data
(1) SSDI
Application
(2) SSDI
Receipt
(3) Any
Employment SSA1983 x …
55 ≤ Age < 62 -0.00114 (0.00131)
-0.00126 (0.000933)
-0.0250**
(0.0119) 62 ≤ Age < 65 0.00137
(0.00131) 0.000338
(0.000797) 0.0214
(0.0174) 65 ≤ Age < FRA -0.000394
(0.000489) -0.000294 (0.000298)
0.104***
(0.0322) SSA1983 x ADL Limitation x …
55 ≤ Age < 62 0.00870***
(0.00268) 0.00709***
(0.00164) -0.0153 (0.0134)
62 ≤ Age < 65 0.0000557 (0.00201)
0.00293*
(0.00162) -0.0122 (0.0225)
65 ≤ Age < FRA -0.00329***
(0.00115) -0.00163 (0.00114)
-0.0932***
(0.0296) N 54,873 54,873 55,119
51
Notes: See the notes to Tables 4 and 6. Standard errors, in parentheses, are clustered at the state level. Significantly different from zero at 1-percent level (***), 5-percent level (**) or 10-percent level (*). The mean rate for SSDI application (receipt) rate is 0.0117 (0.00695). Source: See the source notes to Table 4 and 6.
52
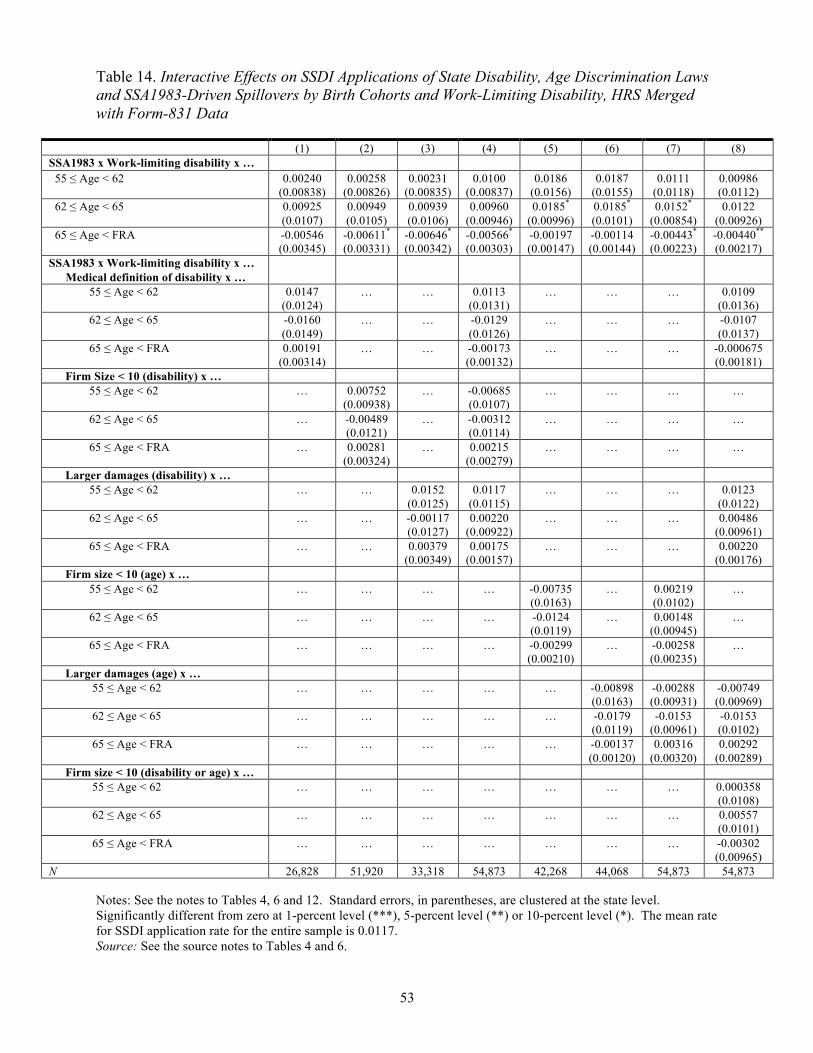
Table 14. Interactive Effects on SSDI Applications of State Disability, Age Discrimination Laws and SSA1983-Driven Spillovers by Birth Cohorts and Work-Limiting Disability, HRS Merged with Form-831 Data
(1) (2) (3) (4) (5) (6) (7) (8) SSA1983 x Work-limiting disability x …
55 ≤ Age < 62 0.00240 (0.00838)
0.00258 (0.00826)
0.00231 (0.00835)
0.0100 (0.00837)
0.0186 (0.0156)
0.0187 (0.0155)
0.0111 (0.0118)
0.00986 (0.0112)
62 ≤ Age < 65 0.00925 (0.0107)
0.00949 (0.0105)
0.00939 (0.0106)
0.00960 (0.00946)
0.0185*
(0.00996) 0.0185*
(0.0101) 0.0152*
(0.00854) 0.0122
(0.00926) 65 ≤ Age < FRA -0.00546
(0.00345) -0.00611*
(0.00331) -0.00646*
(0.00342) -0.00566*
(0.00303) -0.00197 (0.00147)
-0.00114 (0.00144)
-0.00443*
(0.00223) -0.00440**
(0.00217) SSA1983 x Work-limiting disability x …
Medical definition of disability x … 55 ≤ Age < 62 0.0147
(0.0124) … … 0.0113
(0.0131) … … … 0.0109
(0.0136) 62 ≤ Age < 65 -0.0160
(0.0149) … … -0.0129
(0.0126) … … … -0.0107
(0.0137) 65 ≤ Age < FRA 0.00191
(0.00314) … … -0.00173
(0.00132) … … … -0.000675
(0.00181) Firm Size < 10 (disability) x …
55 ≤ Age < 62 … 0.00752 (0.00938)
… -0.00685 (0.0107)
… … … …
62 ≤ Age < 65 … -0.00489 (0.0121)
… -0.00312 (0.0114)
… … … …
65 ≤ Age < FRA … 0.00281 (0.00324)
… 0.00215 (0.00279)
… … … …
Larger damages (disability) x … 55 ≤ Age < 62 … … 0.0152
(0.0125) 0.0117
(0.0115) … … … 0.0123
(0.0122) 62 ≤ Age < 65 … … -0.00117
(0.0127) 0.00220
(0.00922) … … … 0.00486
(0.00961) 65 ≤ Age < FRA … … 0.00379
(0.00349) 0.00175
(0.00157) … … … 0.00220
(0.00176) Firm size < 10 (age) x …
55 ≤ Age < 62 … … … … -0.00735 (0.0163)
… 0.00219 (0.0102)
…
62 ≤ Age < 65 … … … … -0.0124 (0.0119)
… 0.00148 (0.00945)
…
65 ≤ Age < FRA … … … … -0.00299 (0.00210)
… -0.00258 (0.00235)
…
Larger damages (age) x … 55 ≤ Age < 62 … … … … … -0.00898
(0.0163) -0.00288 (0.00931)
-0.00749 (0.00969)
62 ≤ Age < 65 … … … … … -0.0179 (0.0119)
-0.0153 (0.00961)
-0.0153 (0.0102)
65 ≤ Age < FRA … … … … … -0.00137 (0.00120)
0.00316 (0.00320)
0.00292 (0.00289)
Firm size < 10 (disability or age) x … 55 ≤ Age < 62 … … … … … … … 0.000358
(0.0108) 62 ≤ Age < 65 … … … … … … … 0.00557
(0.0101) 65 ≤ Age < FRA … … … … … … … -0.00302
(0.00965) N 26,828 51,920 33,318 54,873 42,268 44,068 54,873 54,873
Notes: See the notes to Tables 4, 6 and 12. Standard errors, in parentheses, are clustered at the state level. Significantly different from zero at 1-percent level (***), 5-percent level (**) or 10-percent level (*). The mean rate for SSDI application rate for the entire sample is 0.0117. Source: See the source notes to Tables 4 and 6.
53
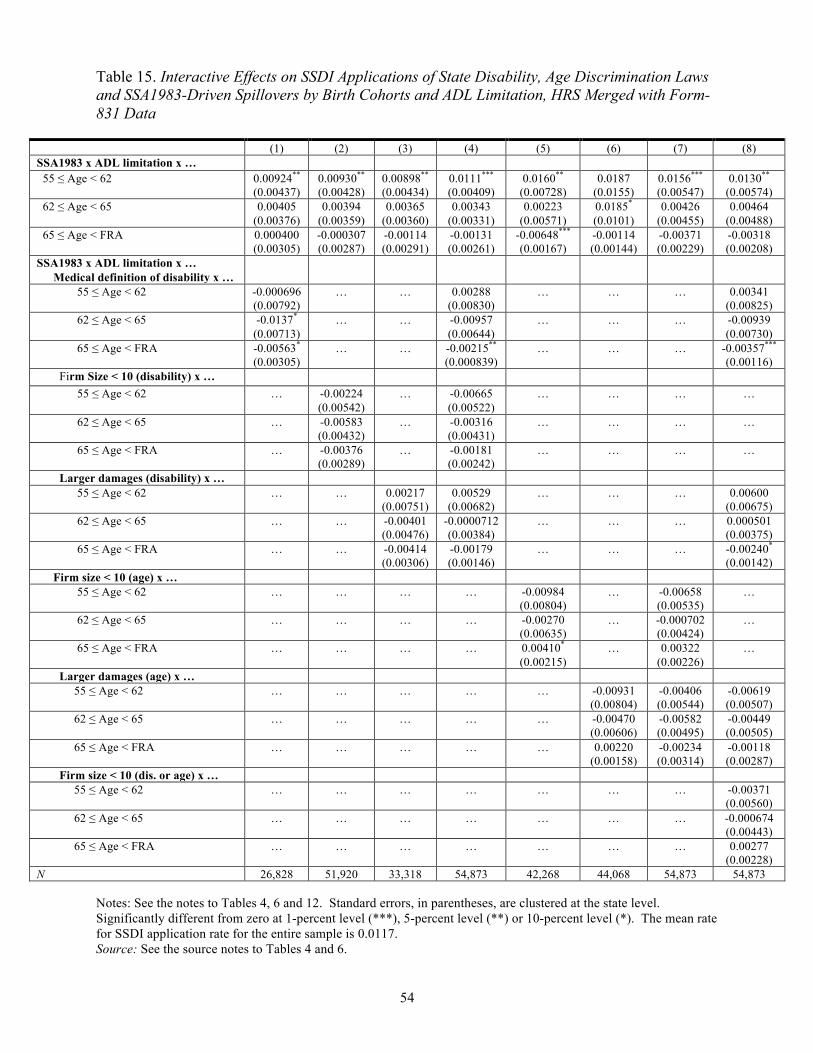
Table 15. Interactive Effects on SSDI Applications of State Disability, Age Discrimination Laws and SSA1983-Driven Spillovers by Birth Cohorts and ADL Limitation, HRS Merged with Form-831 Data
(1) (2) (3) (4) (5) (6) (7) (8) SSA1983 x ADL limitation x …
55 ≤ Age < 62 0.00924**
(0.00437) 0.00930**
(0.00428) 0.00898**
(0.00434) 0.0111***
(0.00409) 0.0160**
(0.00728) 0.0187
(0.0155) 0.0156***
(0.00547) 0.0130**
(0.00574) 62 ≤ Age < 65 0.00405
(0.00376) 0.00394
(0.00359) 0.00365
(0.00360) 0.00343
(0.00331) 0.00223
(0.00571) 0.0185*
(0.0101) 0.00426
(0.00455) 0.00464
(0.00488) 65 ≤ Age < FRA 0.000400
(0.00305) -0.000307 (0.00287)
-0.00114 (0.00291)
-0.00131 (0.00261)
-0.00648***
(0.00167) -0.00114 (0.00144)
-0.00371 (0.00229)
-0.00318 (0.00208)
SSA1983 x ADL limitation x … Medical definition of disability x …
55 ≤ Age < 62 -0.000696 (0.00792)
… … 0.00288 (0.00830)
… … … 0.00341 (0.00825)
62 ≤ Age < 65 -0.0137*
(0.00713) … … -0.00957
(0.00644) … … … -0.00939
(0.00730) 65 ≤ Age < FRA -0.00563*
(0.00305) … … -0.00215**
(0.000839) … … … -0.00357***
(0.00116) Firm Size < 10 (disability) x …
55 ≤ Age < 62 … -0.00224 (0.00542)
… -0.00665 (0.00522)
… … … …
62 ≤ Age < 65 … -0.00583 (0.00432)
… -0.00316 (0.00431)
… … … …
65 ≤ Age < FRA … -0.00376 (0.00289)
… -0.00181 (0.00242)
… … … …
Larger damages (disability) x … 55 ≤ Age < 62 … … 0.00217
(0.00751) 0.00529
(0.00682) … … … 0.00600
(0.00675) 62 ≤ Age < 65 … … -0.00401
(0.00476) -0.0000712 (0.00384)
… … … 0.000501 (0.00375)
65 ≤ Age < FRA … … -0.00414 (0.00306)
-0.00179 (0.00146)
… … … -0.00240*
(0.00142) Firm size < 10 (age) x …
55 ≤ Age < 62 … … … … -0.00984 (0.00804)
… -0.00658 (0.00535)
…
62 ≤ Age < 65 … … … … -0.00270 (0.00635)
… -0.000702 (0.00424)
…
65 ≤ Age < FRA … … … … 0.00410*
(0.00215) … 0.00322
(0.00226) …
Larger damages (age) x … 55 ≤ Age < 62 … … … … … -0.00931
(0.00804) -0.00406 (0.00544)
-0.00619 (0.00507)
62 ≤ Age < 65 … … … … … -0.00470 (0.00606)
-0.00582 (0.00495)
-0.00449 (0.00505)
65 ≤ Age < FRA … … … … … 0.00220 (0.00158)
-0.00234 (0.00314)
-0.00118 (0.00287)
Firm size < 10 (dis. or age) x … 55 ≤ Age < 62 … … … … … … … -0.00371
(0.00560) 62 ≤ Age < 65 … … … … … … … -0.000674
(0.00443) 65 ≤ Age < FRA … … … … … … … 0.00277
(0.00228) N 26,828 51,920 33,318 54,873 42,268 44,068 54,873 54,873
Notes: See the notes to Tables 4, 6 and 12. Standard errors, in parentheses, are clustered at the state level. Significantly different from zero at 1-percent level (***), 5-percent level (**) or 10-percent level (*). The mean rate for SSDI application rate for the entire sample is 0.0117. Source: See the source notes to Tables 4 and 6.
54
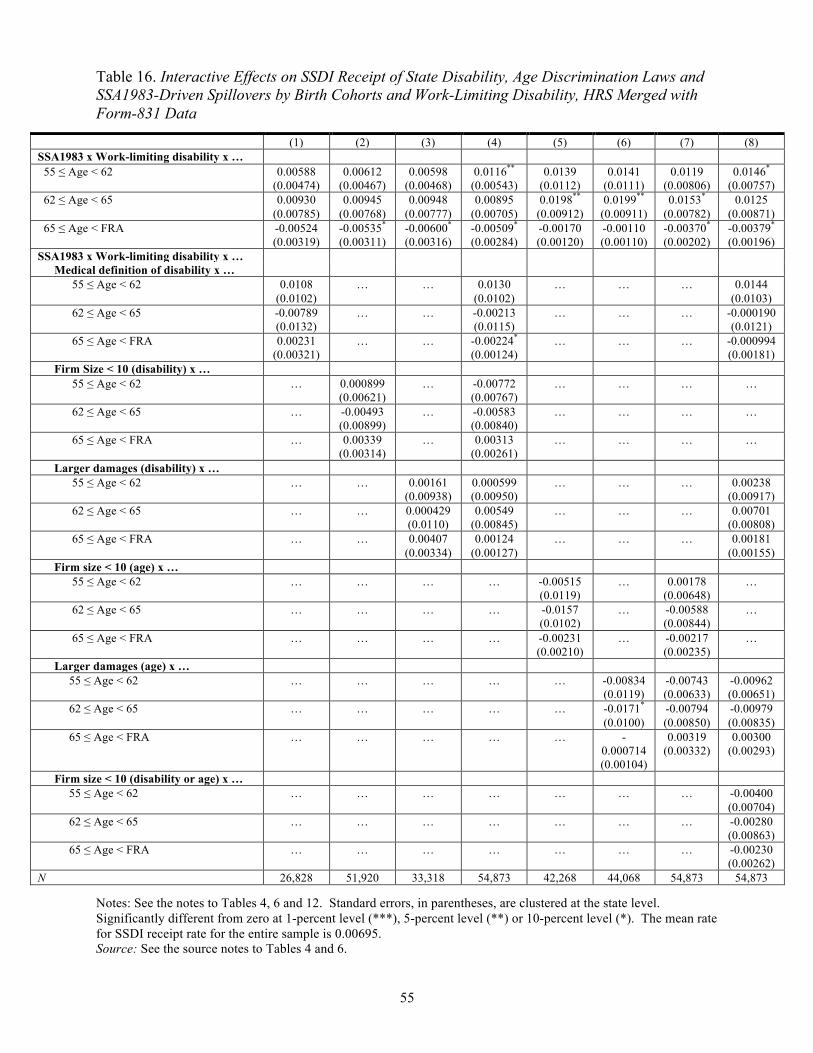
Table 16. Interactive Effects on SSDI Receipt of State Disability, Age Discrimination Laws and SSA1983-Driven Spillovers by Birth Cohorts and Work-Limiting Disability, HRS Merged with Form-831 Data
(1) (2) (3) (4) (5) (6) (7) (8) SSA1983 x Work-limiting disability x …
55 ≤ Age < 62 0.00588 (0.00474)
0.00612 (0.00467)
0.00598 (0.00468)
0.0116**
(0.00543) 0.0139
(0.0112) 0.0141
(0.0111) 0.0119
(0.00806) 0.0146*
(0.00757) 62 ≤ Age < 65 0.00930
(0.00785) 0.00945
(0.00768) 0.00948
(0.00777) 0.00895
(0.00705) 0.0198**
(0.00912) 0.0199**
(0.00911) 0.0153*
(0.00782) 0.0125
(0.00871) 65 ≤ Age < FRA -0.00524
(0.00319) -0.00535*
(0.00311) -0.00600*
(0.00316) -0.00509*
(0.00284) -0.00170 (0.00120)
-0.00110 (0.00110)
-0.00370*
(0.00202) -0.00379*
(0.00196) SSA1983 x Work-limiting disability x …
Medical definition of disability x … 55 ≤ Age < 62 0.0108
(0.0102) … … 0.0130
(0.0102) … … … 0.0144
(0.0103) 62 ≤ Age < 65 -0.00789
(0.0132) … … -0.00213
(0.0115) … … … -0.000190
(0.0121) 65 ≤ Age < FRA 0.00231
(0.00321) … … -0.00224*
(0.00124) … … … -0.000994
(0.00181) Firm Size < 10 (disability) x …
55 ≤ Age < 62 … 0.000899 (0.00621)
… -0.00772 (0.00767)
… … … …
62 ≤ Age < 65 … -0.00493 (0.00899)
… -0.00583 (0.00840)
… … … …
65 ≤ Age < FRA … 0.00339 (0.00314)
… 0.00313 (0.00261)
… … … …
Larger damages (disability) x … 55 ≤ Age < 62 … … 0.00161
(0.00938) 0.000599 (0.00950)
… … … 0.00238 (0.00917)
62 ≤ Age < 65 … … 0.000429 (0.0110)
0.00549 (0.00845)
… … … 0.00701 (0.00808)
65 ≤ Age < FRA … … 0.00407 (0.00334)
0.00124 (0.00127)
… … … 0.00181 (0.00155)
Firm size < 10 (age) x … 55 ≤ Age < 62 … … … … -0.00515
(0.0119) … 0.00178
(0.00648) …
62 ≤ Age < 65 … … … … -0.0157 (0.0102)
… -0.00588 (0.00844)
…
65 ≤ Age < FRA … … … … -0.00231 (0.00210)
… -0.00217 (0.00235)
…
Larger damages (age) x … 55 ≤ Age < 62 … … … … … -0.00834
(0.0119) -0.00743 (0.00633)
-0.00962 (0.00651)
62 ≤ Age < 65 … … … … … -0.0171*
(0.0100) -0.00794 (0.00850)
-0.00979 (0.00835)
65 ≤ Age < FRA … … … … … -0.000714 (0.00104)
0.00319 (0.00332)
0.00300 (0.00293)
Firm size < 10 (disability or age) x … 55 ≤ Age < 62 … … … … … … … -0.00400
(0.00704) 62 ≤ Age < 65 … … … … … … … -0.00280
(0.00863) 65 ≤ Age < FRA … … … … … … … -0.00230
(0.00262) N 26,828 51,920 33,318 54,873 42,268 44,068 54,873 54,873
Notes: See the notes to Tables 4, 6 and 12. Standard errors, in parentheses, are clustered at the state level. Significantly different from zero at 1-percent level (***), 5-percent level (**) or 10-percent level (*). The mean rate for SSDI receipt rate for the entire sample is 0.00695. Source: See the source notes to Tables 4 and 6.
55
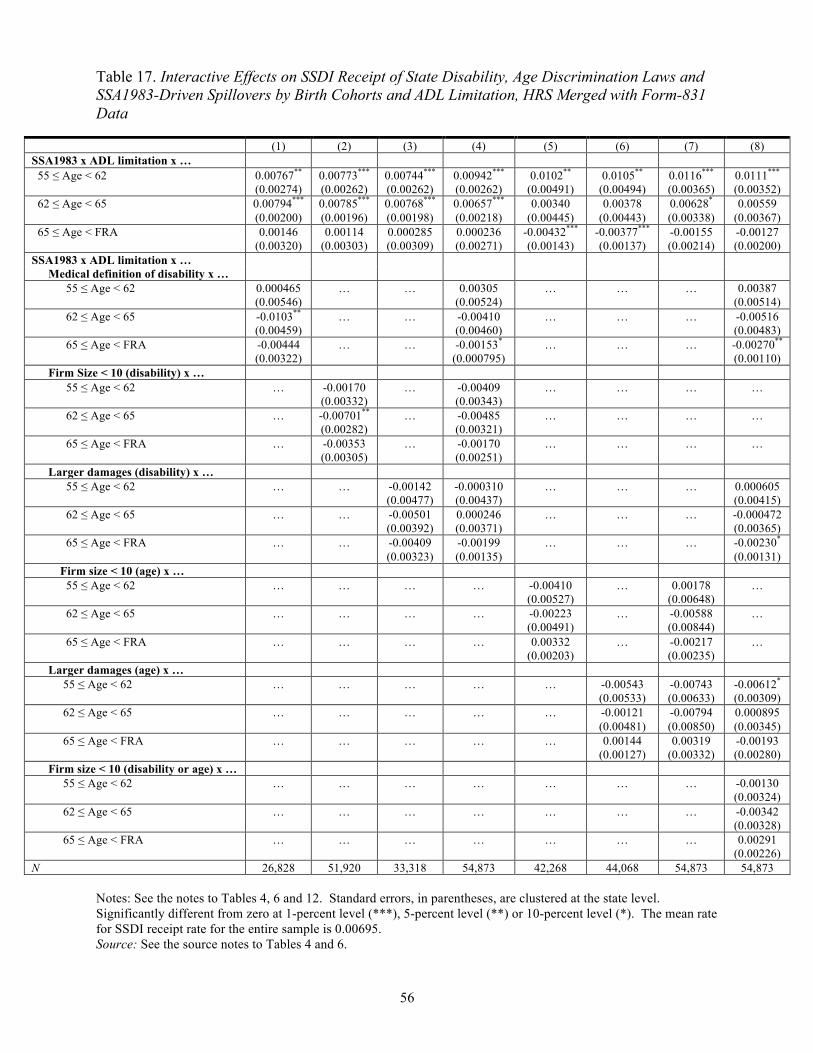
Table 17. Interactive Effects on SSDI Receipt of State Disability, Age Discrimination Laws and SSA1983-Driven Spillovers by Birth Cohorts and ADL Limitation, HRS Merged with Form-831 Data
(1) (2) (3) (4) (5) (6) (7) (8) SSA1983 x ADL limitation x …
55 ≤ Age < 62 0.00767**
(0.00274) 0.00773***
(0.00262) 0.00744***
(0.00262) 0.00942***
(0.00262) 0.0102**
(0.00491) 0.0105**
(0.00494) 0.0116***
(0.00365) 0.0111***
(0.00352) 62 ≤ Age < 65 0.00794***
(0.00200) 0.00785***
(0.00196) 0.00768***
(0.00198) 0.00657***
(0.00218) 0.00340
(0.00445) 0.00378
(0.00443) 0.00628*
(0.00338) 0.00559
(0.00367) 65 ≤ Age < FRA 0.00146
(0.00320) 0.00114
(0.00303) 0.000285 (0.00309)
0.000236 (0.00271)
-0.00432***
(0.00143) -0.00377***
(0.00137) -0.00155 (0.00214)
-0.00127 (0.00200)
SSA1983 x ADL limitation x … Medical definition of disability x …
55 ≤ Age < 62 0.000465 (0.00546)
… … 0.00305 (0.00524)
… … … 0.00387 (0.00514)
62 ≤ Age < 65 -0.0103**
(0.00459) … … -0.00410
(0.00460) … … … -0.00516
(0.00483) 65 ≤ Age < FRA -0.00444
(0.00322) … … -0.00153*
(0.000795) … … … -0.00270**
(0.00110) Firm Size < 10 (disability) x …
55 ≤ Age < 62 … -0.00170 (0.00332)
… -0.00409 (0.00343)
… … … …
62 ≤ Age < 65 … -0.00701**
(0.00282) … -0.00485
(0.00321) … … … …
65 ≤ Age < FRA … -0.00353 (0.00305)
… -0.00170 (0.00251)
… … … …
Larger damages (disability) x … 55 ≤ Age < 62 … … -0.00142
(0.00477) -0.000310 (0.00437)
… … … 0.000605 (0.00415)
62 ≤ Age < 65 … … -0.00501 (0.00392)
0.000246 (0.00371)
… … … -0.000472 (0.00365)
65 ≤ Age < FRA … … -0.00409 (0.00323)
-0.00199 (0.00135)
… … … -0.00230*
(0.00131) Firm size < 10 (age) x …
55 ≤ Age < 62 … … … … -0.00410 (0.00527)
… 0.00178 (0.00648)
…
62 ≤ Age < 65 … … … … -0.00223 (0.00491)
… -0.00588 (0.00844)
…
65 ≤ Age < FRA … … … … 0.00332 (0.00203)
… -0.00217 (0.00235)
…
Larger damages (age) x … 55 ≤ Age < 62 … … … … … -0.00543
(0.00533) -0.00743 (0.00633)
-0.00612*
(0.00309) 62 ≤ Age < 65 … … … … … -0.00121
(0.00481) -0.00794 (0.00850)
0.000895 (0.00345)
65 ≤ Age < FRA … … … … … 0.00144 (0.00127)
0.00319 (0.00332)
-0.00193 (0.00280)
Firm size < 10 (disability or age) x … 55 ≤ Age < 62 … … … … … … … -0.00130
(0.00324) 62 ≤ Age < 65 … … … … … … … -0.00342
(0.00328) 65 ≤ Age < FRA … … … … … … … 0.00291
(0.00226) N 26,828 51,920 33,318 54,873 42,268 44,068 54,873 54,873
Notes: See the notes to Tables 4, 6 and 12. Standard errors, in parentheses, are clustered at the state level. Significantly different from zero at 1-percent level (***), 5-percent level (**) or 10-percent level (*). The mean rate for SSDI receipt rate for the entire sample is 0.00695. Source: See the source notes to Tables 4 and 6.
56

Table 18. Interactive Effects on Any Employment of State Disability, Age Discrimination Laws and SSA1983-Driven Spillovers by Birth Cohorts and Work-Limiting Disability, HRS Data
(1) (2) (3) (4) (5) (6) (7) (8) SSA1983 x Work-limiting disability x …
55 ≤ Age < 62 0.0172 (0.0158)
0.0148 (0.0151)
0.0157 (0.0151)
0.000156 (0.0160)
-0.0395 (0.0264)
-0.0384 (0.0263)
-0.00537 (0.0248)
-0.00219 (0.0236)
62 ≤ Age < 65 0.0172 (0.0178)
0.0154 (0.0176)
0.0182 (0.0183)
0.00661 (0.0193)
0.00570 (0.0489)
0.00701 (0.0487)
0.0281 (0.0374)
0.0212 (0.0327)
65 ≤ Age < FRA -0.295***
(0.0353) -0.298***
(0.0364) -0.293***
(0.0361) -0.268***
(0.0378) -0.177***
(0.0309) -0.182***
(0.0315) -0.233***
(0.0384) -0.243***
(0.0440) SSA1983 x Work-limiting disability x …
Medical definition of disability x … 55 ≤ Age < 62 0.000891
(0.0279) … … 0.0239
(0.0386) … … … 0.0243
(0.0379) 62 ≤ Age < 65 -0.0331
(0.0404) … … -0.0200
(0.0421) … … … -0.00839
(0.0406) 65 ≤ Age < FRA 0.0233
(0.0923) … … -0.0551
(0.0943) … … … -0.00839
(0.0471) Firm Size < 10 (disability) x …
55 ≤ Age < 62 … -0.0195 (0.0226)
… 0.00122 (0.0271)
… … … …
62 ≤ Age < 65 … -0.0231 (0.0262)
… 0.0101 (0.0324)
… … … …
65 ≤ Age < FRA … 0.0564 (0.0484)
… 0.0378 (0.0577)
… … … …
Larger damages (disability) x … 55 ≤ Age < 62 … … -0.0449
(0.0292) -0.0362 (0.0292)
… … … -0.0356 (0.0285)
62 ≤ Age < 65 … … -0.0631*
(0.0323) -0.0584*
(0.0333) … … … -0.0497
(0.0347) 65 ≤ Age < FRA … … 0.0636
(0.0562) 0.00702 (0.0591)
… … … 0.0191 (0.0579)
Firm size < 10 (age) x … 55 ≤ Age < 62 … … … … 0.0339
(0.0315) … 0.00609
(0.0265) …
62 ≤ Age < 65 … … … … -0.0233 (0.0519)
… -0.0220 (0.0304)
…
65 ≤ Age < FRA … … … … -0.0811*
(0.0457) … -0.0320
(0.0507) …
Larger damages (age) x … 55 ≤ Age < 62 … … … … … 0.0328
(0.0308) -0.00680 (0.0274)
-0.00439 (0.0270)
62 ≤ Age < 65 … … … … … -0.0250 (0.0514)
-0.0317 (0.0324)
-0.0242 (0.0334)
65 ≤ Age < FRA … … … … … -0.0716 (0.0432)
0.00380 (0.0561)
-0.000161 (0.0617)
Firm size < 10 (disability or age) x … 55 ≤ Age < 62 … … … … … … … 0.00772
(0.0273) 62 ≤ Age < 65 … … … … … … … 0.00365
(0.0329) 65 ≤ Age < FRA … … … … … … … -0.0110
(0.0573) N 26,955 52,150 33,473 55,119 42,453 44,269 55,119 55,119
Notes: See the notes to Tables 4, 6 and 12. Standard errors, in parentheses, are clustered at the state level. Significantly different from zero at 1-percent level (***), 5-percent level (**) or 10-percent level (*). The mean rate of any employment is 0.613. Source: See the source notes to Tables 4 and 6.
57
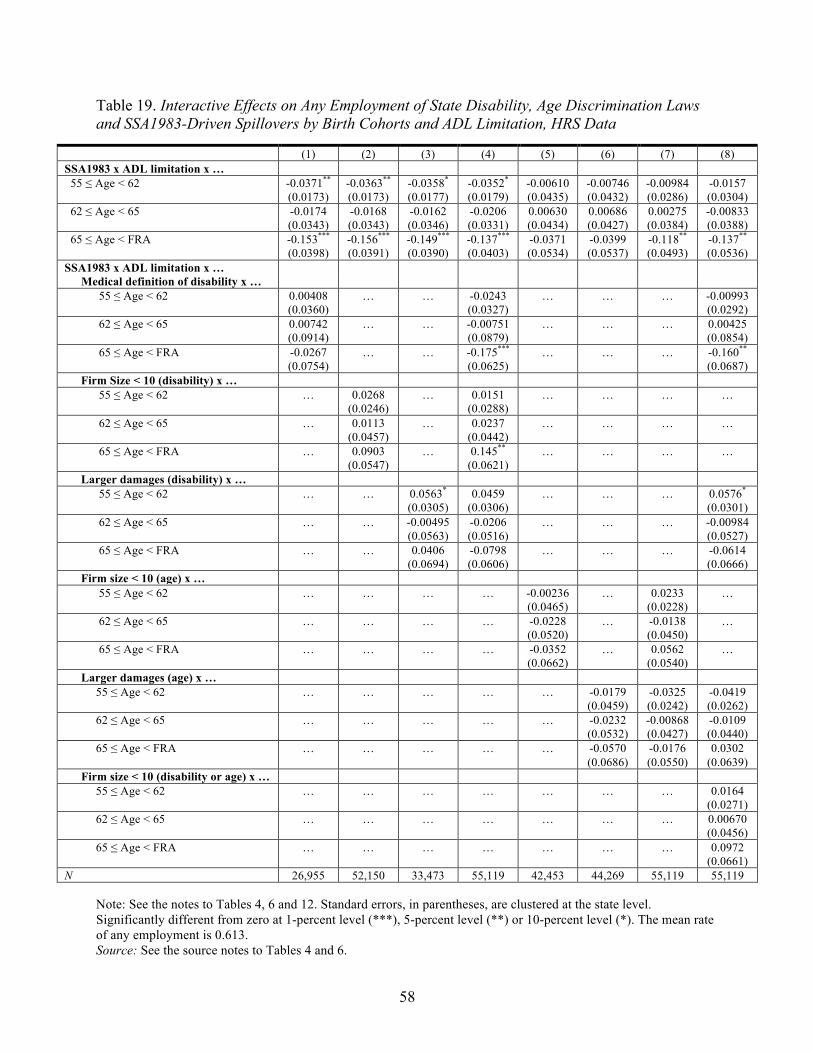
Table 19. Interactive Effects on Any Employment of State Disability, Age Discrimination Laws and SSA1983-Driven Spillovers by Birth Cohorts and ADL Limitation, HRS Data
(1) (2) (3) (4) (5) (6) (7) (8) SSA1983 x ADL limitation x …
55 ≤ Age < 62 -0.0371**
(0.0173) -0.0363**
(0.0173) -0.0358*
(0.0177) -0.0352*
(0.0179) -0.00610 (0.0435)
-0.00746 (0.0432)
-0.00984 (0.0286)
-0.0157 (0.0304)
62 ≤ Age < 65 -0.0174 (0.0343)
-0.0168 (0.0343)
-0.0162 (0.0346)
-0.0206 (0.0331)
0.00630 (0.0434)
0.00686 (0.0427)
0.00275 (0.0384)
-0.00833 (0.0388)
65 ≤ Age < FRA -0.153***
(0.0398) -0.156***
(0.0391) -0.149***
(0.0390) -0.137***
(0.0403) -0.0371 (0.0534)
-0.0399 (0.0537)
-0.118**
(0.0493) -0.137**
(0.0536) SSA1983 x ADL limitation x …
Medical definition of disability x … 55 ≤ Age < 62 0.00408
(0.0360) … … -0.0243
(0.0327) … … … -0.00993
(0.0292) 62 ≤ Age < 65 0.00742
(0.0914) … … -0.00751
(0.0879) … … … 0.00425
(0.0854) 65 ≤ Age < FRA -0.0267
(0.0754) … … -0.175***
(0.0625) … … … -0.160**
(0.0687) Firm Size < 10 (disability) x …
55 ≤ Age < 62 … 0.0268 (0.0246)
… 0.0151 (0.0288)
… … … …
62 ≤ Age < 65 … 0.0113 (0.0457)
… 0.0237 (0.0442)
… … … …
65 ≤ Age < FRA … 0.0903 (0.0547)
… 0.145**
(0.0621) … … … …
Larger damages (disability) x … 55 ≤ Age < 62 … … 0.0563*
(0.0305) 0.0459
(0.0306) … … … 0.0576*
(0.0301) 62 ≤ Age < 65 … … -0.00495
(0.0563) -0.0206 (0.0516)
… … … -0.00984 (0.0527)
65 ≤ Age < FRA … … 0.0406 (0.0694)
-0.0798 (0.0606)
… … … -0.0614 (0.0666)
Firm size < 10 (age) x … 55 ≤ Age < 62 … … … … -0.00236
(0.0465) … 0.0233
(0.0228) …
62 ≤ Age < 65 … … … … -0.0228 (0.0520)
… -0.0138 (0.0450)
…
65 ≤ Age < FRA … … … … -0.0352 (0.0662)
… 0.0562 (0.0540)
…
Larger damages (age) x … 55 ≤ Age < 62 … … … … … -0.0179
(0.0459) -0.0325 (0.0242)
-0.0419 (0.0262)
62 ≤ Age < 65 … … … … … -0.0232 (0.0532)
-0.00868 (0.0427)
-0.0109 (0.0440)
65 ≤ Age < FRA … … … … … -0.0570 (0.0686)
-0.0176 (0.0550)
0.0302 (0.0639)
Firm size < 10 (disability or age) x … 55 ≤ Age < 62 … … … … … … … 0.0164
(0.0271) 62 ≤ Age < 65 … … … … … … … 0.00670
(0.0456) 65 ≤ Age < FRA … … … … … … … 0.0972
(0.0661) N 26,955 52,150 33,473 55,119 42,453 44,269 55,119 55,119
Note: See the notes to Tables 4, 6 and 12. Standard errors, in parentheses, are clustered at the state level. Significantly different from zero at 1-percent level (***), 5-percent level (**) or 10-percent level (*). The mean rate of any employment is 0.613. Source: See the source notes to Tables 4 and 6.
58
Online Appendices
Contents
A. Summary of Disability and Age Discrimination Literature
B. Additional Information on the Data
C. Details on the Calculation of OASI and SSDI Benefits
D. Tables for Heterogeneous Effects by Sex and Age Cohort, Aggregated SSDI Data
E. Tables for Robustness Checks, Aggregated SSDI Data
F. Tables for Results without Separate Effect by Age or Disability, HRS Data
G. Tables for Results by Age Cohort Only, HRS Data
H. Tables for Results by Disability Status Only, HRS Data
I. Tables for Results by Age Cohort, Disability Status, and Sex, HRS Data
J. Additional References not Cited in the Main Paper
59
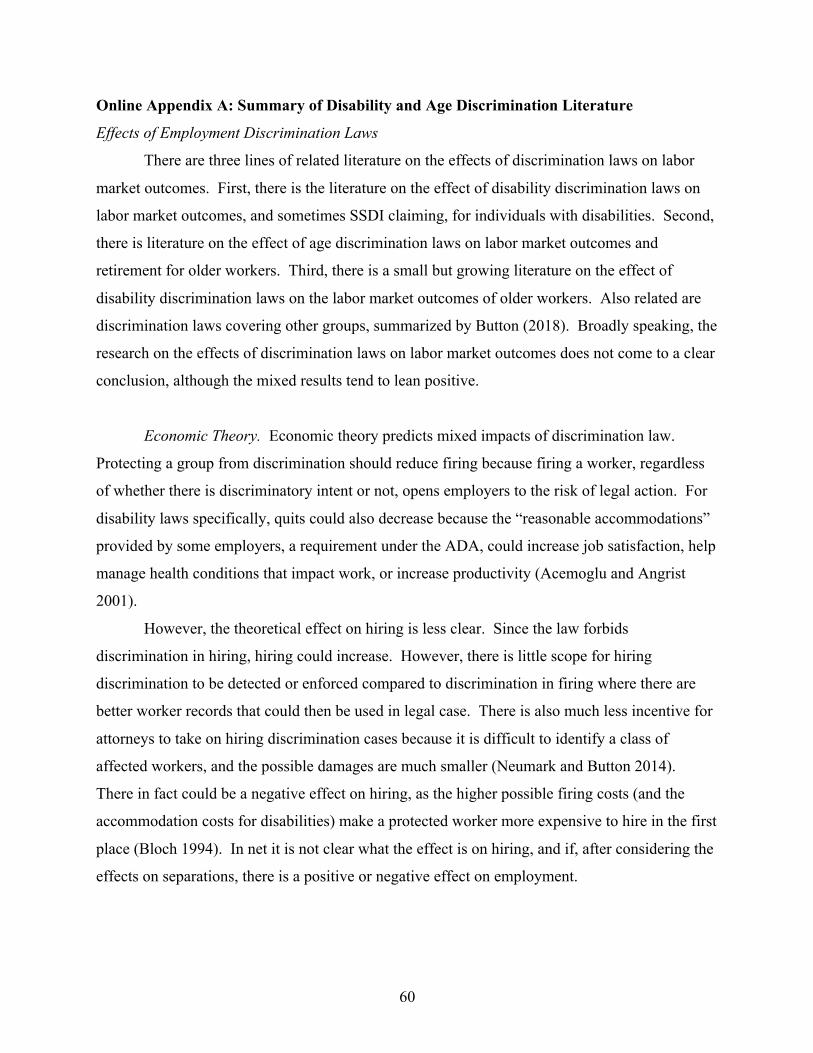
Online Appendix A: Summary of Disability and Age Discrimination Literature
Effects of Employment Discrimination Laws
There are three lines of related literature on the effects of discrimination laws on labor
market outcomes. First, there is the literature on the effect of disability discrimination laws on
labor market outcomes, and sometimes SSDI claiming, for individuals with disabilities. Second,
there is literature on the effect of age discrimination laws on labor market outcomes and
retirement for older workers. Third, there is a small but growing literature on the effect of
disability discrimination laws on the labor market outcomes of older workers. Also related are
discrimination laws covering other groups, summarized by Button (2018). Broadly speaking, the
research on the effects of discrimination laws on labor market outcomes does not come to a clear
conclusion, although the mixed results tend to lean positive.
Economic Theory. Economic theory predicts mixed impacts of discrimination law.
Protecting a group from discrimination should reduce firing because firing a worker, regardless
of whether there is discriminatory intent or not, opens employers to the risk of legal action. For
disability laws specifically, quits could also decrease because the “reasonable accommodations”
provided by some employers, a requirement under the ADA, could increase job satisfaction, help
manage health conditions that impact work, or increase productivity (Acemoglu and Angrist
2001).
However, the theoretical effect on hiring is less clear. Since the law forbids
discrimination in hiring, hiring could increase. However, there is little scope for hiring
discrimination to be detected or enforced compared to discrimination in firing where there are
better worker records that could then be used in legal case. There is also much less incentive for
attorneys to take on hiring discrimination cases because it is difficult to identify a class of
affected workers, and the possible damages are much smaller (Neumark and Button 2014).
There in fact could be a negative effect on hiring, as the higher possible firing costs (and the
accommodation costs for disabilities) make a protected worker more expensive to hire in the first
place (Bloch 1994). In net it is not clear what the effect is on hiring, and if, after considering the
effects on separations, there is a positive or negative effect on employment.
60
Disability Discrimination Laws and Individuals with Disabilities. The empirical studies
analyzing the effects of disability discrimination laws on labor market outcomes for individuals
with disabilities often come to different conclusions. We summarize these studies in Appendix
Table A1. Early work found negative effects of the ADA on employment of individuals with
disabilities (Acemoglu and Angrist 2001; DeLeire 2000, 2001). Numerous scholars questioned
these results on technical grounds.
Kruse and Schur (2003) argue that the “work-limited” measure of disability used in
previous studies was endogenous to employment, leading to a negatively biased estimated effect
of the ADA on employment. They also argue that the “work-limited” measure was very
different than the definition of disability in the ADA. They developed a new set of disability
measures using the functional limitation modules in the SIPP. They created a set of disability
indicators defining an individual as having a disability if they report at least one limitation to an
activity of daily life (ADL). This is more in line with the definition of the ADA, which requires
that an individual be “substantially limited” in a “major life activity.” Using this broader set of
disability indicators, Kruse and Schur (2003) find that the effects of the ADA depend on the
measure used, with negative effects only for the endogenous work-limited measure, and positive
effects with the more appropriate ADL limitation measures. Further, Button, Armour, and
Hollands (2017a) replicate Kruse and Schur’s (2003) comparison of work-limited and ADL
measures but instead use hiring as one of the outcome variables and find similar results to Kruse
and Schur (2003)—that the ADA boosted hiring using the ADL measure of disability.
Houtenville and Burkhauser (2004), and later Button (2018) and Button, Armour, and
Hollands (2017a), criticize the earlier research for using a control group that experienced
different employment trends, such that the “parallel paths” (Mora and Reggio 2019) assumption
did not hold, leading to negatively biased estimated employment effects. Houtenville and
Burkhauser (2004) argue that, starting in the 1980s, there was a preexisting negative employment
trend for individuals with disabilities, which was related to increased accessibility of SSDI and
SSI programs. Bound and Waidmann (2002) also make note of this preexisting trend.
Houtenville and Burkhauser (2004) also find no negative effects of the ADA, but instead find
some positive effects if they instead used a work-limited measure of disability where the
individual reported being work-limited two periods in a row.
61
Hotchkiss (2004) shows that the negative estimated effects of the ADA in Acemoglu and
Angrist (2001) and DeLeire (2000, 2001) were attributable to a reclassification of individuals
without disabilities who were not in the labor force as “disabled” under the work-limited
measure, again reflecting concerns regarding the work-limited measure being endogenous.
Even discounting these earlier studies, the literature since then still shows mixed effects
of disability discrimination laws, although these results lean toward showing positive effects or
no effects. Bell and Heitmueller (2009) find that the UK’s similar law, the Disability
Discrimination Act, passed in 1995 and decreased employment at least in the short-term. Button,
Armour, and Hollands (2017a) and Armour, Button, and Hollands (2018) explore variation in the
ADA since it was originally adopted. They find mixed effects depending on how disability is
defined, which labor market outcome (e.g., hiring vs. employment) is used, and which legal
change is considered, although the effects generally lean positive. Using similar variation,
Thompkins (2015) finds that neither the SCOTUS cases that narrowed the definition of disability
nor the Americans with Disabilities Act Amendments Act (ADAAA) that expanded it were
associated with employment effects. Ameri et al. (2018) take the innovative approach of
conducting a resume-correspondence experiment quantifying discrimination in hiring. They
compare the interview offer rates for on-average identical resumes submitted to accounting
positions by individuals with and without disabilities (Asperger’s or spinal cord injury), both of
which should have no effect (or maybe even a positive effect) on productivity in accounting.
They find that discrimination is lower for larger firms covered by the ADA compared to smaller
firms that are not covered. However, they do not find any effects of the state disability
discrimination laws that we explore in this paper.
Several studies exploit changes in disability discrimination laws at the state level, which
allows for an additional control group: states with no changes in discrimination law. This
additional control group is important as it does not require a direct comparison of individuals
with and without disabilities, two groups that experience very different employment trends. It
allows for multiple treatment and control groups, which can improve statistical inference (see,
e.g., Donald and Lang 2007). Beegle and Stock (2003) explore the effects of state disability
discrimination laws that were adopted before the ADA, generally finding no effect of these laws
on employment after controlling for the preexisting differential employment trends for
individuals with disabilities. Jolls and Prescott (2004) explore how the introduction of the ADA
62
differed based on existing state laws, finding that the negative effects of the ADA found in
Acemoglu and Angrist (2001) and DeLeire (2000) were confined to states that did not, prior to
the ADA, require reasonable accommodations. Button (2018) finds that employment of
individuals with disabilities increased after California’s Prudence Kay Poppink Act in 2001,
which broadened the definition of disability under California law. However, Button, Armour,
and Hollands (2017b) conduct a much broader evaluation of the effects of state disability
discrimination laws adopted since the ADA and their early results do not find many effects.
Age Discrimination Laws and Older Workers. The research on how age discrimination
laws affect labor market outcomes for older workers is also mixed, but again the effects lean
positive (Appendix Table A2). Adams (2004) and Neumark and Stock (1999) find that the
adoption of state and federal age discrimination laws increased employment of older workers. In
contrast, Lahey (2008) finds that hiring rates for older workers are lower in states where it was
easier to file an ADEA claim. However, Neumark (2009) disputes the interpretation of the
results in Lahey (2008), suggesting instead that the results can be interpreted differently in a way
that shows a positive effect.
Recent work explores previously unexplored aspects of state age discrimination laws,
which are also considered in this paper “lower firm size (age)” and “larger damages (age).”
Neumark and Song (2013) use a research design like ours and find increased hiring of older
workers “caught” by the SSA1983 in states with age discrimination laws that have “lower firm
size (age)” and “larger damages (age).” Neumark and Button (2014) find more mixed evidence
suggesting that the effect of age discrimination laws may vary over the business cycle, with the
laws perhaps having a negative effect during the Great Recession. For men, “larger damages
(age)” is associated with shorter unemployment durations before the Great Recession, but with
unemployment durations that increased disproportionately more for older workers during and
after the Great Recession. For women, “larger damages (age)” is associated with increased
hiring of older workers before the Great Recession but larger decreases in hiring during and after
the Great Recession.
Neumark et al. (2019) take a unique approach, using a resume-correspondence
experiment modeled off Neumark, Burn, and Button (2019) to measure if older workers get
relatively fewer interview offers in states with stronger or broader age and disability
63
discrimination laws (using all five measures considered in this paper). They find some evidence
that “larger damages (age)” decreases age discrimination against older women and older men
and “larger damages (disability)” decreases age discrimination against older women. But there is
no evidence that broader laws, a lower firm size of a broader definition of disability, affect
discrimination.
Disability Discrimination Laws and Older Workers. More importantly for this study,
there is a small but growing literature on how disability discrimination laws affect older workers
(Appendix Table A3). The first study of this kind, Stock and Beegle (2004), examines how the
adoption of state disability discrimination laws prior to the ADA affected employment of older
workers, finding that disability discrimination laws increase employment of older workers
without disabilities but only when there is both an age and a disability discrimination law.
Neumark et al. (2019), discussed above, finds that “larger damages (disability)” may reduce age
discrimination against older women. Neumark, Song, and Button (2017) also provide cross-
sectional evidence that a broader definition of disability is associated with increased relative
hiring of older men.
64
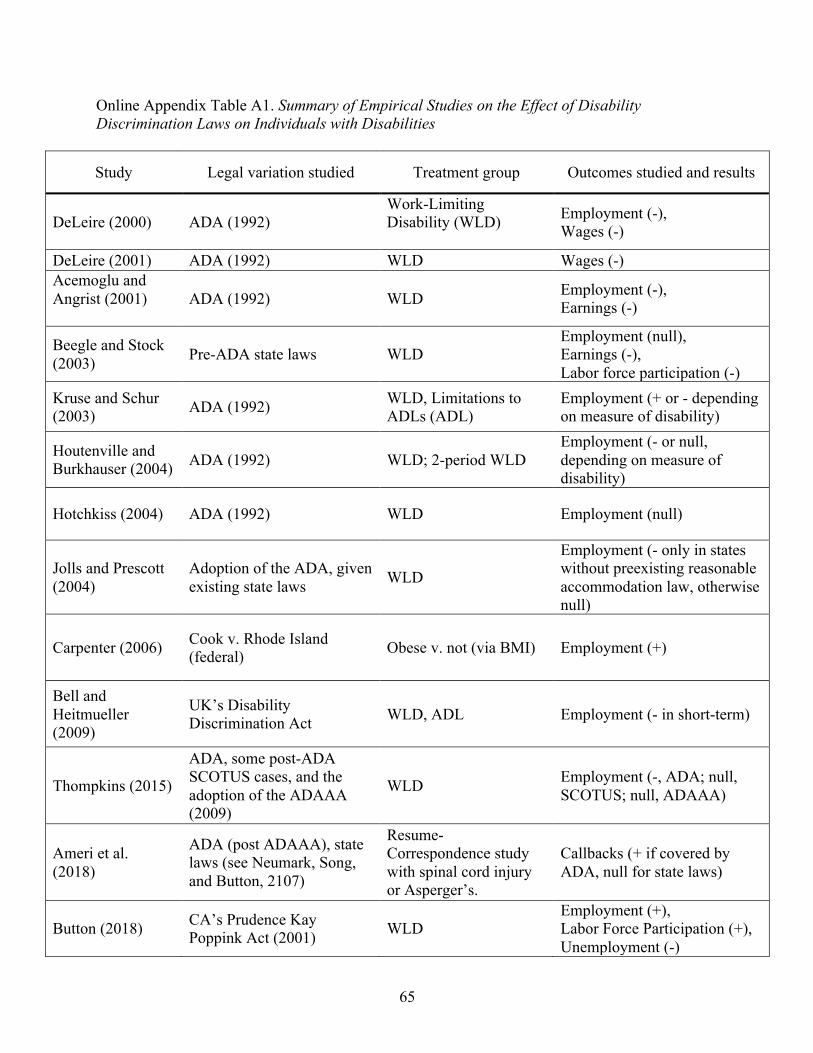
Online Appendix Table A1. Summary of Empirical Studies on the Effect of Disability Discrimination Laws on Individuals with Disabilities
Study Legal variation studied Treatment group Outcomes studied and results
DeLeire (2000) ADA (1992) Work-Limiting Disability (WLD) Employment (-),
Wages (-)
DeLeire (2001) ADA (1992) WLD Wages (-) Acemoglu and Angrist (2001) ADA (1992) WLD Employment (-),
Earnings (-)
Beegle and Stock (2003) Pre-ADA state laws WLD
Employment (null), Earnings (-), Labor force participation (-)
Kruse and Schur (2003) ADA (1992) WLD, Limitations to
ADLs (ADL) Employment (+ or - depending on measure of disability)
Houtenville and Burkhauser (2004) ADA (1992) WLD; 2-period WLD
Employment (- or null, depending on measure of disability)
Hotchkiss (2004) ADA (1992) WLD Employment (null)
Jolls and Prescott (2004)
Adoption of the ADA, given existing state laws WLD
Employment (- only in states without preexisting reasonable accommodation law, otherwise null)
Carpenter (2006) Cook v. Rhode Island (federal) Obese v. not (via BMI) Employment (+)
Bell and Heitmueller (2009)
UK’s Disability Discrimination Act WLD, ADL Employment (- in short-term)
Thompkins (2015)
ADA, some post-ADA SCOTUS cases, and the adoption of the ADAAA (2009)
WLD Employment (-, ADA; null, SCOTUS; null, ADAAA)
Ameri et al. (2018)
ADA (post ADAAA), state laws (see Neumark, Song, and Button, 2107)
Resume-Correspondence study with spinal cord injury or Asperger’s.
Callbacks (+ if covered by ADA, null for state laws)
Button (2018) CA’s Prudence Kay Poppink Act (2001) WLD
Employment (+), Labor Force Participation (+), Unemployment (-)
65
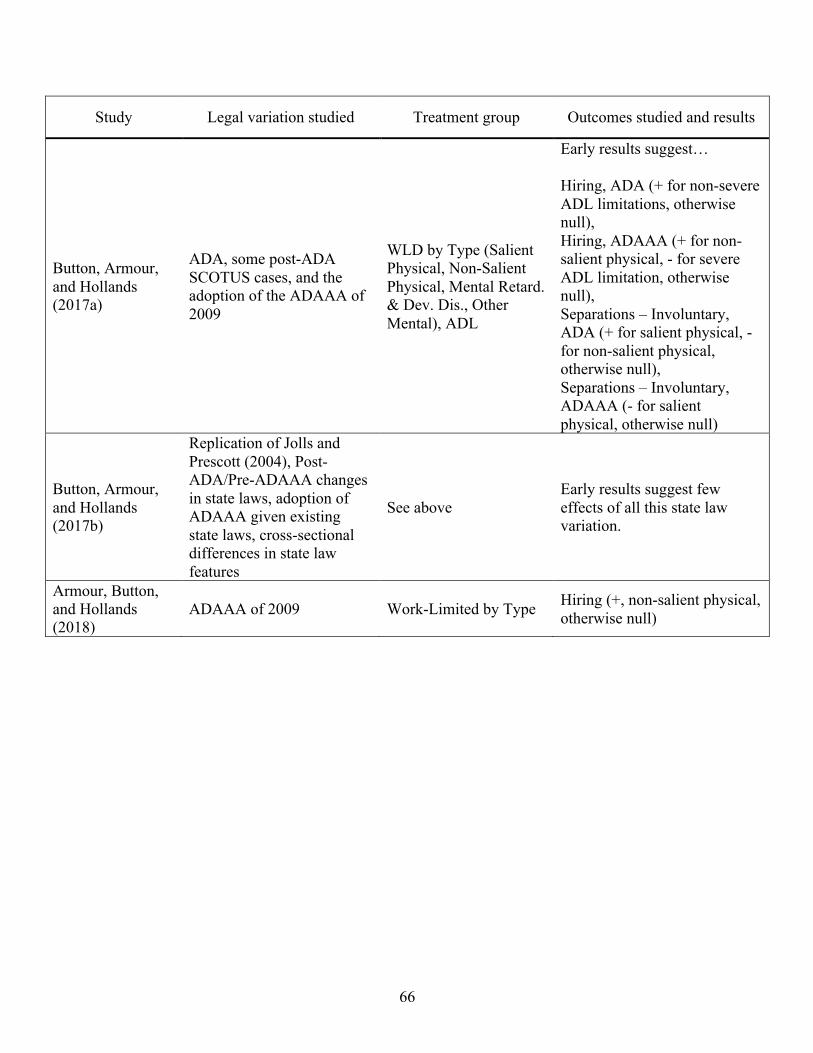
Study Legal variation studied Treatment group Outcomes studied and results
Button, Armour, and Hollands (2017a)
ADA, some post-ADA SCOTUS cases, and the adoption of the ADAAA of 2009
WLD by Type (Salient Physical, Non-Salient Physical, Mental Retard. & Dev. Dis., Other Mental), ADL
Early results suggest…
Hiring, ADA (+ for non-severe ADL limitations, otherwise null), Hiring, ADAAA (+ for non-salient physical, - for severe ADL limitation, otherwise null), Separations – Involuntary, ADA (+ for salient physical, -for non-salient physical, otherwise null), Separations – Involuntary, ADAAA (- for salient physical, otherwise null)
Button, Armour, and Hollands (2017b)
Replication of Jolls and Prescott (2004), Post-ADA/Pre-ADAAA changes in state laws, adoption of ADAAA given existing state laws, cross-sectional differences in state law features
See above Early results suggest few effects of all this state law variation.
Armour, Button, and Hollands (2018)
ADAAA of 2009 Work-Limited by Type Hiring (+, non-salient physical, otherwise null)
66
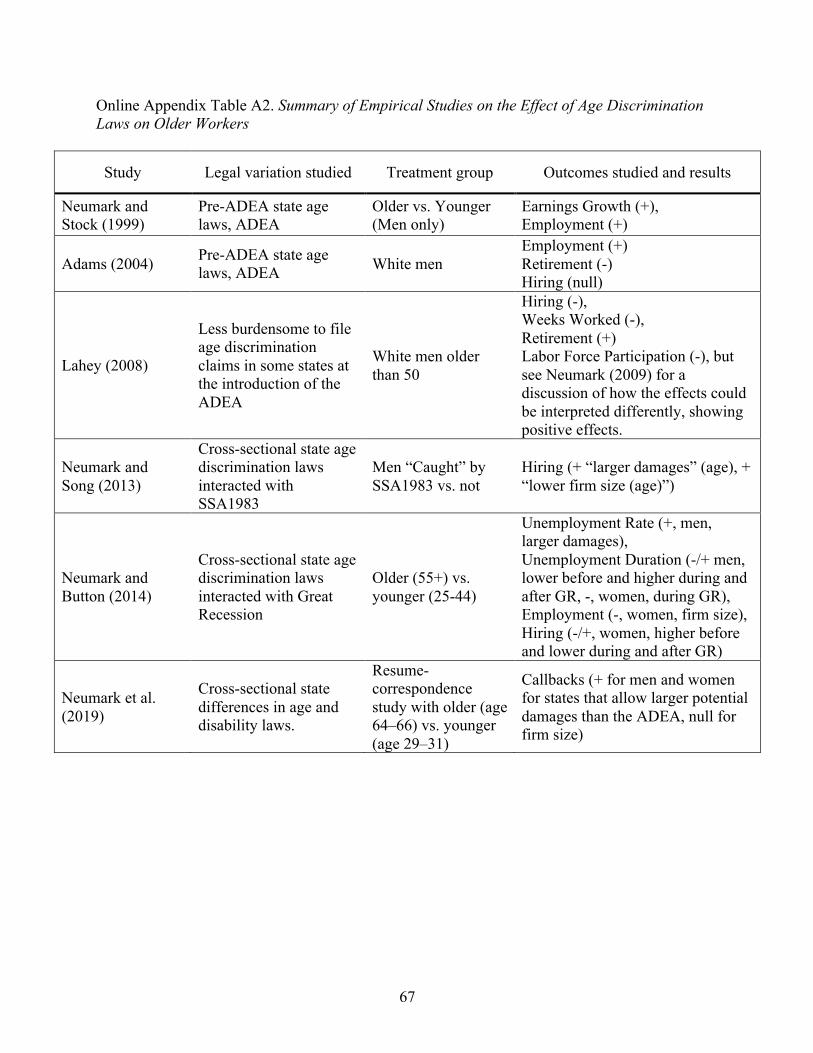
Online Appendix Table A2. Summary of Empirical Studies on the Effect of Age Discrimination Laws on Older Workers
Study Legal variation studied Treatment group Outcomes studied and results
Neumark and Stock (1999)
Pre-ADEA state age laws, ADEA
Older vs. Younger (Men only)
Earnings Growth (+), Employment (+)
Adams (2004) Pre-ADEA state age laws, ADEA White men
Employment (+) Retirement (-) Hiring (null)
Lahey (2008)
Less burdensome to file age discrimination claims in some states at the introduction of the ADEA
White men older than 50
Hiring (-), Weeks Worked (-), Retirement (+) Labor Force Participation (-), but see Neumark (2009) for a discussion of how the effects could be interpreted differently, showing positive effects.
Neumark and Song (2013)
Cross-sectional state age discrimination laws interacted with SSA1983
Men “Caught” by SSA1983 vs. not
Hiring (+ “larger damages” (age), + “lower firm size (age)”)
Neumark and Button (2014)
Cross-sectional state age discrimination laws interacted with Great Recession
Older (55+) vs. younger (25-44)
Unemployment Rate (+, men, larger damages), Unemployment Duration (-/+ men, lower before and higher during and after GR, -, women, during GR), Employment (-, women, firm size), Hiring (-/+, women, higher before and lower during and after GR)
Neumark et al. (2019)
Cross-sectional state differences in age and disability laws.
Resume-correspondence study with older (age 64–66) vs. younger (age 29–31)
Callbacks (+ for men and women for states that allow larger potential damages than the ADEA, null for firm size)
67

Online Appendix Table A3. Summary of Empirical Studies on the Effect of Disability Discrimination Laws on Older Workers
Study Legal variation studied Treatment group Outcomes studied and results
Stock and Beegle (2004) Pre-ADA state laws Older vs. younger Employment (+ only if combined
with age discrimination laws)
Neumark, Song, and Button (2017)
Cross-sectional state differences in age and disability laws.
Older vs. younger (both w/o WLD)
Hiring (+ broader definition, null otherwise)
Neumark et al. (2019)
Cross-sectional state differences in age and disability laws.
Resume-correspondence study with older (age 64–66) vs. younger (age 29–31)
Callbacks (+ for women in states with larger potential damages than the ADA)
68
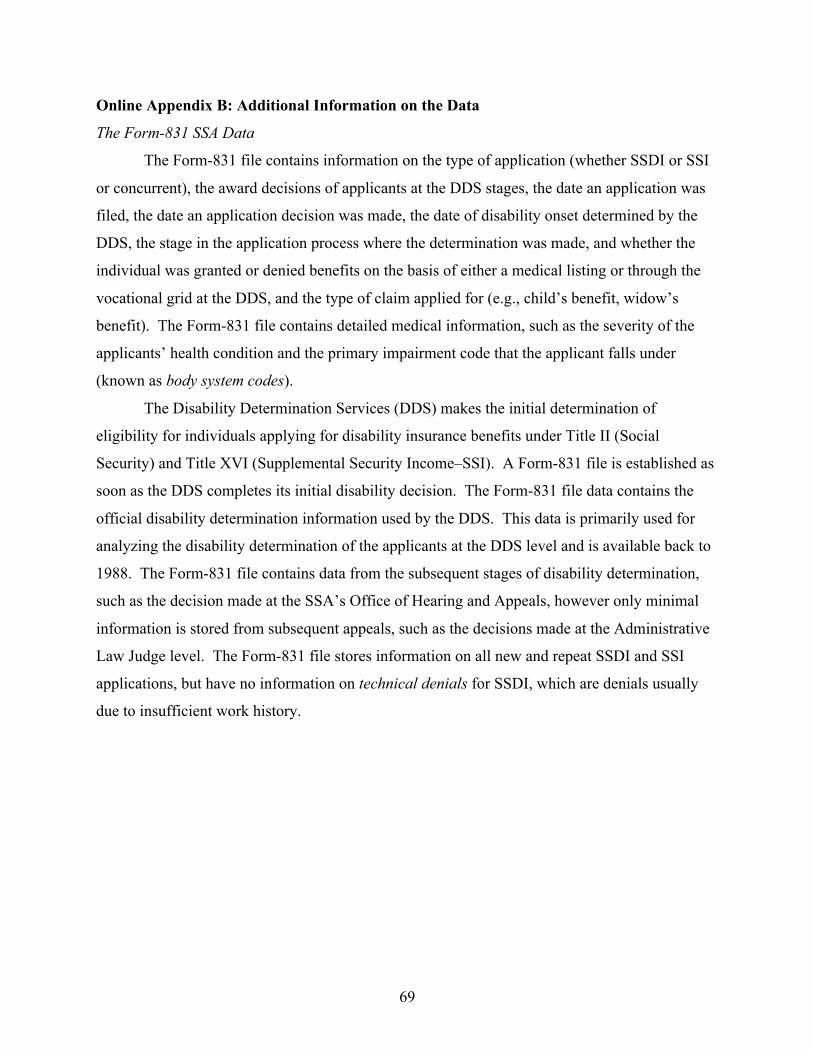
Online Appendix B: Additional Information on the Data
The Form-831 SSA Data
The Form-831 file contains information on the type of application (whether SSDI or SSI
or concurrent), the award decisions of applicants at the DDS stages, the date an application was
filed, the date an application decision was made, the date of disability onset determined by the
DDS, the stage in the application process where the determination was made, and whether the
individual was granted or denied benefits on the basis of either a medical listing or through the
vocational grid at the DDS, and the type of claim applied for (e.g., child’s benefit, widow’s
benefit). The Form-831 file contains detailed medical information, such as the severity of the
applicants’ health condition and the primary impairment code that the applicant falls under
(known as body system codes).
The Disability Determination Services (DDS) makes the initial determination of
eligibility for individuals applying for disability insurance benefits under Title II (Social
Security) and Title XVI (Supplemental Security Income–SSI). A Form-831 file is established as
soon as the DDS completes its initial disability decision. The Form-831 file data contains the
official disability determination information used by the DDS. This data is primarily used for
analyzing the disability determination of the applicants at the DDS level and is available back to
1988. The Form-831 file contains data from the subsequent stages of disability determination,
such as the decision made at the SSA’s Office of Hearing and Appeals, however only minimal
information is stored from subsequent appeals, such as the decisions made at the Administrative
Law Judge level. The Form-831 file stores information on all new and repeat SSDI and SSI
applications, but have no information on technical denials for SSDI, which are denials usually
due to insufficient work history.
69
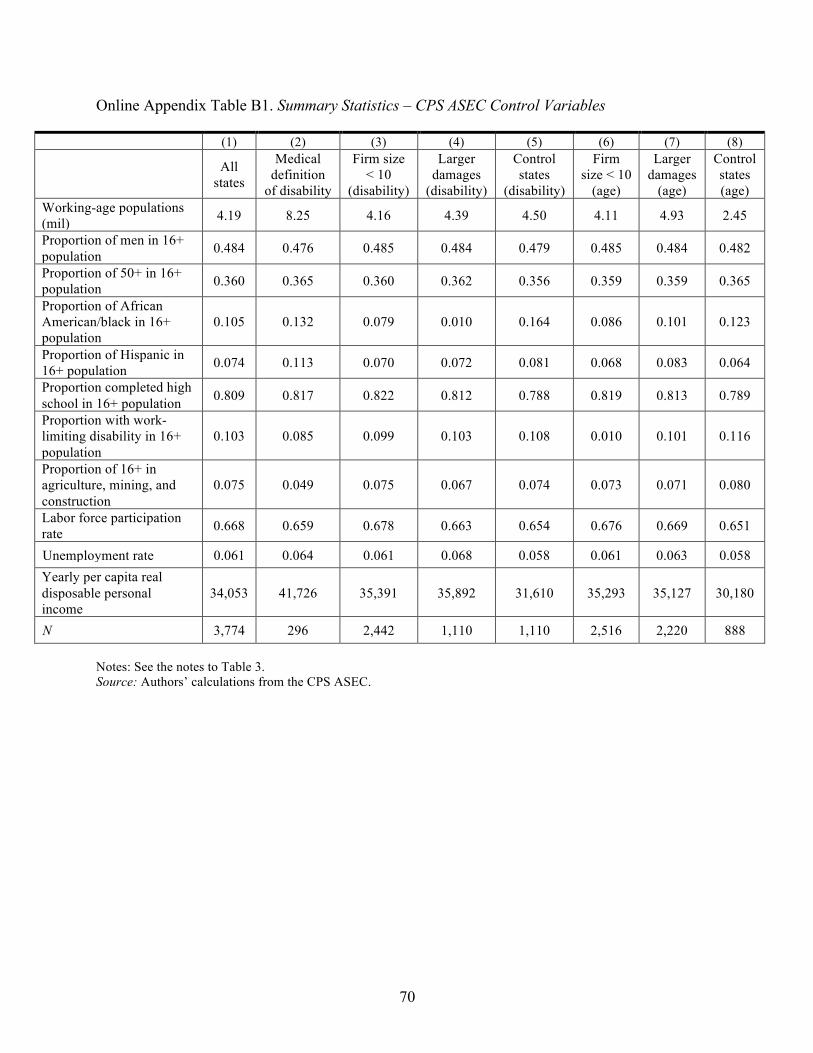
Online Appendix Table B1. Summary Statistics – CPS ASEC Control Variables
(1) (2) (3) (4) (5) (6) (7) (8)
All states
Medical definition
of disability
Firm size < 10
(disability)
Larger damages
(disability)
Control states
(disability)
Firm size < 10
(age)
Larger damages
(age)
Control states (age)
Working-age populations (mil) 4.19 8.25 4.16 4.39 4.50 4.11 4.93 2.45
Proportion of men in 16+ population 0.484 0.476 0.485 0.484 0.479 0.485 0.484 0.482
Proportion of 50+ in 16+ population 0.360 0.365 0.360 0.362 0.356 0.359 0.359 0.365
Proportion of African American/black in 16+ population
0.105 0.132 0.079 0.010 0.164 0.086 0.101 0.123
Proportion of Hispanic in 16+ population 0.074 0.113 0.070 0.072 0.081 0.068 0.083 0.064
Proportion completed high school in 16+ population 0.809 0.817 0.822 0.812 0.788 0.819 0.813 0.789
Proportion with work-limiting disability in 16+ population
0.103 0.085 0.099 0.103 0.108 0.010 0.101 0.116
Proportion of 16+ in agriculture, mining, and construction
0.075 0.049 0.075 0.067 0.074 0.073 0.071 0.080
Labor force participation rate 0.668 0.659 0.678 0.663 0.654 0.676 0.669 0.651
Unemployment rate 0.061 0.064 0.061 0.068 0.058 0.061 0.063 0.058 Yearly per capita real disposable personal income
34,053 41,726 35,391 35,892 31,610 35,293 35,127 30,180
N 3,774 296 2,442 1,110 1,110 2,516 2,220 888
Notes: See the notes to Table 3. Source: Authors’ calculations from the CPS ASEC.
70
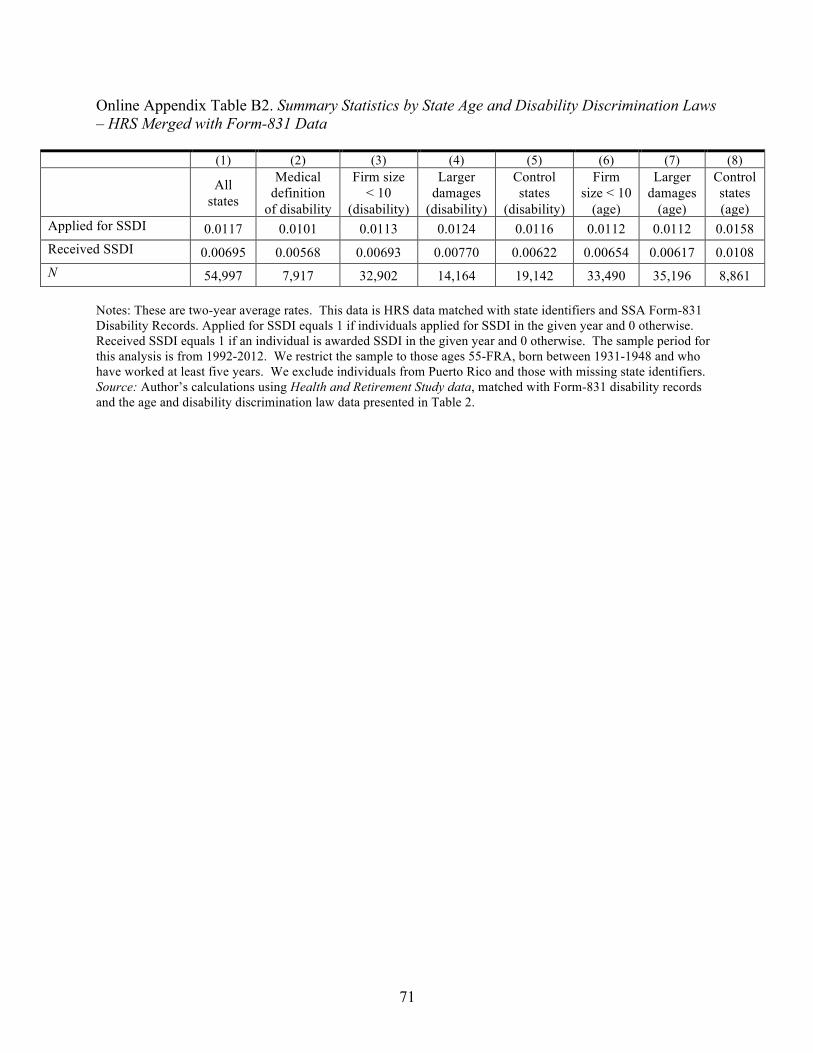
Online Appendix Table B2. Summary Statistics by State Age and Disability Discrimination Laws – HRS Merged with Form-831 Data
(1) (2) (3) (4) (5) (6) (7) (8)
All states
Medical definition
of disability
Firm size < 10
(disability)
Larger damages
(disability)
Control states
(disability)
Firm size < 10
(age)
Larger damages
(age)
Control states (age)
Applied for SSDI 0.0117 0.0101 0.0113 0.0124 0.0116 0.0112 0.0112 0.0158 Received SSDI 0.00695 0.00568 0.00693 0.00770 0.00622 0.00654 0.00617 0.0108 N 54,997 7,917 32,902 14,164 19,142 33,490 35,196 8,861
Notes: These are two-year average rates. This data is HRS data matched with state identifiers and SSA Form-831 Disability Records. Applied for SSDI equals 1 if individuals applied for SSDI in the given year and 0 otherwise. Received SSDI equals 1 if an individual is awarded SSDI in the given year and 0 otherwise. The sample period for this analysis is from 1992-2012. We restrict the sample to those ages 55-FRA, born between 1931-1948 and who have worked at least five years. We exclude individuals from Puerto Rico and those with missing state identifiers. Source: Author’s calculations using Health and Retirement Study data, matched with Form-831 disability records and the age and disability discrimination law data presented in Table 2.
71
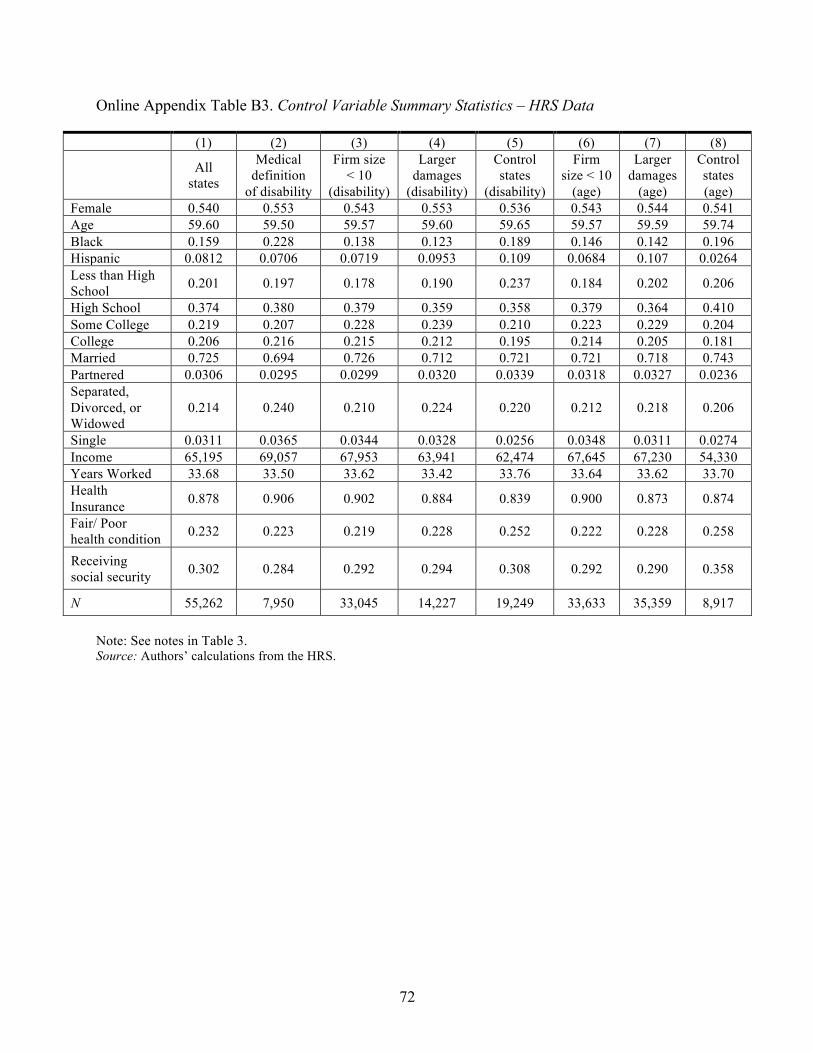
Online Appendix Table B3. Control Variable Summary Statistics – HRS Data
(1) (2) (3) (4) (5) (6) (7) (8)
All states
Medical definition
of disability
Firm size < 10
(disability)
Larger damages
(disability)
Control states
(disability)
Firm size < 10
(age)
Larger damages
(age)
Control states (age)
Female 0.540 0.553 0.543 0.553 0.536 0.543 0.544 0.541 Age 59.60 59.50 59.57 59.60 59.65 59.57 59.59 59.74 Black 0.159 0.228 0.138 0.123 0.189 0.146 0.142 0.196 Hispanic 0.0812 0.0706 0.0719 0.0953 0.109 0.0684 0.107 0.0264 Less than High School 0.201 0.197 0.178 0.190 0.237 0.184 0.202 0.206
High School 0.374 0.380 0.379 0.359 0.358 0.379 0.364 0.410 Some College 0.219 0.207 0.228 0.239 0.210 0.223 0.229 0.204 College 0.206 0.216 0.215 0.212 0.195 0.214 0.205 0.181 Married 0.725 0.694 0.726 0.712 0.721 0.721 0.718 0.743 Partnered 0.0306 0.0295 0.0299 0.0320 0.0339 0.0318 0.0327 0.0236 Separated, Divorced, or Widowed
0.214 0.240 0.210 0.224 0.220 0.212 0.218 0.206
Single 0.0311 0.0365 0.0344 0.0328 0.0256 0.0348 0.0311 0.0274 Income 65,195 69,057 67,953 63,941 62,474 67,645 67,230 54,330 Years Worked 33.68 33.50 33.62 33.42 33.76 33.64 33.62 33.70 Health Insurance 0.878 0.906 0.902 0.884 0.839 0.900 0.873 0.874
Fair/ Poor health condition 0.232 0.223 0.219 0.228 0.252 0.222 0.228 0.258
Receiving social security 0.302 0.284 0.292 0.294 0.308 0.292 0.290 0.358
N 55,262 7,950 33,045 14,227 19,249 33,633 35,359 8,917
Note: See notes in Table 3. Source: Authors’ calculations from the HRS.
72
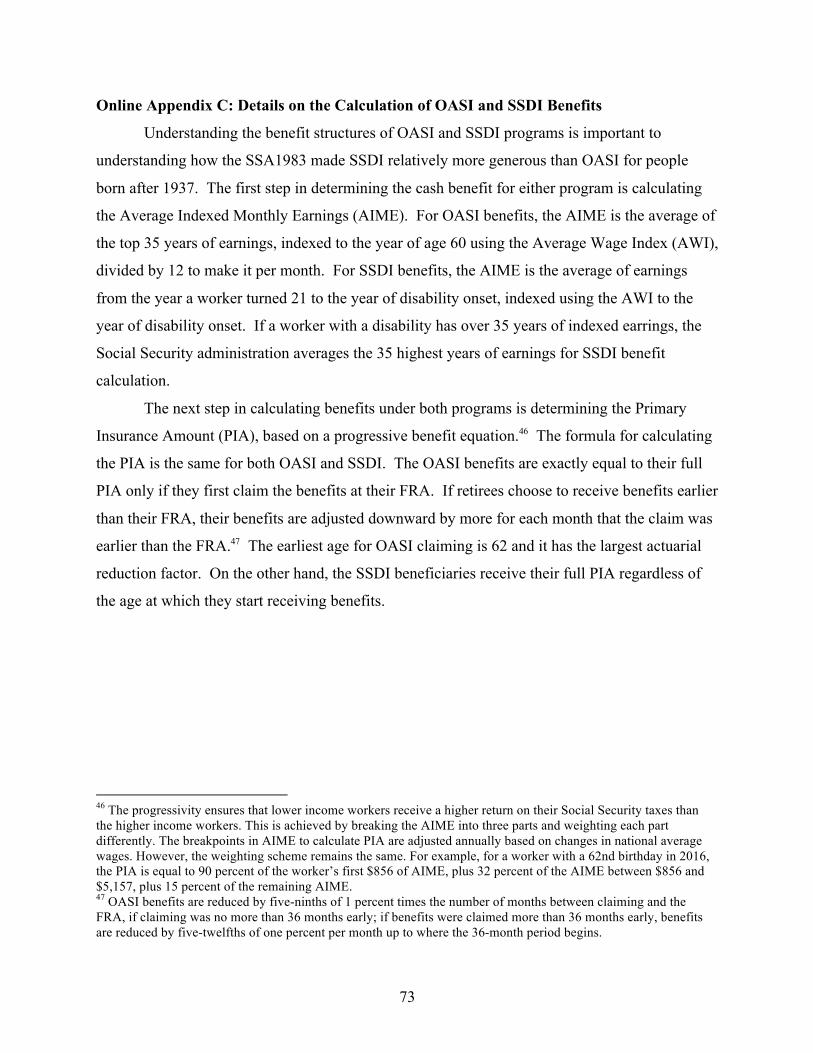
Online Appendix C: Details on the Calculation of OASI and SSDI Benefits
Understanding the benefit structures of OASI and SSDI programs is important to
understanding how the SSA1983 made SSDI relatively more generous than OASI for people
born after 1937. The first step in determining the cash benefit for either program is calculating
the Average Indexed Monthly Earnings (AIME). For OASI benefits, the AIME is the average of
the top 35 years of earnings, indexed to the year of age 60 using the Average Wage Index (AWI),
divided by 12 to make it per month. For SSDI benefits, the AIME is the average of earnings
from the year a worker turned 21 to the year of disability onset, indexed using the AWI to the
year of disability onset. If a worker with a disability has over 35 years of indexed earrings, the
Social Security administration averages the 35 highest years of earnings for SSDI benefit
calculation.
The next step in calculating benefits under both programs is determining the Primary
Insurance Amount (PIA), based on a progressive benefit equation.46 The formula for calculating
the PIA is the same for both OASI and SSDI. The OASI benefits are exactly equal to their full
PIA only if they first claim the benefits at their FRA. If retirees choose to receive benefits earlier
than their FRA, their benefits are adjusted downward by more for each month that the claim was
earlier than the FRA.47 The earliest age for OASI claiming is 62 and it has the largest actuarial
reduction factor. On the other hand, the SSDI beneficiaries receive their full PIA regardless of
the age at which they start receiving benefits.
46 The progressivity ensures that lower income workers receive a higher return on their Social Security taxes than the higher income workers. This is achieved by breaking the AIME into three parts and weighting each part differently. The breakpoints in AIME to calculate PIA are adjusted annually based on changes in national average wages. However, the weighting scheme remains the same. For example, for a worker with a 62nd birthday in 2016, the PIA is equal to 90 percent of the worker’s first $856 of AIME, plus 32 percent of the AIME between $856 and $5,157, plus 15 percent of the remaining AIME. 47 OASI benefits are reduced by five-ninths of 1 percent times the number of months between claiming and the FRA, if claiming was no more than 36 months early; if benefits were claimed more than 36 months early, benefits are reduced by five-twelfths of one percent per month up to where the 36-month period begins.
73
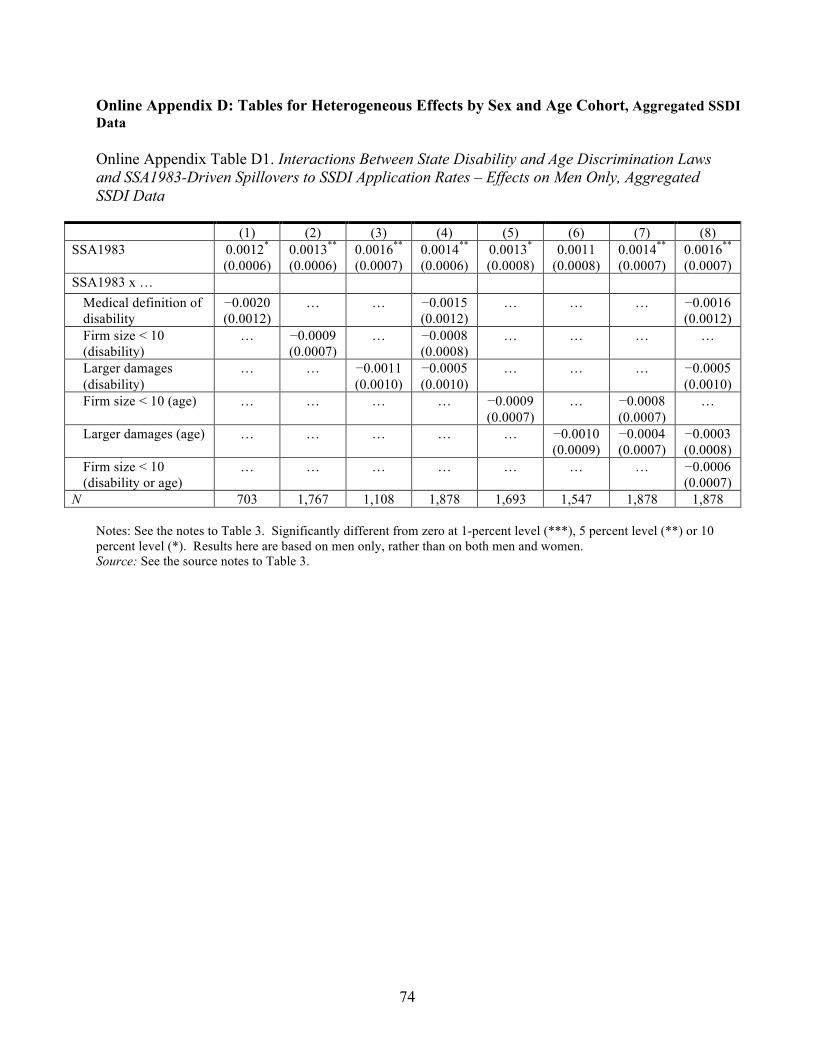
Online Appendix D: Tables for Heterogeneous Effects by Sex and Age Cohort, Aggregated SSDI Data
Online Appendix Table D1. Interactions Between State Disability and Age Discrimination Laws and SSA1983-Driven Spillovers to SSDI Application Rates – Effects on Men Only, Aggregated SSDI Data
(1) (2) (3) (4) (5) (6) (7) (8) SSA1983 0.0012*
(0.0006) 0.0013**
(0.0006) 0.0016**
(0.0007) 0.0014**
(0.0006) 0.0013*
(0.0008) 0.0011
(0.0008) 0.0014**
(0.0007) 0.0016**
(0.0007) SSA1983 x …
Medical definition of disability
−0.0020 (0.0012)
… … −0.0015 (0.0012)
… … … −0.0016 (0.0012)
Firm size < 10 (disability)
… −0.0009 (0.0007)
… −0.0008 (0.0008)
… … … …
Larger damages (disability)
… … −0.0011 (0.0010)
−0.0005 (0.0010)
… … … −0.0005 (0.0010)
Firm size < 10 (age) … … … … −0.0009 (0.0007)
… −0.0008 (0.0007)
…
Larger damages (age) … … … … … −0.0010 (0.0009)
−0.0004 (0.0007)
−0.0003 (0.0008)
Firm size < 10 (disability or age)
… … … … … … … −0.0006 (0.0007)
N 703 1,767 1,108 1,878 1,693 1,547 1,878 1,878
Notes: See the notes to Table 3. Significantly different from zero at 1-percent level (***), 5 percent level (**) or 10 percent level (*). Results here are based on men only, rather than on both men and women. Source: See the source notes to Table 3.
74
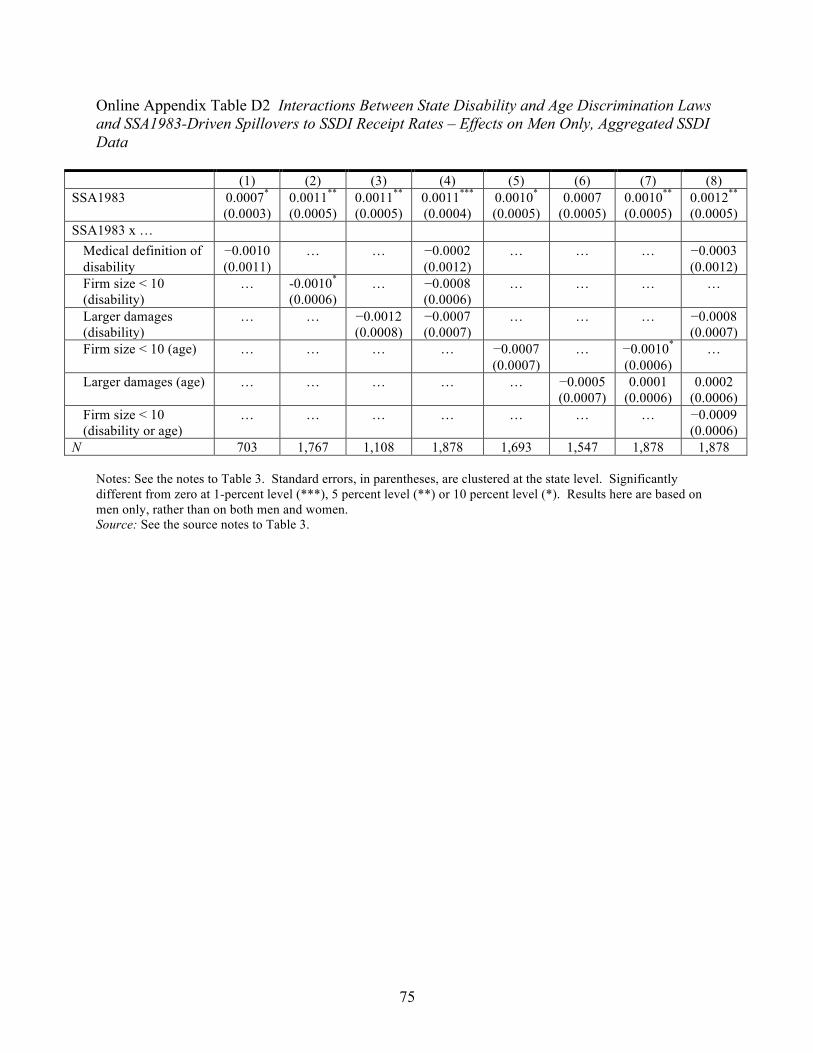
Online Appendix Table D2 Interactions Between State Disability and Age Discrimination Laws and SSA1983-Driven Spillovers to SSDI Receipt Rates – Effects on Men Only, Aggregated SSDI Data
(1) (2) (3) (4) (5) (6) (7) (8) SSA1983 0.0007*
(0.0003) 0.0011**
(0.0005) 0.0011**
(0.0005) 0.0011***
(0.0004) 0.0010*
(0.0005) 0.0007
(0.0005) 0.0010**
(0.0005) 0.0012**
(0.0005) SSA1983 x …
Medical definition of disability
−0.0010 (0.0011)
… … −0.0002 (0.0012)
… … … −0.0003 (0.0012)
Firm size < 10 (disability)
… -0.0010*
(0.0006) … −0.0008
(0.0006) … … … …
Larger damages (disability)
… … −0.0012 (0.0008)
−0.0007 (0.0007)
… … … −0.0008 (0.0007)
Firm size < 10 (age) … … … … −0.0007 (0.0007)
… −0.0010*
(0.0006) …
Larger damages (age) … … … … … −0.0005 (0.0007)
0.0001 (0.0006)
0.0002 (0.0006)
Firm size < 10 (disability or age)
… … … … … … … −0.0009 (0.0006)
N 703 1,767 1,108 1,878 1,693 1,547 1,878 1,878
Notes: See the notes to Table 3. Standard errors, in parentheses, are clustered at the state level. Significantly different from zero at 1-percent level (***), 5 percent level (**) or 10 percent level (*). Results here are based on men only, rather than on both men and women. Source: See the source notes to Table 3.
75
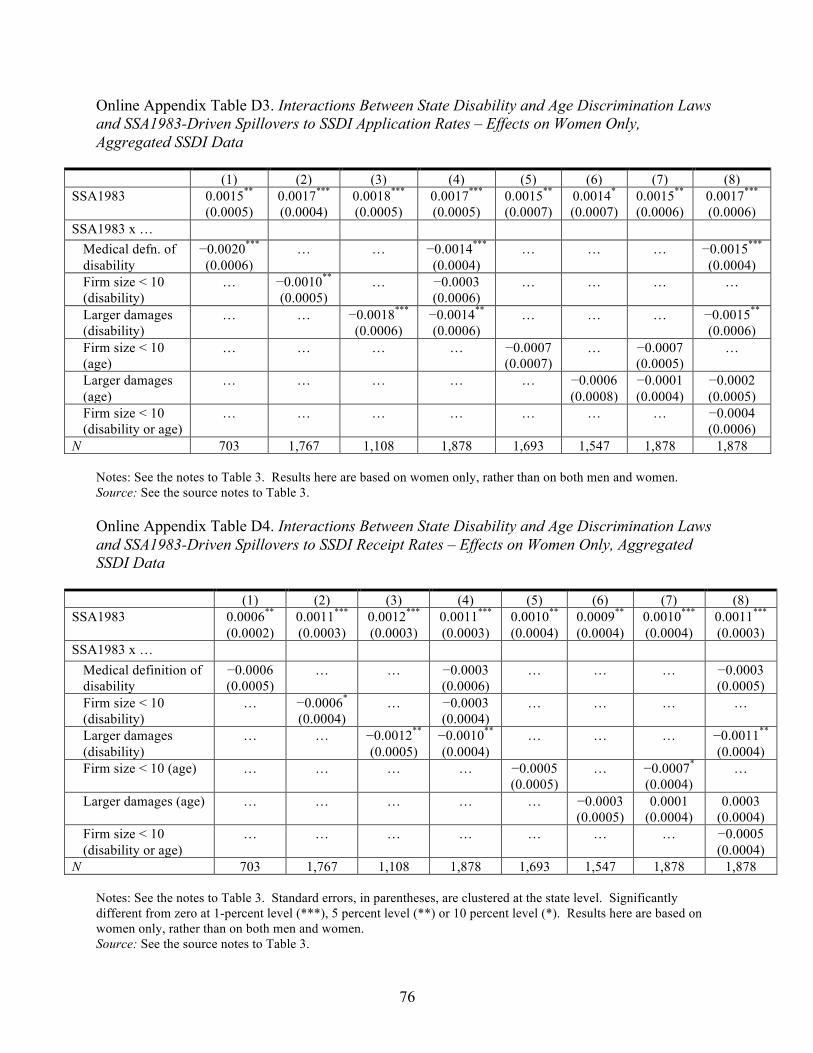
Online Appendix Table D3. Interactions Between State Disability and Age Discrimination Laws and SSA1983-Driven Spillovers to SSDI Application Rates – Effects on Women Only, Aggregated SSDI Data
(1) (2) (3) (4) (5) (6) (7) (8) SSA1983 0.0015**
(0.0005) 0.0017***
(0.0004) 0.0018***
(0.0005) 0.0017***
(0.0005) 0.0015**
(0.0007) 0.0014*
(0.0007) 0.0015**
(0.0006) 0.0017***
(0.0006) SSA1983 x …
Medical defn. of disability
−0.0020***
(0.0006) … … −0.0014***
(0.0004) … … … −0.0015***
(0.0004) Firm size < 10 (disability)
… −0.0010**
(0.0005) … −0.0003
(0.0006) … … … …
Larger damages (disability)
… … −0.0018***
(0.0006) −0.0014**
(0.0006) … … … −0.0015**
(0.0006) Firm size < 10 (age)
… … … … −0.0007 (0.0007)
… −0.0007 (0.0005)
…
Larger damages (age)
… … … … … −0.0006 (0.0008)
−0.0001 (0.0004)
−0.0002 (0.0005)
Firm size < 10 (disability or age)
… … … … … … … −0.0004 (0.0006)
N 703 1,767 1,108 1,878 1,693 1,547 1,878 1,878
Notes: See the notes to Table 3. Results here are based on women only, rather than on both men and women. Source: See the source notes to Table 3.
Online Appendix Table D4. Interactions Between State Disability and Age Discrimination Laws and SSA1983-Driven Spillovers to SSDI Receipt Rates – Effects on Women Only, Aggregated SSDI Data
(1) (2) (3) (4) (5) (6) (7) (8) SSA1983 0.0006**
(0.0002) 0.0011***
(0.0003) 0.0012***
(0.0003) 0.0011***
(0.0003) 0.0010**
(0.0004) 0.0009**
(0.0004) 0.0010***
(0.0004) 0.0011***
(0.0003) SSA1983 x …
Medical definition of disability
−0.0006 (0.0005)
… … −0.0003 (0.0006)
… … … −0.0003 (0.0005)
Firm size < 10 (disability)
… −0.0006*
(0.0004) … −0.0003
(0.0004) … … … …
Larger damages (disability)
… … −0.0012**
(0.0005) −0.0010**
(0.0004) … … … −0.0011**
(0.0004) Firm size < 10 (age) … … … … −0.0005
(0.0005) … −0.0007*
(0.0004) …
Larger damages (age) … … … … … −0.0003 (0.0005)
0.0001 (0.0004)
0.0003 (0.0004)
Firm size < 10 (disability or age)
… … … … … … … −0.0005 (0.0004)
N 703 1,767 1,108 1,878 1,693 1,547 1,878 1,878
Notes: See the notes to Table 3. Standard errors, in parentheses, are clustered at the state level. Significantly different from zero at 1-percent level (***), 5 percent level (**) or 10 percent level (*). Results here are based on women only, rather than on both men and women. Source: See the source notes to Table 3.
76
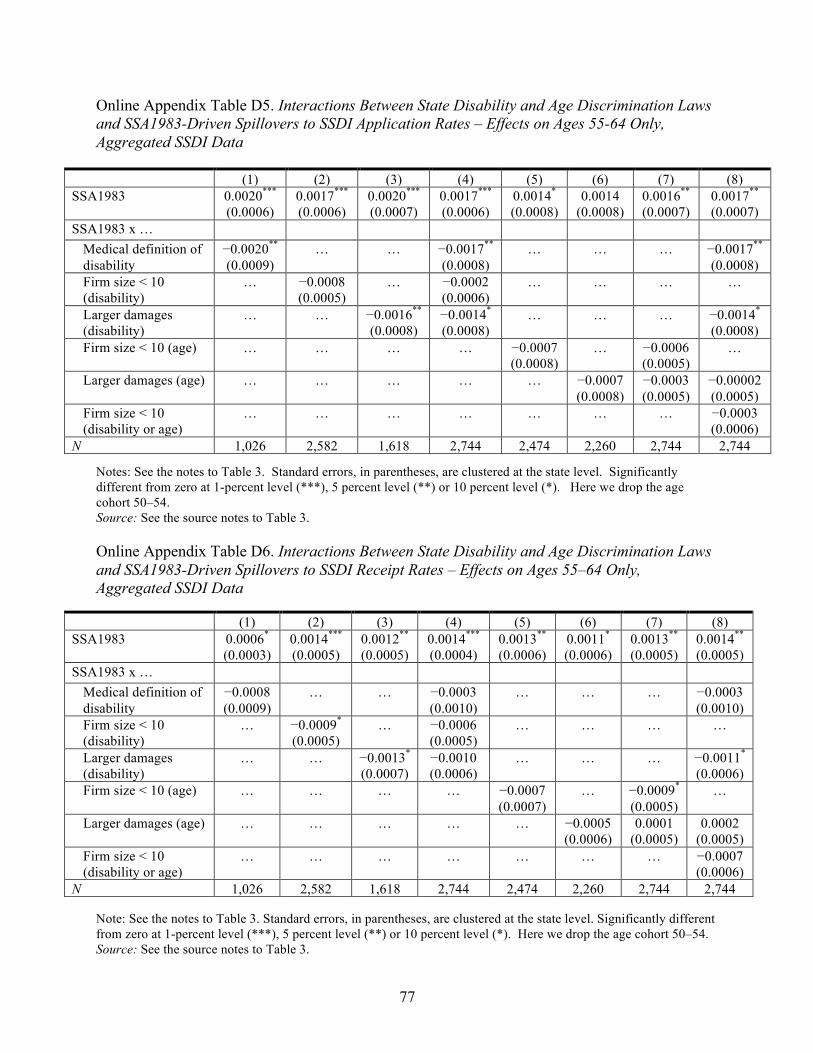
Online Appendix Table D5. Interactions Between State Disability and Age Discrimination Laws and SSA1983-Driven Spillovers to SSDI Application Rates – Effects on Ages 55-64 Only, Aggregated SSDI Data
(1) (2) (3) (4) (5) (6) (7) (8) SSA1983 0.0020***
(0.0006) 0.0017***
(0.0006) 0.0020***
(0.0007) 0.0017***
(0.0006) 0.0014*
(0.0008) 0.0014
(0.0008) 0.0016**
(0.0007) 0.0017**
(0.0007) SSA1983 x …
Medical definition of disability
−0.0020**
(0.0009) … … −0.0017**
(0.0008) … … … −0.0017**
(0.0008) Firm size < 10 (disability)
… −0.0008 (0.0005)
… −0.0002 (0.0006)
… … … …
Larger damages (disability)
… … −0.0016**
(0.0008) −0.0014*
(0.0008) … … … −0.0014*
(0.0008) Firm size < 10 (age) … … … … −0.0007
(0.0008) … −0.0006
(0.0005) …
Larger damages (age) … … … … … −0.0007 (0.0008)
−0.0003 (0.0005)
−0.00002 (0.0005)
Firm size < 10 (disability or age)
… … … … … … … −0.0003 (0.0006)
N 1,026 2,582 1,618 2,744 2,474 2,260 2,744 2,744
Notes: See the notes to Table 3. Standard errors, in parentheses, are clustered at the state level. Significantly different from zero at 1-percent level (***), 5 percent level (**) or 10 percent level (*). Here we drop the age cohort 50–54. Source: See the source notes to Table 3.
Online Appendix Table D6. Interactions Between State Disability and Age Discrimination Laws and SSA1983-Driven Spillovers to SSDI Receipt Rates – Effects on Ages 55–64 Only, Aggregated SSDI Data
(1) (2) (3) (4) (5) (6) (7) (8) SSA1983 0.0006*
(0.0003) 0.0014***
(0.0005) 0.0012**
(0.0005) 0.0014***
(0.0004) 0.0013**
(0.0006) 0.0011*
(0.0006) 0.0013**
(0.0005) 0.0014**
(0.0005) SSA1983 x …
Medical definition of disability
−0.0008 (0.0009)
… … −0.0003 (0.0010)
… … … −0.0003 (0.0010)
Firm size < 10 (disability)
… −0.0009*
(0.0005) … −0.0006
(0.0005) … … … …
Larger damages (disability)
… … −0.0013*
(0.0007) −0.0010 (0.0006)
… … … −0.0011*
(0.0006) Firm size < 10 (age) … … … … −0.0007
(0.0007) … −0.0009*
(0.0005) …
Larger damages (age) … … … … … −0.0005 (0.0006)
0.0001 (0.0005)
0.0002 (0.0005)
Firm size < 10 (disability or age)
… … … … … … … −0.0007 (0.0006)
N 1,026 2,582 1,618 2,744 2,474 2,260 2,744 2,744
Note: See the notes to Table 3. Standard errors, in parentheses, are clustered at the state level. Significantly different from zero at 1-percent level (***), 5 percent level (**) or 10 percent level (*). Here we drop the age cohort 50–54. Source: See the source notes to Table 3.
77
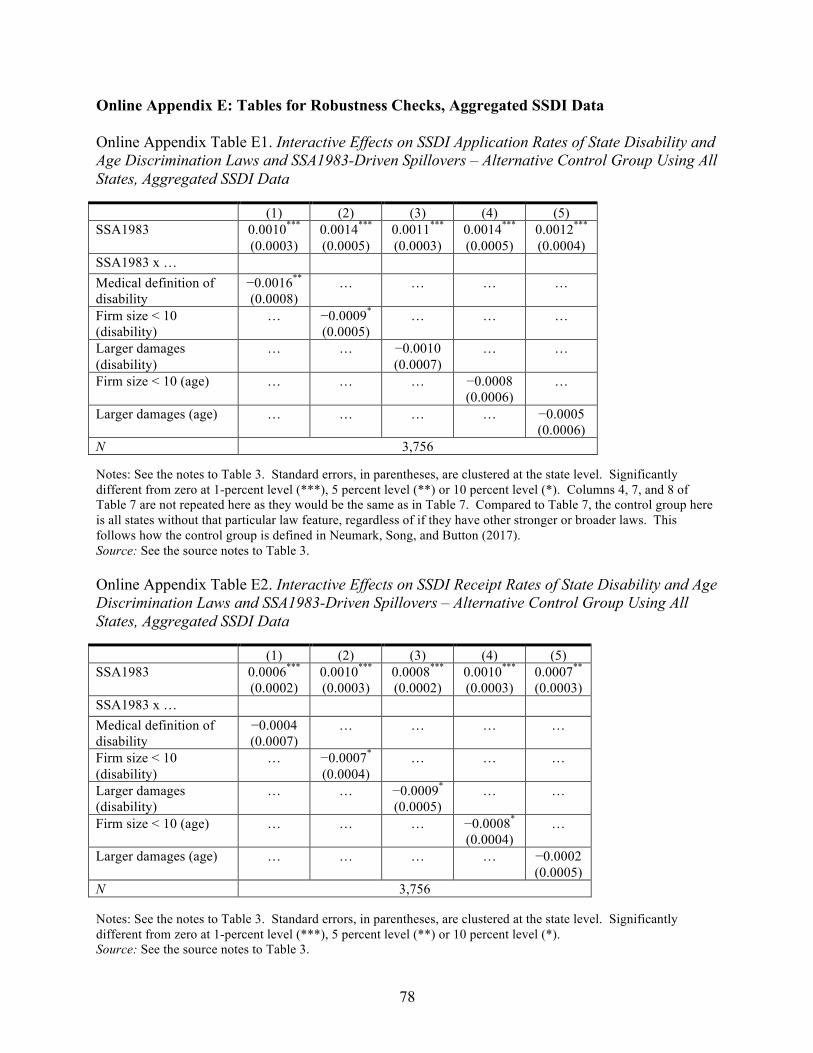
Online Appendix E: Tables for Robustness Checks, Aggregated SSDI Data
Online Appendix Table E1. Interactive Effects on SSDI Application Rates of State Disability and Age Discrimination Laws and SSA1983-Driven Spillovers – Alternative Control Group Using All States, Aggregated SSDI Data
(1) (2) (3) (4) (5) SSA1983 0.0010***
(0.0003) 0.0014***
(0.0005) 0.0011***
(0.0003) 0.0014***
(0.0005) 0.0012***
(0.0004) SSA1983 x … Medical definition of disability
−0.0016**
(0.0008) … … … …
Firm size < 10 (disability)
… −0.0009*
(0.0005) … … …
Larger damages (disability)
… … −0.0010 (0.0007)
… …
Firm size < 10 (age) … … … −0.0008 (0.0006)
…
Larger damages (age) … … … … −0.0005 (0.0006)
N 3,756
Notes: See the notes to Table 3. Standard errors, in parentheses, are clustered at the state level. Significantly different from zero at 1-percent level (***), 5 percent level (**) or 10 percent level (*). Columns 4, 7, and 8 of Table 7 are not repeated here as they would be the same as in Table 7. Compared to Table 7, the control group here is all states without that particular law feature, regardless of if they have other stronger or broader laws. This follows how the control group is defined in Neumark, Song, and Button (2017). Source: See the source notes to Table 3.
Online Appendix Table E2. Interactive Effects on SSDI Receipt Rates of State Disability and Age Discrimination Laws and SSA1983-Driven Spillovers – Alternative Control Group Using All States, Aggregated SSDI Data
(1) (2) (3) (4) (5) SSA1983 0.0006***
(0.0002) 0.0010***
(0.0003) 0.0008***
(0.0002) 0.0010***
(0.0003) 0.0007**
(0.0003) SSA1983 x … Medical definition of disability
−0.0004 (0.0007)
… … … …
Firm size < 10 (disability)
… −0.0007*
(0.0004) … … …
Larger damages (disability)
… … −0.0009*
(0.0005) … …
Firm size < 10 (age) … … … −0.0008*
(0.0004) …
Larger damages (age) … … … … −0.0002 (0.0005)
N 3,756
Notes: See the notes to Table 3. Standard errors, in parentheses, are clustered at the state level. Significantly different from zero at 1-percent level (***), 5 percent level (**) or 10 percent level (*). Source: See the source notes to Table 3.
78
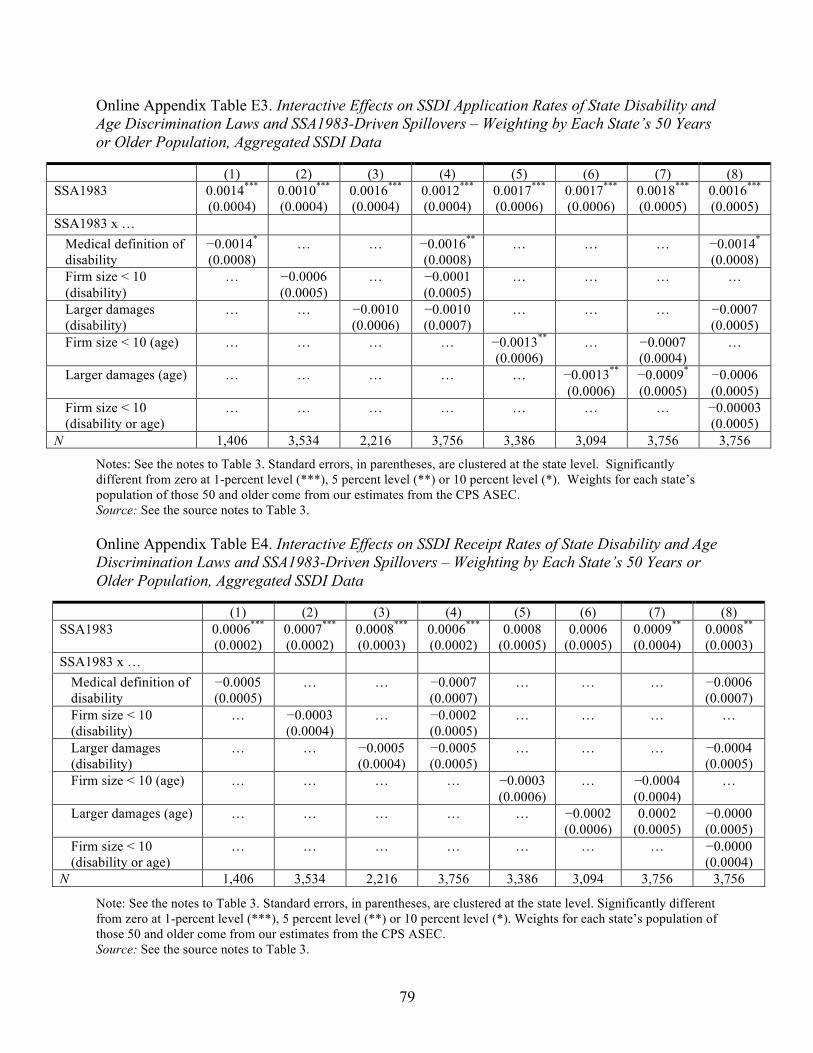
Online Appendix Table E3. Interactive Effects on SSDI Application Rates of State Disability and Age Discrimination Laws and SSA1983-Driven Spillovers – Weighting by Each State’s 50 Years or Older Population, Aggregated SSDI Data
(1) (2) (3) (4) (5) (6) (7) (8) SSA1983 0.0014***
(0.0004) 0.0010***
(0.0004) 0.0016***
(0.0004) 0.0012***
(0.0004) 0.0017***
(0.0006) 0.0017***
(0.0006) 0.0018***
(0.0005) 0.0016***
(0.0005) SSA1983 x …
Medical definition of disability
−0.0014*
(0.0008) … … −0.0016**
(0.0008) … … … −0.0014*
(0.0008) Firm size < 10 (disability)
… −0.0006 (0.0005)
… −0.0001 (0.0005)
… … … …
Larger damages (disability)
… … −0.0010 (0.0006)
−0.0010 (0.0007)
… … … −0.0007 (0.0005)
Firm size < 10 (age) … … … … −0.0013**
(0.0006) … −0.0007
(0.0004) …
Larger damages (age) … … … … … −0.0013**
(0.0006) −0.0009*
(0.0005) −0.0006 (0.0005)
Firm size < 10 (disability or age)
… … … … … … … −0.00003 (0.0005)
N 1,406 3,534 2,216 3,756 3,386 3,094 3,756 3,756
Notes: See the notes to Table 3. Standard errors, in parentheses, are clustered at the state level. Significantly different from zero at 1-percent level (***), 5 percent level (**) or 10 percent level (*). Weights for each state’s population of those 50 and older come from our estimates from the CPS ASEC. Source: See the source notes to Table 3.
Online Appendix Table E4. Interactive Effects on SSDI Receipt Rates of State Disability and Age Discrimination Laws and SSA1983-Driven Spillovers – Weighting by Each State’s 50 Years or Older Population, Aggregated SSDI Data
(1) (2) (3) (4) (5) (6) (7) (8) SSA1983 0.0006***
(0.0002) 0.0007***
(0.0002) 0.0008***
(0.0003) 0.0006***
(0.0002) 0.0008
(0.0005) 0.0006
(0.0005) 0.0009**
(0.0004) 0.0008**
(0.0003) SSA1983 x …
Medical definition of disability
−0.0005 (0.0005)
… … −0.0007 (0.0007)
… … … −0.0006 (0.0007)
Firm size < 10 (disability)
… −0.0003 (0.0004)
… −0.0002 (0.0005)
… … … …
Larger damages (disability)
… … −0.0005 (0.0004)
−0.0005 (0.0005)
… … … −0.0004 (0.0005)
Firm size < 10 (age) … … … … −0.0003 (0.0006)
… −0.0004 (0.0004)
…
Larger damages (age) … … … … … −0.0002 (0.0006)
0.0002 (0.0005)
−0.0000 (0.0005)
Firm size < 10 (disability or age)
… … … … … … … −0.0000 (0.0004)
N 1,406 3,534 2,216 3,756 3,386 3,094 3,756 3,756
Note: See the notes to Table 3. Standard errors, in parentheses, are clustered at the state level. Significantly different from zero at 1-percent level (***), 5 percent level (**) or 10 percent level (*). Weights for each state’s population of those 50 and older come from our estimates from the CPS ASEC. Source: See the source notes to Table 3.
79
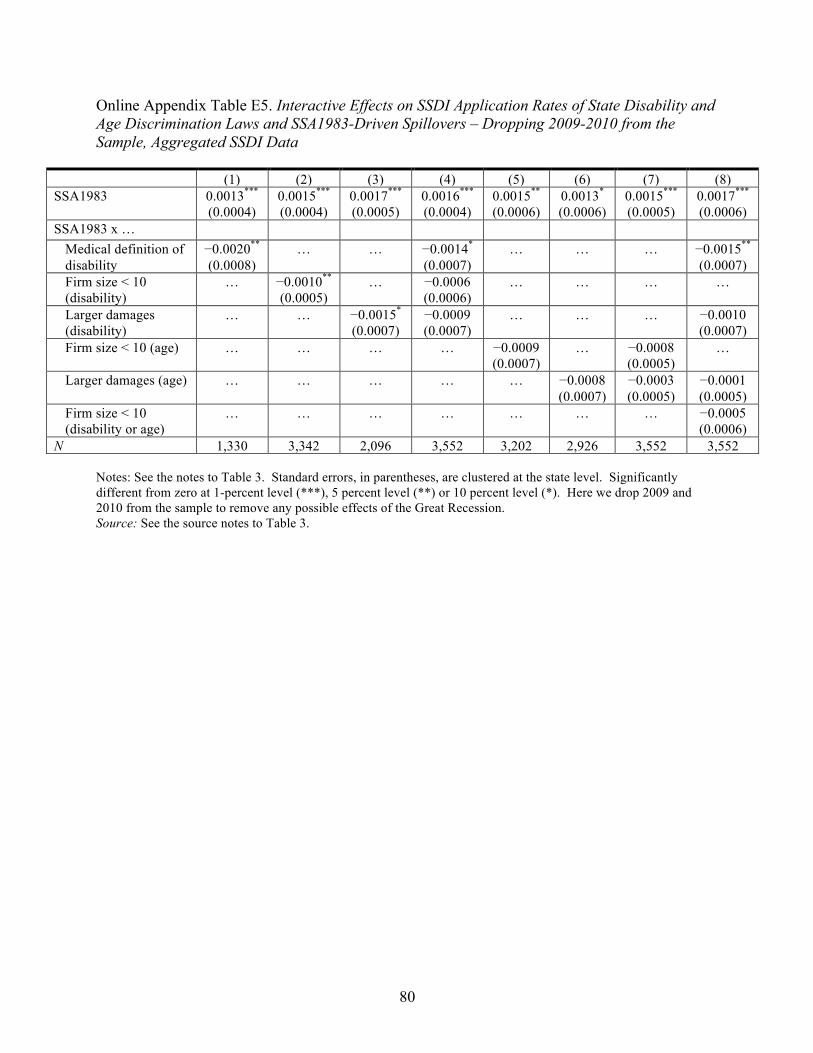
Online Appendix Table E5. Interactive Effects on SSDI Application Rates of State Disability and Age Discrimination Laws and SSA1983-Driven Spillovers – Dropping 2009-2010 from the Sample, Aggregated SSDI Data
(1) (2) (3) (4) (5) (6) (7) (8) SSA1983 0.0013***
(0.0004) 0.0015***
(0.0004) 0.0017***
(0.0005) 0.0016***
(0.0004) 0.0015**
(0.0006) 0.0013*
(0.0006) 0.0015***
(0.0005) 0.0017***
(0.0006) SSA1983 x …
Medical definition of disability
−0.0020**
(0.0008) … … −0.0014*
(0.0007) … … … −0.0015**
(0.0007) Firm size < 10 (disability)
… −0.0010**
(0.0005) … −0.0006
(0.0006) … … … …
Larger damages (disability)
… … −0.0015*
(0.0007) −0.0009 (0.0007)
… … … −0.0010 (0.0007)
Firm size < 10 (age) … … … … −0.0009 (0.0007)
… −0.0008 (0.0005)
…
Larger damages (age) … … … … … −0.0008 (0.0007)
−0.0003 (0.0005)
−0.0001 (0.0005)
Firm size < 10 (disability or age)
… … … … … … … −0.0005 (0.0006)
N 1,330 3,342 2,096 3,552 3,202 2,926 3,552 3,552
Notes: See the notes to Table 3. Standard errors, in parentheses, are clustered at the state level. Significantly different from zero at 1-percent level (***), 5 percent level (**) or 10 percent level (*). Here we drop 2009 and 2010 from the sample to remove any possible effects of the Great Recession. Source: See the source notes to Table 3.
80
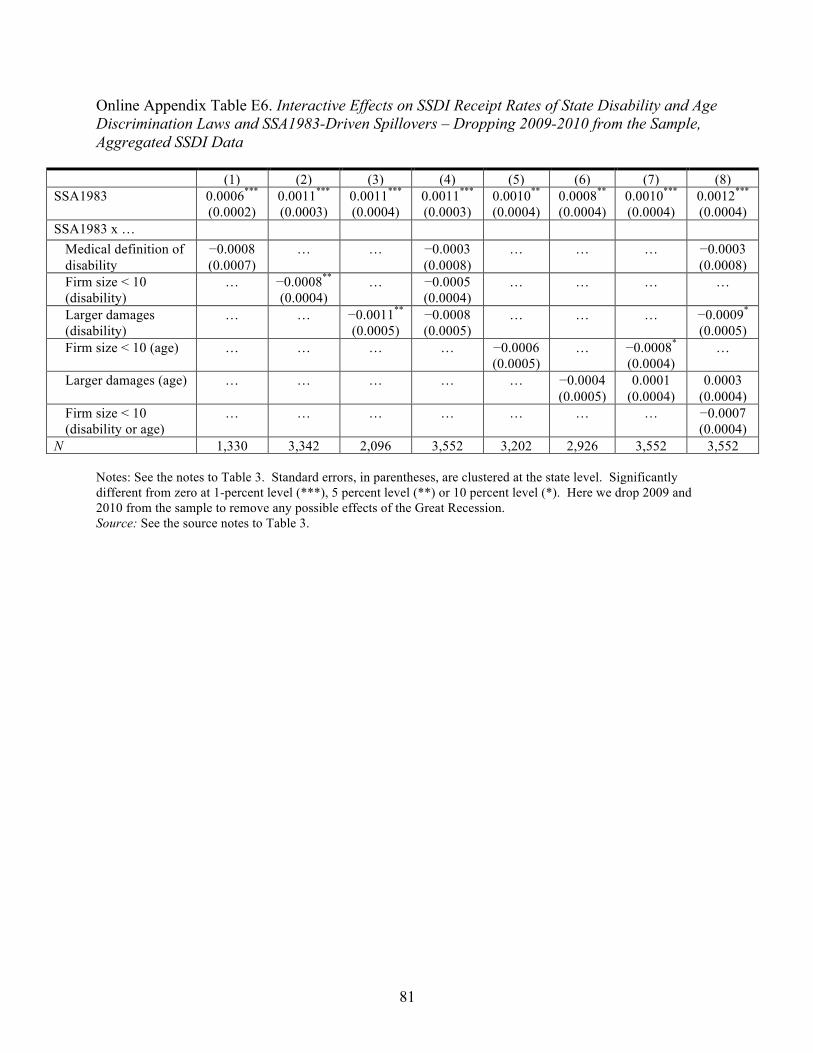
Online Appendix Table E6. Interactive Effects on SSDI Receipt Rates of State Disability and Age Discrimination Laws and SSA1983-Driven Spillovers – Dropping 2009-2010 from the Sample, Aggregated SSDI Data
(1) (2) (3) (4) (5) (6) (7) (8) SSA1983 0.0006***
(0.0002) 0.0011***
(0.0003) 0.0011***
(0.0004) 0.0011***
(0.0003) 0.0010**
(0.0004) 0.0008**
(0.0004) 0.0010***
(0.0004) 0.0012***
(0.0004) SSA1983 x …
Medical definition of disability
−0.0008 (0.0007)
… … −0.0003 (0.0008)
… … … −0.0003 (0.0008)
Firm size < 10 (disability)
… −0.0008**
(0.0004) … −0.0005
(0.0004) … … … …
Larger damages (disability)
… … −0.0011**
(0.0005) −0.0008 (0.0005)
… … … −0.0009*
(0.0005) Firm size < 10 (age) … … … … −0.0006
(0.0005) … −0.0008*
(0.0004) …
Larger damages (age) … … … … … −0.0004 (0.0005)
0.0001 (0.0004)
0.0003 (0.0004)
Firm size < 10 (disability or age)
… … … … … … … −0.0007 (0.0004)
N 1,330 3,342 2,096 3,552 3,202 2,926 3,552 3,552
Notes: See the notes to Table 3. Standard errors, in parentheses, are clustered at the state level. Significantly different from zero at 1-percent level (***), 5 percent level (**) or 10 percent level (*). Here we drop 2009 and 2010 from the sample to remove any possible effects of the Great Recession. Source: See the source notes to Table 3.
81
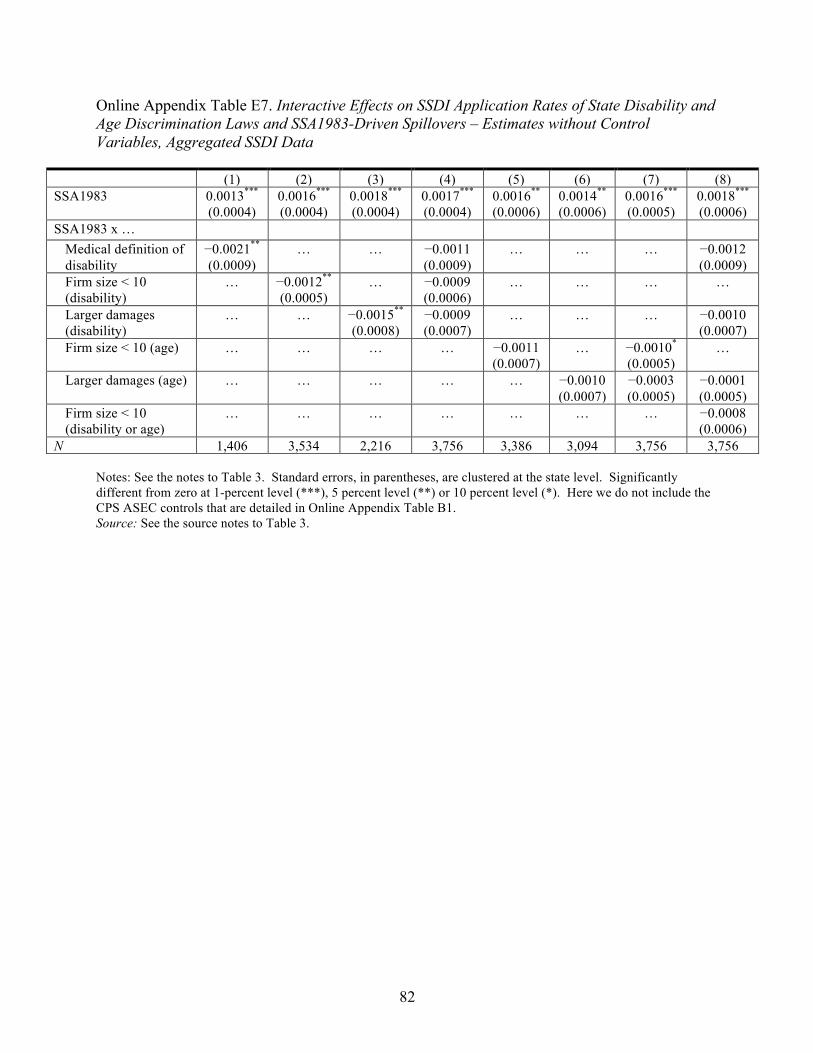
Online Appendix Table E7. Interactive Effects on SSDI Application Rates of State Disability and Age Discrimination Laws and SSA1983-Driven Spillovers – Estimates without Control Variables, Aggregated SSDI Data
(1) (2) (3) (4) (5) (6) (7) (8) SSA1983 0.0013***
(0.0004) 0.0016***
(0.0004) 0.0018***
(0.0004) 0.0017***
(0.0004) 0.0016**
(0.0006) 0.0014**
(0.0006) 0.0016***
(0.0005) 0.0018***
(0.0006) SSA1983 x …
Medical definition of disability
−0.0021**
(0.0009) … … −0.0011
(0.0009) … … … −0.0012
(0.0009) Firm size < 10 (disability)
… −0.0012**
(0.0005) … −0.0009
(0.0006) … … … …
Larger damages (disability)
… … −0.0015**
(0.0008) −0.0009 (0.0007)
… … … −0.0010 (0.0007)
Firm size < 10 (age) … … … … −0.0011 (0.0007)
… −0.0010*
(0.0005) …
Larger damages (age) … … … … … −0.0010 (0.0007)
−0.0003 (0.0005)
−0.0001 (0.0005)
Firm size < 10 (disability or age)
… … … … … … … −0.0008 (0.0006)
N 1,406 3,534 2,216 3,756 3,386 3,094 3,756 3,756
Notes: See the notes to Table 3. Standard errors, in parentheses, are clustered at the state level. Significantly different from zero at 1-percent level (***), 5 percent level (**) or 10 percent level (*). Here we do not include the CPS ASEC controls that are detailed in Online Appendix Table B1. Source: See the source notes to Table 3.
82
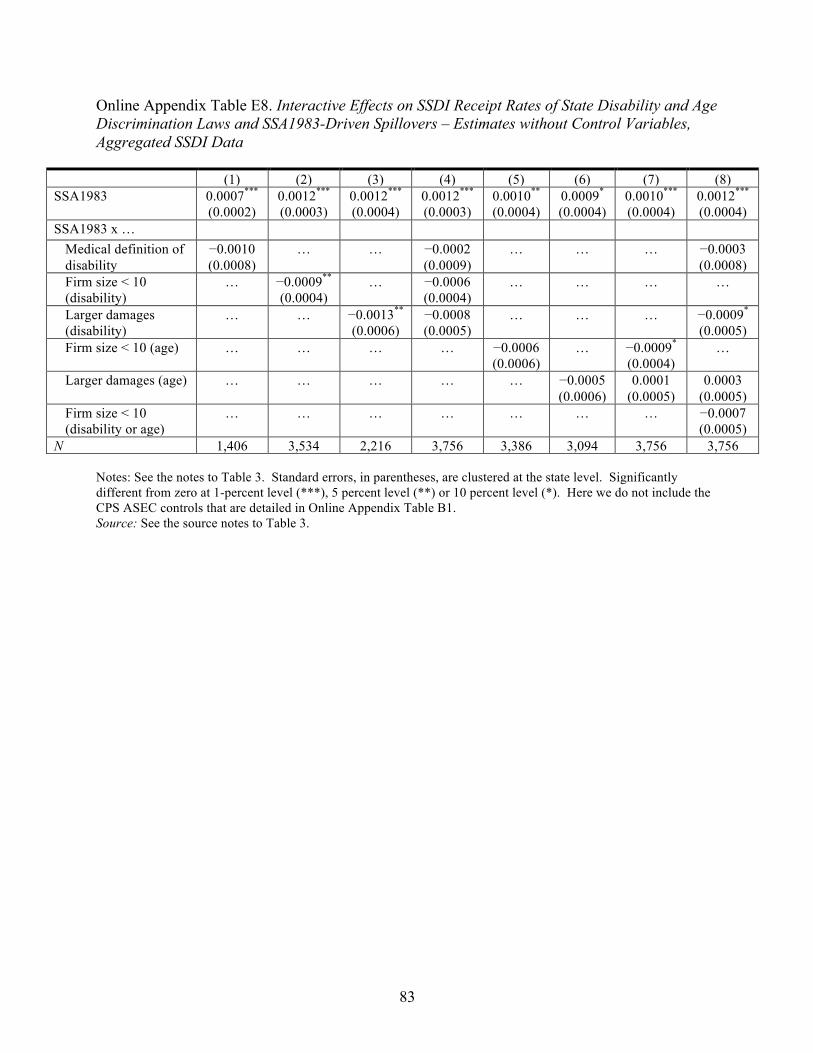
Online Appendix Table E8. Interactive Effects on SSDI Receipt Rates of State Disability and Age Discrimination Laws and SSA1983-Driven Spillovers – Estimates without Control Variables, Aggregated SSDI Data
(1) (2) (3) (4) (5) (6) (7) (8) SSA1983 0.0007***
(0.0002) 0.0012***
(0.0003) 0.0012***
(0.0004) 0.0012***
(0.0003) 0.0010**
(0.0004) 0.0009*
(0.0004) 0.0010***
(0.0004) 0.0012***
(0.0004) SSA1983 x …
Medical definition of disability
−0.0010 (0.0008)
… … −0.0002 (0.0009)
… … … −0.0003 (0.0008)
Firm size < 10 (disability)
… −0.0009**
(0.0004) … −0.0006
(0.0004) … … … …
Larger damages (disability)
… … −0.0013**
(0.0006) −0.0008 (0.0005)
… … … −0.0009*
(0.0005) Firm size < 10 (age) … … … … −0.0006
(0.0006) … −0.0009*
(0.0004) …
Larger damages (age) … … … … … −0.0005 (0.0006)
0.0001 (0.0005)
0.0003 (0.0005)
Firm size < 10 (disability or age)
… … … … … … … −0.0007 (0.0005)
N 1,406 3,534 2,216 3,756 3,386 3,094 3,756 3,756
Notes: See the notes to Table 3. Standard errors, in parentheses, are clustered at the state level. Significantly different from zero at 1-percent level (***), 5 percent level (**) or 10 percent level (*). Here we do not include the CPS ASEC controls that are detailed in Online Appendix Table B1. Source: See the source notes to Table 3.
83
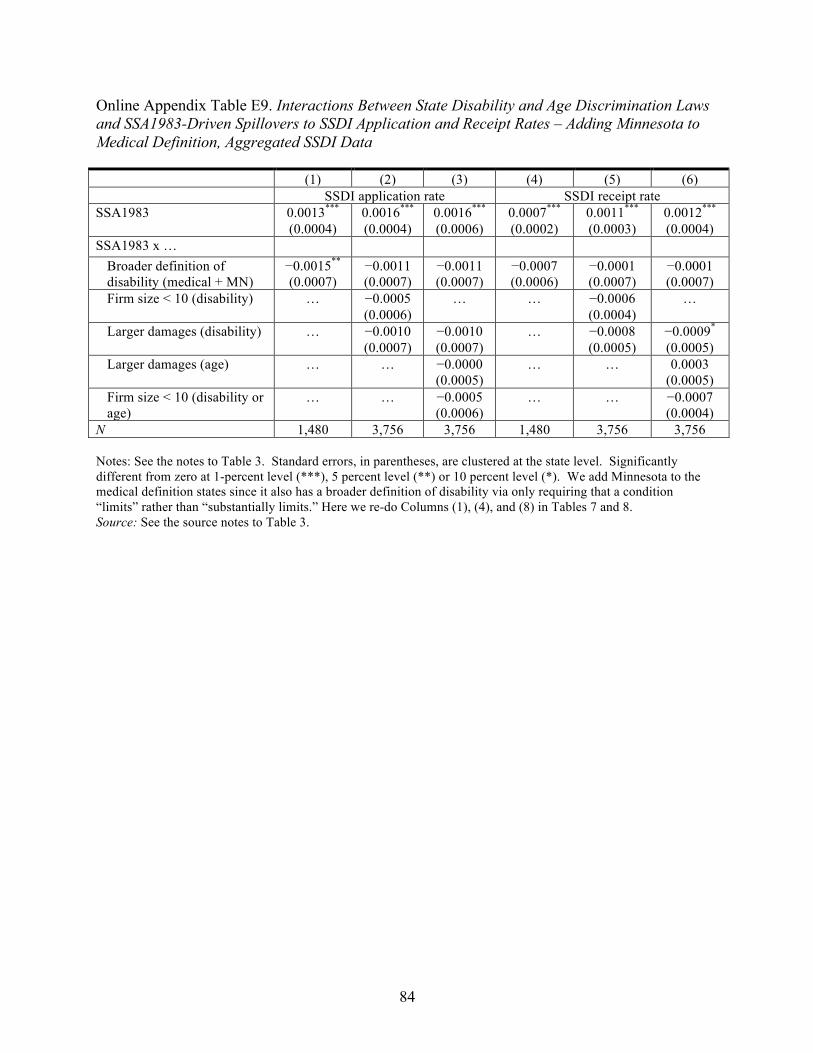
Online Appendix Table E9. Interactions Between State Disability and Age Discrimination Laws and SSA1983-Driven Spillovers to SSDI Application and Receipt Rates – Adding Minnesota to Medical Definition, Aggregated SSDI Data
(1) (2) (3) (4) (5) (6) SSDI application rate SSDI receipt rate
SSA1983 0.0013***
(0.0004) 0.0016***
(0.0004) 0.0016***
(0.0006) 0.0007***
(0.0002) 0.0011***
(0.0003) 0.0012***
(0.0004) SSA1983 x …
Broader definition of disability (medical + MN)
−0.0015**
(0.0007) −0.0011 (0.0007)
−0.0011 (0.0007)
−0.0007 (0.0006)
−0.0001 (0.0007)
−0.0001 (0.0007)
Firm size < 10 (disability) … −0.0005 (0.0006)
… … −0.0006 (0.0004)
…
Larger damages (disability) … −0.0010 (0.0007)
−0.0010 (0.0007)
… −0.0008 (0.0005)
−0.0009*
(0.0005) Larger damages (age) … … −0.0000
(0.0005) … … 0.0003
(0.0005) Firm size < 10 (disability or age)
… … −0.0005 (0.0006)
… … −0.0007 (0.0004)
N 1,480 3,756 3,756 1,480 3,756 3,756
Notes: See the notes to Table 3. Standard errors, in parentheses, are clustered at the state level. Significantly different from zero at 1-percent level (***), 5 percent level (**) or 10 percent level (*). We add Minnesota to the medical definition states since it also has a broader definition of disability via only requiring that a condition “limits” rather than “substantially limits.” Here we re-do Columns (1), (4), and (8) in Tables 7 and 8. Source: See the source notes to Table 3.
84
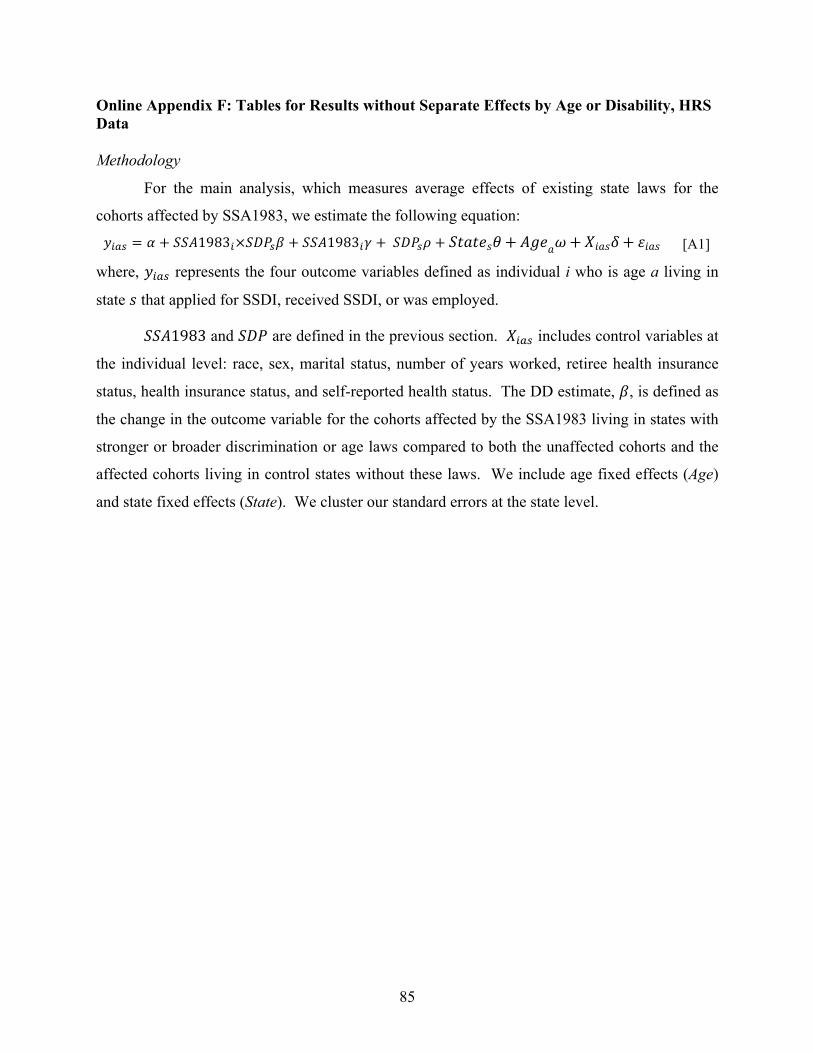
Online Appendix F: Tables for Results without Separate Effects by Age or Disability, HRS Data
Methodology
For the main analysis, which measures average effects of existing state laws for the
cohorts affected by SSA1983, we estimate the following equation:
�!"# = � + ���1983!���!� + ���1983!� + ���!� + ������� + ����� + ����� + ���� [A1]
where, �!"# represents the four outcome variables defined as individual i who is age a living in
state � that applied for SSDI, received SSDI, or was employed.
���1983 and ��� are defined in the previous section. �!"# includes control variables at
the individual level: race, sex, marital status, number of years worked, retiree health insurance
status, health insurance status, and self-reported health status. The DD estimate, �, is defined as
the change in the outcome variable for the cohorts affected by the SSA1983 living in states with
stronger or broader discrimination or age laws compared to both the unaffected cohorts and the
affected cohorts living in control states without these laws. We include age fixed effects (Age)
and state fixed effects (State). We cluster our standard errors at the state level.
85
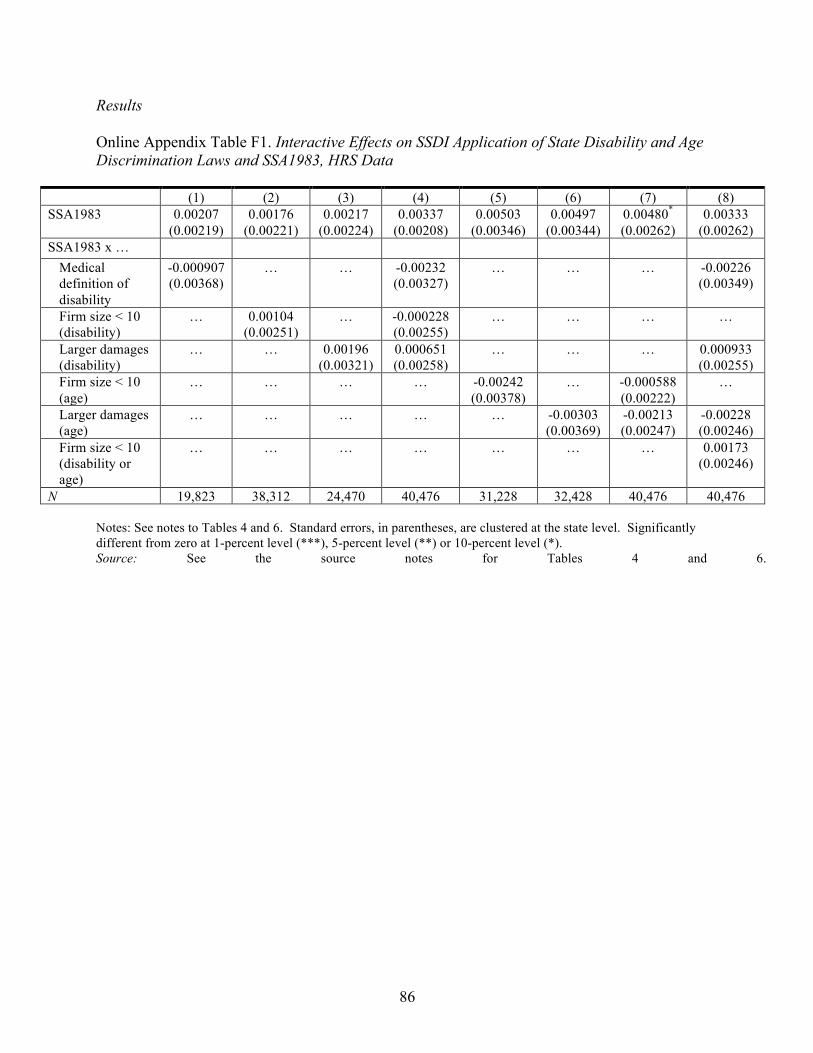
Results
Online Appendix Table F1. Interactive Effects on SSDI Application of State Disability and Age Discrimination Laws and SSA1983, HRS Data
(1) (2) (3) (4) (5) (6) (7) (8) SSA1983 0.00207
(0.00219) 0.00176
(0.00221) 0.00217
(0.00224) 0.00337
(0.00208) 0.00503
(0.00346) 0.00497
(0.00344) 0.00480*
(0.00262) 0.00333
(0.00262) SSA1983 x …
Medical definition of disability
-0.000907 (0.00368)
… … -0.00232 (0.00327)
… … … -0.00226 (0.00349)
Firm size < 10 (disability)
… 0.00104 (0.00251)
… -0.000228 (0.00255)
… … … …
Larger damages (disability)
… … 0.00196 (0.00321)
0.000651 (0.00258)
… … … 0.000933 (0.00255)
Firm size < 10 (age)
… … … … -0.00242 (0.00378)
… -0.000588 (0.00222)
…
Larger damages (age)
… … … … … -0.00303 (0.00369)
-0.00213 (0.00247)
-0.00228 (0.00246)
Firm size < 10 (disability or age)
… … … … … … … 0.00173 (0.00246)
N 19,823 38,312 24,470 40,476 31,228 32,428 40,476 40,476
Notes: See notes to Tables 4 and 6. Standard errors, in parentheses, are clustered at the state level. Significantly different from zero at 1-percent level (***), 5-percent level (**) or 10-percent level (*). Source: See the source notes for Tables 4 and 6.
86
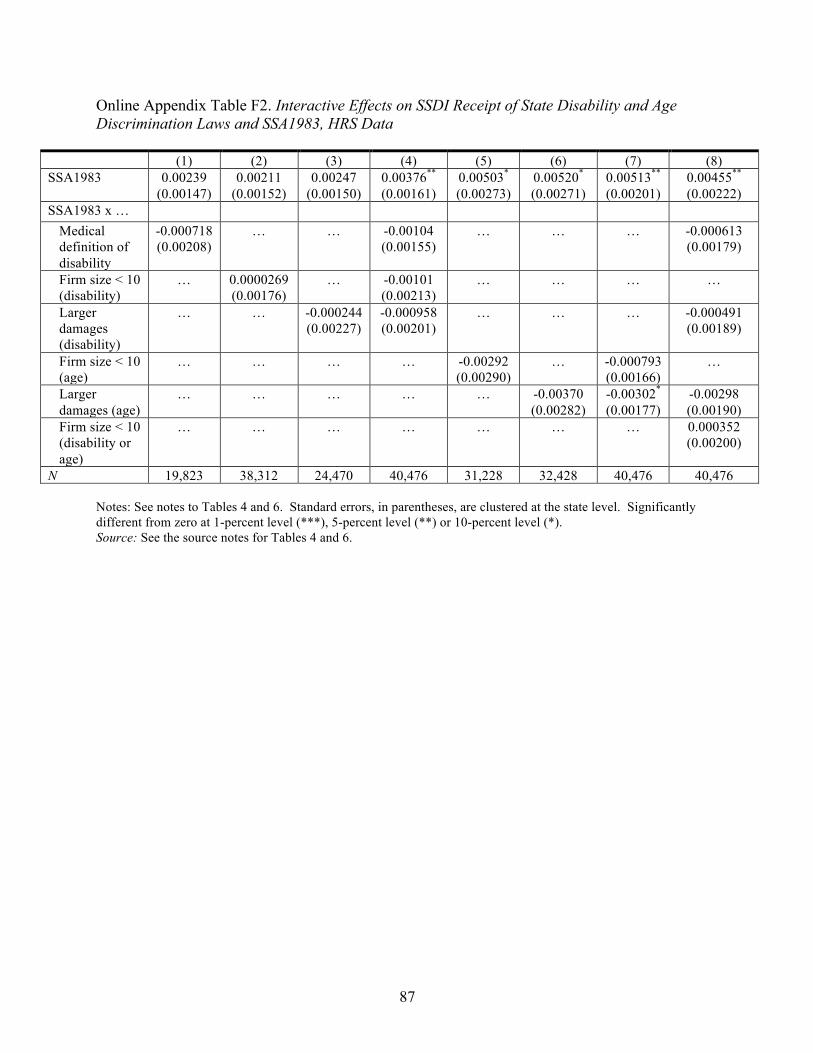
Online Appendix Table F2. Interactive Effects on SSDI Receipt of State Disability and Age Discrimination Laws and SSA1983, HRS Data
(1) (2) (3) (4) (5) (6) (7) (8) SSA1983 0.00239
(0.00147) 0.00211
(0.00152) 0.00247
(0.00150) 0.00376**
(0.00161) 0.00503*
(0.00273) 0.00520*
(0.00271) 0.00513**
(0.00201) 0.00455**
(0.00222) SSA1983 x …
Medical definition of disability
-0.000718 (0.00208)
… … -0.00104 (0.00155)
… … … -0.000613 (0.00179)
Firm size < 10 (disability)
… 0.0000269 (0.00176)
… -0.00101 (0.00213)
… … … …
Larger damages (disability)
… … -0.000244 (0.00227)
-0.000958 (0.00201)
… … … -0.000491 (0.00189)
Firm size < 10 (age)
… … … … -0.00292 (0.00290)
… -0.000793 (0.00166)
…
Larger damages (age)
… … … … … -0.00370 (0.00282)
-0.00302*
(0.00177) -0.00298 (0.00190)
Firm size < 10 (disability or age)
… … … … … … … 0.000352 (0.00200)
N 19,823 38,312 24,470 40,476 31,228 32,428 40,476 40,476
Notes: See notes to Tables 4 and 6. Standard errors, in parentheses, are clustered at the state level. Significantly different from zero at 1-percent level (***), 5-percent level (**) or 10-percent level (*). Source: See the source notes for Tables 4 and 6.
87
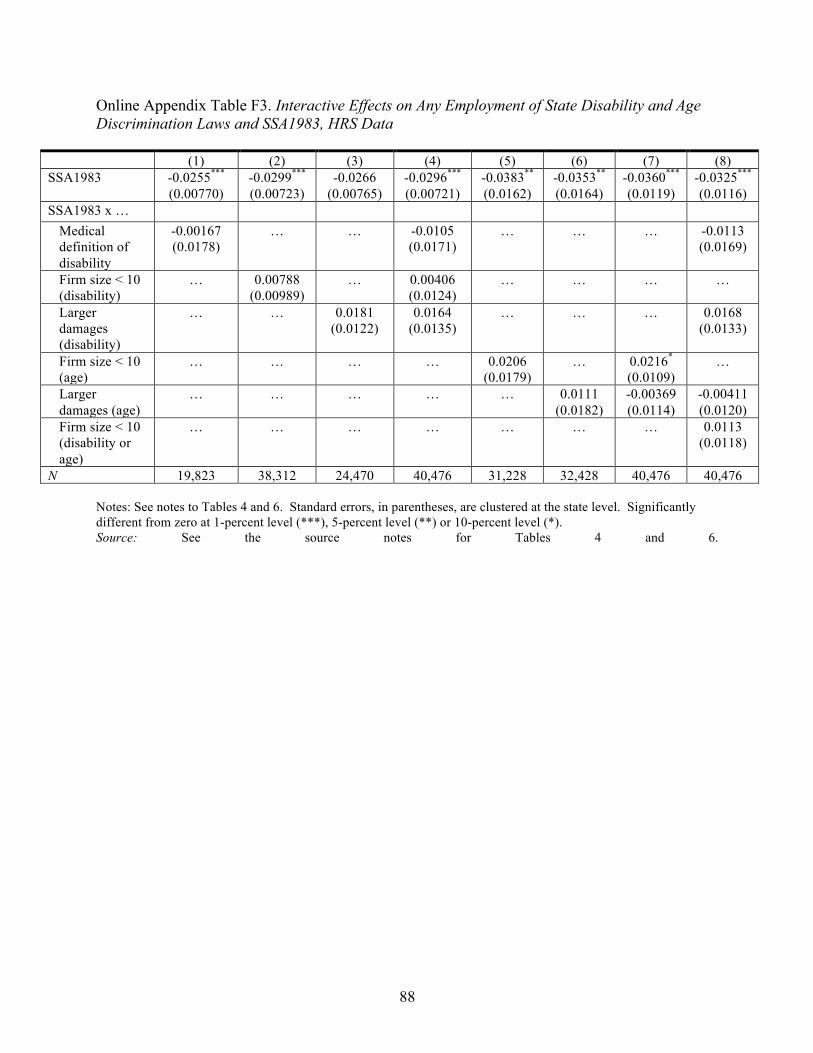
Online Appendix Table F3. Interactive Effects on Any Employment of State Disability and Age Discrimination Laws and SSA1983, HRS Data
(1) (2) (3) (4) (5) (6) (7) (8) SSA1983 -0.0255***
(0.00770) -0.0299***
(0.00723) -0.0266
(0.00765) -0.0296***
(0.00721) -0.0383**
(0.0162) -0.0353**
(0.0164) -0.0360***
(0.0119) -0.0325***
(0.0116) SSA1983 x …
Medical definition of disability
-0.00167 (0.0178)
… … -0.0105 (0.0171)
… … … -0.0113 (0.0169)
Firm size < 10 (disability)
… 0.00788 (0.00989)
… 0.00406 (0.0124)
… … … …
Larger damages (disability)
… … 0.0181 (0.0122)
0.0164 (0.0135)
… … … 0.0168 (0.0133)
Firm size < 10 (age)
… … … … 0.0206 (0.0179)
… 0.0216*
(0.0109) …
Larger damages (age)
… … … … … 0.0111 (0.0182)
-0.00369 (0.0114)
-0.00411 (0.0120)
Firm size < 10 (disability or age)
… … … … … … … 0.0113 (0.0118)
N 19,823 38,312 24,470 40,476 31,228 32,428 40,476 40,476
Notes: See notes to Tables 4 and 6. Standard errors, in parentheses, are clustered at the state level. Significantly different from zero at 1-percent level (***), 5-percent level (**) or 10-percent level (*). Source: See the source notes for Tables 4 and 6.
88
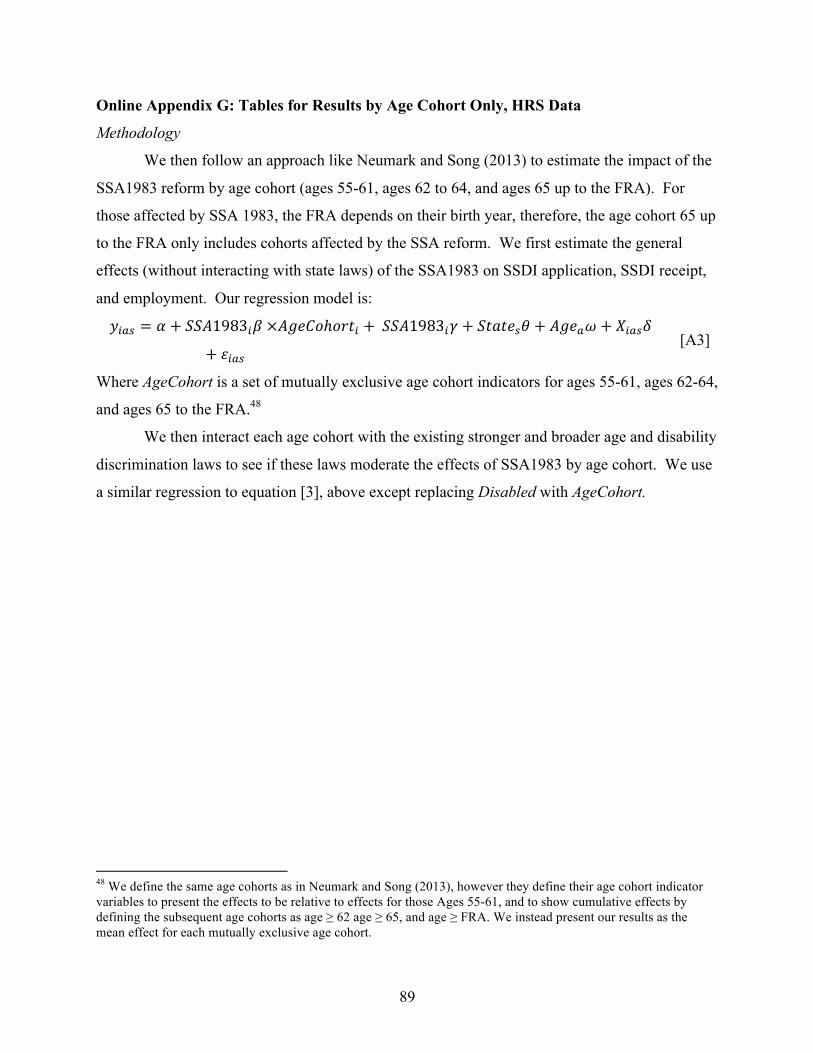
Online Appendix G: Tables for Results by Age Cohort Only, HRS Data
Methodology
We then follow an approach like Neumark and Song (2013) to estimate the impact of the
SSA1983 reform by age cohort (ages 55-61, ages 62 to 64, and ages 65 up to the FRA). For
those affected by SSA 1983, the FRA depends on their birth year, therefore, the age cohort 65 up
to the FRA only includes cohorts affected by the SSA reform. We first estimate the general
effects (without interacting with state laws) of the SSA1983 on SSDI application, SSDI receipt,
and employment. Our regression model is:
�!"# = � + ���1983!� ×�����ℎ���! + ���1983!� + �����!� + ���!� + �!"#� [A3]
+ �!"#
Where AgeCohort is a set of mutually exclusive age cohort indicators for ages 55-61, ages 62-64,
and ages 65 to the FRA.48
We then interact each age cohort with the existing stronger and broader age and disability
discrimination laws to see if these laws moderate the effects of SSA1983 by age cohort. We use
a similar regression to equation [3], above except replacing Disabled with AgeCohort.
48 We define the same age cohorts as in Neumark and Song (2013), however they define their age cohort indicator variables to present the effects to be relative to effects for those Ages 55-61, and to show cumulative effects by defining the subsequent age cohorts as age ≥ 62 age ≥ 65, and age ≥ FRA. We instead present our results as the mean effect for each mutually exclusive age cohort.
89
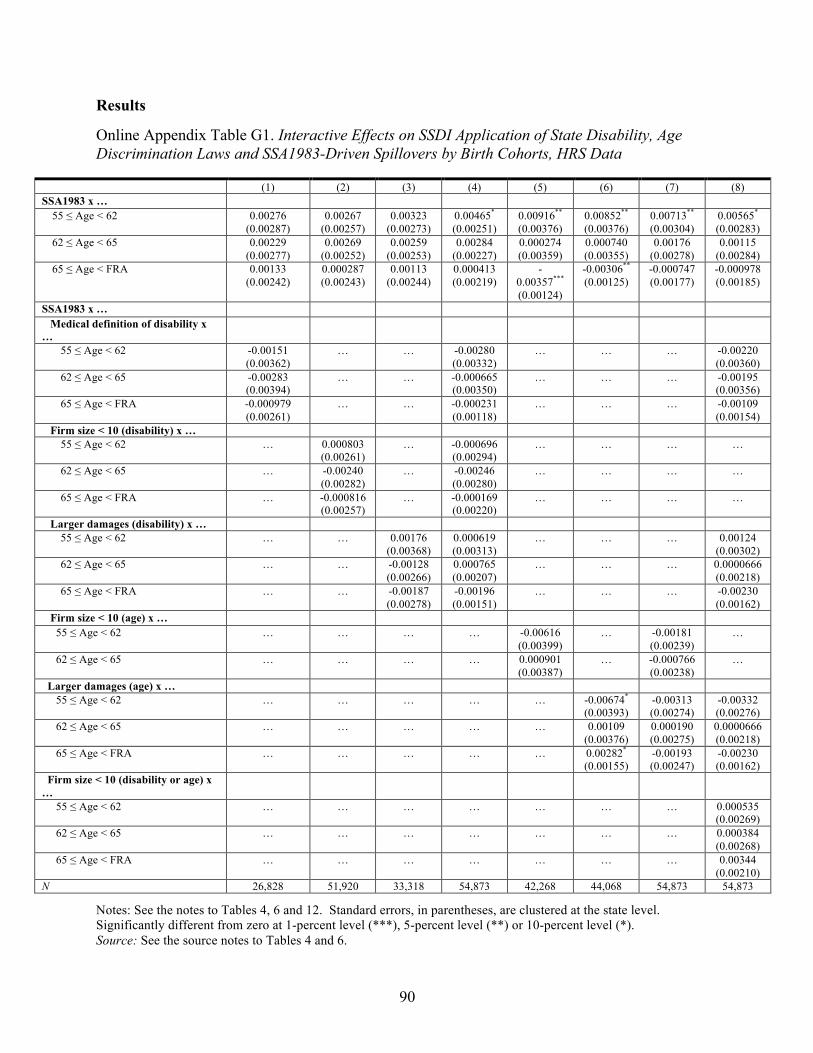
Results
Online Appendix Table G1. Interactive Effects on SSDI Application of State Disability, Age Discrimination Laws and SSA1983-Driven Spillovers by Birth Cohorts, HRS Data
(1) (2) (3) (4) (5) (6) (7) (8) SSA1983 x …
55 ≤ Age < 62 0.00276 (0.00287)
0.00267 (0.00257)
0.00323 (0.00273)
0.00465*
(0.00251) 0.00916**
(0.00376) 0.00852**
(0.00376) 0.00713**
(0.00304) 0.00565*
(0.00283) 62 ≤ Age < 65 0.00229
(0.00277) 0.00269
(0.00252) 0.00259
(0.00253) 0.00284
(0.00227) 0.000274 (0.00359)
0.000740 (0.00355)
0.00176 (0.00278)
0.00115 (0.00284)
65 ≤ Age < FRA 0.00133 (0.00242)
0.000287 (0.00243)
0.00113 (0.00244)
0.000413 (0.00219)
-0.00357***
(0.00124)
-0.00306**
(0.00125) -0.000747 (0.00177)
-0.000978 (0.00185)
SSA1983 x … Medical definition of disability x
… 55 ≤ Age < 62 -0.00151
(0.00362) … … -0.00280
(0.00332) … … … -0.00220
(0.00360) 62 ≤ Age < 65 -0.00283
(0.00394) … … -0.000665
(0.00350) … … … -0.00195
(0.00356) 65 ≤ Age < FRA -0.000979
(0.00261) … … -0.000231
(0.00118) … … … -0.00109
(0.00154) Firm size < 10 (disability) x …
55 ≤ Age < 62 … 0.000803 (0.00261)
… -0.000696 (0.00294)
… … … …
62 ≤ Age < 65 … -0.00240 (0.00282)
… -0.00246 (0.00280)
… … … …
65 ≤ Age < FRA … -0.000816 (0.00257)
… -0.000169 (0.00220)
… … … …
Larger damages (disability) x … 55 ≤ Age < 62 … … 0.00176
(0.00368) 0.000619 (0.00313)
… … … 0.00124 (0.00302)
62 ≤ Age < 65 … … -0.00128 (0.00266)
0.000765 (0.00207)
… … … 0.0000666 (0.00218)
65 ≤ Age < FRA … … -0.00187 (0.00278)
-0.00196 (0.00151)
… … … -0.00230 (0.00162)
Firm size < 10 (age) x … 55 ≤ Age < 62 … … … … -0.00616
(0.00399) … -0.00181
(0.00239) …
62 ≤ Age < 65 … … … … 0.000901 (0.00387)
… -0.000766 (0.00238)
…
Larger damages (age) x … 55 ≤ Age < 62 … … … … … -0.00674*
(0.00393) -0.00313 (0.00274)
-0.00332 (0.00276)
62 ≤ Age < 65 … … … … … 0.00109 (0.00376)
0.000190 (0.00275)
0.0000666 (0.00218)
65 ≤ Age < FRA … … … … … 0.00282*
(0.00155) -0.00193 (0.00247)
-0.00230 (0.00162)
Firm size < 10 (disability or age) x …
55 ≤ Age < 62 … … … … … … … 0.000535 (0.00269)
62 ≤ Age < 65 … … … … … … … 0.000384 (0.00268)
65 ≤ Age < FRA … … … … … … … 0.00344 (0.00210)
N 26,828 51,920 33,318 54,873 42,268 44,068 54,873 54,873
Notes: See the notes to Tables 4, 6 and 12. Standard errors, in parentheses, are clustered at the state level. Significantly different from zero at 1-percent level (***), 5-percent level (**) or 10-percent level (*). Source: See the source notes to Tables 4 and 6.
90
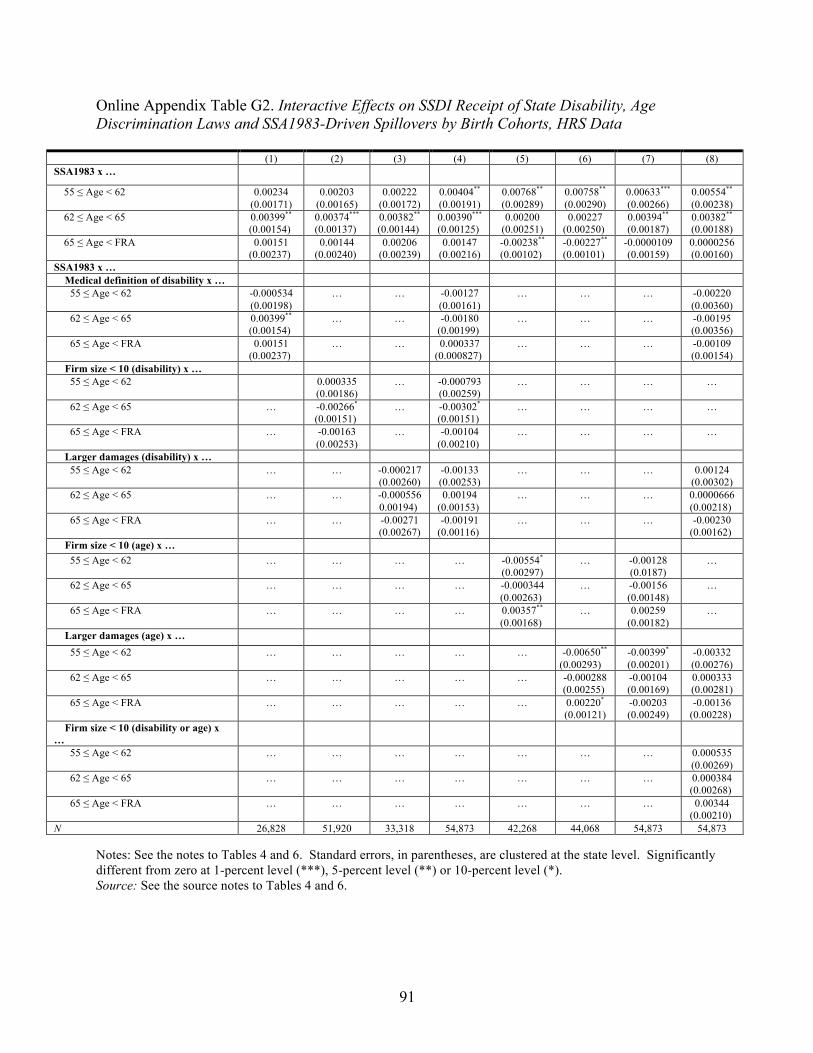
Online Appendix Table G2. Interactive Effects on SSDI Receipt of State Disability, Age Discrimination Laws and SSA1983-Driven Spillovers by Birth Cohorts, HRS Data
(1) (2) (3) (4) (5) (6) (7) (8) SSA1983 x …
55 ≤ Age < 62 0.00234 (0.00171)
0.00203 (0.00165)
0.00222 (0.00172)
0.00404**
(0.00191) 0.00768**
(0.00289) 0.00758**
(0.00290) 0.00633***
(0.00266) 0.00554**
(0.00238) 62 ≤ Age < 65 0.00399**
(0.00154) 0.00374***
(0.00137) 0.00382**
(0.00144) 0.00390***
(0.00125) 0.00200
(0.00251) 0.00227
(0.00250) 0.00394**
(0.00187) 0.00382**
(0.00188) 65 ≤ Age < FRA 0.00151
(0.00237) 0.00144
(0.00240) 0.00206
(0.00239) 0.00147
(0.00216) -0.00238**
(0.00102) -0.00227**
(0.00101) -0.0000109 (0.00159)
0.0000256 (0.00160)
SSA1983 x … Medical definition of disability x …
55 ≤ Age < 62 -0.000534 (0.00198)
… … -0.00127 (0.00161)
… … … -0.00220 (0.00360)
62 ≤ Age < 65 0.00399**
(0.00154) … … -0.00180
(0.00199) … … … -0.00195
(0.00356) 65 ≤ Age < FRA 0.00151
(0.00237) … … 0.000337
(0.000827) … … … -0.00109
(0.00154) Firm size < 10 (disability) x …
55 ≤ Age < 62 0.000335 (0.00186)
… -0.000793 (0.00259)
… … … …
62 ≤ Age < 65 … -0.00266*
(0.00151) … -0.00302*
(0.00151) … … … …
65 ≤ Age < FRA … -0.00163 (0.00253)
… -0.00104 (0.00210)
… … … …
Larger damages (disability) x … 55 ≤ Age < 62 … … -0.000217
(0.00260) -0.00133 (0.00253)
… … … 0.00124 (0.00302)
62 ≤ Age < 65 … … -0.000556 0.00194)
0.00194 (0.00153)
… … … 0.0000666 (0.00218)
65 ≤ Age < FRA … … -0.00271 (0.00267)
-0.00191 (0.00116)
… … … -0.00230 (0.00162)
Firm size < 10 (age) x … 55 ≤ Age < 62 … … … … -0.00554*
(0.00297) … -0.00128
(0.0187) …
62 ≤ Age < 65 … … … … -0.000344 (0.00263)
… -0.00156 (0.00148)
…
65 ≤ Age < FRA … … … … 0.00357**
(0.00168) … 0.00259
(0.00182) …
Larger damages (age) x … 55 ≤ Age < 62 … … … … … -0.00650**
(0.00293) -0.00399*
(0.00201) -0.00332 (0.00276)
62 ≤ Age < 65 … … … … … -0.000288 (0.00255)
-0.00104 (0.00169)
0.000333 (0.00281)
65 ≤ Age < FRA … … … … … 0.00220*
(0.00121) -0.00203 (0.00249)
-0.00136 (0.00228)
Firm size < 10 (disability or age) x …
55 ≤ Age < 62 … … … … … … … 0.000535 (0.00269)
62 ≤ Age < 65 … … … … … … … 0.000384 (0.00268)
65 ≤ Age < FRA … … … … … … … 0.00344 (0.00210)
N 26,828 51,920 33,318 54,873 42,268 44,068 54,873 54,873
Notes: See the notes to Tables 4 and 6. Standard errors, in parentheses, are clustered at the state level. Significantly different from zero at 1-percent level (***), 5-percent level (**) or 10-percent level (*). Source: See the source notes to Tables 4 and 6.
91
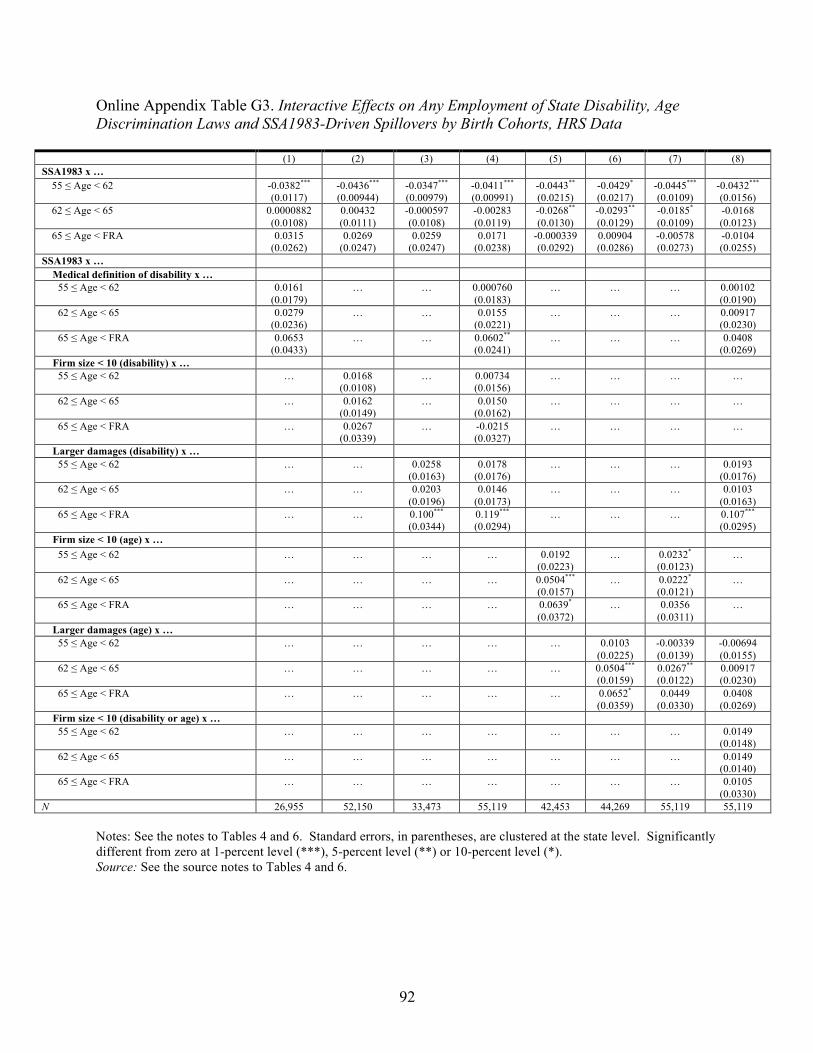
Online Appendix Table G3. Interactive Effects on Any Employment of State Disability, Age Discrimination Laws and SSA1983-Driven Spillovers by Birth Cohorts, HRS Data
(1) (2) (3) (4) (5) (6) (7) (8) SSA1983 x …
55 ≤ Age < 62 -0.0382***
(0.0117) -0.0436***
(0.00944) -0.0347***
(0.00979) -0.0411***
(0.00991) -0.0443**
(0.0215) -0.0429*
(0.0217) -0.0445***
(0.0109) -0.0432***
(0.0156) 62 ≤ Age < 65 0.0000882
(0.0108) 0.00432 (0.0111)
-0.000597 (0.0108)
-0.00283 (0.0119)
-0.0268**
(0.0130) -0.0293**
(0.0129) -0.0185*
(0.0109) -0.0168 (0.0123)
65 ≤ Age < FRA 0.0315 (0.0262)
0.0269 (0.0247)
0.0259 (0.0247)
0.0171 (0.0238)
-0.000339 (0.0292)
0.00904 (0.0286)
-0.00578 (0.0273)
-0.0104 (0.0255)
SSA1983 x … Medical definition of disability x …
55 ≤ Age < 62 0.0161 (0.0179)
… … 0.000760 (0.0183)
… … … 0.00102 (0.0190)
62 ≤ Age < 65 0.0279 (0.0236)
… … 0.0155 (0.0221)
… … … 0.00917 (0.0230)
65 ≤ Age < FRA 0.0653 (0.0433)
… … 0.0602**
(0.0241) … … … 0.0408
(0.0269) Firm size < 10 (disability) x …
55 ≤ Age < 62 … 0.0168 (0.0108)
… 0.00734 (0.0156)
… … … …
62 ≤ Age < 65 … 0.0162 (0.0149)
… 0.0150 (0.0162)
… … … …
65 ≤ Age < FRA … 0.0267 (0.0339)
… -0.0215 (0.0327)
… … … …
Larger damages (disability) x … 55 ≤ Age < 62 … … 0.0258
(0.0163) 0.0178
(0.0176) … … … 0.0193
(0.0176) 62 ≤ Age < 65 … … 0.0203
(0.0196) 0.0146
(0.0173) … … … 0.0103
(0.0163) 65 ≤ Age < FRA … … 0.100***
(0.0344) 0.119***
(0.0294) … … … 0.107***
(0.0295) Firm size < 10 (age) x …
55 ≤ Age < 62 … … … … 0.0192 (0.0223)
… 0.0232*
(0.0123) …
62 ≤ Age < 65 … … … … 0.0504***
(0.0157) … 0.0222*
(0.0121) …
65 ≤ Age < FRA … … … … 0.0639*
(0.0372) … 0.0356
(0.0311) …
Larger damages (age) x … 55 ≤ Age < 62 … … … … … 0.0103
(0.0225) -0.00339 (0.0139)
-0.00694 (0.0155)
62 ≤ Age < 65 … … … … … 0.0504***
(0.0159) 0.0267**
(0.0122) 0.00917 (0.0230)
65 ≤ Age < FRA … … … … … 0.0652*
(0.0359) 0.0449
(0.0330) 0.0408
(0.0269) Firm size < 10 (disability or age) x …
55 ≤ Age < 62 … … … … … … … 0.0149 (0.0148)
62 ≤ Age < 65 … … … … … … … 0.0149 (0.0140)
65 ≤ Age < FRA … … … … … … … 0.0105 (0.0330)
N 26,955 52,150 33,473 55,119 42,453 44,269 55,119 55,119
Notes: See the notes to Tables 4 and 6. Standard errors, in parentheses, are clustered at the state level. Significantly different from zero at 1-percent level (***), 5-percent level (**) or 10-percent level (*). Source: See the source notes to Tables 4 and 6.
92
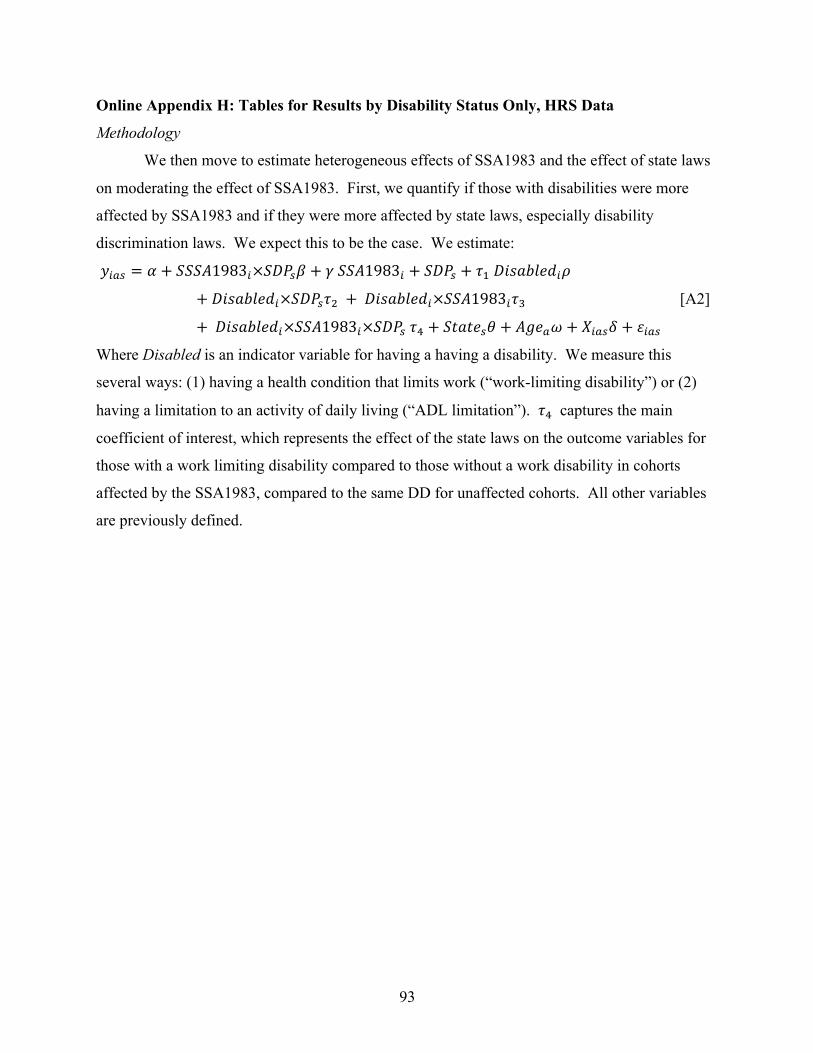
Online Appendix H: Tables for Results by Disability Status Only, HRS Data
Methodology
We then move to estimate heterogeneous effects of SSA1983 and the effect of state laws
on moderating the effect of SSA1983. First, we quantify if those with disabilities were more
affected by SSA1983 and if they were more affected by state laws, especially disability
discrimination laws. We expect this to be the case. We estimate:
�!"# = � + ����1983!���!� + � ���1983! + ���! + �! ��������!�
+ ��������!���!�! + ��������!���1983!�! [A2]
+ ��������!���1983!���! �! + �����!� + ���!� + �!"#� + �!"#
Where Disabled is an indicator variable for having a having a disability. We measure this
several ways: (1) having a health condition that limits work (“work-limiting disability”) or (2)
having a limitation to an activity of daily living (“ADL limitation”). �! captures the main
coefficient of interest, which represents the effect of the state laws on the outcome variables for
those with a work limiting disability compared to those without a work disability in cohorts
affected by the SSA1983, compared to the same DD for unaffected cohorts. All other variables
are previously defined.
93

Results
Online Appendix Table H1. Interactive Effects on SSDI Application of State Disability, Age Discrimination Laws and SSA1983-Driven Spillovers, and Work-Limiting Disability, HRS Data
(1) (2) (3) (4) (5) (6) (7) (8) SSA1983 0.000709
(0.00159) 0.000434 (0.00159)
0.000888 (0.00163)
0.000731 (0.00148)
-0.000236 (0.00303)
-0.000212 (0.00300)
0.00140 (0.00216)
0.000282 (0.00190)
SSA1983 x … Medical defn. of disability
-0.00183 (0.00204)
… … -0.00303*
(0.00170) … … … -0.00309*
(0.00174) Firm size < 10 (disability)
… 0.000360 (0.00176)
… 0.00122 (0.00187)
… … … …
Larger damages (disability)
… … -0.000104 (0.00204)
-0.00108 (0.00172)
… … … -0.00106 (0.00169)
Firm size < 10 (age)
… … … … 0.000536 (0.00317)
… -0.000868 (0.00164)
…
Larger damages (age)
… … … … … 0.000538 (0.00311)
-0.000148 (0.00178)
0.000308 (0.00187)
Firm size < 10 (dis. or age)
… … … … … … … 0.00145 (0.00187)
Work-limiting disability x …
0.00722 (0.00624)
0.00705 (0.00615)
0.00692 (0.00623)
0.0130*
(0.00664) 0.023***
(0.0112) 0.0235**
(0.0111) 0.0163*
(0.00899) 0.0147*
(0.00822) Medical defn. of disability
0.00394 (0.0107)
… … 0.00387 (0.0113)
… … … 0.00473 (0.0120)
Firm Size<10 (disability)
… 0.00228 (0.00714)
… -0.00751 (0.00878)
… … … …
Larger damages (dis)
… … 0.00876 (0.0105)
0.00821 (0.00971)
… … … 0.00948 (0.00994)
Firm size<10 (age)
… … … -0.0133 (0.0118)
… -0.000131 (0.00816)
…
Larger damages (age)
… … … … … -0.0157 (0.0119)
-0.00820 (0.00745)
-0.0113 (0.00763)
Firm size<10 (disability/age)
… … … … … … … -0.000107 (0.00829)
N 19,823 38,312 24,470 40,476 31,228 32,428 40,476 40,476
Notes: See the notes to Tables 4 and 6. Standard errors, in parentheses, are clustered at the state level. Significantly different from zero at 1-percent level (***), 5-percent level (**) or 10-percent level (*). Work-limiting disability equals 1 if an individual has at a health condition that limits work and 0 otherwise. Source: See the source notes to Tables 4 and 6.
94
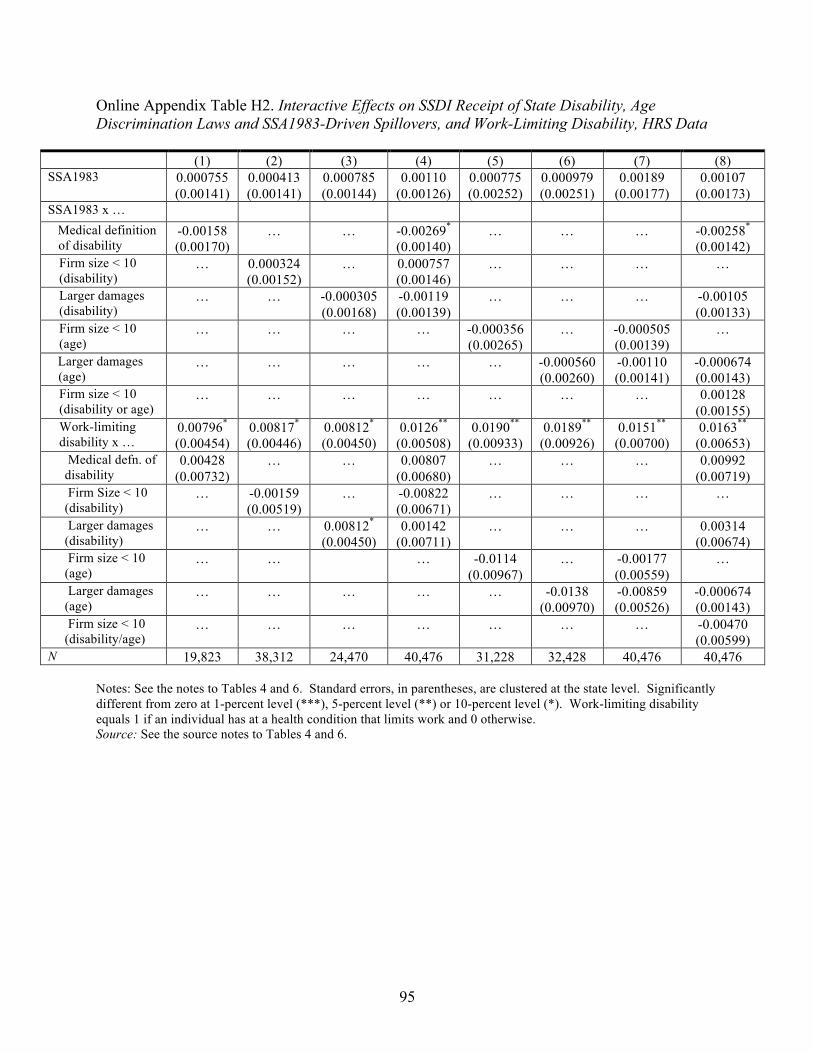
Online Appendix Table H2. Interactive Effects on SSDI Receipt of State Disability, Age Discrimination Laws and SSA1983-Driven Spillovers, and Work-Limiting Disability, HRS Data
(1) (2) (3) (4) (5) (6) (7) (8) SSA1983 0.000755
(0.00141) 0.000413 (0.00141)
0.000785 (0.00144)
0.00110 (0.00126)
0.000775 (0.00252)
0.000979 (0.00251)
0.00189 (0.00177)
0.00107 (0.00173)
SSA1983 x … Medical definition of disability
-0.00158 (0.00170)
… … -0.00269*
(0.00140) … … … -0.00258*
(0.00142) Firm size < 10 (disability)
… 0.000324 (0.00152)
… 0.000757 (0.00146)
… … … …
Larger damages (disability)
… … -0.000305 (0.00168)
-0.00119 (0.00139)
… … … -0.00105 (0.00133)
Firm size < 10 (age)
… … … … -0.000356 (0.00265)
… -0.000505 (0.00139)
…
Larger damages (age)
… … … … … -0.000560 (0.00260)
-0.00110 (0.00141)
-0.000674 (0.00143)
Firm size < 10 (disability or age)
… … … … … … … 0.00128 (0.00155)
Work-limiting disability x …
0.00796*
(0.00454) 0.00817*
(0.00446) 0.00812*
(0.00450) 0.0126**
(0.00508) 0.0190**
(0.00933) 0.0189**
(0.00926) 0.0151**
(0.00700) 0.0163**
(0.00653) Medical defn. of
disability 0.00428
(0.00732) … … 0.00807
(0.00680) … … … 0.00992
(0.00719) Firm Size < 10
(disability) … -0.00159
(0.00519) … -0.00822
(0.00671) … … … …
Larger damages (disability)
… … 0.00812*
(0.00450) 0.00142
(0.00711) … … … 0.00314
(0.00674) Firm size < 10
(age) … … … -0.0114
(0.00967) … -0.00177
(0.00559) …
Larger damages (age)
… … … … … -0.0138 (0.00970)
-0.00859 (0.00526)
-0.000674 (0.00143)
Firm size < 10 (disability/age)
… … … … … … … -0.00470 (0.00599)
N 19,823 38,312 24,470 40,476 31,228 32,428 40,476 40,476
Notes: See the notes to Tables 4 and 6. Standard errors, in parentheses, are clustered at the state level. Significantly different from zero at 1-percent level (***), 5-percent level (**) or 10-percent level (*). Work-limiting disability equals 1 if an individual has at a health condition that limits work and 0 otherwise. Source: See the source notes to Tables 4 and 6.
95
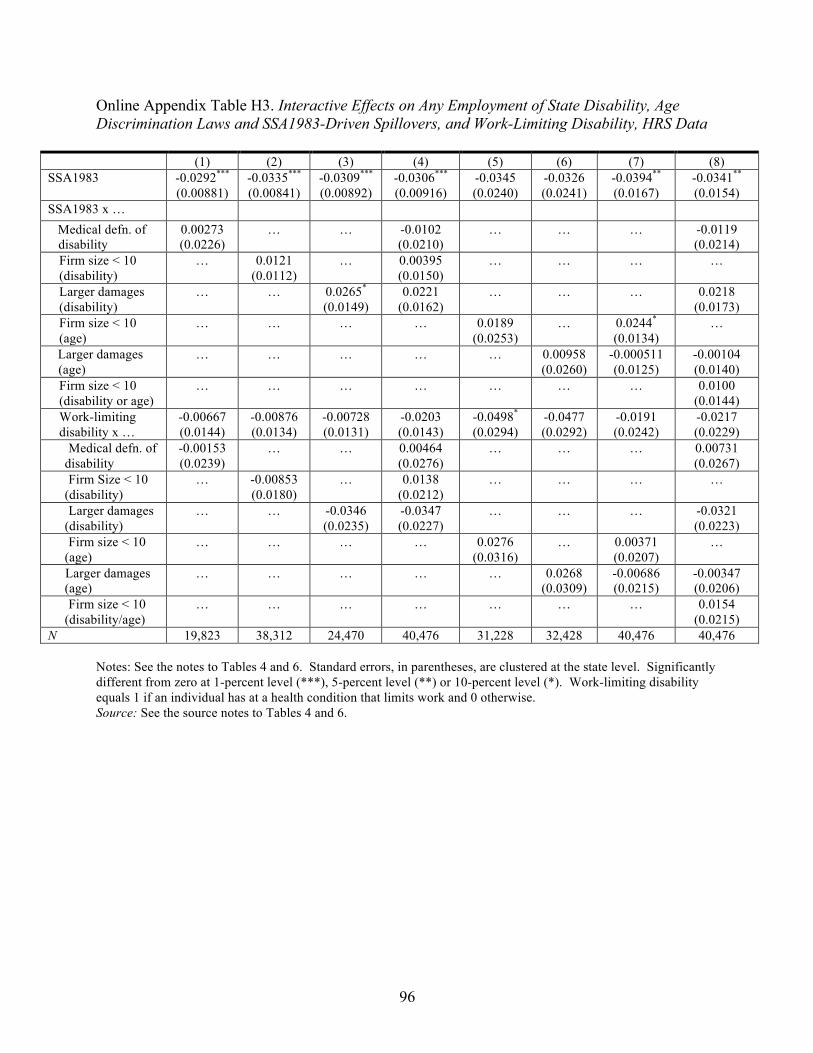
Online Appendix Table H3. Interactive Effects on Any Employment of State Disability, Age Discrimination Laws and SSA1983-Driven Spillovers, and Work-Limiting Disability, HRS Data
(1) (2) (3) (4) (5) (6) (7) (8) SSA1983 -0.0292***
(0.00881) -0.0335***
(0.00841) -0.0309***
(0.00892) -0.0306***
(0.00916) -0.0345 (0.0240)
-0.0326 (0.0241)
-0.0394**
(0.0167) -0.0341**
(0.0154) SSA1983 x …
Medical defn. of disability
0.00273 (0.0226)
… … -0.0102 (0.0210)
… … … -0.0119 (0.0214)
Firm size < 10 (disability)
… 0.0121 (0.0112)
… 0.00395 (0.0150)
… … … …
Larger damages (disability)
… … 0.0265*
(0.0149) 0.0221
(0.0162) … … … 0.0218
(0.0173) Firm size < 10 (age)
… … … … 0.0189 (0.0253)
… 0.0244*
(0.0134) …
Larger damages (age)
… … … … … 0.00958 (0.0260)
-0.000511 (0.0125)
-0.00104 (0.0140)
Firm size < 10 (disability or age)
… … … … … … … 0.0100 (0.0144)
Work-limiting disability x …
-0.00667 (0.0144)
-0.00876 (0.0134)
-0.00728 (0.0131)
-0.0203 (0.0143)
-0.0498*
(0.0294) -0.0477 (0.0292)
-0.0191 (0.0242)
-0.0217 (0.0229)
Medical defn. of disability
-0.00153 (0.0239)
… … 0.00464 (0.0276)
… … … 0.00731 (0.0267)
Firm Size < 10 (disability)
… -0.00853 (0.0180)
… 0.0138 (0.0212)
… … … …
Larger damages (disability)
… … -0.0346 (0.0235)
-0.0347 (0.0227)
… … … -0.0321 (0.0223)
Firm size < 10 (age)
… … … … 0.0276 (0.0316)
… 0.00371 (0.0207)
…
Larger damages (age)
… … … … … 0.0268 (0.0309)
-0.00686 (0.0215)
-0.00347 (0.0206)
Firm size < 10 (disability/age)
… … … … … … … 0.0154 (0.0215)
N 19,823 38,312 24,470 40,476 31,228 32,428 40,476 40,476
Notes: See the notes to Tables 4 and 6. Standard errors, in parentheses, are clustered at the state level. Significantly different from zero at 1-percent level (***), 5-percent level (**) or 10-percent level (*). Work-limiting disability equals 1 if an individual has at a health condition that limits work and 0 otherwise. Source: See the source notes to Tables 4 and 6.
96
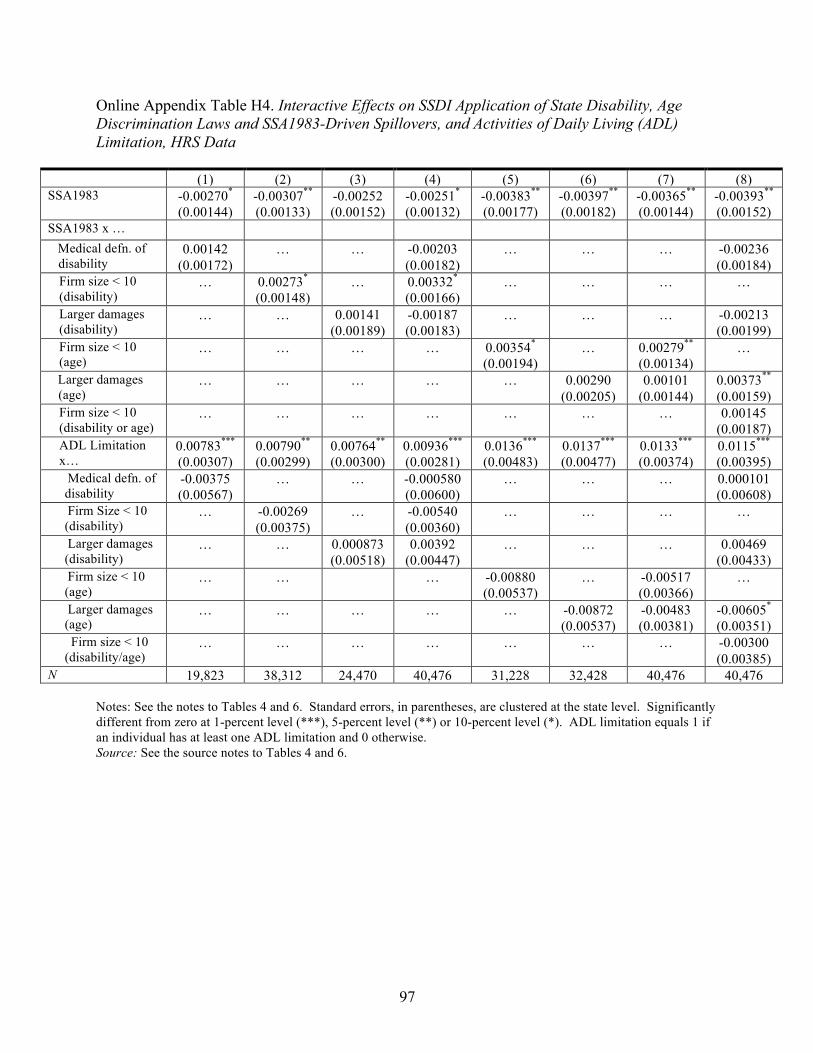
Online Appendix Table H4. Interactive Effects on SSDI Application of State Disability, Age Discrimination Laws and SSA1983-Driven Spillovers, and Activities of Daily Living (ADL) Limitation, HRS Data
(1) (2) (3) (4) (5) (6) (7) (8) SSA1983 -0.00270*
(0.00144) -0.00307**
(0.00133) -0.00252 (0.00152)
-0.00251*
(0.00132) -0.00383**
(0.00177) -0.00397**
(0.00182) -0.00365**
(0.00144) -0.00393**
(0.00152) SSA1983 x …
Medical defn. of disability
0.00142 (0.00172)
… … -0.00203 (0.00182)
… … … -0.00236 (0.00184)
Firm size < 10 (disability)
… 0.00273*
(0.00148) … 0.00332*
(0.00166) … … … …
Larger damages (disability)
… … 0.00141 (0.00189)
-0.00187 (0.00183)
… … … -0.00213 (0.00199)
Firm size < 10 (age)
… … … … 0.00354*
(0.00194) … 0.00279**
(0.00134) …
Larger damages (age)
… … … … … 0.00290 (0.00205)
0.00101 (0.00144)
0.00373**
(0.00159) Firm size < 10 (disability or age)
… … … … … … … 0.00145 (0.00187)
ADL Limitation x…
0.00783***
(0.00307) 0.00790**
(0.00299) 0.00764**
(0.00300) 0.00936***
(0.00281) 0.0136***
(0.00483) 0.0137***
(0.00477) 0.0133***
(0.00374) 0.0115***
(0.00395) Medical defn. of disability
-0.00375 (0.00567)
… … -0.000580 (0.00600)
… … … 0.000101 (0.00608)
Firm Size < 10 (disability)
… -0.00269 (0.00375)
… -0.00540 (0.00360)
… … … …
Larger damages (disability)
… … 0.000873 (0.00518)
0.00392 (0.00447)
… … … 0.00469 (0.00433)
Firm size < 10 (age)
… … … -0.00880 (0.00537)
… -0.00517 (0.00366)
…
Larger damages (age)
… … … … … -0.00872 (0.00537)
-0.00483 (0.00381)
-0.00605*
(0.00351) Firm size < 10
(disability/age) … … … … … … … -0.00300
(0.00385) N 19,823 38,312 24,470 40,476 31,228 32,428 40,476 40,476
Notes: See the notes to Tables 4 and 6. Standard errors, in parentheses, are clustered at the state level. Significantly different from zero at 1-percent level (***), 5-percent level (**) or 10-percent level (*). ADL limitation equals 1 if an individual has at least one ADL limitation and 0 otherwise. Source: See the source notes to Tables 4 and 6.
97
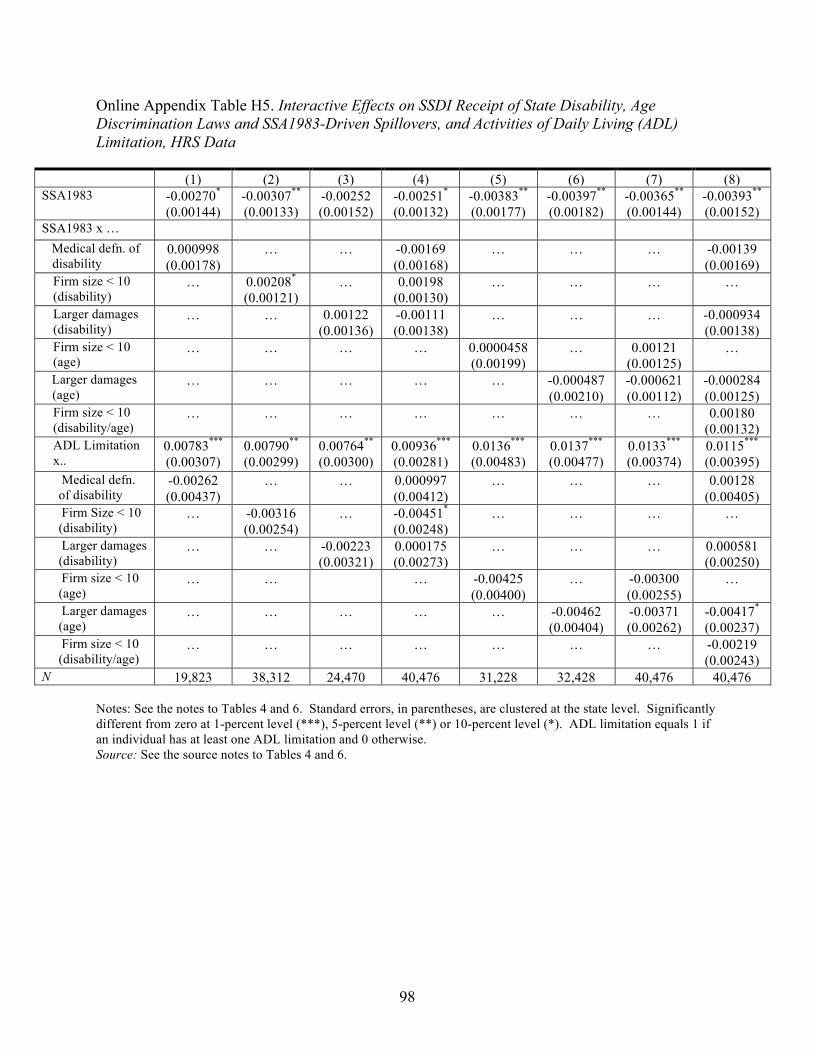
Online Appendix Table H5. Interactive Effects on SSDI Receipt of State Disability, Age Discrimination Laws and SSA1983-Driven Spillovers, and Activities of Daily Living (ADL) Limitation, HRS Data
(1) (2) (3) (4) (5) (6) (7) (8) SSA1983 -0.00270*
(0.00144) -0.00307**
(0.00133) -0.00252 (0.00152)
-0.00251*
(0.00132) -0.00383**
(0.00177) -0.00397**
(0.00182) -0.00365**
(0.00144) -0.00393**
(0.00152) SSA1983 x …
Medical defn. of disability
0.000998 (0.00178)
… … -0.00169 (0.00168)
… … … -0.00139 (0.00169)
Firm size < 10 (disability)
… 0.00208*
(0.00121) … 0.00198
(0.00130) … … … …
Larger damages (disability)
… … 0.00122 (0.00136)
-0.00111 (0.00138)
… … … -0.000934 (0.00138)
Firm size < 10 (age)
… … … … 0.0000458 (0.00199)
… 0.00121 (0.00125)
…
Larger damages (age)
… … … … … -0.000487 (0.00210)
-0.000621 (0.00112)
-0.000284 (0.00125)
Firm size < 10 (disability/age)
… … … … … … … 0.00180 (0.00132)
ADL Limitation x..
0.00783***
(0.00307) 0.00790**
(0.00299) 0.00764**
(0.00300) 0.00936***
(0.00281) 0.0136***
(0.00483) 0.0137***
(0.00477) 0.0133***
(0.00374) 0.0115***
(0.00395) Medical defn. of disability
-0.00262 (0.00437)
… … 0.000997 (0.00412)
… … … 0.00128 (0.00405)
Firm Size < 10 (disability)
… -0.00316 (0.00254)
… -0.00451*
(0.00248) … … … …
Larger damages (disability)
… … -0.00223 (0.00321)
0.000175 (0.00273)
… … … 0.000581 (0.00250)
Firm size < 10 (age)
… … … -0.00425 (0.00400)
… -0.00300 (0.00255)
…
Larger damages (age)
… … … … … -0.00462 (0.00404)
-0.00371 (0.00262)
-0.00417*
(0.00237) Firm size < 10 (disability/age)
… … … … … … … -0.00219 (0.00243)
N 19,823 38,312 24,470 40,476 31,228 32,428 40,476 40,476
Notes: See the notes to Tables 4 and 6. Standard errors, in parentheses, are clustered at the state level. Significantly different from zero at 1-percent level (***), 5-percent level (**) or 10-percent level (*). ADL limitation equals 1 if an individual has at least one ADL limitation and 0 otherwise. Source: See the source notes to Tables 4 and 6.
98
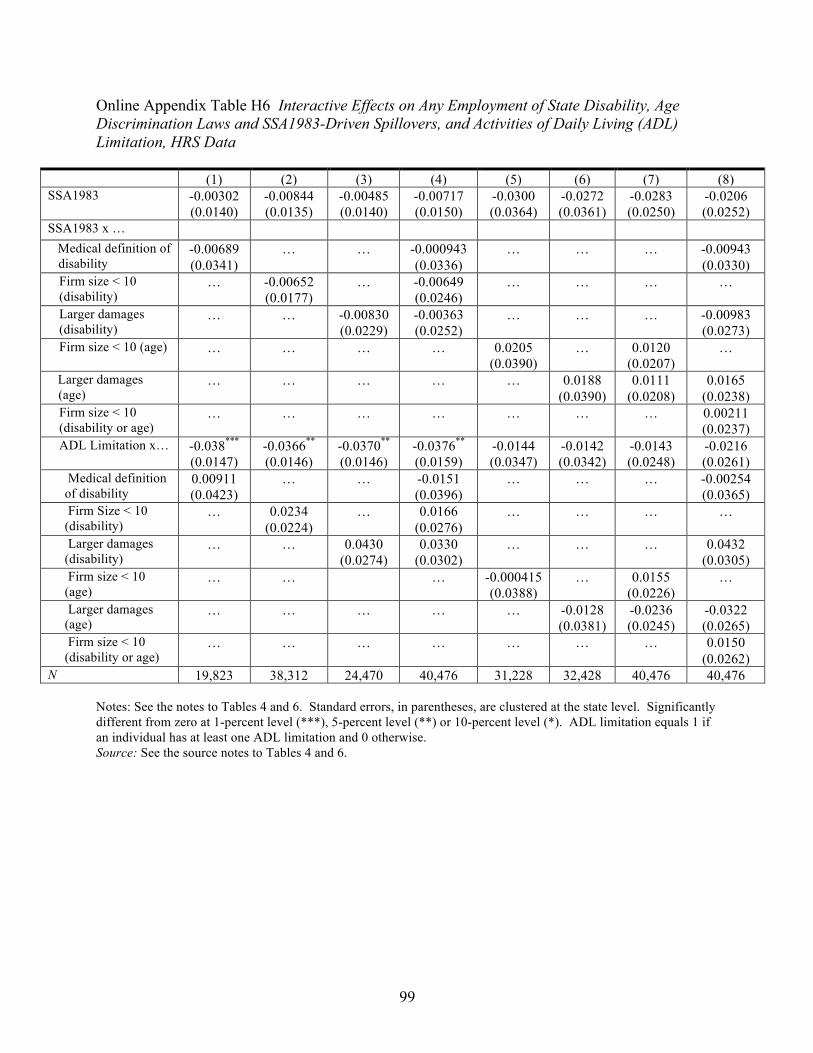
Online Appendix Table H6 Interactive Effects on Any Employment of State Disability, Age Discrimination Laws and SSA1983-Driven Spillovers, and Activities of Daily Living (ADL) Limitation, HRS Data
(1) (2) (3) (4) (5) (6) (7) (8) SSA1983 -0.00302
(0.0140) -0.00844 (0.0135)
-0.00485 (0.0140)
-0.00717 (0.0150)
-0.0300 (0.0364)
-0.0272 (0.0361)
-0.0283 (0.0250)
-0.0206 (0.0252)
SSA1983 x … Medical definition of disability
-0.00689 (0.0341)
… … -0.000943 (0.0336)
… … … -0.00943 (0.0330)
Firm size < 10 (disability)
… -0.00652 (0.0177)
… -0.00649 (0.0246)
… … … …
Larger damages (disability)
… … -0.00830 (0.0229)
-0.00363 (0.0252)
… … … -0.00983 (0.0273)
Firm size < 10 (age) … … … … 0.0205 (0.0390)
… 0.0120 (0.0207)
…
Larger damages (age)
… … … … … 0.0188 (0.0390)
0.0111 (0.0208)
0.0165 (0.0238)
Firm size < 10 (disability or age)
… … … … … … … 0.00211 (0.0237)
ADL Limitation x… -0.038***
(0.0147) -0.0366**
(0.0146) -0.0370**
(0.0146) -0.0376**
(0.0159) -0.0144 (0.0347)
-0.0142 (0.0342)
-0.0143 (0.0248)
-0.0216 (0.0261)
Medical definition of disability
0.00911 (0.0423)
… … -0.0151 (0.0396)
… … … -0.00254 (0.0365)
Firm Size < 10 (disability)
… 0.0234 (0.0224)
… 0.0166 (0.0276)
… … … …
Larger damages (disability)
… … 0.0430 (0.0274)
0.0330 (0.0302)
… … … 0.0432 (0.0305)
Firm size < 10 (age)
… … … -0.000415 (0.0388)
… 0.0155 (0.0226)
…
Larger damages (age)
… … … … … -0.0128 (0.0381)
-0.0236 (0.0245)
-0.0322 (0.0265)
Firm size < 10 (disability or age)
… … … … … … … 0.0150 (0.0262)
N 19,823 38,312 24,470 40,476 31,228 32,428 40,476 40,476
Notes: See the notes to Tables 4 and 6. Standard errors, in parentheses, are clustered at the state level. Significantly different from zero at 1-percent level (***), 5-percent level (**) or 10-percent level (*). ADL limitation equals 1 if an individual has at least one ADL limitation and 0 otherwise. Source: See the source notes to Tables 4 and 6.
99
Online Appendix I: Tables for Results by Age Cohort, Disability Status, and Sex, HRS Data
Results: Heterogeneous Effects of SSA1983 by Sex
As we did with the aggregated SSDI application and receipt aggregated data, we also
investigate if any effects we observe in the HRS and HRS-Form-831 data differ by sex. Women
generally had more spillovers than men to SSDI application and receipt due to SSA1983. Online
Appendix Table I1 re-creates Table 11 for women only (Columns [1], [3], and [5]) and men only
(Columns [2], [4], and [6]) rather than using our default pooled sample. Earlier in Table 11, we
found that the effect of SSA1983 on SSDI application and receipt was concentrated in those with
disabilities of ages 55 to 61 who experienced large, statistically significant increases. We also
found that those ages 65 up to the FRA experienced decreased SSDI application and receipt.
These spillovers in the pooled analysis appear driven by women only. For men we find no
statistically significant effects of SSA1983 on SSDI application or SSDI receipt for individuals
of any age cohort with or without a work-limiting disability. For women only, the earlier results
from Table 12 are of a larger magnitude and are even more statistically significant.
Using the ADL limitation definition of disability instead (Online Appendix Table I2), we
find fewer stark differences by sex. For women, the spillover effects on SSDI application for
those 55 to 61 with an ADL limitation are larger, but there is no difference by sex in SSDI
receipt. We also find that the decrease in SSDI receipt for those ages 65 to the FRA with an
ADL limitation occurs more for men.
For employment, we generally see that SSA1983 induced more of an increase in
employment for women than for men. For example, among those ages 65 to the FRA without a
work limiting disability, women affected by SSA1983 experienced a 0.0954 percentage point
increase in any employment, statistically significant at the 1 percent level, while men only
experienced a 0.0567 percentage point increase, significant at the 10 percent level. These
differences by sex are less pronounced when using the ADL limitation measure of disability. For
example, women age 65 up to the FRA without (with) an ADL limitation had larger increases
(decreases) in any employment due to SSA1983, compared to men of the same ages and
disability status. Overall, especially for the work-limited measure of disability, we find that
women had more SSDI and employment responses to SSA1983.
Heterogeneous Moderating Effects on SSA1983 of State Laws by Sex, SSDI Application.
We finally move to if the moderating effects of state discrimination laws on SSA1983 differed
100
by sex. Earlier, our key results using the pooled sample where that there were decreases in SSDI
application, SSDI receipt, and any employment for those ages 65 up to the FRA with an ADL
limitation, but no results for work-limiting disabilities.
Online Appendix Tables I3-I6 present results for SSDI application. We find that the
medical definition of disability is associated with decreased SSDI application for men with a
work-limiting disability, but not women. Specifically, men of ages 65 up to the FRA with a
work-limiting disability in states with a medical definition of disability had a relative decrease in
their SSDI application rate of 0.00476 percentage points, significant at the 1 percent (5 percent)
level, in our preferred specification that includes all discrimination laws (Column [8]) in Online
Appendix Table I4. Using the ADL definition of disability instead provides similar, but weaker,
differences by sex. We find that the medical definition of disability is associated with decreased
SSDI application for both women and men of ages 65 to the FRA with an ADL limitation, but
the effect is larger for men. In our preferred specifications in column (8), we find a 0.00458
percentage point decrease in SSDI applications for men, significant at the 1 percent level (Online
Appendix Table I6), versus a 0.00318 percentage decrease for women, only significant at the 10
percent level (Online Appendix Table I5).
As for other disability and age discrimination laws, we find no differential effects of
other laws on women with work-limited disabilities. For men, we find some weak evidence of
larger damages for disability being associated with an increase in SSDI application for men ages
65 up to the FRA with a work-limiting disability. For ADL limitation, we still do not find any
effects for any laws on women but find some effects of age discrimination laws on men. We
find some mixed, non-robust, evidence of larger damages for age discrimination decreasing
SSDI applications for men ages 62 to 64 with an ADL limitation, but increasing SSDI
applications for men ages 65 up to the FRA with an ADL limitation. Across all age and
disability discrimination laws and measures of disability, it appears that men with disabilities
generally had a larger reduction in spillovers to SSDI applications due to laws.
Heterogeneous Moderating Effects on SSA1983 of State Laws by Sex, SSDI Receipt.
Online Appendix Tables I7-I10 present estimated effects on SSDI receipt. We find that the
medical definition of disability is also associated with decreased SSDI receipt for men more than
for women. For the work-limited measure of disability, we do not find that any laws moderate
101
outcomes for women of any age group with a work-limiting disability, but we do find effects on
men. Specifically, men of ages 65 up to the FRA with a work-limiting disability in states with a
medical definition of disability had a relative decrease in their SSDI receipt rate of 0.00229
percentage points, significant at the 5 percent level (Online Appendix Table I8, Column [8]).
Using the ADL definition of disability, we again find decreases in SSDI receipt for women and
men of ages 65 to the FRA with an ADL limitation. For men, the effects are smaller in
magnitude but are more statistically significant compared to for women. For men, this is a
0.00203 percentage point decrease, significant at the 5 percent level (Online Appendix Table I10,
Column [8]), and, for women, this is a 0.00318 percentage point decrease, but only significant at
the 10 percent level (Online Appendix Table I9, Column [8]). For men, this is again significant
for other specifications, but this is not the case for women.
For other discrimination laws, we find no effects on women with disabilities using either
the work-limiting disability measure or the ADL limitations measure. For men, we find a few
effects. For the work-limited measure the only moderating effect of other laws we find is that
there is some weak, non-robust, evidence that, in some cases, larger damages for disability are
associated with increased SSDI receipt for men 65 up to the FRA with a work-limiting disability.
We do not find any effects for the firm size minimum.
Heterogeneous Moderating Effects on SSA1983 of State Laws by Sex, Any Employment.
Starting with the medical definition of disability, the earlier decrease in employment that we
found for those ages 65 up to the FRA with an ADL limitation in medical definition of disability
states is driven by women only (Online Appendix Table I13), with the estimates being large and
statistically significant. For men (Online Appendix Table I14), the estimates are also negative
but are relatively smaller in magnitude and are not statistically significant.
For the firm size minimum and larger damages under disability discrimination law, we
find no effects for men and few effects for women with work-limiting disabilities. Using the
ADL limitation measure of disability, we find no effects on men with ADL limitations. We do,
however, find more robust, but still mixed, effects of the firm size minimum and larger damages
under disability discrimination law on women with ADL limitations. First, a lower firm size
minimum for disability discrimination laws is associated with increased employment for women
ages 62 to the FRA (Column [4]), but this is not robust across specifications. For larger damages
102
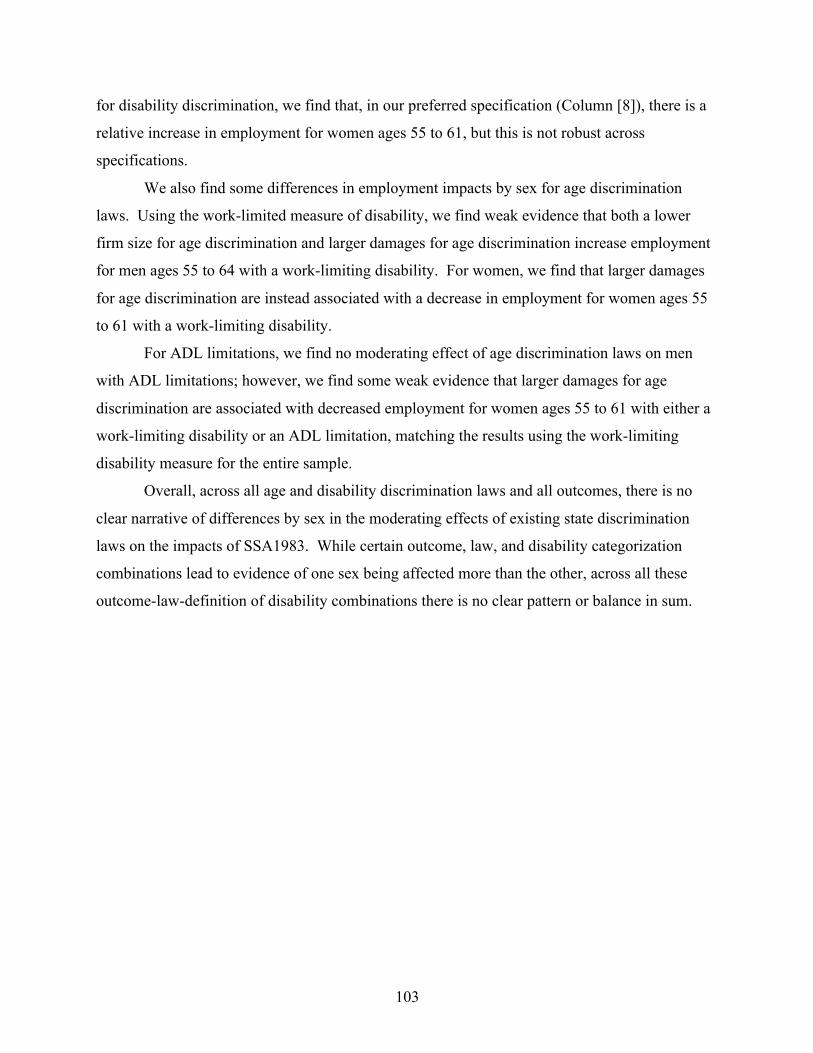
for disability discrimination, we find that, in our preferred specification (Column [8]), there is a
relative increase in employment for women ages 55 to 61, but this is not robust across
specifications.
We also find some differences in employment impacts by sex for age discrimination
laws. Using the work-limited measure of disability, we find weak evidence that both a lower
firm size for age discrimination and larger damages for age discrimination increase employment
for men ages 55 to 64 with a work-limiting disability. For women, we find that larger damages
for age discrimination are instead associated with a decrease in employment for women ages 55
to 61 with a work-limiting disability.
For ADL limitations, we find no moderating effect of age discrimination laws on men
with ADL limitations; however, we find some weak evidence that larger damages for age
discrimination are associated with decreased employment for women ages 55 to 61 with either a
work-limiting disability or an ADL limitation, matching the results using the work-limiting
disability measure for the entire sample.
Overall, across all age and disability discrimination laws and all outcomes, there is no
clear narrative of differences by sex in the moderating effects of existing state discrimination
laws on the impacts of SSA1983. While certain outcome, law, and disability categorization
combinations lead to evidence of one sex being affected more than the other, across all these
outcome-law-definition of disability combinations there is no clear pattern or balance in sum.
103
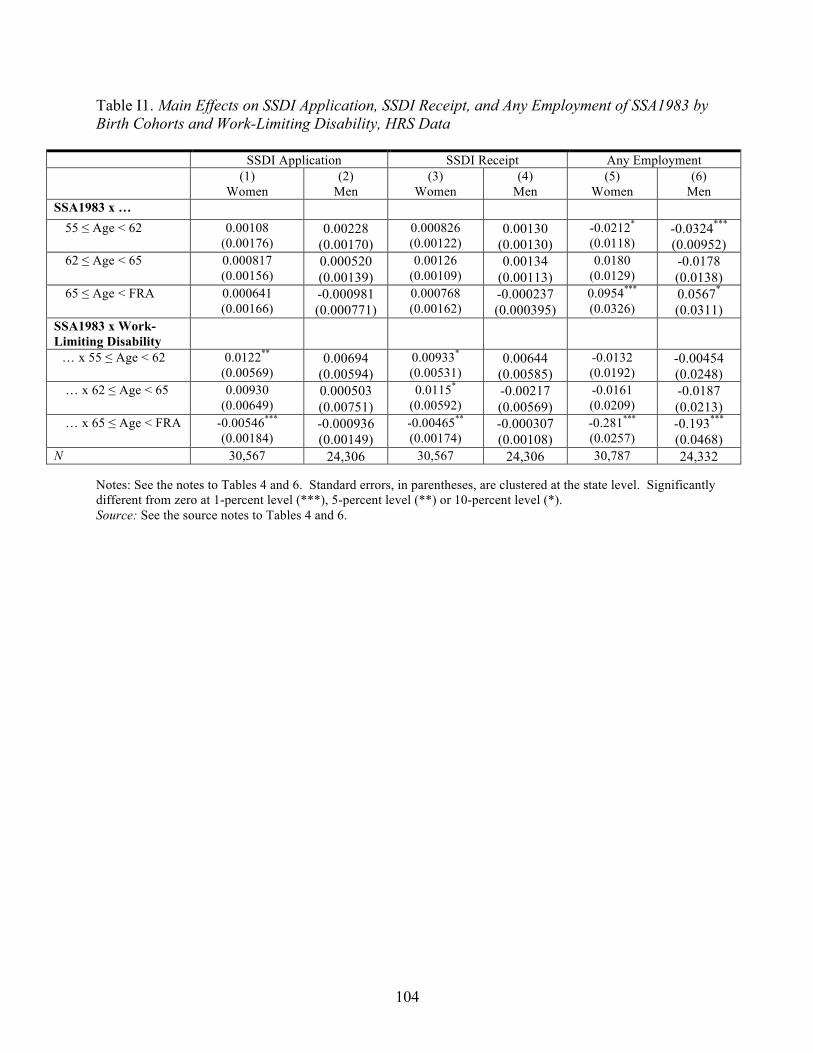
Table I1. Main Effects on SSDI Application, SSDI Receipt, and Any Employment of SSA1983 by Birth Cohorts and Work-Limiting Disability, HRS Data
SSDI Application SSDI Receipt Any Employment (1)
Women (2)
Men (3)
Women (4)
Men (5)
Women (6)
Men SSA1983 x …
55 ≤ Age < 62 0.00108 (0.00176)
0.00228 (0.00170)
0.000826 (0.00122)
0.00130 (0.00130)
-0.0212*
(0.0118) -0.0324***
(0.00952) 62 ≤ Age < 65 0.000817
(0.00156) 0.000520 (0.00139)
0.00126 (0.00109)
0.00134 (0.00113)
0.0180 (0.0129)
-0.0178 (0.0138)
65 ≤ Age < FRA 0.000641 (0.00166)
-0.000981 (0.000771)
0.000768 (0.00162)
-0.000237 (0.000395)
0.0954***
(0.0326) 0.0567*
(0.0311) SSA1983 x Work-Limiting Disability
… x 55 ≤ Age < 62 0.0122**
(0.00569) 0.00694
(0.00594) 0.00933*
(0.00531) 0.00644
(0.00585) -0.0132 (0.0192)
-0.00454 (0.0248)
… x 62 ≤ Age < 65 0.00930 (0.00649)
0.000503 (0.00751)
0.0115*
(0.00592) -0.00217 (0.00569)
-0.0161 (0.0209)
-0.0187 (0.0213)
… x 65 ≤ Age < FRA -0.00546***
(0.00184) -0.000936 (0.00149)
-0.00465**
(0.00174) -0.000307 (0.00108)
-0.281***
(0.0257) -0.193***
(0.0468) N 30,567 24,306 30,567 24,306 30,787 24,332
Notes: See the notes to Tables 4 and 6. Standard errors, in parentheses, are clustered at the state level. Significantly different from zero at 1-percent level (***), 5-percent level (**) or 10-percent level (*). Source: See the source notes to Tables 4 and 6.
104
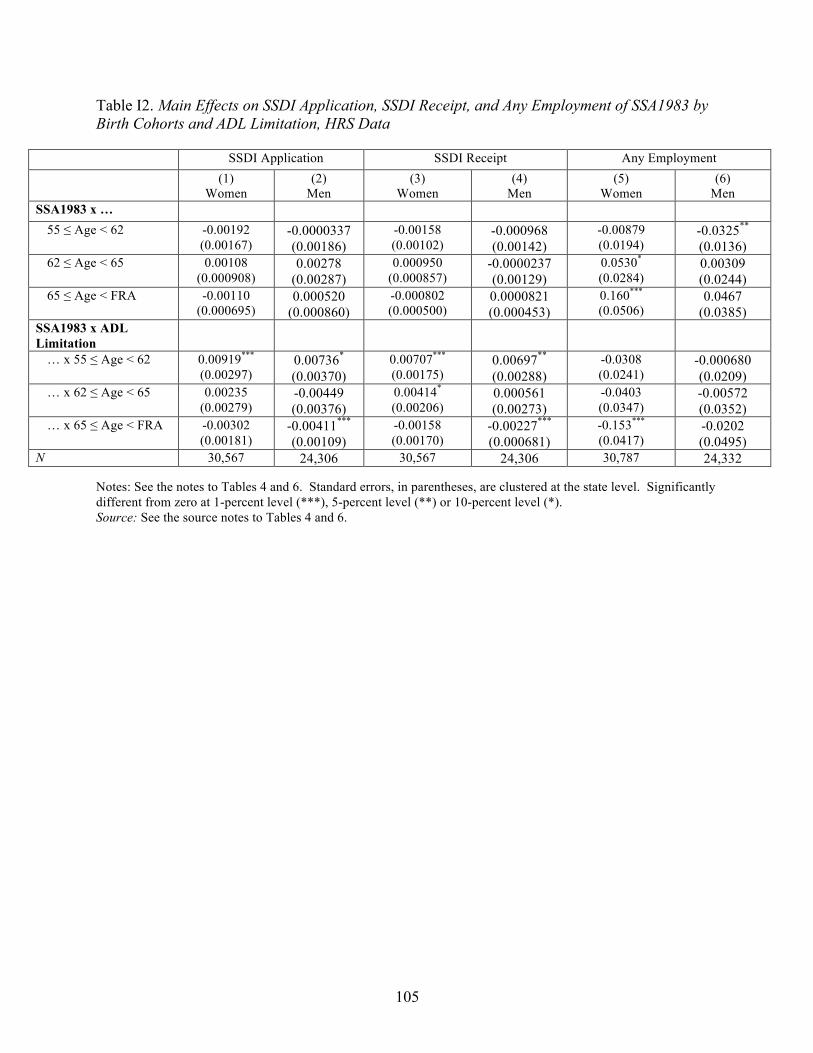
Table I2. Main Effects on SSDI Application, SSDI Receipt, and Any Employment of SSA1983 by Birth Cohorts and ADL Limitation, HRS Data
SSDI Application SSDI Receipt Any Employment (1)
Women (2)
Men (3)
Women (4)
Men (5)
Women (6)
Men SSA1983 x …
55 ≤ Age < 62 -0.00192 (0.00167)
-0.0000337 (0.00186)
-0.00158 (0.00102)
-0.000968 (0.00142)
-0.00879 (0.0194)
-0.0325**
(0.0136) 62 ≤ Age < 65 0.00108
(0.000908) 0.00278
(0.00287) 0.000950
(0.000857) -0.0000237 (0.00129)
0.0530*
(0.0284) 0.00309 (0.0244)
65 ≤ Age < FRA -0.00110 (0.000695)
0.000520 (0.000860)
-0.000802 (0.000500)
0.0000821 (0.000453)
0.160***
(0.0506) 0.0467
(0.0385) SSA1983 x ADL Limitation
… x 55 ≤ Age < 62 0.00919***
(0.00297) 0.00736*
(0.00370) 0.00707***
(0.00175) 0.00697**
(0.00288) -0.0308 (0.0241)
-0.000680 (0.0209)
… x 62 ≤ Age < 65 0.00235 (0.00279)
-0.00449 (0.00376)
0.00414*
(0.00206) 0.000561 (0.00273)
-0.0403 (0.0347)
-0.00572 (0.0352)
… x 65 ≤ Age < FRA -0.00302 (0.00181)
-0.00411***
(0.00109) -0.00158 (0.00170)
-0.00227***
(0.000681) -0.153***
(0.0417) -0.0202 (0.0495)
N 30,567 24,306 30,567 24,306 30,787 24,332
Notes: See the notes to Tables 4 and 6. Standard errors, in parentheses, are clustered at the state level. Significantly different from zero at 1-percent level (***), 5-percent level (**) or 10-percent level (*). Source: See the source notes to Tables 4 and 6.
105

Table I3. Interactive Effects on SSDI Applications of State Disability, Age Discrimination Laws and SSA1983-Driven Spillovers by Birth Cohorts and Work-Limiting Disability – Effects on Women Only, HRS Data
(1) (2) (3) (4) (5) (6) (7) (8) SSA1983 x Work-Limiting Disability x …
55 ≤ Age < 62 0.00519 (0.0123)
0.00523 (0.0120)
0.00534 (0.0122)
0.00944 (0.0111)
0.00147 (0.0177)
0.00160 (0.0177)
0.00693 (0.0123)
0.00360 (0.0141)
62 ≤ Age < 65 0.00545 (0.0124)
0.00553 (0.0121)
0.00593 (0.0123)
0.00667 (0.0112)
0.0223 (0.0163)
0.0219 (0.0162)
0.0159 (0.0131)
0.00967 (0.0144)
65 ≤ Age < FRA -0.00793 (0.00544)
-0.00858 (0.00526)
-0.00950*
(0.00542) -0.00766 (0.00466)
-0.00279 (0.00214)
-0.00225 (0.00230)
-0.00658*
(0.00330) -0.00637*
(0.00323) SSA1983 x Work-Limiting Disability x …
Medical definition of disability x … 55 ≤ Age < 62 0.0139
(0.0213) … … 0.00970
(0.0203) … … … 0.00705
(0.0204) 62 ≤ Age < 65 -0.0165
(0.0242) … … -0.0245
(0.0226) … … … -0.0214
(0.0237) 65 ≤ Age < FRA 0.00495
(0.00513) … … -0.000241
(0.00247) … … … 0.000805
(0.00301) Firm Size < 10 (disability) x …
55 ≤ Age < 62 … 0.00787 (0.0137)
… -0.00124 (0.0122)
… … … …
62 ≤ Age < 65 … 0.00452 (0.0147)
… 0.00460 (0.0133)
… … … …
65 ≤ Age < FRA … 0.00445 (0.00523)
… 0.00289 (0.00446)
… … … …
Larger damages (disability) x … 55 ≤ Age < 62 … … 0.0108
(0.0172) 0.00648 (0.0141)
… … … 0.00543 (0.0331)
62 ≤ Age < 65 … … 0.0124 (0.0182)
0.00934 (0.0143)
… … … 0.0121 (0.0147)
65 ≤ Age < FRA … … 0.00422 (0.00546)
0.00135 (0.00238)
… … … 0.00180 (0.00268)
Firm size < 10 (age) x … 55 ≤ Age < 62 … … … … 0.0121
(0.0188) … 0.00348
(0.0135) …
62 ≤ Age < 65 … … … … -0.0133 (0.0180)
… 0.000103 (0.0141)
…
65 ≤ Age < FRA … … … … -0.00421 (0.00353)
… -0.00427 (0.00374)
…
Larger damages (age) x … 55 ≤ Age < 62 … … … … … 0.0122
(0.0193) 0.00434 (0.0114)
0.000659 (0.0119)
62 ≤ Age < 65 … … … … … -0.0164 (0.0186)
-0.0101 (0.0123)
-0.0109 (0.0123)
65 ≤ Age < FRA … … … … … -0.000769 (0.00234)
0.00597 (0.00502)
0.00544 (0.00450)
Firm size < 10 (disability and/or age) x … 55 ≤ Age < 62 … … … … … … … 0.00708
(0.0143) 62 ≤ Age < 65 … … … … … … … 0.00788
(0.0140) 65 ≤ Age < FRA … … … … … … … -0.00470
(0.00412) N 14,951 28,926 18,599 30,567 23,641 24,568 30,567 30,567
Notes: See the notes to Tables 4 and 6. Standard errors, in parentheses, are clustered at the state level. Significantly different from zero at 1-percent level (***), 5-percent level (**) or 10-percent level (*). Results here are based on women only, rather than on both men and women. Source: See the source notes to Tables 4 and 6.
106

Table I4. Interactive Effects on SSDI Applications of State Disability, Age Discrimination Laws and SSA1983-Driven Spillovers by Birth Cohorts and Work-Limiting Disability – Effects on Men Only, HRS Data
(1) (2) (3) (4) (5) (6) (7) (8) SSA1983 x Work-Limiting Disability x …
55 ≤ Age < 62 -0.00129 (0.0125)
-0.000674 (0.0125)
-0.00129 (0.0124)
0.0104 (0.0130)
0.0390*
(0.0218) 0.0390*
(0.0216) 0.0181
(0.0180) 0.0192
(0.0168) 62 ≤ Age < 65 0.0126
(0.0185) 0.0134
(0.0181) 0.0119
(0.0184) 0.0131
(0.0161) 0.00560*
(0.00293) 0.00570*
(0.00291) 0.00860
(0.00958) 0.0122
(0.0113) 65 ≤ Age < FRA -0.00251
(0.00238) -0.00324 (0.00196)
-0.00271 (0.00202)
-0.00352*
(0.00196) -0.000601 (0.00349)
0.000773 (0.00346)
-0.00217 (0.00251)
-0.00271 (0.00277)
SSA1983 x Work-Limiting Disability x … Medical definition of disability x …
55 ≤ Age < 62 0.0106 (0.0130)
… … 0.00928 (0.00771)
… … … 0.0117 (0.00973)
62 ≤ Age < 65 -0.0188 (0.0192)
… … -0.00312 (0.0119)
… … … -0.00344 (0.0135)
65 ≤ Age < FRA -0.000616 (0.00267)
… … -0.00530***
(0.00162) … … … -0.00476***
(0.00164) Firm Size < 10 (disability) x …
55 ≤ Age < 62 … 0.00425 (0.0133)
… -0.0146 (0.0169)
… … … …
62 ≤ Age < 65 … -0.0184 (0.0198)
… -0.0131 (0.0174)
… … … …
65 ≤ Age < FRA … 0.00250 (0.00206)
… 0.00289 (0.00207)
… … … …
Larger damages (disability) x … 55 ≤ Age < 62 … … 0.0166
(0.0202) 0.0156
(0.0166) … … … 0.0185
(0.0160) 62 ≤ Age < 65 … … -0.0236
(0.0212) -0.0138 (0.0135)
… … … -0.0108 (0.0139)
65 ≤ Age < FRA … … 0.00562 (0.00333)
0.00380*
(0.00221) … … … 0.00412*
(0.00225) Firm size < 10 (age) x …
55 ≤ Age < 62 … … … … -0.0337 (0.0225)
… -0.00386 (0.0147)
…
62 ≤ Age < 65 … … … … -0.00405 (0.0108)
… 0.00789 (0.0150)
…
65 ≤ Age < FRA … … … … -0.000201 (0.00327)
… 0.00173 (0.00176)
…
Larger damages (age) x … 55 ≤ Age < 62 … … … … … -0.0378*
(0.0222) -0.0139 (0.0128)
-0.0186 (0.0140)
62 ≤ Age < 65 … … … … … -0.0130 (0.00996)
-0.0215 (0.0158)
-0.0202 (0.0163)
65 ≤ Age < FRA … … … … … -0.00115 (0.00339)
-0.000253 (0.00203)
-0.000538 (0.00211)
Firm size < 10 (disability and/or age) x … 55 ≤ Age < 62 … … … … … … … -0.0111
(0.0165) 62 ≤ Age < 65 … … … … … … … 0.00569
(0.0163) 65 ≤ Age < FRA … … … … … … … 0.00195
(0.00217) N 11,877 22,994 14,719 24,306 18,627 19,500 24,306 24,306
Notes: See the notes to Tables 4 and 6. Standard errors, in parentheses, are clustered at the state level. Significantly different from zero at 1-percent level (***), 5-percent level (**) or 10-percent level (*). Results here are based on men only, rather than on both men and women. Source: See the source notes to Tables 4 and 6.
107
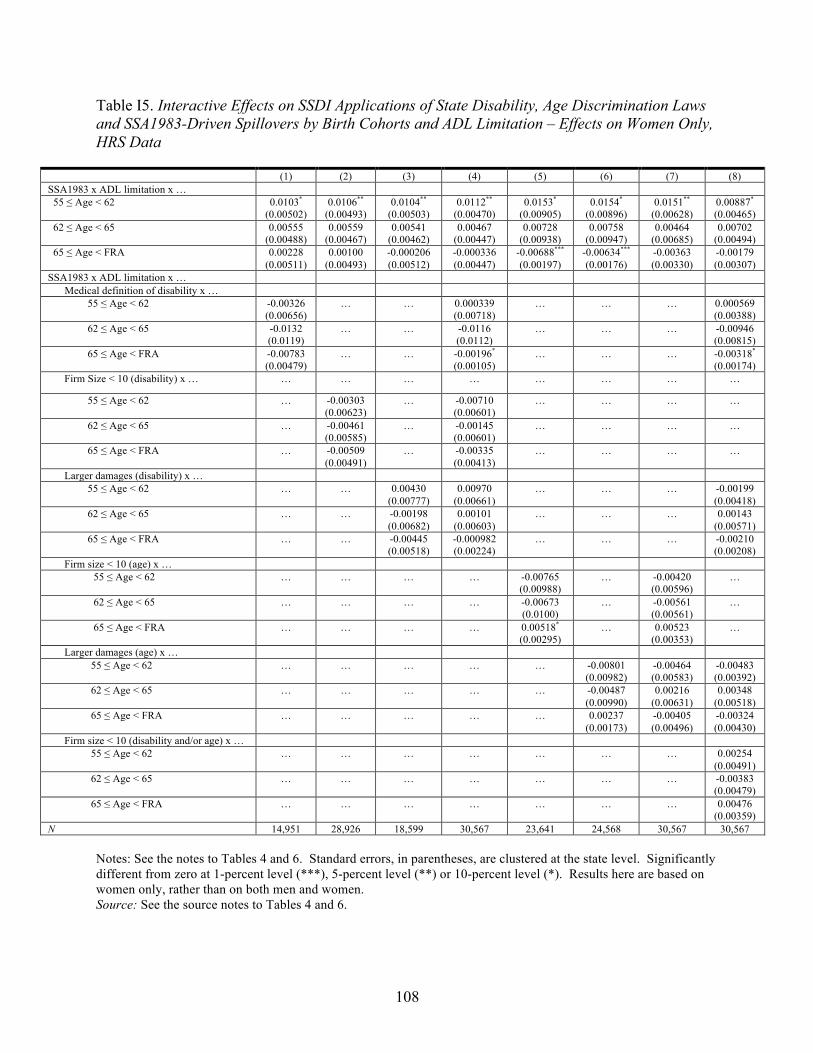
Table I5. Interactive Effects on SSDI Applications of State Disability, Age Discrimination Laws and SSA1983-Driven Spillovers by Birth Cohorts and ADL Limitation – Effects on Women Only, HRS Data
(1) (2) (3) (4) (5) (6) (7) (8) SSA1983 x ADL limitation x …
55 ≤ Age < 62 0.0103*
(0.00502) 0.0106**
(0.00493) 0.0104**
(0.00503) 0.0112**
(0.00470) 0.0153*
(0.00905) 0.0154*
(0.00896) 0.0151**
(0.00628) 0.00887*
(0.00465) 62 ≤ Age < 65 0.00555
(0.00488) 0.00559
(0.00467) 0.00541
(0.00462) 0.00467
(0.00447) 0.00728
(0.00938) 0.00758
(0.00947) 0.00464
(0.00685) 0.00702
(0.00494) 65 ≤ Age < FRA 0.00228
(0.00511) 0.00100
(0.00493) -0.000206 (0.00512)
-0.000336 (0.00447)
-0.00688***
(0.00197) -0.00634***
(0.00176) -0.00363 (0.00330)
-0.00179 (0.00307)
SSA1983 x ADL limitation x … Medical definition of disability x …
55 ≤ Age < 62 -0.00326 (0.00656)
… … 0.000339 (0.00718)
… … … 0.000569 (0.00388)
62 ≤ Age < 65 -0.0132 (0.0119)
… … -0.0116 (0.0112)
… … … -0.00946 (0.00815)
65 ≤ Age < FRA -0.00783 (0.00479)
… … -0.00196*
(0.00105) … … … -0.00318*
(0.00174) Firm Size < 10 (disability) x … … … … … … … … …
55 ≤ Age < 62 … -0.00303 (0.00623)
… -0.00710 (0.00601)
… … … …
62 ≤ Age < 65 … -0.00461 (0.00585)
… -0.00145 (0.00601)
… … … …
65 ≤ Age < FRA … -0.00509 (0.00491)
… -0.00335 (0.00413)
… … … …
Larger damages (disability) x … 55 ≤ Age < 62 … … 0.00430
(0.00777) 0.00970
(0.00661) … … … -0.00199
(0.00418) 62 ≤ Age < 65 … … -0.00198
(0.00682) 0.00101
(0.00603) … … … 0.00143
(0.00571) 65 ≤ Age < FRA … … -0.00445
(0.00518) -0.000982 (0.00224)
… … … -0.00210 (0.00208)
Firm size < 10 (age) x … 55 ≤ Age < 62 … … … … -0.00765
(0.00988) … -0.00420
(0.00596) …
62 ≤ Age < 65 … … … … -0.00673 (0.0100)
… -0.00561 (0.00561)
…
65 ≤ Age < FRA … … … … 0.00518*
(0.00295) … 0.00523
(0.00353) …
Larger damages (age) x … 55 ≤ Age < 62 … … … … … -0.00801
(0.00982) -0.00464 (0.00583)
-0.00483 (0.00392)
62 ≤ Age < 65 … … … … … -0.00487 (0.00990)
0.00216 (0.00631)
0.00348 (0.00518)
65 ≤ Age < FRA … … … … … 0.00237 (0.00173)
-0.00405 (0.00496)
-0.00324 (0.00430)
Firm size < 10 (disability and/or age) x … 55 ≤ Age < 62 … … … … … … … 0.00254
(0.00491) 62 ≤ Age < 65 … … … … … … … -0.00383
(0.00479) 65 ≤ Age < FRA … … … … … … … 0.00476
(0.00359) N 14,951 28,926 18,599 30,567 23,641 24,568 30,567 30,567
Notes: See the notes to Tables 4 and 6. Standard errors, in parentheses, are clustered at the state level. Significantly different from zero at 1-percent level (***), 5-percent level (**) or 10-percent level (*). Results here are based on women only, rather than on both men and women. Source: See the source notes to Tables 4 and 6.
108
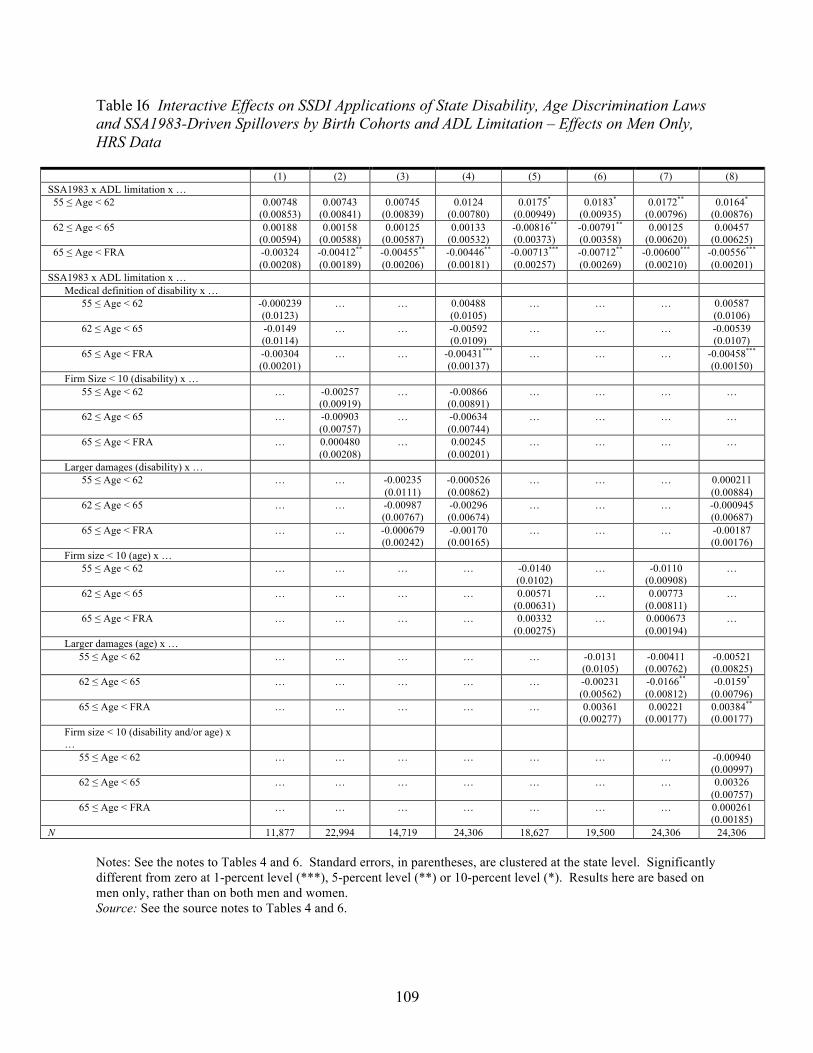
Table I6 Interactive Effects on SSDI Applications of State Disability, Age Discrimination Laws and SSA1983-Driven Spillovers by Birth Cohorts and ADL Limitation – Effects on Men Only, HRS Data
(1) (2) (3) (4) (5) (6) (7) (8) SSA1983 x ADL limitation x …
55 ≤ Age < 62 0.00748 (0.00853)
0.00743 (0.00841)
0.00745 (0.00839)
0.0124 (0.00780)
0.0175*
(0.00949) 0.0183*
(0.00935) 0.0172**
(0.00796) 0.0164*
(0.00876) 62 ≤ Age < 65 0.00188
(0.00594) 0.00158
(0.00588) 0.00125
(0.00587) 0.00133
(0.00532) -0.00816**
(0.00373) -0.00791**
(0.00358) 0.00125
(0.00620) 0.00457
(0.00625) 65 ≤ Age < FRA -0.00324
(0.00208) -0.00412**
(0.00189) -0.00455**
(0.00206) -0.00446**
(0.00181) -0.00713***
(0.00257) -0.00712**
(0.00269) -0.00600***
(0.00210) -0.00556***
(0.00201) SSA1983 x ADL limitation x …
Medical definition of disability x … 55 ≤ Age < 62 -0.000239
(0.0123) … … 0.00488
(0.0105) … … … 0.00587
(0.0106) 62 ≤ Age < 65 -0.0149
(0.0114) … … -0.00592
(0.0109) … … … -0.00539
(0.0107) 65 ≤ Age < FRA -0.00304
(0.00201) … … -0.00431***
(0.00137) … … … -0.00458***
(0.00150) Firm Size < 10 (disability) x …
55 ≤ Age < 62 … -0.00257 (0.00919)
… -0.00866 (0.00891)
… … … …
62 ≤ Age < 65 … -0.00903 (0.00757)
… -0.00634 (0.00744)
… … … …
65 ≤ Age < FRA … 0.000480 (0.00208)
… 0.00245 (0.00201)
… … … …
Larger damages (disability) x … 55 ≤ Age < 62 … … -0.00235
(0.0111) -0.000526 (0.00862)
… … … 0.000211 (0.00884)
62 ≤ Age < 65 … … -0.00987 (0.00767)
-0.00296 (0.00674)
… … … -0.000945 (0.00687)
65 ≤ Age < FRA … … -0.000679 (0.00242)
-0.00170 (0.00165)
… … … -0.00187 (0.00176)
Firm size < 10 (age) x … 55 ≤ Age < 62 … … … … -0.0140
(0.0102) … -0.0110
(0.00908) …
62 ≤ Age < 65 … … … … 0.00571 (0.00631)
… 0.00773 (0.00811)
…
65 ≤ Age < FRA … … … … 0.00332 (0.00275)
… 0.000673 (0.00194)
…
Larger damages (age) x … 55 ≤ Age < 62 … … … … … -0.0131
(0.0105) -0.00411 (0.00762)
-0.00521 (0.00825)
62 ≤ Age < 65 … … … … … -0.00231 (0.00562)
-0.0166**
(0.00812) -0.0159*
(0.00796) 65 ≤ Age < FRA … … … … … 0.00361
(0.00277) 0.00221
(0.00177) 0.00384**
(0.00177) Firm size < 10 (disability and/or age) x …
55 ≤ Age < 62 … … … … … … … -0.00940 (0.00997)
62 ≤ Age < 65 … … … … … … … 0.00326 (0.00757)
65 ≤ Age < FRA … … … … … … … 0.000261 (0.00185)
N 11,877 22,994 14,719 24,306 18,627 19,500 24,306 24,306
Notes: See the notes to Tables 4 and 6. Standard errors, in parentheses, are clustered at the state level. Significantly different from zero at 1-percent level (***), 5-percent level (**) or 10-percent level (*). Results here are based on men only, rather than on both men and women. Source: See the source notes to Tables 4 and 6.
109
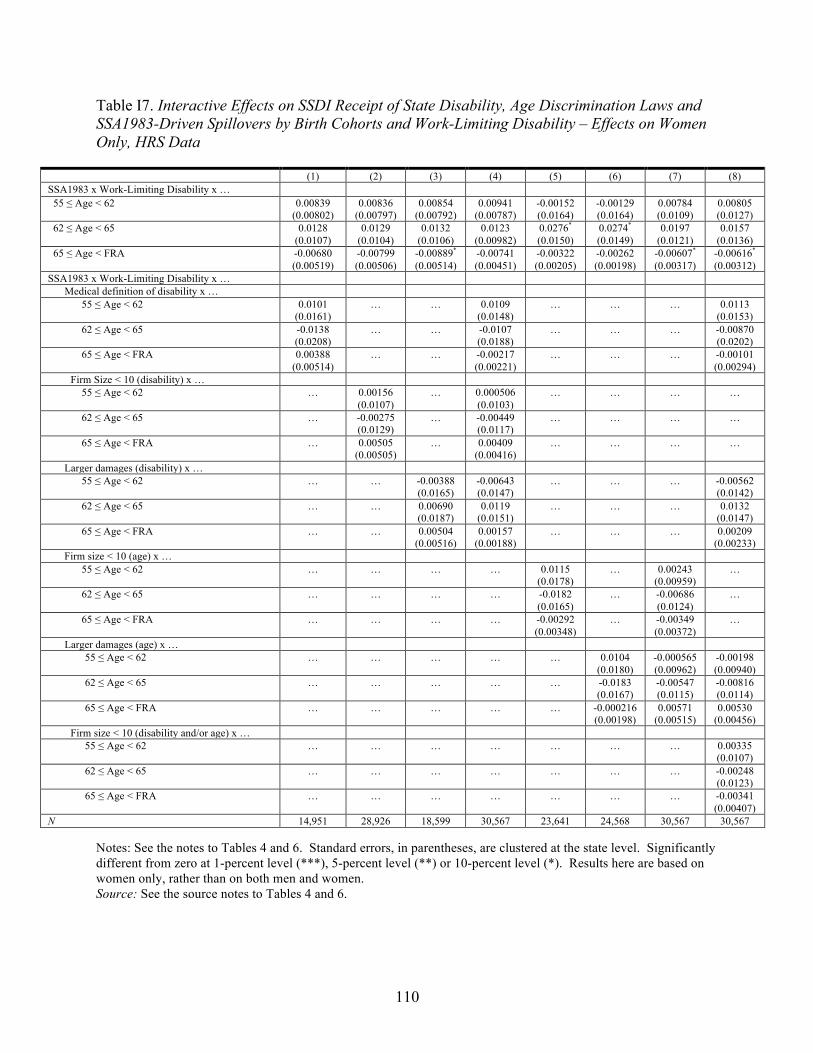
Table I7. Interactive Effects on SSDI Receipt of State Disability, Age Discrimination Laws and SSA1983-Driven Spillovers by Birth Cohorts and Work-Limiting Disability – Effects on Women Only, HRS Data
(1) (2) (3) (4) (5) (6) (7) (8) SSA1983 x Work-Limiting Disability x …
55 ≤ Age < 62 0.00839 (0.00802)
0.00836 (0.00797)
0.00854 (0.00792)
0.00941 (0.00787)
-0.00152 (0.0164)
-0.00129 (0.0164)
0.00784 (0.0109)
0.00805 (0.0127)
62 ≤ Age < 65 0.0128 (0.0107)
0.0129 (0.0104)
0.0132 (0.0106)
0.0123 (0.00982)
0.0276*
(0.0150) 0.0274*
(0.0149) 0.0197
(0.0121) 0.0157
(0.0136) 65 ≤ Age < FRA -0.00680
(0.00519) -0.00799 (0.00506)
-0.00889*
(0.00514) -0.00741 (0.00451)
-0.00322 (0.00205)
-0.00262 (0.00198)
-0.00607*
(0.00317) -0.00616*
(0.00312) SSA1983 x Work-Limiting Disability x …
Medical definition of disability x … 55 ≤ Age < 62 0.0101
(0.0161) … … 0.0109
(0.0148) … … … 0.0113
(0.0153) 62 ≤ Age < 65 -0.0138
(0.0208) … … -0.0107
(0.0188) … … … -0.00870
(0.0202) 65 ≤ Age < FRA 0.00388
(0.00514) … … -0.00217
(0.00221) … … … -0.00101
(0.00294) Firm Size < 10 (disability) x …
55 ≤ Age < 62 … 0.00156 (0.0107)
… 0.000506 (0.0103)
… … … …
62 ≤ Age < 65 … -0.00275 (0.0129)
… -0.00449 (0.0117)
… … … …
65 ≤ Age < FRA … 0.00505 (0.00505)
… 0.00409 (0.00416)
… … … …
Larger damages (disability) x … 55 ≤ Age < 62 … … -0.00388
(0.0165) -0.00643 (0.0147)
… … … -0.00562 (0.0142)
62 ≤ Age < 65 … … 0.00690 (0.0187)
0.0119 (0.0151)
… … … 0.0132 (0.0147)
65 ≤ Age < FRA … … 0.00504 (0.00516)
0.00157 (0.00188)
… … … 0.00209 (0.00233)
Firm size < 10 (age) x … 55 ≤ Age < 62 … … … … 0.0115
(0.0178) … 0.00243
(0.00959) …
62 ≤ Age < 65 … … … … -0.0182 (0.0165)
… -0.00686 (0.0124)
…
65 ≤ Age < FRA … … … … -0.00292 (0.00348)
… -0.00349 (0.00372)
…
Larger damages (age) x … 55 ≤ Age < 62 … … … … … 0.0104
(0.0180) -0.000565 (0.00962)
-0.00198 (0.00940)
62 ≤ Age < 65 … … … … … -0.0183 (0.0167)
-0.00547 (0.0115)
-0.00816 (0.0114)
65 ≤ Age < FRA … … … … … -0.000216 (0.00198)
0.00571 (0.00515)
0.00530 (0.00456)
Firm size < 10 (disability and/or age) x … 55 ≤ Age < 62 … … … … … … … 0.00335
(0.0107) 62 ≤ Age < 65 … … … … … … … -0.00248
(0.0123) 65 ≤ Age < FRA … … … … … … … -0.00341
(0.00407) N 14,951 28,926 18,599 30,567 23,641 24,568 30,567 30,567
Notes: See the notes to Tables 4 and 6. Standard errors, in parentheses, are clustered at the state level. Significantly different from zero at 1-percent level (***), 5-percent level (**) or 10-percent level (*). Results here are based on women only, rather than on both men and women. Source: See the source notes to Tables 4 and 6.
110
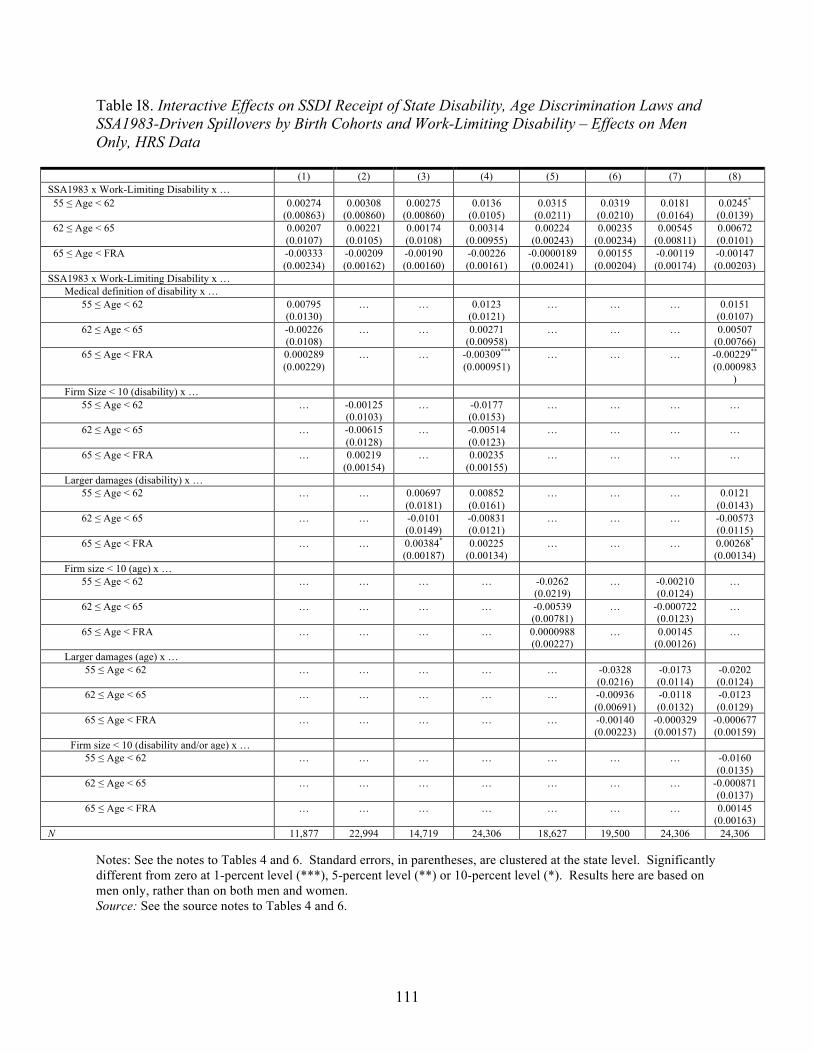
Table I8. Interactive Effects on SSDI Receipt of State Disability, Age Discrimination Laws and SSA1983-Driven Spillovers by Birth Cohorts and Work-Limiting Disability – Effects on Men Only, HRS Data
(1) (2) (3) (4) (5) (6) (7) (8) SSA1983 x Work-Limiting Disability x …
55 ≤ Age < 62 0.00274 (0.00863)
0.00308 (0.00860)
0.00275 (0.00860)
0.0136 (0.0105)
0.0315 (0.0211)
0.0319 (0.0210)
0.0181 (0.0164)
0.0245*
(0.0139) 62 ≤ Age < 65 0.00207
(0.0107) 0.00221 (0.0105)
0.00174 (0.0108)
0.00314 (0.00955)
0.00224 (0.00243)
0.00235 (0.00234)
0.00545 (0.00811)
0.00672 (0.0101)
65 ≤ Age < FRA -0.00333 (0.00234)
-0.00209 (0.00162)
-0.00190 (0.00160)
-0.00226 (0.00161)
-0.0000189 (0.00241)
0.00155 (0.00204)
-0.00119 (0.00174)
-0.00147 (0.00203)
SSA1983 x Work-Limiting Disability x … Medical definition of disability x …
55 ≤ Age < 62 0.00795 (0.0130)
… … 0.0123 (0.0121)
… … … 0.0151 (0.0107)
62 ≤ Age < 65 -0.00226 (0.0108)
… … 0.00271 (0.00958)
… … … 0.00507 (0.00766)
65 ≤ Age < FRA 0.000289 (0.00229)
… … -0.00309***
(0.000951) … … … -0.00229**
(0.000983 )
Firm Size < 10 (disability) x … 55 ≤ Age < 62 … -0.00125
(0.0103) … -0.0177
(0.0153) … … … …
62 ≤ Age < 65 … -0.00615 (0.0128)
… -0.00514 (0.0123)
… … … …
65 ≤ Age < FRA … 0.00219 (0.00154)
… 0.00235 (0.00155)
… … … …
Larger damages (disability) x … 55 ≤ Age < 62 … … 0.00697
(0.0181) 0.00852 (0.0161)
… … … 0.0121 (0.0143)
62 ≤ Age < 65 … … -0.0101 (0.0149)
-0.00831 (0.0121)
… … … -0.00573 (0.0115)
65 ≤ Age < FRA … … 0.00384*
(0.00187) 0.00225
(0.00134) … … … 0.00268*
(0.00134) Firm size < 10 (age) x …
55 ≤ Age < 62 … … … … -0.0262 (0.0219)
… -0.00210 (0.0124)
…
62 ≤ Age < 65 … … … … -0.00539 (0.00781)
… -0.000722 (0.0123)
…
65 ≤ Age < FRA … … … … 0.0000988 (0.00227)
… 0.00145 (0.00126)
…
Larger damages (age) x … 55 ≤ Age < 62 … … … … … -0.0328
(0.0216) -0.0173 (0.0114)
-0.0202 (0.0124)
62 ≤ Age < 65 … … … … … -0.00936 (0.00691)
-0.0118 (0.0132)
-0.0123 (0.0129)
65 ≤ Age < FRA … … … … … -0.00140 (0.00223)
-0.000329 (0.00157)
-0.000677 (0.00159)
Firm size < 10 (disability and/or age) x … 55 ≤ Age < 62 … … … … … … … -0.0160
(0.0135) 62 ≤ Age < 65 … … … … … … … -0.000871
(0.0137) 65 ≤ Age < FRA … … … … … … … 0.00145
(0.00163) N 11,877 22,994 14,719 24,306 18,627 19,500 24,306 24,306
Notes: See the notes to Tables 4 and 6. Standard errors, in parentheses, are clustered at the state level. Significantly different from zero at 1-percent level (***), 5-percent level (**) or 10-percent level (*). Results here are based on men only, rather than on both men and women. Source: See the source notes to Tables 4 and 6.
111
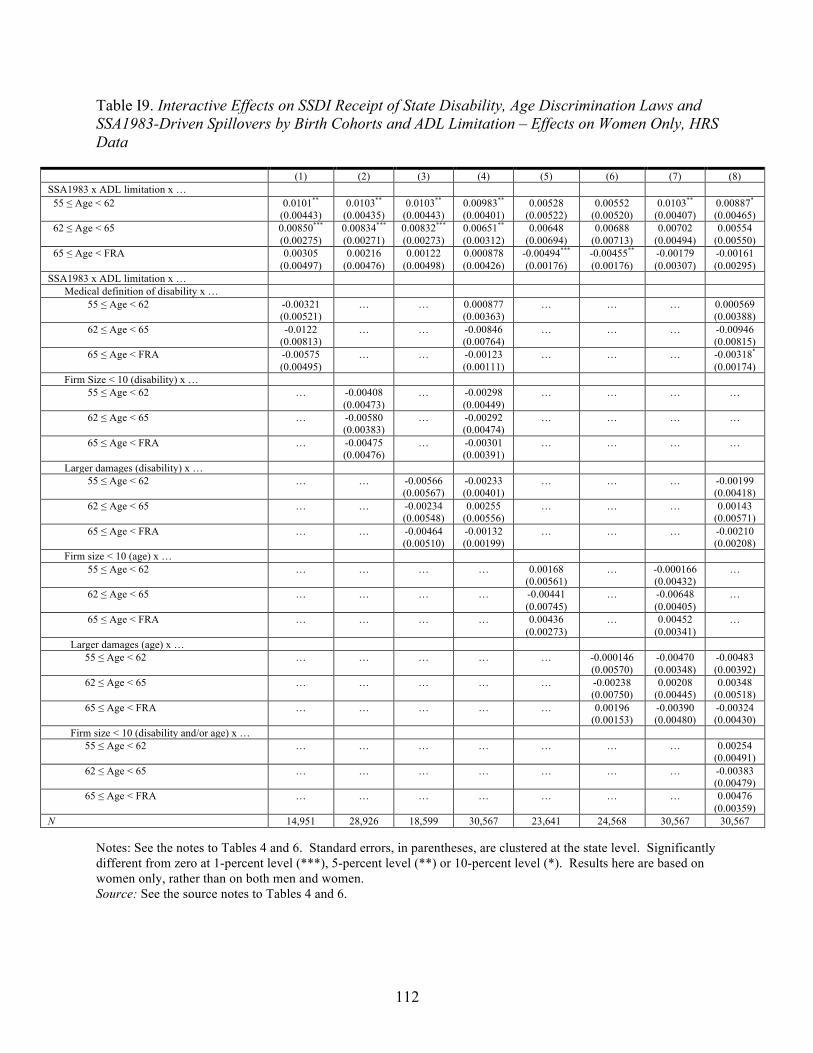
Table I9. Interactive Effects on SSDI Receipt of State Disability, Age Discrimination Laws and SSA1983-Driven Spillovers by Birth Cohorts and ADL Limitation – Effects on Women Only, HRS Data
(1) (2) (3) (4) (5) (6) (7) (8) SSA1983 x ADL limitation x …
55 ≤ Age < 62 0.0101**
(0.00443) 0.0103**
(0.00435) 0.0103**
(0.00443) 0.00983**
(0.00401) 0.00528
(0.00522) 0.00552
(0.00520) 0.0103**
(0.00407) 0.00887*
(0.00465) 62 ≤ Age < 65 0.00850***
(0.00275) 0.00834***
(0.00271) 0.00832***
(0.00273) 0.00651**
(0.00312) 0.00648
(0.00694) 0.00688
(0.00713) 0.00702
(0.00494) 0.00554
(0.00550) 65 ≤ Age < FRA 0.00305
(0.00497) 0.00216
(0.00476) 0.00122
(0.00498) 0.000878 (0.00426)
-0.00494***
(0.00176) -0.00455**
(0.00176) -0.00179 (0.00307)
-0.00161 (0.00295)
SSA1983 x ADL limitation x … Medical definition of disability x …
55 ≤ Age < 62 -0.00321 (0.00521)
… … 0.000877 (0.00363)
… … … 0.000569 (0.00388)
62 ≤ Age < 65 -0.0122 (0.00813)
… … -0.00846 (0.00764)
… … … -0.00946 (0.00815)
65 ≤ Age < FRA -0.00575 (0.00495)
… … -0.00123 (0.00111)
… … … -0.00318*
(0.00174) Firm Size < 10 (disability) x …
55 ≤ Age < 62 … -0.00408 (0.00473)
… -0.00298 (0.00449)
… … … …
62 ≤ Age < 65 … -0.00580 (0.00383)
… -0.00292 (0.00474)
… … … …
65 ≤ Age < FRA … -0.00475 (0.00476)
… -0.00301 (0.00391)
… … … …
Larger damages (disability) x … 55 ≤ Age < 62 … … -0.00566
(0.00567) -0.00233 (0.00401)
… … … -0.00199 (0.00418)
62 ≤ Age < 65 … … -0.00234 (0.00548)
0.00255 (0.00556)
… … … 0.00143 (0.00571)
65 ≤ Age < FRA … … -0.00464 (0.00510)
-0.00132 (0.00199)
… … … -0.00210 (0.00208)
Firm size < 10 (age) x … 55 ≤ Age < 62 … … … … 0.00168
(0.00561) … -0.000166
(0.00432) …
62 ≤ Age < 65 … … … … -0.00441 (0.00745)
… -0.00648 (0.00405)
…
65 ≤ Age < FRA … … … … 0.00436 (0.00273)
… 0.00452 (0.00341)
…
Larger damages (age) x … 55 ≤ Age < 62 … … … … … -0.000146
(0.00570) -0.00470 (0.00348)
-0.00483 (0.00392)
62 ≤ Age < 65 … … … … … -0.00238 (0.00750)
0.00208 (0.00445)
0.00348 (0.00518)
65 ≤ Age < FRA … … … … … 0.00196 (0.00153)
-0.00390 (0.00480)
-0.00324 (0.00430)
Firm size < 10 (disability and/or age) x … 55 ≤ Age < 62 … … … … … … … 0.00254
(0.00491) 62 ≤ Age < 65 … … … … … … … -0.00383
(0.00479) 65 ≤ Age < FRA … … … … … … … 0.00476
(0.00359) N 14,951 28,926 18,599 30,567 23,641 24,568 30,567 30,567
Notes: See the notes to Tables 4 and 6. Standard errors, in parentheses, are clustered at the state level. Significantly different from zero at 1-percent level (***), 5-percent level (**) or 10-percent level (*). Results here are based on women only, rather than on both men and women. Source: See the source notes to Tables 4 and 6.
112
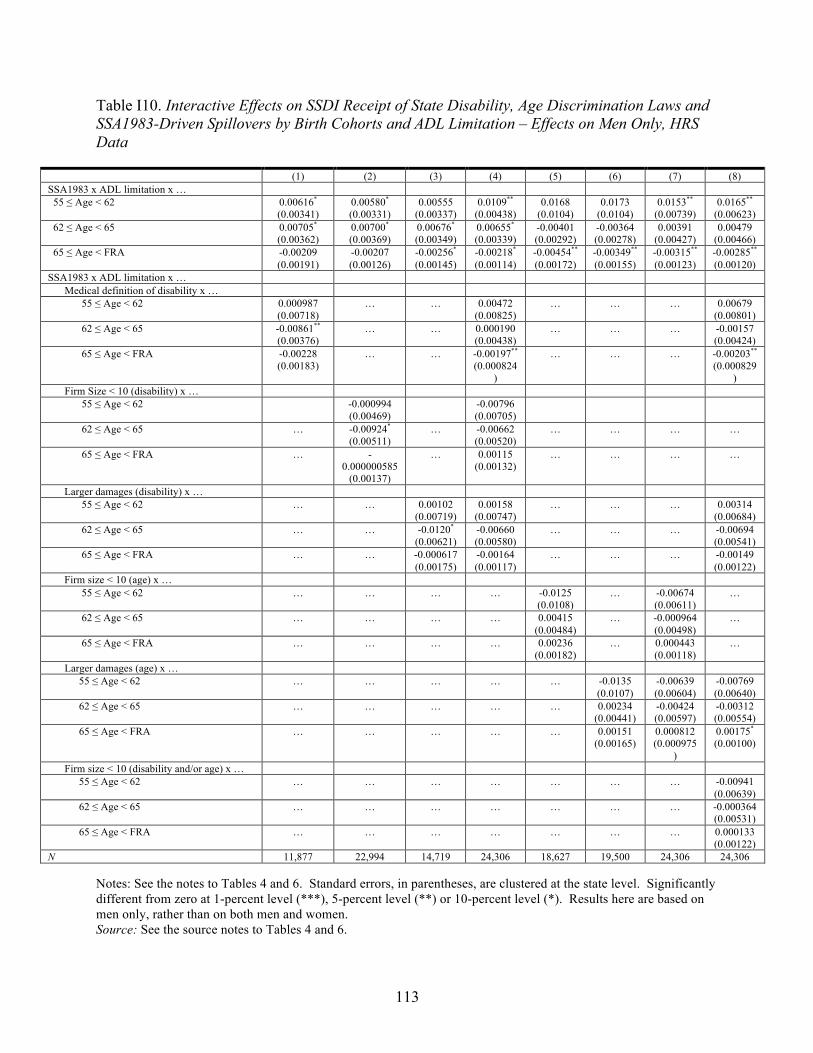
Table I10. Interactive Effects on SSDI Receipt of State Disability, Age Discrimination Laws and SSA1983-Driven Spillovers by Birth Cohorts and ADL Limitation – Effects on Men Only, HRS Data
(1) (2) (3) (4) (5) (6) (7) (8) SSA1983 x ADL limitation x …
55 ≤ Age < 62 0.00616*
(0.00341) 0.00580*
(0.00331) 0.00555
(0.00337) 0.0109**
(0.00438) 0.0168
(0.0104) 0.0173
(0.0104) 0.0153**
(0.00739) 0.0165**
(0.00623) 62 ≤ Age < 65 0.00705*
(0.00362) 0.00700*
(0.00369) 0.00676*
(0.00349) 0.00655*
(0.00339) -0.00401 (0.00292)
-0.00364 (0.00278)
0.00391 (0.00427)
0.00479 (0.00466)
65 ≤ Age < FRA -0.00209 (0.00191)
-0.00207 (0.00126)
-0.00256*
(0.00145) -0.00218*
(0.00114) -0.00454**
(0.00172) -0.00349**
(0.00155) -0.00315**
(0.00123) -0.00285**
(0.00120) SSA1983 x ADL limitation x …
Medical definition of disability x … 55 ≤ Age < 62 0.000987
(0.00718) … … 0.00472
(0.00825) … … … 0.00679
(0.00801) 62 ≤ Age < 65 -0.00861**
(0.00376) … … 0.000190
(0.00438) … … … -0.00157
(0.00424) 65 ≤ Age < FRA -0.00228
(0.00183) … … -0.00197**
(0.000824 )
… … … -0.00203**
(0.000829 )
Firm Size < 10 (disability) x … 55 ≤ Age < 62 -0.000994
(0.00469) -0.00796 (0.00705)
62 ≤ Age < 65 … -0.00924*
(0.00511) … -0.00662
(0.00520) … … … …
65 ≤ Age < FRA … -0.000000585
(0.00137)
… 0.00115 (0.00132)
… … … …
Larger damages (disability) x … 55 ≤ Age < 62 … … 0.00102
(0.00719) 0.00158
(0.00747) … … … 0.00314
(0.00684) 62 ≤ Age < 65 … … -0.0120*
(0.00621) -0.00660 (0.00580)
… … … -0.00694 (0.00541)
65 ≤ Age < FRA … … -0.000617 (0.00175)
-0.00164 (0.00117)
… … … -0.00149 (0.00122)
Firm size < 10 (age) x … 55 ≤ Age < 62 … … … … -0.0125
(0.0108) … -0.00674
(0.00611) …
62 ≤ Age < 65 … … … … 0.00415 (0.00484)
… -0.000964 (0.00498)
…
65 ≤ Age < FRA … … … … 0.00236 (0.00182)
… 0.000443 (0.00118)
…
Larger damages (age) x … 55 ≤ Age < 62 … … … … … -0.0135
(0.0107) -0.00639 (0.00604)
-0.00769 (0.00640)
62 ≤ Age < 65 … … … … … 0.00234 (0.00441)
-0.00424 (0.00597)
-0.00312 (0.00554)
65 ≤ Age < FRA … … … … … 0.00151 (0.00165)
0.000812 (0.000975
)
0.00175*
(0.00100)
Firm size < 10 (disability and/or age) x … 55 ≤ Age < 62 … … … … … … … -0.00941
(0.00639) 62 ≤ Age < 65 … … … … … … … -0.000364
(0.00531) 65 ≤ Age < FRA … … … … … … … 0.000133
(0.00122) N 11,877 22,994 14,719 24,306 18,627 19,500 24,306 24,306
Notes: See the notes to Tables 4 and 6. Standard errors, in parentheses, are clustered at the state level. Significantly different from zero at 1-percent level (***), 5-percent level (**) or 10-percent level (*). Results here are based on men only, rather than on both men and women. Source: See the source notes to Tables 4 and 6.
113
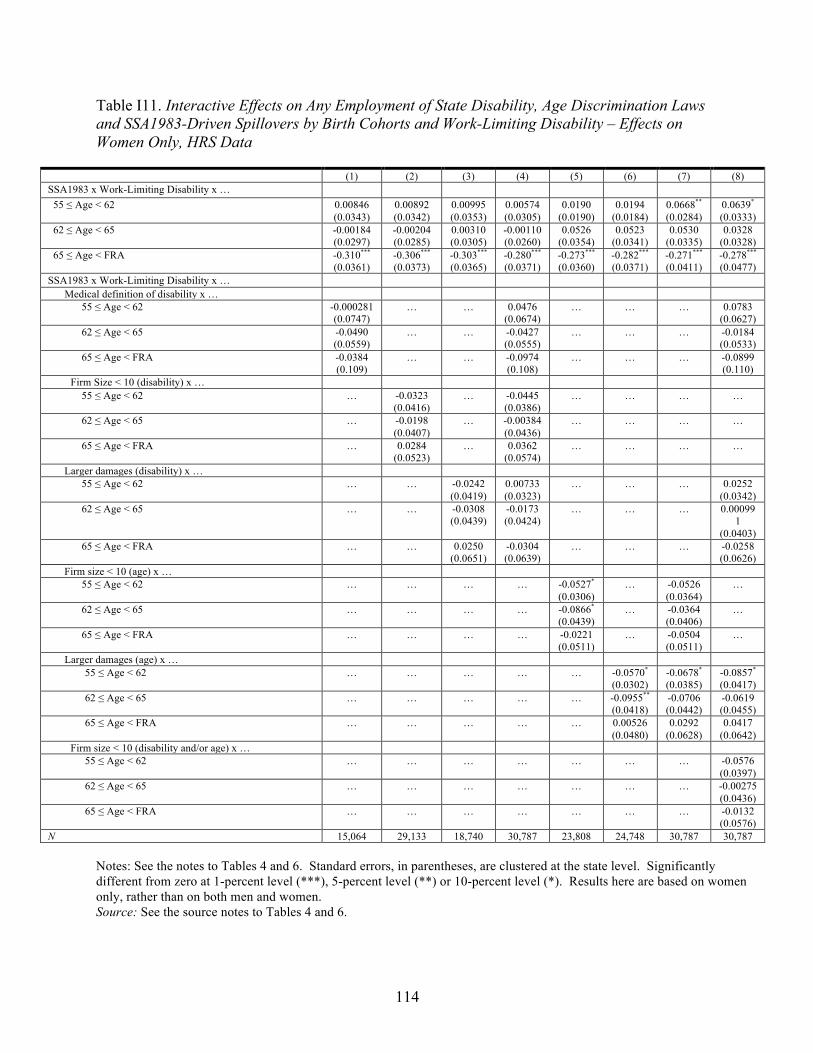
Table I11. Interactive Effects on Any Employment of State Disability, Age Discrimination Laws and SSA1983-Driven Spillovers by Birth Cohorts and Work-Limiting Disability – Effects on Women Only, HRS Data
(1) (2) (3) (4) (5) (6) (7) (8) SSA1983 x Work-Limiting Disability x …
55 ≤ Age < 62 0.00846 (0.0343)
0.00892 (0.0342)
0.00995 (0.0353)
0.00574 (0.0305)
0.0190 (0.0190)
0.0194 (0.0184)
0.0668**
(0.0284) 0.0639*
(0.0333) 62 ≤ Age < 65 -0.00184
(0.0297) -0.00204 (0.0285)
0.00310 (0.0305)
-0.00110 (0.0260)
0.0526 (0.0354)
0.0523 (0.0341)
0.0530 (0.0335)
0.0328 (0.0328)
65 ≤ Age < FRA -0.310***
(0.0361) -0.306***
(0.0373) -0.303***
(0.0365) -0.280***
(0.0371) -0.273***
(0.0360) -0.282***
(0.0371) -0.271***
(0.0411) -0.278***
(0.0477) SSA1983 x Work-Limiting Disability x …
Medical definition of disability x … 55 ≤ Age < 62 -0.000281
(0.0747) … … 0.0476
(0.0674) … … … 0.0783
(0.0627) 62 ≤ Age < 65 -0.0490
(0.0559) … … -0.0427
(0.0555) … … … -0.0184
(0.0533) 65 ≤ Age < FRA -0.0384
(0.109) … … -0.0974
(0.108) … … … -0.0899
(0.110) Firm Size < 10 (disability) x …
55 ≤ Age < 62 … -0.0323 (0.0416)
… -0.0445 (0.0386)
… … … …
62 ≤ Age < 65 … -0.0198 (0.0407)
… -0.00384 (0.0436)
… … … …
65 ≤ Age < FRA … 0.0284 (0.0523)
… 0.0362 (0.0574)
… … … …
Larger damages (disability) x … 55 ≤ Age < 62 … … -0.0242
(0.0419) 0.00733 (0.0323)
… … … 0.0252 (0.0342)
62 ≤ Age < 65 … … -0.0308 (0.0439)
-0.0173 (0.0424)
… … … 0.00099 1
(0.0403) 65 ≤ Age < FRA … … 0.0250
(0.0651) -0.0304 (0.0639)
… … … -0.0258 (0.0626)
Firm size < 10 (age) x … 55 ≤ Age < 62 … … … … -0.0527*
(0.0306) … -0.0526
(0.0364) …
62 ≤ Age < 65 … … … … -0.0866*
(0.0439) … -0.0364
(0.0406) …
65 ≤ Age < FRA … … … … -0.0221 (0.0511)
… -0.0504 (0.0511)
…
Larger damages (age) x … 55 ≤ Age < 62 … … … … … -0.0570*
(0.0302) -0.0678*
(0.0385) -0.0857*
(0.0417) 62 ≤ Age < 65 … … … … … -0.0955**
(0.0418) -0.0706 (0.0442)
-0.0619 (0.0455)
65 ≤ Age < FRA … … … … … 0.00526 (0.0480)
0.0292 (0.0628)
0.0417 (0.0642)
Firm size < 10 (disability and/or age) x … 55 ≤ Age < 62 … … … … … … … -0.0576
(0.0397) 62 ≤ Age < 65 … … … … … … … -0.00275
(0.0436) 65 ≤ Age < FRA … … … … … … … -0.0132
(0.0576) N 15,064 29,133 18,740 30,787 23,808 24,748 30,787 30,787
Notes: See the notes to Tables 4 and 6. Standard errors, in parentheses, are clustered at the state level. Significantly different from zero at 1-percent level (***), 5-percent level (**) or 10-percent level (*). Results here are based on women only, rather than on both men and women. Source: See the source notes to Tables 4 and 6.
114
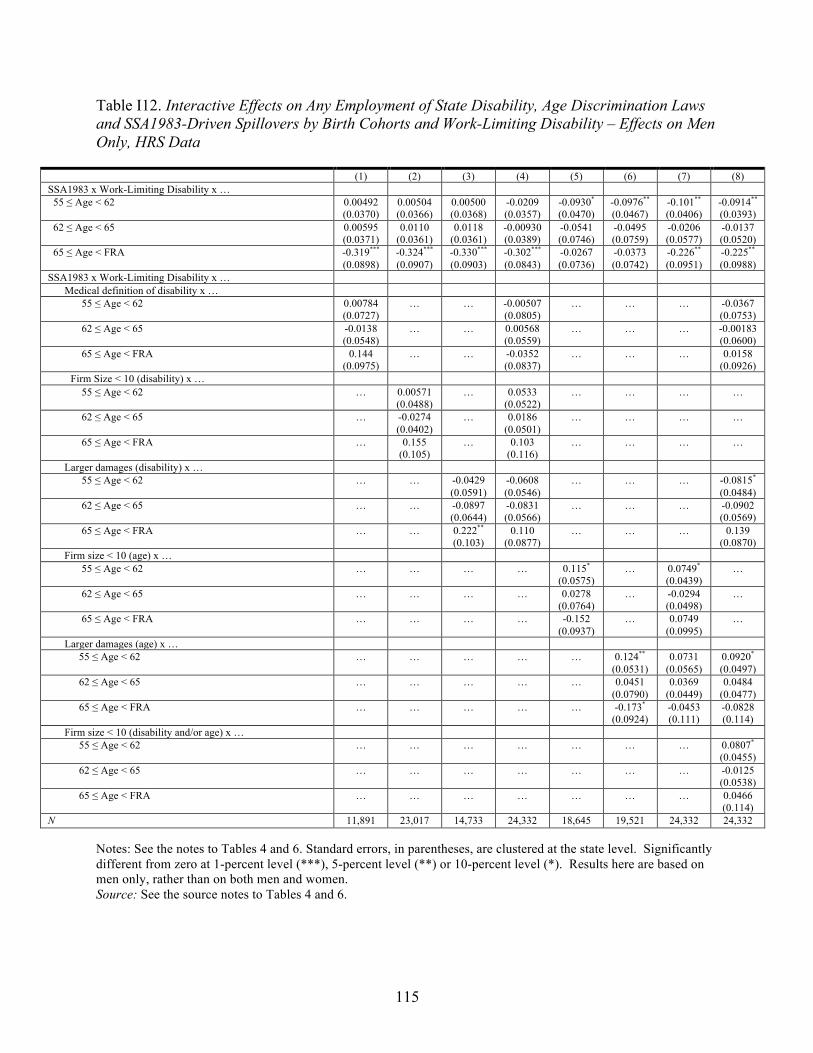
Table I12. Interactive Effects on Any Employment of State Disability, Age Discrimination Laws and SSA1983-Driven Spillovers by Birth Cohorts and Work-Limiting Disability – Effects on Men Only, HRS Data
(1) (2) (3) (4) (5) (6) (7) (8) SSA1983 x Work-Limiting Disability x …
55 ≤ Age < 62 0.00492 (0.0370)
0.00504 (0.0366)
0.00500 (0.0368)
-0.0209 (0.0357)
-0.0930*
(0.0470) -0.0976**
(0.0467) -0.101**
(0.0406) -0.0914**
(0.0393) 62 ≤ Age < 65 0.00595
(0.0371) 0.0110
(0.0361) 0.0118
(0.0361) -0.00930 (0.0389)
-0.0541 (0.0746)
-0.0495 (0.0759)
-0.0206 (0.0577)
-0.0137 (0.0520)
65 ≤ Age < FRA -0.319***
(0.0898) -0.324***
(0.0907) -0.330***
(0.0903) -0.302***
(0.0843) -0.0267 (0.0736)
-0.0373 (0.0742)
-0.226**
(0.0951) -0.225**
(0.0988) SSA1983 x Work-Limiting Disability x …
Medical definition of disability x … 55 ≤ Age < 62 0.00784
(0.0727) … … -0.00507
(0.0805) … … … -0.0367
(0.0753) 62 ≤ Age < 65 -0.0138
(0.0548) … … 0.00568
(0.0559) … … … -0.00183
(0.0600) 65 ≤ Age < FRA 0.144
(0.0975) … … -0.0352
(0.0837) … … … 0.0158
(0.0926) Firm Size < 10 (disability) x …
55 ≤ Age < 62 … 0.00571 (0.0488)
… 0.0533 (0.0522)
… … … …
62 ≤ Age < 65 … -0.0274 (0.0402)
… 0.0186 (0.0501)
… … … …
65 ≤ Age < FRA … 0.155 (0.105)
… 0.103 (0.116)
… … … …
Larger damages (disability) x … 55 ≤ Age < 62 … … -0.0429
(0.0591) -0.0608 (0.0546)
… … … -0.0815*
(0.0484) 62 ≤ Age < 65 … … -0.0897
(0.0644) -0.0831 (0.0566)
… … … -0.0902 (0.0569)
65 ≤ Age < FRA … … 0.222**
(0.103) 0.110
(0.0877) … … … 0.139
(0.0870) Firm size < 10 (age) x …
55 ≤ Age < 62 … … … … 0.115*
(0.0575) … 0.0749*
(0.0439) …
62 ≤ Age < 65 … … … … 0.0278 (0.0764)
… -0.0294 (0.0498)
…
65 ≤ Age < FRA … … … … -0.152 (0.0937)
… 0.0749 (0.0995)
…
Larger damages (age) x … 55 ≤ Age < 62 … … … … … 0.124**
(0.0531) 0.0731
(0.0565) 0.0920*
(0.0497) 62 ≤ Age < 65 … … … … … 0.0451
(0.0790) 0.0369
(0.0449) 0.0484
(0.0477) 65 ≤ Age < FRA … … … … … -0.173*
(0.0924) -0.0453 (0.111)
-0.0828 (0.114)
Firm size < 10 (disability and/or age) x … 55 ≤ Age < 62 … … … … … … … 0.0807*
(0.0455) 62 ≤ Age < 65 … … … … … … … -0.0125
(0.0538) 65 ≤ Age < FRA … … … … … … … 0.0466
(0.114) N 11,891 23,017 14,733 24,332 18,645 19,521 24,332 24,332
Notes: See the notes to Tables 4 and 6. Standard errors, in parentheses, are clustered at the state level. Significantly different from zero at 1-percent level (***), 5-percent level (**) or 10-percent level (*). Results here are based on men only, rather than on both men and women. Source: See the source notes to Tables 4 and 6.
115
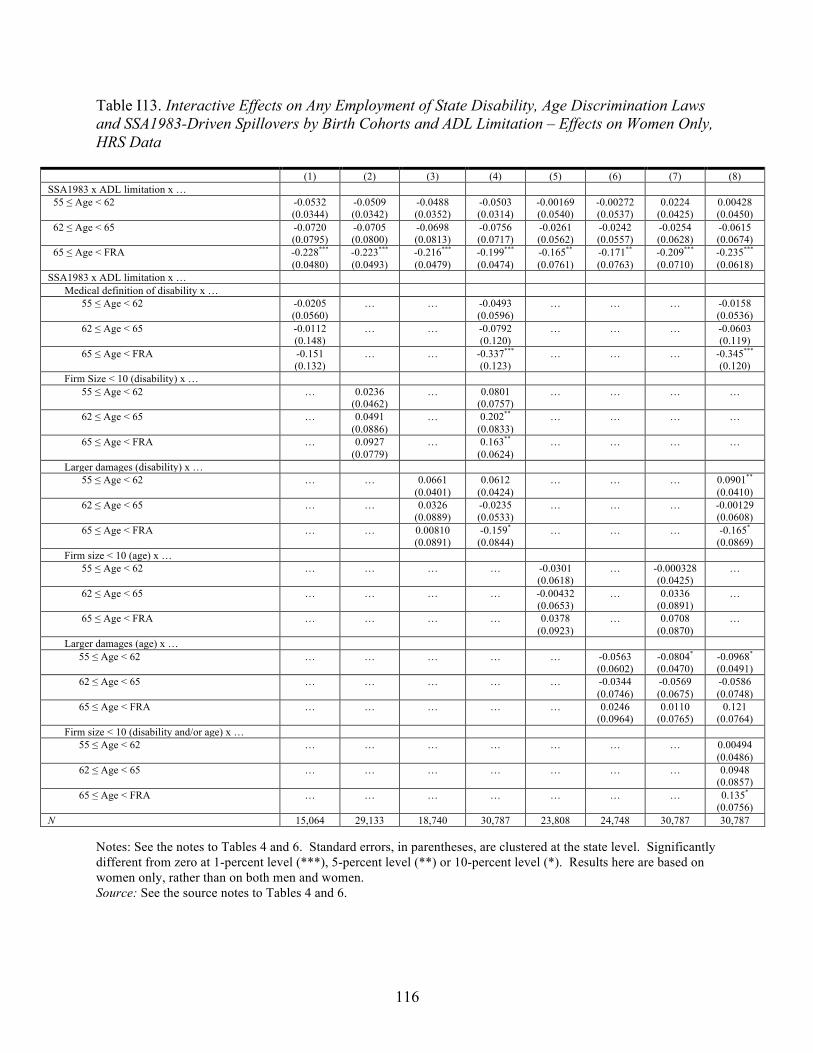
Table I13. Interactive Effects on Any Employment of State Disability, Age Discrimination Laws and SSA1983-Driven Spillovers by Birth Cohorts and ADL Limitation – Effects on Women Only, HRS Data
(1) (2) (3) (4) (5) (6) (7) (8) SSA1983 x ADL limitation x …
55 ≤ Age < 62 -0.0532 (0.0344)
-0.0509 (0.0342)
-0.0488 (0.0352)
-0.0503 (0.0314)
-0.00169 (0.0540)
-0.00272 (0.0537)
0.0224 (0.0425)
0.00428 (0.0450)
62 ≤ Age < 65 -0.0720 (0.0795)
-0.0705 (0.0800)
-0.0698 (0.0813)
-0.0756 (0.0717)
-0.0261 (0.0562)
-0.0242 (0.0557)
-0.0254 (0.0628)
-0.0615 (0.0674)
65 ≤ Age < FRA -0.228***
(0.0480) -0.223***
(0.0493) -0.216***
(0.0479) -0.199***
(0.0474) -0.165**
(0.0761) -0.171**
(0.0763) -0.209***
(0.0710) -0.235***
(0.0618) SSA1983 x ADL limitation x …
Medical definition of disability x … 55 ≤ Age < 62 -0.0205
(0.0560) … … -0.0493
(0.0596) … … … -0.0158
(0.0536) 62 ≤ Age < 65 -0.0112
(0.148) … … -0.0792
(0.120) … … … -0.0603
(0.119) 65 ≤ Age < FRA -0.151
(0.132) … … -0.337***
(0.123) … … … -0.345***
(0.120) Firm Size < 10 (disability) x …
55 ≤ Age < 62 … 0.0236 (0.0462)
… 0.0801 (0.0757)
… … … …
62 ≤ Age < 65 … 0.0491 (0.0886)
… 0.202**
(0.0833) … … … …
65 ≤ Age < FRA … 0.0927 (0.0779)
… 0.163**
(0.0624) … … … …
Larger damages (disability) x … 55 ≤ Age < 62 … … 0.0661
(0.0401) 0.0612
(0.0424) … … … 0.0901**
(0.0410) 62 ≤ Age < 65 … … 0.0326
(0.0889) -0.0235 (0.0533)
… … … -0.00129 (0.0608)
65 ≤ Age < FRA … … 0.00810 (0.0891)
-0.159*
(0.0844) … … … -0.165*
(0.0869) Firm size < 10 (age) x …
55 ≤ Age < 62 … … … … -0.0301 (0.0618)
… -0.000328 (0.0425)
…
62 ≤ Age < 65 … … … … -0.00432 (0.0653)
… 0.0336 (0.0891)
…
65 ≤ Age < FRA … … … … 0.0378 (0.0923)
… 0.0708 (0.0870)
…
Larger damages (age) x … 55 ≤ Age < 62 … … … … … -0.0563
(0.0602) -0.0804*
(0.0470) -0.0968*
(0.0491) 62 ≤ Age < 65 … … … … … -0.0344
(0.0746) -0.0569 (0.0675)
-0.0586 (0.0748)
65 ≤ Age < FRA … … … … … 0.0246 (0.0964)
0.0110 (0.0765)
0.121 (0.0764)
Firm size < 10 (disability and/or age) x … 55 ≤ Age < 62 … … … … … … … 0.00494
(0.0486) 62 ≤ Age < 65 … … … … … … … 0.0948
(0.0857) 65 ≤ Age < FRA … … … … … … … 0.135*
(0.0756) N 15,064 29,133 18,740 30,787 23,808 24,748 30,787 30,787
Notes: See the notes to Tables 4 and 6. Standard errors, in parentheses, are clustered at the state level. Significantly different from zero at 1-percent level (***), 5-percent level (**) or 10-percent level (*). Results here are based on women only, rather than on both men and women. Source: See the source notes to Tables 4 and 6.
116
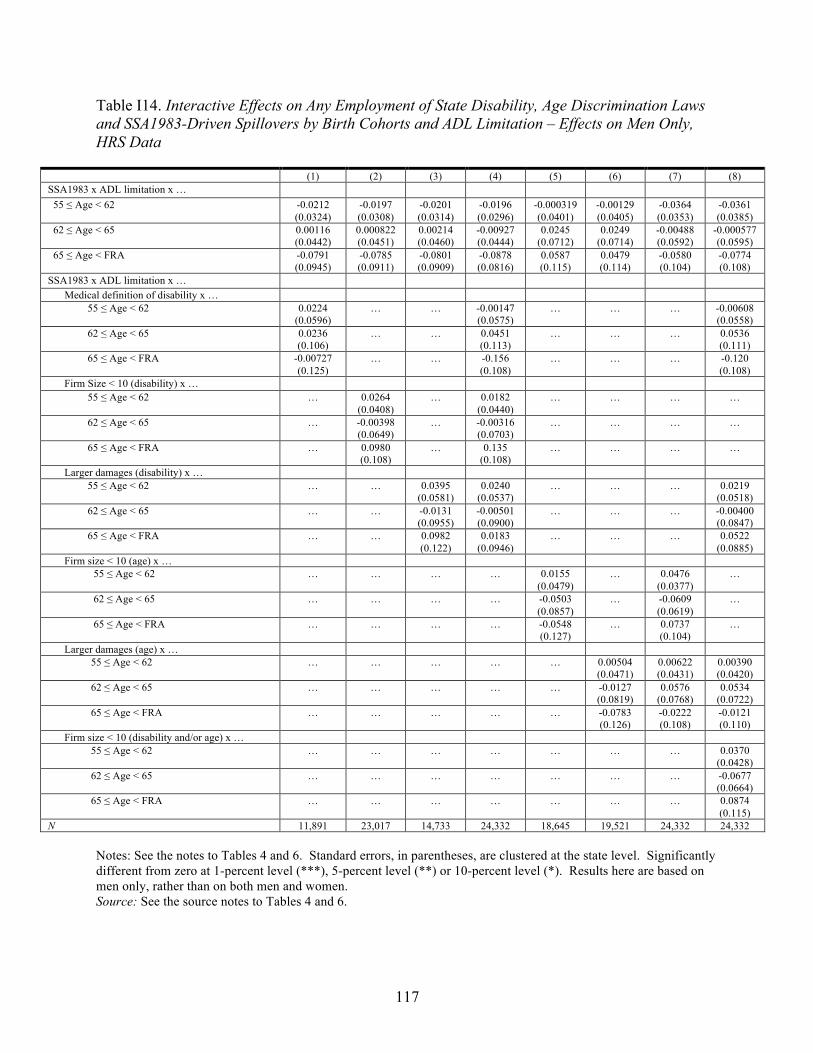
Table I14. Interactive Effects on Any Employment of State Disability, Age Discrimination Laws and SSA1983-Driven Spillovers by Birth Cohorts and ADL Limitation – Effects on Men Only, HRS Data
(1) (2) (3) (4) (5) (6) (7) (8) SSA1983 x ADL limitation x …
55 ≤ Age < 62 -0.0212 (0.0324)
-0.0197 (0.0308)
-0.0201 (0.0314)
-0.0196 (0.0296)
-0.000319 (0.0401)
-0.00129 (0.0405)
-0.0364 (0.0353)
-0.0361 (0.0385)
62 ≤ Age < 65 0.00116 (0.0442)
0.000822 (0.0451)
0.00214 (0.0460)
-0.00927 (0.0444)
0.0245 (0.0712)
0.0249 (0.0714)
-0.00488 (0.0592)
-0.000577 (0.0595)
65 ≤ Age < FRA -0.0791 (0.0945)
-0.0785 (0.0911)
-0.0801 (0.0909)
-0.0878 (0.0816)
0.0587 (0.115)
0.0479 (0.114)
-0.0580 (0.104)
-0.0774 (0.108)
SSA1983 x ADL limitation x … Medical definition of disability x …
55 ≤ Age < 62 0.0224 (0.0596)
… … -0.00147 (0.0575)
… … … -0.00608 (0.0558)
62 ≤ Age < 65 0.0236 (0.106)
… … 0.0451 (0.113)
… … … 0.0536 (0.111)
65 ≤ Age < FRA -0.00727 (0.125)
… … -0.156 (0.108)
… … … -0.120 (0.108)
Firm Size < 10 (disability) x … 55 ≤ Age < 62 … 0.0264
(0.0408) … 0.0182
(0.0440) … … … …
62 ≤ Age < 65 … -0.00398 (0.0649)
… -0.00316 (0.0703)
… … … …
65 ≤ Age < FRA … 0.0980 (0.108)
… 0.135 (0.108)
… … … …
Larger damages (disability) x … 55 ≤ Age < 62 … … 0.0395
(0.0581) 0.0240
(0.0537) … … … 0.0219
(0.0518) 62 ≤ Age < 65 … … -0.0131
(0.0955) -0.00501 (0.0900)
… … … -0.00400 (0.0847)
65 ≤ Age < FRA … … 0.0982 (0.122)
0.0183 (0.0946)
… … … 0.0522 (0.0885)
Firm size < 10 (age) x … 55 ≤ Age < 62 … … … … 0.0155
(0.0479) … 0.0476
(0.0377) …
62 ≤ Age < 65 … … … … -0.0503 (0.0857)
… -0.0609 (0.0619)
…
65 ≤ Age < FRA … … … … -0.0548 (0.127)
… 0.0737 (0.104)
…
Larger damages (age) x … 55 ≤ Age < 62 … … … … … 0.00504
(0.0471) 0.00622 (0.0431)
0.00390 (0.0420)
62 ≤ Age < 65 … … … … … -0.0127 (0.0819)
0.0576 (0.0768)
0.0534 (0.0722)
65 ≤ Age < FRA … … … … … -0.0783 (0.126)
-0.0222 (0.108)
-0.0121 (0.110)
Firm size < 10 (disability and/or age) x … 55 ≤ Age < 62 … … … … … … … 0.0370
(0.0428) 62 ≤ Age < 65 … … … … … … … -0.0677
(0.0664) 65 ≤ Age < FRA … … … … … … … 0.0874
(0.115) N 11,891 23,017 14,733 24,332 18,645 19,521 24,332 24,332
Notes: See the notes to Tables 4 and 6. Standard errors, in parentheses, are clustered at the state level. Significantly different from zero at 1-percent level (***), 5-percent level (**) or 10-percent level (*). Results here are based on men only, rather than on both men and women. Source: See the source notes to Tables 4 and 6.
117
Online Appendix J: References not Cited in the Main Paper
Adams, Scott J. 2004. “Age Discrimination Legislation and the Employment of Older Workers.” Labour Economics 11: 219-241.
Bell, David and Axel Heitmueller. 2009. “The Disability Discrimination Act in the UK: Helping or Hindering Employment among the Disabled?” Journal of Health Economics 28(2): 465-480.
Bound, John and Timothy Waidmann. 2002. “Accounting for Recent Declines in Employment Rates among Working-Aged Men and Women with Disabilities.” Journal of Human Resources 37(2): 231-250.
Carpenter, Christopher S. 2006. “The Effects of Employment Protection for Obese People.” Industrial Relations 45(3): 393-415.
Donald, Stephen G. and Kevin Lang. 2007. “Inference with Difference-in-Differences and Other Panel Data.” Review of Economics and Statistics 89(2): 221-233.
Hotchkiss, Julie L. 2004. “A Closer Look at the Employment Impact of the Americans with Disabilities Act.” Journal of Human Resources 39(4): 887-911.
Houtenville, Andrew J. and Richard V. Burkhauser. 2004. “Did the Employment of People with Disabilities Decline in the 1990s, and Was the ADA Responsible? A Replication and Robustness Check of Acemoglu and Angrist (2001).” Ithaca, NY: Cornell Rehabilitation Research and Training Center for Economic Research on Employment Policy for Person with Disabilities.
Lahey, Joanna N. 2008. “State Age Protection Laws and the Age Discrimination in Employment Act.” Journal of Law and Economics 51(3): 433-460.
Neumark, David. 2009. “The Age Discrimination in Employment Act and the Challenge of Population Aging.” Research on Aging 31(1): 41-68.
Neumark, David and Wendy A. Stock. 1999. “Age Discrimination Laws and Labor Market Efficiency.” Journal of Political Economy 107(5): 1081-1125.
Thompkins, Allison V. 2015. “Did the ADA Evolve into Our Ramp to Full Employment ? An Analysis of 18 Years of the Americans with Disabilities Act.” Journal of Contemporary Management 4(1): 13-32.
118
RECENT WORKING PAPERS FROM THE CENTER FOR RETIREMENT RESEARCH AT BOSTON COLLEGE
Trends in Opioid Use among Social Security Disability Insurance Applicants April Yanyuan Wu, Denise Hoffman, and Paul O’Leary, March 2021
The Value of Annuities Gal Wettstein, Alicia H. Munnell, Wenliang Hou, and Nilufer Gok, March 2021
Will Women Catch Up to Their Fertility Expectations? Anqi Chen and Nilufer Gok, February 2021
The Consequences of Current Benefit Adjustments for Early and Delayed Claiming Andrew G. Biggs, Anqi Chen, and Alicia H. Munnell, January 2021
Intended Bequests and Housing Equity in Older Age Gary V. Engelhardt and Michael D. Eriksen, January 2021
The Effect of Early Claiming Benefit Reduction on Retirement Rates Damir Cosic and C. Eugene Steuerle, January 2021
Financial Security at Older Ages Barbara A. Butrica and Stipica Mudrazija, December 2020
Do People Work Longer When They Live Longer? Damir Cosic, Aaron R. Williams, and C. Eugene Steuerle, December 2020
Do State and Local Government Employees Save Outside of Their Defined Benefit Plans When They Need To? Laura D. Quinby and Geoffrey T. Sanzenbacher, November 2020
How Much Taxes Will Retirees Owe on Their Retirement Income? Anqi Chen and Alicia H. Munnell, November 2020
A Behavioral Economics Assessment of SSDI Earnings Reporting Documents Denise Hoffman, Jonah Deutsch, and Britta Seifert, November 2020
How Accurate Are Retirees’ Assessments of Their Retirement Risk? Wenliang Hou, July 2020
Is Nontraditional Work at Older Ages Associated with Better Retirement Security? Matthew S. Rutledge and Gal Wettstein, July 2020
All working papers are available on the Center for Retirement Research website (https://crr.bc.edu) and can be requested by e-mail ([email protected]) or phone (617-552-1762).
119

![Discrimination in Black Employment [2013]:](https://static.fdocuments.net/doc/165x107/55683454d8b42ab7198b52d4/discrimination-in-black-employment-2013.jpg)