Do Remittances Reduce Poverty and Inequality in the ...
28
Munich Personal RePEc Archive Do Remittances Reduce Poverty and Inequality in the Western Balkans? Evidence from Macedonia. Petreski, Marjan and Jovanovic, Branimir University American College Skopje, University of Rome "Tor Vergata" 2013 Online at https://mpra.ub.uni-muenchen.de/51413/ MPRA Paper No. 51413, posted 15 Nov 2013 05:48 UTC
Transcript of Do Remittances Reduce Poverty and Inequality in the ...

Munich Personal RePEc Archive
Do Remittances Reduce Poverty and
Inequality in the Western Balkans?
Evidence from Macedonia.
Petreski, Marjan and Jovanovic, Branimir
University American College Skopje, University of Rome "Tor
Vergata"
2013
Online at https://mpra.ub.uni-muenchen.de/51413/
MPRA Paper No. 51413, posted 15 Nov 2013 05:48 UTC

Working Paper
Do Remittances Reduce Poverty and Inequality in the Western Balkans?
Evidence from Macedonia.1
Marjan Petreski
University American College Skopje
III Makedonska Brigada 60 Skopje
Branimir Jovanovic
University of Rome “Tor Vergata”
Via Columbia 2, 00133, Rome
Abstract
The objective of this study is to investigate whether remittances in Macedonia affect poverty and
inequality. Using two household surveys, one conducted in 2008, one in 2012, we find that
remittances reduce both poverty and inequality. The inequality-reducing effect has been particularly
present in 2012.
Keywords: remittances; poverty, income inequality, self-employment, Macedonia
JEL classification: O15
1 The paper has been generously supported by the Regional Research Promotion Program by the University of Fribourg and the Swiss Agency for Development and Cooperation. The views expressed here are those of the authors and do not necessarily represent opinions of the University of Fribourg or the Swiss Agency for Development and Cooperation
1

1. Introduction
International migration is one of the most important factors that affect economic relations
between developed and developing countries in the 21st century. At the start of the century, it
was estimated that about 175 million people, roughly 3% of the world population, lived and
worked outside the country of their birth (United Nations, 2002). The international
remittances sent back home by these migrant workers have a profound impact on the
developing countries of Eastern Europe, Asia, Africa, Latin America and the Middle East.
Remittances that these workers send back to developing countries rose from $31.1 billion in
1990, to $76.8 billion in 2000 to around $400 billion in 2012. These flows are expected to
rise 8% in 2013 and 10% in 2014 to reach $534 billion in 2015 (World Bank, 2012). They
amount to over twice the amount of the official development assistance and are 10 times
higher than the net private capital transfers to developing countries (Kapur and McHale,
2003). Constituting one of the largest sources of foreign exchange earnings (in some
countries even exceeding export revenues and foreign direct investment), remittances become
a relatively attractive source of foreign earning for developing countries.
Things are not much different in Macedonia. Since 2004, remittances in Macedonia have
averaged 250 million euros per annum (around 4% of GDP), roughly the same as flows from
foreign direct investment. Furthermore, their upward trend has been maintained despite the
recent crisis – in 2008, before the crisis, they were 280 million euros, while in 2012, after the
crisis, they reached 310 million euros.
Given the nature, magnitude, and evolution of these flows it should not be a surprise that
remittances are now seen by development practitioners as having a potentially important role
to play in supporting the development efforts of recipient countries. There are two main
channels in which remittances can support these efforts. First, remittances could flow towards
the neediest groups of the population and therefore directly contribute to poverty reduction.
Second, with imperfect insurance and financial markets, remittances can also contribute to
higher investment in human and physical capital. For example, these flows can remove some
of the financial constraints faced by households and small-scale entrepreneurs that prevented
them from investing. Thus in this regard, remittances may also potentially contribute to
raising the country’s long run growth potential through higher rates of capital accumulation.
2

There are a lot of papers that investigated the issue and determinants of remittances, since
they represent one of the most stable external sources of financing for developing countries.
At first, researchers were focused on remittances and their direct economic consequences,
like economic growth, investment, poverty and income inequality, but lately there have also
come out a lot of papers where the non-pecuniary consequences of remittances, such as their
impact on health, education, care arrangements and social structures and ethnic hierarchies
are examined. According to Pant (2008), whether remittances are utilized for consumption or
purchasing houses, or for investment in other things, they have positive impact on the
economy by stimulating demand for other goods and services. Migrants send different forms
of capital that have developmental impact in their origin countries. These impacts may be in
the form of financial, social, political, cultural or economic impact. The impact can be
examined at both micro level, like in case of households and macro level like impact on GDP
growth, poverty and development.
This study will investigate remittances’ impact on social disparities in the Western Balkans,
more precisely, in Macedonia. It will investigate the role of remittances for poverty and
income inequality. Special emphasis will be put on the Great Recession, and how these
relationships have changed with it. The analysis will be done using two household surveys,
one conducted in 2008, one in 2012. Findings point out that remittances decrease both
poverty and inequality in Macedonia. The inequality-reducing role has been particularly
evident during the post-crisis period.
This study is organized as follows: Section 2 makes an overview of the literature on this
topic. Section 3 presents descriptive analysis. Section 4 portrays the methodology to be used.
Section 5 gives the results and offers discussion and the last section concludes and offers
policy recommendations.
2. Literature overview
As for the most economic issues, there is no consensus in the literature about remittances’ influence
on poverty reduction and income inequality, neither that they are an engine of long-run growth. There
are two contrasting views regarding the effects of international remittances on the economy of the
labor-sending country: the optimistic view and the pessimistic view. The first one views remittances
as mechanisms for economic development while the latter, on the other hand, perceives remittances as
an “illness” that weakens the economy.
3

Remittances have important contribution to human welfare: this aid flows directly to the people who
really need it and it does not require a costly bureaucracy on the sending side and “far less of it is
likely to be siphoned off into the pockets of corrupt government officials” (Kapur, 2003). Although
most international remittances do not flow directly to the poorest people, remittances often make up
an important share of the income of poor people and poor communities. Moreover, non-migrant poor
might be affected indirectly (positively or negatively) through the economy-wide effects of remittance
expenditure on wages, prices and employment. In accordance with the importance of the official
international remittances, relatively rich literature exists on their effects on poverty alleviation in
developing countries. Some more recent contributions include: Adams and Page (2005); Spatafora
(2005); Munzele (2005); Banga and Sahu (2010); Acosta et al. (2007; 2008); Jongwanish (2007);
Javid et al. (2012); Siddiqui and Kemal (2006; Nwosu (2009); Adams and Cuecuecha (2008), and all
document remittances as significantly reducing the level, depth and severity of poverty, i.e.
international migration of labor has substantial potential benefits for poor people.
The remittances of money and goods by migrants to their origin countries can also have important
impacts on the distribution of household income and welfare. This is especially the case in developing
economies, where household earnings are low, inequality is often pervasive and domestic or
international migration of family members can provide a major source of income through the
remittances of wage earnings. Literature has been rich in investigating this topic also. For instance,
Mckenzie and Rapoport (2004) argue that when migration to a new destination starts taking place, the
cost of emigrating is usually high; implying that, in the presence of liquidity constraints, only high-
income members of population can afford the move. At the beginning, when only richer and more
educated people migrate to another country, income inequality actually rises. But, as the number of
migrants in that destination increases, the cost of emigration declines, giving individuals in low-
income households the opportunity to emigrate. This is because emigration costs include not only
transportation and borders-crossing costs, but information costs about the specific destination to
choose, the search for a job, shelter and so on. Such information costs are significant and tend to
decrease as the size of a network of migrants augments. As a result, over time remittances should
accrue to low-income households, thereby reducing income inequality at the origin. The empirical
literature – e.g. Anyanwu (2011); Kimhi (2010); Adams (1991); Ebeke and Le Goff (2009) – found
mixed results, though, suggesting that remittances’ effect on inequality is far from being uniform
and usually dependent on factors as the level of country’s development; skill endowment of
population and potential migrants, existence of information and emigration networks and so on.
4

3. Stylized facts
Remittance flows represent an important income for households in Macedonia and important source
of financing the current account deficit - since 2004 they have averaged 4% of GDP, roughly the same
as flows from foreign direct investment. Their upward trend has been maintained despite the recent
crisis – in 2008, before the crisis, they amounted to 277 million euro, while in 2012, after the crisis,
they are estimated to be 294 million euro (World Bank data)2.
The empirical analysis in this paper will be done on two household (HH) surveys. The first has been
collected for the project “Development on the Move: Measuring and Optimizing the Economic and
Social Impacts of Migration in the Republic of Macedonia”, by Educon Research, Macedonia. This
survey has been collected in July-September 2008 and covers 1211 households. The primary focus on
this survey (and project) is to analyze migration, so there are questions about remittances. For more
details, see Educon Research (2009). The second survey has been collected for this project. It has
been designed by the authors of this study, following the UNDP Kosovo Remittances Survey 2010,
and has been collected by GfK Macedonia on a total of 1000 household (800 nationally representative
households and 200 remittances receiving households), during October and November 2012.
The data on remittances available from the two household surveys, mainly coincide with the official
macro data, as can be seen in Table 1. However, households tend to underreport the amount of
remittances received – in 2008 the estimates from the available household survey were around 60% of
the official macro figures, while in 2012 they were about 80%. Still, the upward trend in the
remittances is evident in the micro data too. Looking at them in greater detail, one can observe that
the increase in total remittances comes mainly from the extensive margin, i.e. from the increased
number of households that get remittances – before the crisis, in 2008, around 16% of the households
reported receiving remittances, whereas in 2012, after the crisis, the percentage increased to 21%. At
the same time, the average amount of remittances per household remained increased marginally, from
1990 to 2070 euro per receiving household, per year.
Table 1 – Some facts about the remittance flows in 2008 and 2012*
Average amount of
remittances per
receiving household
(euro)
Percentage of
households
receiving
remittances (%)
Estimated amount
of total
remittances (mil.
euro)
World Bank
data on total
remittances
(mil. euro)
Pre-crisis 1992 15.7 167.5 276.9 Post-crisis 2068 20.7 230.6 293.9
Source: DoTM Survey (2008); UACS Remittances Survey (2012).
2 All the nominal amounts (on remittances, consumption etc.) in this section are expressed in 2008 prices, i.e. the data for 2012 have been deflated for the cumulative inflation between 2009 and 2012 (7.4%), for better comparison between the two time periods.
5

The share of HHs with migrant member remained roughly the same in the two surveys (Table 2).
While nearly half of the households in 2008 reported absent migrant who does not send money, this
number halved in 2012, suggesting that amid the crisis, households in Macedonia likely strengthened
the utilization of the diaspora for income support. Finally, both before and after the crisis, nearly all
absent migrant were close family to the responding household.
Table 2 – Households with absent migrant
To
tal
nu
mb
er o
f
ho
use
ho
lds
Rem
itta
nce
s’ r
ecei
vin
g
ho
use
ho
lds
% o
f re
mit
tan
ces'
rece
ivin
g h
ou
seh
old
s
% o
f h
ou
seh
old
s w
ho
rep
ort
ed a
bse
nt
mig
ran
t
% o
f h
h w
ith
mig
ran
ts
no
t se
nd
ing
mo
ney
Per
cen
tag
e o
f h
h w
ith
clo
se-f
am
ily
mig
ran
ts
Before the crisis
1211 190 15.7% 28.2% 44.4% 97.4% After the crisis
801 166 20.7% 27.2% 23.9% 100%
Source: DoTM Survey (2008); UACS Remittances Survey (2012).
Some additional facts about the two surveys are shown in Table 3 in order to build further intuition
about the changes between the two time periods. The share of poor households has decreased
substantially, from 26% in 2008, to 18% in 2012, which can be ascribed, apart from the increase in
remittances, to the measures undertaken in the period between, which may have positively affected
the poor, like the agricultural subsidies program, the increase in the public-sector wages and pensions,
and the measures for fighting the informal economy (the reduction of taxes and social contributions
and introduction of flat tax system). At the same time, the share of households with self-employed
members declined, from 16% in 2008, to 9% in 2012, which comes at a surprise, given the
government efforts to improve the business climate, but may be explained by the global crisis.
Finally, it can be observed that the remittance flows have much higher standard deviation in
2008 than in 2012 (5464 vs. 2310), which points out that remittances have been more unequally
dispersed before the crisis, and have become more equally distributed after the crisis. In other words,
after the crisis, remittances might have started to decrease inequality.
6

Table 3 – Some additional statistics from the two available surveys
HHs Female
headed
Poor Albanian Rural Urban Skopje Self
employed
St. dev. of
remit.
Pre-crisis 1211 42.6% 25.7% 26.9% 26.1% 50.5% 23.5% 15.9% 5464
Post-crisis 800* 19.5% 17.9% 26.1% 43.1% 37.7% 19.2% 9.2% 2310
*800 households in the representative sample, plus 200 in the booster sample
Source: DoTM Survey (2008); UACS Remittances Survey (2012).
Table 4 looks at the poverty rates before and after the crisis for receivng and non-receiving HHs.
Interesting conclusions emerge. First, no large differences existed in poverty rates before the crisis,
depending on whether households were remittances’ receivers or not. However, after the crisis,
remittance-receiving households exhibit larger improvement in poverty, which is in line with the
finding that larger number of households was remittance receiver after the crisis than compared to
before the crisis.
Table 2. – Poverty among surveyed households by different characteristics
All Remittances’
receivers
Non-
remittances’
receivers
Before the crisis
25.7% 25.3% 25.8% After the crisis
17.9% 13.3% 19.1%
Source: DoTM Survey (2008); UACS Remittances Survey (2012).
Table 5 shows some patterns in remittances for different groups in the Macedonian society, before
and after the crisis. It can be observed that female-headed households, on average get more
remittances than male-headed. However, this difference was especially pronounced before the crisis.
After the crisis, female-headed households continued to receive roughly the same amount of
remittances than before the crisis (464 vs. 437 euro), while remittances for male-headed households
increased substantially (to 420 from 220 euro). This may happen if the increase in remittances was
due to children starting working abroad, instead of the households’ heads. Another interesting fact is
that Albanian households get much higher remittances than Macedonian households, both before and
after the crisis. Moreover, remittance flows increased during the crisis for Albanians (to 886 from 440
euro), while they remained unchanged for Macedonians (267 vs. 265). Similar trends are observed in
the incidence of remittances, which is higher for Albanian households than for Macedonian ones,
especially for the period after the crisis; the share of Albanian households receiving remittances
increased during the crisis (to 42%, from 18%), while the share of Macedonian declined (to 14%,
7
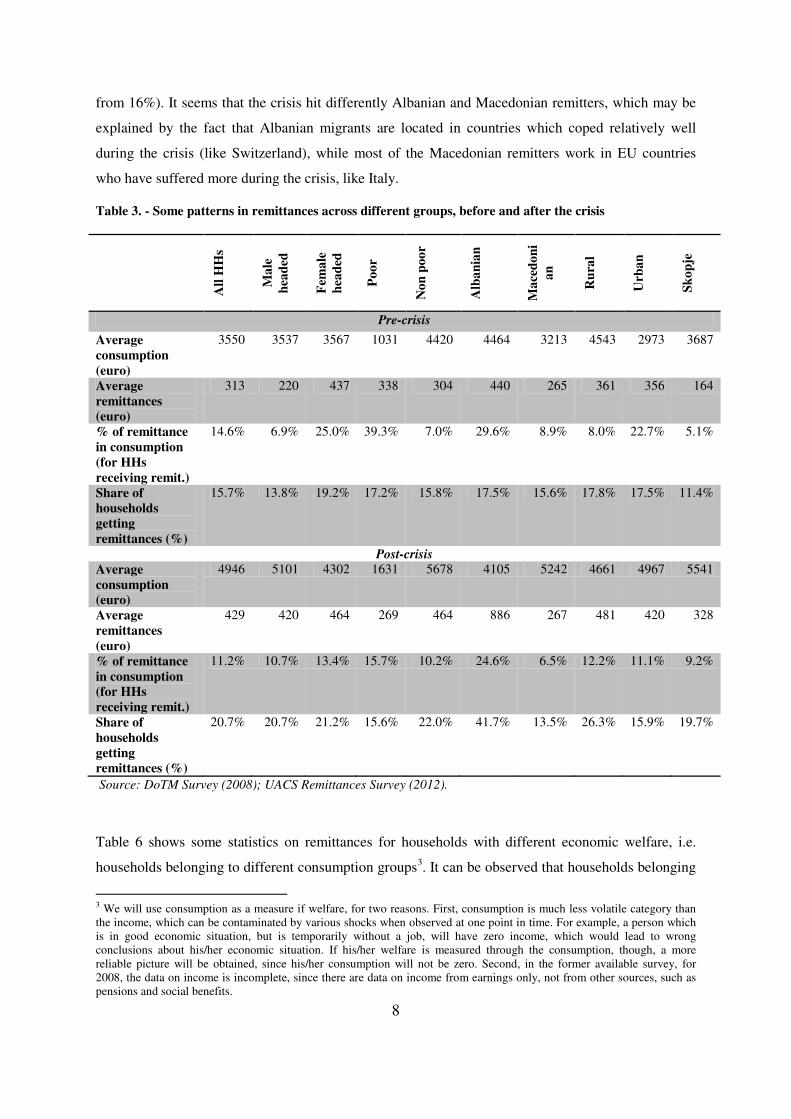
from 16%). It seems that the crisis hit differently Albanian and Macedonian remitters, which may be
explained by the fact that Albanian migrants are located in countries which coped relatively well
during the crisis (like Switzerland), while most of the Macedonian remitters work in EU countries
who have suffered more during the crisis, like Italy.
Table 3. - Some patterns in remittances across different groups, before and after the crisis
All
HH
s
Ma
le
hea
ded
Fem
ale
hea
ded
Po
or
No
n p
oo
r
Alb
an
ian
Ma
ced
on
i
an
Ru
ral
Urb
an
Sk
op
je
Pre-crisis
Average
consumption
(euro)
3550 3537 3567 1031 4420 4464 3213 4543 2973 3687
Average
remittances
(euro)
313 220 437 338 304 440 265 361 356 164
% of remittance
in consumption
(for HHs
receiving remit.)
14.6% 6.9% 25.0% 39.3% 7.0% 29.6% 8.9% 8.0% 22.7% 5.1%
Share of
households
getting
remittances (%)
15.7% 13.8% 19.2% 17.2% 15.8% 17.5% 15.6% 17.8% 17.5% 11.4%
Post-crisis
Average
consumption
(euro)
4946 5101 4302 1631 5678 4105 5242 4661 4967 5541
Average
remittances
(euro)
429 420 464 269 464 886 267 481 420 328
% of remittance
in consumption
(for HHs
receiving remit.)
11.2% 10.7% 13.4% 15.7% 10.2% 24.6% 6.5% 12.2% 11.1% 9.2%
Share of
households
getting
remittances (%)
20.7% 20.7% 21.2% 15.6% 22.0% 41.7% 13.5% 26.3% 15.9% 19.7%
Source: DoTM Survey (2008); UACS Remittances Survey (2012).
Table 6 shows some statistics on remittances for households with different economic welfare, i.e.
households belonging to different consumption groups3. It can be observed that households belonging
3 We will use consumption as a measure if welfare, for two reasons. First, consumption is much less volatile category than the income, which can be contaminated by various shocks when observed at one point in time. For example, a person which is in good economic situation, but is temporarily without a job, will have zero income, which would lead to wrong conclusions about his/her economic situation. If his/her welfare is measured through the consumption, though, a more reliable picture will be obtained, since his/her consumption will not be zero. Second, in the former available survey, for 2008, the data on income is incomplete, since there are data on income from earnings only, not from other sources, such as pensions and social benefits.
8
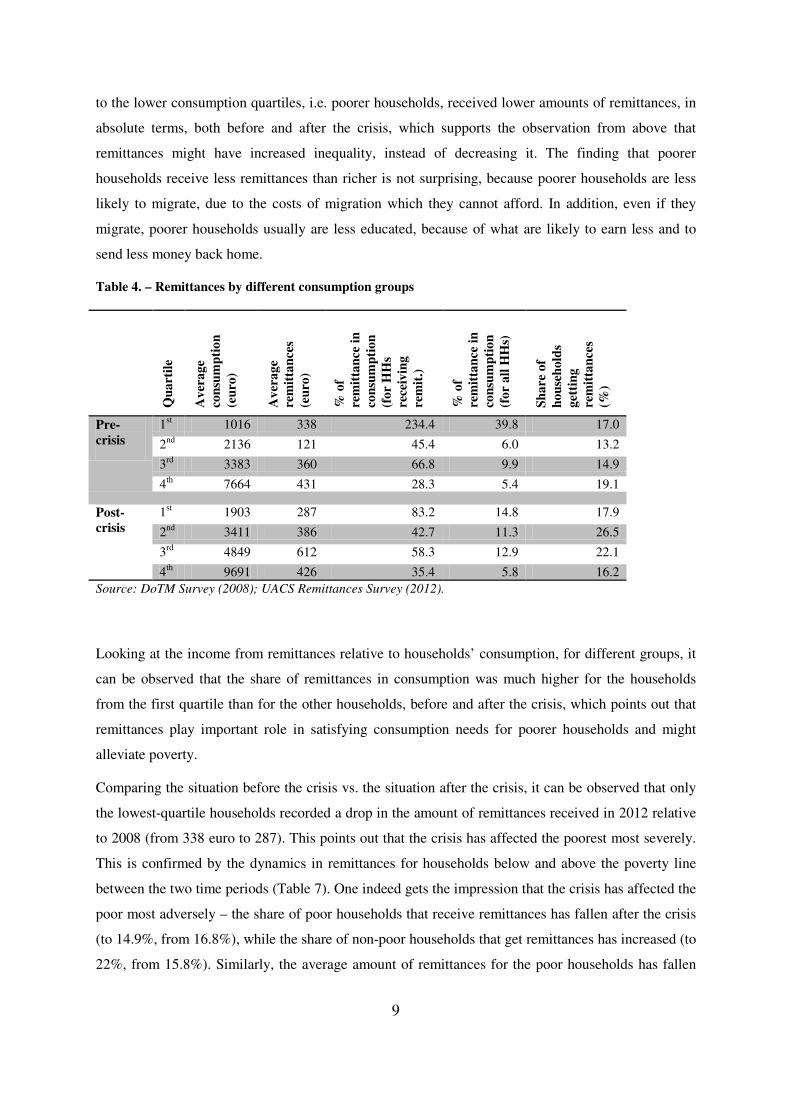
to the lower consumption quartiles, i.e. poorer households, received lower amounts of remittances, in
absolute terms, both before and after the crisis, which supports the observation from above that
remittances might have increased inequality, instead of decreasing it. The finding that poorer
households receive less remittances than richer is not surprising, because poorer households are less
likely to migrate, due to the costs of migration which they cannot afford. In addition, even if they
migrate, poorer households usually are less educated, because of what are likely to earn less and to
send less money back home.
Table 4. – Remittances by different consumption groups
Qu
art
ile
Av
era
ge
con
sum
pti
on
(eu
ro)
Av
era
ge
rem
itta
nce
s
(eu
ro)
% o
f
rem
itta
nce
in
con
sum
pti
on
(fo
r H
Hs
rece
ivin
g
rem
it.)
% o
f
rem
itta
nce
in
con
sum
pti
on
(fo
r a
ll H
Hs)
Sh
are
of
ho
use
ho
lds
get
tin
g
rem
itta
nce
s
(%)
Pre-
crisis
1st 1016 338 234.4 39.8 17.0
2nd 2136 121 45.4 6.0 13.2
3rd 3383 360 66.8 9.9 14.9
4th 7664 431 28.3 5.4 19.1
Post-
crisis
1st 1903 287 83.2 14.8 17.9
2nd 3411 386 42.7 11.3 26.5
3rd 4849 612 58.3 12.9 22.1
4th 9691 426 35.4 5.8 16.2
Source: DoTM Survey (2008); UACS Remittances Survey (2012).
Looking at the income from remittances relative to households’ consumption, for different groups, it
can be observed that the share of remittances in consumption was much higher for the households
from the first quartile than for the other households, before and after the crisis, which points out that
remittances play important role in satisfying consumption needs for poorer households and might
alleviate poverty.
Comparing the situation before the crisis vs. the situation after the crisis, it can be observed that only
the lowest-quartile households recorded a drop in the amount of remittances received in 2012 relative
to 2008 (from 338 euro to 287). This points out that the crisis has affected the poorest most severely.
This is confirmed by the dynamics in remittances for households below and above the poverty line
between the two time periods (Table 7). One indeed gets the impression that the crisis has affected the
poor most adversely – the share of poor households that receive remittances has fallen after the crisis
(to 14.9%, from 16.8%), while the share of non-poor households that get remittances has increased (to
22%, from 15.8%). Similarly, the average amount of remittances for the poor households has fallen
9

substantially (from 338 to 269 euro), while it has increased for the non-poor households (from 304 to
464 euro).
Table 5. – Remittances for poor and non-poor households
Quartile Average
Consumption
(euro)
Average
remittances
(euro)
% of
remittance in
consumption
(for HHs
receiving
remit.)
% of
remittance in
consumption
(for all HHs)
Share of
households
getting
remittances
(%)
Pre-
crisis
Poor 1031 338 233.0 39.3 16.8
Non Poor 4420 304 44.3 7.0 15.8 Post-
crisis
Poor 1631 269 105.2 15.7 14.9
Non Poor 5678 464 46.7 10.2 22.0
Source: DoTM Survey (2008); UACS Remittances Survey (2012).
Finally, Table 8 portrays the usage of remittances inflows. The crisis likely led to households increase
the usage of remittances for consumption, but also for property purchase and savings, at the expense
of longer-term ventures, like education, health-related spending, starting-up a business and
agricultural land purchase. However, the increase in consumption has been more prominent for the
non-poor. The usage of remittances for starting up a business likely suffered most throughout all sub-
groupings amid the crisis.
10

Table 8. – Usage of remittances
Consumption of
the household
(good, clothes,
home
equipment, car)
Family
events
Property
investment
(excpt. agr.
land)
Education Health Starting
up a
business
Agricultural
land
investment
Savings Debt
repayment
Lending
Before the crisis
All 40.2% 9.8% 6.1% 11.0% 11.0% 7.3% 4.9% 6.1% 3.7% 0.0% Male-headed 35.7% 14.3% 4.8% 7.1% 9.5% 9.5% 9.5% 4.8% 4.8% 0.0% Female-headed 45.0% 5.0% 7.5% 15.0% 12.5% 5.0% 0.0% 7.5% 2.5% 0.0% Macedonian 38.7% 8.1% 8.1% 8.1% 9.7% 8.1% 6.5% 8.1% 4.8% 0.0% Albanian 45.0% 15.0% 0.0% 20.0% 15.0% 5.0% 0.0% 0.0% 0.0% 0.0% Poor 47.6% 4.8% 4.8% 23.8% 9.5% 0.0% 4.8% 4.8% 0.0% 0.0% Non-poor 37.7% 11.5% 6.6% 6.6% 11.5% 9.8% 4.9% 6.6% 4.9% 0.0% Skopje 38.0% 10.0% 6.0% 8.0% 12.0% 8.0% 8.0% 6.0% 4.0% 0.0% Urban (other than capital) 41.9% 9.7% 6.5% 16.1% 9.7% 6.5% 0.0% 6.5% 3.2% 0.0% Rural 100.0% 0.0% 0.0% 0.0% 0.0% 0.0% 0.0% 0.0% 0.0% 0.0%
After the crisis
All 47.9% 5.0% 15.8% 6.4% 8.3% 0.7% 0.3% 10.1% 4.5% 1.1% Male-headed 50.1% 4.2% 16.9% 5.0% 7.3% 0.7% 0.5% 10.2% 3.9% 1.1% Female-headed 43.2% 6.8% 13.2% 9.3% 10.4% 0.7% 0.0% 9.6% 5.7% 1.1% Macedonian 44.6% 4.6% 15.8% 6.1% 6.9% 1.0% 0.2% 15.8% 4.4% 0.6% Albanian 52.0% 5.5% 15.8% 6.8% 10.0% 0.3% 0.5% 3.0% 4.5% 1.8% Poor 49.6% 2.5% 11.8% 7.6% 9.2% 0.8% 1.7% 11.8% 4.2% 0.8% Non-poor 47.7% 5.4% 16.4% 6.2% 8.1% 0.6% 0.1% 9.8% 4.5% 1.2% Skopje 49.5% 6.6% 14.6% 7.0% 7.7% 0.3% 0.7% 6.3% 5.6% 1.7% Urban (other than capital) 45.7% 3.5% 16.6% 6.4% 8.1% 1.0% 0.2% 13.5% 3.7% 1.0% Rural 52.8% 7.1% 15.0% 4.7% 10.2% 0.0% 0.0% 5.5% 4.7% 0.0%
Source: DoTM Survey (2008); UACS Remittances Survey (2012).
11

4. Methodology and data
4.1. Models
The model used in the poverty analysis is very similar to the one from World Bank and Statistical
Office of Kosovo (2011). Broadly speaking, it is in accordance with the other existing studies on this
issue surveyed in section 2. The main regression is as follows:
Pr(Poor) = c1 + c2*gender_head + c3*age_head + c4*age_head_squared
+c5*married + c6*education_head + c7*size_HH + c8*size_HH_squared +
c9*dependency_ratio + c10*main_income +c11*no_income + c12*albanian
+c13*geography +c14*own_house +c15*remittances + c16*dummy2012 + u
(1)
The dependent variable is poverty, i.e. the probability of being poor - a dummy variable taking a
unitary value if a household had a consumption per capita below the 60th percentile of the median of
the consumption per capita in that year. The explanatory variables are standard in the literature:
gender of the head, age of the head, age squared, marriage status of the head, education of the nead,
size of the household, size squared, the dependency ratio, main income in the household, ethnicity,
urban/rural, whether household owns a house, the amount of remittances received and a dummy
variable for the time/crisis effect. The coefficient on the remittances variable will tell us if remittances
affect poverty or not. Also, a cross product between the remittances and the dummy for the crisis
period will be included in order to see if the effect of the remittances on poverty changes with the
crisis. Differently from other studies, we decide to include the amount of remittances received, and
not a dummy variable for receiving remittances. The main reason for this is that we believe that there
is a difference in the effect on poverty if a household receives 500 euros of remittances and if it
receives 50.000 euros.
Because there might be endogeneity in the relationship poverty-remittances, i.e. because poverty (the
dependent variable) may also affect whether a household receives remittances and the amount it
receives, we will use an instrumental variable technique to estimate equation 1. The variable that
should instrument remittances should satisfy two properties: 1) it should be correlated with the
variable it instruments (i.e. remittances); 2) it should not be correlated with the dependent variable in
the main regresssion (i.e. probability of being poor) through channels other from the variable it
insruments (i.e. remittances). Our instrument will be a dummy variable for migrating for
completely non-economic reasons (political, education, marriage, war, discrimination etc.). Our both
surveys have questions for the reasons for migrating. The questions are multiple-answer. We take
only those cases which reported migrating for studying, marriage, political reasons etc., but not for
economic reasons. Hence, our variable is likely to be uncorrelated with the incidence of poverty, i.e.
12

the second criterion from above should be satisfied4. It should also satisfy the first criterion, because
migrants who left for purely non-economic reasons should also send money back home.
The impact of remittances on income inequality will be measured through a comparison between the
Gini coefficient of the actual household consumption and the Gini coefficient of the consumption that
would prevail if there were no remittances.
The simulation of the household consumption without the remittances is done following the
existing literature (Acosta et al. 2007, 2008, Adams 1991, Adams and Cuecuecha 2008,
Barham and Boucher 1998). First, household consumption per capita for households without
remittances is regressed on a set of conventional explanatory variables:
Consumption p/c = c1 + c2*gender_head + c3*age_head + c4*age_head_squared
+c5*married + c6*education_head + c7*size_HH + c8*size_HH_squared +
c9*dependency_ratio + c10*main_income +c11*no_income + c12*albanian +
c13*geography +c14*own_house +c15*self_employment + c16*dummy2012 +
c17*lambda + u (2)
Because the sample of non-remittances-receiving households might be non random, the
model is corrected for the selection bias, following Heckman (1979), by including a variable
measuring the probability for not receiving remittances (lambda). Lambda is actually the
inverse Mills ratio from the following regression:
Pr(no_remittances) = c1 + c2*gender_head + c3*age_head + c4*age_head_squared
+ c5*married + c6*education_head + c7*size_HH + c8*size_HH_squared +
c9*dependency_ratio + c10*main_income +c11*no_income + c12*albanian +
c13*geography +c14*own_house + c15*self_employment + c16*dummy2012 +
c17*remittances_region + u (3)
The last variable in this regression, remittances_region, is required to satisfy the exclusion
restriction – in order the model to be identified, the first step regression needs to include a
variable which does not affect the consumption directly, but affects the probability to receive
remittances. Following Acosta et al. (2008), we take the share of households that receive
remittances in every region as the exogenous variable. This share is likely to affect the
4 It is true that the non-economic reasons for migration might be correlated with the economic background (i.e. poorer persons may be more likely to get married abroad). However, those cases are also likely to cite economic reasons for migration, besides the non-economic. By taking only those observations who cite only non-economic reasons, we believe we exclude these cases.
13

probability to receive remittances, through network effects. On the other hand, it is not very
likely to affect the consumption directly.
This consumption regression is then used to predict the consumption that remittances-
receiving households would have had they not received remittances. The predicted values
from the model would have very low variance, because they exlude all the random factors
that affect household consumption. Hence, to make them comparable to the original
consumption data, we would add to them a random component, which would be a series
drawn from a normal distribution with a mean and a standard deviation as the residuals from
the consumption regression.
Then the Gini coefficient of the actual consumption and the simulated one will be compared.
Higher Gini of the simulated series would suggest that remittances decrease inequality.
4.2. Survey setting
Two household surveys are available for Macedonia. The first has been collected for the project
“Development on the Move: Measuring and Optimizing the Economic and Social Impacts of
Migration in the Republic of Macedonia”, by Educon Research, Macedonia. This survey has been
collected in July-September 2008 and covers 1211 households. The primary focus on this survey (and
project) is to analyze migration, so there are questions about remittances. For more details, see
Educon Research (2009). The second survey has been collected for this project. It has been designed
by the authors of this study, following the UNDP Kosovo Remittances Survey 2010, and has been
collected by GfK Macedonia on a total of 1000 household (800 nationally representative households
and 200 remittances receiving households), during October and November 2012.
The first step in the preparation of the surveys is to define their structure. This is very important,
because failure to account for the correct survey design can lead to wrong inference. The
representative 800 households of the 2012 survey are stratified on two levels – region5 and
rural/urban. On the first level of stratification, each region is included in the survey with a number of
households proportional to the total number of households in that region. Then, on the second level of
stratification, the number of rural and urban households from each region is proportional to the total
number of rural/urban households in that region. Then, after the number of rural and urban households
for each region has been determined in this way, those households are selected randomly. For the
booster sample, 25 remittance-receiving households from each region have been selected and in the
5 There are 8 regions in Macedonia – Skopje, Vardar Valley, Pelagonija, Polog, South-West, North-East, East and South-East.
14

survey design they were assigned a probability proportional to the number of remittance-receiving
households in each region without reference to urban-rural characteristic. Because the exact design of
the 2008 survey was not known, it was assumed that it is same as the representative part of the 2012
survey. Then, on the grounds of this information, the probability of being selected was calculated for
each household from the two surveys, and these probabilities were used to correct the regression
estimates.6
4.3. Method and data
The poverty and self-employment regressions will be estimated using the logit model, since the
dependent variable is binary. The reported results are the marginal effects when the variables are on
their mean values (for instance, how much the probability of being poor increases when age of the
household head increases from the mean value of 47 to 48).
The first-step regression in the simulation exercise (equation 5) will be estimated using probit. The
second-step regression (equation 4) will be estimated using OLS.
Descriptive statistics of the variables used in the econometric analysis is shown in Tables 9 and 10.
Table 9 shows the standard statistics of interest for the continuous variables, while Table 10 shows the
percentage of observations with the respective attribute for the qualitative variables.
Table 9. – Descriptive statistics of the quantitative variables used in the analysis
Absolute income
inequality
Age of head
(years)
Size of household
(no. of members)
Dependency ratio
Remittances (EUR)
Consumption per capita
(EUR)
Mean -1.8 47.1 3.5 0.6 516.6 1342.6
Maximum 0.9 93.0 12.0 1.0 30952.4 17668.4
Minimum -2978.2 17.0 1.0 -0.5 0.0 0.3
St. Dev. 67.4 14.7 1.4 0.3 1771.8 1233.6
25th perc. -0.6 35.0 3.0 0.5 0.0 636.6
75th perc. 0.4 58.0 4.0 0.8 136.1 1598.0
No. Obs. 1952.0 1986.0 1986.0 1986.0 1986.0 1952.0
Source: Authors’ estimations
6 This was done using the command “svyset” in Stata.
15

Table 10. - Descriptive statistics of the qualitative variables used in the analysis
Attribute % of HH
with the
attribute
Poor 21.5
Self emp1oyment 12.6
Male head 73.1
Married head 79.5
Education of head, secondary 29.6
Education of head, university 12.0
Education of head, postgraduate 0.4
Main income from pensions 9.8
Main income from social benefits 1.7
Main income from other sources 1.4
No income 14.7
Albanian 27.0
Urban 47.8
Capital 18.1
Own house 95.6
Source: Authors’ estimations
5. Econometric analysis and discussion
5.1 Remittances and poverty
Table 11 presents the results of the poverty analysis. The first two columns present the baseline
results, while the next three columns – the results of the analysis of the effects of the crisis. The first
column of the baseline results and the first two columns of the crisis results present the first-step
regressions, i.e. the regression where the endogenous explanatory variables (the remittances) are
regressed on the instruments (the dummy for non-economic migration)7. The most important results
of the first-stage regressions are those regarding the strenght of the instruments. It can be seen that the
dummies for non-economic migration (dum_no_econ and dum_no_econ*dum2012) are significant,
pointing out that the instrument is unlikely to be weak. To be fair, the F values in the first-stage
regressions are below the rule-of-thumb value of 10, but are above 2, so we proceed as if the
instruments are not weak.
The results of the baseline second-stage regression is shown in the second column. In general, results
have the expected signs and some of them are statistically significant. They suggest that only those
heads who have university education have lower probability of falling into poverty by about 17% than
7 There are two first-stage regressions in the ‘crisis’ analysis, one for the remittances, the other one for the cross-product of the remittances with the dummy for 2012.
16

compared to heads with primary education, which justifies the investment in tertiary education, while
the other educational degrees are found not to matter for poverty. The age and marriage are also
unimportant for poverty. Each additional member of the household increases the probability of being
poor by 7% suggesting that larger households are, on average, poorer than smaller ones. Also, those
households which have higher number of dependent members (children and elderly) have higher
probability of falling into poverty.
With respect to income, we find that it does not matter for poverty what is the source of the main
income of the household. Owning a house is not important for poverty, which may be explained by
the high home-ownership rate in Macedonia (around 95%). The probability of being poor is the same
for Albanians and Macedonians and for urban (other than capital) and rural inhabitants, as the
respective coefficients are insignificant. On the other hand, those living in Skopje, the capital city,
have lower probability of being poor by about 7% than rural counterparts, which is not surprising,
given the role of Skopje as administrative and financial center of the country. Gender does not matter,
either, as well as the crisis, which points out that the fall in the poverty between the two years is
explained by the change in the other variables that are included in the regression.
17

Table 11: Results of the regression
Baseline regression Crisis
1st step 2nd step 1st step 1st step 2nd step
remit poor remit remit* poor
dum2012
Age of the head (years) -38.03 -0.0078 -36.88 0.201 -0.0071 -34.37 -0.00816 -34.25 -11.53 -0.0279 Age of the head, squared 0.356 7.61E-05 0.344 -0.0865 6.27E-05
-0.398 -8.24E-05 -0.397 -0.109 -0.00033
Married head 289.7*** 0.0447 289.9*** 202.9*** 0.0547
-94.75 -0.0541 -94.36 -59.77 -0.0703
Secondary education of head -58.01 -0.0307 -64.32 -29.27 -0.0318
-101.4 -0.0433 -101.8 -44.24 -0.0501 University education of head -136.3 -0.167*** -136.6 -32.07 -0.167***
-87.6 -0.0327 -87.45 -50.74 -0.0527 Above university education of head 83.14 -0.0379 70.72 37.83 -0.0371
-386.6 -0.151 -384.6 -142.6 -0.152 Size of HH -106.6 0.0736* -98.14 -176 0.0602
-168.2 -0.0422 -163.9 -129.1 -0.0749 Size of HH, squared 13.33 0.00175 12.12 16.24 0.00296
-17.27 -0.00444 -16.49 -15.48 -0.00566 Dependency ratio 251.6 0.441*** 250.5 239.8* 0.454***
-180.1 -0.0917 -179.8 -142.2 -0.0885 Main income from pension -129.2 -0.047 -119 -76.75 -0.0503
-167.8 -0.0591 -167.2 -150.1 -0.0631 Main income from social assistance -91.65 0.238 -81.94 -5.405 0.24
-194.2 -0.156 -194.2 -195.4 -0.173 Main income from other sources 235 -0.0973 246.6 304.6 -0.0823
-526.6 -0.0941 -526.8 -517.5 -0.11 No income 188.1 0.0418 194 78.93 0.0453
-212.9 -0.0666 -213.1 -124.2 -0.11 Own house 14.37 -0.0411 13.33 399.9*** -0.008
-325.2 -0.0696 -324.9 -62.71 -0.311 Albanian 169.2 0.0594 157.4 217.9*** 0.0742
-108.8 -0.045 -109.7 -82.36 -0.0749 Urban 149.8 0.0355 149 197.7*** 0.0492
-99.84 -0.0356 -99.77 -74.13 -0.0611 Capital 0.167 -0.0657* 7.773 102.9 -0.0594
-114.5 -0.0357 -114.1 -83.73 -0.0776 Male head of HH -223.1** 0.0163 -229.3** -157.2** 0.00814
-101.7 -0.0447 -102 -75.94 -0.0621 Dum2012 360.1*** 0.000973 333.7*** 579.4*** 0.0403
-103.2 -0.0654 -105.2 -81.02 -0.22 Remit
-0.000272*
-0.00026
-0.00014
-0.00074
remit*dum2012
-7.95E-05
-0.00078
dum_no_econ 425.2***
84.44 -36.93
-150
-212.5 -44.74 dum_no_econ*dum2012
606.0** 702.0***
-286.4 -193.4 Constant 985
969.4 -174.1
-802.1
-798.8 -408.1 Observations 1,690 1,690 1,690 1,690 1,690
F stat 4.4
4.5 7.9 R-squared 0.03 0.031 0.095
Dependent variables in italics. Standard errors in parentheses. *** p<0.01, ** p<0.05, * p<0.1
18

Finally, remittances – the focus of this study – are found to affect poverty in a positive fashion, so that
an additional thousand euro of remittance money, reduces the probability of being poor by 27% on
average (at the mean of the explanatory variables). In other words, a household which has 1600 euros
of remittances per year, is 27% less likely to be poor than a household which has 600 euros of
remittances (the mean of the variable), on average, ceteris paribus. This is a very strong effect.
The results of the crisis second-stage regression are shown in the last column of Table 11. Most of the
coefficients are very similar to the baseline results. The main variable of interest here is the
dum_no_econ*dum2012, which shows whether the effect of remitances on poverty differed in 2012,
with respect to 2008. This variable is insignificant, pointing out that the relationship remained
unchanged.
5.2. Remittances and inequality
We will measure welfare by consumption, not income, for two main reasons. The first one is
that consumption is a better indicator for welfare, since utility in all economic models is
represented by consumption, not income. The second one is a purely practical reason –
people tend to under-report income much more than consumption, as a result of what around
16% of our households report no income at all.
As explained in section 4.1, the inequality analysis has several stages. The first one estimates
the probability for not-receiving remittances. The second one estimates a consumption
function for HHs without remittances (correcting for the selection bias, i.e. for the probability
of not-receiving remittances). The third stage uses this function to simulate the consumption
of remittances-receiving HHs. Finally, the Gini coefficient on this simulated consumption is
compared to the actual Gini coefficient.
The results of the first-stage regression, which explains the probability not to receive
remittances (equation 3 from above) are shown in Table 12. Since the purpose of our analysis
is not to investigate determinants of remittances, we will not interpret this regression in
greater details. It is worth noting that most (if not all) of the coefficients appear with the
expected signs and magnitudes, and that the variable which is supposed to be exogenous with
respect to consumption, the share of household with remittances in the corresponding region,
is significant and negative in the first-stage regression, pointing out that the probability not to
receive remittances is negatively related to the share of remittance-receiving households in
the region.
19

Table 12. – Results of the first-stage regression for the determinants of the consumption
of households without remittances
Dependent variable: Dummy taking value of 1 if household has no remittances
Gender of the head (1 if male) 0.313***
Age of the head (years) 0.00498
Age of the head, squared 7.96E-06
Marriage status of head (1 if married) -0.227**
Education of head (1 if with incomplete or complete
secondary school)
0.211*
Education of head (1 if with college or university) 0.385**
Education of head (1 if with postgraduate degrees) 0.122
Size of household (no of members) 0.315***
Size of household squared -0.0238**
Percentage of dependent members in total household
members
-0.049
Main income (1 if pension is main income) -0.0901
Main income (1 if social assistance is main income) 0.397
Main income (1 if other source is main income) -0.285
No income (1 if the household has no income) -0.0382
Albanian (1 if Albanian) -0.342***
Own house (1 if the household possesses own house) -0.284*
Self employment (1 if household has a private business) -0.0642
Urban (1 if urban (except capital)) -0.270***
Capital (1 if capital (Skopje)) 0.0263
2012 (1 for the year 2012 (during crisis)) 0.144
Share of households with remittances in the region -3.383***
Constant 0.971**
Observations 1,690
Source: Authors’ estimates.
*, ** and *** denote statistical significance at the 10, 5 and 1% level, respectively.
The results of the second-stage regression (equation 2 from above), which gives the
determinants of the consumption of households without remittances, are shown in Table 13.
Again, since our main interest does not lie in the determinants of household consumption, we
will not interpret these results thoroughly. It is only worth noting that the Inverse Mills ratio
is insignificant in the regression, pointing out that there is no selection bias arising from
investigating determinants of consumption on a sample of non-remittance receiving
households.
20

Table 13. – Results of the second-stage regression for the determinants of the
consumption of households without remittances
Dependent variable: Logarithm of households consumption per capita
Gender of the head (1 if male) -0.066
Age of the head (years) 0.0014
Age of the head, squared -2.58E-06
Marriage status of head (1 if married) 0.0699
Education of head (1 if with incomplete or complete
secondary school)
0.0421
Education of head (1 if with college or university) 0.362***
Education of head (1 if with postgraduate degrees) 0.537*
Size of household (no of members) -0.365***
Size of household squared 0.0224***
Percentage of dependent members in total household
members
-0.712***
Main income (1 if pension is main income) 0.00751
Main income (1 if social assistance is main income) -0.259*
Main income (1 if other source is main income) 0.519***
No income (1 if the household has no income) 0.00234
Albanian (1 if Albanian) 0.0636
Own house (1 if the household possesses own house) -0.151
Self employment (1 if household has a private business) 0.209***
Urban (1 if urban (except capital)) -0.0431
Capital (1 if capital (Skopje)) 0.118**
2012 (1 for the year 2012 (during crisis)) 0.581***
Constant 8.082***
Inverse Mills ratio -0.183
Observations 1,216
R-squared 0.288
Source: Authors’ estimates.
*, ** and *** denote statistical significance at the 10, 5 and 1% level, respectively.
These estimates are then used to predict the consumption that households which receive
remittances would have had, in case they had not received remittances. However, a simple fit
of this regression would provide very stable consumption, because it omits all the random
factors that affect household consumption. To address this problem, we will follow Barham
and Boucher (1998) and Acosta et al. (2008), and will add a series of consumption shocks to
the fitted values of the above regression, the former being drawn from a normal dristribution
with properties as the residuals from the above regression (zero mean and standard deviation
21
of 0.6598454)8. The series that is obtained in this way is then the consumption that
households with remittances would have, had they not received remittances.
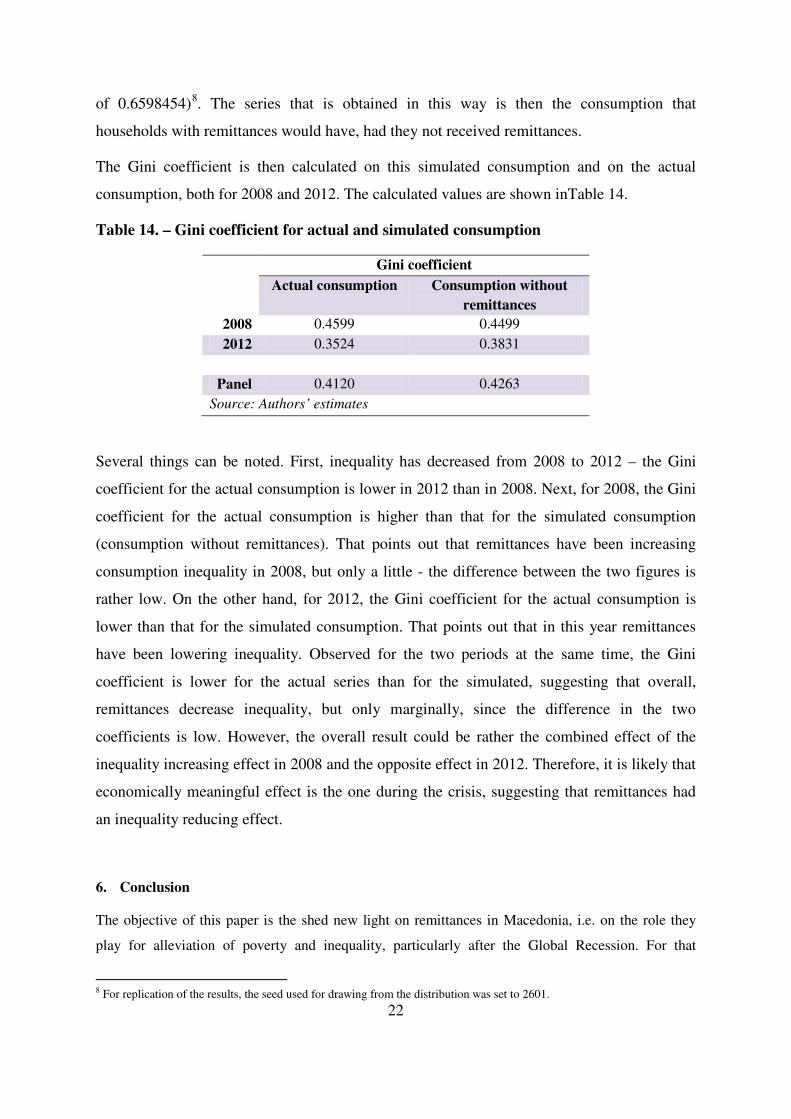
The Gini coefficient is then calculated on this simulated consumption and on the actual
consumption, both for 2008 and 2012. The calculated values are shown inTable 14.
Table 14. – Gini coefficient for actual and simulated consumption
Gini coefficient
Actual consumption Consumption without
remittances
2008 0.4599 0.4499
2012 0.3524 0.3831
Panel 0.4120 0.4263
Source: Authors’ estimates
Several things can be noted. First, inequality has decreased from 2008 to 2012 – the Gini
coefficient for the actual consumption is lower in 2012 than in 2008. Next, for 2008, the Gini
coefficient for the actual consumption is higher than that for the simulated consumption
(consumption without remittances). That points out that remittances have been increasing
consumption inequality in 2008, but only a little - the difference between the two figures is
rather low. On the other hand, for 2012, the Gini coefficient for the actual consumption is
lower than that for the simulated consumption. That points out that in this year remittances
have been lowering inequality. Observed for the two periods at the same time, the Gini
coefficient is lower for the actual series than for the simulated, suggesting that overall,
remittances decrease inequality, but only marginally, since the difference in the two
coefficients is low. However, the overall result could be rather the combined effect of the
inequality increasing effect in 2008 and the opposite effect in 2012. Therefore, it is likely that
economically meaningful effect is the one during the crisis, suggesting that remittances had
an inequality reducing effect.
6. Conclusion
The objective of this paper is the shed new light on remittances in Macedonia, i.e. on the role they
play for alleviation of poverty and inequality, particularly after the Global Recession. For that
8 For replication of the results, the seed used for drawing from the distribution was set to 2601.
22

purpose, we used an existing survey of before the crisis and conducted new one on a representative
sample of 1000 households in Macedonia in late-2012, i.e. during the crisis.
The main conclusion of the analysis for remittances in Macedonia is that they reduce poverty, both
before and after the crisis. The inequality analysis pointed out that remittances have been increasing
inequality in 2008, but only a little, while they have decreased it sizeably in 2012.
7. References
Acosta, P., Fajnzylber, P. and Lopez, J.H. (2007) The impact of remittances on poverty and human
capital: Evidence from Latin American households surveys. World Bank Policy Research
Working Paper 4247.
Acosta, P., Fajnzylber, P. and Lopez, J.H. (2008) What is the impact of international remittances on
poverty and inequality in Latin America?. World Development Vol 36
Adams R.H. and Page, J. (2005) Do international migration and remittances reduce poverty in
developing countries?. World Development Vol 33
Adams, R.H. and Cuecuecha, A. (2008) The impact of remittances on poverty and inequality in
Ghana. Policy Research Working Paper 4732
Adams, R.H., (1991) The effects of international remittances on poverty, inequality and development
in rural Egypt. International Food Policy Research Institute
Amuedo-Dorantes, C. and Pozo, S. (2006) Remittance receipt and business ownership in the
Dominican Republic. The World Economy Vol 29
Anyanwu, J. (2011) International remittances and income inequality in Africa. African Development
Bang Group Working Paper No. 135
Balde, Y. (2009) Migrants’ remittances and economic growth in Sub-Saharan Africa. Mimeo.
Banga, R. and Sahu, P.K. (2010) Impact of remittances on poverty in developing countries.
eSocialSciences Working Paper id 3100
Barham, B. and Boucher, S. (1998) Migration, remittances and inequality: estimating the net effects
of migration on income distribution. Journal of Development Economics Vol 55
Barnow, B. (1987) The Impact of CETA Programs on Earnings: A Review of the Literature. Journal
of Human Resources, 22(2):157-193.
Bassi, L. (1984) Estimating the Effects of Training Programs with Nonrandom Selection. Review of
Economics and Statistics, 66(1):36-43.
23
Cave, G. and H. Bos (1995) The Value of a GED in a Choice-Based Experimental Sample. Mimeo,
New York: Manpower Demonstration Research Corporation.
Chami, R., Fullenkamp, C. and Jahjah, S. (2003) Are Immigrant Remittance Flows a Source of
Capital for Development?. IMF Working Paper 03/189
Cochran, W.G., and D.B. Rubin (1973) Controlling Bias in Observational Studies: A Review.
Sankhya, ser. A, 35(4):417-446.
Cox-Edwards, A. and Ureta, M. (2003) International migration, remittances and schooling: evidence
from El Salvador. Journal of Development Economics Vol 72
Czajka, J., S.M. Hirabayashi, R.J.A. Little, and D.B. Rubin (1992) Projecting From Advance Data
Using Propensity Modeling: An Application to Income and Tax Statistics. Journal of
Business and Economic Statistics, 10(2):117-131.
De Haas, H. (2007) Remittances, migration and social development: a conceptual review of the
literature. United Nations Research Institute for Social Development. Social Policy and
Development Programme Paper No. 34
De Haas, H. (2007) The impact of international migration on social and economic development in
Moroccan sending regions: a review of the empirical literature. International Migration
Institute Paper 3
Ebeke, C. and Le Goff, M. (2009) Why migrants remittances reduce income inequality in some
countries and not in others?. Working Papers 200919, CERDI.
Ekanayake, M. and Mihalis, H. (2008) Do remittances and foreign direct investment promote growth:
evidence from developing countries. Journal of International Business and Economics
Funkhouser, E. (1992) Migration from Nicaragua: Some recent evidence. World Development,
Elsevier, vol. 20(8), pages 1209-1218, August.
Giuliano, P. and Ruiz-Arranz, M. (2005) Remittances, financial development and growth. IMF
Working Paper 05/234
Gustafson, B., & Makonnen, N. (1993). Poverty and remittances in Lesotho. Journal of African
Economies 2
Hanson, G. and Woodruff, C. (2003) Emigration and Educational Attainment in Mexico. NBER
Working Paper. 2003.
Heckman, J. (1979). "Sample selection bias as a specification error". Econometrica 47 (1): 153–61.
24
Hildebrandt, N. and McKenzie, D. (2005) The effects of migration on the child health in Mexico.
Economia
Javid, M., Arif, U. and Qayyum, A. (2012) Impact of remittances on economic growth and poverty.
Academic Research International Vol. 2, No. 1
Jongwanish, J. (2007) Workers’ remittances, economic growth and poverty in developing Asia and
the Pacific countries. UNESCAP Working Paper 07/01
Kapur, D (2003) Remittances: the new development mantra, paper prepared for the G-24 Technical
Group Meeting, 15–16 September (Geneva: Palais des Nations).
Kapur, D. and McHale, J. (2003) Sharing the Spoils: International Human Capital Flows and
Developing Countries. Mimeo, The Center for Global Development
Kimhi, A. (2010) International remittances, domestic remittances and income inequality in Dominican
Republic. The Hebrew University of Jerusalem Discussion Paper No. 2.10
Lopez-Calix, J. and Seligson, M. (1990) Small business development in El Salvador: the impact of
remittances. Report of the Commission for the study of international migration and
cooperative development, Washington
Lopez-Cordova, E. (2006) Globalization, migration and development: the role of Mexican migrant
remittances. INTAL-ITD Working Paper 20.
Lopez-Cordova, E. and Olmedo, A. (2006) International remittances and development: existing
evidence, policies and recommendations. INTAL-ITD Occasional Paper 41.
McKenzie, D. and Rapoport, H. (2004) Network effects and the dynamics of migration and
inequality: theory and evidence from Mexico. Mimeo, Stanford University
Mesnard, A. (2000) Temporary migration and capital market imperfections. Oxford Economic Papers,
56(2), p.242-262.
Munzele-Maimbo, S. and Ratha, D. (2005) Remittances: development impact and future prospects.
The International Bank for Reconstruction and Development, The World Bank.
Nwosu, E.O. (2009) Remittances, poverty and income distribution in Nigeria: evidence from
household data. Mimeo
Page, J. and Plaza, S. (2005) Migration, remittances and development: a review of global evidence.
Oxford University Press
Rappoport, H. and Docquier, F. (2005) The economics of migrants’ remittances. IZA Discussion
Paper No. 1531
25
Raynor, W.J. (1983) Caliper Pair-Matching on a Continuous Variable in Case Control Studies.
Communications in Statistics: Theory and Methods, 12(13):1499-1509.
Revallion, M & Chen, S (1997) what can new survey data tell us about recent change in distribution
and poverty?. World Bank Economic Review, 11
Rosenbaum, Paul (1995) Observational Studies, Springer Series in Statistics (New York, NY:
Springer Verlag).
Rubin, D. (1973) Matching to Remove Bias in Observational Studies. Biometrics, 29:159-183.
Rubin, D. (1979) Using Multivariate Matched Sampling and Regression Adjustment to Control Bias
in Observation Studies. Journal of the American Statistical Association, 74(366):318-328.
Schneider, F., Buehn, A. and Montenegro, C. (2010) Shadow Economies All Over the World: New
Estimates for 162 Countries from 1999 to 2007. World Bank Policy Research Working Paper
Series, 5356.
Siddiqui, R. and Kemal, A.R. (2002) Remittances, trade liberalization and poverty in Pakistan: The
role of excluded variables in poverty change analysis. Development Economics Working
Papers 22224, East Asian Bureau of Economic Research
Spatafora, N. (2005) Workers’ remittances and economic development. World Economic Outlook
Taylor, J.E., Mora, J., Adams, R. and Lopez-Feldman, A. (2005) Remittances, inequality and poverty:
evidence from rural Mexico. Working Papers 60287, University of California, Davis,
Department of Agricultural and Resource Economics
United Nations, Department of Economic and Social Affairs, Population Division (2002).
International Migration Report 2002
United Nations, United Nations Conference on Trade and Development (2011). Impact of remittances
on poverty in developing countries
Westat (1981) Continuous Longitudinal Manpower Survey Net Impact Report No. 1: Impact on 1977
Earnings of New FY 1976 CETA Enrollees in Selected Program Activities. Report prepared
for U.S. DOL under contract No. 23-24-75-07.
Woodruff, C. and Zenteno, R. (2001) Remittances and microenterprises in Mexico, Journal of
Development Economics 82
World Bank (2012) Migration and development brief 19. Migration and remittances units,
Development prospects groups, November, 2012
26

World Bank and Statistical Office of Kosovo (2011) Consumption Poverty in the Republic of Kosovo
in 2009, May 2011
Yang, D. (2003) The dynamics of international labor migration: understanding the departure and
return of overseas Filipino workers. Mimeo.
27