Do Remittances Reduce Aid Dependency? · Kangni Kpodar and Maëlan Le Goff ... Do Remittances...
32
WP/11/246 Do Remittances Reduce Aid Dependency? Kangni Kpodar and Maëlan Le Goff
-
Upload
nguyenquynh -
Category
Documents
-
view
214 -
download
0
Transcript of Do Remittances Reduce Aid Dependency? · Kangni Kpodar and Maëlan Le Goff ... Do Remittances...

WP/11/246
Do Remittances Reduce Aid Dependency?
Kangni Kpodar and Maëlan Le Goff

© 2011 International Monetary Fund WP/11/246
IMF Working Paper
AFR
Do Remittances Reduce Aid Dependency?
Prepared by Kangni Kpodar and Maëlan Le Goff1
Authorized for distribution by Peter Allum
October 2011
Abstract
Aid has been for decades an important source of financing for developing countries, but
more recently remittance flows have increased rapidly and are beginning to dwarf aid
flows. This paper investigates how remittances affect aid flows, and how this relationship
varies depending on the channel of transmission from remittances to aid. Buoyant
remittances could reduce aid needs when human capital improves and private investment
takes off. Absent these, aid flows could still drop as remittances may dampen donors’
incentive to scale up aid. Concurrently, remittances could be positively associated with aid
if migrants can influence aid policy in donor countries. Using an instrumental variable
approach with panel data for a sample of developing countries from 1975–2005, the
baseline results show that remittances actually increase aid dependency. However, a
refined model controlling for the channels of transmission from remittances to aid reveals
that remittances lead to lower aid dependency when they are invested in human and
physical capital rather than consumed.
JEL Classification Numbers: F35, F24, O10
Keywords: Development aid, remittances
Authors’ E-Mail Addresses: [email protected]; [email protected]
1 K. Kpodar is an Economist at the International Monetary Fund (IMF) and Research Fellow at the Centre for
Studies and Research on International Development (CERDI); M. Le Goff is an Economist at the French Centre for
Research and Studies on the World Economy (CEPII). We would like to thank Enrico Berkes, Patrick Guillaumont,
Elliott Harris, Patrick Imam, Salifou Issoufou, Thierry Kangoye, Nkunde Mwase, and Raju Singh for insightful
comments and suggestions, and Jenny Kletzin DiBiase for helpful editorial comments. We are also grateful to
participants at the CERDI Seminar in June 2010, and the 15th Annual Conference of the AES on Econometric
Modeling for Africa in July 2010. The usual disclaimer applies.
This Working Paper should not be reported as representing the views of the IMF.
The views expressed in this Working Paper are those of the author(s) and do not necessarily
represent those of the IMF or IMF policy. Working Papers describe research in progress by the
author(s) and are published to elicit comments and to further debate.

2
Contents
I. Introduction ........................................................................................................................... 3
II. Literature Review ................................................................................................................. 4
A. Factors Affecting Bilateral Aid Allocation ...................................................................... 4
B. Remittances and Aid ........................................................................................................ 5
III. Empirical Analysis .............................................................................................................. 9
A. The Model and Data ......................................................................................................... 9
B. Empirical Results ........................................................................................................... 11
IV. Conclusion ........................................................................................................................ 12
References ............................................................................................................................... 14
Tables
Table 1. Remittances and Aid: the Baseline Model ................................................................ 23
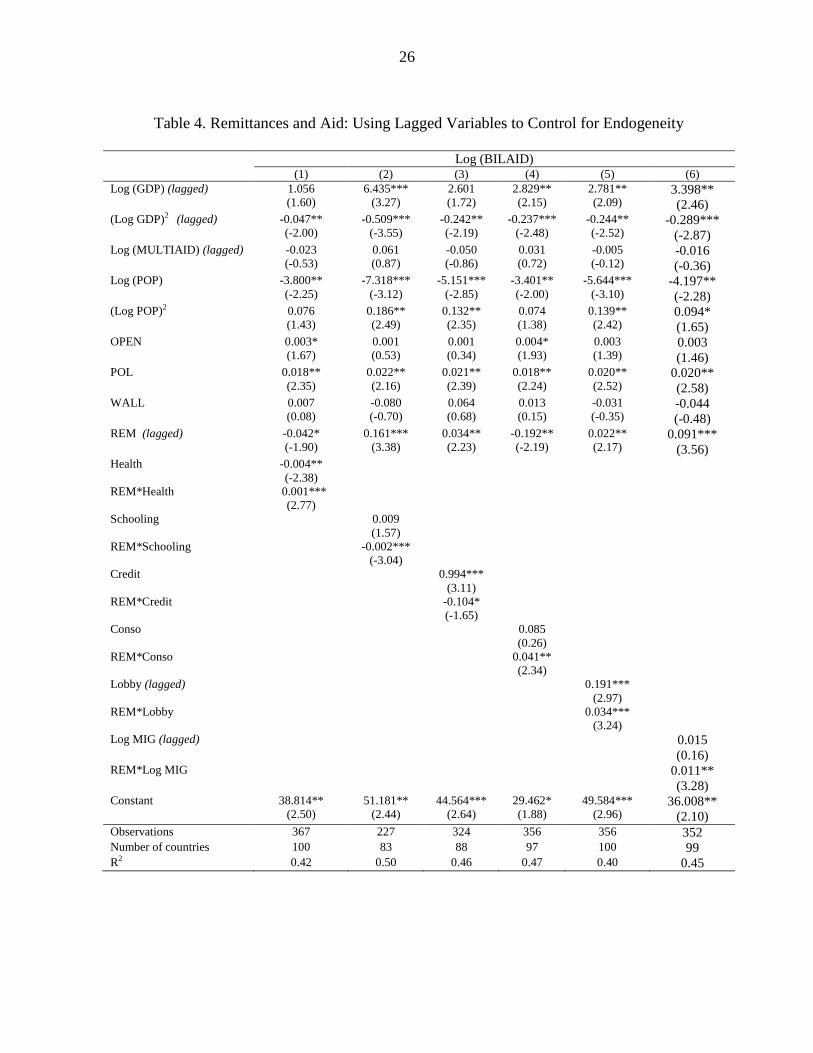
Table 2. Remittances and Aid: Controlling for Fiscal Deficits in Donor Countries ............... 24 Table 3. Alternative Indicators for the Channels of Transmission from Remittances to Aid 25 Table 4. Remittances and Aid: Using Lagged Variables to Control for Endogeneity ............ 26
Figures
Text Figure 1. Channels of Transmission from Remittances to Aid Flows ..............................8
Figure 1. Remittances and Aid, 1975–2005............................................................................ 20 Figure 2. Trends in Remittances and ODA for Selected Countries, 1975–2005 .................... 21 Figure 3. Migrant Stocks and Bilateral Aid in 2000 ............................................................... 22
Appendices
Appendix 1. List of the Sample Countries .............................................................................. 27 Appendix 2. Variable Definitions and Sources ....................................................................... 29 Appendix 3. Correlation Matrix .............................................................................................. 30 Appendix 4. Descriptive Statistics .......................................................................................... 31

3
I. INTRODUCTION
In 2002, the UN Monterrey Report of the International Conference on Financing for
Development recognized that official development assistance (ODA, henceforth aid) is, with
trade and foreign direct investment (FDI), an essential tool for development financing. At
that conference, the international community reached a consensus on increasing ODA to help
countries reach the Millennium Development Goals (MDGs). However, international aid has
fallen short of expectations, and many countries, in particular in sub-Saharan Africa, will not
be able to meet the goal of halving extreme poverty by 2015.
Since 2002, remittances flows, which were barely mentioned in the Monterrey Consensus,
have grown substantially; reportedly they now outpace public aid flows. The World Bank
estimates that remittances are more than double official aid received by developing countries,
reaching about US$325 billion in 2010. Increasingly, remittances are being recognized as an
additional source of financing for development. For this reason, development initiatives have
called for reducing the transfer costs of worker remittances and improving their impact on
growth and poverty reduction by unlocking opportunities to channel remittances to
productive investments.
Considering aid and remittance flows independently could be misleading. They share
common determinant factors such as income per capita in receiving countries, and are geared
to some extent toward similar development goals, for instance improving well-being in
recipient countries. This paper investigates whether, and under what circumstances,
remittances lead to lower aid dependency. A common belief is that remittances would
complement aid in fostering growth and reducing poverty. Nevertheless, there are good
reasons to believe remittances could actually lead to lower aid flows, as a country becomes
less dependent on external assistance. This paper offers an explanation. When remittances are
mostly invested in human and physical capital rather than consumed, they are likely to
improve macroeconomic performance and access to health and education, thereby reducing
aid needs. Conversely, aid flows could increase with remittances when the remittances
improve absorption capacity through human capital accumulation, and when migrants are
able to influence a host country’s aid policy.
The issues raised in this paper relate to the literature on the determinants of aid allocation
which, although large, has yet to examine how remittances can influence aid, even though
some papers focus on the relationship between foreign aid and other external financing flows,
such as FDI and migrations. The main contribution of this paper is to fill this gap by
assessing the link between remittances and aid while controlling for reserve causation and
simultaneous effects, and taking into account the different channels of transmission.
This paper is structured as follows: after a literature review of the factors determining aid
allocation, we document channels through which remittances and aid are linked and how they
shape this relationship. The following section describes the empirical analysis, including the
model and methodology, and presents the main results. The last section concludes and draws
some policy conclusions.

4
II. LITERATURE REVIEW
A. Factors Affecting Bilateral Aid Allocation
Early studies on aid investigate whether foreign aid is determined by the need of the recipient
country (by using variables such as average income per capita of the recipient country to test
whether countries with greater needs receive more aid) or by the interests of the donor
country. In the latter case, foreign aid benefits more countries that are economically and
strategically important, or those that share a similar culture and have historical ties with the
donor country.
The first studies that test the ―donor interest‖ against the ―recipient need‖ model are
McKinlay and Little (1977, 1978a, 1978b, 1979). The authors analyze the two models for
four donors (United States, France, Germany, United Kingdom) using data for 1960–1970
and find that the donor interest model performed better than the recipient need model for all
four donors. Maizels and Nissanke (1984) reach similar conclusions using total bilateral aid
per capita received by 80 developing countries for 1969–70 and 1978–80. However, it
appears that multilateral aid flows were allocated on the basis of recipient needs.
The main shortcoming of the ―recipient need/donor interest‖ approach is that the two models
are estimated separately, which may lead to model specification bias because of potential
omitted variables. To address this, some studies adopt hybrid models that take into account
both recipient need and donor interest variables, notably Levitt (1968), Wittkopf (1972),
McGillivray and Oczkowski (1991), Poe and Sirirangsi (1993), Cassen (1994), Meernik,
Krueger, and Poe (1998), Alesina and Dollar (2002), Alesina and Weder (2002), Neumayer
(2003), and Berthelemy and Tichit (2004). Their findings generally confirm the importance
in aid allocation of historical and commercial ties and of the strategic interests of donors.
Donor foreign policy goals continue to be the most important motive for giving aid. For
instance, Cassen (1994) shows that countries like Israel, Jordan, and Egypt are the largest aid
recipients in per capita terms because of their strategic importance.
Subsequent studies revisit the hybrid model by adding variables on the quality of economic
policy and institutional environment (openness, political regime, quality of institutions), on
the assumption that donors give aid to countries that can make the most efficient use of it or
countries where aid-funded projects would yield tangible outcomes. In a seminal paper,
Alesina and Dollar (2002) find that aid allocation follows political and strategic
considerations (colonial past and political alliances are significant determinants of aid
allocation) rather than responding to the economic needs or policy performance of the
recipients. The authors point out that, at the margin, changes in aid flows over time tend to
reward ―good‖ policies measured by trade openness and democratization, except for aid from
Austria, Belgium, France, and Italy.
Svensson (2000) comes up with a more moderate finding. While there is evidence that
Germany, Japan, and the United States tend to reward ―good policies,‖ he asserts that they do
not appear to reward recipients with better political and civil rights. Similarly, Neumayer
(2003) examines the allocation of aid of all 21 members of the OECD’s Development
Assistance Committee (DAC) for 1985–1997, and finds that almost all donors link a

5
country's eligibility to respect for civil and political rights, but ―at the level stage, most
donors fail to promote respect for human rights in a consistent manner and often give more
aid to countries with a poor record on either civil/political or personal integrity rights.‖
In contrast, Gates and Hoeffler (2004), using panel data for 1980–99, find evidence that
Nordic donors (Norway, Denmark, Sweden, Finland) tend to give more aid to democracies
and to recipients with a good human rights record. Particular attention has been paid to
whether corruption deters aid flows, but the evidence is rather inconclusive. Alesina and
Weder (2002) also conclude that corruption of recipient governments has no significant
effect on the amount of aid they receive; lower corruption is rewarded by higher aid only
when Australia and the Nordic countries are the donors. Svensson (2000) also fails to
demonstrate that less corrupt countries receive more foreign aid.
Some studies have addressed the population and middle-income bias that arise in the aid
allocation process. The population bias occurs when donors prefer to give aid to small and
less populous countries where the impact of foreign aid is likely to be more visible (Gillis
and others, 1992) and where the cost of buying voting compliance in the UN General
Assembly is lower. Dowling and Hiemenz (1985) provide evidence for the population bias
while Maizels and Nissanke (1984) do not, probably because donors may also want to
strengthen ties with large and potentially powerful developing countries in order to increase
their political and cultural influence. The middle-income bias posits an inverted U-shaped
relationship between income per capita in the recipient and the amount of aid it receives, on
the grounds that the absorptive capacity constraint is less binding in middle-income
countries. Dowling and Hiemenz (1985) note that middle income countries have more
economic and political weight and well-developed bureaucracies that can administer the aid
and use it more effectively are in place.
Finally, another strand of the literature has taken a normative approach of aid allocation by
analyzing how aid should be allocated and how actual aid allocation deviates from that
benchmark. To name a few, the egalitarian distribution of aid suggests that countries should
receive the same amount of aid, either on a per capita basis or as a ratio to GDP. Collier and
Dollar (2001) propose a different approach, aiming to maximize global poverty reduction,
considering that good policies enhance the effectiveness of aid in spurring growth. Amprou,
Guillaumont, and Jeanneney (2007) and Guillaumont (2008) argue that structural factors,
such as vulnerability to exogenous shocks and low level of human capital should also be
taken into account when allocating aid.
B. Remittances and Aid
How could remittances reduce aid dependency?
Improvement in human capital has been one of the main goals of foreign aid. This stems
from the belief that human capital accumulation is critical for sustainable growth and poverty
reduction. Therefore to ensure that aid effectively contributes to these goals, and reflecting
donors’ commitment to the MDGs, a substantial portion of foreign aid to developing
countries is geared toward improving school enrollment rates and health indicators. As a
result, if external aid reacts to human capital needs, we should expect countries with better

6
human capital to receive less aid, everything being equal. Indeed, given that aid to health and
education sectors accounts for the bulk of external assistance, the impact of an improvement
in access to health and education financed by private sources might have a downward effect
on aid flows—unless aid is reallocated to other sectors.
Micro evidence shows that remittances facilitate investment in human capital. Yang (2008)
finds that increased remittances due to positive migrant shocks are associated with a rise in
child schooling and education expenditure in Philippines. Calero, Bedi, and Sparrow (2009)
find similar results for Ecuador. In addition, Acosta, Fajnzylber, and Humberto (2007)
explore the development impact of remittances in a sample of 11 Latin American countries
and find that remittances increase children’s educational attainment and health, particularly
in low-income households, though results vary by country, gender, and geographical location
of households. Considering the potential positive effect of remittances on human capital
accumulation, it is likely that remittances could be negatively linked to aid flows, because
less aid flows would be needed to achieve the same level of human capital.
In addition to the human capital channel, the link between remittances and aid may also
operate through the physical capital/financial development channel (henceforth the physical
channel). When remittances are invested in physical assets rather than consumed, the impact
on the local economy would be stronger because in highly open developing economies, the
increase in consumption resulting from higher remittances could lead to higher imports with
little impact on the domestic economy. Alternatively, when remittances increase households’
savings in the formal sector, a well-functioning financial system may help direct this savings
to projects that yield the highest returns and therefore enhance growth rates. In a sample of
sub-Saharan African countries, Gupta, Patillo, and Wagh (2009) show that remittances
promote financial development
Giuliano and Ruiz-Arranz (2009) underline that remittances can even compensate for lack of
financial development because by loosening liquidity constraints, potential entrepreneurs
could use remittances whenever the financial system does not help them start productive
activities owing to lack of collateral or because of high lending costs. The authors find in a
sample of 100 developing countries that remittances promote growth in countries with less
developed financial systems by providing an alternative way to finance investment and
helping to overcome liquidity constraints. With a positive impact on private domestic
investment, financial development, and financial inclusion (see Toxopeus and Lensink,
2007), remittances could contribute to economic development, thereby lowering aid needs.2
Also, because significant inflows of remittances can directly or indirectly raise the
government revenue base in home countries, they improve the country’s ability to raise taxes
domestically and as result to rely less on foreign aid.
2 The impact of remittances on growth remains, however, heavily debated in the empirical literature with
findings ranging from a negative impact (Chami, Fullenkamp, and Jahjah, 2003) to a positive impact depending
on country’s characteristics (Giuliano and Ruiz-Arranz, 2009; Singh and others, 2011).

7
It is worth noting that a drop in aid following sustained remittance inflows may not
necessarily mean reduced aid needs, or lower aid dependency, but may reflect strategic
decisions by donors. Indeed, increasing remittance flows could have a dampening impact on
aid because they may reduce donors’ willingness to scale up aid. Because the amount of aid
is limited, donor countries may be tempted to reduce aid to high-remittance recipient
countries and use the savings to increase aid to low-remittance recipient countries. In recent
years, sluggish growth in donor countries and the resulting fiscal challenges have made many
of them unable to meet aid commitments. Given the challenge of scaling up aid, it is
becoming widely accepted that remittances can supplement aid in financing development,
with the advantage that remittances do not create debt flows and are less volatile. Donors and
receiving countries agree it is critical to ease remittance flows by lowering transaction costs
to stimulate private capital inflows to developing countries.
A first look at the data appears to contradict our main hypothesis that remittances reduce aid
dependency. Figure 1, which depicts a dual relationship between remittances and aid flows in
a sample of developing economies, suggests that on average high-remittance recipient
countries tend to receive more aid. The evidence is mixed when looking at the trend in
remittances and aid over the time for selected economies (Figure 2). We find a co-movement
between aid and remittances for some countries (for instance Benin and Botswana), and for
other countries (for instance Bangladesh and Kenya) an opposite relationship when the surge
in remittances since the 1990s has been accompanied by a decline in aid flows. This
contrasting picture could be misleading because the statistical relationship between aid and
remittances does not control for other variables influencing aid flows, country specific
effects, the various channels from remittances to aid, and endogeneity issues.
The literature offers, nevertheless, some arguments supporting a positive link between
remittances and aid flows. A rising migrant stock will result in higher remittances; but as the
migrant population grows, its ability to influence foreign aid policy in host countries may
increase, especially if it is large enough to undertake lobbying activities (the lobby channel).
Many studies highlight the role played by ethnic lobbies in foreign policy of host countries
(Levitt and de la Dehesa, 2003; Jones-Correa, 2001; Itzigsohn, 2000), and some of them find
evidence that the migrant lobby groups may influence aid policy of host countries. Milner
and Tingley (2010) argue that the percentage of Afro-Americans in a district makes the
legislator more sensitive to the needs of foreigners and thus more inclined to support foreign
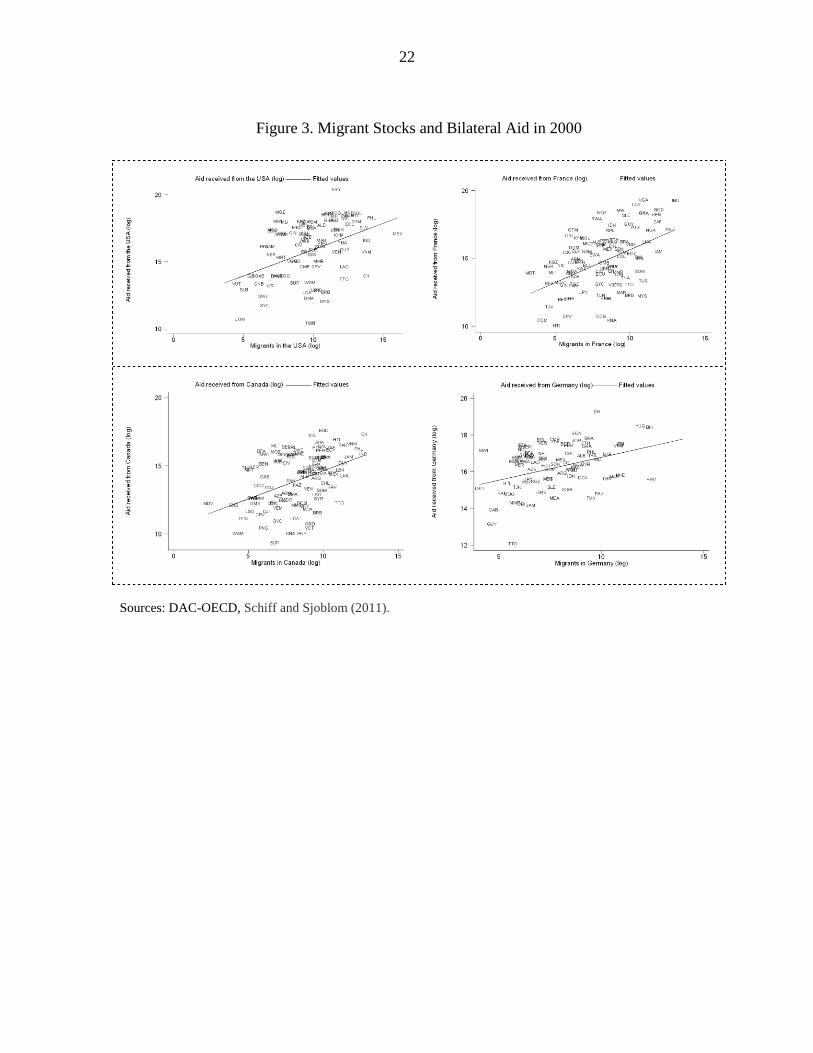
aid. Figure 3 plots the number of migrants in four donor countries (United States, France,
Canada, Germany) against bilateral aid received by their countries of origin; the correlation is
positive, suggesting that migrants might use their political voice to influence donors’ foreign
aid policy.3 The econometric analysis will provide a more rigorous framework to test this
hypothesis.
3Using a dyadic panel data set of 19 donors and 165 recipient countries from 1992- through 2005, Bermeo and
Leblang (2009) find that aid recipient countries receive more aid with more migrants living in the donor
country. But, they also argue that donor countries may use aid to decrease unwanted immigration. In that case
remittances would be negatively correlated with aid flows.

8
Remittances could also be positively associated with aid because by enhancing the home
country's absorption capacity—the lack of which has been often pointed out as a bottleneck
to aid scaling up—remittances can in fact lead to an increase in aid. Thus remittances
contribute to human capital accumulation by improving household access to education and
health care, which would reduce barriers to aid effectiveness.4 In addition, given the
tremendous requirements in the health and education sectors, a scaling up of financing in
these sectors from remittances is likely to accelerate the improvements of outcomes, and
enhance the contribution of aid, which might encourage more aid to these sectors.
To sum up, remittances could lower aid dependency through the human and physical capital
channels (Text Figure 1), but it is important to isolate these channels from donors’ incentives
to divert aid away from high remittance countries. Additionally, the lobby channel predicts
that remittances and aid would be positively linked, with high-remittance recipient countries
being more dependent on aid.
Text Figure 1. Channels of Transmission from Remittances to Aid Flows
Human capital channel
Aid
Lobby channel
Remittances
Physical capital/financial
development channel
Large migrant groups can influence aid policy in host country (+)
Better human capital development reduces aid needs (-), but higher absorption capacity means country can manage more aid flows (+)
Remittances enhance investment in education and health (+)
Remittances are positively associated with the size of migrant groups (+)
Remittances promote privateinvestment and financial development (+) ...
... leading to improvedeconomic performance and lower aid needs (-)
Source: Authors
4 This implies that through the human capital channel, remittances can have opposite effects on aid flows,
though the net effect is likely to be a reduction in aid dependency.

9
Reverse causality issue
While remittances affect aid, this relationship could go in the opposite direction as well,
raising a reserve causality issue that would need to be addressed in the empirical estimation.
Aid could negatively affect remittances flows for several reasons. Because aid aims to reduce
the income differential between the donor and the receiving country, at least at the margin,
foreign aid could reduce migration, and even per-migrant remittances.
More aid could also lead to higher remittances. Aid can stimulate remittances by increasing
income in the receiving countries, thus improving workers’ ability to cover the cost of
migration, especially in countries where migration costs are high relative to income, and
capital markets are imperfect. Moreover, aid could be used to finance public infrastructure
(roads for instance), thereby increasing business opportunities, which could result in higher
remittances if migrants invest at home for self-interested reasons.
III. EMPIRICAL ANALYSIS
A. The Model and Data
In line with previous studies, the aid model adopted in this paper takes into account both
recipient need and donor interest variables in the bilateral aid allocation process. The model
is then augmented with the remittance variable. Following Trumbull and Wall (1994), we use
panel data to control for country-specific effects to capture time-invariant variables, such as
colonial ties, strategic alliances, cultural similarity, and geographic proximity between donor
and recipient countries. The sample covers 100 developing countries receiving official
development assistance from donors (see Appendix 1), of which 23 belong to the
Development Assistance Committee (DAC). The period of study covers 1970–2005, with
data averaged over five years for 1970–1974, 1975–1979, 1980–1984, 1985–1989, 1990–
1994, 1995–2000, and six years for 2001–2005.
The baseline econometric model is as follows:
Where denotes total bilateral aid commitments by donors to country i in period t
divided by total population, the amount of multilateral aid per capita,
the level of GDP per capita, the size of the population, an indicator of political
stability and democracy compiled by the Polity IV database, the level of trade
openness, a dummy equal to one before the fall of the Berlin wall,5 the amount
of remittances as a share of GDP, a country specific effect, and the error term.
5 See Berthélemy and Tichit (2004).

10
A negative coefficient of , our main variable of interest, would mean that remittances
reduce aid dependency. But a positive coefficient would imply that remittances lead to
greater aid flows, suggesting a higher dependence on aid flows. This would also suggest that
the channels through which remittances lower aid dependency (the human and physical
capital channels) are dominated by those through which aid increases with remittances
(mainly the lobby channel). We will refine the model to test how the impact of remittances
on aid depends on each of the channels considered.
Turning to the control variables, multilateral aid is expected to be positively correlated with
bilateral aid, because in some developing countries, financial assistance from international
organizations like the International Monetary Fund (IMF) and the World Bank can be a
catalyst for bilateral aid. But because studies find that multilateral aid tends to respond to a
country’s need while bilateral aid may follow the strategic interests of donors, the correlation
between the two types of aid might not be positive. Nevertheless, controlling for GDP, which
measures the country’s need, and for country-specific effects accounting for donor interests,
should ensure that the relationship between multilateral and bilateral aid is appropriately
captured.
We expect per capita GDP to be negatively correlated with aid if donors mainly target their
aid according to recipient needs, but if bilateral aid is guided by self-interest, the coefficient
for GDP per capita could be positive. To account for the middle-income bias, the model
includes the squared per capita GDP variable. Another donor interest variable is population
size, because donors may seek to strengthen their ties with large and influent developing
countries, leading to a positive correlation between aid and population size. Following
Dowling and Heimenz (1985) and Wall (1995), the squared population variable is introduced
in the model to test the population bias effect in aid allocation. Openness to trade enhances
competitiveness and reflects a country’s commitment to sound macroeconomic policies,
which could be rewarded by higher development aid; therefore we expect the coefficient for
trade openness to be positive. Finally, the model includes an index of political stability and
democracy as an explanatory variable to assess whether respect for political and civil rights
leads to higher aid.
We use the instrumental variable fixed effects estimator to account for country-specific
effects and address endogeneity issues associated with reverse causation from per capita
GDP and remittances to aid. Consistent with previous studies, remittances are instrumented
by the lagged variable, the amount of remittances received by the entire sample minus the
amount of remittances received by the country considered (Chami and others, 2008), and the
geographical distance between the recipient and the main destination country weighted by the
income gap between them—following World Bank (2006)—. Regarding per capita GDP, we
use urban population share, population density, and the lagged per capita GDP as
instruments.

11
B. Empirical Results
The baseline model
Table 1 sets out the results regarding the determinants of bilateral aid. Contrary to our
expectations, it emerges that remittances are positively correlated with aid flows (column 1,
Table 1), suggesting that remittances worsen aid dependency. Here, we interpret an increase
in aid as a higher aid dependency because remittances would increase aid over and above the
level implied by recipient needs and donor interests, variables which the model controls for.
However, caution is needed in interpreting this result because the link between remittances
and aid operates partly through a number of channels that are difficult to measure. We
attempt to address this point in the subsequent regressions.
As for the control variables, the results support the middle income bias hypothesis. The level
of per capita GDP and its squared term are highly significant in most regressions, pointing to
an inverted-U relationship between per capita GDP and aid. The coefficient for population
size is negative and significant in columns 1 and 5 (Table 1), suggesting that donors tend to
give more aid to smaller countries; while the positive sign of the coefficient on squared
population (columns 1 and 5, Table 1) indicates that population bias may be present in
bilateral aid allocation. However the significance of the population variables is not robust
across regressions. Aid seems to reward political stability and democracy, with the
coefficient on the latter being positive and significant in all columns, but column 5 (Table 1).
The results also show that multilateral aid stimulates bilateral aid, but trade openness does
not, probably because even if aid is likely to go to countries where economic policy is trade-
friendly, trade preferences granted to developing countries can also be used as a substitute for
development aid.
Testing for the human capital, physical capital and lobby channels
As underlined in the theoretical section of this paper, we test how the relationship between
remittances and aid is altered when considering the different channels of transmission
between the two variables. Including the level of human capital, proxied by infant mortality,
leads to dramatic changes in the results (column 2, Table 1). The coefficient on remittances
turns negative when accounting for the human capital channel. Although the coefficient on
infant mortality is not significant, its interaction term with remittances has a positive and
significant coefficient, suggesting that the downward impact of remittances on aid
dependency would be stronger if the former is accompanied by an improvement in human
capital (captured by a reduction in infant mortality).
We introduce an indicator of financial development, the private credit ratio to GDP, to
account for the physical capital channel. As expected, the coefficient for the interaction term
between remittances and financial development is negative and significant, implying that
remittances reduce aid dependency in more financially developed economies (column 3,
Table 1). This suggests that as remittances are thought to favor financial development, higher
remittances are likely to reduce aid dependency more strongly. We also test an alternative
hypothesis assuming that remittances fuel domestic consumption rather than investment in

12
physical and human capital. The result in column 4 (Table 1) shows that a higher level of
consumption is associated with a higher aid dependency. Although remittances would allow
consumption smoothing, the higher the share of remittance consumed, the lower the share
invested in human and physical capital. As a result, more aid would be needed to achieve the
same target of human capital development if remittances are spent disproportionally on
consumption.
To test the lobby channel, we use the Herfindhal index of migrant concentration in the main
host countries:
Where represents the total number of migrants from country i and
corresponds to the number of migrants from country i living in country j. As expected the
coefficient of the interaction term between the index and remittances is positive and
significant (column 5, Table 1). Aid dependency increases with the size of migrant groups,
which we assume determines their ability to influence the host country's aid policy.
To ensure that a decline in aid reflects lower aid dependency rather than unfavorable
economic conditions in donor countries or weak incentives for donors to provide aid to high-
remittance countries, we include in the model the fiscal deficit of donor countries. The
intuition behind this is that pressures to cut spending in donor countries could adversely
affect aid flows or produce a shift in aid allocation away from countries experiencing
sustained remittance flows. The results support the sensitivity of aid to economic conditions
in donor countries, with the coefficient for fiscal deficit in donor countries being significant
in 3 out of 5 specifications. The previous findings regarding the human capital, physical
capital, and lobby channels remain unchanged.
Robustness tests
We use alternative indicators to capture the channels of transmission from remittances to aid.
Indeed, our main conclusions remain when primary school enrollment rate is used as a proxy
for the human capital channel, M2 as a share of GDP for the physical/financial development
channel, and the number of migrants abroad for the lobby channel (Table 3). In addition,
using lagged variables to control for endogeneity does not alter the previous findings (Table
4).
IV. CONCLUSION
This paper assesses whether remittances reduce aid dependency, and through which channels
this relationship operates. It argues that, in theory, remittances can both lower or increase aid
dependency measured by total bilateral aid flows per capita. By stimulating human and
physical capital accumulation, remittances would dampen aid dependency (what we called
the human and physical capital channels respectively), but at the same time they could
increase it by improving aid absorption capacity. In addition, countries with more
concentrated migrant groups could experience higher aid flows depending on their ability to

13
influence host countries’ aid policy (the so-called lobby channel). These hypotheses were
successfully tested in a sample of developing economies with data during 1970–2005. In
carrying out the estimations, we carefully control for the endogeneity of remittances per
capita and GDP per capita in the aid model and consider separately the channels from
remittances to aid. The results suggest that remittances, in fact, increase aid dependency,
contrary to expectations. But, by isolating the different channels, we find that, consistent with
the theoretical predictions, remittances reduce a country’s reliance on aid through the human
and physical capital channels, while the opposite holds for the lobby channel. Put differently,
remittances tend to reduce aid dependency if invested in physical and human capital rather
than consumed. These results remain unchanged even after controlling for the fiscal stance of
donor countries. Periods of fiscal tightening in donor countries coincide with declines in aid
to developing countries.
The findings of the paper point out that remittances have not so far enabled developing
countries to graduate from development aid. To do so, more needs to be done to channel
remittances toward investment in human and physical capital. Although this reflects private
decisions to some extent, macroeconomic policies to promote an investor-friendly business
environment, deeper financial development and low financial transaction costs, and
availability of health and education services can help.

14
REFERENCES
Acosta, P., Fajnzylber, P. and Humberto, J., 2007, ―The impact of remittances on poverty and
human capital: evidence from Latin American household surveys,‖ IMF Policy Research
Working Paper Series 4247 (Washington: International Monetary Fund).
Adams, R., 2009, ―The Determinants of International Remittances in Developing Countries,‖
World Development 37(1), 93–103.
Agarwal, R., and Horowitz, A. W., 2002, ―Are international remittances altruism or
insurance? Evidence from Guyana using multiple-migrant households,‖ World Development
30(11), 2033–2044.
Alesina, A., and Dollar, D., 2002, ―Who Gives Foreign Aid to Whom and Why,‖ Journal of
Economic Growth 5, 33–64.
Alesina, A., and Weder, B., 2002, ―Do Corrupt Governments Receive Less Foreign Aid?‖
American Economic Review 92(4), 1126–1137.
Ambrosio, T., 2002, Ethnic Identity Groups and U.S. Foreign Policy (Westport: Praeger
Publishers).
Amprou, J., Guillaumont, P., and Jeanneney, S. G., 2007, ―Aid Selectivity According to
Augmented Criteria,‖ The World Economy 30(5), 733–763.
Bermeo, S., and Leblang, D., 2009, ―Foreign Interests: Immigration and the Political
Economy of Foreign Aid,‖ Paper prepared for presentation at the Annual Meeting of the
International Political Economy Society, College Station, November 13–14.
Berthélemy, J. C., and Tichit, A., 2004, ―Bilateral Donors Aid Allocation Decisions: A
Three-dimensional Panel Analysis,‖ International Review of Economics and Finance 13(3),
253–274.
Bouhga-Hagbe, J., 2006, Altruism and Workers Remittances: Evidence from Selected
Countries in the Middle East and Central Asia, IMF Working paper WP/06/130
(Washington: International Monetary Fund).
Calero, C., Bedi, A., and Sparrow, R., 2009, ―Remittances, Liquidity Constraints and Human
Capital Investments in Ecuador,‖ World Development 37(6), 1143–1154.
Cassen, R., 1994, Does Aid Work? Report to an intergovernmental task force (New York:
Oxford University Press).
Chami, R., and Fisher, J. H., 1996, "Altruism, Matching, and Nonmarket Insurance,‖
Economic Inquiry 34, 630–647.

15
Chami, R., Fullenkamp, C., and Jahjah, S., 2003, ―Are Immigrant Remittance Flows a Source
of Capital for Development?‖ IMF Working Paper 03/189 (Washington: International
Monetary Fund).
Chami, R., Barajas, A., Cosimano, T., Fullenkamp, C., Gapen, M., and Montiel, P., 2008,
―Macroeconomic Consequences of Remittances,‖ Technical Report, IMF Occasional Paper
No. 259 (Washington: International Monetary Fund).
Chauvet, L., and Mesplé-Somps, S., 2007, « L'aide publique au développement et les
investissements directs étrangers en Afrique sont-ils complémentaires? », Revue Tiers Monde
(192), 815–831.
Collier, P., and Dollar, D., 2001, ―Can the World Cut Poverty in Half? How Policy Reform
and Effective Aid Can Meet International Development Goals,‖ World Development 29(11),
1787–1802.
Cox, D., Eser, Z., and Jimenez, E., 1998, ―Motives for Private Transfers over the Life Cycle:
an Analytical Framework and Evidence for Peru,‖ Journal of Development Economics 55.
Dowling, J., and Hiemenz, U., 1985, ―Biases in the Allocation of Foreign Aid: Some New
Evidence,‖ World Development 13(4), 535–541.
El-Sakka, M., and McNabb, R., 1999, ―The Macroeconomic Determinants of Migrant
Remittances,‖ World Development 27(8), 1493–1502.
Elbadawi, I., and de Rezende Rocha, R., 1992, ―Determinants of Expatriate Workers
Remittances in North Africa and Europe,‖ World Bank Policy Research Working Paper 1038
(Washington: World Bank).
Faini, R., 1994, ―Workers’ Remittances and the Real Exchange Rate,‖ Journal of Population
Economics 72(2), 235–245.
Freund, C., and Spatafora, N., 2005, ―Remittances, Transaction Costs, Determinants, and
Informal Flows,‖ World Bank Policy Research Working Paper 3704 (Washington: World
Bank).
Funkhouser, E., 1995, ―Remittances from International Migration: A Comparison of El
Salvador and Nicaragua,‖ The Review of Economics and Statistics 77(1), 137.
Gang, I. N., and Lehman, J. A., 1990, ―New Directions or Not: US Aid in Latin America,‖
World Development 18(5), 723–732.
Gates, S., and Hoeffler, A., 2004, ―Global Aid Allocation: Are Nordic Donors Different?‖
CSAE Working Paper No. 2004–34 (Oxford: Centre for the Study of African Economies).

16
Gaytan-Fregoso, H., and Lahiri, S., 2000, ―Foreign Aid and Illegal Immigration', Journal of
Development Economics 63, 515–527.
Gillis, M., Perkins, D. H., Roemer, M., and Snodgrass, D. R., 1992, Economics of
Development (New York: W. W. Norton and Company).
Giuliano, P., and Ruiz-Arranz, M., 2009, ―Remittances, financial development, and growth,‖
Journal of Development Economics 90(1), 144–152.
Guillaumont, P., 2008, ―Adapting Aid Allocation Criteria to Development Goals,‖ CERDI
Working Paper 200810 (Clermont-Ferrand: Centre of Studies and Research on International
Development).
Guillaumont, P., and Laajaj, R., 2006, ―When Instability Increases the Effectiveness of Aid
Projects,‖ World Bank Policy Research Working Paper 4034 (Washington: World Bank).
Gupta, S., Patillo, C., and Wagh, S., 2009, ―Effect of Remittances on Poverty and Financial
Development in Sub-Saharan Africa,‖ World Development 37(1), 104–115.
Hysenbegasi, A., and Pozo, S., 2002, ―What Prompts Worker to Remit? Evidence Using a
Panel of Latin Amerian and Carribean Nations,‖ WMU Working Paper (Kalamazoo: Western
Michigan University)
Ilahi, N., and Jafarey, S., 1999, ―Guestworker Migration, Remittances and the Extended
Family: Evidence from Pakistan,‖ Journal of Development Economics 58, 485–512.
Itzigsohn, J., 2000, ―Immigration and the Boundaries of Citizenship: The Institutions of
Immigrants' Political Transnationalism,‖ International Migration Review 34(4), 1126–54.
Jones-Correa, M., ed., 2001, Governing American Cities: Inter-Ethnic Coalitions,
Competition, and Conflict (New York: Russell Sage Foundation).
Kapur, D., and McHale, J., 2005, Give Us Your Best and Brightest: The Global Hunt for
Talent and Its Impact on the Developing World (Washington: Center for Global
Development and Brookings Institution).
Levitt, M. S., 1968, ―The Allocation of Aid in Practice,‖ Manchester School of Economics
and Social Studies 36(2), 131–147.
Levitt, P., and de la Dehesa, R., 2003, ―Transnational Migration and the Redefinition of the
State: Variations and Explanations,‖ Ethnics and Racial Studies 26(4), 587–611.
Lopez, R., and Schiff, M., 1998, ―Migration and Skill Composition of the Labour Force: the
Impact of Trade Liberalization in LDCs,‖ Canadian Journal of Economics 31, 318–336.
Lueth, E., and Ruiz-Arranz, M., 2007, ―A Gravity Model or Workers Remittances,‖ IMF

17
Working Paper 06/290 (Washington: International Monetary Fund).
Maizels, A., and Nissanke, M., 1984, ―Motivations for Aid to Developing Countries,‖ World
Development 12(9), 879–900.
McGillivray, M., 2003, ―Modelling Aid Allocation: Issues, Approach and Results,‖ Journal
of Economic Development 28(1), 171–188.
McGillivray, M., and Oczkowski, E., 1991, ―Modelling the Allocation of Australian Bilateral
Aid: A Two-part Sample Selection Approach,‖ Economic Record 67(197), 147–152.
McKinlay, R., and Little, R., 1977, ―A Foreign Policy of US Bilateral Aid Allocation,‖
World Politics 30, 58–86.
McKinlay, R., and Little, R., 1978a, ―A Foreign Policy Model of the Distribution of British
Bilateral Aid 1960–70,‖ British Journal of Political Science 8(3), 313–332.
McKinlay, R., and Little, R., 1978b, ―The French Aid Relationship: A Foreign Policy Model
of the Distribution of French Bilateral Aid, 1964–1970,‖ Development and Change 9, 459–
478.
McKinlay, R., and Little, R.. 1979, ―The U.S. Aid Relationship: A Test of the Recipient
Need and Donor Interest Models,‖ Political Studies 27(2), 236–250.
Meernick, J., Krueger, E. L., and Poe, S. C., 1998, ―Testing Models of US Foreign Policy:
Foreign Aid during and after the Cold War,‖ The Journal of Politics 60(1), 6–85.
Milner, H., and Tingley, D., 2010, ―The Political Economy of U.S. Foreign Aid: American
Legislators and the Domestic Politics of Aid,‖ Economics and Politics, Forthcoming.
Mishra, P., 2005, ―Macroeconomic Impact of Remittances in the Caribbean,‖ Unpublished
paper (Washington: International Monetary Fund).
Neumayer, E., 2003, ―Do Human Rights Matter in Bilateral Aid Allocation? A Quantitative
Analysis of 21 Donor Countries,‖ Social Science Quaterly 84(3), 650–66.
Poe, S. C., and Sirirangsi, R., 1993, ―Human Rights and U.S. Economic Aid to Africa,‖
International Interactions 18(4), 309–322.
Poirine, B., 1997, ―A Theory of Remittances as an Implicit Family Loan Arrangement,‖
World Development 25(5), 589–611.
Quartey, P., and Blankson, T., 2005, ―Do Migrant Remittances Reduce the Impact of Macro-
volatility on Poor Households in Ghana,‖ Final report submitted to the Global Development
Network (Washington: International Monetary Fund).

18
Schrieder, G., and Knerr, B,, 2000, ―Labour Migration as a Social Security Mechanism for
Smallholder Households in Sub-Saharan Africa: The Case of Cameroon,‖ Oxford
Development Studies 28(2), 223–236.
Schiff, M., and Sjoblom, M. C., 2011, ―Panel Data on International Migration (PDIM) 1975-
2000‖ (Washington: World Bank).
Schrooten, M., 2005, ―Bringing Home the Money: What Determines Worker's Remittances
to Transition Countries?‖ Hitotsubashi University, Discussion Paper Series (Tokyo: Institute
of Economic Research).
Singh, R. J., Haacker, M., Lee, K., and Le Goff, M., 2011, ―Determinants and
Macroeconomic Impact of Remittances in Sub-Saharan Africa,‖ Journal of African
Economies 20(2), 312–340.
Spatafora, N., 2005, ―Two current issues facing developing countries,‖ in World Economic
Outlook 2005 (Washington: International Monetary Fund).
Stark, O., and Levhari, D., 1982, ―On Migration and Risk in Less Developed Countries,‖
Economic Development and Cultural Change 31, 191–196.
Stark, O., and Lucas, R., 1988, ―Migration, Remittances and the Family,‖ Economic
Development and Cultural Change 36(3), 465–81.
Svensson, J., 2000, ―Why Conditional Aid Does Not Work and What Can Be Done about
It?‖ Journal of Development Economics 70(2), 381–402.
Swamy, G., 1981, ―International Migrant Workers’ Remittances: Issues and Prospects,‖
World Bank Working Paper No. 481 (Washington: World Bank).
Toxopeus, H. S., and Lensink, R., 2007, ―Remittances and Financial Inclusion in
Development,‖ UNU-WIDER Research Working Paper (Helsinki: World Institute for
Development Economic Research).
Trumbull, W., and Wall, H.J., 1994, ―Estimating Aid-Allocation Criteria with Panel Data,‖
The Economic Journal 104, 876–892.
Wall, H.J., 1995, ―The Allocation of Development Assistance,‖ Journal of Policy Modeling
17, 307–314.
Wittkopf, E., 1972, Western Bilateral Aid Allocation: A Comparative Study of Recipient
State Attitudes and Aid Received (Beverly Hills, CA: Sage Publications).
World Bank, 2006, ―The Development Impact of Workers’ Remittances in Latin America,‖
Vol. 2: Detailed Findings, Report No. 37026 (Washington: World Bank).
Yang, D., 2008, ―International Migration, Remittances and Household Investment: Evidence

19
from Philippine Migrants' Exchange Rate Shocks,‖ Economic Journal 118(528), 591–630.
Yang, D., and Choi, H., 2007, ―Are Remittances Insurance? Evidence from Rainfall Shocks
in the Philippines,‖ World Bank Economic Review 21(2), 219–248.

20
Figure 1. Remittances and Aid, 1975–2005
ALB
DZAAGO
ARG
ARM
AZE
BGD
BRB
BLR
BLZ
BEN
BOLBIH
BWA
BRA
BFA
KHM
CMR
CPV
CAF
TCD
CHL
CHN
COL
COMCOGCRI
CIV
HRV
DJI DMA
DOMECU
EGYSLVGNQ
ERI
ETH
FJI
GAB
GMB
GEO
GHA
GRD
GTMGNB
GIN GUY
HTI
HND
IND
IDN
IRN
JAMJOR
KAZ
KEN
KIR
KGZ
LAOLBN
LSO
LBY
MKDMDGMWI MYS
MDV
MLI
MRTMUS
MEX
MDA
MNGMAR
MOZNAM
NPL
NIC
NER
NGA
OMN PAK
PAN
PNG
PRYPER PHL
RWA
WSMSTP
SEN
SER
SYC
SLE
SLB
SOM
ZAF
LKA
KNALCA
VCT
SDN
SUR
SWZ
SYR
TJK
TZA
THA
TGO
TON
TTO
TUN
TUR
TKM
UGA
UKR
URY
VUT
VEN
VNM
YEM
ZWE
46
810
12
14
-4 -2 0 2 4Remittances/GDP (log)
Bilateral aid per capita (log) Fitted values
Sources: DAC-OECD, IMF.

21
Figure 2. Trends in Remittances and ODA for Selected Countries, 1975–2005
Sources: DAC-OECD, IMF.
22
Figure 3. Migrant Stocks and Bilateral Aid in 2000
Sources: DAC-OECD, Schiff and Sjoblom (2011).

23
Table 1. Remittances and Aid: the Baseline Model
Variables Log (BILAID)
(1) (2) (3) (4) (5)
Log (GDP)
2.762***
(3.06)
3.521***
(3.04)
9.585***
(2.85)
5.842***
(3.02)
-8.323**
(-2.10)
(Log GDP)2
-0.105***
(-3.09)
-0.124***
(-2.82)
-0.748***
(-3.14)
-0.434
(-3.01)
0.541**
(2.01)
Log (MULTIAID)
0.358***
(6.20)
0.350***
(4.56)
0.334***
(4.39)
0.313***
(4.95)
0.387***
(6.50)
Log (POP)
-4.045**
(-2.05)
-0.471
(-0.17)
-2.658
(-0.91)
-1.898
(-0.87)
-7.530***
(-2.63)
(Log POP)2
0.119*
(1.91)
0.0005
(0.01)
0.073
(0.81)
0.049
(0.71)
0.243***
(2.65)
OPEN 0.003
(1.34)
0.0009
(0.26)
0.004
(1.14)
0.003
(1.35)
0.003
(1.01)
POL
0.016*
(1.72)
0.026**
(2.25)
0.028**
(2.04)
0.017*
(1.71)
0.003
(0.28)
WALL
0.149
(1.44)
0.027
(0.21)
0.037
(0.28)
0.072
(0.64)
0.189
(1.47)
REM
0.016**
(2.03)
-0.150**
(-2.01)
0.087**
(2.14)
-0.530**
(-2.39)
-0.009
(-0.41)
HEALTH -0.005
(-0.79)
REM*HEALTH 0.001**
(2.24)
CREDIT 2.113***
(3.07)
REM*CREDIT -0.386*
(-1.81)
CONSO -0.466
(-1.10)
REM*CONSO 0.110**
(2.46)
LOBBY 0.110
(0.88)
REM*LOBBY 0.058*
(1.92)
Constant
22.383
(1.22)
-14.421
(-0.57)
-4.939
(-0.16)
2.559
(0.13)
90.002***
(2.72)
Observations 300 296 261 289 300
Number of countries 90 90 79 88 90
R2
0.37 0.43 0.40 0.49 0.10
Hansen p-value 0.140 0.388 0.728 0.346 0.127

24
Table 2. Remittances and Aid: Controlling for Fiscal Deficits in Donor Countries
Variables Log (BILAID)
(1) (2) (3) (4) (5)
Log (GDP)
3.014***
(3.37)
3.649***
(3.24)
9.290***
(2.98)
5.999***
(3.15)
-7.926**
(-1.96)
(Log GDP)2
-0.114***
(-3.39)
-0.130***
(-3.04)
-0.729***
(-3.20)
-0.445***
(-3.12)
0.515*
(1.87)
Log (MULTIAID)
0.336***
(5.88)
0.332***
(4.52)
0.316***
(4.35)
0.302***
(4.86)
0.379***
(6.34)
Log (POP)
-4.301**
(-2.22)
-0.642
(-0.24)
-3.239
(-1.18)
-2.150
(-1.00)
-7.409**
(-2.57)
(Log POP)2
0.138**
(2.25)
0.007
(0.08)
0.101
(1.19)
0.065
(0.95)
0.242***
(2.64)
OPEN 0.003
(1.20)
0.001
(0.35)
0.003
(1.10)
0.003
(1.17)
0.003
(0.88)
POL
0.016*
(1.82)
0.026**
(2.36)
0.027**
(2.12)
0.017*
(1.79)
0.004
(0.34)
WALL
0.187*
(1.82)
0.054
(0.42)
0.072
(0.57)
0.102
(0.91)
0.199
(1.53)
DEFICIT -0.016***
(-3.06)
-0.007
(-1.14)
-0.014**
(-2.32)
-0.011**
(-2.05)
-0.006
(-0.98)
REM
0.014*
(1.85)
-0.140**
(-2.29)
0.076**
(2.09)
-0.495**
(-2.24)
-0.012
(-0.51)
HEALTH -0.006
(-1.01)
REM*HEALTH 0.001***
(2.58)
CREDIT 1.967***
(3.14)
REM*CREDIT -0.329*
(-1.72)
CONSO -0.514
(-1.23)
REM*CONSO 0.103**
(2.32)
LOBBY 0.087
(0.68)
REM*LOBBY 0.063**
(2.04)
Constant
19.707
(1.09)
-14.093
(-0.59)
-1.938
(-0.07)
1.936
(0.10)
86.709**
(2.57)
Observations 300 296 261 289 300
Number of countries 90 90 79 88 90
R2
0.39 0.41 0.29 0.35 0.10
Hansen p-value 0.211 0.544 0.578 0.216 0.139

25
Table 3. Alternative Indicators for the Channels of Transmission from Remittances to Aid
Log (BILAID)
(1) (2) (3)
Log (GDP)
12.637***
(3.76)
6.125***
(3.02)
-6.026*
(-1.83)
(Log GDP)2
-0.989***
(-3.96)
-0.470***
(-3.06)
0.378*
(1.65)
Log (MULTIAID)
0.259***
(2.65)
0.377***
(5.76)
0.394***
(5.47)
Log (POP)
-6.055*
(-1.92)
-3.503
(-1.53)
-7.828***
(-2.93)
(Log POP)2
0.183*
(1.79)
0.097
(1.34)
0.227***
(2.67)
OPEN 0.002
(0.66)
0.004*
(1.65)
0.006**
(2.05)
POL
0.008
(0.56)
0.013
(1.21)
0.008
(0.74)
WALL
-0.100
(-0.58)
0.110
(0.92)
0.208*
(1.76)
REM
0.344**
(2.30)
0.071***
(2.74)
-0.071**
(-2.33)
SCHOOLING 0.011
(1.10)
REM*SCHOOLING -0.004**
(-2.19)
M2/GDP 0.011**
(2.41)
REM*M2/GDP -0.002**
(-2.37)
Log MIG 0.415***
(2.75)
REM*Log MIG 0.010***
(2.94)
Constant
11.737
(0.42)
12.806
(0.61)
87.065***
(3.02)
Observations 219 296 298
Number of countries 81 90 89
R2
0.19 0.51 0.21
Hansen p-value 0.76 0.47 0.18
26
Table 4. Remittances and Aid: Using Lagged Variables to Control for Endogeneity
Log (BILAID)
(1) (2) (3) (4) (5) (6)
Log (GDP) (lagged)
1.056
(1.60)
6.435***
(3.27)
2.601
(1.72)
2.829**
(2.15)
2.781**
(2.09) 3.398**
(2.46) (Log GDP)2 (lagged)
-0.047**
(-2.00)
-0.509***
(-3.55)
-0.242**
(-2.19)
-0.237***
(-2.48)
-0.244**
(-2.52) -0.289***
(-2.87) Log (MULTIAID) (lagged)
-0.023
(-0.53)
0.061
(0.87)
-0.050
(-0.86)
0.031
(0.72)
-0.005
(-0.12) -0.016
(-0.36) Log (POP)
-3.800**
(-2.25)
-7.318***
(-3.12)
-5.151***
(-2.85)
-3.401**
(-2.00)
-5.644***
(-3.10) -4.197**
(-2.28) (Log POP)2
0.076
(1.43)
0.186**
(2.49)
0.132**
(2.35)
0.074
(1.38)
0.139**
(2.42) 0.094*
(1.65) OPEN 0.003*
(1.67)
0.001
(0.53)
0.001
(0.34)
0.004*
(1.93)
0.003
(1.39) 0.003
(1.46) POL
0.018**
(2.35)
0.022**
(2.16)
0.021**
(2.39)
0.018**
(2.24)
0.020**
(2.52) 0.020**
(2.58) WALL
0.007
(0.08)
-0.080
(-0.70)
0.064
(0.68)
0.013
(0.15)
-0.031
(-0.35) -0.044
(-0.48) REM (lagged)
-0.042*
(-1.90)
0.161***
(3.38)
0.034**
(2.23)
-0.192**
(-2.19)
0.022**
(2.17) 0.091***
(3.56) Health -0.004**
(-2.38)
REM*Health 0.001***
(2.77)
Schooling 0.009
(1.57)
REM*Schooling -0.002***
(-3.04)
Credit 0.994***
(3.11)
REM*Credit -0.104*
(-1.65)
Conso 0.085
(0.26)
REM*Conso 0.041**
(2.34)
Lobby (lagged)
0.191***
(2.97)
REM*Lobby 0.034***
(3.24)
Log MIG (lagged)
0.015
(0.16) REM*Log MIG 0.011**
(3.28) Constant
38.814**
(2.50)
51.181**
(2.44)
44.564***
(2.64)
29.462*
(1.88)
49.584***
(2.96) 36.008**
(2.10) Observations 367 227 324 356 356 352 Number of countries 100 83 88 97 100 99 R2 0.42 0.50 0.46 0.47 0.40 0.45
27
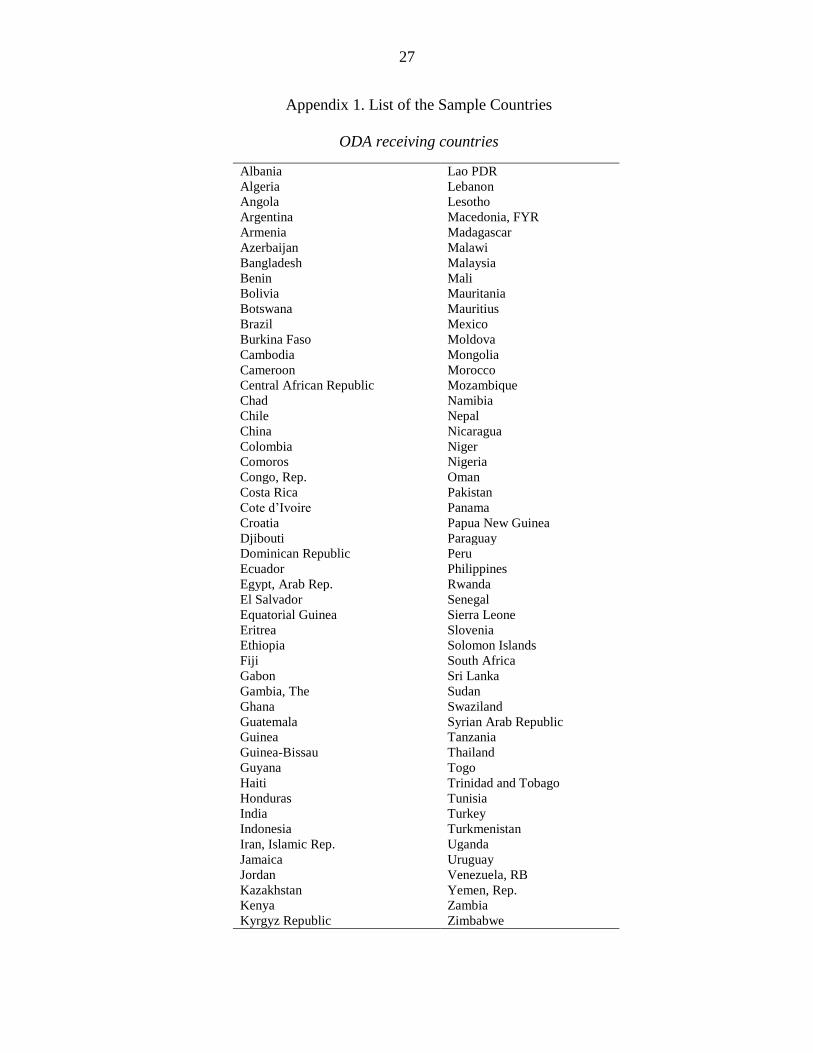
Appendix 1. List of the Sample Countries
ODA receiving countries
Albania Lao PDR
Algeria Lebanon
Angola Lesotho
Argentina Macedonia, FYR
Armenia Madagascar
Azerbaijan Malawi
Bangladesh Malaysia
Benin Mali
Bolivia Mauritania
Botswana Mauritius
Brazil Mexico
Burkina Faso Moldova
Cambodia Mongolia
Cameroon Morocco
Central African Republic Mozambique
Chad Namibia
Chile Nepal
China Nicaragua
Colombia Niger
Comoros Nigeria
Congo, Rep. Oman
Costa Rica Pakistan
Cote d’Ivoire Panama
Croatia Papua New Guinea
Djibouti Paraguay
Dominican Republic Peru
Ecuador Philippines
Egypt, Arab Rep. Rwanda
El Salvador Senegal
Equatorial Guinea Sierra Leone
Eritrea Slovenia
Ethiopia Solomon Islands
Fiji South Africa
Gabon Sri Lanka
Gambia, The Sudan
Ghana Swaziland
Guatemala Syrian Arab Republic
Guinea Tanzania
Guinea-Bissau Thailand
Guyana Togo
Haiti Trinidad and Tobago
Honduras Tunisia
India Turkey
Indonesia Turkmenistan
Iran, Islamic Rep. Uganda
Jamaica Uruguay
Jordan Venezuela, RB
Kazakhstan Yemen, Rep.
Kenya Zambia
Kyrgyz Republic Zimbabwe

28
ODA sending countries
Australia Korea
Austria Luxembourg
Belgium Netherlands
Canada New Zealand
Denmark Norway
Finland Portugal
France Spain
Germany Sweden
Greece
Ireland
Switzerland
United Kingdom
Italy
Japan
United States
Others (non DAC countries)

29
Appendix 2. Variable Definitions and Sources
Variables Definitions Sources
Dependent and
explanatory variables
BILAID Per capita total ODA commitment by DAC
and on DAC countries (constant US$ 2000)
DAC-OECD
MULTIAID Per capita total ODA commitment by
multilateral organizations (constant US$
2000)
DAC-OECD
GDP Per capita GDP of the recipient (constant
US$ 2000)
World Development Indicators 2009,
and International Financial Statistics
POP Population of the recipient country World Development Indicators 2009
POL Indicator of political stability and democracy Polity2 of Polity IV database
OPEN Exports+Imports (in percent of GDP) World Development Indicators 2009
REM Amount of remittances received (in percent
of GDP)
International Monetary Fund
MIG Stock of migrants in the six key receiving
countries in the OECD: Australia, Canada,
France, Germany, the UK, and the US
Maurice Schiff and Mirja Channa
Sjoblom. Panel Data on International
Migration (PDIM) 1975-2000, 2011
(http://go.worldbank.org/4IJSEHH7P0)
Credit Credit to private sector over GDP International Financial Statistics
M2/GDP Money and quasi money as percentage of
GDP
International Financial Statistics
Schooling Primary school enrollment rate World Development Indicators 2009
Consumption Household final consumption expenditure per
capita (constant 2000 US$)
World Development Indicators 2009
Instruments
∆REM Amount of remittances received by the entire
sample minus the amount of remittances
received by the country considered
Chami and others (2008)
∆GDP/DIST Per capita income gap between i and j,
weighted by the geographical distance
separating them
Spatafora (2005), CEPII and authors’
calculations
DENSITY Number of people per square kilometer World Development Indicators 2009
URBAN Percentage of the population living in urban
areas
World Development Indicators 2009

30
Appendix 3. Correlation Matrix
BILAID MULTIAID REM GDP POP POL OPEN WALL DEFICIT INF. MORT. CONS. CREDIT LOBBY
BILAID 1.00
MULTIAID 0.61* 1.00
REM 0.18* 0.26* 1.00
GDP -0.21* -0.28* -0.12* 1.00
POP -0.24* -0.22* -0.08 -0.08 1.00
POL 0.03 -0.10* -0.06 0.27* 0.01 1.00
OPEN 0.34* 0.35* 0.28* 0.11* -0.23* 0.02 1.00
WALL 0.13* 0.05 -0.02 -0.06 -0.02 -0.30* -0.15* 1.00
DEFICIT -0.08* -0.01 -0.01 0.02 -0.02 0.22* 0.22* -0.46* 1.00
INFANT MORTALITY 0.02 0.24* -0.05 -0.58* -0.04 -0.38* -0.38* 0.21* -0.17* 1.00
CONSUMPTION 0.09 0.27* 0.51* -0.43* -0.18* -0.04 -0.04 -0.01 -0.02 0.40* 1.00
CREDIT 0.009 -0.14* -0.04 0.32* 0.01 0.15* 0.15* 0.04 0.02 -0.42* -0.37* 1.00
LOBBY 0.21* -0.28* -0.05 0.09* 0.42* 0.11* 0.11* 0.08 -0.09* 0.11* -0.16* 0.06 1.00
Note: *significant at least at 10%

31
Appendix 4. Descriptive Statistics
Obs Mean Std. Dev. Min Max
BILAID 371 35424.7 33614.8 491.9 222563.6
MULTIAID 371 18949.5 19897 28.8 142711.2
REM 371 3.3 8.4 0 8.4
GDP 371 1396.9 1595.2 107.9 8538.5
POP 371 4.83e+07 1.63e+08 402727.9 1.28e+09
POL 371 10.7 6.5 0 20
OPEN 371 70.4 38.0 12.7 224.2
WALL 371 0.361 0.480 0 1
DEFICIT 371 -14.338 7.018 -35.4 4.4
INFANT MORTALITY 367 105.7 70.7 7.8 320
CONSUMPTION 356 71.1 14.4 26.2 148.7
CREDIT 324 0.2 0.22 0.02 1.4
LOBBY 356 1.1 2.1 0.001 16.2