Do organic livestock differ from low input? Beef cattle, Southern Europe
18
Provisional chapter Do Organic Livestock Farms Differ From Low-Input Conventional Ones? Insights Based on Beef Cattle in Southern Europe Alfredo J. Escribano, Paula Gaspar, Francisco J. Mesías and Miguel Escribano Additional information is available at the end of the chapter Abstract The objective of this study is to determine whether there are clear differences between conventional (but low-input) and organic beef cattle farms located in the Southwest of Spain. Thirty-three conventional and 30 organic farms were compared in terms of structure, technical management, and performance. The results showed that organic farms (‘All Organic’) mainly focus on the production of calves at weaning age, which are fattened in conventional holdings (‘Organic 1’; n = 22). The remaining organic farms (‘Organic 2’; n = 11) showed to participate in almost all stages of the agri-value chain. ‘Conventional’ farms were mainly dedicated to producing calves at weaning age (similarly to Organic 1). Organic 1 had the smallest herd size (80.18 livestock units (LU), p < 0.05). Organic 2 showed greater presence of indigenous breeds (62.08%, p < 0.05). Conventional farms proved to bear higher feed and veterinary costs per area (161.59 and 17.87 €/ha; p < 0.01 and p < 0.05, respectively), but Organic 2 had higher feed costs per LU. Therefore, Conventional and All Organic were quite similar, and differences depended mainly on farm structure. Hence, being either conventional or organic does not seem to be a valid criterion for drawing conclusions regarding the benefits or characteristics of each system. Keywords: semiarid, production systems, sustainability, sustainable agriculture, med‐ iterranean, drylands © 2016 The Author(s). Licensee InTech. This chapter is distributed under the terms of the Creative Commons Attribution License (http://creativecommons.org/licenses/by/3.0), which permits unrestricted use, distribution, and reproduction in any medium, provided the original work is properly cited.
-
Upload
alfredo-j-escribano -
Category
Food
-
view
38 -
download
0
Transcript of Do organic livestock differ from low input? Beef cattle, Southern Europe

Provisional chapter
Do Organic Livestock Farms Differ From Low-InputConventional Ones? Insights Based on Beef Cattle inSouthern Europe
Alfredo J. Escribano, Paula Gaspar,Francisco J. Mesías and Miguel Escribano
Additional information is available at the end of the chapter
Abstract
The objective of this study is to determine whether there are clear differences betweenconventional (but low-input) and organic beef cattle farms located in the Southwest ofSpain. Thirty-three conventional and 30 organic farms were compared in terms ofstructure, technical management, and performance. The results showed that organicfarms (‘All Organic’) mainly focus on the production of calves at weaning age, whichare fattened in conventional holdings (‘Organic 1’; n = 22). The remaining organic farms(‘Organic 2’; n = 11) showed to participate in almost all stages of the agri-value chain.‘Conventional’ farms were mainly dedicated to producing calves at weaning age(similarly to Organic 1). Organic 1 had the smallest herd size (80.18 livestock units (LU),p < 0.05). Organic 2 showed greater presence of indigenous breeds (62.08%, p < 0.05).Conventional farms proved to bear higher feed and veterinary costs per area (161.59and 17.87 €/ha; p < 0.01 and p < 0.05, respectively), but Organic 2 had higher feed costsper LU. Therefore, Conventional and All Organic were quite similar, and differencesdepended mainly on farm structure. Hence, being either conventional or organic doesnot seem to be a valid criterion for drawing conclusions regarding the benefits orcharacteristics of each system.
Keywords: semiarid, production systems, sustainability, sustainable agriculture, med‐iterranean, drylands
© 2016 The Author(s). Licensee InTech. This chapter is distributed under the terms of the Creative CommonsAttribution License (http://creativecommons.org/licenses/by/3.0), which permits unrestricted use, distribution,and reproduction in any medium, provided the original work is properly cited.

1. Introduction
Organic livestock farm numbers have sharply increased in recent years [1] as an adaptiveresponse for increasing farm profitability (through subsidies and price premiums). However,before implementing any production systems, an analysis of the similarities and differencesbetween both the current and the potential new farm configurations should be carried out, sinceit will provide a wider view of the chances of success after the change.
For this purpose, the methodological process of farm characterisation is essential as it allowsin-depth understanding of the operation of livestock production systems, which is key toimproving their management, economic performance and overall sustainability. Thus,Rodríguez et al. [2] stated that farm viability relies on specific management practices that aresuitable for the specific socioeconomic and environmental context of the farm, and this shouldbe based on the knowledge of the characteristics and performance of the production systems.
Subsequently, several researchers have conducted studies for characterising farms accordingto various parameters. Some authors have focused on livestock species reared on the farms.Thus, different authors [3–10] have studied and characterised beef cattle farms by means ofdescriptive and/or cluster analysis on the basis of technical, structural, economic and/or socialindicator. However, to our knowledge, there are no available studies that comparativelycharacterise organic and pasture-based or low-input conventional beef cattle farms, contex‐tualizing such analysis within the evolution of the production systems under study. Wetherefore believe that this is a particularly appropriate time to conduct the present study. Thiswould be of even more interest if the farms studied were located in complex agro-ecosystemswith great value and externalities from the socio-economic and environmental points of view.
The present study was carried out with the following aims: (i) to shed light on the gap ofknowledge existing due to the lack of studies that compare the characteristics of convention‐al and organic beef cattle farms and (ii) to find similarities and differences between organicand low-input conventional beef cattle farms. For this purpose, a characterisation (technicalmanagement, structure and economic performance) of the farms located in the ‘dehesa’ wascarried out.
2. Material and methods
2.1. Study area
The study area was the dehesa located in the region of Extremadura (Southwest of Spain). Froma climatic point of view, it enjoys annual average temperatures of 16–17°C, with mild winters(average temperature of 7.5°C) and hot and dry summers (the average mean temperature isgreater than 26°C, exceeding 40°C in the hottest months, which correspond to a Mediterraneancontinental semiarid climate. Its rainfall pattern is irregular (300–800 mm). Soils are shallow,acidic and of low fertility. Due to these characteristics, the availability of grazing resources isreduced and unstable [11–13].
Livestock Science2
2.2. Sample selection
A sample of farms in the beef cattle sector located in the dehesa of Extremadura was selected.Due to a lack of official statistics on figures and locations of dehesa farms in Extremadura, thesampling was non-probabilistic by quotas. The number of farms surveyed was 63, in line withother studies analysing livestock production systems [4, 14–17]. Apart from the number offarms, various criteria (already explained by Escribano et al. [17,18]) were used to select thefarms with the aim of obtaining an indicative sample of the various beef cattle productionsystems located in dehesas. The criteria used are summarised below:
- Predominant species and productive orientation: beef cattle.
- Herd size: over 25 adult cows, in order to differentiate between small and commercial farms.
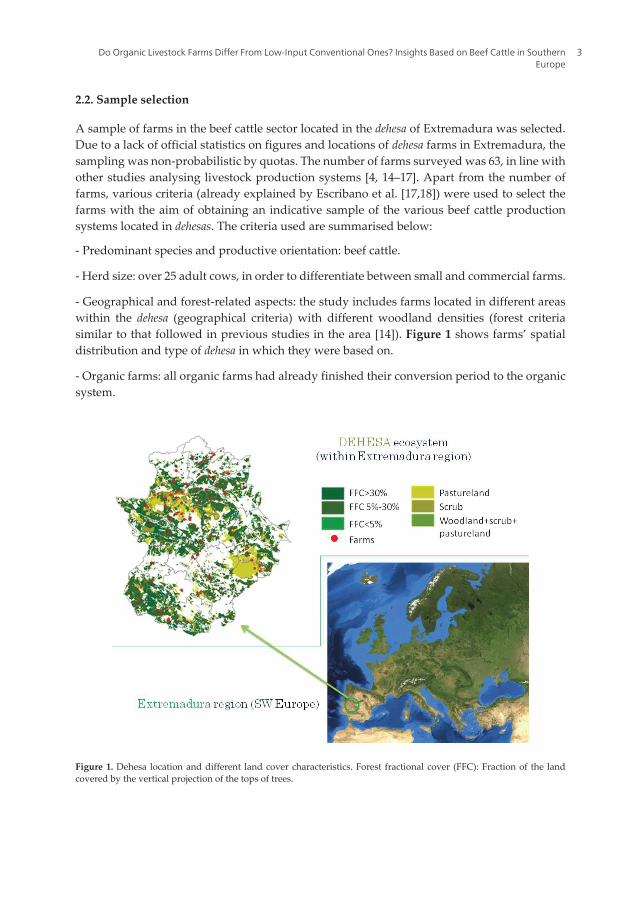
- Geographical and forest-related aspects: the study includes farms located in different areaswithin the dehesa (geographical criteria) with different woodland densities (forest criteriasimilar to that followed in previous studies in the area [14]). Figure 1 shows farms’ spatialdistribution and type of dehesa in which they were based on.
- Organic farms: all organic farms had already finished their conversion period to the organicsystem.
Figure 1. Dehesa location and different land cover characteristics. Forest fractional cover (FFC): Fraction of the landcovered by the vertical projection of the tops of trees.
Do Organic Livestock Farms Differ From Low-Input Conventional Ones? Insights Based on Beef Cattle in SouthernEurope
3
Finally, 63 farms (30 Conventional and 33 Organic farms were selected, thus achieving: asample size similar to that of other studies characterising livestock farms [4,5,10,14]; similarsample sizes of organic and conventional farms, thus allowing an adequate comparativeanalysis of both sectors.
2.3. Selection of parameters
In order to select the most appropriate indicators to analyse the farms under study, two mainsteps were followed. Firstly, the scientific literature addressing the structural and technical-economic points of view was reviewed. The selection of consistent and similar indicatorsallowed carrying out comparisons with studies on the topic. Moreover, economic parameterswere created following the economic accounts for agriculture in the community [19] and theadaptation to dehesa livestock farms already carried out in previous studies [14,15,20]. As aconsequence, the discussion of the results was consistent and the achievement of the aims ofthe present study was possible.
Finally, the selected set of indicators were confirmed to be in agreement with the recommen‐dations of Lebacq et al. [21]: relevance, representativeness of the system, measurable, value tothe end user, no ambiguity, no redundancy, and predictive.
2.4. Data collection
Data were collected from farms by means of a questionnaire in the year 2010. The questionnairewas developed according to selected indicators. These included information on structure(farms and herd characteristics: sizes, infrastructure, etc.), technical management, productionresults, economic data and social aspects. Subsequently, data were collected by the first authordirectly at the farms, followed by structured and semiclosed interviews with farm managers.Farmers’ answers were the sources of information for all indicators. All these processes werecarried out in accordance with the methodology used by several authors who analysed similaraspects of livestock farms [2,6,8,10,14,15,17,22–27].
2.5. Analysis
The statistical analyses included descriptive statistics for the full sample of farms. Subsequent‐ly, an ANOVA test was applied to all parameters, as all of them are quantitative ones. Thisallowed comparing all farms following two approaches. First, conventional farms werecompared to organic farms in order to compare the two production systems as a whole(Conventional vs. All Organic). Secondly, farms were compared based on three classificationsthat are explained in the next section: (i) Conventional farms; (ii) Organic 1 farms; (iii) Organic2 farms. This approach offered insight into each of them, so that more valuable and preciseconclusions about the organic beef cattle sector could be made. Statistical analyses wereperformed using SPSS v. 20.
Livestock Science4

3. Results
3.1. Farm types
After collecting data and creating the database, it was noted that, based on the aspects studied,organic farms could clearly be subdivided into two production systems, so it was decided thata classification of the farms selected needed to be made, with the resulting following groups:
- Conventional; found as “Conv.” in the tables (n = 30): This grouped conventional farms. Withregards to the situation of the beef cattle sector in the dehesa, these farms were mostly focusedon calf rearing (calf fattening was almost nonexistent, so these farms mainly sold their calvesat weaning age (5–6 months old and 160–220 kg of live weight; see Table 1).
Parameters Conv.
(n = 30)
Org. 1
(n = 22)
Org. 2
(n = 11)
Sig. 14 Sample
(n = 63)
SD All Organic
(n = 33)
Sig. 25
UAA1 275.80 223.72 337.84 0.378 268.44 223.34 261.76 0.806
Owned area/UAA 0.64 0.54 0.55 0.541 0.59 0.44 0.55 0.390
Wooded land/UAA 0.46 0.47 0.77 0.101 0.52 0.43 0.57 0.336
Crop area/UAA 0.00 0.00 0.00 0.576 0.00 0.01 0.00 0.334
Bovine LU2 104.92ab 74.33a 124.83b 0.016* 97.72 52.14 91.16 0.299
Ovine LU 6.78 5.36 15.37 0.496 7.78 30.38 8.69 0.805
Swine LU 0.00 0.50 0.77 0.445 0.31 1.55 0.58 0.138
Total LU 111.70ab 80.18a 140.95b 0.024* 105.80 63.33 100.44 0.485
Bovine LU/Total LU 0.98 0.96 0.92 0.452 0.96 0.13 0.85 0.369
Total stocking rate3 0.73 0.50 0.44 0.312 0.60 0.64 0.48 0.131
a, b, c Mean values with different letters in the same row are significantly different. * p<0.05, ** p<0.01, *** p<0.001. SD:standard deviation. 1UAA: Utilized Agricultural Area. 2LU: Livestock Units. 1 cow = 1 LU; 1 sheep = 0.12 LU; 1 sow = 0.37LU. 3Total Stocking rate = LU/ha UAA. 4Analysis of Variance of the groups Conventional, Organic 1 and Organic 2.5Analysis of Variance of the groups Conventional vs. All Organic.
Table 1. Herd and farm structure. Mean values, standard deviation and level of significance
- Organic 1; found as “Org. 1” in the tables (n = 22): These farms were producing under theorganic system, but none of them fattened their calves. On the contrary, they were marketedwith almost the same characteristics (age and live weight) and price as the conventional ones(check Table 1 to observe the similarity with conventional farms).
- Organic 2; found as “Org. 2” in the tables (n = 11): Organic farms that fattened and sold theircalves under the organic system.
Furthermore, organic farms were also analysed as a whole in a group called “All Organic”(n = 33).
Do Organic Livestock Farms Differ From Low-Input Conventional Ones? Insights Based on Beef Cattle in SouthernEurope
5

3.2. Farm structure and management
3.2.1. Farm and herd characteristics
The average size of farms was 268.44 ha utilized agricultural area (UAA) (Table 2). Organic 2farms were larger than ‘All Organic’, but the high variability within the sample did not allowidentifying significant differences between this group and Organic 1. With regard to herd size,All Organic farms were also similar to Conventional farms, and an important variation withinfarms was identified in relation to the mean cattle herd size (140.95 livestock units (LU) inOrganic 2 vs. 80.18 in Organic 1, p < 0.05).
Parameters Conv.(n = 30)
Org. 1(n = 22)
Org. 2(n = 11)
Sig. 16 Sample(n = 63)
SD AllOrganic(n = 33)
Sig. 27
Replacement rate (%)1 11.98 11.92 13.29 0.922 12.19 1.23 12.38 0.875
Cows/bull (N°) 31.01 30.67 28.29 0.844 30.42 1.68 29.88 0.740
Estrous synchronisation (%)2 6.70 0.00 0.00 0.321 3.20 – 0.00 0.132
Artificial insemination (%)3 6.70 4.50 0.00 0.592 4.80 – 3.00 0.658
Length of mating period (months) 10.40 10.70 10.14 0.922 10.46 0.29 10.52 0.846
Fertility rate (%)4 85.15 77.70 81.49 0.187 81.91 1.82 78.97 0.091
Age at first calving (month) 30.68 33.45 33.68 0.197 32.17 0.79 33.53 0.074
Calving interval (days)5 346.50 33500 343.64 0.165 341.98 2.74 337.88 0.117
Calves born/cow/year (N°) 0.85 0.78 0.81 0.187 0.82 0.02 0.78 0.091
Weaned calves/cow/year (N°) 0.81 0.71 0.65 0.061 0.75 0.03 0.69 0.025*
Age at weaning (months) 5.86 5.82 6.00 0.886 5.87 0.13 5.88 0.944
Live weight at calving (kg) 202.33a 190.91b 193.18ab 0.037* 196.75 2.12 191.67 0.011*
Calves sold at weaningage/cow/year (N°)
0.63a 0.66a 0.27b 0.000*** 0.58 0.03 0.53 0.000***
Fattened calves sold/cow/year (N°) 0.07a 0.00a 0.45b 0.000*** 0.11 0.03 0.15 0.000***
Fattened calves/total calves sold 0.09a 0.00a 0.64b 0.000*** 0.15 0.30 0.21 0.119
a, b, c Mean values with different letters in the same row are significantly different. * p<0.05, ** p<0.01, *** p<0.001.1Calculated as the annual average proportion of heifers bred for reproduction/number adult. 2Annual averageproportion of cows synchronized/total adult cows in the farm. 3Average annual proportion of inseminated cows/totaladult serviced cows in the farm. 4Annual average proportion of: live births/serviced cows. 5Annual average number ofdays from calving to calving in the adult cows of the farms. 6Analysis of Variance of the groups Conventional, Organic1 and Organic 2. 7Analysis of Variance of the groups Conventional vs. All Organic.
Table 2. Reproductive management and performance, and productive orientation. Mean values, standard deviationand level of significance
In relation to the various land uses and the type of ownership, it was seen that 59% of landwas in property (owned area/UAA in percentages). Fifty-two percent of UAAs had treepresence. Moreover, crop areas were almost inexistent.
Livestock Science6

3.2.2. Reproductive management and performance, and production results
Estrous synchronisation was only carried out in the 3.20% of farms held. This practice wasonly observed in conventional farms, since it is not permitted in organic farming. Accordingly,only 4.80% of farms opted for artificial insemination, with all of them also carrying out naturalmating, such that the use of either one or another technique was not exclusive. This scarce useof these reproductive techniques is typical in low-input beef cattle farms.
Calves weaned in All Organic had lower weights than those belonging to the conventionalgroup, and Organic 2 farms sold less weaned calves per cow in total, thus showing a lowerproductivity in this regard. However, Organic 2 and All Organic sold more fattened calves percow and also sold a higher proportion of fattened calves/total calves sold. These differenceswere due to the fact that the Organic 2 group was composed entirely of fattening farms, whileall Organic 1 farms solely marketed calves at the age of weaning. Similarly to the Organic 1group, 83.33% of the farms belonging to the conventional group did not carry out the fatteningof any of the calves that they produced. These facts about the composition of the groups alsoinfluenced the differences between these indicators for yearlings sold per cow and calf weightat weaning.
3.2.3. Breeds
The breed distribution of organic farms is also an important issue, as autochthonous breedsare preferable for this production model, as indicated by Regulation 834/2007 [28]. Table 3shows the composition by breed of the farms.
Parameters Conv.(n = 30)
Org. 1(n = 22)
Org. 2(n = 11)
Sig. 11 Sample(n = 63)
SD AllOrganic(n = 33)
Sig. 22
Purebred autochthonouscows (%)
20.11a 30.76ab 62.08b 0.015* 41.83 31.16 41.20 0.045*
Purebred foreign cows (%) 8.86 11.25 6.74 0.854 22.31 9.33 9.75 0.877
Purebred cows (%) 28.97a 42.01ab 68.82b 0.027* 42.85 40.48 50.95 0.041*
Purebred autochthonousbulls (%)
13.02 15.91 31.36 0.264 32.06 17.23 21.06 0.324
Purebred foreign bulls (%) 86.98 76.82 68.64 0.254 33.94 80.23 74.09 0.133
a, b Mean values with different letters in the same row are significantly different. * p<0.05. 1Analysis of Variance of thegroups Conventional, Organic 1 and Organic 2. 2Analysis of Variance of the groups Conventional vs. All Organic.
Table 3. Farm breed structure. Mean percentage values, standard deviation and level of significance
The percentage of purebred autochthonous cows reached 41.83%, with this percentage beinghigher in All Organic and Organic 2 than in the conventional group. Also, All Organic andOrganic 2 showed a higher presence of these purebred cows; either autochthonous or foreignones. The main reason for this is that Organic 2 farmers were market oriented (they had
Do Organic Livestock Farms Differ From Low-Input Conventional Ones? Insights Based on Beef Cattle in SouthernEurope
7

contracts with supermarkets) so that they knew that more productive breeds that allow themto produce carcass of better conformation, mainly Limousine.
3.3. Economic parameters
3.3.1. Analysis of fixed capital
This analysis allowed identification of similarities between organic and conventional systems(Table 4), with regard to infrastructure, land and animals. It is worth highlighting the highaverage value of land fixed capital 5489.42 €/ha that accounted for the 81% of total fixed capital(Table 5).
Parameters Conv.(n = 30)
Org. 1(n = 22)
Org. 2(n = 11)
Sig. 15 Sample(n = 63)
SD AllOrganic(n = 33)
Sig. 26
Land fixed capital1 5,630.07 5,194.52 5,695.62 0.788 5,489.42 310.43 5,361.56 0.669Buildings fixed capital2 660.75 606.48 546.10 0.935 621.78 114.32 586.35 0.748Machinery fixed capital3 215.51 138.79 107.77 0.449 169.91 35.00 128.45 0.217Livestock fixed capital4 624.81 416.66 329.10 0.217 500.49 69.69 387.47 0.089Total fixed capital 7,131.14 6,356.45 6,678.59 0.443 6,781.59 430.59 6,463.83 0.443
Note: all these indicators were measured in terms of €/ha. 1Value of the land at market prices. This depended on thequality of the plots (grazing resources, location and tree density, among other parameters). 2Value of infrastructure atmarket prices. Years of use and level of conservation/maintenance were taken into account. 3Value of machinery (cars,trucks, etc.) at market prices. Years of use and level of conservation/maintenance were taken into account. 4Value of alllivestock present at market prices. 5Analysis of Variance of the groups Conventional, Organic 1 and Organic 2.6Analysis of Variance of the groups Conventional vs. All Organic.
Table 4. Fixed capital according to farm groups.
Parameters Conv.(n = 30)
Org. 1(n = 22)
Org. 2(n = 11)
Sample(n = 63)
SD Sig. 113 AllOrganic(n = 33)
Sig. 214
Feed/ha UAA1 109.69a 17.55b 96.63ab 75.24 112.18 0.009** 43.91 0.019*
Feed/LU2 161.59a 38.27b 220.54a 128.82 165.70 0.003** 99.03 0.136
Seeds and fertilisers3 7.51 3.10 1.00 4.84 12.61 0.252 2.40 0.108
Veterinary and medicines/ha UAA4 17.87a 4.51b 4.84b 10.93 21.16 0.043* 4.62 0.012*
Veterinary and medicines /LU5 20.32a 7.45b 11.64ab 14.31 15.14 0.006** 8.84 0.002**
Maintenance of fixed capital6 15.74 18.95 22.60 18.06 22.68 0.681. 20.17 0.444
Energy7 24.24 22.44 18.27 22.57 22.84 0.765 21.05 0.584
Other expenditure8 24.32 20.87 21.88 22.69 33.67 0.934 21.20 0.717
Intermediate consumption9 199.38 87.42 165.22 154.32 177.86 0.077 113.36 0.054
Remuneration of employees10 60.29 42.48 61.24 54.24 100.69 0.799 48.73 0.653
Fixed capital consumption11 54.59 44.20 38.08 48.08 66.62 0.744 42.16 0.464
Land rented12 30.56 30.96 23.25 29.42 38.47 0.846 28.39 0.825
Livestock Science8

a, b Mean values with different letters in the same row are significantly different. * p<0.05, ** p<0.01. 1Expenditures(purchases) made in external feedstuffs/hectare of UAA (€/ha). 2Expenditures (purchases) made in externalfeedstuffs/LU (€/LU). 3Expenditure in seeds and fertilisers/hectare of UAA (€/ha). 4Expenditures made in veterinaryand medicines/ha UAA (€/ha). 5Expenditures made in veterinary and medicines /LU (€/LU). 6Expenditures made inmaintenance of fixed capital/ha of UAA (€/ha). 7Expenditures made in energy/ha UAA (petrol and electricity) (€/ha).8Expenditures/ha UAA made in farmers’ associations, lawyers, etc. (€/ha). 9Sum of the following costs (€/ha of UAA:External feedstuffs + Veterinary services and medicines + Energy + Maintenance of machinery and infrastructure +Other goods and Services (lawyers, farmers’ associations, etc.). 10Expenditures made in salaries/ha of UAA (€/ha).11Amortization of machinery and infrastructure = Sum of (((1/20 years amortization) × Value of infrastructures) + ((1/10years) × Value of machinery)). 12Cost of the land rented (€/ha). 13Analysis of Variance of the groups Conventional,Organic 1 and Organic 2. 14Analysis of Variance of the groups Conventional vs. All Organic.
Table 5. Intermediate consumption and other costs.
Parameters (€/ha) Conv.(n = 30)
Org. 1(n = 22)
Org. 2(n = 11)
Sample(n = 63)
SD Sig.6 AllOrganic(n = 33)
Sig.7
Livestock sales 291.23 151.90 215.92 229.43 223.45 0.081 173.24 0.035*
Other sales 1.49 11.34 9.75 6.37 23.05 0.276 10.81 0.110Gross output1 635.24 464.09 578.52 565.57 406.81 0.328 502.24 0.197Subsidies for livestock 158.54 153.75 185.72 161.61 118.93 0.759 164.41 0.847Total subsidies 165.70 159.91 193.85 168.59 123.39 0.752 171.22 0.861Total income 458.41 323.15 419.52 404.39 316.03 0.313 355.27 0.198Total subsidies/total income (%) 0.39 0.45 0.47 0.42 0.18 0.353 0.45 0.160Net value added2 388.43 338.63 383.35 370.15 249.94 0.769 353.53 0.584Net operating surplus3 320.98 289.98 313.99 308.94 223.74 0.886 297.98 0.687Net entrepreneurial income4 290.43 259.02 290.74 279.52 214.31 0.861 269.60 0.703Profitability rate (%)5 4.39 4.18 4.35 4.31 2.69 0.961 4.24 0.819
Note: Those parameters whose unit is not showed in the table are measured per ha of UAA ((€/ha). 1Value of all theproducts of agricultural activities. All agricultural output was recorded except that which was solely produced by unitsfor their own consumption. 2It measures the value created by all agricultural output after the consumption of fixed capital.That output is valued at basic prices and intermediate consumption is valued at purchase prices. It was calculated asfollows: (Gross output – Intermediate consumption – Amortisation) + (Those subsidies not related to livestock farming).3It measures the yield from land, capital and unpaid labour. It is the balance of the generation of income account whichindicates the distribution of income between the factors of production and the general government sector. 4Obtained byadding the interest received and then deducting rent (i.e., farm and land rents) and interest payments, measuringcompensation of unpaid labour, remuneration from land belonging to units and the yield arising from the use of capital.5Ratio between net surplus and average capital assets, estimated from the value of total fixed capital and the value ofcapital. 6Analysis of Variance of the groups Conventional, Organic 1 and Organic 2. 7Analysis of Variance of the groupsConventional vs. All Organic.
Table 6. Economic and productive performance and subsidies.
Table 6 shows the economic and productive performance of the farm groups, as well as aspectsrelated to subsidies, where the Organic 1 group can be seen to have lower livestock sales perhectare of UAA and lower gross production.
Conventional farms proved to sell more calves per hectare and year, which is due to theirshorter productive cycle and the low productivity of Organic 1. No differences were found for
Do Organic Livestock Farms Differ From Low-Input Conventional Ones? Insights Based on Beef Cattle in SouthernEurope
9

the remaining indicators, but some interesting results were found and therefore comments arenecessary. Organic farms (especially Organic 2) revealed higher numerical values for othersales, which reflect a higher level of business diversification, something that is key in the farms’flexibility and adaptability to the changing market environment. Moreover, organic farms(especially Organic 2) tended to be more dependent on subsidies.
4. Discussion
4.1. Structure
4.1.1. Farm and herd characteristics
All Organic farms were much smaller than the average farm size found by Perea et al. [10] inorganic cattle farms located in seven regions of Spain (261.76 vs. 425 ha UAA). With regard toherd size, All Organic farms were also quite similar to Conventional farms and again smallerthan the farms studied by [10], with 100.44 vs. 154 livestock units (LU).
The scarce association between land and animals continues to be an unsolved concern [6,10].Similarly, the integration of different livestock species is beneficial. In the farms analyzed, theproportion of cattle has been really high – 96%, in line with the findings of Perea et al. [9,10].This situation responds to the trend of specialisation and intensification already described[15,17,18], with increasing total stocking rates in beef cattle farms from 0.40 to 0.43 LU/ha ([6]—conventional farms; and [9,10]—organic farms) to the current 0.60 LU/ha. The higher meanvalues observed in this study came from conventional farms (0.70). Both Organic 1 and Organic2 farms complied with the regional organic rules [29] setting a maximum stocking rate allowedof 0.5 LU/ha.
4.1.2. Reproductive management and performance, and production results
No major differences were found between farm’s groups regarding the reproductive manage‐ment among groups, since most of arms followed the typical technical reproductive manage‐ment in extensive ruminants production systems located in semiarid areas, where the lowfertility rates compared to other breeds and systems. This is due to the fact that heats are notdetected by farmers, there is no heat synchronization, and natural service is the predominanttechnique used for conception. Only some organic farms showed to apply artificial insemina‐tion. Average replacement rate of the sample was close to 12%, similar to that found in dehesabeef cattle farms, either conventional: with values ranging from 10 to 12.4% in Extremadura[30–32] or organic: 10.65% in Andalusia [9]. However, values found in the study of Milán etal. [6] were higher: 19.2%. The number of cows per bull was 30.42, lower than the 38.4 foundby Milán et al. [6] and similar to the 27 found by López de Torre et al. [31] in conventionalcattle farms in the dehesas of Extremadura. The implementation of reproductive techniques,such as artificial insemination, was even lower than that found by Milán et al. [6]: 8.5 vs. 4.80%.This divergence in results is due to the fact that they analysed farms rearing autochthonouspurebred beef cattle cows. In these cases, livestock is usually registered in the Stud Book of the
Livestock Science10

breeds, and the use of artificial insemination is more widespread, with the aim of rearingoffspring of more appreciated genetic potential, and thus obtaining higher incomes throughboth selling animals as breeding animals and public subsidies.
Despite the lack of significant differences among groups, it is necessary to discuss some topicssuch as the reproductive calendar due to its importance in the context of uncertain availabilityof pastures in pasture-based systems, such as those of the Mediterranean basin. In this sense,it is recommended to avoid continuous mating and make it coincide with spring and autumn,the seasons where the availability of local feed resources allows fulfilling an importantpercentage of animals’ nutritional needs at more affordable prices, due to a lower dependenceon external feedstuff, whose prices are high and subjected to great volatility. However, alsopositive externalities can be found from this organization: reduced seasonality in marketingtheir products, thus obtaining better prices for them at certain times. Many of the farmsanalysed showed a distribution of mating throughout a year. Thus, the average duration ofmating was 10.46 months.
Calves weaned in organic farms had lower weights than those belonging to the Conventionalgroup. This could be due to the following aspects: Firstly, in some of the studies discussed,farms reared only local breeds, whose growing rates are lower. However, in the farms analysedin this study, many cows were either crossed or more efficient breeds, mainly the Limousinebreed. Secondly, increased livestock pressure led to intensification and guidance to higherproductivity which, among other adaptations, led to the inclusion of more efficient breeds.Thirdly, the rising prices of feed led to the weaning of animals at a younger age (therefore atlower weights), in order to use less feedstuff and thus reduce production costs. Finally, thenext link in the food chain prefers younger animals because of their better conversion rates infeedlots. Moreover, less time grazing is usually associated with meat tenderness and lightercolour, which is in line with butchers' preferences. Thus, Organic 2 farms were those that soldmore fattened calves per cow, and the age of weaning of these was lower. The latter was dueto the fact that calves in Organic 2 farms were weaned before starting the fattening period,which shortened the length of the production cycle at the farm level (period between weaningand sale).
The results relating to calves weaned and sold per cow clearly show how the production ofbeef cattle in Southwest Europe and in semiarid areas, such as the Mediterranean basin, ismainly focused on the sale of calves at weaning. As a result, the percentage of fattened calvessold has been reduced. This is due to both the lack of infrastructure and the traditions offinishing and slaughtering animals in the Extremadura region [33]. Currently, this fact mighthave increased due to high feed prices and low farm profitability.
The existence of organic farms without organic products (Organic 1 in the present study) hasbeen reported for more authors in dairy cattle [34], in a mixture of livestock and crop farms [35]and beef cattle [10,18]. Specifically, Perea et al. [10] reported that only 40.6% of the surveyedorganic beef cattle farms marketed calves as organically certified, and to the organic market.Thus, they also noticed that in different areas of Europe (from Norway to the Mediterraneanarea) the marketing of organic livestock is focused on the sale to conventional feedlots, and
Do Organic Livestock Farms Differ From Low-Input Conventional Ones? Insights Based on Beef Cattle in SouthernEurope
11

their organic stamp does not have market implications (there is a scarce market for theseweaned organic animals, and they are not sold at a higher price; see [27]).
4.1.3. Breeds
The use of autochthonous breeds is a contemporary issue and usually promoted in organicfarming. However, the low productivity of the rustic local cows makes it necessary to makeuse of other breeds that, despite not being autochthonous, are both well adapted to the localconditions and more productive. Thus, in the case of males, the racial distribution was main‐ly based on Limousine and Charolais breeds. This is a growing trend that responds to theneed for productivity and competitiveness that requires specialisation [36]. In the dehesas ofExtremadura, there has also been a change from Charolais towards Limousine, probablyaimed at avoiding problems related to dystocia and the ability of calves to suckle, sincefarmers perceive that these problems are more frequent when the Charolais breed of ani‐mals are reared.
4.2. Economic parameters
4.2.1. Analysis of fixed capital
No significant differences were found between the groups of farms studied.
4.2.2. Costs, production and incomes
It is important to note that expenditure on feedstuff was lower in Organic 1 than in Conven‐tional group when studied per hectare, while differences were found between Organic 1 andthe rest of groups when these expenditures were measured per livestock unit. The expendi‐ture on veterinary services and veterinary drugs were also lower in Organic 1 group bothper area of land and per livestock unit. However, these differences only were found betweenOrganic 1 and the Conventional group. All Organic group showed to also rely less on theseexternal resources (feedstuff, veterinary services and drugs). However, the expenditure onfeed per livestock unit was not statistically different between All Organic and the Conven‐tional group. In general terms, these higher reliance on external resources, and in particularfeed and veterinary services and drugs, is consistent with the organic production method,since the use of inputs such as feed must come from the farm itself (or the immediate sur‐roundings), and veterinary drugs are limited to two treatments per adult cow per year, ac‐cording to [28] and subsequent amendments.
When comparing Conventional and All Organic farms, one can observe very low feed costsin Organic 1 and very high feed costs in Organic 2 farms. This is due to the fact that Organic2 farms fattened all their calves, and Organic 1, none of theirs. This increases the organicfeedstuff purchased, whose price is high: around 30% above the conventional one.
The cost related to veterinary services and medicines shows that in extensive livestock systemsof semiarid areas and conditions it is possible to reduce reliance on drugs with no major
Livestock Science12

problems. In fact, conventional low-input farms in this area do not rely significantly on theseproducts due to low stocking rates and dry climate. Also, as the prevalence of infectiousdiseases is low, it must be mentioned that the health management of organic beef cattle farmsin this area is very similar to that carried out in Conventional farms, and it is not based onalternative medicine. In fact organic beef cattle farms also used some veterinary drugs as apreventive measure [17]. Organic 2 farms had higher veterinary costs than Organic 1 farmsdue to the fact that the transition to the fattening period usually provokes some respiratoryand/or intestinal disorders.
Regarding incomes, it is necessary to increase the market orientation of Organic 1 farms, asthey are not providing organic goods to the market, which influences their low economicresults. Conversely, the longer productive cycle in Organic 2 farms did not allow them toclearly stand out in terms of income. Finally, the dependence on agricultural subsidies mustbe addressed as it is a key point for both the organic sector and the extensive beef cattle farmsof Mediterranean Europe. The high dependence of this aspect makes it unstable and fragile.In the case of the organic sector, the contribution of the agro-environment subsidies makesthem numerically more dependent, which is in contrast with other studies, regardless whetheror not they were receiving agricultural subsidies [35,37,38].
The lower livestock sales per hectare of UAA and lower gross production in the Organic 1group can be due to the fact that farms belonging to this group only sold calves at weaningage, and their prices were lower than those of fattened calves. Despite the price of organicfattened calves (marketed by the Organic farms 2 group) being greater, income from the saleof livestock per hectare of UAA was higher in Conventional farms. This was probably due toan extension of the productive cycles in Organic 2 compared to Conventional farms which, inturn, led to a reduction in the number of calves sold per cow per year. On the other hand,organic farms (especially the Organic 1 group) had higher incomes in relation to other sales(those not related to livestock). This could be a consequence of the greater degree of diversi‐fication in organic farming over conventional.
4.2.3. Other aspects worthy of discussion: workforce, agro-environmental management and marketingstrategies
In addition, other aspects came up from the interviews with farmers during the farm visitswhich point to additional interesting aspects and open up perspectives which would beinteresting to research. In this sense, Escribano et al. [17,18] carried out a comparative sus‐tainability assessment which showed that organic farms did not carry out so many agro-ecological practices as would be desirable to increase farm environmental protection, nutrientcycling and self-sufficiency. Moreover, these authors found that in terms of workforce bothproduction systems are also very similar. Additionally, short marketing channels, which arecommonly associated with organic production, were noted to also be very similar in variousstudies [17,18,27,39,40]. Profound discussion and review about these aspects can be found inother studies [40].
Do Organic Livestock Farms Differ From Low-Input Conventional Ones? Insights Based on Beef Cattle in SouthernEurope
13

5. Conclusions and future perspectives
The present study integrated structure, technical, productive and economic parameters thatallowed for a deep understanding of the organic beef cattle farms of Southern Europe, as wellas their similarities and differences with conventional ones. Organic farms have proved to bevery similar to Conventional farms (but pasture-based or low-input). Accordingly, thedifferences were based on the structure of the farms, more than the condition of their beingorganic.
According to the results discussed, it is worth mentioning that there was little orientationtowards a different concept of farming, namely, environmental sustainability and self-sufficiency. However, the organic farm has been defined as a production system based on theprinciples of Health, Ecology, Fairness and Care. In this sense, consumers expect organicproducts to be based on these principles, and citizens support this system through taxes. Allthese aforementioned aspects shape the necessity to increase the implementation of sustainableagricultural practices, self-sufficiency and sales of organic products. Otherwise, the currentproduction systems will hinder their sustainability due to high global competition, theincreasing cost of agricultural inputs and reduced grazing resources in the Mediterranean areadue to global warming. To do so, the education level of farmers, public support and farmercooperation are essential. Moreover, further research is needed to study different productionsystems and strategies in order to improve the situation of the sector and the differentialexternalities of the organic livestock sector above the conventional one.
Acknowledgements
Research funded by project INIA-RTA2009-00122-C03-03 of the Spanish Ministry Economyand Competitiveness. The authors would also like to acknowledge the support provided byJunta de Extremadura and FEDER funds. Special thanks to the farmers, practitioners andexperts that contributed to this research. The first author also acknowledges the pre-doctoralfinancial support of the Fundación Fernando Valhondo Calaff
Author details
Alfredo J. Escribano1*, Paula Gaspar2, Francisco J. Mesías3 and Miguel Escribano4
*Address all correspondence to: [email protected]
1 C/ Rafael Alberti, Cáceres, Spain
2 Department of Animal Production and Food Science, Faculty of Agriculture, University ofExtremadura, Ctra. Cáceres s/n, Badajoz, Spain
Livestock Science14

3 Department of Economy, Faculty of Agriculture, University of Extremadura, Ctra. Cáceress/n, Badajoz, Spain
4 Department of Animal Production and Food Science, Faculty of Veterinary Sciences, Uni‐versity of Extremadura, Avda.de la Universidad s/n. Cáceres, Spain
References
[1] FiBL, IFOAM. The world of organic agriculture. Statistics & Emerging Trends2015. 2015; http://www.organic-world.net/yearbook-2015.html. Accessed 04 August2015.
[2] Rodríguez L, Bartolomé DJ, Tabernero de Paz MJ, Posado R, García JJ, Bodas R, GarridoC, Vázquez JM, Mazariegos V, Vicente M, Olmedo S. Características técnico-económ‐icas de las explotaciones de ovino lechero con reproducción asistida de Castilla y León:Sistemas y tipos de explotación. ITEA. 2013;109:201-214.
[3] Olaizola AM, Manrique E, Maza MT. Tipos de sistemas de producción y rendimientoseconómicos en las explotaciones de vacuno de montaña. ITEA Producción Animal.1995;91:47-58.
[4] Serrano EP, Lavín P, Giradles FJ, Bernués A, Ruiz A. Classification variables of cattlefarms in the mountains of León, Spain. Spanish Journal of Agricultural Research.2004;2:504–511.
[5] Serrano E, Lavín P, Giradles FJ, Bernués A, Ruiz A. The identification of homogeneousgroups of cattle farms in the mountains of León, Spain. Spanish Journal of AgriculturalResearch. 2004;2:512-523.
[6] Milán MJ, Arnalte E, Caja G. Economic profitability and typology of Ripollesa breedsheep farms in Spain. Small Ruminant Research. 2003;49:97-105.
[7] Nieto MI, Olaizola AM, Manrique E. Los sistemas de vacuno de carne de las sierras deLa Rioja: I Caracterización de las explotaciones. ITEA Producción Animal.2005;26:183-185.
[8] Ruiz R, Igarzabal A, Mandaluniz N, Amenazar M, Oregui LM. Caracterización de losprincipales sistemas de producción de ganado vacuno en el País Vasco. ITEA.2005;26:195-197.
[9] Perea J, García A, Acero R, Valerio D, Rodríguez V. Caracterización productiva delvacuno ecológico en Andalucía. Archivos de Zootecnia. 2007;56:517-521.
[10] Perea J, Blanco–Penedo I, Barba C, Angón E, García A. Organic beef farming in Spain:Typology according to livestock management and economic variables. (Producción
Do Organic Livestock Farms Differ From Low-Input Conventional Ones? Insights Based on Beef Cattle in SouthernEurope
15
ecológica bovina de carne en España: tipología de acuerdo a variables técnicas yeconómicas). Revista Científica, FCV-LUZ. 2014;XXIV:347-354.
[11] Granda M, Moreno V, Prieto M, (Eds.) Pastos naturales en la dehesa extremeña. SIA-Junta de Extremadura. 1991.
[12] Hernández CG, (Ed.) La dehesa, aprovechamiento sostenible de los recursos naturales.Editorial Agrícola Española. 1998.
[13] Espejo M, Espejo AM. Los sistemas tradicionales de explotación y la aplicación deinnovaciones tecnológicas de la dehesa. In: Espejo M, Martín M, Matos C, Mesías FJ,(Eds.) Gestión ambiental y económica del ecosistema dehesa en la Península Ibérica.Junta de Extremadura, Consejería de Infraestructuras y D.T. 2006.
[14] Gaspar P, Mesías FJ, Escribano M, Rodríguez De Ledesma A, Pulido F. Economic andmanagement characterization of dehesa farms: Implications for their sustainability.Agroforestry Systems. 2007;71:151-162.
[15] Gaspar P, Mesías FJ, Escribano M, Pulido F. Sustainability in Spanish extensive farms(Dehesas): An economic and management indicator-based evaluation. RangelandEcology and Management. 2009;62:153-162.
[16] Franco JA, Gaspar P, Mesías FJ. Economic analysis of scenarios for the sustainability ofextensive livestock farming in Spain under the CAP. Ecological Economics.2012;74:120-129.
[17] Escribano AJ, Gaspar P, Mesías FJ, Escribano M, Pulido F. Comparative sustainabilityassessment of extensive beef cattle farms in a high nature value agroforestry system.In: Squires VR, (Ed.) Rangeland Ecology, Management and Conservation Benefits.Nova Science Publishers. 2015.
[18] Escribano AJ, Gaspar P, Mesías FJ, Pulido AF, Escribano M. A sustainabilityassessment of organic and conventional beef cattle farms in agroforestry systems:The case of the dehesa rangelands. ITEA Información Técnica Económica Agraria.2014;110:343-367.
[19] Regulation (EC) No 138/2004 of the European Parliament and of the Councilof 5 December 2003 on the economic accounts for agriculture in theCommunity.
[20] Gaspar P, Escribano M, Mesías FJ, Ledesma AR, Pulido F. Sheep farms in the Spanishrangelands (dehesas): Typologies according to livestock management and economicindicators. Small Ruminant Research. 2008;74:52-63.
[21] Lebacq T, Baret PV, Stilmant D. Sustainability indicators for livestock farming. Areview. Agronomy for Sustainable Development. 2013;33:311-327.
[22] Nieto MI, Olaizola AM, Manrique E. Los sistemas de vacuno de carne de las sierras deLa Rioja: I Caracterización de las explotaciones. ITEA. 2005;26:183-185.
Livestock Science16

[23] García A, Perea J, Acero R, Angón E, Toro P, Rodríguez V, Gómez Castro AG. Structuralcharacterization of extensive farms in andalusian dehesas. Archivos de Zootecnia.2010;59:577-588.
[24] Gaspar P, Escribano AJ, Mesías FJ, Escribano M, Pulido AF. Goat systems of Villuercas-Ibores area in SW Spain: Problems and perspectives of traditional farming systems.Small Ruminant Research. 2011;97:1-11.
[25] Toro-Mújica P, García A, Gómez-Castro AG, Acero R, Perea J, Rodríguez-Estévez V,Aguilar C, Vera R. Organic dairy sheep farms in south-central Spain: Typologiesaccording to livestock management and economic variables. Small Ruminant Research.2012;100:89-95.
[26] Riveiro JA, Mantecón AR, Álvarez CJ, Lavín P. A typological characterization of dairyAssaf breed sheep farms at NW of Spain based on structural factor. AgriculturalSystems. 2013;120:27-37.
[27] Escribano AJ. Beef cattle farms’ conversion to the organic system. Recommendationsfor success in the face of future changes in a global context. Sustainability. 2016;8:572.
[28] Regulation (EC) No 834/2007 of 28 June 2007 on organic production and labelling oforganic products and repealing Regulation (EEC) No 2092/91.
[29] DECRETO 9/2016, de 26 de enero, por el que se regula el régimen de ayudas agroam‐bientales y climáticas y agricultura ecológica para prácticas agrícolas compatibles conla protección y mejora del medio ambiente en la Comunidad Autónoma de Extrema‐dura. DOE Numero 18. Jueves, 28 de enero de 2016.
[30] López de Torre G.. Metodología y esquema de selección de razas maternales de vacunode carne: Aplicación a la raza Retinta. Especial Vacuno de Carne. Exclusivas ONE.1986:75-93.
[31] López de Torre G, García Barreto L, López Márquez JA. Encuesta sobre la explotacióny mejora del ganado vacuno en la Dehesa extremeña. In: Campos P, Martín M, (Eds.)Conservación y Desarrollo de las Dehesas Portuguesas y Española. Ministerio deAgricultura, Pesca y Alimentación. 1987.
[32] Martín M, Escribano M, Mesías FJ, Rodríguez de Ledesma A, Pulido F. Sistemasextensivos de producción animal. Archivos de Zootecnia. 2001;50:465‐489.
[33] Mateos A. 2008. Caracterización del cebo de bovino en Extremadura. Doctoral thesis.Departamento de Producción Animal, Universidad de Extremadura.
[34] Flaten O, Lien G, Ebbesvik M, Koesling M, Valle PS. Do the new organic producersdiffer from the 'old guard'? Empirical results from Norwegian dairy farming. Renew‐able Agriculture & Food Systems. 2006;21:174-182.
[35] Argyropoulos C, Tsiafouli MA, Sgardelis SP, Pantis JD. Organic farming withoutorganic products. Land Use Policy. 2013;32:324-328.
Do Organic Livestock Farms Differ From Low-Input Conventional Ones? Insights Based on Beef Cattle in SouthernEurope
17

[36] Ligios S, Revilla R, Nardona A, Casu S. Cattle husbandry systems in Mediterraneanmountains: Situation and prospects. In: Georgoudis A, Rosati A, Mosconi C, (Eds.)Animal Production and Natural Resources Utilisation in the Mediterranean MountainAreas EAAP. 2005.
[37] Hrabalová A, Zander K. Organic beef farming in the Czech Republic: Structure,development and economic performance. Agricultural Economics UZPI.2006;52:89-100.
[38] Gillespie J, Nehring R. Comparing economic performance of organic and conventionalU.S. beef farms using matching examples. Australian Journal of Agricultural andResource Economics. 2013;57:178-192.
[39] Lobley M, Butler A, Winter M. Local organic food for local people? Organic marketingstrategies in England and Wales. Regional Studies. 2013;47:216-228.
[40] Escribano AJ. Organic livestock farming: Challenges, perspectives, and strategies toincrease its contribution to the agrifood system’s sustainability – A review. In: Konva‐lina P, (Ed.) Organic Farming – A Promising Way of Food Production, InTech. 2016.
Livestock Science18