
Do International Launch Strategies of Pharmaceutical …eprints.lse.ac.uk/29972/1/LSEHWP19.pdf ·...
35
Nebibe Varol, Joan Costa-Font, Alistair McGuire Do International Launch Strategies of Pharmaceutical Corporations Respond to Changes in the Regulatory Environment? Working paper No: 19/2010 October 2010 LSE Health
Transcript of Do International Launch Strategies of Pharmaceutical …eprints.lse.ac.uk/29972/1/LSEHWP19.pdf ·...

For further information on this or any of the
Health publications contact:
Naho Ollason
Managing Editor
LSE Health
The London School of Economics and Political Science
Houghton Street
London WC2A 2AE
Tel: + 44 (0)20 7955 3733
Fax: + 44 (0)20 7955 6090
Email: [email protected]
Website: www.lse.ac.uk/collections/LSEHealth/
Nebibe Varol, Joan Costa-Font, Alistair McGuire
Do International Launch Strategies ofPharmaceutical Corporations Respond toChanges in the Regulatory Environment?
Working paper No: 19/2010 October 2010 LSE Health
10_0726 Working paper cover 19:Layout 1 2/11/10 14:13 Page 1

Do International Launch Strategies of Pharmaceutical Corporations Respond to Changes
in the Regulatory Environment?
Nebibe Varola, Joan Costa-Fonta, b, Alistair McGuirea
a LSE Health, London School of Economics and Political Science, London, UK b European Institute, London School of Economics and Political Science, London, UK Working Paper No. 19/2010 First published in October 2010 by: LSE Health The London School of Economics and Political Science Houghton Street London WC2A 2AE © Nebibe Varol, Joan Costa-Font, Alistair McGuire All rights reserved. No part of this paper may be reprinted or reproduced or utilised in any form or by any electronic, mechanical or other means, now known or hereafter invented, including photocopying and recording, or in any information storage or retrieve system, without permission in writing from the publishers. British Library Cataloguing in Publication Data A catalogue record for this publication is available from the British Library ISBN [978-0-85328-460-4] Corresponding Author Nebibe Varol LSE Health Cowdray House London School of Economics and Political Science Houghton Street London WC2A 2AE Email: [email protected]
2
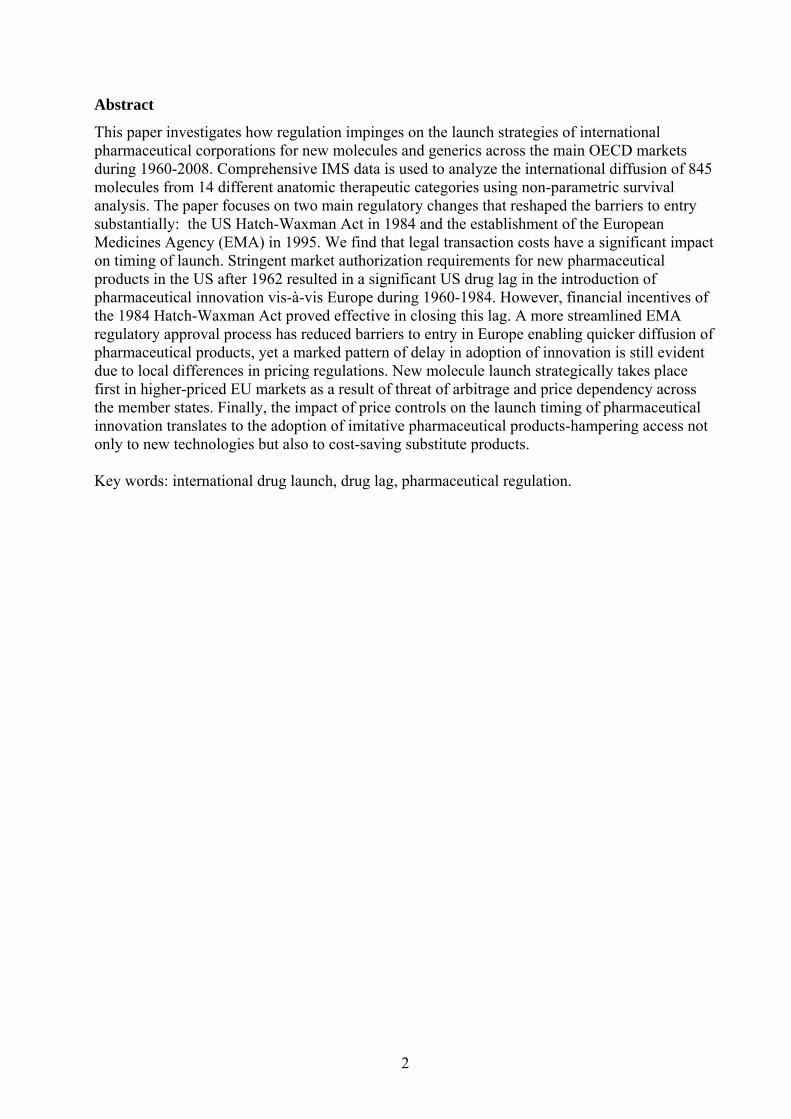
Abstract
This paper investigates how regulation impinges on the launch strategies of international pharmaceutical corporations for new molecules and generics across the main OECD markets during 1960-2008. Comprehensive IMS data is used to analyze the international diffusion of 845 molecules from 14 different anatomic therapeutic categories using non-parametric survival analysis. The paper focuses on two main regulatory changes that reshaped the barriers to entry substantially: the US Hatch-Waxman Act in 1984 and the establishment of the European Medicines Agency (EMA) in 1995. We find that legal transaction costs have a significant impact on timing of launch. Stringent market authorization requirements for new pharmaceutical products in the US after 1962 resulted in a significant US drug lag in the introduction of pharmaceutical innovation vis-à-vis Europe during 1960-1984. However, financial incentives of the 1984 Hatch-Waxman Act proved effective in closing this lag. A more streamlined EMA regulatory approval process has reduced barriers to entry in Europe enabling quicker diffusion of pharmaceutical products, yet a marked pattern of delay in adoption of innovation is still evident due to local differences in pricing regulations. New molecule launch strategically takes place first in higher-priced EU markets as a result of threat of arbitrage and price dependency across the member states. Finally, the impact of price controls on the launch timing of pharmaceutical innovation translates to the adoption of imitative pharmaceutical products-hampering access not only to new technologies but also to cost-saving substitute products. Key words: international drug launch, drug lag, pharmaceutical regulation.

Contents
Abstract ..........................................................................................................................................2
1. INTRODUCTION.....................................................................................................................4
2. DATA AND METHODS ..........................................................................................................6
2.1 Data.......................................................................................................................................6
2.2 Methods .................................................................................................................................7
3. RESULTS...................................................................................................................................9
3.1 Trends in the Adoption of Pharmaceutical Innovation .........................................................9
3.2 Trends in the Adoption of Generic Products.......................................................................19
4. CONCLUSIONS......................................................................................................................25
Acknowledgements......................................................................................................................27
Appendix ......................................................................................................................................28
References ....................................................................................................................................31
3

1. INTRODUCTION
The purpose of this paper is to investigate how the regulatory environment impinges on the
launch strategies of pharmaceutical corporations across the main OECD markets during 1960-
2008. How regulation affects adoption of innovation is a question open to empirical scrutiny,
especially in highly regulated industries such as the pharmaceutical industry where products and
processes are protected by intellectual property rights. Although several studies have been
carried out, the existing evidence in the pharmaceutical context is limited. Particularly important
is the role of the timing of new drug launch, which is typically carried out by international
companies following some corporate strategy. Paradoxically, the impact of regulation on generic
products within a therapeutic group has received even less attention. Expected proliferation of
bioequivalent products in the near future, rising concerns over cost containment and the resulting
push for genericization makes timing of generic launch a question of interest both for the
pharmaceutical industry and the policy makers.
Normally, firms facing a competitive environment would like to launch new chemical entities
(NCE) as quickly as possible into several markets while the product is still under patent
protection to amortize the substantial R&D outlays. However, there are at least two regulatory
hurdles that firms have to overcome before commercializing a new drug product. The first hurdle
is that manufacturers have to prove the threefold requirement of quality, safety and efficacy of
new molecules which is estimated to take around ten years of pre-clinical and clinical research
(Permanand 2006). The second hurdle typically includes the review of the new product dossier
by the regulatory authority (FDA1, EMA2 or any national authority) and approval of marketing
authorization (MA). Finally, the third hurdle following marketing approval is pricing and
reimbursement (P&R) which involves negotiations between manufacturers and P&R authorities
regarding the price of the new product and its reimbursement status. Price regulation can
arguably delay launch through the negotiation processes alongside the resulting firm strategies
of delaying or foregoing launch in low-priced markets3 (Danzon, Wang et al. 2005; Kyle 2007).
Non-homogeneity in these hurdles across markets results in launch delays, with welfare
implications for the consumer and the pharmaceutical producer.
Lags in adoption of new pharmaceutical innovations may affect consumer welfare through
impaired access to new drug products, in particular cost-effective products. Empirical evidence
shows that lack of access to new drugs leads to compromises in health outcomes (Schoffski
2002), shifts volume to older molecules of lower therapeutic value (Danzon and Ketcham 2004)
1 Food and Drug Administration 2 European Medicines Agency (www.ema.europa.eu) 3 The US, UK and Germany do not require price approval; however, in the UK, Germany and several other markets cost-effectiveness evaluation may further delay the adoption of new pharmaceutical innovation as the fourth hurdle
4
and results in higher expenditures on other forms of medical care and compromises in quality of
health care (Kessler 2004; Wertheimer and Santella 2004). Innovative medications offer
economic benefits through fewer work days missed and lives saved (Lichtenberg 1996;
Lichtenberg 2003; Hassett 2004; Lichtenberg 2005). Delays in the launch of new molecules
could be costly to the pharmaceutical industry through reduced market exclusivity periods, lower
returns to R&D and eventually fewer innovations4.
Generic products are by definition bioequivalent, and therefore perfect substitutes (on objective
quality grounds), to their branded counterparts that usually claim substantial price mark-ups over
the marginal cost of production5. Generic entry following patent expiry is argued to enhance
efficiency and competition in the drug market; however, the main hurdle before generic entry is
the cost of bioequivalence tests which have been estimated to be significantly cheaper than the
average costs of safety and clinical evaluation6. Generic imitations largely free-ride on the R&D
efforts of originator firms, which enables them to compete solely based on price. Timely
adoption of generic products, therefore, carries significant importance to improve allocative
efficiency and stimulate competition (DG Competition 2009).
The analysis in this paper draws upon an extensive database on the timing and entry of new
pharmaceutical molecules along with the entry of bioequivalent competitors. The paper has
several contributions to the literature on regulation and changes in corporate behaviour. First,
data used in previous studies is mainly restricted to specific, small time periods. Second, one of
the most important dimensions of market dynamics, the timing dimension of new and old
products, has been traditionally left out of the analysis of drugs. Finally, the paper assesses
corporate behaviour with respect to two main regulatory changes that reshaped the barriers to
entry substantially: 1) the US Hatch-Waxman Act in 19847; 2) the establishment of the
European Medicines Agency (EMA) in 1995 along with the adoption of the centralized
procedure that grants a Community marketing authorization.
The organisation of the paper is as follows: Section 2 describes the data and methods used in the
analysis; Section 3 discusses the results of the analysis along with corresponding regulatory
triggers; and finally Section 4 concludes.
4 Both profit expectations and lagged cash flows have been shown to have significantly positive impacts on pharmaceutical firms’ R&D investment intensity (Vernon 2005) 5 A generic is defined by the European Directive 2004/27/EC as “a medicinal product which has the same qualitative and quantitative composition in active substances and the same pharmaceutical form as the reference medicinal product, and whose bioequivalence with the reference medicinal product has been demonstrated by appropriate bioavailability studies.” 6 18 times cheaper according to the Pharmaceutical Manufacturers Association (Pharmaceutical Manufacturers Association 1993) 7 The cut off value of 1984 has been suggested as a pivotal year in the history of drug introduction patterns between the US and the UK (Coppinger, Peck et al. 1989)
5
2. DATA AND METHODS
2.1 Data
The IMS data used in the analysis contains quarterly sales in dollars and standard units for
molecules from 14 different ATC groups and 20 countries8 9. Additional data fields include
global and local launch date of drug products, pharmaceutical form, anatomic therapeutic class
of the product, the distribution channel of sales (hospital vs. retail), and patent protection status
of the drug. The markets in the dataset comprise the majority of the global pharmaceutical sales
and are all based in the OECD except for South Africa. Results are reported for the main seven
pharmaceutical markets comprised of the US, Japan and the EU5 (namely the UK, Germany,
France, Italy, and Spain).
Multi-country drug lag studies apply several criteria to identify significant NCEs. Some consider
molecules that have launched in the US and/or the UK as an indication of therapeutic
significance and potential for global launch (Parker 1984; Danzon, Wang et al. 2005). Several
studies find a direct relationship between the therapeutic contribution of a new drug and its
likelihood of achieving widespread introduction (Parker 1984; Barral 1985). This finding
suggests that most one-market new chemical entities (NCEs) do not simply disperse among
countries more slowly than others, but that they are never going to be widely available due to
their marginal therapeutic advantages. Molecules that have not launched in the US and the UK
are excluded to avoid any potential bias due to one-market molecules and to ensure that
molecules with potential global importance are considered. Hereafter, this potentially global set
of molecules is referred as US&UK molecules.
In addition, a global molecule set comprised of molecules that have diffused to all twenty
markets on the database is defined. These two sets provide a means to compare relative drug lags
for molecules with different levels of international spread and to assess whether there exists a
systematic difference between the two. For brevity, the results for US&UK molecules only are
reported. Findings for global molecules are broadly in line with the estimates for US&UK
molecules.
Table 1 presents the breakdown of molecules by the period of global launch. The majority of the
molecules had their global launch during 1960-1984. In total 845 molecules were launched in the
US and UK since 1960, 200 of which diffused to all markets. Only 350 of the molecules had a
8 IMS (Intercontinental Medical Services) MIDAS data was collected at Merck Sharp and Dome Limited (MSD) premises in Hoddesdon, UK. 9 Australia (ALIA), Austria (AUS), Belgium (BEL), Canada (CAN), Finland (FIN), France (FRA), Germany (GER), Greece (GRE), Italy (ITA), Japan (JAP), Netherlands (NET), Poland (POL), Portugal (POR), South Africa (SAF), Spain (SPA), Sweden (SWE), Switzerland (SWI), Turkey (TUR), the UK, and the US
6
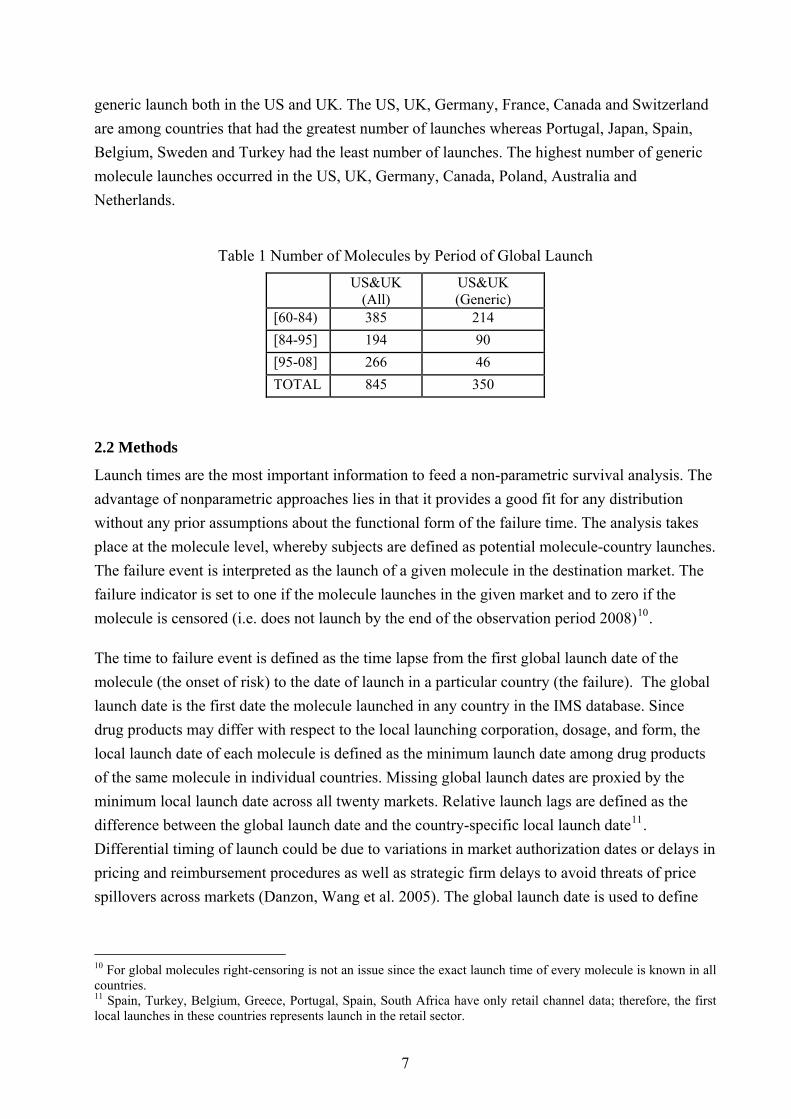
generic launch both in the US and UK. The US, UK, Germany, France, Canada and Switzerland
are among countries that had the greatest number of launches whereas Portugal, Japan, Spain,
Belgium, Sweden and Turkey had the least number of launches. The highest number of generic
molecule launches occurred in the US, UK, Germany, Canada, Poland, Australia and
Netherlands.
Table 1 Number of Molecules by Period of Global Launch
US&UK (All)
US&UK (Generic)
[60-84) 385 214
[84-95] 194 90
[95-08] 266 46
TOTAL 845 350
2.2 Methods
Launch times are the most important information to feed a non-parametric survival analysis. The
advantage of nonparametric approaches lies in that it provides a good fit for any distribution
without any prior assumptions about the functional form of the failure time. The analysis takes
place at the molecule level, whereby subjects are defined as potential molecule-country launches.
The failure event is interpreted as the launch of a given molecule in the destination market. The
failure indicator is set to one if the molecule launches in the given market and to zero if the
molecule is censored (i.e. does not launch by the end of the observation period 2008)10.
The time to failure event is defined as the time lapse from the first global launch date of the
molecule (the onset of risk) to the date of launch in a particular country (the failure). The global
launch date is the first date the molecule launched in any country in the IMS database. Since
drug products may differ with respect to the local launching corporation, dosage, and form, the
local launch date of each molecule is defined as the minimum launch date among drug products
of the same molecule in individual countries. Missing global launch dates are proxied by the
minimum local launch date across all twenty markets. Relative launch lags are defined as the
difference between the global launch date and the country-specific local launch date11.
Differential timing of launch could be due to variations in market authorization dates or delays in
pricing and reimbursement procedures as well as strategic firm delays to avoid threats of price
spillovers across markets (Danzon, Wang et al. 2005). The global launch date is used to define
10 For global molecules right-censoring is not an issue since the exact launch time of every molecule is known in all countries. 11 Spain, Turkey, Belgium, Greece, Portugal, Spain, South Africa have only retail channel data; therefore, the first local launches in these countries represents launch in the retail sector.
7
the onset of risk for molecule launches due to unavailability of data to isolate the delays due to
these components.
The risk onset in the case of pharmaceutical imitation is defined as the date when the first
generic product of a given molecule launched in any of the twenty markets. It would have been
informative to carry out the analysis by considering generic delays following the local protection
expiry dates. This approach was not followed because expiry date is available only in 3% of the
data and in 56% of these cases expiry date exceeds local launch by more than a year, which
could be due to the presence of copy products in some markets, launch of pseudogenerics12 (also
known as authorized generics) or errors in reporting the expiry dates.
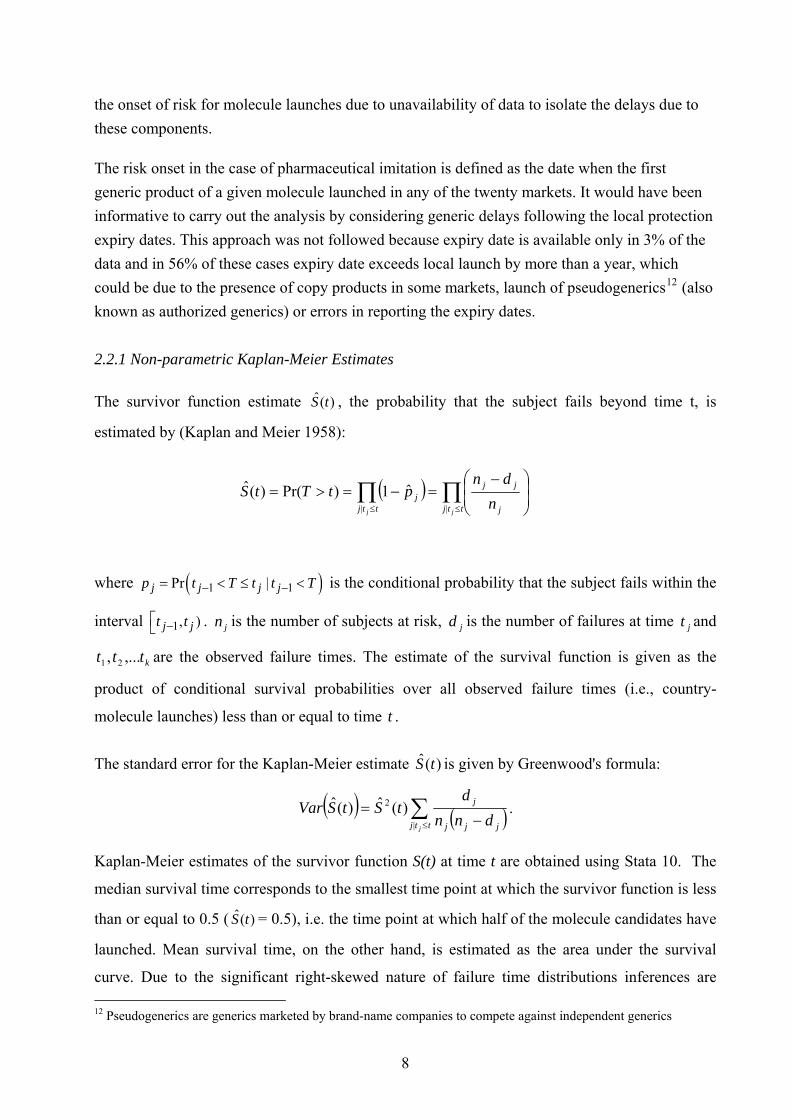
2.2.1 Non-parametric Kaplan-Meier Estimates
The survivor function estimate , the probability that the subject fails beyond time t, is
estimated by (Kaplan and Meier 1958):
ˆ( )S t
ttj j
jj
ttjj
jjn
dnptTtS
||
ˆ1)Pr()(ˆ
where 1 1Pr |j j j jp t T t t T
1, )j jt t jn
kt
is the conditional probability that the subject fails within the
interval . is the number of subjects at risk, is the number of failures at time and
are the observed failure times. The estimate of the survival function is given as the
product of conditional survival probabilities over all observed failure times (i.e., country-
molecule launches) less than or equal to time t .
jd t
tt ,...,
j
21
The standard error for the Kaplan-Meier estimate is given by Greenwood's formula: )(ˆ tS
ttj jjj
j
jdnn
dtStSVar
|
2 )(ˆ)(ˆ .
Kaplan-Meier estimates of the survivor function S(t) at time t are obtained using Stata 10. The
median survival time corresponds to the smallest time point at which the survivor function is less
than or equal to 0.5 ( = 0.5), i.e. the time point at which half of the molecule candidates have
launched. Mean survival time, on the other hand, is estimated as the area under the survival
curve. Due to the significant right-skewed nature of failure time distributions inferences are
ˆ
( )S t
12 Pseudogenerics are generics marketed by brand-name companies to compete against independent generics
8

based primarily on the median delays. The median survival times are estimated in each market
for molecules by period of entry into the risk set, i.e. first global launch during 1960-1984, 1984-
1995 and 1995-2008. This framework allows the comparison of the evolution of relative launch
lags both across countries and over time. Since the cut-off points of 1984 and 1995 correspond to
two major regulatory changes in the US and Europe, their impact on timing of launch can be
assessed comparatively using medians before and after these cut-off values.
3. RESULTS
3.1 Trends in the Adoption of Pharmaceutical Innovation
Evolution of Median Delays over Decades
Figure 1 shows the trend in overall median delays for US&UK molecules across the twenty
markets from 1960 to 2008. A marked acceleration in the international diffusion speed of
pharmaceuticals is observed. While the overall median is 11 years for molecules with a global
launch in 1960-1985, the median drops to 4 and 2 years for molecules that launched in 1984-
1995 and 1995-2008 respectively (see Table A.1 in the Appendix for the medians in individual
countries over time). The significance of this trend is tested by a Cox proportional hazard model
that controls for the period of global launch. Coefficients are estimated both by a Cox model
with country fixed effects and a random effects Cox model with shared frailties for the same
country launches. Both the fixed effects and the random effects indicate that hazard of launch13
is significantly higher for molecules that first launched during 1995-2008 compared to 1984-
1995. Similarly, the hazard is higher for molecules that launched in 1984-1995 compared to
1960-1984. The Hausman test that compares the fixed and random effects specifications
indicates that the fixed effects model is the correct specification (p-value: 0.0135). Based on the
fixed effects specification launch in 1960-1984 decreases the hazard by 48% and launch in 1995-
2008 increases the hazard by 82%, both compared to launch in 1984-1995.
13 The instantaneous probability of launch conditional on not launching before
9
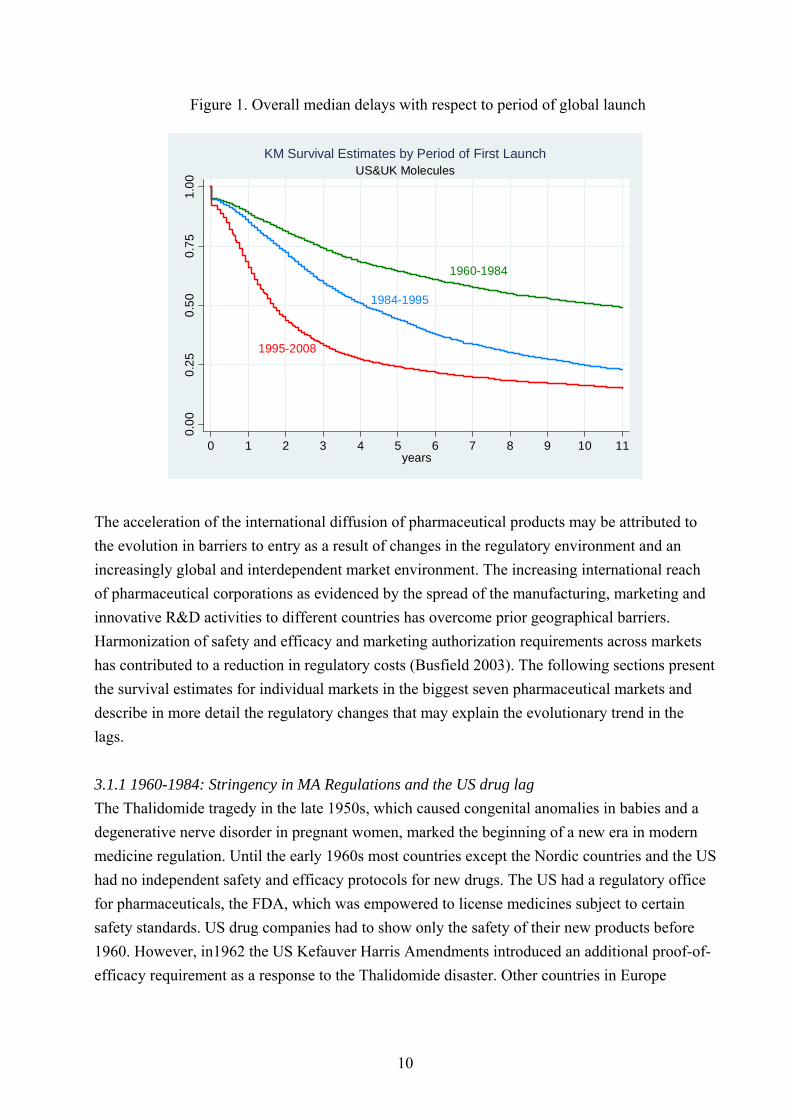
Figure 1. Overall median delays with respect to period of global launch
1960-1984
1984-1995
1995-2008
0.0
00
.25
0.5
00
.75
1.0
0
0 1 2 3 4 5 6 7 8 9 10 11years
US&UK MoleculesKM Survival Estimates by Period of First Launch
The acceleration of the international diffusion of pharmaceutical products may be attributed to
the evolution in barriers to entry as a result of changes in the regulatory environment and an
increasingly global and interdependent market environment. The increasing international reach
of pharmaceutical corporations as evidenced by the spread of the manufacturing, marketing and
innovative R&D activities to different countries has overcome prior geographical barriers.
Harmonization of safety and efficacy and marketing authorization requirements across markets
has contributed to a reduction in regulatory costs (Busfield 2003). The following sections present
the survival estimates for individual markets in the biggest seven pharmaceutical markets and
describe in more detail the regulatory changes that may explain the evolutionary trend in the
lags.
3.1.1 1960-1984: Stringency in MA Regulations and the US drug lag
The Thalidomide tragedy in the late 1950s, which caused congenital anomalies in babies and a
degenerative nerve disorder in pregnant women, marked the beginning of a new era in modern
medicine regulation. Until the early 1960s most countries except the Nordic countries and the US
had no independent safety and efficacy protocols for new drugs. The US had a regulatory office
for pharmaceuticals, the FDA, which was empowered to license medicines subject to certain
safety standards. US drug companies had to show only the safety of their new products before
1960. However, in1962 the US Kefauver Harris Amendments introduced an additional proof-of-
efficacy requirement as a response to the Thalidomide disaster. Other countries in Europe
10

aligned their marketing authorizing procedures for increased safety and efficacy only in late
1960s and early 1970s (Permanand 2006).
The debate about launch delays extends back to 1960s when the main concern was the
significant US drug lag compared to the main EU markets, mainly as a result of the more
stringent US regulations. Wardell, a pharmacologist, coined the term “drug lag” and increased
awareness of the unavailability of new drugs in the US, and stressed that the delay affected
therapeutically important drugs as well (Wardell 1973; Wardell 1974; Wardell 1978). Later
studies by Grabowski (1980), Berlin and Jonsson (1986) and Kaitin (1989) confirmed findings of
Wardell (Grabowski 1980; Berlin and Jonsson 1986; Kaitin, Mattison et al. 1989).
The survival estimates in this study for molecules that launched first during 1960-1984 confirm
findings of the early literature that the US market was relatively disadvantaged for the timely
adoption of pharmaceutical innovations as a result of much stricter requirements for regulatory
approval. The survival graph in Figure 2 shows the probability that molecule launch in a given
country occurs after t years following global launch, conditional on the fact that the molecule has
not launched in that country up to time t. Hence, it takes longer for countries with a higher
survival curve to adopt new pharmaceutical innovations. The median survival time, the time
point at which half of the molecule candidates have launched, is given by the t value where the
survival probability is 0.5.
Figure 2. Survival Estimates: 1960-1984
JAP
ITA
UKUS
FRA
GER
SPA
0.0
0.1
0.2
0.3
0.4
0.5
0.6
0.7
0.8
0.9
1.0
0 1 2 3 4 5 6 7 8 9 10 11 12 13 14
Molecules with global launch during 1960-1984KM survival estimates in years
11
During 1960-1984, Europe is found to be leading in the introduction of pharmaceutical
innovation. As expected, free price countries such as the UK and Germany are leading markets,
with a median delay of 3 years and are followed by Italy, France and Spain with a corresponding
lag of 3.5− 4 years. The US lags behind the slowest European market by about half a year. Japan
has the most dramatic delay of 12 years, which can be attributed to geographical barriers and
predominantly domestic nature of the market, especially in a period when the global expansion
of pharmaceutical corporations was relatively limited.
3.1.2 1984-1995: The US Hatch-Waxman Act and Stimulus for Innovation
The Hatch Waxman Act, also known as the Drug Price Competition and Patent Term Restoration
Act of 1984, was enacted to compensate for the loss in effective patent life during drug
development. The Act extended pharmaceutical patents for the time lost in clinical testing and
regulatory review, but the entire patent term restored was restricted to 5 years and the term of the
restored patent following FDA approval was restricted to 14 years. In addition, the Act
introduced a five-year market exclusivity period for NMEs such that once an NME is approved a
generic manufacturer cannot submit an application until 5 years after the approval of the pioneer
and thus cannot enter the market for at least 5 years. These amendments enabled pharmaceutical
innovators to recoup some of the revenue losses due to regulatory stringency after 1962. The
main aim of the Act, however, was to maintain incentives for innovation while ensuring quick
generic entry. Although the impact on the brand-name drugs is somewhat contentious, data
from the literature suggests that stimulation for innovation resulted in increased R&D funding
and R&D intensity (Branes 2007).
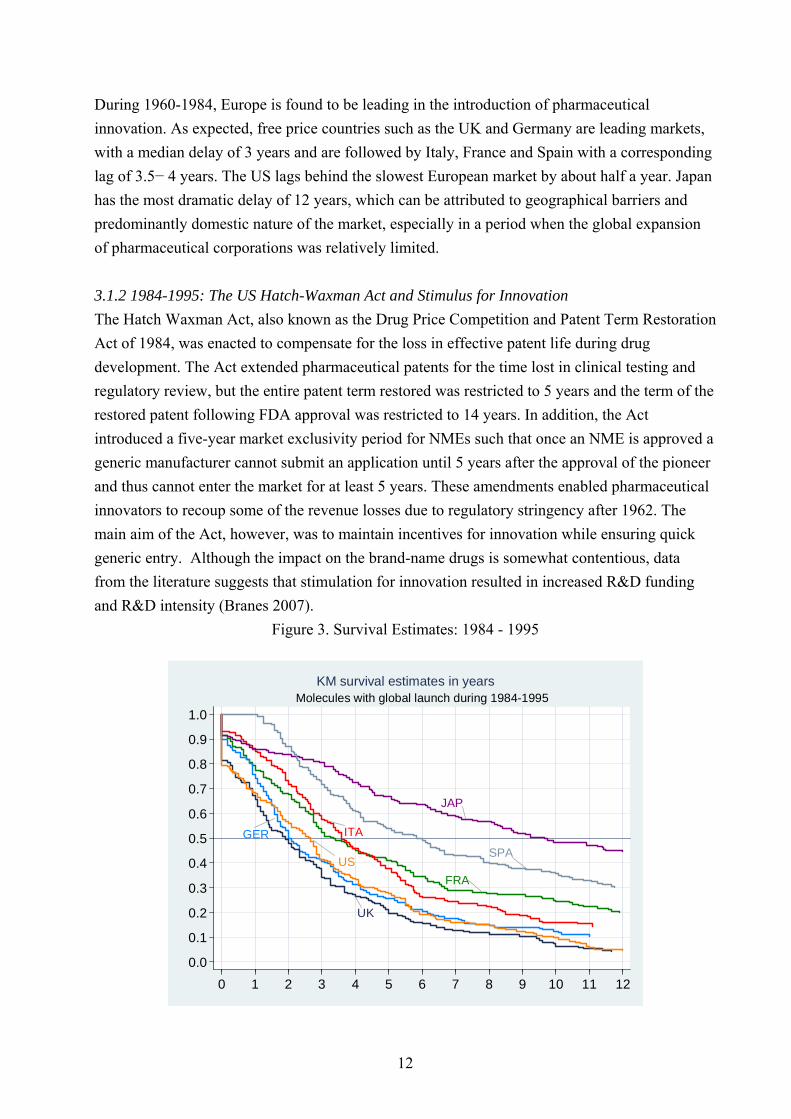
Figure 3. Survival Estimates: 1984 - 1995
JAP
ITA
FRA
USSPA
UK
GER
0.0
0.1
0.2
0.3
0.4
0.5
0.6
0.7
0.8
0.9
1.0
0 1 2 3 4 5 6 7 8 9 10 11 12
Molecules with global launch during 1984-1995KM survival estimates in years
12

Survival estimates in this study indicate a stark improvement in the US for the timing of new
product launches vis-à-vis Europe (Figure 3). The median delay in the US decreased from about
8 years to 3 years following the enactment of the Act whereas the corresponding decrease in the
leading markets of UK and Germany was on the order of one year only. While the US was the
second slowest market to adopt new pharmaceutical molecules in 1960-1984, after the 1984 Act
the US becomes one of the leading markets along with the UK and Germany. The estimates
present a clear indication that the 1984 Act has generated a more favourable environment for
market entry in the US and suggests an increase in overall R&D activity in the US
pharmaceutical industry.
The remaining markets in Europe also experience faster introductions after 1984. In particular,
the medians in France and Italy decrease by 3 years (to about 3.5 years). The one-year reduction
in the Spanish median delay is more modest and can be partially attributed to the lack of product
patent protection for new pharmaceuticals before ratification of the TRIPS Agreement in 1995.
Overall, Spain and Japan emerge as the slowest adopters following the 1984 Act. Local clinical
trial requirements are the core factor for the Japanese drug lag and the exclusion of foreign
corporations from the Japanese market. According to a study that analyzes the Japanese lag
during 1981-1993, the second influential factor is the price regulations since 1981 that sharply
lowered launch prices and the life cycle sales of drugs launched into Japan (Thomas 2001).
Patent term restoration in Europe was enacted only eight years following the 1984 Act in the US.
In 1992, Supplementary Protection Certificate (SPC) extended the protection period of
pharmaceutical products in the European Community (EC) by 5 years following patent-expiry or
15 years of protection from the date of first market authorization in the EC, instead of twenty
years after patent application as under the European Patent Convention14. This prolonged the
profit life of products as drug sales are generally highest during the period of market exclusivity.
In addition, the SPC prevented generic companies from engaging in R&D prior to patent expiry,
which essentially ensured a longer shelf-life for branded products and provided stimulus for
innovation. The relative delay in providing financial stimulus for innovation through patent term
restoration in the EU could be an additional factor that explains the drastic improvement in the
timing of new product launches in the US vis-à-vis Europe during 1984-1995.
3.1.3 1995-2008: EMA and Harmonization across the Globe
The set up of a single market in 1993 and a common currency in 1999 (when exchange rates
were pegged) ensured free movement of people, goods and services within the EU. Since then
14 The SPC became effective on Jan 1993 and applied to drugs granted market authorization in the EU after Jan 1985.
13

market authorization has been streamlined by the establishment of the European Medicines
Agency (EMA) in 1995 although a complete harmonization of the pharmaceutical market has not
taken place. This was a significant step to speed approval times across Europe which had begun
to suffer from increasing number of applications as the industry grew and technical and scientific
issues became more complex. In addition, EU Directive 2004/27/EC introduced a uniform level
of data protection for 10 years across the EU and precluded the launch of the generic copy until
the expiry of the 10-year period.
A centralized approval procedure, which grants a Community-wide authorization valid in all
Member States, would increase efficiency by obviating the duplication of effort through a single
market authorization process and saving an annual expenditure of $350m by drug firms to get
separate approvals from individual member countries (Annon 1994). The centralized procedure,
however, does not apply to all products. It is mandatory for all biotechnology processes and
optional for innovative chemical drugs provided the product offers a significant therapeutic,
scientific or technical innovation15.
After 1990, the pharmaceutical industry witnessed further harmonisation efforts. The Agreement
on Trade Related Aspects of Intellectual Property Rights (TRIPS) in 1994 strengthened
intellectual property rights and provided significant financial incentives for companies by
blocking generic competition until the expiry of the 20 years patent life and by extending the
scope of patent protection both to products and processes (WTO OMC 2003). Similarly, the
International Conference on Harmonisation of Technical Requirements for Registration of
Pharmaceuticals for Human Use (ICH) has aimed to achieve greater harmonisation in the
application of technical guidelines and requirements for product registration across the EU, US
and Japan to reduce or obviate the need of duplicative testing in the R&D stage16.
Figure 4 shows that the median delays continued to decrease throughout 1995-2008 as a
response to the harmonization efforts across the biggest 7 pharmaceutical markets, yet the
differential delays have not been eliminated totally17. Most of the molecules launch immediately
in the US followed by launch in the free-priced European markets of Germany and the UK
within one year. The US emerges as the most favourable market because of high profit
potentials. This is both because the US has the largest market size and a more liberal pricing
environment compared to other OECD markets that employ some form of price control, either in
the form of statutory pricing whereby the price is set on a regulatory basis or through price
negotiations (Vogler 2008). Stringent price controls have been criticized for having negative
15 http://www.emea.europa.eu/ 16 http://www.ich.org 17 Log-rank test for equality of survivor functions indicate that the difference in median delays between countries is significant (p-value: 0.0000). In addition, significant heterogeneity exists with respect to the ATC group (p-value: 0.0021), which implies that the relative delays vary across ATC groups.
14

implications on the extent and timing of launch via knock-on effects on foreign markets through
external referencing and parallel trade within the EU; however, the available evidence is limited
(Danzon and Epstein 2005; Kyle 2007; Danzon and Epstein 2008).
Figure 4. Survival Estimates: 1995-2008
JAP
ITAFRA
US
UK
GER SPA
1.0
0.9
0.8
0.7
0.6
0.5
0.4
0.3
0.2
0.1
0.0
0 1 2 3 4 5 6 7 8
Molecules with global launch during 1995-2008KM survival estimates in years
The relative launch delays in Europe suggest an ordering with respect to price levels of
pharmaceutical products. Figure 5 illustrates the correlation between median delays and the
bilateral price indexes with respect to US prices for 200418. The correlation is -0.47 and is
significant at the 0.01 level. France and Italy seem to have a comparable speed of launch with a
median delay of around two years. The median lag in Spain has decreased compared to 1984-
1995 but it still lags about a year behind France and Italy. The lack of product patent protection
for new pharmaceuticals before EU membership contributes to launch delays in Spain. EU
accession in 1986 required Spain to comply with the European Patent Convention (EPC), which
allowed the patentability of both products and processes. Spain enacted a new patent law in 1986
which introduced patent protection for pharmaceuticals. However, effective patentability was
delayed until 7 October 1992 through Reservation under Article 167 of the EPC, which
essentially meant that pharmaceutical and chemical products could not be patented in Spain prior
to 7 October 1992. In 1995, Spain ratified the TRIPS Agreement, which substantially changed
18 Bilateral price indexes are calculated by considering common molecules in the US and the respective country, prices are weighted by the US Volume
15

the patent protection landscape19. In addition, Spain is one of the major parallel exporters in the
EU due to its relatively lower drug prices, which are further pushed downwards by unilateral
price cuts imposed on pharmaceutical prices. The delay in Spain, therefore, is consistent with
pharmaceutical firm strategies to avoid parallel trade (Kyle 2007).
Figure 5. Bilateral Price Indexes with Respect to US Prices vs. Median Delays
(for ethical branded products in the retail sector)
ALIA
AUS
BEL
CAN
FIN FRA
GER
GREITA
JAP
NET
POL
PORSAF
SPA
SWE
SWI
TUR
UK
US
0
.2
.4
.6
.8
1
1.2
0 3 6 9 12 15
US&UK molecules during 95-082004 Price Index (US=1) vs Median Delay (yrs)
Note: Bilateral price indexes are calculated by considering common molecules in
the US and the respective country, prices are weighted by the US Volume20
The Japanese drug lag extends to this period as well although the median Japanese delay
decreases by two years with respect to the previous period. This is paradoxical given the
international competitiveness of numerous Japanese high-tech industries including electronics
and automobiles during 1990s. The Japanese pharmaceutical market is the second largest market
in the world and offers a great profit potential because of a large market size and relatively high
19 https://www.eversheds.com/uk/Home/Articles/index1.page?ArticleID=templatedata\Eversheds\articles\data\en\Healthcare\BioBrief_Stop_press_Direct_applicability_in_Spain_of_patent_provisions_of_the_TRIPS_Agreement 20 ALIA: Australia; AUS: Austria; CAN: Canada; FIN: Finland; FRA: France; GER: Germany; GRE: Greece; ITA: Italy; JAP: Japan; NET: Netherlands; POL: Poland; POR: Portugal; TUR: Turkey; SAF: South Africa; SPA: Spain; SWE: Sweden; SWI: Switzerland
16

drug prices (see Figure 5). Nevertheless, the Japanese pharmaceutical industry still remains
predominantly domestic and uncompetitive.
Japanese regulations for new drug approval have required Japanese clinical data for evaluating
the efficacy and safety of the drug even if foreign clinical data is available due to racial and
ethnic variations in responses to medicines. In the past, all three phases of clinical trials had to be
carried out on the Japanese population, which has driven launch delays in addition to other
factors such as language barriers and longer times for patient enrolment in clinical trials. In 1998,
Japan adopted the ICH E5 guideline entitled "Ethnic Factors in the Acceptability of Foreign
Clinical Data" that recommends the use of foreign clinical data for new drug approval if there is
one additional bridging study21 showing that the drug will behave similarly in the Japanese
population. According to Uyama et al. (2005) new drug approvals based on a bridging strategy in
Japan have increased from 3.2% in 1999 to 25% in 2003. Tabata and Albani (2008) report that
companies are increasingly trying to leverage their operations globally in order to take advantage
of the Japanese efforts to comply with the trend for globalising clinical trials (Tabata and Albani
2008). These developments suggest that the drug lag in Japan can decrease over the next years
(Uyama, Shibata et al. 2005).
Ranking countries by median lags, countries may be characterised as leaders (the US, UK,
Germany, Sweden, Netherlands, Finland, Austria, Switzerland) and laggards (Belgium, Greece,
South Africa, Poland, Portugal, and Turkey). The remaining countries (France, Canada, Italy,
Australia, and Spain) rank as intermediaries with the rank dependant on the period and extent of
global launch. The laggards and leaders, as defined by countries with median lags above and
below the overall delays, are similar for the global and the US&UK molecules; however, the
extent of the relative lag is shorter for the truly global molecules as is expected because global
molecules have diffused to all markets and have non-censored survival times. Similarly, launch
in all markets may indicate higher therapeutic or commercial importance at the product level.
EMA Sub-Analysis
Differences in the survival behaviour among the EU markets in Figure 4 indicate that
pharmaceutical firms have adopted different launch strategies across markets in the EU and that
efforts of harmonization in market authorization procedures have not eliminated the differentials
in timing of launch across European countries. Sub-analysis for the EU countries22 is carried-out
to further investigate the impact of the establishment of a centralized regulatory procedure in the
21 A bridging study aims to confirm that the efficacy, safety and dose-response relationships of the drug in the new population are similar to those in the population evaluated in the foreign studies 22 Austria, Belgium, Finland, France, Germany, Italy, Netherlands, Poland, Portugal, Spain, Sweden, UK
17

EU. In order to compare relative delays for molecules that obtained centralized approval (central
molecules) with those that did not (non-central molecules), data was collected for all centrally
approved molecules from the EMA website (EMA publishes information following the grant of a
Marketing Authorization as a European Public Assessment Report). This information was
combined with the IMS database to estimate delays within the EU for molecules with a first
global launch post-1995 (see Figure 623).
Figure 6. Delays with respect to central vs. non-central approval in the EU
0
1
2
3
4
5
6
7
8
9
year
s
Non-EMEA EMEA
UK GE FR IT SP GE UK SP FR IT
Median delays for Central vs Non-Central Molecules in EU5
(Kaplan-Meier estimate for Spain not available, the restricted mean which provides a lower bound for the median is reported; EMEA: Molecules centrally approved by EMA)
There is a statistically significant difference in launch behaviours between the central and non-
central molecules (p-value: 0.000 for the test of the null hypothesis that the survival behaviours
of EMA and non-EMA molecules are identical). The effectiveness of a more streamlined
authorization is demonstrated by the lower variation in launch timing for EMA molecules
compared to molecules that did not go through the centralized procedure. The median delay for
non-central molecules is greater by more than 2 years compared to the median delay of central
molecules which is on the order of one year. The faster diffusion of centrally approved
23 Kaplan-Meier estimate for Spain not available, the restricted mean which provides a lower bound for the median is reported
18
molecules can be attributed to the elimination of differentials in regulatory approval times as
well as a potentially higher therapeutic/commercial value of the centrally approved drugs.
Central approval speeds up the introduction of molecules in laggard countries such as France,
Italy and Spain. Spain exhibits the most dramatic reduction in median delays -a reduction from 5
years to 1.5 years- among the five main European pharmaceutical markets due to central
approval. For France and Italy the reduction is on the order of half a year only. The centralized
EU procedure is compulsory for all medicinal products derived from biotechnology and other
high technology processes. If the product does not belong to the designated disease categories24
for central approval, companies can submit an application for a centralized marketing
authorization, provided the product offers a significant therapeutic, scientific or technical
innovation25. A more homogenous cross-country launch for central molecules across the EU
indicates that on average European patients have more equitable access to drugs that have
priority from a health policy perspective-at least to the extent that these drugs are diffused at
comparable times (the take-up and access post-launch may introduce further differentials in
access due to differences in reimbursement policies as well as cultural factors).
3.2 Trends in the Adoption of Generic Products
The lags in generic entry across countries depend on differentials in patent expiry dates or
market exclusivity as well as originator firm strategies to block or delay generic competition.
Due to unavailability of data to control for patent expiry dates or originator firm actions, the
estimates provide generic lags as the time elapse between the first global generic product launch
and local generic launch for a given molecule-country pair. This measure therefore provides only
a relative measure of differentials in the timing of generic availability across countries.
Evolution of Median Delays over Decades
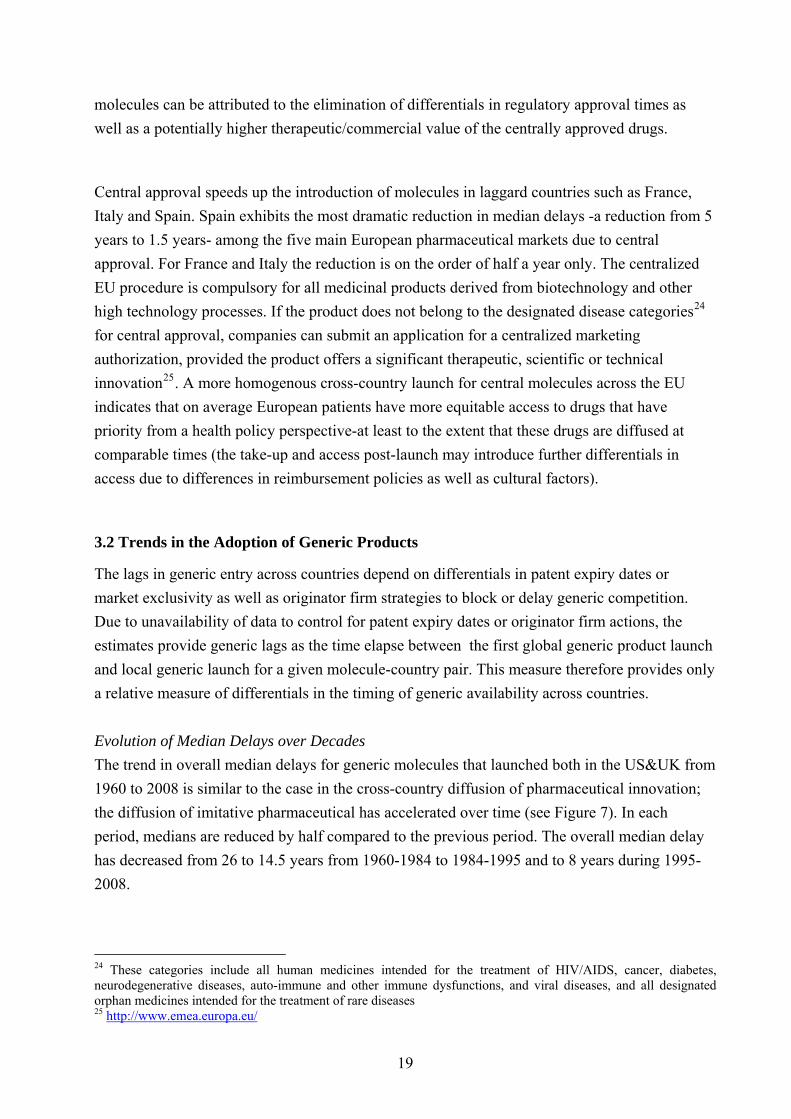
The trend in overall median delays for generic molecules that launched both in the US&UK from
1960 to 2008 is similar to the case in the cross-country diffusion of pharmaceutical innovation;
the diffusion of imitative pharmaceutical has accelerated over time (see Figure 7). In each
period, medians are reduced by half compared to the previous period. The overall median delay
has decreased from 26 to 14.5 years from 1960-1984 to 1984-1995 and to 8 years during 1995-
2008.
24 These categories include all human medicines intended for the treatment of HIV/AIDS, cancer, diabetes, neurodegenerative diseases, auto-immune and other immune dysfunctions, and viral diseases, and all designated orphan medicines intended for the treatment of rare diseases 25 http://www.emea.europa.eu/
19

Figure 7. Overall median delays of generics with respect to period of global launch
1960-1984
1995-2008 1984-1995
0.0
0.1
0.2
0.3
0.4
0.5
0.6
0.7
0.8
0.9
1.0
0 4 8 12 16 20 24 28 32 36years
Generic moleculesKM Survival Estimates by First Launch Period
In parallel to the case with innovative molecules, fixed and random effect Cox estimates for the
impact of the period of first launch indicate that generics launched significantly faster after 1984.
The Hausman test comparing fixed and random effects indicates that the shared frailty
specification is correct (p-value 0.154). First launch during 1984-1995 is associated with a 2.5
times faster hazard rate compared to first launch during 1960-1984, and first launch during 1995-
2008 is associated with a 6.5 times faster hazard rate compared to first launch during 1960-1984.
The significance of the difference in the median delays across decades can also be inferred from
the non-intersecting confidence intervals of medians estimated by Stata 10 (see Table A.2). The
acceleration in generic adoption over time can be mainly attributed to new regulations in the US
and EU that have enabled generic drug development before patent expiry and reduced capital
requirements by obviating the need to reproduce data from clinical trials.
3.2.1 1960-1984: Stringency in MA Regulations and the US drug lag
In the previous sections, significant lags in the US were observed for innovative products (i.e.
new molecules launching for the first time). As Figure 8 shows the US exhibits no lag with
respect to the adoption of pharmaceutical imitation. Based on a cross-country perspective, Italy,
Spain and France adopt generics latest, and are surpassed by Germany and the UK. This pattern
in Europe is broadly in line with the case for innovative pharmaceutical diffusion; except for the
20

fact that UK lags behind Germany during this period by about 3 years (see Table A.3 for the
exact figures). Also, generics reach Japan relatively fast during this period compared to the
relative adoption speed of innovative molecules in Japan.
Figure 8. Survival Estimates for Generics: 1960-1984
FRA
US UK
GER
JAP
SPA
ITA
1.0
0.9
0.8
0.7
0.6
0.5
0.4
0.3
0.2
0.1
0.0
0 2 4 6 8 10 12 14 16 18 20 22 24 26 28 30 32 34 36
US&UK generic molecules with first launch during 1960-1984KM survival estimates in years
3.2.2 1984-1995: The Hatch-Waxman Act and Improved Generic Access in the US
The Hatch-Waxman Act of 1984 aimed to facilitate generic entry by eliminating the entry barrier
of duplicative testing required for generic substitutes while ensuring adequate return for
innovator firms through patent restoration (Wittner 2004). As the most immediate benefit, the
1984 Act allowed generic manufacturers develop generic drugs before patent expiry of the
originator product (often referred as the “Bolar” clause)26. Generic producers were allowed to
reference the originator’s safety and efficacy data obviating the need to repeat the same tests,
which reduced development costs substantially and therefore alleviated barriers to generic entry.
The Act introduced 180 days of market exclusivity period to the first company to file a new
generic application (known as ANDA, Abridged New Drug Application).
26 The name is derived from a landmark case between Roche and the generic companies Bolar. Bolar won the right to start developing the generic copy of Roche’s patented compound Flurazepam Hydrochloride prior to its patent expiry, which was incorporated into the 1984 Act.
21

Figure 9. Survival Estimates for Generics: 1984-1995
JAP
FRA
ITA
GER
US
UK
SPA
0.0
0.1
0.2
0.3
0.4
0.5
0.6
0.7
0.8
0.9
1.0
0 2 4 6 8 10 12 14 16 18 20 22 24
US&UK generic molecules with first launch during 1984-1995KM survival estimates in years
Figure 9 shows that the pattern of differential lags during 1984-1995. Compared to the 1960-
1984 three main differences emerge. First, following the provisions for quicker generic entry in
the Hatch-Waxman Act, the median delay in the US is reduced by 4 years (from 14 years to
about 10 years). Second, the Japanese lag for generics increases by 4 years. Third, UK and
Germany show equally fast generic adoption with a median lag on the order of 11-12 years.
Finally, France, Italy and Spain follow with a median delay of 14-17 years.
3.2.3 1995-2008: EMA and New Generic Legislations in Europe
The period from 1995 to 2008 witnessed important regulatory changes in generic legislations
both in the US and Europe. Europe followed the US in providing incentives for generic
development and timely market access in Europe. The US, on the other hand, focused mainly on
the prevention of originator firm strategies to delay or block generic competition.
Changes in the US Generic Legislation
Two revisions (McCain-Schumer legislation in 2002, Gregg-Schumer Act in 2003) to Hatch-
Waxman Act in the US sought to improve the balance between the needs of the branded
companies and those of the generic companies. First, the new revisions set up a new mechanism
to prevent the inclusion of frivolous patents or those filed at the last moment as a blocking
mechanism. Second, the new legislation addressed the use of 180-day exclusivity period by
22

generic companies for special arrangements with originators as a means to prevent market entry
of other generics27. Gregg-Schumer revisions included “forfeiture” provisions which put the
generics company under risk of losing the exclusivity if found to have made such an
arrangement.
Changes in the European Generic Legislation
Europe’s fragmented market structure has presented a major barrier to generic growth compared
to the US market where federal law applies uniformly across different states. Directive
2004/27/EC has aimed to remove some of these barriers by updating Directive 2001/83. As with
the US Hatch-Waxman Act, the legislation was intended to balance the needs of the branded
pharmaceutical companies and generics companies. Directive 2001/83, the overall body of EU
law governing the manufacture and trade in pharmaceuticals, had flows such as the lack of a
generic-product definition and allowed branded companies to withdraw reference products
before generic entry.
The new laws introduced a specific “generic” definition. One of the most important aspects for
generics companies was the “Bolar” clause permitting generic companies to do their own
development work within the EU during the period of patent protection for the original
molecule. The practical impact of the clause on the timing of product launches may be minimal
because wherever the development is carried out, generics cannot be launched prior to patent
expiry. The main benefit however is that companies could maintain generic drug development in
the EU28.
Under the new legislation, the same product can be used as a reference product for generics
everywhere in the EU even if not registered in particular countries. This is a small step towards
unification of European generic legislation. An additional benefit of the new legislation is that if
originator companies withdraw a brand before any generic versions are marketed, the generics
can still use it as a reference product. Finally, the establishment of the EMA in 1995 had little
direct impact on generics companies. However, the centralized procedure is open to generics
provided that the original is approved through the centralized system (Wittner 2004) .
Generic Lags across Markets follow the Pattern of Non-Generic Lags
Figure 10 demonstrates that the pattern of launch for the first imitative generic product is quite
27 According to the 1984 Act, if the first generic company chose not to market the generic copy, all other generic competitors from the market would be excluded and all competition would be blocked for a period of 180 days. Authorized generics, copies made under license from the innovator companies, were introduced whereby the originator receives royalties on sales in return. For example, Par Pharma's generic version of Glaxo's Paxil (Paroxetine) was launched with Glaxo's approval even though Apotex had obtained six-month exclusivity for its own generic. 28 As mentioned before, the SPC had prevented generic companies from engaging in R&D prior to patent expiry.
23

similar to the pattern for innovative molecules (Figure 4)29. New generic legislations have
proven effective in the EU in further reducing the generic lag. The fastest adopters are as usual
markets with relatively high originator prices (the US, UK and Germany) that offer higher profit
prospects for imitative products. The median delay for the leaders is on the order of 4-5 years,
with a reduction of 5-6 years compared to 1984-1995. More regulated markets (Italy, Spain and
France) lag by about 5 years behind the leaders, with a median delay of 9-10 years (which is a
significant reduction from 14-17 years in 1984-1995).
Figure 10. Survival Estimates for Generics: 1995-2008
UK
US
GER
JAP
FRAITA
SPA
1.0
0.9
0.8
0.7
0.6
0.5
0.4
0.3
0.2
0.1
0.0
0 2 4 6 8 10 12
US&UK generic molecules with first launch during 1995-2008KM survival estimates in years
Japanese lag for the adoption of imitative products is not as dramatic as for innovative
molecules; however, Japan is still the slowest market among the biggest seven markets with a
median delay of 11 years. Generic drugs have been regarded in Japan as inferior. Similarly,
physicians have had financial incentives for prescribing non-generic drugs. However, recently
the government has initiated educational and advertising campaigns to improve generic use as
well as changes on the provider side including elimination of the link between prescribing
practices and physician salaries (Business Insights 2009).
29 Similar to the non-generic case, equality by country, atc1, form1 and first launch period rejected (p-value < 0.001 for all).
24

Similar survival profiles for new molecules and generic products indicate that the negative
impact of price controls on the launch timing of pharmaceutical innovation translates to the
adoption of imitative pharmaceutical products. The launch patterns show that regulated markets
access innovation later but also face temporal disadvantage in terms of their access to cost-
saving generic products. To what extent this is balanced by lower branded prices remains an
open question for further exploration.
4. CONCLUSIONS
This paper has sought to provide an overview of the evolution of the drug lag for pharmaceutical
innovation (new molecules) as well as generic copies across the main OECD markets with
regards to changes in the regulatory environment during 1960-2008 using non parametric
methods. This is the first study to provide a descriptive evolution of relative lags across a number
of markets over a lengthy period of time and a comprehensive set of molecules, both for
innovative products and generic copies.
Lower transaction costs due to reductions in geographical barriers and lower regulatory costs
(harmonized market authorization procedures, strengthened IP rights, patent term restorations)
have exerted a downward pressure over time on median delays in individual countries as well as
overall delays across the main OECD markets. All markets experience a decreasing trend over
time for median delays following global launch. With the wider use of the centralized procedure
over the coming years, the delays in the diffusion of pharmaceutical innovation across the EU
may be further smoothed out. However, the relative lags across countries remain significant both
for new molecules and generic products due to the variety in pricing and reimbursement
regulations. In fact, an important finding is that the negative impact of price controls on new
molecules translates to a later generic availability which suggests that regulation delays patient
access to new pharmaceutical technologies but also creates opportunity costs for governments
through foregone savings due to later generic availability compared to free markets. Assessing
the impact on overall welfare, however, would require a comparison of savings from lower
branded product prices and savings foregone due to late generic launch and possibly lower
generic penetration. Relative delays in the diffusion of generics are expected to decrease further
due to the impact of the new European legislation in 2004 and the push for genericization as a
cost-containment mechanism in regulated markets that have been further challenged by the
recent economic downturn.
Globally, the relative lags exhibit a change in the geographical pattern of lags over time. The US
lag back in 1960s has switched to more price stringent European markets throughout 1960-2008.
25

Relatively free-priced European markets of Germany and the UK30, which also have strong local
pharmaceutical industries, lead in the EU as the fastest adopters of pharmaceutical innovation
(and imitation). Product launch strategically takes place first in higher-priced EU markets as a
result of threat of arbitrage and price dependency across the member states, which puts European
markets with low prices and/or small market sizes such as Spain and Portugal at a disadvantage.
Paradoxically, the Japanese market with its large market size and relatively high prices remains a
laggard throughout 1960-2008. The idiosyncratic nature of clinical trial requirements in Japan
has been the major driver of asymmetric costs for foreign pharmaceutical firms. Harmonization
efforts on foreign clinical data use seem to be taking effect slowly and expected future rise in the
use of the bridging strategy may further reduce the Japanese drug lag in the upcoming years.
The R&D activity of leading pharmaceutical companies is largely carried out in the major OECD
markets. Reducing delays in these markets will offer higher returns to R&D and stimulate further
innovation contributing to dynamic efficiency over the long run. On the other hand, new
pharmaceutical technologies impose additional pressure on the tight health care budgets and
quick diffusion of new technologies with uncertain benefits could lead to inefficiencies in the
provision of health care (Garber and Skinner 2008). The introduction of new drugs in individual
markets, therefore, should be balanced out with the expansion of drug expenditure and the
evidence of cost-effectiveness. From a cross-country perspective, reducing the differential delays
for globally important molecules will enable a more equitable access to new and possibly more
effective treatment alternatives.
Finally, the non-parametric approach adopted in this paper offered an exploratory analysis into
the nature of the drug delay across countries and over time. The methodological approach can be
extended in future research to analyze the impact of policy changes in 1984 and 1995 by a
difference-in-differences (DiD) analysis that treats policy changes as quasi-experiments. In
addition, the impact of regulation on the international adoption speed of new molecules and
generic competition can be further assessed in a (semi-) parametric survival analysis by
treatment dummies for regulation or proxying the net effect of regulation with expected prices.
30 However, prices may be indirectly affected through regulations in other parts of the market. In the UK profits are regulated through the PPRS (Pharmaceutical Price Regulation Scheme) and products are subject to NICE appraisals for Cost-Effectiveness (“the fourth hurdle”). The Flexible Pricing scheme and Risk Sharing Agreements introduced in the 2009 PPRS will further emphasize value-for-money in NHS purchases of medicinal products. In Germany reimbursement regulation through reference pricing includes patented pharmaceuticals in reference groups unless novelty and therapeutic improvement is demonstrated and companies take this into consideration when setting prices.
26

27
Acknowledgements
We are grateful for the financial support provided by Merck Foundation Trust, and to Tim
Williams and Elizabeth Finch from MSD, UK for their help during the data collection process.

Appendix
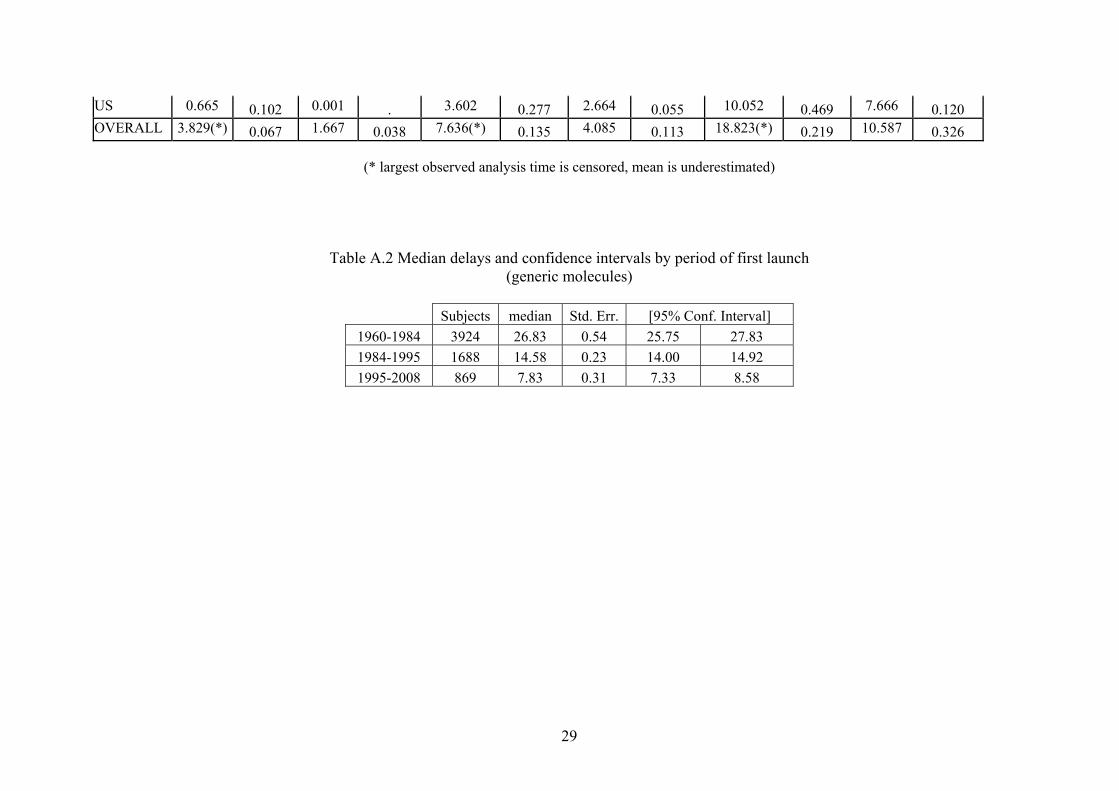
Table A.1 Mean and Median Launch Lags over Time for US & UK Molecules (Non-Generic)
1995-2008 1984-1995 1960-1984
Country Mean Std Error - Mean
Median Std Error - Median
Mean Std Error -Mean
Median Std Error - Median
Mean Std Error -Mean
Median Std Error -Median
Australia 3.598(*) 0.264 1.752 0.029 8.146(*) 0.58 4.838 0.118 18.143(*) 0.873 12.252 0.256 Austria 2.181(*) 0.212 0.999 0.015 6.514(*) 0.559 3.42 0.077 19.254(*) 1.02 9.415 0.279 Belgium 5.720(*) 0.359 2.667 0.058 9.137(*) 0.697 3.666 0.133 19.791(*) 1.065 8.501 0.446 Canada 3.431(*) 0.281 1.336 0.032 7.402(*) 0.592 4 0.084 13.257(*) 0.81 6.084 0.124 Finland 2.259(*) 0.208 0.999 0.014 7.397(*) 0.603 3.337 0.09 22.804(*) 1.07 13.999 0.573 France 2.903(*) 0.233 1.585 0.022 6.482(*) 0.524 3.329 0.092 16.558(*) 0.942 6.585 0.224 Germany 1.444 0.157 0.668 0.008 4.703(*) 0.473 2.001 0.042 11.576(*) 0.86 3.001 0.070 Greece 4.138(*) 0.279 2.166 0.039 7.798(*) 0.565 4.58 0.095 22.250(*) 0.998 14.412 0.440 Italy 2.927 0.212 1.749 0.015 6.227(*) 0.521 3.584 0.058 16.019(*) 0.964 6.253 0.133 Japan 7.885(*) 0.338 6.582 0.194 12.441(*) 0.71 9.673 0.231 21.218(*) 1.034 11.414 0.304 Netherlands 3.042(*) 0.319 0.75 0.02 5.726(*) 0.611 1.837 0.057 19.158(*) 1.105 7.247 0.317 Poland 4.402(*) 0.264 3.001 0.049 9.395(*) 0.495 7.335 0.074 27.980(*) 0.666 26.497 0.204 Portugal 8.521(*) 0.372 13.254 . 12.884(*) 0.711 8.83 0.272 25.436(*) 1.1 19.162 0.748 S.Africa 5.590(*) 0.344 3.168 0.063 7.877(*) 0.611 4 0.122 21.776(*) 0.985 20.246 0.415 Spain 6.318(*) 0.375 2.667 0.061 10.117(*) 0.667 5.84 0.142 19.309(*) 1.06 7.077 0.221 Sweden 2.809(*) 0.286 0.747 0.016 8.311(*) 0.668 4.167 0.155 27.842(*) 1.086 27.83 . Switzerland 2.964(*) 0.261 1.413 0.027 5.842(*) 0.537 2.828 0.071 12.799(*) 0.931 4.085 0.143 Turkey 5.701(*) 0.299 4 0.041 9.381(*) 0.552 6.834 0.095 25.803(*) 0.903 21.832 0.299 UK 1.27 0.115 0.75 0.009 3.151 0.271 1.914 0.062 8.817 0.584 3.083 0.097
28
29
US 0.665 0.102 0.001 . 3.602 0.277 2.664 0.055 10.052 0.469 7.666 0.120 OVERALL 3.829(*) 0.067 1.667 0.038 7.636(*) 0.135 4.085 0.113 18.823(*) 0.219 10.587 0.326
(* largest observed analysis time is censored, mean is underestimated)
Table A.2 Median delays and confidence intervals by period of first launch (generic molecules)
Subjects median Std. Err. [95% Conf. Interval]
1960-1984 3924 26.83 0.54 25.75 27.83
1984-1995 1688 14.58 0.23 14.00 14.92
1995-2008 869 7.83 0.31 7.33 8.58

Table A.3 Mean and median launch delays for generic molecules that launched in US and UK
1995-2008 1984-1995 1960-1984
Country Mean
Std Error - Mean Median
Std Error -Median
Mean
Std Error - Mean Median
Std Error -Median
Mean
Std Error - Mean Median
Std Error -Median
AUSTRALIA 7.425(*) 0.712 8.085 8.085 15.446(*) 0.831 16 0.073 27.460(*) 1.05 24.586 0.355
AUSTRIA 7.877(*) 0.711 7.915 7.915 16.248(*) 0.808 14.001 0.146 31.961(*) 1.189 33.418 0.871
BELGIUM 10.052(*) 0.674 . . 18.075(*) 0.721 17.084 . 33.843(*) 1.069 39.086 0.871
CANADA 6.560(*) 0.632 6.916 6.916 12.981(*) 0.895 10.242 0.306 22.390(*) 1.063 17.333 0.226
FINLAND 8.098(*) 0.72 7.417 7.417 16.553(*) 0.796 16 0.353 31.367(*) 1.279 31.496 .
FRANCE 8.610(*) 0.661 8.914 8.914 15.912(*) 0.754 15.663 0.17 31.178(*) 1.092 29.752 0.463
GERMANY 6.060(*) 0.6 5.081 5.081 12.768(*) 0.793 12.167 0.207 20.877(*) 1.18 15.168 0.136
GREECE 9.261(*) 0.676 8.413 8.413 15.215(*) 0.93 15.253 0.38 30.055(*) 1.244 32.838 0.567
ITALY 8.374(*) 0.69 9.339 9.339 16.817(*) 0.728 16.999 0.138 28.294(*) 1.422 27.083 0.801
JAPAN 9.782(*) 0.646 11.496 11.496 18.784(*) 0.719 22.412 0.497 24.920(*) 1.443 18.412 0.532
NETHERLA 7.451(*) 0.736 6.418 6.418 15.386(*) 0.965 13.413 0.265 32.053(*) 1.123 32.832 0.602
POLAND 7.858(*) 0.703 7.168 7.168 13.114(*) 0.815 11.086 0.192 30.611(*) 0.901 29.495 0.278
PORTUGAL 9.259(*) 0.645 11.496 11.496 15.922(*) 0.919 16 0.303 35.085(*) 1.151 . .
SAFRICA 8.911(*) 0.606 8.832 8.832 16.261(*) 0.779 14.834 0.204 32.282(*) 1.228 31.247 0.385
SPAIN 8.965(*) 0.633 9.747 9.747 16.110(*) 0.903 13.919 0.572 31.147(*) 1.294 34.749 0.846
SWEDEN 8.119(*) 0.746 8.167 8.167 16.578(*) 0.823 15.001 0.267 36.388(*) 1.103 . .
SWITZERLAND 10.530(*) 0.672 . . 17.173(*) 0.758 15.918 0.247 30.654(*) 1.222 29.248 0.893
TURKEY 8.767(*) 0.808 9.832 9.832 15.293(*) 1.035 16.085 0.902 29.481(*) 1.198 28.413 0.529
UK 4.486 0.388 4.252 4.252 10.596 0.507 11.25 0.182 18.619 0.772 18.168 0.147
US 5.224 0.516 4.504 4.504 9.754 0.585 9.752 0.182 14.767 0.589 13.67 0.129
Total 8.117(*) 0.16 7.833 7.833 15.314(*) 0.191 14.579 0.23 28.615(*) 0.27 26.831 0.544 (* largest observed analysis time is censored, mean is underestimated)
30

References
Annon, A. (1994). 'A Drug Tsar is Born', The Economist. Barral, P. E. (1985). Ten Years of Results in Pharmaceutical Research Throughout the World.(1975-1984), Prospective et Sante Publique. Berlin, H. and B. Jonsson (1986). 'International dissemination of new drugs: a comparative study of six countries', Managerial and Decision Economics 7(4), pp. 235-242. Branes, J. M. (2007). Patent technology: transfer and industrial competition Nova Science Publishers. Busfield, J. (2003). 'Globalization and the pharmaceutical industry revisited', International Journal of Health Services 33(3), pp. 581-605. Business Insights (2009). 'The Japanese Pharmaceutical Market Outlook to 2014: Policy environment, market structure, competitive landscape, growth opportunities'. Coppinger, P. L., C. C. Peck, et al. (1989). 'Understanding comparisons of drug introductions between the United States and the United Kingdom. Reply', Clinical pharmacology and therapeutics 46(2), pp. 139-145. Danzon, P. M. and A. Epstein (2005). 'Launch and Pricing Strategies of Pharmaceuticals in Interdependent Markets', iHEA Conference. Danzon, P. M. and A. J. Epstein (2008). 'Launch and Pricing Strategies of Pharmaceuticals in Interdependent Markets', NBER Working Paper No. W14041. Danzon, P. M. and J. D. Ketcham (2004). Reference Pricing of Pharmaceuticals for Medicare: Evidence from Germany, the Netherlands, and New Zealand. Cutler DM, Garber AM, eds. Frontiers in Health Policy Research (National Bureau of Economic Research, Volume 7). Cambridge, Mass: The MIT Press: 1-54. Danzon, P. M., Y. Wang, et al. (2005). 'The Impact of Price Regulation on the Launch Delay of New Drugs - Evidence from Twenty-Five Major Markets in the 1990s', Health Economics 14, pp. 269-292. DG Competition (2009). 'Pharmaceutical Sector Inquiry Final Report', Available at http://ec.europa.eu/competition/sectors/pharmaceuticals/inquiry/staff_working_paper_part1.pdf Garber, A. M. and J. Skinner (2008). 'Is American Health Care Uniquely Inefficient?' The journal of economic perspectives: a journal of the American Economic Association 22(4), pp. 27. Grabowski, H. G. (1980). 'Regulation and the International Diffusion of Pharmaceuticals', The International Supply of Medicines, pp. 5-36. Hassett, K. A. (2004). 'Price Controls and the Evolution of Pharmaceutical Markets', American Enterprise Institute.
31
Kaitin, K. I., N. Mattison, et al. (1989). 'The drug lag: an update of new drug introductions in the United States and in the United Kingdom, 1977 through 1987', Clinical pharmacology and therapeutics 46(2), pp. 121. Kessler, D. P. (2004). 'The Effects of Pharmaceutical Price Controls on the Cost and Quality of Medical Care: A Review of the Empirical Literature', pp. Kyle, M. (2007). 'Pharmaceutical Price Controls and Entry Strategies', The Review of Economics and Statistics 89(1), pp. 88-99. Kyle, M. K. (2007). 'Strategic responses to parallel trade', National Bureau of Economic Research Lichtenberg, F. (2003). 'Impact of Drug Launches on Longevity: Evidence from Longitudinal Disease Level Data from 52 countries, 1982-2001', pp. Lichtenberg, F. R. (1996). 'Do (More and Better) Drugs Keep People Out of Hospitals?' American Economic Review 86, pp. 384-388. Lichtenberg, F. R. (2005). 'The Impact of New Drug Launches on Longevity: Evidence from Longitudinal, Disease-Level Data from 52 Countries, 1982–2001', International Journal of Health Care Finance and Economics 5(1), pp. 47-73. Parker, J. E. S. (1984). The International Diffusion of Pharmaceuticals, Macmillan Press Ltd. Permanand, G. (2006). EU pharmaceutical regulation : the politics of policy-making. Pharmaceutical Manufacturers Association (1993). PMA Annual Survey Report: Trends in US Pharmaceutical Sales and R&D. Washington, DC. Schoffski, O. (2002). 'Diffusion of Medicines in Europe', pp. Tabata, Y. and C. Albani (2008). 'Globalising clinical development in Japan', Journal of Commercial Biotechnology 14(1), pp. 73-78. Thomas, L. G. (2001). The Japanese Pharmaceutical Industry: The new drug lag and the failure of industrial policy, Edward Elgar Publishing. Uyama, Y., T. Shibata, et al. (2005). 'Successful bridging strategy based on ICH E5 guideline for drugs approved in Japan&ast', Clinical Pharmacology & Therapeutics 78(2), pp. 102-113. Vernon, J. (2005). 'Examining the link between price regulation and pharmaceutical R&D investment', Health Economics 14(1), pp. 1-17. Vogler, S. (2008). Pharmaceutical Pricing and Reimbursement Information Report. Wardell, W. M. (1973). 'Introduction of new therapeutic drugs in the United States and Great Britain: an international comparison', Clinical Pharmacology & Therapeutics 14(5), pp. 773-90.
32

33
Wardell, W. M. (1974). 'Therapeutic implications of the drug lag', Clinical Pharmacology & Therapeutics 15(1), pp. 73-96. Wardell, W. M. (1978). 'The drug lag revisited: comparison by therapeutic area of patterns of drugs marketed in the United States and Great Britain from 1972 through 1976', Clinical Pharmacology & Therapeutics 24(5), pp. 499-524. Wertheimer, A. I. and T. M. Santella (2004). 'Pharmacoevolution: the advantages of incremental innovation', IPN Working Papers on Intellectual Property, Innovation and Health. Wittner, P. (2004). Growth Strategies in Generics: Innovative and aggressive strategies and their impact on branded pharmaceuticals. London. WTO OMC. (2003). "TRIPS and pharmaceutical patents, Fact Sheet." 2008, Available at http://www.wto.org/english/tratop_e/trips_e/tripsfactsheet_pharma_e.pdf.

For further information on this or any of the
Health publications contact:
Naho Ollason
Managing Editor
LSE Health
The London School of Economics and Political Science
Houghton Street
London WC2A 2AE
Tel: + 44 (0)20 7955 3733
Fax: + 44 (0)20 7955 6090
Email: [email protected]
Website: www.lse.ac.uk/collections/LSEHealth/
Nebibe Varol, Joan Costa-Font, Alistair McGuire
Do International Launch Strategies ofPharmaceutical Corporations Respond toChanges in the Regulatory Environment?
Working paper No: 19/2010 October 2010 LSE Health
10_0726 Working paper cover 19:Layout 1 2/11/10 14:13 Page 1